Embed Size (px)
Citation preview
JORIND 11(1), June, 2013. ISSN 1596-8308. www.transcampus.org/journals; www.ajol.info/journals/jorind
COMPARATIVE ANALYSIS OF PRE- AND POST- MERGERS AND ACQUISITIONS RESULTS OF
NIGERIAN BANKS
Idris Adegboyega Onikoyi
Business Administration, Babcock University, Ilishan Remo, Ogun State, Nigeria
and
Adeyinka Olawanle Sokefun
Banking and Finance, Redeemer’s University, Mowe, Ogun State, Nigeria
Abstract
The banking reform that commenced on the 1st of January, 2006 had been a major wave towards a diversified,
strong and reliable banking sector in Nigeria. This paper examined the mega banks by evaluating their results
three before and three years after the consolidation exercise in Nigeria (2003-2009). This study further
examined the impact of consolidation on performance and considers if there had been considerable
improvement on their capital base, bank revenue, total assets, and cost of operation. We analyzed six ratios of a
sample of fifteen (15) mega banks. Descriptive analysis of these performance ratios was carried out. We found
that, on average, merger and acquisition have not improved the results of merged banks in post consolidation
era.
Keywords: Mergers, acquisition, shareholders wealth, capital base, market share, bank revenue
Introduction
Merger is the global business term used achieving the
business growth and survival. Merger is different from
acquisition. Merger is the combination of two
businesses that leads toward a new business, but
acquisition is the takeover or purchase of one business
by other business. Merger is also helpful for businesses
in terms of solvency. Because when a business’
liabilities exceed the assets then mostly businesses
adopt this process to abstain from insolvency. The
process of mergers & acquisition in the banking sector
also extended hand to strengthen the solvency of the
banking system (Malik, 2006).
From banking system review it was also seen that
merger of banks is adapted to increase the return on
capital, that further lead towards increment in equity.
The recent trend of mergers and acquisitions of local
banks by the foreign banks is also intended to extend
their outreach to maximize return on their capital
(Malik, 2006). Mergers and consolidation of the
banking system further supported this increasing equity
base (Malik, 2006). The chances of uncertainty in
operations increase due to new technologies, e- banking
and more over mainly from merger. No doubt that new
technology and e- banking are the basic factors of
operational risks, but banking mergers are causing
operational risk in a situation when there was no more
idea about new banking workings and operations while
diversification is there.
Arshad (2012) opined that banks attained the
performance improvement after merger on the basis of
decrease in cost of production and increase in
production level. Scope of economies or changes in
product mix are another potential way in which
mergers might help improve bank performance (Berger
and Humphrey, 1994). Another source of cost
efficiency behind merger was that efficient banks
acquires the inefficient banks and run their managing
rules over the inefficient. In this case all talents of
superior management are spread over there with the
help of different resources. Thus efficient business gets
required results. Cost efficiency could be considerably
improved by a merger in which a relatively efficient
bank acquires a relatively inefficient bank and spread
its superior management talent over more resources
(Akhavein, Berger, & Humphrey, 1996).
Merger enhances the value of business. On account of
which owners’ good will increases with the increment in
profit through economies of scale and cost reduction etc
(Arshad, 2012). Motives behind merger are to increase
revenue by enhancing market share, cost reduction,
economies of scale and economies of scope. As the size
of bank increases, efficiency also improves. In addition
to economies of scale and diversification benefits, there
are two other economic motives of M&A; Horizontal
integration and vertical integration (Gaughan, 2011). To
employees, merger provides a different and new culture
233
JORIND 11(1), June, 2013. ISSN 1596-8308. www.transcampus.org/journals; www.ajol.info/journals/jorind
to work. Employees can work in an advanced culture
with some desired change.
Business consolidation through Mergers and
Acquisitions has become a global phenomenon to
achieve economies of scale and higher productivity. The
need for financial institutions to merge becomes even
more imperative in the face of the onslaught of greater
competition arising from globalization and the pressure
under the World Trade Organization (WTO) for
countries to open up their financial market to further
entry of foreign banks. For this reason, many countries
are moving toward consolidating their banking systems
and Nigeria cannot be an exemption.
Two primary factors affecting the need of banks to
remain competitive are technology and deregulation.
Whilst, technology has blurred the lines of
specialization among financial intermediaries,
deregulation has significantly changed the way banks do
business and where they do business. Technological
improvement also means more change and the
breakdown of traditional barriers, such as geography
and product varieties. The two forces of technology and
deregulation working together have resulted in what is
referred to as the Global Economy. Also, the mixing
together of technology and deregulation has produced
rapid change that increasingly blur accepted boundaries
of time, geography, language, industries, enterprises,
economies and regulations. As result many merging
partners today are creating financial supermarket, where
customers can have one – stop financial services.
In addition to market consideration, regulatory factors
have accounted for some banks consolidation in
different parts of the world. For example, the
consolidation that took place in Lebanon, Malaysia,
Kenya and South Africa were mainly policy – induced.
Merger and acquisition & Nigerian banking sector
The Nigerian banking sector has undergone remarkable
changes over the years, in terms of the number of
institutions, ownership structure as well as the depth and
breadth of operations. These changes have been
influenced largely by the challenges posed by the
deregulation of the sector, globalization of operations,
technological innovations and the adoption of
supervisory and prudential requirements that conform to
international standards. The deregulation of the sector
which began during the period 1986 to 1990 was
followed by flood of new banks. The existence of many
banks coupled with non-compliance with market
regulations by majority of the players, poor
management, poor credit policy, insider dealings
/abuses and economic recession led to high incidence of
distress in the banking industry in the 1990s (CBN
Briefs, 2005).
Furthermore, Central Bank of Nigeria’s surveillance on
banks revealed deterioration in banks’ overall
performance, based on Capital, Assets, Quality
Management, Equity and Liquidity (CAMEL)
parameters. Banks’ performance rating in 2004 showed
that 10 banks were rated as sound, while 51, 16, and 10
banks were rated as satisfactory, marginal and unsound,
respectively. Against this background, the CBN in July
2004 rolled out a 13- point reform agenda aimed at
consolidating the banking sector and preventing the
occurrence of banking distress.
Two major elements of this reforms package were the
requirement, that the minimum capitalization for banks
should be N25billion with effect from 31st December
2005 and consolidation of banks through mergers and
acquisitions (CBN Briefs, 2005).
The objective of this study is to determine whether
merger and acquisition process of 2005 in Nigeria
banking industry improve the merged banks results.
Theoretical framework
This study is anchored on the following theories:
The theory of efficiency
According to the value increasing school, mergers
occur, broadly, because mergers generate ‘synergies’
between the acquirer and the target, and synergies, in
turn, increases the value of the firm (Hitt, Harrison, &
Ireland 2001). The theory of efficiency suggests that
mergers will only occur when they are expected to
generate enough realizable synergies to make the deal
beneficial to both parties; it is the symmetric
expectations of gains which results in a ‘friendly’
merger being proposed and accepted. If the gain in
value to the target was not positive, it is suggested, the
target firm’s owners would not sell or submit to the
acquisition, and if the gains were negative to the
bidders’ owners, the bidder would not complete the
deal. Hence, if we observe a merger deal, efficiency
theory predicts value creation with positive returns to
both the acquirer and the target. Banerjee and Eckard
(1998) and Klein (2001) evidence this suggestion.
Following Chatterjee (1986), we must, however,
distinguish between ‘operative synergies’ – or
‘efficiency gains’ achieved through economies of scale
and scope – and ‘allocative synergies’ – or ‘collusive
synergies’ resultant from increased market power and
an improved ability to extract consumer surplus – when
234
JORIND 11(1), June, 2013. ISSN 1596-8308. www.transcampus.org/journals; www.ajol.info/journals/jorind
commenting on value creation in mergers and
acquisitions.
Market power theory
Most of the recent literature concludes that operating
synergies are the more significant source of gain
(Devos, Kadapakkam, & Krishnamurthy, 2008;
Houston, James, & Ryngaert, 2001; Mukherjee,
Kiymaz, & Baker, 2004), although it does also suggest
that market power theory remains a valid merger
motive. Increased ‘allocative’ synergies is said to offer
the firm positive and significant private benefits
(Feinberg, 1985) because, ceteris paribus, firms with
greater market power charge higher prices and earn
greater margins through the appropriation of consumer
surplus. Indeed, a number of studies find increased
profits and decreased sales after many mergers (Prager,
1992; Chatterjee, 1986; Kim and Singal, 1993); From a
dynamic point of view too, market power is said to
allow for the deterrence of potential future entrants
(Gugler et al., 2003), which can again afford the firm a
significant premium, and so offer another long-term
source of gain.
The theory of corporate control
In an efficient merger, the theory of corporate control
provides a third justification, beyond simply synergistic
gains, for why mergers must create value. It suggests
that there is always another firm or management team
willing to acquire an underperforming firm, to remove
those managers who have failed to capitalise on the
opportunities to create synergies, and thus to improve
the performance of its assets (Weston, Mitchell, &
Mulherin, 2004). Managers who offer the highest value
to the owners, it suggests, will take over the right to
manage the firm until they themselves are replaced by
another team that discovers an even higher value for its
assets. Hence, inefficient managers will supply the
‘market for corporate control’ (Manne, 1965), and
managers that do not maximise profits will not survive,
even if the competitive forces on their product and input
markets fails to eliminate them. ‘Hostile’ takeovers
should, as a result, be observed amongst poorly
performing firms, and amongst those whose internal
corporate governance mechanisms have failed to
discipline their managers.
The theory of managerial hubris
The theory of managerial hubris (Roll, 1986) suggests
that managers may have good intentions in increasing
their firm’s value but, being over-confident; they over-
estimate their abilities to create synergies. Over-
confidence increases the probability of overpaying
(Hayward and Hambrick, 1997; Malmendier and Tate,
2008), and may leave the winning bidder in the situation
of a winner's-curse, which dramatically increases the
chances of failure (Dong, Hirschleifer, Richardson, &
Teoh, 2006). Empirically speaking, Berkovitch and
Narayanan (1993) find strong evidence of hubris in US
takeovers, and Goergen and Renneboog (2004) find the
same in a European context. The latter estimate that
about one third of the large takeovers in the 1990s
suffered from some form of hubris. Malmendier and
Tate (2005) show that overly optimistic managers, who
voluntarily retain in-the-money stock options in their
own firms, more frequently engage in less profitable
diversifying mergers, and Rau and Vermaelen (1998)
find that hubris is more likely to be seen amongst low
book-to-market ratio firms – that is, amongst the so-
called ‘glamour firms’ – than amongst high book-to-
market ratio ‘value firms’.
Theory of managerial discretion
Jensen’s (1986) theory of managerial discretion claims
that it is not over-confidence that drives unproductive
acquisitions, but rather the presence of excess liquidity,
or free cash flow. Firms whose internal funds are in
excess of the investments required to fund positive net
present value projects, it is suggested, are more likely to
make quick strategic decisions, and are more likely to
engage in large-scale strategic actions with less analysis
than their cash-strapped peers. High levels of liquidity
increase managerial discretion, making it increasingly
possible for managers to choose poor acquisitions when
they run out of good ones (Martynova and Renneboog,
2008). Indeed, several empirical studies demonstrate
that the abnormal share price reaction to takeover
announcements by cash-rich bidders is negative and
decreasing in the amount of free cash flow held by the
bidder (Harford, 1999). Moreover, it is suggested that
the other stakeholders in the firm will be more likely to
give management the benefit of the doubt in such
situations, and to approve acquisition plans on the basis
of fuzzy and subjective concepts such as managerial
‘instincts’, ‘gut feelings’ and ‘intuition’, based on high
past and current cash flows (Rau and Vermaelen, 1998).
Thus, like the hubris theory, the theory of free cash flow
suggests that otherwise well-intentioned mangers make
bad decisions, not out of malice, but simply because the
quality of their decisions are less challenged than they
would be in the absence of excess liquidity.
The agency cost theory
Of course, as the of managerial discretion increases in
free cash flow, or in high market valuations (as in the
case of ‘glamour firms’ above), or in other proxies, so,
too, does the opportunity for self-interested managers to
pursue self-serving acquisitions (Jensen, 2005).
235
JORIND 11(1), June, 2013. ISSN 1596-8308. www.transcampus.org/journals; www.ajol.info/journals/jorind
It is generally agreed that managerial self-interest does
play a role in M&A; research has shown that bidder
returns are, for example, generally higher when the
manager of the acquiring firm is a large shareholder
(Lewellen, Loderer, & Rosenfeld, 1985), and lower
when management is not (Lang, Stulz, & Walkling,
1991; Harford, 1999). This suggests that managers pay
more attention to an acquisition when they themselves
are financially concerned. Further, it supports the notion
of ‘agency cost’ and the ‘managerial theories’ of the
firm’ (Berle and Means, 1932; Marris, 1963), which
broadly suggest that managers pursue self-serving
acquisitions, and it is this fact that leads to value-
destruction.
The theory of managerial entrenchment
The theory of managerial entrenchment (Shleifer and
Vishny, 1989), for example, claims that unsuccessful
mergers occur because managers primarily make
investments that minimise the risk of replacement. It
suggests that managers pursue projects not in an effort
to maximize enterprise value, but in an effort to
entrench themselves by increasing their individual value
to the firm. Entrenching managers will, accordingly,
make manager-specific investments that make it more
costly for shareholders to replace them, and value will
be reduced because free resources are invested in
manager-specific assets rather than in a shareholder
value-maximising alternative. Amihud and Lev (1981)
empirically support this notion, and suggest that
managers pursue diversifying mergers in order to
decrease earnings volatility which, in turn, enhances
corporate survival and protects their positions. Of
course, entrenchment is not only pursued for job
security itself, but also because entrenched managers
may be able to extract more wealth, power, reputation
and fame.
The empire theory
While entrenchment theory primarily explains the
process of how managers position themselves to achieve
the above objectives, the theory of empire-building and
other related, well-tested theories provide both the
motivations and evidence behind these objectives
(Marris, 1963; 1964; Ravenscraft and Scherer, 1987;
Rhoades, 1983; Black, 1989).
According to empire theory, managers are explicitly
motivated to invest in the growth of their firm’s
revenues (sales) or asset base, subject to a minimum
profit requirement (Marris, 1963).
Data and methodology
Research design
This quantitative and cross sectional study was
conducted for hypothesis testing.
Population of the study
For the purpose of this research, the population of the
study was twenty five (25) consolidated banks as at 1st
January, 2006 in the Nigerian Banking Industry (CBN
Annual Report, 2006).
Sampling method
Stratified Sampling technique was adopted for this
study in other to derive sample size from the population.
Nigerian Banking Industry was grouped into ‘deposit
money banks’ and ‘non deposit money banks’. The
deposit money banks were further grouped into two
strata. One group was “merged and acquired banks” and
second group was “nationalized and liquidated banks”.
Sample size
Both qualitative and quantitative methods of determine
sampling size was applied for this study.
Qualitative method
The sample size for this study was arrived at based on
the following criteria.
1- Each sample unit is part of merged and
acquired banks.
2- Each sample unit is listed on Nigerian Stock
Exchange Market
3- Each sample unit has up to date published
annual report.
4- Each sample unit is not nationalised or recently
liquidated.
Based on the above, fifteen (15) merged and acquired
banks met the requirements and therefore were chosen
for this study. This represents 75% of twenty (20)
deposit money banks that merged during consolidation
exercise of 2005 and still in existence as at 2012.
Out of twenty four (24) banks that merged in 2005,
three (3) banks were nationalised; four (4) banks
liquidated and acquired by new owners whilst two (2)
banks were unlisted on the floor Nigerian Stock
Exchange.
Data collection
Data for the study was collected from 15 merged
banks’ web site, annual reports and The Nigerian Stock
Exchange Fact book, 2011.
236
JORIND 11(1), June, 2013. ISSN 1596-8308. www.transcampus.org/journals; www.ajol.info/journals/jorind
Data analysis
Merger in banking sector is becoming more important.
In banks, merger is adopted to gain the market share and
to get the economies of scale with cost efficiency.
Mergers and acquisitions not only improve the bank
profit but also improve the economy and society
situation. To analyze the performance of 15 merged
banks before and after merger, descriptive statistics
were used to test the hypothesis.
Conceptual framework
Earning Per Share
The accounting measure of value adopted for this
study is Earning Per Share (EPS). This is defined as
net profit after tax divide by number of shareholders
outstanding.
EPS = Net Profit after Tax
Number of Shareholders
EPS simply shows the profitability of the firm on a per
share basis. However, it does not reflect how much it
retained in the business and how much is paid as
dividend. But as profitability index, it is valuable and
widely used ratio (Pandey, 2005).
Capital base
The ratio of equity to total assets (CA) is considered
one of the basic ratios for capital strength. It is
expected that the higher this ratio, the lower the need
for external funding and the higher the profitability of
the bank. It shows the ability of bank to absorb losses
and handle risk exposure. Equity to total assets ratio is
expected to have positive relation with performance
that well-capitalized banks face lower costs of going
bankrupt which reduces their costs of funding and
risks (Berger, 1995; Bourke, 1989; Hassan and Bashir,
2003).
Market share
Market share is considered as one of the determinants
of profitability since the bigger the market, the larger
the firm’s potential for profits. Bigger market share
also means more power to the bank in controlling the
prices and services it offers to customers (Heggested,
1977).
Heggested (1977) believed that the net effect of
growth in the market on profitability could be negative
or positive. Increase in demand would push prices
higher and at the same time would affect bank costs.
Heggested (1977) found a weak adverse relationship
between market growth and profitability.
Smirlock,(1985) strongly believed that instead of
concentration, market share was more dominant in
influencing bank’ profitability. He investigated 2700
unit banks and found that market share had a positive
significant relationship with profitability and not
concentration. Smirlock (1985) not only believed that
market share influenced profitability but growth in the
market created more opportunities for the bank, thus
generating more profits. He also found that growth in
the market had a positive significant relationship with
profits.
For this study, total assets of the banks are used as a
proxy for Market share. This is represented by natural
logarithm of total assets (log A) (Smirlock, 1985).
Revenue efficiency
In literature, banks revenue efficiency is measured by
return on asset (ROA) and return on equity (ROE).
ROA is defined as net profit divided by total assets and
is expressed in percent (Pilloff, 1996).
In this study, we use two measures of bank’s
profitability: return on assets (ROA) and return on
equity (ROE). ROA is a general measure for bank
profitability reflects bank ability to achieve return on
its sources of fund to generate profits. The second
measure ROE is defined as net profit divided by
shareholders’ equity and is expressed in percent.
Cost efficiency
Operating costs comprise of all expenses related to the
use of physical and labour factors. Since these
expenditures are management controllable, expenses
management is also considered as an internal
determinant of commercial bank profitability. Pilloff
(1996), used Total Operating Efficiency ratio which he
defined as Operating Expense divide by Operating
Revenue as one of the operating indicators to measure
cost efficiency of banks. The following ratios are
adopted for this study.
237
JORIND 11(1), June, 2013. ISSN 1596-8308. www.transcampus.org/journals; www.ajol.info/journals/jorind
Table 1: Operational definition of variables
NO. Variable Notation Measure Authors
1 EPS EPS Net Profit after tax
Number of Shareholders
Pandey, (2005).
2 Capital base
(Capital adequacy)
CA Equity
Total Assets
Berger, (1995)
3
4
Revenue Efficiency ROE
ROA
Net Profit after tax
Total Equity
Net Profit after tax
Total Assets
Pilloff (1996),
5 Market share Log A Natural Logarithm of Total
Asset
Smirlock,
(1985)
6 Cost Efficiency CE Operating expences
Operating revenue
Total Expenses
Total Assets
Pilloff (1996),
Source: Researcher Derivative, 2012
Comparative analysis of pre and post merger results
For the purpose of this analysis, four years before 31st
December 2005 (2002 to 2005) and four years from 1st
January, 2006 (2006 to 2009) were taken. The Pre
Merger Era for this analysis was 2002 to 2005 while the
Post Merger Era was 2006 to 2009.
Empirical results:
EPS Comparison (2002-2009)
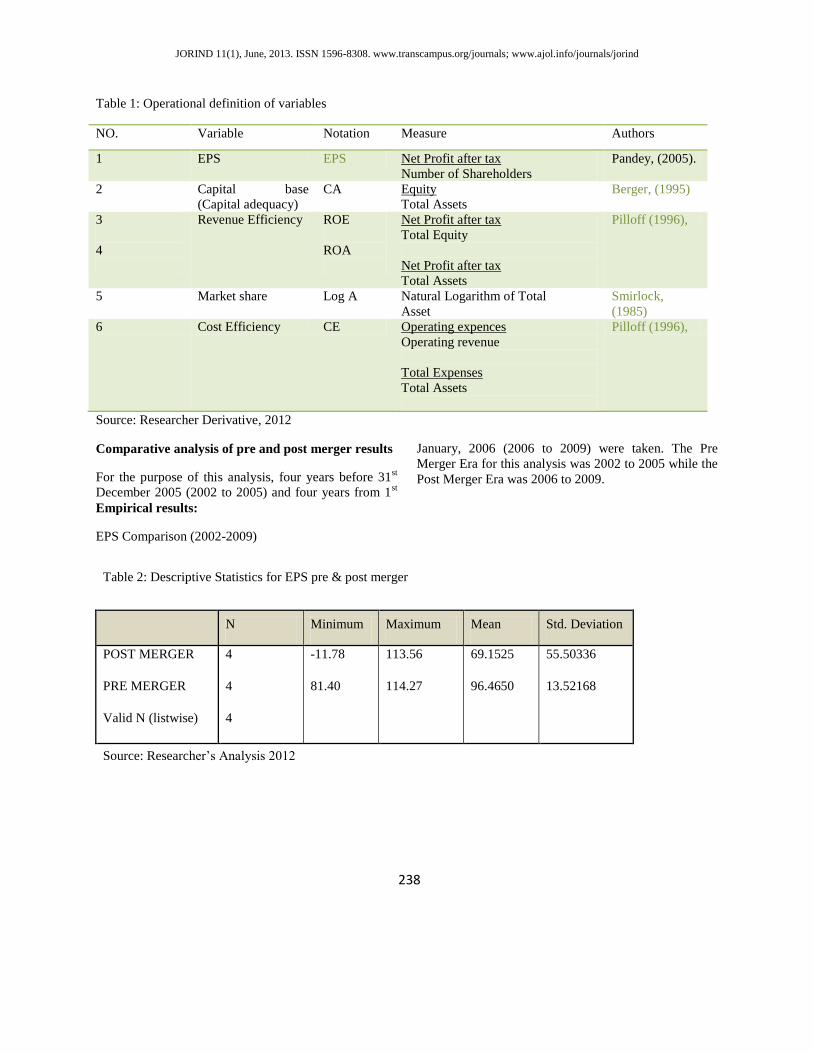
Table 2: Descriptive Statistics for EPS pre & post merger
N Minimum Maximum Mean Std. Deviation
POST MERGER 4 -11.78 113.56 69.1525 55.50336
PRE MERGER 4 81.40 114.27 96.4650 13.52168
Valid N (listwise) 4
Source: Researcher’s Analysis 2012
238
JORIND 11(1), June, 2013. ISSN 1596-8308. www.transcampus.org/journals; www.ajol.info/journals/jorind
Source : Banks Annual Reports 2002-2009
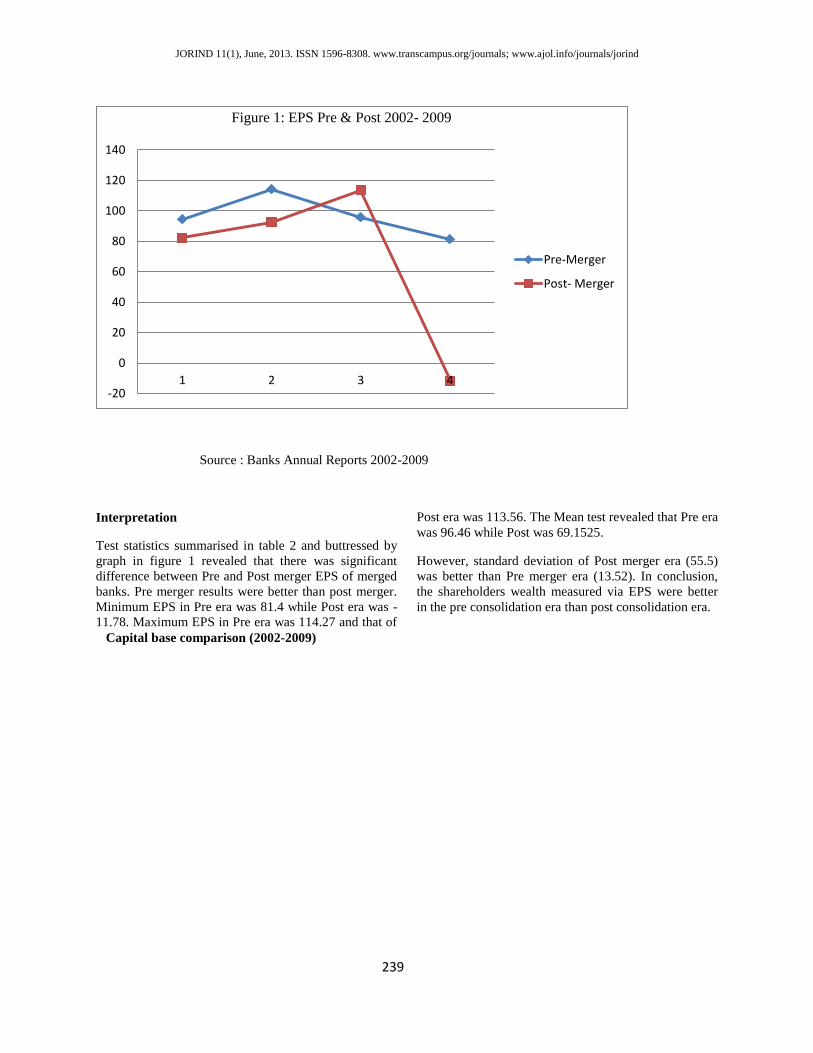
Interpretation
Test statistics summarised in table 2 and buttressed by
graph in figure 1 revealed that there was significant
difference between Pre and Post merger EPS of merged
banks. Pre merger results were better than post merger.
Minimum EPS in Pre era was 81.4 while Post era was -
11.78. Maximum EPS in Pre era was 114.27 and that of
Post era was 113.56. The Mean test revealed that Pre era
was 96.46 while Post was 69.1525.
However, standard deviation of Post merger era (55.5)
was better than Pre merger era (13.52). In conclusion,
the shareholders wealth measured via EPS were better
in the pre consolidation era than post consolidation era.
Capital base comparison (2002-2009)
-20
0
20
40
60
80
100
120
140
1 2 3 4
Figure 1: EPS Pre & Post 2002- 2009
Pre-Merger
Post- Merger
239
JORIND 11(1), June, 2013. ISSN 1596-8308. www.transcampus.org/journals; www.ajol.info/journals/jorind
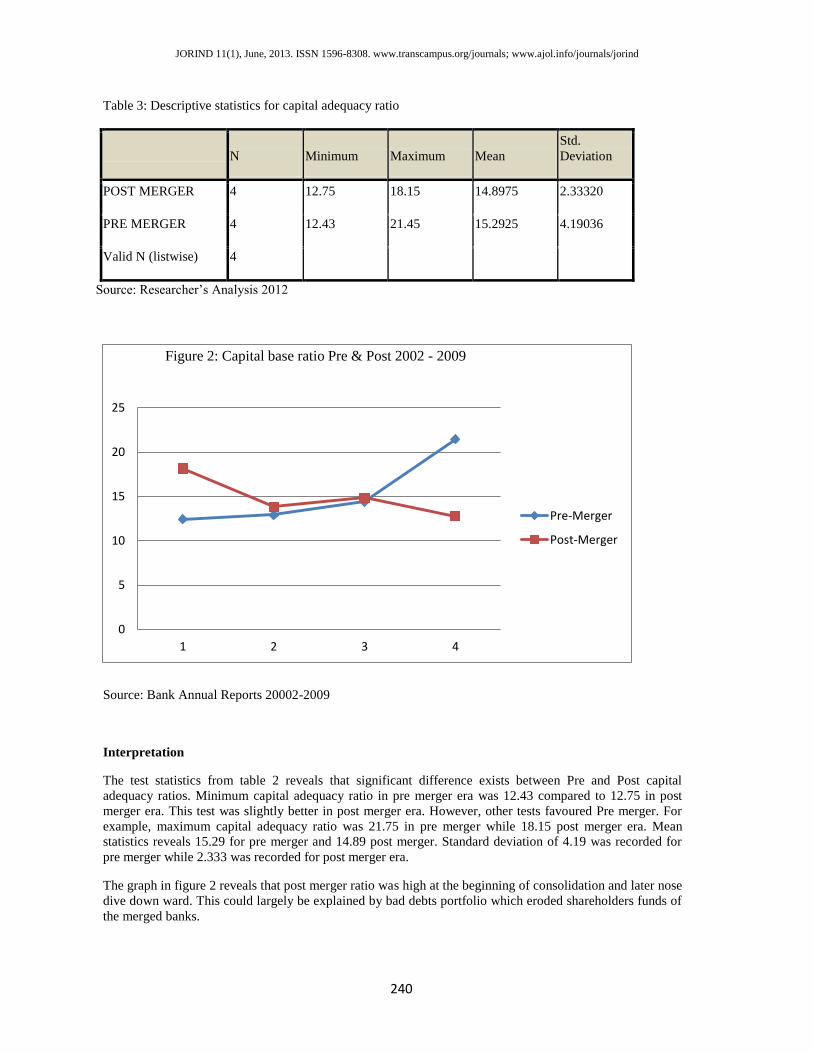
Table 3: Descriptive statistics for capital adequacy ratio
N Minimum Maximum Mean
Std.
Deviation
POST MERGER 4 12.75 18.15 14.8975 2.33320
PRE MERGER 4 12.43 21.45 15.2925 4.19036
Valid N (listwise) 4
Source: Researcher’s Analysis 2012
Source: Bank Annual Reports 20002-2009
Interpretation
The test statistics from table 2 reveals that significant difference exists between Pre and Post capital
adequacy ratios. Minimum capital adequacy ratio in pre merger era was 12.43 compared to 12.75 in post
merger era. This test was slightly better in post merger era. However, other tests favoured Pre merger. For
example, maximum capital adequacy ratio was 21.75 in pre merger while 18.15 post merger era. Mean
statistics reveals 15.29 for pre merger and 14.89 post merger. Standard deviation of 4.19 was recorded for
pre merger while 2.333 was recorded for post merger era.
The graph in figure 2 reveals that post merger ratio was high at the beginning of consolidation and later nose
dive down ward. This could largely be explained by bad debts portfolio which eroded shareholders funds of
the merged banks.
0
5
10
15
20
25
1 2 3 4
Figure 2: Capital base ratio Pre & Post 2002 - 2009
Pre-Merger
Post-Merger
240
JORIND 11(1), June, 2013. ISSN 1596-8308. www.transcampus.org/journals; www.ajol.info/journals/jorind
Market share comparison (2002-2009)
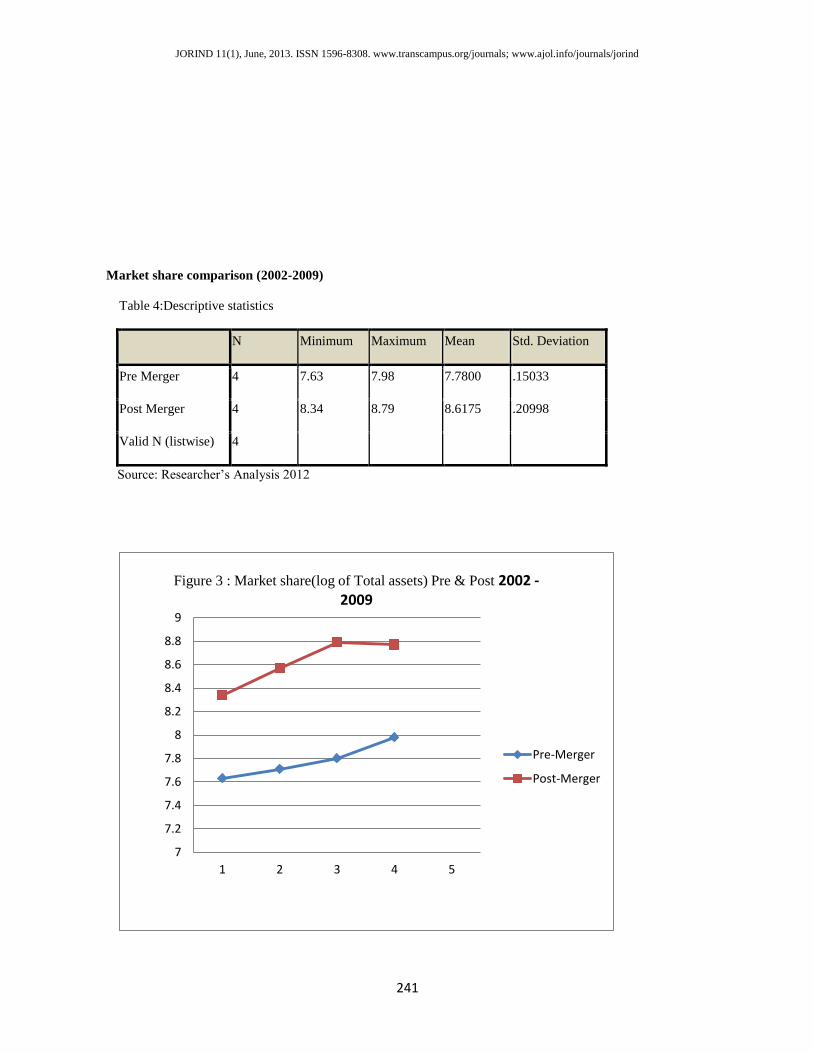
Table 4:Descriptive statistics
N Minimum Maximum Mean Std. Deviation
Pre Merger 4 7.63 7.98 7.7800 .15033
Post Merger 4 8.34 8.79 8.6175 .20998
Valid N (listwise) 4
Source: Researcher’s Analysis 2012
7
7.2
7.4
7.6
7.8
8
8.2
8.4
8.6
8.8
9
1 2 3 4 5
Figure 3 : Market share(log of Total assets) Pre & Post 2002 -2009
Pre-Merger
Post-Merger
241
JORIND 11(1), June, 2013. ISSN 1596-8308. www.transcampus.org/journals; www.ajol.info/journals/jorind
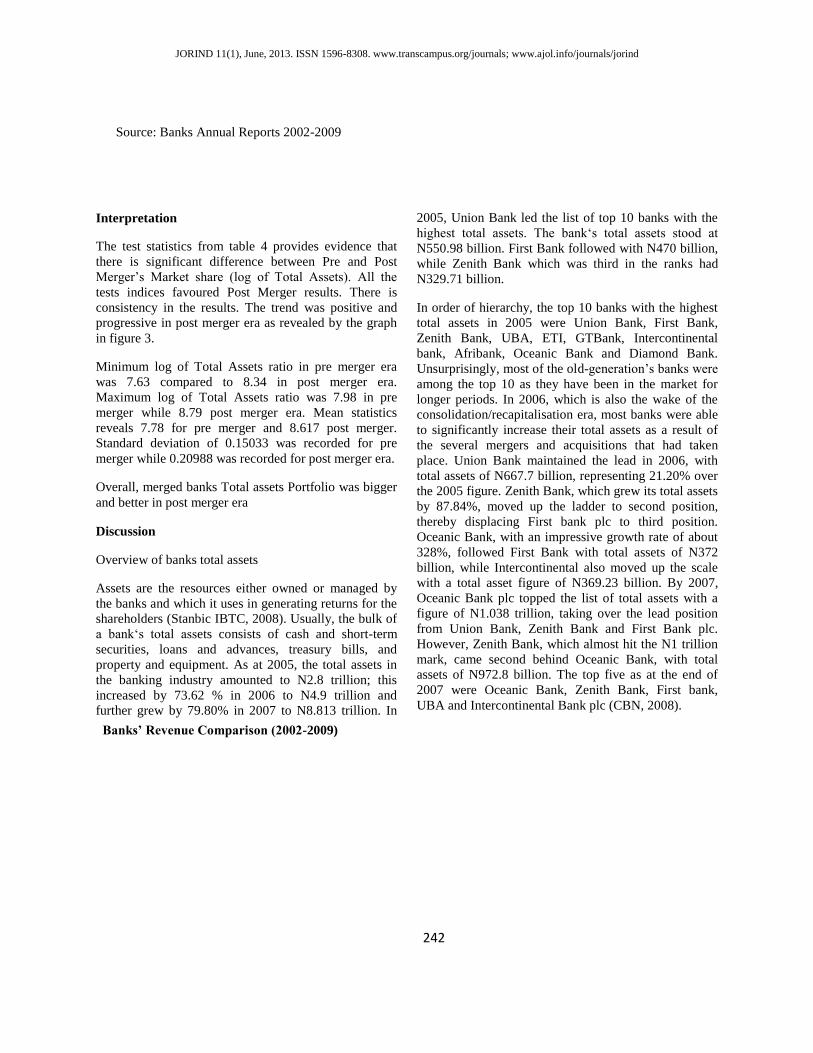
Source: Banks Annual Reports 2002-2009
Interpretation
The test statistics from table 4 provides evidence that
there is significant difference between Pre and Post
Merger’s Market share (log of Total Assets). All the
tests indices favoured Post Merger results. There is
consistency in the results. The trend was positive and
progressive in post merger era as revealed by the graph
in figure 3.
Minimum log of Total Assets ratio in pre merger era
was 7.63 compared to 8.34 in post merger era.
Maximum log of Total Assets ratio was 7.98 in pre
merger while 8.79 post merger era. Mean statistics
reveals 7.78 for pre merger and 8.617 post merger.
Standard deviation of 0.15033 was recorded for pre
merger while 0.20988 was recorded for post merger era.
Overall, merged banks Total assets Portfolio was bigger
and better in post merger era
Discussion
Overview of banks total assets
Assets are the resources either owned or managed by
the banks and which it uses in generating returns for the
shareholders (Stanbic IBTC, 2008). Usually, the bulk of
a bank‘s total assets consists of cash and short-term
securities, loans and advances, treasury bills, and
property and equipment. As at 2005, the total assets in
the banking industry amounted to N2.8 trillion; this
increased by 73.62 % in 2006 to N4.9 trillion and
further grew by 79.80% in 2007 to N8.813 trillion. In
2005, Union Bank led the list of top 10 banks with the
highest total assets. The bank‘s total assets stood at
N550.98 billion. First Bank followed with N470 billion,
while Zenith Bank which was third in the ranks had
N329.71 billion.
In order of hierarchy, the top 10 banks with the highest
total assets in 2005 were Union Bank, First Bank,
Zenith Bank, UBA, ETI, GTBank, Intercontinental
bank, Afribank, Oceanic Bank and Diamond Bank.
Unsurprisingly, most of the old-generation’s banks were
among the top 10 as they have been in the market for
longer periods. In 2006, which is also the wake of the
consolidation/recapitalisation era, most banks were able
to significantly increase their total assets as a result of
the several mergers and acquisitions that had taken
place. Union Bank maintained the lead in 2006, with
total assets of N667.7 billion, representing 21.20% over
the 2005 figure. Zenith Bank, which grew its total assets
by 87.84%, moved up the ladder to second position,
thereby displacing First bank plc to third position.
Oceanic Bank, with an impressive growth rate of about
328%, followed First Bank with total assets of N372
billion, while Intercontinental also moved up the scale
with a total asset figure of N369.23 billion. By 2007,
Oceanic Bank plc topped the list of total assets with a
figure of N1.038 trillion, taking over the lead position
from Union Bank, Zenith Bank and First Bank plc.
However, Zenith Bank, which almost hit the N1 trillion
mark, came second behind Oceanic Bank, with total
assets of N972.8 billion. The top five as at the end of
2007 were Oceanic Bank, Zenith Bank, First bank,
UBA and Intercontinental Bank plc (CBN, 2008).
Banks’ Revenue Comparison (2002-2009)
242
JORIND 11(1), June, 2013. ISSN 1596-8308. www.transcampus.org/journals; www.ajol.info/journals/jorind
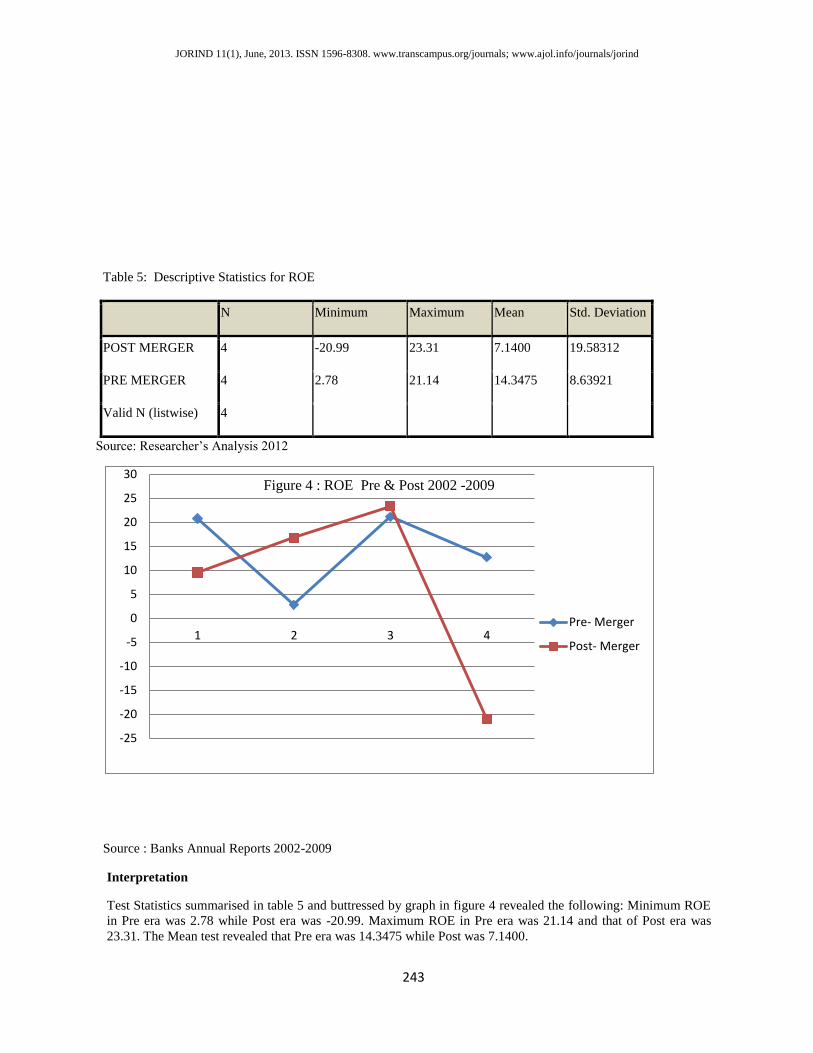
Table 5: Descriptive Statistics for ROE
N Minimum Maximum Mean Std. Deviation
POST MERGER 4 -20.99 23.31 7.1400 19.58312
PRE MERGER 4 2.78 21.14 14.3475 8.63921
Valid N (listwise) 4
Source: Researcher’s Analysis 2012
Source : Banks Annual Reports 2002-2009
Interpretation
Test Statistics summarised in table 5 and buttressed by graph in figure 4 revealed the following: Minimum ROE
in Pre era was 2.78 while Post era was -20.99. Maximum ROE in Pre era was 21.14 and that of Post era was
23.31. The Mean test revealed that Pre era was 14.3475 while Post was 7.1400.
-25
-20
-15
-10
-5
0
5
10
15
20
25
30
1 2 3 4
Figure 4 : ROE Pre & Post 2002 -2009
Pre- Merger
Post- Merger
243
JORIND 11(1), June, 2013. ISSN 1596-8308. www.transcampus.org/journals; www.ajol.info/journals/jorind
However, standard deviation of Post merger era (19.58) was better than Pre merger era (8.639). In conclusion,
ROE of the merged banks better in the pre consolidation era.
Discussion of finding
Investors prefer ROE to ROA because it shows how much is actually attributable to the shareholders after all
other stakeholders have been settled. It measures how much is made on the equity invested in the business. Since
the CBN‘s recapitalisation exercise, a growing activity in the banking industry is capital-raising, either through
initial public offerings, offers for subscription or rights issues. The impact of this activity on the ROE is that with
the increase in the number of shareholdings, banks may not be able to deliver commensurate returns, such that
the earnings per share are not eroded
By 2006, the industry average ROE had fallen drastically to 8.67%. This occurred because the shareholders’
funds of all the banks increased (to a minimum of N25 billion as set by the CBN), with some rising by over
100%. Although the PAT increased, it was not sufficient to stop dilution of the ROE.
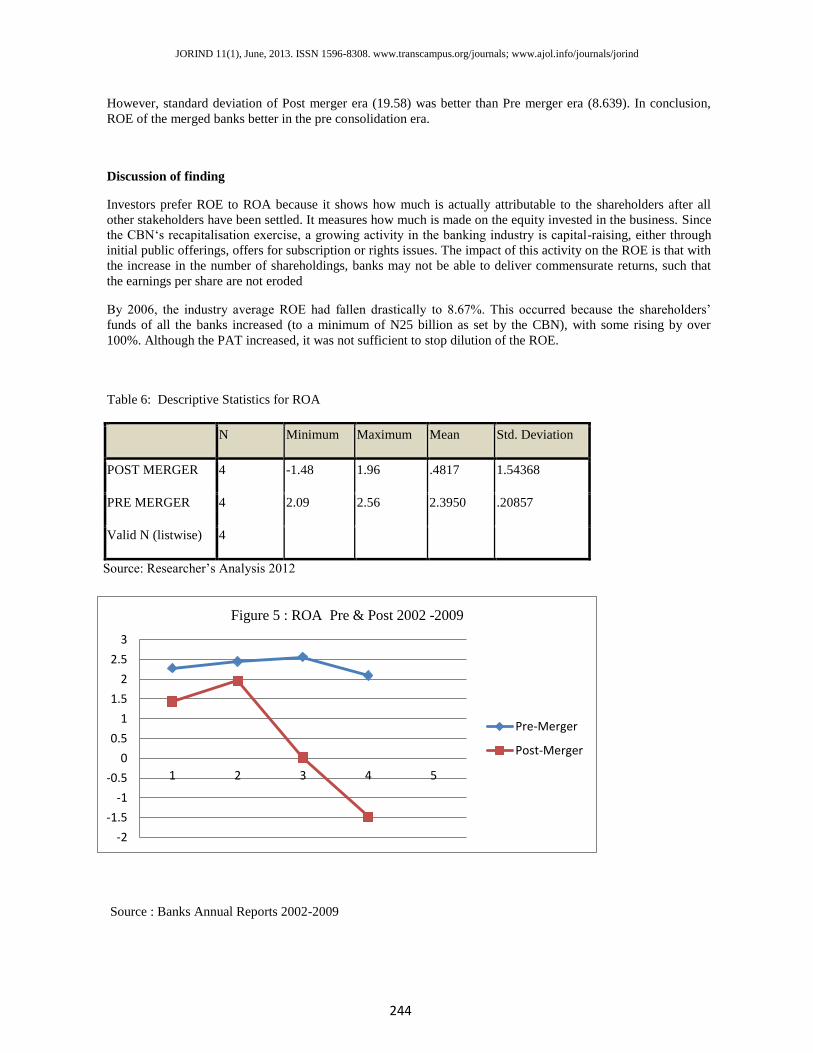
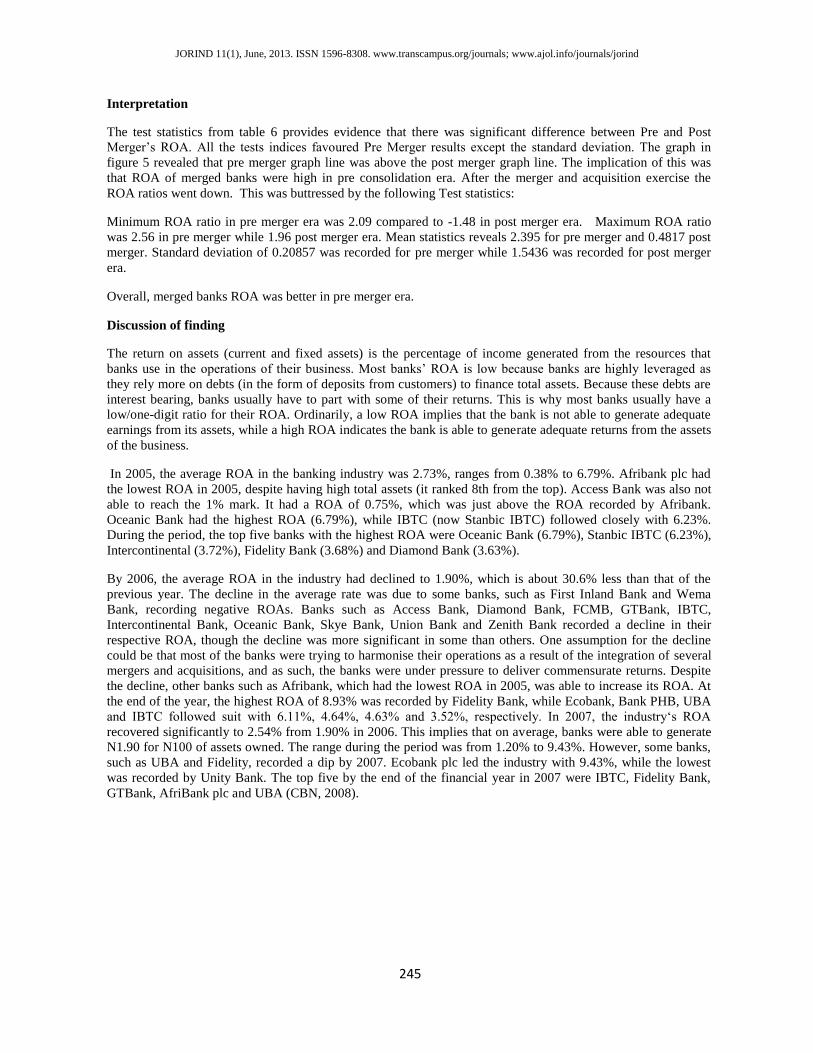
Table 6: Descriptive Statistics for ROA
N Minimum Maximum Mean Std. Deviation
POST MERGER 4 -1.48 1.96 .4817 1.54368
PRE MERGER 4 2.09 2.56 2.3950 .20857
Valid N (listwise) 4
Source: Researcher’s Analysis 2012
Source : Banks Annual Reports 2002-2009
-2
-1.5
-1
-0.5
0
0.5
1
1.5
2
2.5
3
1 2 3 4 5
Figure 5 : ROA Pre & Post 2002 -2009
Pre-Merger
Post-Merger
244
JORIND 11(1), June, 2013. ISSN 1596-8308. www.transcampus.org/journals; www.ajol.info/journals/jorind
Interpretation
The test statistics from table 6 provides evidence that there was significant difference between Pre and Post
Merger’s ROA. All the tests indices favoured Pre Merger results except the standard deviation. The graph in
figure 5 revealed that pre merger graph line was above the post merger graph line. The implication of this was
that ROA of merged banks were high in pre consolidation era. After the merger and acquisition exercise the
ROA ratios went down. This was buttressed by the following Test statistics:
Minimum ROA ratio in pre merger era was 2.09 compared to -1.48 in post merger era. Maximum ROA ratio
was 2.56 in pre merger while 1.96 post merger era. Mean statistics reveals 2.395 for pre merger and 0.4817 post
merger. Standard deviation of 0.20857 was recorded for pre merger while 1.5436 was recorded for post merger
era.
Overall, merged banks ROA was better in pre merger era.
Discussion of finding
The return on assets (current and fixed assets) is the percentage of income generated from the resources that
banks use in the operations of their business. Most banks’ ROA is low because banks are highly leveraged as
they rely more on debts (in the form of deposits from customers) to finance total assets. Because these debts are
interest bearing, banks usually have to part with some of their returns. This is why most banks usually have a
low/one-digit ratio for their ROA. Ordinarily, a low ROA implies that the bank is not able to generate adequate
earnings from its assets, while a high ROA indicates the bank is able to generate adequate returns from the assets
of the business.
In 2005, the average ROA in the banking industry was 2.73%, ranges from 0.38% to 6.79%. Afribank plc had
the lowest ROA in 2005, despite having high total assets (it ranked 8th from the top). Access Bank was also not
able to reach the 1% mark. It had a ROA of 0.75%, which was just above the ROA recorded by Afribank.
Oceanic Bank had the highest ROA (6.79%), while IBTC (now Stanbic IBTC) followed closely with 6.23%.
During the period, the top five banks with the highest ROA were Oceanic Bank (6.79%), Stanbic IBTC (6.23%),
Intercontinental (3.72%), Fidelity Bank (3.68%) and Diamond Bank (3.63%).
By 2006, the average ROA in the industry had declined to 1.90%, which is about 30.6% less than that of the
previous year. The decline in the average rate was due to some banks, such as First Inland Bank and Wema
Bank, recording negative ROAs. Banks such as Access Bank, Diamond Bank, FCMB, GTBank, IBTC,
Intercontinental Bank, Oceanic Bank, Skye Bank, Union Bank and Zenith Bank recorded a decline in their
respective ROA, though the decline was more significant in some than others. One assumption for the decline
could be that most of the banks were trying to harmonise their operations as a result of the integration of several
mergers and acquisitions, and as such, the banks were under pressure to deliver commensurate returns. Despite
the decline, other banks such as Afribank, which had the lowest ROA in 2005, was able to increase its ROA. At
the end of the year, the highest ROA of 8.93% was recorded by Fidelity Bank, while Ecobank, Bank PHB, UBA
and IBTC followed suit with 6.11%, 4.64%, 4.63% and 3.52%, respectively. In 2007, the industry‘s ROA
recovered significantly to 2.54% from 1.90% in 2006. This implies that on average, banks were able to generate
N1.90 for N100 of assets owned. The range during the period was from 1.20% to 9.43%. However, some banks,
such as UBA and Fidelity, recorded a dip by 2007. Ecobank plc led the industry with 9.43%, while the lowest
was recorded by Unity Bank. The top five by the end of the financial year in 2007 were IBTC, Fidelity Bank,
GTBank, AfriBank plc and UBA (CBN, 2008).
245
JORIND 11(1), June, 2013. ISSN 1596-8308. www.transcampus.org/journals; www.ajol.info/journals/jorind
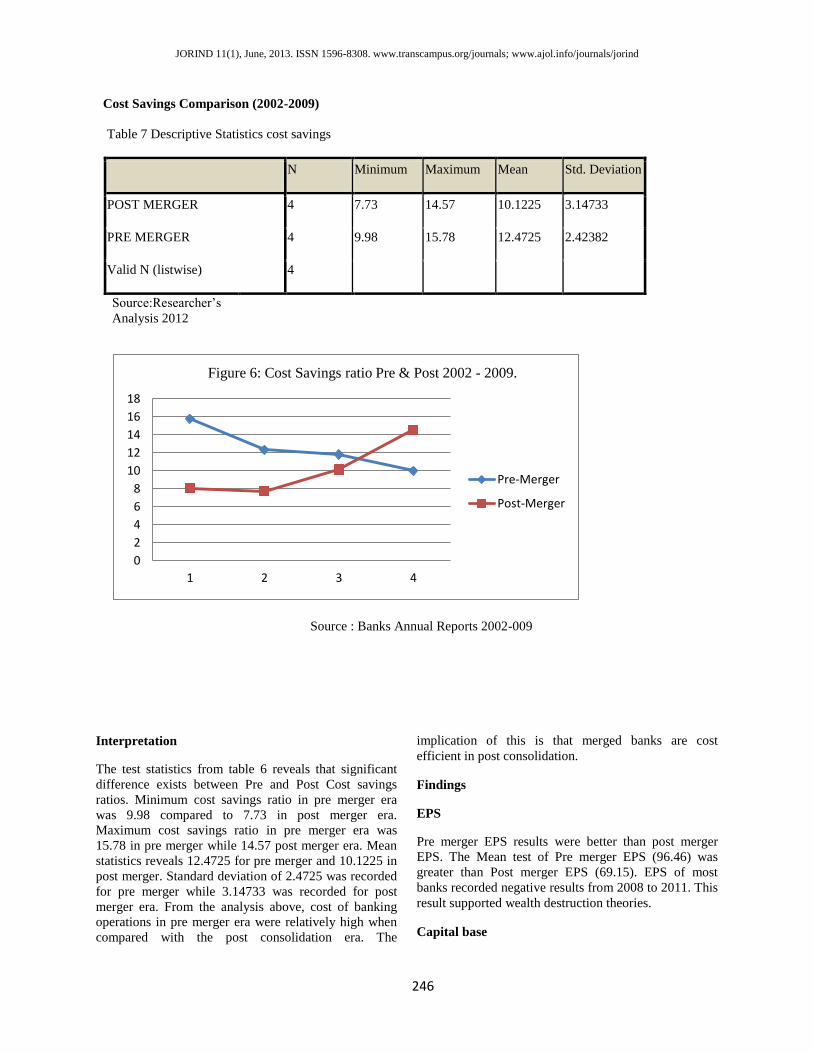
Cost Savings Comparison (2002-2009)
Table 7 Descriptive Statistics cost savings
N Minimum Maximum Mean Std. Deviation
POST MERGER 4 7.73 14.57 10.1225 3.14733
PRE MERGER 4 9.98 15.78 12.4725 2.42382
Valid N (listwise) 4
Source:Researcher’s
Analysis 2012
Source : Banks Annual Reports 2002-009
Interpretation
The test statistics from table 6 reveals that significant
difference exists between Pre and Post Cost savings
ratios. Minimum cost savings ratio in pre merger era
was 9.98 compared to 7.73 in post merger era.
Maximum cost savings ratio in pre merger era was
15.78 in pre merger while 14.57 post merger era. Mean
statistics reveals 12.4725 for pre merger and 10.1225 in
post merger. Standard deviation of 2.4725 was recorded
for pre merger while 3.14733 was recorded for post
merger era. From the analysis above, cost of banking
operations in pre merger era were relatively high when
compared with the post consolidation era. The
implication of this is that merged banks are cost
efficient in post consolidation.
Findings
EPS
Pre merger EPS results were better than post merger
EPS. The Mean test of Pre merger EPS (96.46) was
greater than Post merger EPS (69.15). EPS of most
banks recorded negative results from 2008 to 2011. This
result supported wealth destruction theories.
Capital base
0
2
4
6
8
10
12
14
16
18
1 2 3 4
Figure 6: Cost Savings ratio Pre & Post 2002 - 2009.
Pre-Merger
Post-Merger
246
JORIND 11(1), June, 2013. ISSN 1596-8308. www.transcampus.org/journals; www.ajol.info/journals/jorind
Inspite of increase in the capital base of banks from
N2billion to N25billion minimum, the capital adequacy
ratios were better in Pre merger era than Post merger
era. Statistics carried out revealed that Pre merger Mean
of 15.29 was greater than Post merger Mean of 14.89.
Market share
Merged banks assets portfolio witnessed geometrical
increase in Post merger era. The merged banks’
portfolios were diversified across geographical terrains
and they had broad market share. Test Statistics carried
out overwhelmingly supported Post Merger era results.
For example Mean Statistics for Post merger of 8.617
was greater than Pre merger of 7.78. Standard deviation
for Post merger was 0.20988 while Pre merger was
0.15033.Merged banks ventured into related and
unrelated businesses in post merger era.
ROE
Pre merger ROE ratios were better results than Post
merger era. Statistics carried out reveals that Mean of
Post merger (7.14) was less than (14.3) for Pre merger.
In post merger era the minimum ROE was as low as -
20.99 while the lowest in pre merger was 2.78
ROA
Pre merger ROA ratios were better than Post merger
era. Statistics carried out, all favoured Pre merger era.
Mean was 2.395 in pre merger era while post merger era
was 0.4817.
Cost savings
Cost to Total assets: The cost-to-total assets ratio shows
the efficiency of banks, the higher the ratio, less
efficient is the bank and the more profitability is
reduced. One strategic way of increasing profitability is
reducing costs, increasing earnings or a combination of
both. Costs in a bank usually range from interest
expenses to other operating expenses, while income is
generated from revenues, such as interest on loans and
advances, commissions, etc.
Our findings revealed that in the Post merger era banks
were more efficient in terms of cost to total assets than
Pre merger era. Statistics carried out reveals Pre merger
ratios were higher than Post merger era. For example,
the Mean for Pre merger was 12.4725 while Mean for
Post merger era was10.1225. The implication of this is
that the lower the cost savings ratio the better for the
banks and more wealth would be created for the
shareholders.
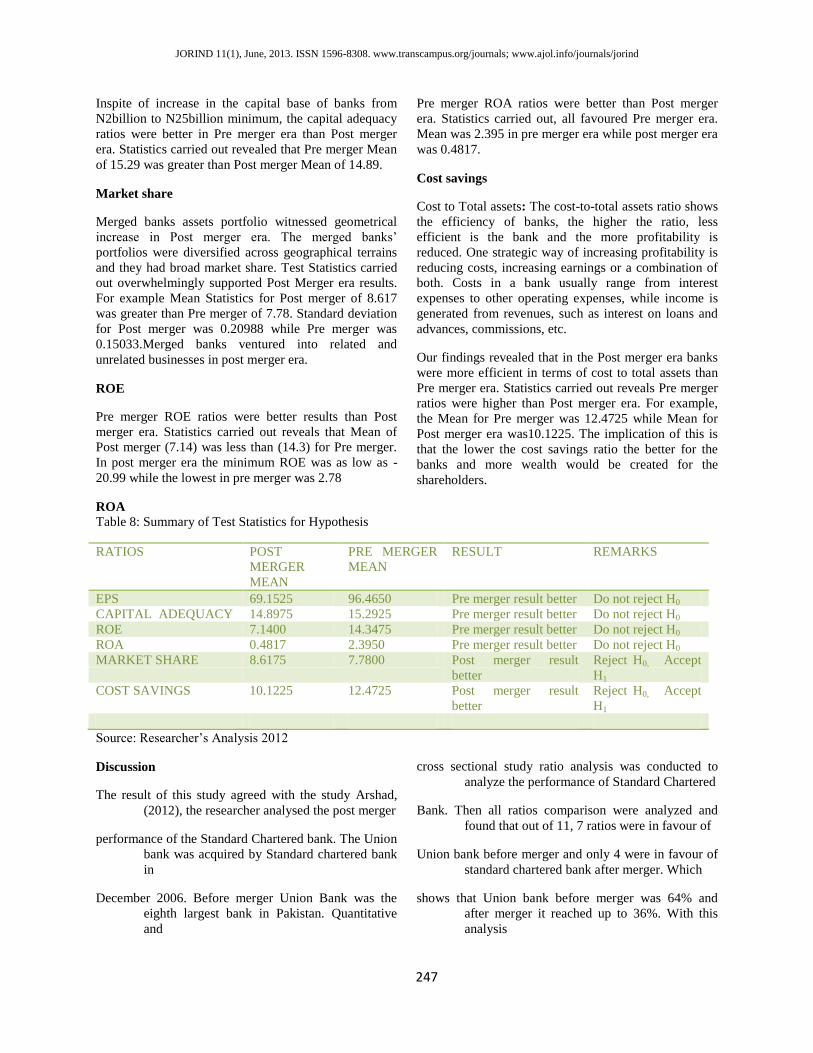
Table 8: Summary of Test Statistics for Hypothesis
RATIOS POST
MERGER
MEAN
PRE MERGER
MEAN
RESULT REMARKS
EPS 69.1525 96.4650 Pre merger result better Do not reject H0
CAPITAL ADEQUACY 14.8975 15.2925 Pre merger result better Do not reject H0
ROE 7.1400 14.3475 Pre merger result better Do not reject H0
ROA 0.4817 2.3950 Pre merger result better Do not reject H0
MARKET SHARE 8.6175 7.7800 Post merger result
better
Reject H0, Accept
H1
COST SAVINGS 10.1225 12.4725 Post merger result
better
Reject H0, Accept
H1
Source: Researcher’s Analysis 2012
Discussion
The result of this study agreed with the study Arshad,
(2012), the researcher analysed the post merger
performance of the Standard Chartered bank. The Union
bank was acquired by Standard chartered bank
in
December 2006. Before merger Union Bank was the
eighth largest bank in Pakistan. Quantitative
and
cross sectional study ratio analysis was conducted to
analyze the performance of Standard Chartered
Bank. Then all ratios comparison were analyzed and
found that out of 11, 7 ratios were in favour of
Union bank before merger and only 4 were in favour of
standard chartered bank after merger. Which
shows that Union bank before merger was 64% and
after merger it reached up to 36%. With this
analysis
247
JORIND 11(1), June, 2013. ISSN 1596-8308. www.transcampus.org/journals; www.ajol.info/journals/jorind
it was proved that merger does not improve the
performance of the bank after merger.
In the study of Royal Bank of Scotland (RBS) proves to
be failure in banking history. In this RBS study, author
also adopted the same way of finding results by
applying 20 financial ratios, to analyze the profitability
of Royal Bank of Scotland. And concluded that merger
does not improve the profitability (Kemal, 2011). In
another study the empirical results also shows that there
was not statistically significant gain in value or
performance from merger activity (Pilloff & Santomero,
1996). Furthermore, in another study it was shown that
target merged banks are smaller, less profitable, less
cost efficient and riskier than non-merging banks in case
of Germany (Andreas Behr, 2002). In another study it
was found that Merger between unhappy and strong
banks did not give up any significant efficiency gains to
participated banks (Pardeep & Gian, 2010).
Conclusion
Generally, our findings support the hypothesis that, on
average, Merger does not improve the results of merged
banks in the short run.
This study indicates that Mergers and Acquisitions that
took place in December, 2005 in Nigerian Banking
Industry have significant effects on the results of the
merged banks. The effects were both positive and
negative. Shortly after the consolidation process in 2006
and 2007, merged banks posted good results and they
were able to create wealth to shareholders via increase
dividend payout, bonuses and increase in stock prices.
However, from 2008 to 2011, it was wealth destruction.
Many shareholders lost their capital as result of
nationalisation of Banks like Springs Banks and Bank
PHB. Others lost their shares as result of liquidation and
absorption process, for example, Access Banks Plc
absorbed Intercontinental Plc, Ecobank Plc absorbed
Oceanic Banks etc.
Recommendations
Following our research findings, the following
suggestions are recommended. The outcome of this
study suggested a renew focus on elusive factors such as
bank revenue efficiency, market share and cost
efficiency in an attempt to grow profits, sustain bank’s
value and create wealth to shareholders. Banks’
Management should also give proper attention to scope
and scale of economies; eliminate redundancy,
duplication, corrupt and inefficient staff. In addition,
they should do all in their power to maximise wealth for
their shareholders.
References
Akhavein, J. D., Berger, A. N., & Humphrey, D. B.
(1996). The Effects of merger on efficiency and
prices: Evidence from a bank profit function. Wharton
Financial Institution center, 96-03.
Andreas Behr, F. H. (2002). The success of bank
mergers revisited −an assessment based on a
matching
strategy. Deutsche Bundesbank, 1-31.
Amihud, Y., & Lev, B. (1981). Risk reduction as a
managerial motive for conglomerate mergers.
Bell
Journal of Economics, 12, 605-617.
Arshad, A. (2012). Post merger performance analysis of
standard chartered bank Pakistan:
Interdisciplinary Journal of Contemporary Research in
Business, 4, 6.
Banerjee, A., & Eckard, E.W. (1998). Are mega
mergers anticompetitive? Evidence from the first
great
merger wave. Rand Journal of Economics, 29, 803-827.
Berger, A. N., & Humphrey, D. B. (1994). Bank scale
economies, mergers, concentration, and
efficiency:
The U.S. Experience. Wharton Financial Institution
Center, 94-25.
Berkovitch, E., & Narayanan, M. P. (1993). Motives for
takeovers: An empirical investigation. Journal of
Financial and Quantitative Analysis 76(1), 347-362.
Berger, A. N. (1995). The relationship between capital
and earnings in banking. Journal of Money,
Credit
and Banking, 27(2), 432-456.
Black, B. (1989). Bidder overpayment in takeovers.
Stanford Law Review. 41, (3), 597- 660.
Bourke, P. (1989). Concentration and other
determinants of bank profitability in Europe,
North America
248
JORIND 11(1), June, 2013. ISSN 1596-8308. www.transcampus.org/journals; www.ajol.info/journals/jorind
and Australia. Journal of Banking and Finance, 13, 65-
79.
Chatterjee, S. (1986). Types of synergy and economic
value: The impact of acquisitions on merging
and rival firms: Strategic Management Journal.
7, 119-139
Central Bank of Nigeria, (2006). Indigenous banking in
Nigeria. Central Bank of Nigeria. [Online].
Available at: http://www.cenbank.org/ [retrieved
22 May, 2011].
Devos, E., Kadapakkam, P. R., & Krishnamurthy, S.
(2008). How do mergers create value? A
comparison of Taxes, Market Power, and
Efficiency Improvements as Explanations for
Synergies, Review of Financial Studies, 16, 75-
89.
Dong, M., Hirschleifer, D., Richardson, S., & Teoh,
S.H. (2006). Does investor misevaluation drive
the Takeover Market? Journal of Finance 61(2),
725-762.
Feinberg, R. M. (1985). Sales at risk: A test of the
mutual forbearance theory of conglomerate
behaviour, Journal of Business 58, 225-241.
Gaughan, P. A. (2011). Mergers, acquisitions and
corporate restructurings. Canada: Jhon Wiley and
sons. Inc.
Gugler, K., Mueller, D. C., Yurtoglu, B. B., & Zulehner,
C. (2003). The effects of mergers: An
international comparison. International Journal
of Industrial Organization. 21, 625-653.
Goergen, M., & Renneboog, L. (2004). Shareholder
wealth effects of European domestic and cross-
border takeover bids. European Financial
Management 10(1), 9-45.
Hitt, M. A., Harrison, J.S., & Ireland, R.D. (2001).
Mergers and acquisitions: A guide to creating
value for stakeholders: Oxford, Oxford
University Press,
Houston, J. F., James, C.M., & Ryngaert, M.D. (2001).
Where do merger gains come from? Bank
mergers from the perspective of insiders and
outsiders: Journal of Financial Economics, 60,
285-331.
Harford, J. (1999). Corporate cash reserves and
acquisitions. Journal of Finance. 54 (6), 1969-
1997.
Hayward, M. L. A., & Hambrick, D. C. (1997).
Explaining the premiums paid for large
acquisitions: Evidence of CEO hubris.
Administrative Science Quarterly, 42, 103-127.
Heggestad, A. J. (1977). Market structure, risk and
profitability in commercial Banking: Journal of
Finance, 32 (4), 1207-1216.
Hassan, M. K., & Bashir, A. (2003). Determinants of
Islamic banking profitability: Paper presented at
the proceedings of the economic research forum
10th annual conference, Marakesh- Morocco.
Jensen, M .C. (1986). Agency costs of free cash flow,
corporate finance and takeovers, American
Economic Review, 76, 323-329.
Klein, P. G., (2001).Were the acquisitive conglomerates
inefficient? Rand Journal of Economics, 32,745-
761
Kim, E. H., & Singal, V. (1993). Mergers and market
power: Evidence from the airline industry.
American Economic Review, 83, 549-569.
Kemal, M. U. (2011). Post-Merger Profitability: A Case
of Royal Bank of Scotland (RBS). International
Journal of Business and Social Science, 157-162.
Lang, L., Stulz, R., & Walkling, R. (1991). A test of the
free cash flow hypothesis: the case of bidder
returns, Journal of Financial Economics 29(2),
315-335.
Lewellen, W., Loderer, C., & Rosenfeld, A. (1985).
Decisions and executive stock ownership in
acquiring firms, Journal of Accounting and
Economics 7, 209-231.
Malik, L. F. (2006). Banking system review. Pakistan:
State Bank.
Malmendier, U., & Tate, V. (2005). CEO
Overconfidence and corporate investment,
Journal of Finance, 60, (6), 2661-2700.
Manne, H.G. (1965). Mergers and the market for
corporate control: Journal of Political Economy
73, 110-120.
Marris, R.L. (1963). A model of ‘managerial’
enterprise: Quarterly Journal of Economics
77(2), 185-209
249
JORIND 11(1), June, 2013. ISSN 1596-8308. www.transcampus.org/journals; www.ajol.info/journals/jorind
Mukherjee, T.K., Kiymaz , V., & Baker, H.K. (2004).
Merger motives and target valuation: A survey of
evidence from CFO’s. Journal of Applied
Finance 14, 7-24
Prager, R. A. (1992). The effects of horizontal mergers
on competition: The case of the Northern
Securities Company. Rand Journal of
Economics, 23:123-133.
Pandey, I. M. (2005). Financial management, (9th
edition). New Delhi: Vikas Publishing House
PVT Ltd.
Pilloff, S. J., & Santomero, A. M. (1996, October 29).
The Value Effects of Bank Mergers and
Acquisitions. Wharton Financial Institution
center , pp. 97-07.
Rau, P. R., & Vermaelen, T. (1998). Glamour, value
and the post-acquisition performance of
acquiring firms, Journal of Financial Economics
49, 101-116.
Roll, R. (1986). The hubris hypothesis of corporate
takeovers, Journal of Business 59, 197-216.
Ravenscraft, D. J., & Scherer, F.M. (1987). Mergers,
sell-offs and economic efficiency. The Brookings
Institution: Washington, DC.
Rhoades, S. A. (1997). The efficiency effect of bank
mergers: An overview of case studies of nine
mergers. Journal of Banking & Finance , 273-
291.
Shleifer, A., & Vishny, R.W. (1989). Management
entrenchment: The case of manager-specific
investments, Journal of Financial Economics.
25(1), 123-139
Stanbic- IBTC Plc (2008).Annual report
Smirlock, M. (1985). Evidence on the non relationship
between concentration and profitability in
banking. Journal of Money Credit and Banking,
17, 69-83
250