Embed Size (px)
Citation preview
RESEARCH ARTICLE Open Access
Comparative analysis of expressed sequence tags(ESTs) between drought-tolerant and -susceptiblegenotypes of chickpea under terminal droughtstressAmit A Deokar1,2, Vishwajith Kondawar1,2, Pradeep K Jain1, S Mohan Karuppayil2, N L Raju3, Vincent Vadez3,Rajeev K Varshney3,4 and R Srinivasan1*
Abstract
Background: Chickpea (Cicer arietinum L.) is an important grain-legume crop that is mainly grown in rainfed areas,where terminal drought is a major constraint to its productivity. We generated expressed sequence tags (ESTs) bysuppression subtraction hybridization (SSH) to identify differentially expressed genes in drought-tolerant and-susceptible genotypes in chickpea.
Results: EST libraries were generated by SSH from root and shoot tissues of IC4958 (drought tolerant) and ICC1882 (drought resistant) exposed to terminal drought conditions by the dry down method. SSH libraries were alsoconstructed by using 2 sets of bulks prepared from the RNA of root tissues from selected recombinant inbred lines(RILs) (10 each) for the extreme high and low root biomass phenotype. A total of 3062 unigenes (638 contigs and2424 singletons), 51.4% of which were novel in chickpea, were derived by cluster assembly and sequencealignment of 5949 ESTs. Only 2185 (71%) unigenes showed significant BLASTX similarity (<1E-06) in the NCBI non-redundant (nr) database. Gene ontology functional classification terms (BLASTX results and GO term), wereretrieved for 2006 (92.0%) sequences, and 656 sequences were further annotated with 812 Enzyme Commission(EC) codes and were mapped to 108 different KEGG pathways. In addition, expression status of 830 unigenes inresponse to terminal drought stress was evaluated using macro-array (dot blots). The expression of few selectedgenes was validated by northern blotting and quantitative real-time PCR assay.
Conclusion: Our study compares not only genes that are up- and down-regulated in a drought-tolerant genotypeunder terminal drought stress and a drought susceptible genotype but also between the bulks of the selected RILsexhibiting extreme phenotypes. More than 50% of the genes identified have been shown to be associated withdrought stress in chickpea for the first time. This study not only serves as resource for marker discovery, but can providea better insight into the selection of candidate genes (both up- and downregulated) associated with drought tolerance.These results can be used to identify suitable targets for manipulating the drought-tolerance trait in chickpea.
BackgroundChickpea (Cicer arietinum L.), the fourth most impor-tant grain-legume crop, is grown in more than 45 coun-tries, mostly in arid and semiarid zones. Approximately90% of the crop is grown under rainfed conditions,wherein yield is significantly affected by abiotic stresses
such as drought, heat, and cold [1-3]. Drought-relatedyield losses can occur in 40%-60% of the total chickpeaproduction [4]. Terminal drought, which occurs at thepod filling and seed-developing stage of the crop andincreases in severity at the end of the season, is a majorconstraint to chickpea production [1,5,6]. The identifica-tion of differentially expressed genes between 2 geno-types differing in drought tolerance and a set of theirprogenies can therefore be an important indicator ofdrought-associated genes in chickpea.
* Correspondence: [email protected] Research Center on Plant Biotechnology, IARI Campus, New Delhi110012, IndiaFull list of author information is available at the end of the article
Deokar et al. BMC Plant Biology 2011, 11:70http://www.biomedcentral.com/1471-2229/11/70
© 2011 Deokar et al; licensee BioMed Central Ltd. This is an Open Access article distributed under the terms of the Creative CommonsAttribution License (http://creativecommons.org/licenses/by/2.0), which permits unrestricted use, distribution, and reproduction inany medium, provided the original work is properly cited.
Functional genomics approaches have been used inrecent years to understand the stress-responsivemechanism in plants. Candidate genes involved indrought tolerance mechanisms have been identified,characterized, and assessed for their comparative tran-scriptional activity by using whole-genome sequencingor expressed sequence tag (EST) libraries. Several func-tional genomics studies have been performed in chick-pea to identify the abiotic stress-responsive transcriptsby approaches such as suppression subtractive hybridi-zation (SSH), Super serial analysis of gene expression(SuperSAGE), microarray, and EST sequencing [7-9].Additional file 1 summarizes results of previous studieson identifying ESTs associated with drought stress inchickpea.SSH has been widely used to compare patterns of
gene expression in tissues under different conditions.However, it has not yet been used to identify differen-tially expressed transcripts (both up- and downregu-lated) in chickpea in response to drought stress at theflowering stage of plants. In all earlier studies, exceptthe one by Varshney et al. [9], water stress was imposedby either completely withdrawing water or allowinguprooted young seedlings to wilt at room temperature.However, under field conditions, water stress progressesgradually and a similar type of stress is simulated in thelaboratory by the “dry down experiment,” which allowscomparison of different genotypes and their responsetoward drought [10]. Moreover, stress response of aplant at the seedling stage can be very different fromthat at the reproductive stage, the latter being an impor-tant and yield-determining stage in chickpea.In the present study, we constructed several reciprocal
SSH libraries by using drought-tolerant and -susceptiblegenotypes as well as extreme recombinant inbred lines(RILs) for the high root biomass (HRB) and low rootbiomass (LRB) under terminal drought stress. Thisapproach differs from that used in earlier studies in thefollowing aspects: (1) use of 2 chickpea genotypes differ-ing in their drought-tolerance capacity and their RILprogenies; (2) drought stress imposed at the floweringstage in a gradual manner by the dry down method; (3)plant samples analyzed when each plant experienced thesame amount of stress, as judged by their transpirationratio; and (4) reciprocal subtraction of transcripts byusing control and stress conditions as well as susceptibleand tolerant genotypes to enable a good comparison andidentify both up- and downregulated genes. Thus, theEST set we used is novel and represents genes that areup and downregulated in response to terminal droughtstress, and can thereby help several genes that have notbeen shown to be previously associated with droughtstress in chickpea. The differentially expressed ESTs
were analyzed using macro-array, northern blotting, andquantitative PCR.
MethodsPlant MaterialThe drought-tolerant characteristics of chickpea lineICC 4958 and drought-susceptible characteristics of ICC1882 have been attributed to their large and prolific andsmall root system, respectively. An RIL mapping popula-tion (264 RILs) of ICC 4958 (large root) and ICC 1882(small root) has been developed and phenotyped at theInternational Crops Research Institute for the Semi-AridTropics (ICRISAT), Patancheru (17° 30’ N; 78° 16’ E;altitude 549 m). The root phenotyping experiment wasconducted in PVC cylinders with 18 cm diameter and120 cm height, filled with soil-sand mixture in openfield conditions. Plants were sampled at 35 days aftersowing and different measurements were recorded asdescribed by Kashiwagi et al. [11]. Ten RILs for extremephenotype of high root biomass and low root biomasswere selected on the basis of phenotypic evolution[Varshney et al. unpublished] to prepare bulk cDNASSH libraries.
Stress treatmentDry down procedureDry down, a gradual and progressive water deficit stress,was given to plants [10]. Experiments were conducted intriplicate in a glass house receiving natural solar radia-tion, with air temperature regulated between 23°C and28°C (night/day). Seeds of ICC 4958, ICC 1882, 10 RILseach for HRB and LRB, were sown in plastic pots of 8-in. diameter. Water stress (WS) treatment was initiated35 days after the emergence of plants. All pots weresaturated with water and left overnight to drain excesswater. Next day, the surfaces of pots were covered withplastic beads to prevent water loss through the soil sur-face. Weight (in g) of individual pots was recorded dailyin the morning at approximately 10.30 h. Daily loss ofwater through transpiration was calculated as the differ-ence in pot weight on the current day from that on theprevious day. Control plants were maintained atapproximately 80% field capacity by daily compensationof water loss due to transpiration. To expose WS plantsto a progressive water deficit, they were allowed to losea maximum of 80 g of water per day; any additional losswas compensated by adding water to the pots. The tran-spiration of each plant was then calculated as the differ-ence in its weight on successive days, plus water addedon the previous day. Transpiration data were analyzedas described previously [10]. Well watered (WW) potswere maintained at a normalized transpiration ratio(NTR) value of 1 and WS treatment was continued until
Deokar et al. BMC Plant Biology 2011, 11:70http://www.biomedcentral.com/1471-2229/11/70
Page 2 of 20
the ratio of the transpiration of the stressed plant to theaverage transpiration of WW plants reached ≤0.1, thatis, when the transpiration of WS plants was <1% of theWW plants, a stage defined as the endpoint for thewater deficit treatment [10]. WS plants reached thisstage in 10 to13 day of initiation of stress treatment. Atthis stage, shoot and the root tissues from WW and WSplants were separately harvested, frozen in liquid nitro-gen, and stored at -80°C for RNA extraction.
RNA and mRNA isolationTotal RNA was isolated by using the Trizol reagent(Invitrogen, Carlsbad, CA), and mRNA was further iso-lated by using the PolyATract mRNA Isolation System(Promega, Madison, WI). To construct bulk libraries,equal amounts of total RNA (100 μg from each RIL) iso-lated from 10 RILs of extreme HRB and 10 RILs ofextreme LRB were pooled separately and used formRNA isolation.
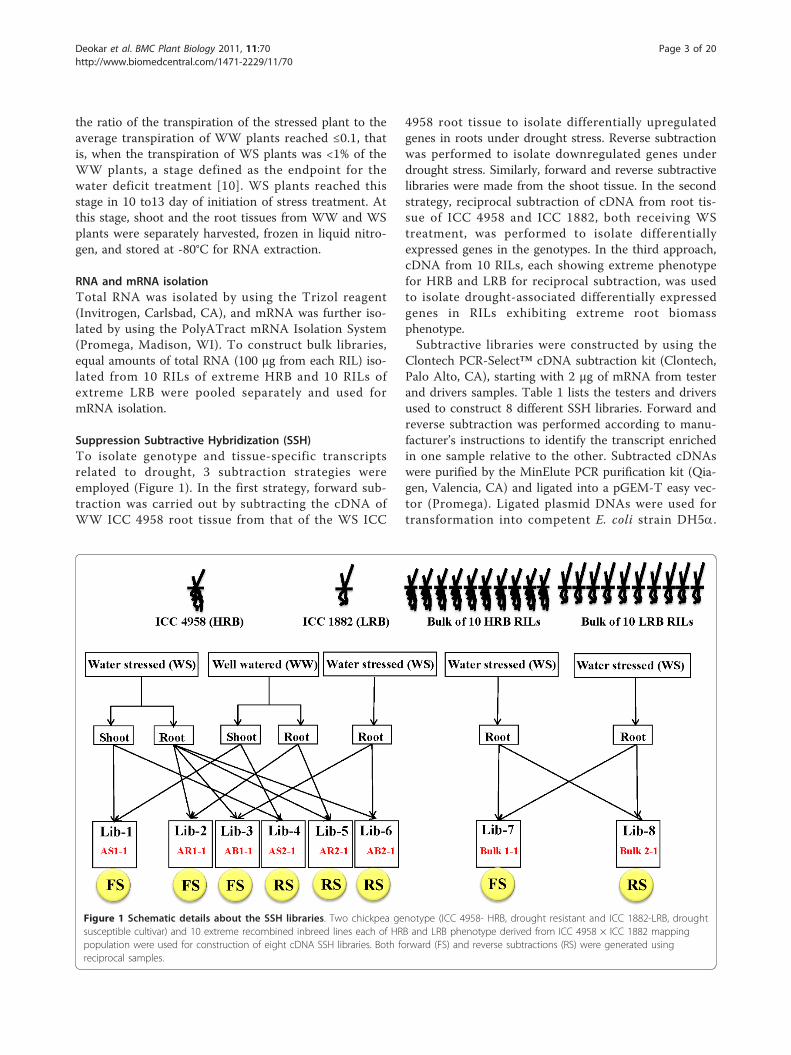
Suppression Subtractive Hybridization (SSH)To isolate genotype and tissue-specific transcriptsrelated to drought, 3 subtraction strategies wereemployed (Figure 1). In the first strategy, forward sub-traction was carried out by subtracting the cDNA ofWW ICC 4958 root tissue from that of the WS ICC
4958 root tissue to isolate differentially upregulatedgenes in roots under drought stress. Reverse subtractionwas performed to isolate downregulated genes underdrought stress. Similarly, forward and reverse subtractivelibraries were made from the shoot tissue. In the secondstrategy, reciprocal subtraction of cDNA from root tis-sue of ICC 4958 and ICC 1882, both receiving WStreatment, was performed to isolate differentiallyexpressed genes in the genotypes. In the third approach,cDNA from 10 RILs, each showing extreme phenotypefor HRB and LRB for reciprocal subtraction, was usedto isolate drought-associated differentially expressedgenes in RILs exhibiting extreme root biomassphenotype.Subtractive libraries were constructed by using the
Clontech PCR-Select™ cDNA subtraction kit (Clontech,Palo Alto, CA), starting with 2 μg of mRNA from testerand drivers samples. Table 1 lists the testers and driversused to construct 8 different SSH libraries. Forward andreverse subtraction was performed according to manu-facturer’s instructions to identify the transcript enrichedin one sample relative to the other. Subtracted cDNAswere purified by the MinElute PCR purification kit (Qia-gen, Valencia, CA) and ligated into a pGEM-T easy vec-tor (Promega). Ligated plasmid DNAs were used fortransformation into competent E. coli strain DH5a.
Figure 1 Schematic details about the SSH libraries. Two chickpea genotype (ICC 4958- HRB, drought resistant and ICC 1882-LRB, droughtsusceptible cultivar) and 10 extreme recombined inbreed lines each of HRB and LRB phenotype derived from ICC 4958 × ICC 1882 mappingpopulation were used for construction of eight cDNA SSH libraries. Both forward (FS) and reverse subtractions (RS) were generated usingreciprocal samples.
Deokar et al. BMC Plant Biology 2011, 11:70http://www.biomedcentral.com/1471-2229/11/70
Page 3 of 20
Positive clones were selected on an Ampicillin/IPTG/X-Gal LB plate. Plasmid DNA from positive clones wereisolated by using REAL 96 plasmid isolation kit (Qia-gen), and purified DNA was used for single-pass Sangersequencing by using T7/SP6/M13F universal sequencingprimers.
Sequence processingAll sequences were checked for quality and then ana-lyzed by Seqman™ II 5.08 (DNASTAR, Inc.. LasergeneGene Corporation, Ann Arbor, MI) to detect andremove pGEMT-Easy vector sequences. A Perl scriptEST trimmer [12] was used to trim adaptors, poly A/Tends. EST sequences which were less than 100 bp longwere removed. Manual sequence processing was alsoperformed to confirm results. ESTs from individuallibraries were assembled into contigs, using default para-meters of CAP3 [13]. Incorporation of ESTs into a con-tig required at least 95% sequence identity and aminimum 40-bp overlap. ESTs from all 8 libraries alsounderwent CAP3 analysis to produce a differentiallyexpressed unigene dataset.
Sequence annotationThe NCBI BLAST program [14] version 2.2.6 was usedto perform BLASTN and BLASTX similarity searches.BLASTN analysis was performed to determinesequence homology at the nucleotide level of this uni-genes set with EST databases of Medicago truncatula,Glycine max, Lotus japonicus, and Phaseous vulgarisand also with ESTs of model plant species suchas Arabidopsis thaliana, Oryza sativa, and Populusalba downloaded from NCBI. The cutoff expectation
(E)-value threshold for BLASTN searches was ≤1e-5.BLASTX was performed against NCBI non-redundant(nr) database using Blast2GO with an E-value cutoff of<1e-06.
Functional categorization and GO enrichment analysisFunctional annotation was performed by using Blast2GO(version 2.2.3) [15], following the standard procedure ofBLASTX for unigenes dataset (parameters: nr database,high scoring segment pair (HSP) cutoff length 33, report20 hits, maximum E-value 1.0E-3), followed by mappingand annotation (parameters: E-value hit filter 1.0E-6,annotation cutoff 55, GO weight 5, HSP-hit coverage cut-off 20). GO terms were summarized according to theirmolecular functions, biologic processes, and cellularcomponents. Enzyme mapping of annotated sequenceswas performed by using direct GO to Enzyme mappingand used to query the Kyoto Encyclopaedia of Genes andGenomes (KEGG) to define the KEGG orthologs (KOs).These KOs were then plotted into the whole metabolicatlas by using the KEGG mapping tool [16].GO enrichment analysis was performed by using the
Fisher exact test, as implemented in the GOSSIP module[17] integrated in Blast2GO package. For GO enrichmentanalysis, all GO terms with a cut-off threshold of pFDR(p)≤ 0.05 were considered differentially enriched between 2set of EST libraries. To study the genotype-specificresponse for ICC 4958 and ICC 1882 under droughtstress, GO enrichment analysis was performed betweenESTs developed from the SSH libraries AB1-1 and AB2-1,which were constructed to identify transcripts induced inresponse to drought in the tolerant genotype ICC 4958and the susceptible genotype ICC 1882, respectively.
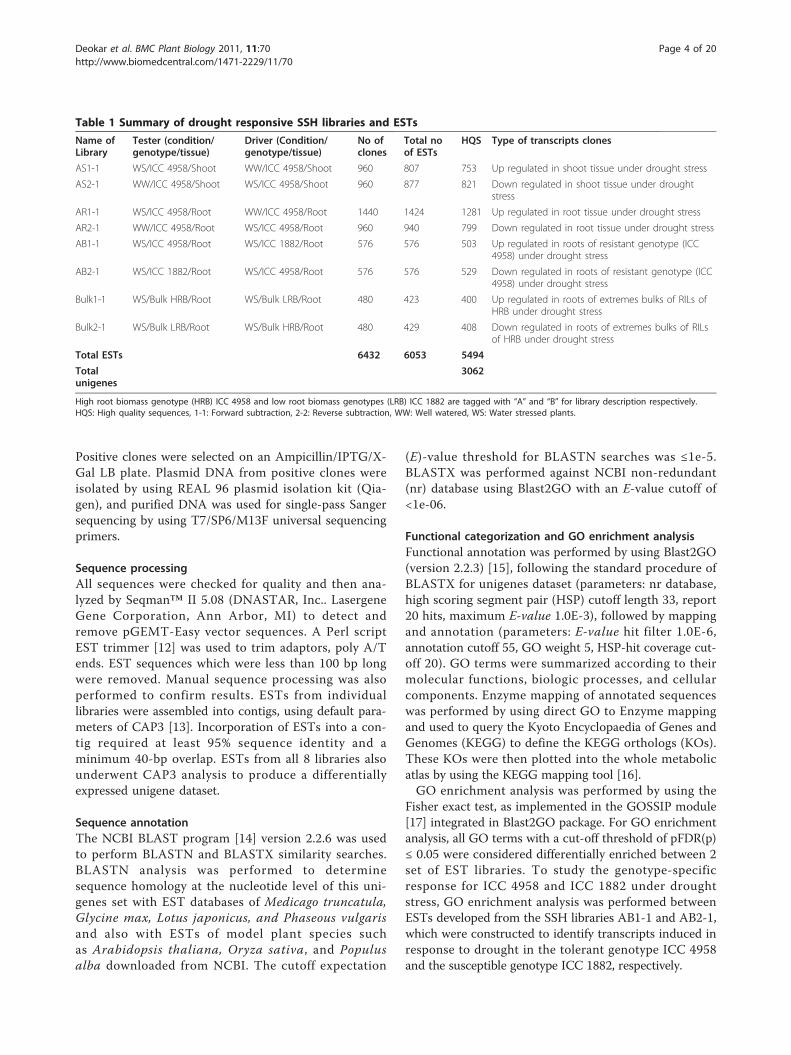
Table 1 Summary of drought responsive SSH libraries and ESTs
Name ofLibrary
Tester (condition/genotype/tissue)
Driver (Condition/genotype/tissue)
No ofclones
Total noof ESTs
HQS Type of transcripts clones
AS1-1 WS/ICC 4958/Shoot WW/ICC 4958/Shoot 960 807 753 Up regulated in shoot tissue under drought stress
AS2-1 WW/ICC 4958/Shoot WS/ICC 4958/Shoot 960 877 821 Down regulated in shoot tissue under droughtstress
AR1-1 WS/ICC 4958/Root WW/ICC 4958/Root 1440 1424 1281 Up regulated in root tissue under drought stress
AR2-1 WW/ICC 4958/Root WS/ICC 4958/Root 960 940 799 Down regulated in root tissue under drought stress
AB1-1 WS/ICC 4958/Root WS/ICC 1882/Root 576 576 503 Up regulated in roots of resistant genotype (ICC4958) under drought stress
AB2-1 WS/ICC 1882/Root WS/ICC 4958/Root 576 576 529 Down regulated in roots of resistant genotype (ICC4958) under drought stress
Bulk1-1 WS/Bulk HRB/Root WS/Bulk LRB/Root 480 423 400 Up regulated in roots of extremes bulks of RILs ofHRB under drought stress
Bulk2-1 WS/Bulk LRB/Root WS/Bulk HRB/Root 480 429 408 Down regulated in roots of extremes bulks of RILsof HRB under drought stress
Total ESTs 6432 6053 5494
Totalunigenes
3062
High root biomass genotype (HRB) ICC 4958 and low root biomass genotypes (LRB) ICC 1882 are tagged with “A” and “B” for library description respectively.HQS: High quality sequences, 1-1: Forward subtraction, 2-2: Reverse subtraction, WW: Well watered, WS: Water stressed plants.
Deokar et al. BMC Plant Biology 2011, 11:70http://www.biomedcentral.com/1471-2229/11/70
Page 4 of 20
Macroarray and Northern HybridizationTo screen the differentially expressed ESTs identified inpresent work, two different macroarray experimentswere conducted. In the first experiment, a nylon macro-array in 96-well format, using unigenes from AS1-1 andAS2-1 libraries, was constructed and total RNA fromWW and WS plants of ICC 4958 were used to evaluatethe differentially expressed unigenes under waterstressed condition. Where as in second experiment, anylon macroarray in a 96-well format, using unigenesfrom AB1-1 and AB2-1 libraries, was constructed andtotal RNA from water-stressed ICC 4958 and ICC 1882were used to evaluate the genotype-specific responseunder water stress condition.Equal amounts of purified PCR amplified products
(100 ng) was spotted onto nylon membranes (Amer-sham Pharmacia Biotech, Uppsala, Sweden), using thedot-blot apparatus in 96 formats. Each blot was pre-pared in duplicate. PCR-amplified products of actincDNA (GenBank: EU529707) as a housekeeping genefor normalization of the signals between the blots andneomycin phosphotransferase (NPTII) as a negative con-trol for signal background correction were spotted onthe membrane and cross-linked using UV. RNA sampleswere labeled during first-strand cDNA synthesis. TotalRNA (5 μg ) was reverse transcribed, using SuperScriptIII RT enzyme (Superscript II, Life Technologies, GrandIslands, NY) in the presence of a-[32P] dCTP and usedas probes. The nylon membrane were prehybridizedwith formamide hybridization buffer for 42°C for 6 h,the denatured probe was added, and hybridized for 24h. Washed membranes were exposed to X-ray film(BIOMAX MR Film, Kodak) and developed after 7 daysof incubation at -80°C. The image of the developed filmwas acquired by SYNGENE-G-Box gel documentationand analysis system (Syngene, Synoptics Ltd, Cambridge,UK) and signal intensity of each spot was calculated bythe Gene tool software. Transcript levels for each uni-genes were calculated as the average intensity from tri-plicate experiments. The intensity of each spot wasnormalized with respect to the intensity of actin gene.Change in level of expression was expressed as theexpression ratio of normalized signal intensities ofrespective unigenes in control versus treatments. On thebasis of macroarray results, genes exhibiting significantinduction were validated by Northern blotting.For northern blotting total RNA (20 μg) from WW and
WS plants was separated by electrophoresis on a 1.2% FAagarose gel and transferred to an Immobilon™-Ny+membrane (Millipore, USA) following the method ofSambrook et al. [18]. PCR-amplified individual cDNAfragments (amplified with M13 forward and reverseuniversal sequencing primers) were purified from theagarose gel and used as probes. cDNA-amplified actin
(EU529707) was the housekeeping gene control. Probeswere labeled with a32P-dCTP, using the DecaLabel™DNA labeling kit (Fermentas Life Sciences). Northernblots were scanned using a PharosFx Plus PhosphorIma-ger (Biorad).
Quantitative real-time RT PCRPCR primers for quantitative real-time PCR weredesigned with the parameters of optimum primer GCcontent of 50%, primer Tm > 55-65°C, primer length18-30 nucleotides, and an expected amplicon size of80-200 bp (see additional file 2 for primer sequences).SYBR green qPCR was performed in 96-well plates,using the Stratagene Mx3000P system and SYBR FASTqPCR Master Mix (2x) Universal (KAPA Biosystems).All qPCR reactions were run in triplicates with a no-template control to check for contaminations. PCR wasconducted under the following conditions: 3 min at95°C (enzyme activation), 40 cycles each of 3 sec at 95°C (denaturation) and 30 s at 60°C (anneal/extend).Finally, a melting curve analysis was performed from65° to 95°C in increments of 0.5°C, each lasting 5 s, toconfirm the presence of a single product and absence ofprimer-dimers. Two internal controls GAPDH (glyceral-dehyde-3-phosphate dehydrogenase, AJ010224) andHSP90 (GR406804) were used to normalize the variationsin cDNA samples [19]. Fold changes were calculated bythe 2-δδCt method [20].
Results and discussionWater stress treatmentA graph of NTR values of ICC 4958, ICC 1882, and 20RILs during the stress treatment indicates that all paren-tal lines and RILs experienced same degree of stress(Additional file 3). The dry down procedure to imposewater stress in pot experiments has been successfullyemployed in various plant systems, including chickpea[21-25].Considering that terminal drought is a major con-
straint in achieving optimal crop yields in chickpea, allexperiments were conducted at the flowering stage toidentify molecular responses of chickpea under waterstress. In many functional genomics studies on droughtresponse in chickpea, drought stress has been inducedby withdrawing water supply or by uprooting seedlingsand allowing them to wilt at room temperature [26-28].However, the physiologic and molecular responses tothese treatments are likely to be different from thoseexperienced by the plant during natural terminaldrought conditions, wherein drought stress is gradualand allows the plant to go through various stages ofadaptation. Another major limitation of all these studiesis the variation in the quantum of stress experienced bydifferent plants. Depending on their genotype as well as
Deokar et al. BMC Plant Biology 2011, 11:70http://www.biomedcentral.com/1471-2229/11/70
Page 5 of 20
environmental and experimental conditions, plantsexperience varying degrees of stress when water is with-drawn or they are allowed to wilt for a specified dura-tion. In our study, we sampled ICC 4958 and ICC 1882and 20 RILs at a stage when they undergo the samedegree of stress, as determined by the transpirationratio.
cDNA SSH librariesA total of 6432 clones were generated from the 8 SSHlibraries, of which 6053 ESTs were sequenced. After aquality check, 5494 high-quality ESTs were obtained(Table 1). Four SSH libraries were constructed fromresistance parent ICC 4958. In total, 2034 upregulatedand 1620 downregulated ESTs were identified: 753 upre-gulated ESTs from library AS1-1 (shoot tissue) and 1281from AR1-1 (root tissue), and 821 downregulated ESTsfrom AS2-1 (shoot tissue) and 799 from AR2-1 (root tis-sue). In addition, 2 reciprocal libraries were constructedusing root tissues of ICC 4958 and ICC 1882: therewere 503 upregulated ESTs from AB1-1 in ICC 4958and 529 uprgulated ESTs from AB2-1 in ICC 1882.Furthermore, 400 ESTs were generated from libraryBulk1-1 (constructed from the bulk of 10 extreme RILsfor HRB) and 408 from library Bulk2-1 (constructedfrom 10 extreme RILs for LRB).In chickpea, root growth, osmotic adjustment, and
stem reserve utilization are associated with drought tol-erance. Root traits such as biomass, length, density, anddepth have been proposed as drought-avoidance traitsunder terminal drought conditions [29,30]. Roots areconsidered a primary site for stress signal perception,where a signaling mechanism cascade initiates geneexpression in response to drought stress. These tran-scriptional changes can result in successful adaptations,protecting plants against environmental stress [31]. Thedifferentially expressed ESTs identified in our study pro-vide a list of gene regulated in response to terminaldrought stress in root tissue of chickpea.The SSH strategy can be used as an alternative and
complementary transcript profiling tool to the GeneChipmicroarrays, especially to identify novel genes and tran-scripts present in low abundance [32]. Thus, the SSHtechnology will have more utility in a system where gen-ome sequence information and microarray chip are notavailable for transcript profiling.In 2001, 47 ESTs up- or downregulated by water
stress were first identified in chickpea [33]. cDNAlibraries from a drought-responsive genotype in chick-pea were constructed and differentially expressed ESTswere identified using in silico approach [9,34]. SSHlibraries have been constructed from chickpea seedlingafter dehydration stress [27,35] and between root tissueof 2 chickpea cultivars [36]. Transcriptome analysis by
using SuperSAGE and high-throughput 454 sequencinghas generated 17,493 unique 26-bp tags (SAGE Uni-Tags) from roots of the drought-tolerant chickpea vari-ety ICC 588 [7]. However, absence of a referencesequence for chickpea and the short read length ofsequences (26-bp) limit the utility of this approach.
EST assemblyA total 5494 high-quality sequences (average length 505bp) were generated after removing short and low-qualitysequences. A total of 3062 unigenes (638 contigs and2424 singletons) were derived from cluster assembly andsequence alignment; each contig had 2-113 ESTs withan average length of the 527 bp. The majority of contigs(84.9%) contained 5 or fewer ESTs, whereas only 2.97%contigs were made from 20 or more ESTs (Additionalfile 4), indicating a high degree of normalization andsubtraction efficiency. All EST sequences have beendeposited in the dbEST division of GenBank(HO062174-HO068058). The unigene (UG) set devel-oped in this study is henceforth referred to as UG-TDS(unigenes responsive to terminal drought stress). CAP3assembly analysis of our datasets with all chickpea ESTsequences (34,587) deposited in NCBI dbESTs identified1576 unigenes (51.4% of total unigenes) as singlets andare new entries to the chickpea database.ESTs from forward and reverse libraries were aligned
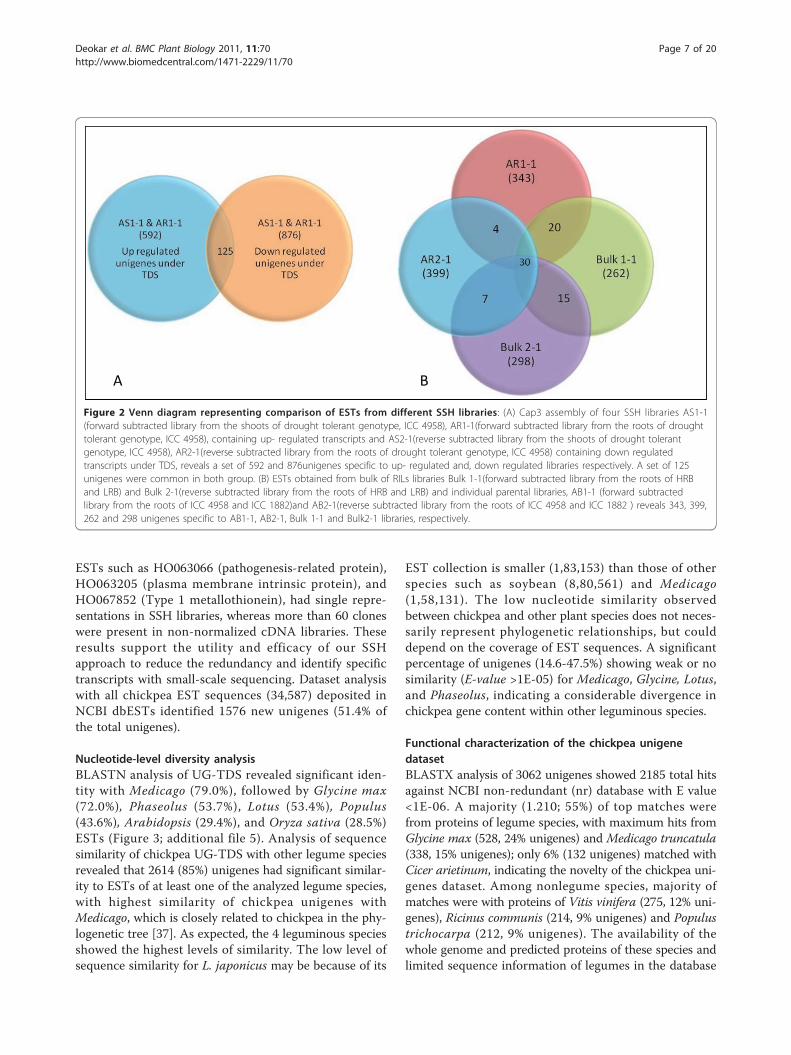
to identify unique ESTs, which were up- or downregu-lated (in silico subtraction). There were 592 unigenesspecific to forward-subtracted libraries and 876 unigenesto reverse-subtracted libraries. Although 125 assembliescontained ESTs from both forward and reverse libraries,this indicates very low level of redundancy between bothlibraries (Figure 2). ESTs identified in bulk libraries andfrom individual parent libraries were also aligned usingCAP3 assembly, assuming that the high number of ESTsfrom the HRB-contributing parent ICC 4958 and bulksof RILs of the extreme HRB phenotype would form acluster. Surprisingly, only 20 ESTs were commonbetween ICC 4958 ESTs and bulks of RILs exhibitingHRB. Similarly, only 7 ESTs were common for ICC1882-specific transcripts (the LRB-contributing parent inthe mapping population) and the transcripts from bulksof RILs exhibiting extremes of LRB phenotype.To determine the efficiency of normalization and sub-
traction of SSH libraries, we compared our ESTs withthose generated by using non-normalized cDNAlibraries. We have previously reported more than 20,000chickpea root ESTs in response to drought and saltstress in ICC 4958 by using the same procedure toobtain tissue samples for constructing the libraries [9].CAP3 assembly and clustering analysis of ESTs identi-fied 126 contigs with 1 EST from our SSH libraries andmore than 5 ESTs from non-normalized libraries. Some
Deokar et al. BMC Plant Biology 2011, 11:70http://www.biomedcentral.com/1471-2229/11/70
Page 6 of 20
ESTs such as HO063066 (pathogenesis-related protein),HO063205 (plasma membrane intrinsic protein), andHO067852 (Type 1 metallothionein), had single repre-sentations in SSH libraries, whereas more than 60 cloneswere present in non-normalized cDNA libraries. Theseresults support the utility and efficacy of our SSHapproach to reduce the redundancy and identify specifictranscripts with small-scale sequencing. Dataset analysiswith all chickpea EST sequences (34,587) deposited inNCBI dbESTs identified 1576 new unigenes (51.4% ofthe total unigenes).
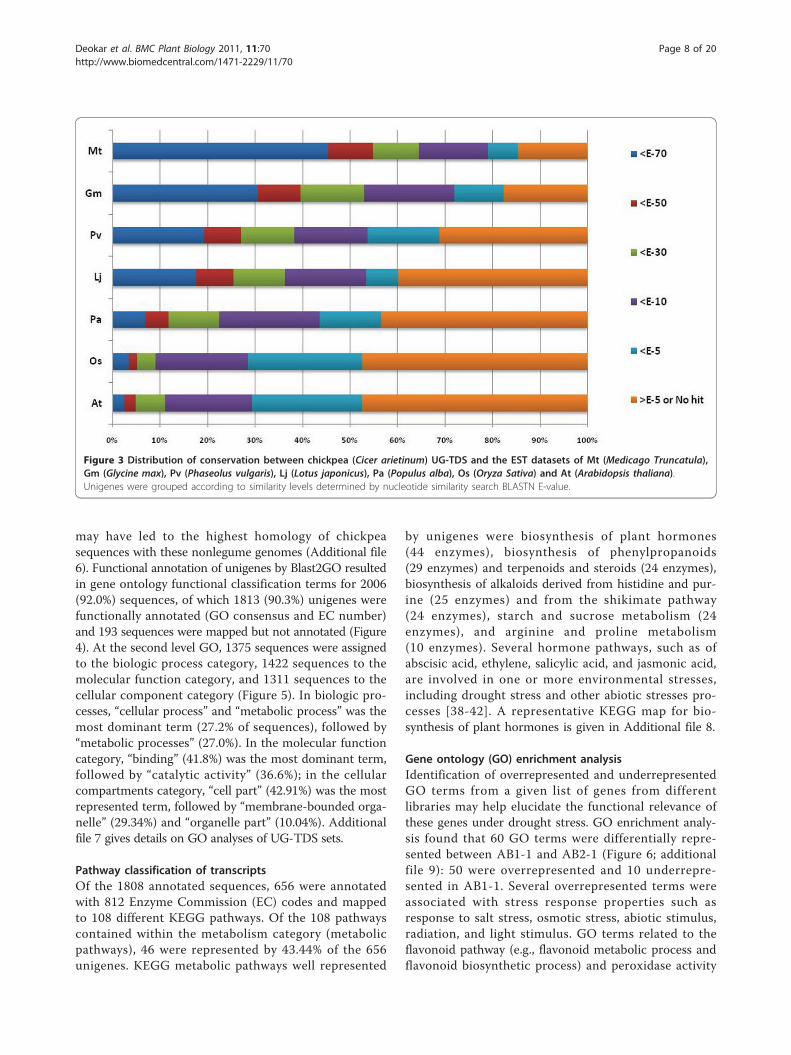
Nucleotide-level diversity analysisBLASTN analysis of UG-TDS revealed significant iden-tity with Medicago (79.0%), followed by Glycine max(72.0%), Phaseolus (53.7%), Lotus (53.4%), Populus(43.6%), Arabidopsis (29.4%), and Oryza sativa (28.5%)ESTs (Figure 3; additional file 5). Analysis of sequencesimilarity of chickpea UG-TDS with other legume speciesrevealed that 2614 (85%) unigenes had significant similar-ity to ESTs of at least one of the analyzed legume species,with highest similarity of chickpea unigenes withMedicago, which is closely related to chickpea in the phy-logenetic tree [37]. As expected, the 4 leguminous speciesshowed the highest levels of similarity. The low level ofsequence similarity for L. japonicus may be because of its
EST collection is smaller (1,83,153) than those of otherspecies such as soybean (8,80,561) and Medicago(1,58,131). The low nucleotide similarity observedbetween chickpea and other plant species does not neces-sarily represent phylogenetic relationships, but coulddepend on the coverage of EST sequences. A significantpercentage of unigenes (14.6-47.5%) showing weak or nosimilarity (E-value >1E-05) for Medicago, Glycine, Lotus,and Phaseolus, indicating a considerable divergence inchickpea gene content within other leguminous species.
Functional characterization of the chickpea unigenedatasetBLASTX analysis of 3062 unigenes showed 2185 total hitsagainst NCBI non-redundant (nr) database with E value<1E-06. A majority (1.210; 55%) of top matches werefrom proteins of legume species, with maximum hits fromGlycine max (528, 24% unigenes) and Medicago truncatula(338, 15% unigenes); only 6% (132 unigenes) matched withCicer arietinum, indicating the novelty of the chickpea uni-genes dataset. Among nonlegume species, majority ofmatches were with proteins of Vitis vinifera (275, 12% uni-genes), Ricinus communis (214, 9% unigenes) and Populustrichocarpa (212, 9% unigenes). The availability of thewhole genome and predicted proteins of these species andlimited sequence information of legumes in the database
Figure 2 Venn diagram representing comparison of ESTs from different SSH libraries: (A) Cap3 assembly of four SSH libraries AS1-1(forward subtracted library from the shoots of drought tolerant genotype, ICC 4958), AR1-1(forward subtracted library from the roots of droughttolerant genotype, ICC 4958), containing up- regulated transcripts and AS2-1(reverse subtracted library from the shoots of drought tolerantgenotype, ICC 4958), AR2-1(reverse subtracted library from the roots of drought tolerant genotype, ICC 4958) containing down regulatedtranscripts under TDS, reveals a set of 592 and 876unigenes specific to up- regulated and, down regulated libraries respectively. A set of 125unigenes were common in both group. (B) ESTs obtained from bulk of RILs libraries Bulk 1-1(forward subtracted library from the roots of HRBand LRB) and Bulk 2-1(reverse subtracted library from the roots of HRB and LRB) and individual parental libraries, AB1-1 (forward subtractedlibrary from the roots of ICC 4958 and ICC 1882)and AB2-1(reverse subtracted library from the roots of ICC 4958 and ICC 1882 ) reveals 343, 399,262 and 298 unigenes specific to AB1-1, AB2-1, Bulk 1-1 and Bulk2-1 libraries, respectively.
Deokar et al. BMC Plant Biology 2011, 11:70http://www.biomedcentral.com/1471-2229/11/70
Page 7 of 20
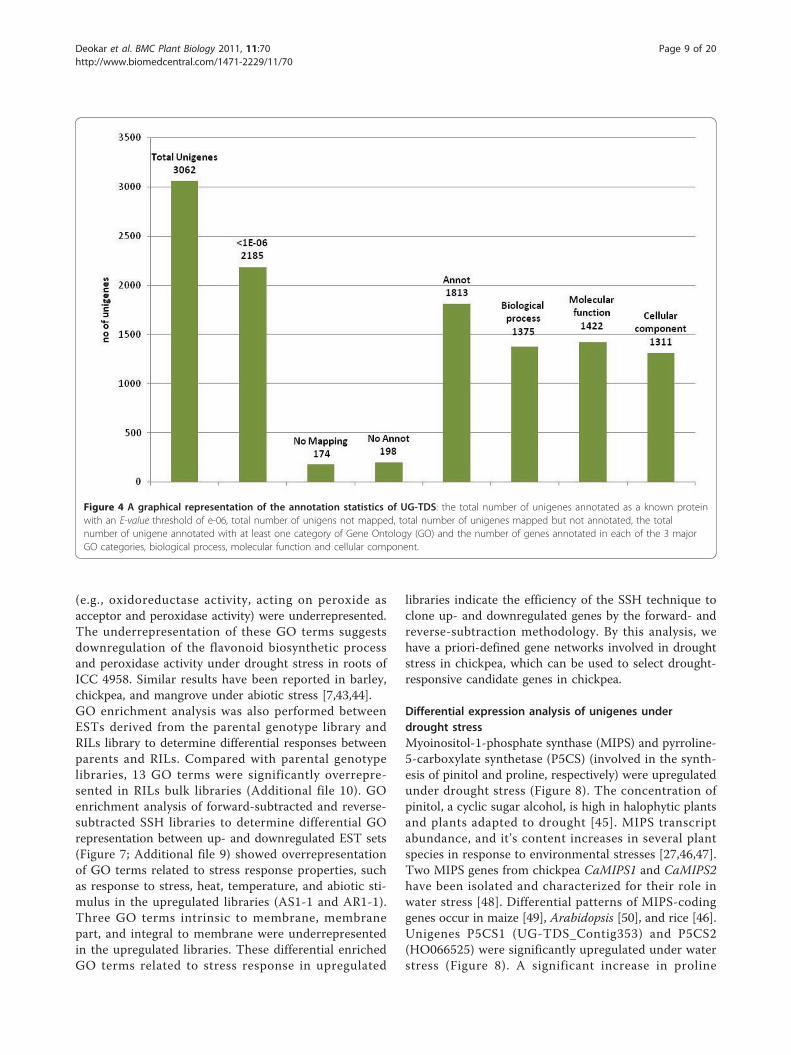
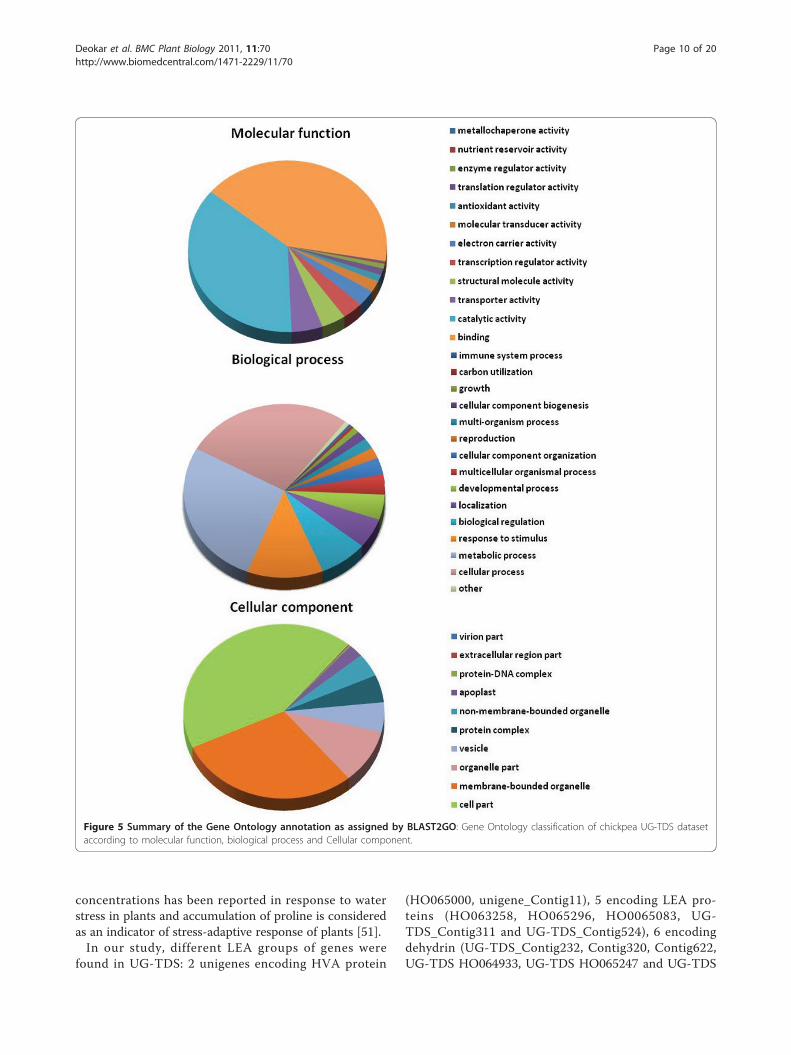
may have led to the highest homology of chickpeasequences with these nonlegume genomes (Additional file6). Functional annotation of unigenes by Blast2GO resultedin gene ontology functional classification terms for 2006(92.0%) sequences, of which 1813 (90.3%) unigenes werefunctionally annotated (GO consensus and EC number)and 193 sequences were mapped but not annotated (Figure4). At the second level GO, 1375 sequences were assignedto the biologic process category, 1422 sequences to themolecular function category, and 1311 sequences to thecellular component category (Figure 5). In biologic pro-cesses, “cellular process” and “metabolic process” was themost dominant term (27.2% of sequences), followed by“metabolic processes” (27.0%). In the molecular functioncategory, “binding” (41.8%) was the most dominant term,followed by “catalytic activity” (36.6%); in the cellularcompartments category, “cell part” (42.91%) was the mostrepresented term, followed by “membrane-bounded orga-nelle” (29.34%) and “organelle part” (10.04%). Additionalfile 7 gives details on GO analyses of UG-TDS sets.
Pathway classification of transcriptsOf the 1808 annotated sequences, 656 were annotatedwith 812 Enzyme Commission (EC) codes and mappedto 108 different KEGG pathways. Of the 108 pathwayscontained within the metabolism category (metabolicpathways), 46 were represented by 43.44% of the 656unigenes. KEGG metabolic pathways well represented
by unigenes were biosynthesis of plant hormones(44 enzymes), biosynthesis of phenylpropanoids(29 enzymes) and terpenoids and steroids (24 enzymes),biosynthesis of alkaloids derived from histidine and pur-ine (25 enzymes) and from the shikimate pathway(24 enzymes), starch and sucrose metabolism (24enzymes), and arginine and proline metabolism(10 enzymes). Several hormone pathways, such as ofabscisic acid, ethylene, salicylic acid, and jasmonic acid,are involved in one or more environmental stresses,including drought stress and other abiotic stresses pro-cesses [38-42]. A representative KEGG map for bio-synthesis of plant hormones is given in Additional file 8.
Gene ontology (GO) enrichment analysisIdentification of overrepresented and underrepresentedGO terms from a given list of genes from differentlibraries may help elucidate the functional relevance ofthese genes under drought stress. GO enrichment analy-sis found that 60 GO terms were differentially repre-sented between AB1-1 and AB2-1 (Figure 6; additionalfile 9): 50 were overrepresented and 10 underrepre-sented in AB1-1. Several overrepresented terms wereassociated with stress response properties such asresponse to salt stress, osmotic stress, abiotic stimulus,radiation, and light stimulus. GO terms related to theflavonoid pathway (e.g., flavonoid metabolic process andflavonoid biosynthetic process) and peroxidase activity
Figure 3 Distribution of conservation between chickpea (Cicer arietinum) UG-TDS and the EST datasets of Mt (Medicago Truncatula),Gm (Glycine max), Pv (Phaseolus vulgaris), Lj (Lotus japonicus), Pa (Populus alba), Os (Oryza Sativa) and At (Arabidopsis thaliana).Unigenes were grouped according to similarity levels determined by nucleotide similarity search BLASTN E-value.
Deokar et al. BMC Plant Biology 2011, 11:70http://www.biomedcentral.com/1471-2229/11/70
Page 8 of 20
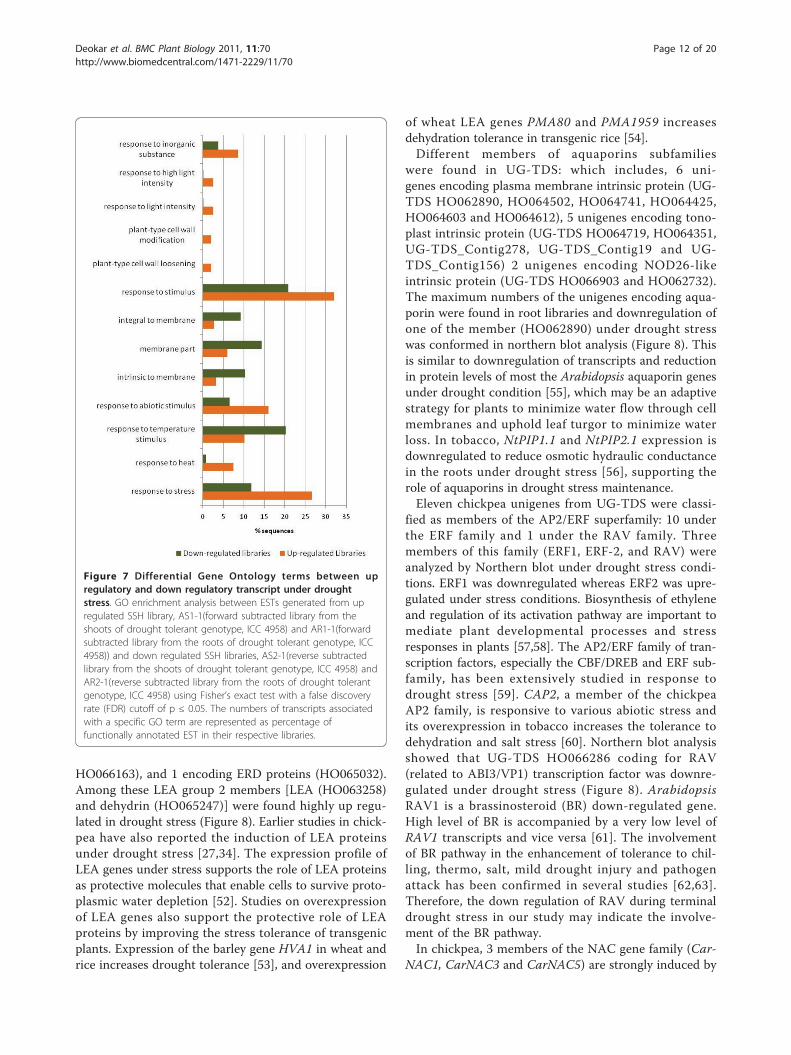
(e.g., oxidoreductase activity, acting on peroxide asacceptor and peroxidase activity) were underrepresented.The underrepresentation of these GO terms suggestsdownregulation of the flavonoid biosynthetic processand peroxidase activity under drought stress in roots ofICC 4958. Similar results have been reported in barley,chickpea, and mangrove under abiotic stress [7,43,44].GO enrichment analysis was also performed betweenESTs derived from the parental genotype library andRILs library to determine differential responses betweenparents and RILs. Compared with parental genotypelibraries, 13 GO terms were significantly overrepre-sented in RILs bulk libraries (Additional file 10). GOenrichment analysis of forward-subtracted and reverse-subtracted SSH libraries to determine differential GOrepresentation between up- and downregulated EST sets(Figure 7; Additional file 9) showed overrepresentationof GO terms related to stress response properties, suchas response to stress, heat, temperature, and abiotic sti-mulus in the upregulated libraries (AS1-1 and AR1-1).Three GO terms intrinsic to membrane, membranepart, and integral to membrane were underrepresentedin the upregulated libraries. These differential enrichedGO terms related to stress response in upregulated
libraries indicate the efficiency of the SSH technique toclone up- and downregulated genes by the forward- andreverse-subtraction methodology. By this analysis, wehave a priori-defined gene networks involved in droughtstress in chickpea, which can be used to select drought-responsive candidate genes in chickpea.
Differential expression analysis of unigenes underdrought stressMyoinositol-1-phosphate synthase (MIPS) and pyrroline-5-carboxylate synthetase (P5CS) (involved in the synth-esis of pinitol and proline, respectively) were upregulatedunder drought stress (Figure 8). The concentration ofpinitol, a cyclic sugar alcohol, is high in halophytic plantsand plants adapted to drought [45]. MIPS transcriptabundance, and it’s content increases in several plantspecies in response to environmental stresses [27,46,47].Two MIPS genes from chickpea CaMIPS1 and CaMIPS2have been isolated and characterized for their role inwater stress [48]. Differential patterns of MIPS-codinggenes occur in maize [49], Arabidopsis [50], and rice [46].Unigenes P5CS1 (UG-TDS_Contig353) and P5CS2(HO066525) were significantly upregulated under waterstress (Figure 8). A significant increase in proline
Figure 4 A graphical representation of the annotation statistics of UG-TDS: the total number of unigenes annotated as a known proteinwith an E-value threshold of e-06, total number of unigens not mapped, total number of unigenes mapped but not annotated, the totalnumber of unigene annotated with at least one category of Gene Ontology (GO) and the number of genes annotated in each of the 3 majorGO categories, biological process, molecular function and cellular component.
Deokar et al. BMC Plant Biology 2011, 11:70http://www.biomedcentral.com/1471-2229/11/70
Page 9 of 20
concentrations has been reported in response to waterstress in plants and accumulation of proline is consideredas an indicator of stress-adaptive response of plants [51].In our study, different LEA groups of genes were
found in UG-TDS: 2 unigenes encoding HVA protein
(HO065000, unigene_Contig11), 5 encoding LEA pro-teins (HO063258, HO065296, HO0065083, UG-TDS_Contig311 and UG-TDS_Contig524), 6 encodingdehydrin (UG-TDS_Contig232, Contig320, Contig622,UG-TDS HO064933, UG-TDS HO065247 and UG-TDS
Figure 5 Summary of the Gene Ontology annotation as assigned by BLAST2GO: Gene Ontology classification of chickpea UG-TDS datasetaccording to molecular function, biological process and Cellular component.
Deokar et al. BMC Plant Biology 2011, 11:70http://www.biomedcentral.com/1471-2229/11/70
Page 10 of 20
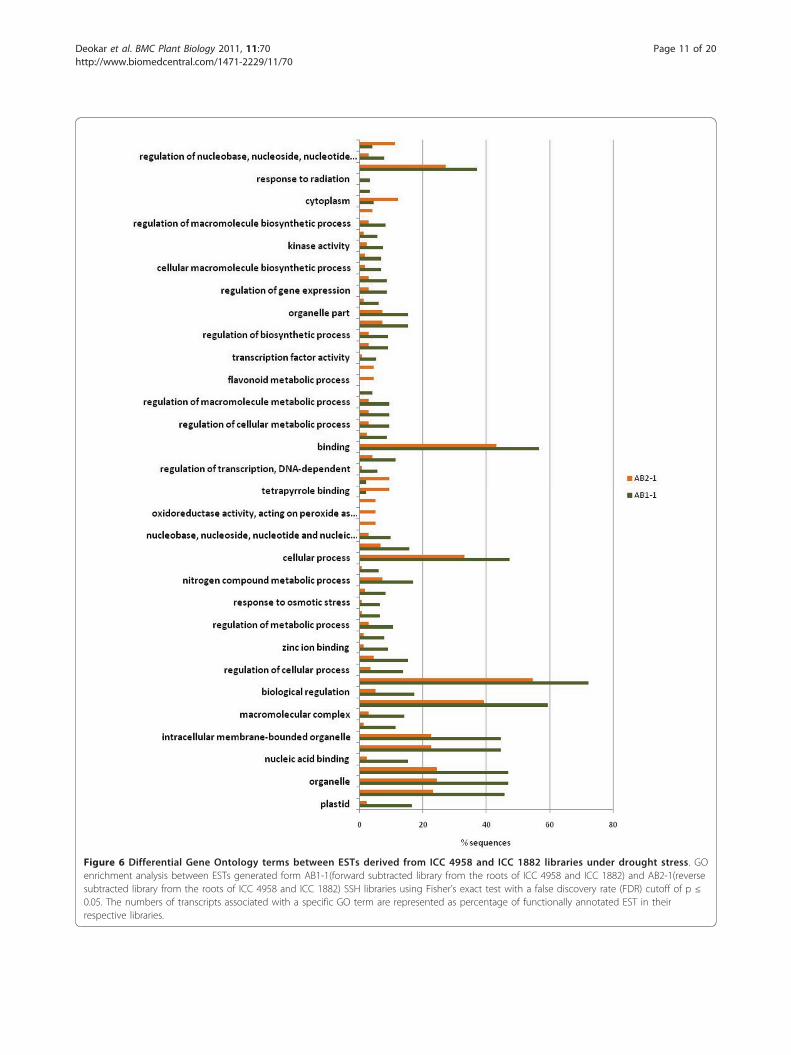
Figure 6 Differential Gene Ontology terms between ESTs derived from ICC 4958 and ICC 1882 libraries under drought stress. GOenrichment analysis between ESTs generated form AB1-1(forward subtracted library from the roots of ICC 4958 and ICC 1882) and AB2-1(reversesubtracted library from the roots of ICC 4958 and ICC 1882) SSH libraries using Fisher’s exact test with a false discovery rate (FDR) cutoff of p ≤
0.05. The numbers of transcripts associated with a specific GO term are represented as percentage of functionally annotated EST in theirrespective libraries.
Deokar et al. BMC Plant Biology 2011, 11:70http://www.biomedcentral.com/1471-2229/11/70
Page 11 of 20
HO066163), and 1 encoding ERD proteins (HO065032).Among these LEA group 2 members [LEA (HO063258)and dehydrin (HO065247)] were found highly up regu-lated in drought stress (Figure 8). Earlier studies in chick-pea have also reported the induction of LEA proteinsunder drought stress [27,34]. The expression profile ofLEA genes under stress supports the role of LEA proteinsas protective molecules that enable cells to survive proto-plasmic water depletion [52]. Studies on overexpressionof LEA genes also support the protective role of LEAproteins by improving the stress tolerance of transgenicplants. Expression of the barley gene HVA1 in wheat andrice increases drought tolerance [53], and overexpression
of wheat LEA genes PMA80 and PMA1959 increasesdehydration tolerance in transgenic rice [54].Different members of aquaporins subfamilies
were found in UG-TDS: which includes, 6 uni-genes encoding plasma membrane intrinsic protein (UG-TDS HO062890, HO064502, HO064741, HO064425,HO064603 and HO064612), 5 unigenes encoding tono-plast intrinsic protein (UG-TDS HO064719, HO064351,UG-TDS_Contig278, UG-TDS_Contig19 and UG-TDS_Contig156) 2 unigenes encoding NOD26-likeintrinsic protein (UG-TDS HO066903 and HO062732).The maximum numbers of the unigenes encoding aqua-porin were found in root libraries and downregulation ofone of the member (HO062890) under drought stresswas conformed in northern blot analysis (Figure 8). Thisis similar to downregulation of transcripts and reductionin protein levels of most the Arabidopsis aquaporin genesunder drought condition [55], which may be an adaptivestrategy for plants to minimize water flow through cellmembranes and uphold leaf turgor to minimize waterloss. In tobacco, NtPIP1.1 and NtPIP2.1 expression isdownregulated to reduce osmotic hydraulic conductancein the roots under drought stress [56], supporting therole of aquaporins in drought stress maintenance.Eleven chickpea unigenes from UG-TDS were classi-
fied as members of the AP2/ERF superfamily: 10 underthe ERF family and 1 under the RAV family. Threemembers of this family (ERF1, ERF-2, and RAV) wereanalyzed by Northern blot under drought stress condi-tions. ERF1 was downregulated whereas ERF2 was upre-gulated under stress conditions. Biosynthesis of ethyleneand regulation of its activation pathway are important tomediate plant developmental processes and stressresponses in plants [57,58]. The AP2/ERF family of tran-scription factors, especially the CBF/DREB and ERF sub-family, has been extensively studied in response todrought stress [59]. CAP2, a member of the chickpeaAP2 family, is responsive to various abiotic stress andits overexpression in tobacco increases the tolerance todehydration and salt stress [60]. Northern blot analysisshowed that UG-TDS HO066286 coding for RAV(related to ABI3/VP1) transcription factor was downre-gulated under drought stress (Figure 8). ArabidopsisRAV1 is a brassinosteroid (BR) down-regulated gene.High level of BR is accompanied by a very low level ofRAV1 transcripts and vice versa [61]. The involvementof BR pathway in the enhancement of tolerance to chil-ling, thermo, salt, mild drought injury and pathogenattack has been confirmed in several studies [62,63].Therefore, the down regulation of RAV during terminaldrought stress in our study may indicate the involve-ment of the BR pathway.In chickpea, 3 members of the NAC gene family (Car-
NAC1, CarNAC3 and CarNAC5) are strongly induced by
Figure 7 Differential Gene Ontology terms between upregulatory and down regulatory transcript under droughtstress. GO enrichment analysis between ESTs generated from upregulated SSH library, AS1-1(forward subtracted library from theshoots of drought tolerant genotype, ICC 4958) and AR1-1(forwardsubtracted library from the roots of drought tolerant genotype, ICC4958)) and down regulated SSH libraries, AS2-1(reverse subtractedlibrary from the shoots of drought tolerant genotype, ICC 4958) andAR2-1(reverse subtracted library from the roots of drought tolerantgenotype, ICC 4958) using Fisher’s exact test with a false discoveryrate (FDR) cutoff of p ≤ 0.05. The numbers of transcripts associatedwith a specific GO term are represented as percentage offunctionally annotated EST in their respective libraries.
Deokar et al. BMC Plant Biology 2011, 11:70http://www.biomedcentral.com/1471-2229/11/70
Page 12 of 20
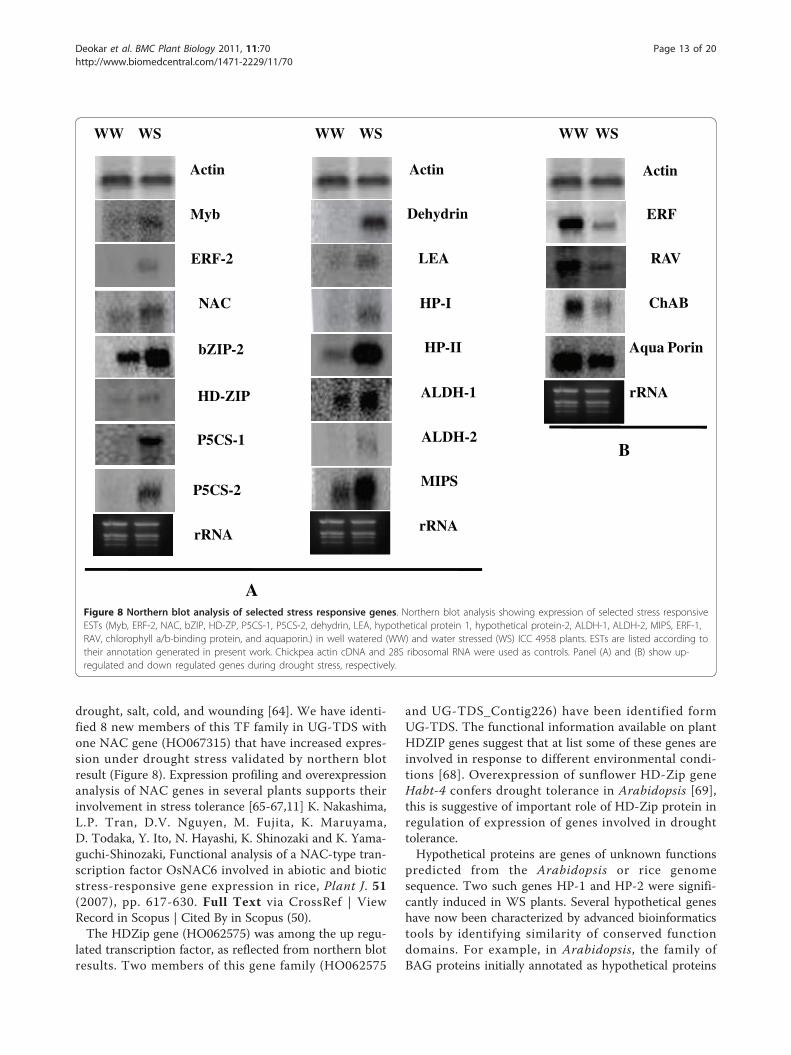
drought, salt, cold, and wounding [64]. We have identi-fied 8 new members of this TF family in UG-TDS withone NAC gene (HO067315) that have increased expres-sion under drought stress validated by northern blotresult (Figure 8). Expression profiling and overexpressionanalysis of NAC genes in several plants supports theirinvolvement in stress tolerance [65-67,11] K. Nakashima,L.P. Tran, D.V. Nguyen, M. Fujita, K. Maruyama,D. Todaka, Y. Ito, N. Hayashi, K. Shinozaki and K. Yama-guchi-Shinozaki, Functional analysis of a NAC-type tran-scription factor OsNAC6 involved in abiotic and bioticstress-responsive gene expression in rice, Plant J. 51(2007), pp. 617-630. Full Text via CrossRef | ViewRecord in Scopus | Cited By in Scopus (50).The HDZip gene (HO062575) was among the up regu-
lated transcription factor, as reflected from northern blotresults. Two members of this gene family (HO062575
and UG-TDS_Contig226) have been identified formUG-TDS. The functional information available on plantHDZIP genes suggest that at list some of these genes areinvolved in response to different environmental condi-tions [68]. Overexpression of sunflower HD-Zip geneHabt-4 confers drought tolerance in Arabidopsis [69],this is suggestive of important role of HD-Zip protein inregulation of expression of genes involved in droughttolerance.Hypothetical proteins are genes of unknown functions
predicted from the Arabidopsis or rice genomesequence. Two such genes HP-1 and HP-2 were signifi-cantly induced in WS plants. Several hypothetical geneshave now been characterized by advanced bioinformaticstools by identifying similarity of conserved functiondomains. For example, in Arabidopsis, the family ofBAG proteins initially annotated as hypothetical proteins
Actin
Myb
ERF-2
NAC
bZIP-2
HD-ZIP
LEA
Dehydrin
HP-I
HP-II
ALDH-1
Actin Actin
ChAB
Aqua Porin
ERF
RAV
WW WS WW WS WW WS
rRNA
P5CS-2
P5CS-1 ALDH-2
MIPS
A
B
rRNArRNA
Figure 8 Northern blot analysis of selected stress responsive genes. Northern blot analysis showing expression of selected stress responsiveESTs (Myb, ERF-2, NAC, bZIP, HD-ZP, P5CS-1, P5CS-2, dehydrin, LEA, hypothetical protein 1, hypothetical protein-2, ALDH-1, ALDH-2, MIPS, ERF-1,RAV, chlorophyll a/b-binding protein, and aquaporin.) in well watered (WW) and water stressed (WS) ICC 4958 plants. ESTs are listed according totheir annotation generated in present work. Chickpea actin cDNA and 28S ribosomal RNA were used as controls. Panel (A) and (B) show up-regulated and down regulated genes during drought stress, respectively.
Deokar et al. BMC Plant Biology 2011, 11:70http://www.biomedcentral.com/1471-2229/11/70
Page 13 of 20
are now annotated as bag gene family members, theirfunction as regulators of apoptosis-like processes hasalso been characterized.Functional characterization of such unknown hypothe-
tical proteins can shed light on the mechanism ofdrought adaptation in chickpea.We found transcript levels of the chlorophyll a/b-
binding protein to be downregulated during stress. Mostof the strongly downregulated transcripts were relatedto photosynthesis, photorespiration, and metabolism ofamino acids and carbohydrates. In a dehydration shocktreatment, the transcript level of chlorophyll a/b-bindingprotein remained unchanged [27]; similarly, in barley,chlorophyll a/b-binding protein transcript (NP_917525)levels do not change under dehydration shock treatmentbut are downregulated by drought stress treatment [70],indicating differential response of genes under dehydra-tion and drought stress.
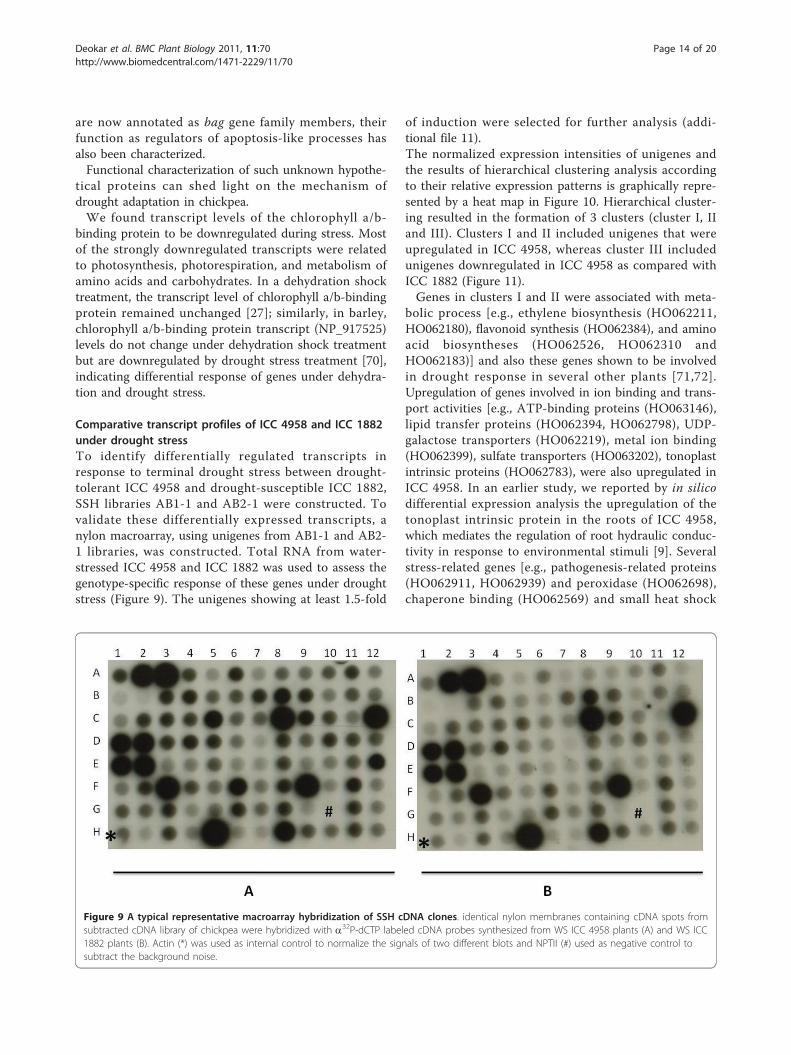
Comparative transcript profiles of ICC 4958 and ICC 1882under drought stressTo identify differentially regulated transcripts inresponse to terminal drought stress between drought-tolerant ICC 4958 and drought-susceptible ICC 1882,SSH libraries AB1-1 and AB2-1 were constructed. Tovalidate these differentially expressed transcripts, anylon macroarray, using unigenes from AB1-1 and AB2-1 libraries, was constructed. Total RNA from water-stressed ICC 4958 and ICC 1882 was used to assess thegenotype-specific response of these genes under droughtstress (Figure 9). The unigenes showing at least 1.5-fold
of induction were selected for further analysis (addi-tional file 11).The normalized expression intensities of unigenes andthe results of hierarchical clustering analysis accordingto their relative expression patterns is graphically repre-sented by a heat map in Figure 10. Hierarchical cluster-ing resulted in the formation of 3 clusters (cluster I, IIand III). Clusters I and II included unigenes that wereupregulated in ICC 4958, whereas cluster III includedunigenes downregulated in ICC 4958 as compared withICC 1882 (Figure 11).Genes in clusters I and II were associated with meta-
bolic process [e.g., ethylene biosynthesis (HO062211,HO062180), flavonoid synthesis (HO062384), and aminoacid biosyntheses (HO062526, HO062310 andHO062183)] and also these genes shown to be involvedin drought response in several other plants [71,72].Upregulation of genes involved in ion binding and trans-port activities [e.g., ATP-binding proteins (HO063146),lipid transfer proteins (HO062394, HO062798), UDP-galactose transporters (HO062219), metal ion binding(HO062399), sulfate transporters (HO063202), tonoplastintrinsic proteins (HO062783), were also upregulated inICC 4958. In an earlier study, we reported by in silicodifferential expression analysis the upregulation of thetonoplast intrinsic protein in the roots of ICC 4958,which mediates the regulation of root hydraulic conduc-tivity in response to environmental stimuli [9]. Severalstress-related genes [e.g., pathogenesis-related proteins(HO062911, HO062939) and peroxidase (HO062698),chaperone binding (HO062569) and small heat shock
Figure 9 A typical representative macroarray hybridization of SSH cDNA clones. identical nylon membranes containing cDNA spots fromsubtracted cDNA library of chickpea were hybridized with a32P-dCTP labeled cDNA probes synthesized from WS ICC 4958 plants (A) and WS ICC1882 plants (B). Actin (*) was used as internal control to normalize the signals of two different blots and NPTII (#) used as negative control tosubtract the background noise.
Deokar et al. BMC Plant Biology 2011, 11:70http://www.biomedcentral.com/1471-2229/11/70
Page 14 of 20
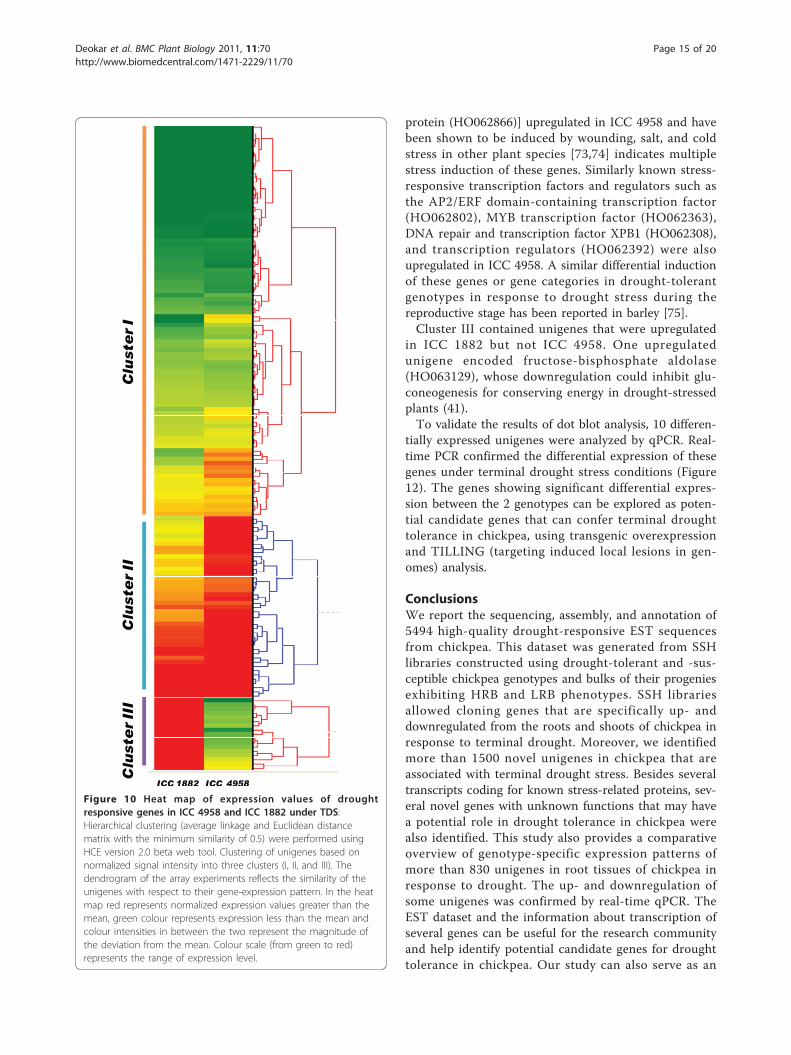
protein (HO062866)] upregulated in ICC 4958 and havebeen shown to be induced by wounding, salt, and coldstress in other plant species [73,74] indicates multiplestress induction of these genes. Similarly known stress-responsive transcription factors and regulators such asthe AP2/ERF domain-containing transcription factor(HO062802), MYB transcription factor (HO062363),DNA repair and transcription factor XPB1 (HO062308),and transcription regulators (HO062392) were alsoupregulated in ICC 4958. A similar differential inductionof these genes or gene categories in drought-tolerantgenotypes in response to drought stress during thereproductive stage has been reported in barley [75].Cluster III contained unigenes that were upregulated
in ICC 1882 but not ICC 4958. One upregulatedunigene encoded fructose-bisphosphate aldolase(HO063129), whose downregulation could inhibit glu-coneogenesis for conserving energy in drought-stressedplants (41).To validate the results of dot blot analysis, 10 differen-
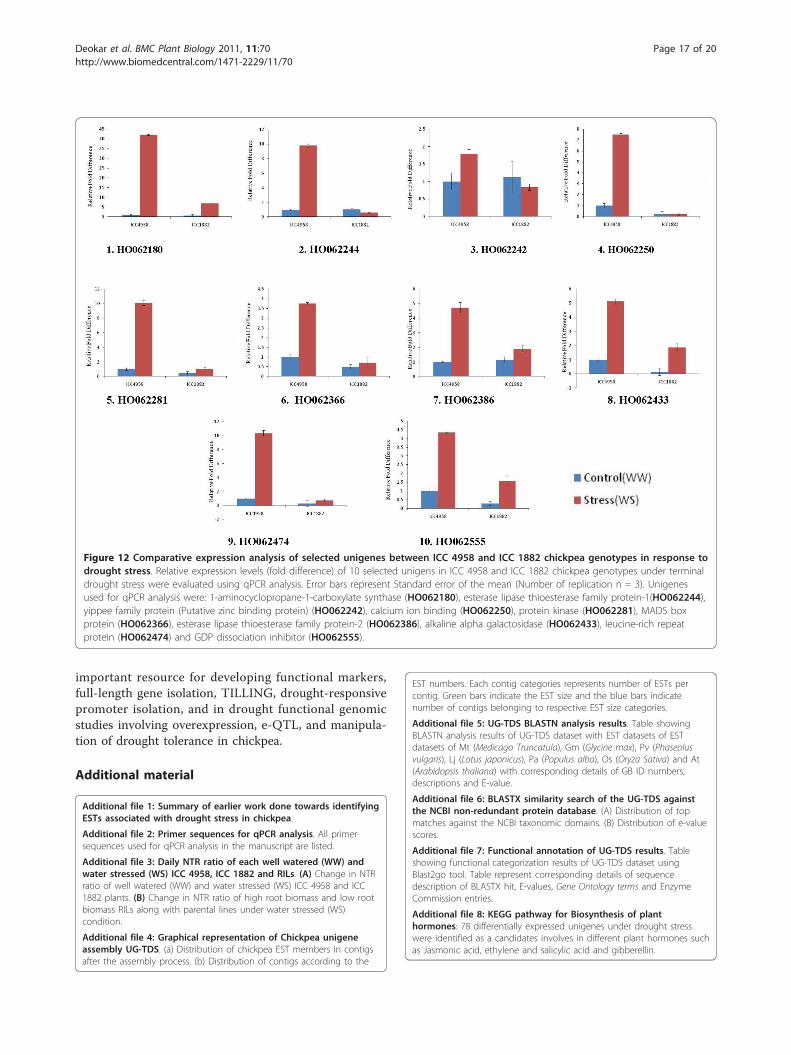
tially expressed unigenes were analyzed by qPCR. Real-time PCR confirmed the differential expression of thesegenes under terminal drought stress conditions (Figure12). The genes showing significant differential expres-sion between the 2 genotypes can be explored as poten-tial candidate genes that can confer terminal droughttolerance in chickpea, using transgenic overexpressionand TILLING (targeting induced local lesions in gen-omes) analysis.
ConclusionsWe report the sequencing, assembly, and annotation of5494 high-quality drought-responsive EST sequencesfrom chickpea. This dataset was generated from SSHlibraries constructed using drought-tolerant and -sus-ceptible chickpea genotypes and bulks of their progeniesexhibiting HRB and LRB phenotypes. SSH librariesallowed cloning genes that are specifically up- anddownregulated from the roots and shoots of chickpea inresponse to terminal drought. Moreover, we identifiedmore than 1500 novel unigenes in chickpea that areassociated with terminal drought stress. Besides severaltranscripts coding for known stress-related proteins, sev-eral novel genes with unknown functions that may havea potential role in drought tolerance in chickpea werealso identified. This study also provides a comparativeoverview of genotype-specific expression patterns ofmore than 830 unigenes in root tissues of chickpea inresponse to drought. The up- and downregulation ofsome unigenes was confirmed by real-time qPCR. TheEST dataset and the information about transcription ofseveral genes can be useful for the research communityand help identify potential candidate genes for droughttolerance in chickpea. Our study can also serve as an
Figure 10 Heat map of expression values of droughtresponsive genes in ICC 4958 and ICC 1882 under TDS:Hierarchical clustering (average linkage and Euclidean distancematrix with the minimum similarity of 0.5) were performed usingHCE version 2.0 beta web tool. Clustering of unigenes based onnormalized signal intensity into three clusters (I, II, and III). Thedendrogram of the array experiments reflects the similarity of theunigenes with respect to their gene-expression pattern. In the heatmap red represents normalized expression values greater than themean, green colour represents expression less than the mean andcolour intensities in between the two represent the magnitude ofthe deviation from the mean. Colour scale (from green to red)represents the range of expression level.
Deokar et al. BMC Plant Biology 2011, 11:70http://www.biomedcentral.com/1471-2229/11/70
Page 15 of 20
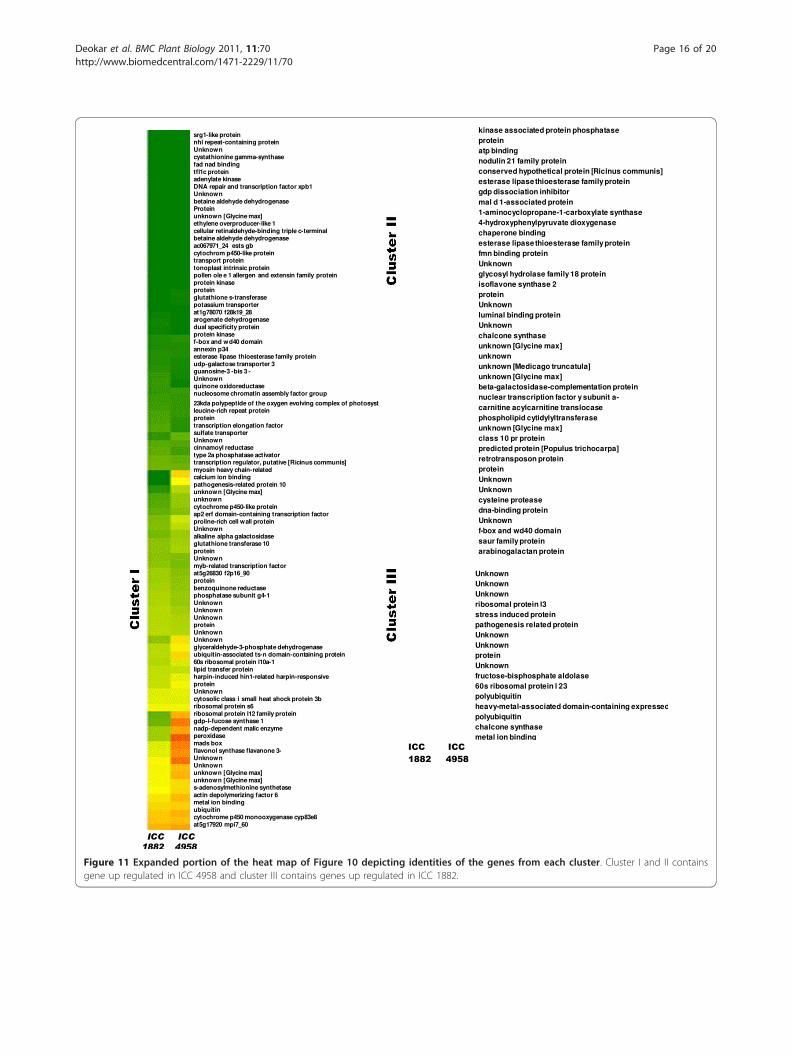
Figure 11 Expanded portion of the heat map of Figure 10 depicting identities of the genes from each cluster. Cluster I and II containsgene up regulated in ICC 4958 and cluster III contains genes up regulated in ICC 1882.
Deokar et al. BMC Plant Biology 2011, 11:70http://www.biomedcentral.com/1471-2229/11/70
Page 16 of 20
important resource for developing functional markers,full-length gene isolation, TILLING, drought-responsivepromoter isolation, and in drought functional genomicstudies involving overexpression, e-QTL, and manipula-tion of drought tolerance in chickpea.
Additional material
Additional file 1: Summary of earlier work done towards identifyingESTs associated with drought stress in chickpea.
Additional file 2: Primer sequences for qPCR analysis. All primersequences used for qPCR analysis in the manuscript are listed.
Additional file 3: Daily NTR ratio of each well watered (WW) andwater stressed (WS) ICC 4958, ICC 1882 and RILs. (A) Change in NTRratio of well watered (WW) and water stressed (WS) ICC 4958 and ICC1882 plants. (B) Change in NTR ratio of high root biomass and low rootbiomass RILs along with parental lines under water stressed (WS)condition.
Additional file 4: Graphical representation of Chickpea unigeneassembly UG-TDS. (a) Distribution of chickpea EST members in contigsafter the assembly process. (b) Distribution of contigs according to the
EST numbers. Each contig categories represents number of ESTs percontig. Green bars indicate the EST size and the blue bars indicatenumber of contigs belonging to respective EST size categories.
Additional file 5: UG-TDS BLASTN analysis results. Table showingBLASTN analysis results of UG-TDS dataset with EST datasets of ESTdatasets of Mt (Medicago Truncatula), Gm (Glycine max), Pv (Phaseolusvulgaris), Lj (Lotus japonicus), Pa (Populus alba), Os (Oryza Sativa) and At(Arabidopsis thaliana) with corresponding details of GB ID numbers,descriptions and E-value.
Additional file 6: BLASTX similarity search of the UG-TDS againstthe NCBI non-redundant protein database. (A) Distribution of topmatches against the NCBI taxonomic domains. (B) Distribution of e-valuescores.
Additional file 7: Functional annotation of UG-TDS results. Tableshowing functional categorization results of UG-TDS dataset usingBlast2go tool. Table represent corresponding details of sequencedescription of BLASTX hit, E-values, Gene Ontology terms and EnzymeCommission entries.
Additional file 8: KEGG pathway for Biosynthesis of planthormones: 78 differentially expressed unigenes under drought stresswere identified as a candidates involves in different plant hormones suchas Jasmonic acid, ethylene and salicylic acid and gibberellin.
Figure 12 Comparative expression analysis of selected unigenes between ICC 4958 and ICC 1882 chickpea genotypes in response todrought stress. Relative expression levels (fold difference) of 10 selected unigens in ICC 4958 and ICC 1882 chickpea genotypes under terminaldrought stress were evaluated using qPCR analysis. Error bars represent Standard error of the mean (Number of replication n = 3). Unigenesused for qPCR analysis were: 1-aminocyclopropane-1-carboxylate synthase (HO062180), esterase lipase thioesterase family protein-1(HO062244),yippee family protein (Putative zinc binding protein) (HO062242), calcium ion binding (HO062250), protein kinase (HO062281), MADS boxprotein (HO062366), esterase lipase thioesterase family protein-2 (HO062386), alkaline alpha galactosidase (HO062433), leucine-rich repeatprotein (HO062474) and GDP dissociation inhibitor (HO062555).
Deokar et al. BMC Plant Biology 2011, 11:70http://www.biomedcentral.com/1471-2229/11/70
Page 17 of 20
Additional file 9: GO enrichment analysis using GOSSIP module ofBLAST2GO program. Table S1: Results of GO enrichment analysis doneusing transcripts generated from AB1-1 library as test set and AB2-1 asreference set with the FDR filter value 0.05. The 60 GO terms weredifferentially represented in these two libraries. Out of then 50 were overrepresented and 10 were under represented. Table S2: Results of GOenrichment analysis done using transcripts generated from bulks of RILsas test set and SSH unigenes from individual parental libraries asreference set with the FDR filter value 0.05. The 13 GO terms were overrepresented in libraries from bulk of RILs. Table S3: Results of GOenrichment analysis done using transcripts generated from up regulatedlibraries (AS1-1 and AR1-1) as test set and unigenes from downregulatory libraries (AS2-1 and AR2-1) as reference set with the FDR filtervalue 0.05. The 10 Go terms were overrepresented in up regulatedlibraries and three GO terms were under represented.
Additional file 10: Differential Gene Ontology terms betweenparental line (ICC 4958 & ICC 1882) and bulks of RILs underdrought stress. GO enrichment analysis between ESTs generated fromparental line (From AS and AR libraries) and ESTs form bulks of RILs usingFisher’s exact test with a false discovery rate (FDR) cutoff of p ≤ 0.05. Thenumbers of transcripts associated with a specific GO term arerepresented as percentage of functionally annotated EST in theirrespective libraries
Additional file 11: Genotype specific response of chickpea unigenesin response to terminal drought stress. Expression profiling ofdifferentially expressed ESTs generated by SSH libraries were analysed indrought stressed ICC 4958 and ICC 1882 using dot-blot expressionanalysis. Differential responses of unigenes are represented in normalisedsignal intensities values. Standard deviations are calculated from threedifferent experiments. Signal intensity of Actin (GenBank: EU529707) usedfor normalisation of the signals between the blots and NPTII was usedfor signal background correction. Unigenes are listed according to theirannotation generated in present work.
AcknowledgementsWe gratefully acknowledge the “National Fund for Basic, Strategic andFrontier Application Research in Agriculture (NFBSFARA), Indian Council ofAgricultural Research (ICAR), New Delhi, India, for financial support. Authorsare thankful to Dr. Pooran Gaur of ICRISAT for sharing the parental genotypesand mapping population used in the study. Thanks are also due to P Lekhaand Pavana Hiremath for their help in planning of some experiments anddiscussions. We are grateful to Dr Vani Shankar for editing the manuscript.
Author details1National Research Center on Plant Biotechnology, IARI Campus, New Delhi110012, India. 2School of Life Sciences, S.R.T.M. University, “Dnyanteerth”,Vishnupuri, Nanded - 431 606, India. 3International Crops Research Institutefor the Semi-Arid Tropics (ICRISAT), Patancheru, Greater Hyderabad 502 324,AP, India. 4Genomics towards Gene Discovery Sub Programme, GenerationChallenge Programme (GCP) c/o CIMMYT, Int. Apartado Postal 6-641, 06600,Mexico, DF Mexico.
Authors’ contributionsRS, RV, PKJ, SMK and AAD planned the experiments. VV, AAD and VK wereinvolved in setting up drought experiments and isolation of RNA. AAD, VKwere involved in cloning and sequencing of cDNA SSH libraries, dot blot,northern blot and real time PCR experiments. AAD, NLR and RV wereinvolved in bioinformatics analysis. AAD, RS and RV analyzed theexperiments. AAD and RS prepared the manuscript. All authors read andapproved the final manuscript.
Received: 22 December 2010 Accepted: 22 April 2011Published: 22 April 2011
References1. Kumar J, Abbo S: Genetics of flowering time in chickpea and its bearing
on productivity in semiarid environments. Adv Agron 2001, 72:107-138.
2. Singh KB, Malhotra RS, Halila MH, Knights EJ, Verma MM: Current statusand future strategy in breeding chickpea for resistance to biotic andabiotic stresses. In Expanding the production and use of coolseason foodlegumes. Edited by: Muehlbauer FJ, Kaiser WJ. Dordrecht, The Netherlands:Kluwer Academic Publishers; 1994:572-591.
3. Croser JS, Clarke HJ, Siddique KHM, Khan TN: Low-temperature stress:implications for chickpea (Cicer arietinum L.) improvement. Crit Rev PlantSci 2003, 22:185-219.
4. Ahmad F, Gaur PM, Croser J: Chickpea (Cicer arietinum L.). In GeneticResources, Chromosome Engineering and Crop Improvement - Grain Legumes.Volume 1. Edited by: Singh R and Jauhar P. USA: CRC Press; 2005:185-214.
5. Leport L, Turner NC, French RJ, Barr MD, Duda R, Davies SL, Tennant D,Siddique KHM: Physiological responses of chickpea genotypes toterminal drought in a Mediterranean-type environment. European Journalof Agronomy 1999, 11:279-291.
6. Siddique KHM, Brinsmead RB, Knight R, Knights EJ, Paul JG, Rose IA:Adaptation of chickpea (Cicer arietinum L.) and faba bean (Vicia faba L.)to Australia. In Linking research and marketing opportunities for pulses in the21st century. Edited by: Knight R. Dordrecht, The Netherlands: Kluwer;2000:289-303.
7. Molina C, Rotter B, Horres R, Udupa SM, Besser B, Bellarmino L, Baum M,Matsumura H, Terauchi R, Kahl G: SuperSAGE: the drought stress-responsive transcriptome of chickpea roots. BMC Genomics 2008, 9:553.
8. Mantri NL, Ford R, Coram TE, Pang EC: Transcriptional profiling ofchickpea genes differentially regulated in response to high-salinity, coldand drought. BMC Genomics 2007, 8:303.
9. Varshney RK, Hiremath PJ, Lekha P, Kashiwagi J, Balaji J, Deokar AA, Vadez V,Xiao Y, Srinivasan R, Gaur PM, Siddique KH, Town CD, Hoisington DA: Acomprehensive resource of drought- and salinityresponsive ESTs forgene discovery and marker development in chickpea (Cicer arietinum L.).BMC Genomics 2009, 15(10):523.
10. Ray J, Sinclair T: : The effect of pot size on growth and transpiration ofmaize and soybean during water deficit stress. J Exp Bot 1998,49:1381-1386.
11. Kashiwagi J, Krishnamurthy L, Gaur PM, Chandra S, Upadhyaya HD:Estimation of gene effect of the drought avoidance root characteristicsin chickpea (C.arietinum L.). Field Crop Research 2007, 105:64-69.
12. EST trimming. [http://pgrc.ipk-gatersleben.de/misa/download/est_trimmer.pl].
13. Huang X, Madan A: CAP3: A DNA sequence assembly program. GenomeRes 1999, 9(9):868-877.
14. Altschul SF, Madden TL, Schaffer AA, Zhang J, Zhang Z, Miller W,Lipman DJ: Gapped BLAST and PSI-BLAST: A new generation of proteindatabase search programs. Nucl Acids Res 1997, 25:3389-3402.
15. Conesa A, Götz S, García-Gómez JM: Blast2GO: a universal tool forannotation, visualization and analysis in functional genomics research.Bioinformatics 2005, 21:3674-3676.
16. Okuda S, Yamada T, Hamajima M, Itoh M, Katayama T, Bork P, Goto S,Kanehisa M: KEGG atlas mapping for global analysis of metabolicpathways. Nucleic Acids Res 2008, 36:W423-426.
17. Blüthgen N, Brand K, Cajavec B, Swat M, Herzel H, Beule D: Biologicalprofiling of gene groups utilizing Gene Ontology. Genome Inform 2005,16:106-15.
18. Sambrook , Russell : Molecular Cloning: A Laboratory Manual. Cold SpringHarbor Laboratory Press;, 3 2001.
19. Garg R, Sahoo A, Tyagi AK, Jain M: Validation of internal control genes forquantitative gene expression studies in chickpea (Cicer arietinum L.).Biochem Biophys Res Commun 2010, 396(2):283-8.
20. Livaka KJ, Schmittgen TD: Analysis of relative gene expression data usingreal-time quantitative PCR and the 2(-Delta Delta C (T)) method. Methods2001, 25:402-408.
21. Kholová J, Hash CT, Lava Kumar P, Yadav RS, Kočová M, Vadez V: Terminaldrought-tolerant pearl millet [Pennisetum glaucum (L.) R. Br.] have highleaf ABA and limit transpiration at high vapour pressure deficit. J Exp Bot2010, 61(5):1431-1440.
22. Bhatnagar-Mathur P, Vadez V, Devi MJ, Lavanya M, Vani G, Sharma KK:Genetic engineering of chickpea (Cicer arietinum L.) with theP5CSF129A gene for osmoregulation with implications on droughttolerance. Mol Breeding 2009, 23:591-606.
23. Sinclair TR, Holbrook NM, Zwieniecki MA: Daily transpiration rates ofwoody species on drying soil. Tree Physiology 2005, 25:1469-1472.
Deokar et al. BMC Plant Biology 2011, 11:70http://www.biomedcentral.com/1471-2229/11/70
Page 18 of 20
24. Vadez V, Sinclair TR, Serraj R, Purcell LC: Manganese application alleviatesthe water deficit-induced decline of N2 fixation. Plant, Cell & Environment2000, 23:497-505.
25. Fang X, Turner NC, Yan G, Li F, Siddique KHM: Flower numbers, podproduction, pollen viability, and pistil function are reduced and flowerand pod abortion increased in chickpea (Cicer arietinum L.) underterminal drought. J Exp Bot 2010, 61(2):335-345.
26. Rabbani MA, Maruyama K, Abe H, Khan MA, Katsura K, Ito Y, Yoshiwara K,Seki M, Shinozaki K, Yamaguchi-Shinozaki K: Monitoring expression profilesof rice genes under cold, drought, and high-salinity stresses and abscisicacid application using cDNA microarray and RNA gel-blot analyses. PlantPhysiol 2003, 133:1755-1767.
27. Boominathan P, Shukla R, Kumar A, Manna D, Negi D, Verma PK,Chattopadhyay D: Long term transcript accumulation during thedevelopment of dehydration adaptation in Cicer arietinum. Plant Physiol2004, 135:1608-1620.
28. Rensink WA, Buell CR: Microarray expression profiling resources for plantgenomics. Trends in Plant Science 2005, 10:603-609.
29. Turner NC, Wright GC, Siddique KHM: Adaptation of grain legumes(pulses) to water limited environments. Advances in Agronomy 2001,71:193-231.
30. Kashiwagi J, Krishnamurthy L, Upadhyaya HD, Krishna H, Chandra S,Vadez V, Serraj R: Genetic variability of drought-avoidance root traits inthe mini-core germplasm collection of chickpea (Cicer arietinum L.).Euphytica 2005, 146:213-222.
31. Périn C, Rebouillat J, Brasileiro ACM, Diévart A, Gantet P, Breitler JC,Johnson AAT, Courtois B, Ahmadi N, de Raissac M: Novel insights into thegenomics of rice root adaptive development. In Rice Genetics V. Edited by:Brar DS, Mackill DJ, Hardy B. Singapore: World Scientific; 2007:117-141.
32. Cao W, Epstein C, Liu H, DeLoughery C, Ge N, Lin J, Diao R, Cao H, Long F,Zhang X: Comparing gene discovery from Affymetrix GeneChipmicroarrays and Clontech PCR-select cDNA subtraction: a case study.BMC Genomics 2004, 5:26.
33. Romo S, Labrador E, Dopico B: Water stress-regulated gene expression inCicer arietinum seedlings and plants. Plant Physiol Biochem 2001,39:1017-1026.
34. Gao WR, Wang XSH, Liu P, Chen Ch, Li JG, Zhang JS, Ma H: Comparativeanalysis of ESTs in response to drought stress in chickpea (Cicerarietinum L.). Biochic and Biophysic Res Commun 2008, 376:578-583.
35. Jain D, Chattopadhyay D: Analysis of gene expression in response towater deficit of chickpea (Cicer arietinum L.) varieties differing indrought tolerance. BMC Plant Biology 2010, 10:24.
36. Buhariwalla HK, Jayashree B, Eshwar K, Crouch JH: Development of ESTsfrom chickpea roots and their use in diversity analysis of the Cicergenus. BMC Plant Biology 2005, 5:16.
37. Doyle JJ, Luckow MA: The rest of the iceberg. Legume diversity andevolution in a phylogenetic context. Plant Physiol 2003, 131:900-910.
38. Kanehisa M, Araki M, Goto S, Hattori M, Hirakawa M, Itoh M, Katayama T,Kawashima S, Okuda S, Tokimatsu T, Yamanishi Y: KEGG for linkinggenomes to life and the environment. Nucleic Acids Res 2008, 36:D480-4.
39. Tanaka Y, Sano T, Tamaoki M, Nakajima N, Kondo N, Hasezawa S: Ethyleneinhibits abscisic acid-induced stomatal closure in Arabidopsis. PlantPhysiol 2005, 138:2337-2343.
40. Aprile A, Mastrangelo AM, De Leonardis AM, Galiba G, Roncaglia E, Ferrari F,Bellis LD, Turchi L, Giuliano G, Cattivelli L: Transcriptional profiling inresponse to terminal drought stress reveals differential responses alongthe wheat genome. BMC Genomics 2009, 10:279.
41. Gong P, Zhang J, Li H, Yang C, Zhang C, Zhang X, Khurram Z, Zhang Y,Wang T, Fei Z: Transcriptional profiles of drought-responsive genes inmodulating transcription signal transduction, and biochemical pathwaysin tomato. J Exp Bot 2010, 61:3563-3575.
42. Zheng J, Fu J, Gou M, Huai J, Liu Y, Jian M, Huang Q, Guo X, Dong Z,Wang H, Wang G: Genome-wide transcriptome analysis of two maizeinbred lines under drought stress. Plant Mol Biol 2010, 72(4-5):407-421.
43. Abebe T, Melmaiee K, Berg V, Wise RP: Drought response in the spikes ofbarley: gene expression in the lemma, palea, awn, and seed. Functional &Integrative Genomics 2009, 10(2):191-205.
44. Miyama M, Hanagata N: Microarray analysis of 7029 gene expressionpatterns in burma mangrove under high-salinity stress. Plant Sci 2007,172:948-957.
45. Vernon DM, Bohnert HJ: A novel methyl trans-ferase induced by osmoticstress in the facultative halophyte Mesembryanthemum crystallinum.EMBO Journal 1992, 11:2077-2085.
46. Yoshida KT, Wada T, Koyama H, Mizobuchi-Fukuoka R, Naito S: Temporaland spatial patterns of accumulation of the transcript of myo-inositol-1-phosphate synthase and phytin containing particles during seeddevelopment in rice. Plant Physiol 1999, 119:65-72.
47. Abreu EFM, Aragão FJL: Isolation and characterization of a myo-inositol-1-phosphate synthase gene from yellow passion fruit (Passiflora edulis f.flavicarpa) expressed during seed development and environmentalstress. Annals of Botany 2007, 99:285-292.
48. Kaur H, Shukla RK, Yadav G, Chattopadhyay D, Majee M: Two divergentgenes encoding L-myo-inositol 1-phosphate synthase1 (CaMIPS1) and 2(CaMIPS2) are differentially expressed in chickpea. Plant, Cell &Environment 2008, 31(11):1701-1716.
49. Larson SR, Raboy V: Linkage mapping of maize and barley myo-inositol1-phosphate synthase DNA sequences: correspondence with a lowphytic acid mutation. Theoretical and Applied Genetics 1999, 99:27-36.
50. Johnson MD, Sussex IM: 1-L-myo-inositol 1-phosphate synthase fromArabidopsis thaliana. Plant Physiol 1995, 107:613-619.
51. Delaunay AJ, Verma DPS: Proline accumulation and osmoregulation inplants. Plant J 1993, 4:215-223.
52. Ingram J, Bartels D: The molecular basis of dehydration tolerance inplants. Annu Rev Plant Physiol Plant Mol Biol 1996, 47:377-403.
53. Sivamani E, Bahieldin A, Wraith JM, Al-Niemi T, Dyer WE, Ho T-HD, Qu R:Improved biomass productivity and water use efficiency under waterdeficit conditions in transgenic wheat constitutively expressing thebarley HVA1 gene. Plant Sci 2000, 155:1-9.
54. Cheng Z, Targolli J, Huang X, Wu R: Wheat LEA genes, PMA80 and PMAenhance dehydration tolerance of transgenic rice (Oryza sativa L.). MolBreeding 1995, 10:71-82.
55. Alexandersson E, Fraysse L, Sjövall-Larsen S, Gustavsson S, Fellert M,Karlsson M, Johanson U, Kjellbom P: Whole gene family expression anddrought stress regulation of aquaporins. Plant Mol Biol 2005, 59:469-484.
56. Mahdieh M, Mostajeran A, Horie T, Katsuhara M: Drought Stress AltersWater Relations and Expression of PIP-Type Aquaporin Genes inNicotiana tabacum Plants. Plant and Cell Physiol 2008, 49(5):801-813.
57. Zhao XC, Schaller GE: Effect of salt and osmotic stress upon expression ofthe ethylene receptor ETR1 in Arabidopsis thaliana. FEBS Lett 2004,562:189-192.
58. Cao Y, Song F, Goodman RM, Zheng Z: Molecular characterization of fourrice genes encoding ethylene-responsive transcriptional factors andtheir expressions in response to biotic and abiotic stress. Journal of PlantPhysiology 2006, 163:1167-1178.
59. Agarwal PK, Agarwal P, Reddy MK, Sopory SK: Role of CBF/DREBtranscription factors in abiotic and biotic stress tolerance in plants. PlantCell Reports 2006, 25:1263-1274.
60. Shukla RK, Raha S, Tripathi V, Chattopadhyay D: Expression of CAP2, anAPETALA2-Family Transcription Factor from Chickpea, Enhances Growthand Tolerance to Dehydration and Salt Stress in Transgenic Tobacco.Plant Physiol 2006, 142:113-123.
61. Hu YX, Wang YH, Liu XF, Li JY: Arabidopsis RAV1 is down-regulated bybrassinosteroid and may act as a negative regulator during plantdevelopment. Cell Research 2004, 14:8-15.
62. Krishna P: Brassinosteroid-mediated stress responses. J Plant Growth Regul2003, 22:289-297.
63. Divi UK, Krishna P: Brassinosteroids confer stress tolerance. In Plant stressbiology: genomics goes systems biology. Edited by: Hirt H. Weinheim: Wiley-VCH; 2009:119-135.
64. Peng H, Yu X, Cheng H, Shi Q, Zhang H, Li J, Ma H: Cloning andcharacterization of a novel NAC family gene CarNAC1 from chickpea(Cicer arietinum L.). Mol Biotechnol 2010, 44(1):30-40.
65. Hegedus D, Yu M, Baldwin D, Gruber M, Sharpe A, Parkin I, Whitwill S,Lydiate D: Molecular characterization of Brassica napus NAC domaintranscriptional activators induced in response to biotic and abioticstress. Plant Mol Biol 2003, 53:383-397.
66. Nakashima K, Tran LS, Van Nguyen D, Fujita M, Maruyama K, Todaka D,Ito Y, Hayashi N, Shinozaki K, Yamaguchi-Shinozaki K: Functional analysis ofa NAC-type transcription factor OsNAC6 involved in abiotic and bioticstress-responsive gene expression in rice. Plant J 2007, 51:617-630.
Deokar et al. BMC Plant Biology 2011, 11:70http://www.biomedcentral.com/1471-2229/11/70
Page 19 of 20
67. Guo YF, Gan SS: AtNAP, a NAC family transcription factor, has animportant role in leaf senescence. Plant J 2006, 47:601-612.
68. Henriksson E, Olsson AS, Johannesson H, Johansson H, Hanson J,Engstrom P, Soderman E: Homeodomain leucine zipper class I genes inArabidopsis: expression patterns and phylogenetic relationships. PlantPhysiol 2005, 139:509-518.
69. Dezer CA, Gago GM, Gonzalez DH, Chan RL: Hahb-4, a sunflowerhomeobox-leucine zipper gene, is a developmental regulator andconfers drought tolerance to Arabidopsis thaliana plants. Transgenicresearch 2005, 14:429-440.
70. Talame V, Ozturk NZ, Bohnert HJ, Tuberosa R: Barley transcript profilesunder dehydration shock and drought stress treatments: a comparativeanalysis. J Exp Bot 2007, 58:229-240.
71. Akashi K, Miyakel C, Yokota A: A novel compatible solute in drought-tolerant wild watermelon leaves, is an efficient hydroxyl radicalscavenger. FEBS Letters 2001, 508:438-442.
72. Capell T, Bassie L, Christou P: Modulation of the polyamine biosyntheticpathway in transgenic rice confers tolerance to drought stress.Proceedings of National Academy of Sciences, USA 2004, 101:9909-9914.
73. Sung DY, Vierling E, Guy CL: Comprehensive expression profile analysis ofthe Arabidopsis Hsp70 gene family. Plant Physiol 2001, 126:789-800.
74. Radauer C, Breiteneder H: Evolutionary biology of food plant allergens.The Journal of Allergy and Clinical Immunology 2007, 120:518-525.
75. Guo P, Baum M, Grando S, Ceccarelli S, Bai G, Li R, Von Korff M,Varshney RK, Graner A, Valkoun J: Differentially expressed genes betweendrought tolerant and drought sensitive barley genotypes in responsiveto drought stress during the reproductive stage. J Exp Bot 2009,60(12):3531-3544.
doi:10.1186/1471-2229-11-70Cite this article as: Deokar et al.: Comparative analysis of expressedsequence tags (ESTs) between drought-tolerant and -susceptiblegenotypes of chickpea under terminal drought stress. BMC Plant Biology2011 11:70.
Submit your next manuscript to BioMed Centraland take full advantage of:
• Convenient online submission
• Thorough peer review
• No space constraints or color figure charges
• Immediate publication on acceptance
• Inclusion in PubMed, CAS, Scopus and Google Scholar
• Research which is freely available for redistribution
Submit your manuscript at www.biomedcentral.com/submit
Deokar et al. BMC Plant Biology 2011, 11:70http://www.biomedcentral.com/1471-2229/11/70
Page 20 of 20