Embed Size (px)
Citation preview
International Journal of Research in Social Sciences Vol. 7 Issue 12, December 2017,
ISSN: 2249-2496 Impact Factor: 7.081
Journal Homepage: http://www.ijmra.us, Email: [email protected]
Double-Blind Peer Reviewed Refereed Open Access International Journal - Included in the International
Serial Directories Indexed & Listed at: Ulrich's Periodicals Directory ©, U.S.A., Open J-Gage as well as in
Cabell‟s Directories of Publishing Opportunities, U.S.A
283 International Journal of Research in Social Sciences
http://www.ijmra.us, Email: [email protected]
Comparative Analysis of Asset Quality of
Public and Private Sector Banks in India
Fareed Ahmed*
Abstract
Asset quality is the indicator for the health of the banking
industry in a country. With the introduction of international
norms of Income Recognition, Asset classification and
Provisioning in the banking sector, managing Non-Performing
Assets have emerged as one of the major challenges facing the
banks. This study provides an analysis of the trends of NPAs
of Public and Private Sector Banks in India and found that the
NPAs of both the groups have been increasing regularly year
by year but the magnitude of Non-Performing Asset is
comparatively higher in public sectors banks than private
sector banks. Further it analysed the asset quality in terms of
Gross Non-Performing Asset & Net Non-Performing Asset to
Total Assets ratios, Slippage & Net Slippage ratios,
Restructured Standard Asset ratio, Stressed Asset and
Impaired Asset ratios besides Gross Non-Performing Asset
and Net Non-Performing Asset ratios based on the secondary
data. Analysis of variance (ANOVA) and F-test are used with
the help of Statistical Package for the Social Sciences to
ascertain the significant difference in various parameters of
Net-Performing Asset between Public Sector Banks and
Private Sector Banks. It was observed that there is significant
difference in between Public Sector Banks and Private Sector
Keywords:
Non Performing Assets
Slippage Ratio
Restructured Asset Ratio
Stressed Asset Ratio
Impaired Asset Ratio
*
ISSN: 2249-2496 Impact Factor: 7.081
284 International Journal of Research in Social Sciences
http://www.ijmra.us, Email: [email protected]
Banks in respect of Net Non-Performing Asset ratio,
Restructured Standard Asset ratio, Stressed Asset and
Impaired Asset ratios and there is no significant difference in
respect of Gross Non-Performing Asset ratio, Gross Non-
Performing Asset & Net Non-Performing Asset to Total
Assets ratios, Slippage and Net Slippage ratios.
.
1. Introduction
Banking sector plays a pivotal role in the development of an economy. A healthy banking system
is essential for sustained and rapid economic progress. The best indicator for the health of the
banking industry in a country is its asset quality. With the introduction of international norms of
Income Recognition, Asset classification and Provisioning in the banking sector, managing Non-
Performing Assets (NPAs) have emerged as one of the major challenges facing the banks. The
Gross NPAs (GNPAs) of Scheduled Commercial Banks (SCBs) stood at Rs. 611500 crore as
on March 2016 constituting about 7.5% of gross advances and further this ratio rose to 9.6% in
2017. Among the bank groups, Public Sector Banks (PSBs) continued to share a disproportionate
and increasing burden in case of Net NPAs (NNPAs). An attempt is made in this paper to
analyse the performance of Public Sector Banks (PSBs) and Private Sector Banks (PVSBs) in
NPA management.
1.1 Concept of NPAs
An asset, including a leased asset, becomes non-performing when it ceases to generate income
for the bank. An NPA is a loan or an advance where;
interest and/or instalment of principal remains overdue for a period of more than 90 days in
respect of a term loan,
the account remains „out of order‟ in respect of an Overdraft/Cash Credit (OD/CC),
the bill remains overdue for a period of more than 90 days in the case of bills purchased and
discounted,
the instalment of principal or interest thereon remains overdue for two crop seasons for short
ISSN: 2249-2496 Impact Factor: 7.081
285 International Journal of Research in Social Sciences
http://www.ijmra.us, Email: [email protected]
duration crops,
the instalment of principal or interest thereon remains overdue for one crop season for long
duration crops,
the amount of liquidity facility remains outstanding for more than 90 days, in respect of a
securitisation transaction,
in respect of derivative transactions, the overdue receivables representing positive mark-to-
market value of a derivative contract, if these remain unpaid for a period of 90 days from the
specified due date for payment.
‘Out of Order’ status
An account should be treated as „out of order‟ if the outstanding balance remains continuously in
excess of the sanctioned limit/drawing power. In cases where the outstanding balance in the
principal operating account is less than the sanctioned limit/drawing power, but there are no
credits continuously for 90 days as on the date of Balance Sheet or credits are not enough to
cover the interest debited during the same period, these accounts should be treated as „out of
order‟.
‘Overdue’
Any amount due to the bank under any credit facility is „overdue‟ if it is not paid on the due date
fixed by the bank.
1.2 Categories of NPAs
Banks are required to classify NPAs further into the following three categories based on the
period for which the asset has remained non-performing and the realisability of the dues:
1.2.1 Substandard Assets
With effect from 31 March, 2005, a substandard asset would be one, which has remained NPA
for a period less than or equal to 12 months. Such an asset will have well defined credit
weaknesses that jeopardize the liquidation of the debt and are characterized by the distinct
possibility that the banks will sustain some loss, if deficiencies are not corrected. 1.2.2 Doubtful
Assets
ISSN: 2249-2496 Impact Factor: 7.081
286 International Journal of Research in Social Sciences
http://www.ijmra.us, Email: [email protected]
With effect from 31 March, 2005, an asset would be classified as doubtful if it has remained in
the substandard category for a period of 12 months. A loan classified as doubtful has all the
weaknesses inherent in assets that were classified as substandard, with the added characteristic
that the weaknesses make collection or liquidation in full, on the basis of currently known facts,
conditions and values highly questionable and improbable.
1.2.3 Loss Assets
A loss asset is one where loss has been identified by the bank or internal or external auditors or
the Reserve Bank of India (RBI) inspection but the amount has not been written off wholly. In
other words, such an asset is considered uncollectible and of such little value that its continuance
as a bankable asset is not warranted although there may be some salvage or recovery value.
2. Objectives
The objectives of the study are:
i. To study the trend of NPAs of PSBs and PVSBs
ii. To evaluate the performance of PSBs and PVSBs
3. Review of Literature
A brief review of literature on the studies on NPAs is presented below:
Harpreet Kaur, et al. (2011) studied NPAs of PSBs and PVSBs and the study period was 1995
to 2009. Both types of banks showed a declining trend in GNPA and NNPAs over the period of
the study but PSBs show higher ratio as compared to PVSBs; reason behind this is that PVSBs
have a secured loan policy as compared to PSBs. GNPA and NNPAs have increased in absolute
terms till 2002 and started declining after that. It is observed that GNPAs in percentage terms
with gross advances of PSBs have declined from 19.5% (Rs. 38384 crore) to 2.1% (Rs. 44039
crore) in the period of 1994-95 to 2008-09, whereas GNPAs as percentage with gross advances
of PVSBs have declined from 8.7% (Rs. 3186 crore) to 3.2 % (Rs. 16983 crore) during the
period of 1997-98 to 2008-09. On the other hand NNPAs of PSBs in percentage terms have also
come down from 10.70% (Rs. 7567 crore) in 1994-95 to 0.70% (Rs. 21033 crore) in 2008-09 but
comparatively in PVSBs, NNPAs in percentage terms to net advances have also come down
from 8.20% (Rs. 1863 crore) in 1997-98 to 1.50% (Rs. 7418 crore) in 2008-09.
ISSN: 2249-2496 Impact Factor: 7.081
287 International Journal of Research in Social Sciences
http://www.ijmra.us, Email: [email protected]
Pacha Malyadri, et al. (2011) examined the state of affair of the NPAs of the PSBs and PVSBs
in India with special reference to weaker sections for the period of seven years i.e. from 2004-
2010. It was observed that the PSBs comprise of two groups i.e. nationalized banks group and
state bank group. These groups depicted that, over the period of study, the share of nationalized
banks in advances and NPAs is more than the state bank group advances and NPAs. It was
further observed that there is increase in advances over the period of the study and the decline in
ratio of NPAs indicates improvement in the asset quality of Indian PSBs and PVSBs.
Kavitha, N. (2012) observed that there is an increase in advances over the period of the study. It
was also observed that Ratio of GNPA to Gross Advances is 9.83% by Nationalized banks, Ratio
of NNPA to Net Advances of Nationalised bank group has secured 4.80%, Ratio of GNPA to
Total Assets is found to be 4.39% by Nationalised bank group; Ratio of NNPA to Total Assets of
Nationalised bank group with 1.97% which is more than State Bank of India (SBI) and its
Associates and private bank group. When the overall position was assessed, it is found that
Nationalised bank group has secured the first place and the second place was taken by SBI and
its Associates. She inferred that the decline in ratio of NPAs indicates improvement in the assets
quality of SBI groups, Nationalized Banks and PVSBs
Mahadeva Murthy, et al. (2013) analysed to highlight the NPAs position of PSBs and PVSBs
in India and studied the trend of NPAs in PSBs and PVSBs in the nineteen years from 1993-94 to
2011-12. Tabular analysis was used and observed that the level of NPAs in relation to the total
assets has declined. There is a decline in the percentage of NPAs from 14.50% to 1.70% in
PSBs over a period of study. There is also decline in the percentage of NPAs from 3.36% to
0.50% in PVSBs from 1993-94 to 2011-12. The level of NPA in PSBs hold larger share
compared to PVSBs. It is found that USA stands first among all the countries in terms of
percentage of NPA with 3.9% in the year 2012.
Mohnani Priyanka, et al. (2013) evaluated the operational performance of the selected PSBs &
PVSBs in India and also analyzed how efficiently PSBs and PVSBs can manage NPA. The
study covered the period from 2002-03 to 2011-2012. They found that there has been marginal
decrease in NPAs level over the period in all selected banks. It is observed that the magnitude of
ISSN: 2249-2496 Impact Factor: 7.081
288 International Journal of Research in Social Sciences
http://www.ijmra.us, Email: [email protected]
NPA was comparatively higher in PSBs compared to PVSBs under study but they have managed
the number at lower end. GNPAs ratio of Punjab National Bank (PNB) is less and it has been
reduced over the period in comparison to SBI. On the other side as far as Private Banks are
concerned, HDFC has better performance in comparison to ICICI. ICICI bank has higher NPA
figure compared to PSBs under study.
Sultan Singh, et al. (2013) attempted to analyze the asset quality of selected private sector
Indian banks. During the period under study, the ratio of NNPAs to total assets ranges from
0.00% to 1.20% in case of ICICI, from 0.16% to 3.39% in case of IndusInd, from 0.17% to
1.59% in case of Axis and from 0.07% to 1.19% in case of HDFC, the ratio of NNPAs to net
advances ranges from 0.72% to 5.48% in case of ICICI, from 0.28% to 6.59% in case of
IndusInd, from 0.29% to 3.43% in case of Axis and from 0.16% to 0.63% in case of HDFC and
the ratio of total investments to total assets ranges from 26.48% to 39.05% in case of ICICI, from
22.94% to 30.70% in case of IndusInd, from 29.66% to 44.04% in case of Axis and from
25.57% to 48.36% in case of HDFC respectively. The study revealed that there is a significant
difference in the ratio of NNPAs to total assets, NNPAs to net advances and total investments to
total assets in the selected banks. This revealed that there exists significant difference in the
asset quality of the selected banks during the period under study.
4. Methodology
The study is descriptive research and analytical study. The sample consists of PSBS and PVSBs
and data collected for the period of nine years from 2008-2016. The secondary data have been
collected from the reports of the RBI like Trend and Progress of Banking in India, and Hand
book of Statistics on Indian Economy. ANOVA and F-test are used with the help of SPSS.
Earlier researchers compared the performance of PSBs and PVSBs only in terms of GNPA and
NNPA ratios, but we attempted to compare in terms of GNPA & NNPA to Total Assets ratios,
Slippage & Net Slippage ratios, Restructured Standard Asset (RSA) ratio, Stressed Asset and
Impaired Asset ratios besides GNPA and NNPA ratios. (Formulae for ratios furnished in Table
1).
ISSN: 2249-2496 Impact Factor: 7.081
289 International Journal of Research in Social Sciences
http://www.ijmra.us, Email: [email protected]
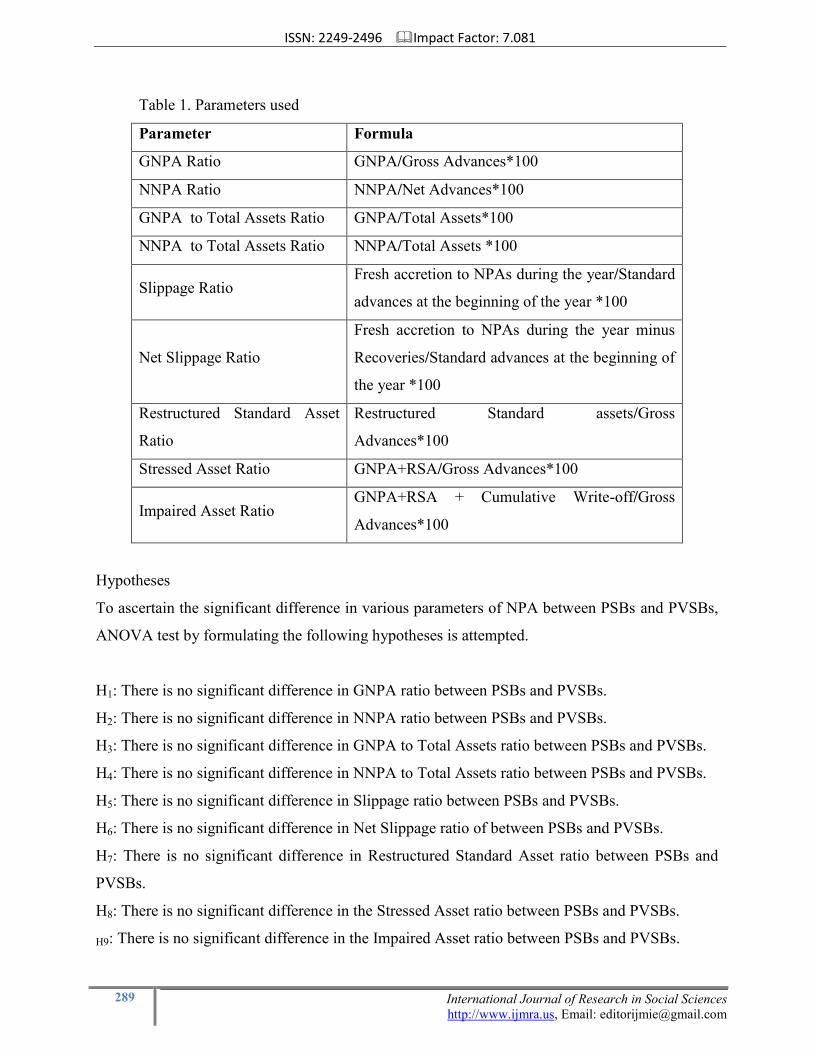
Table 1. Parameters used
Parameter Formula
GNPA Ratio GNPA/Gross Advances*100
NNPA Ratio NNPA/Net Advances*100
GNPA to Total Assets Ratio GNPA/Total Assets*100
NNPA to Total Assets Ratio NNPA/Total Assets *100
Slippage Ratio Fresh accretion to NPAs during the year/Standard
advances at the beginning of the year *100
Net Slippage Ratio
Fresh accretion to NPAs during the year minus
Recoveries/Standard advances at the beginning of
the year *100
Restructured Standard Asset
Ratio
Restructured Standard assets/Gross
Advances*100
Stressed Asset Ratio GNPA+RSA/Gross Advances*100
Impaired Asset Ratio GNPA+RSA + Cumulative Write-off/Gross
Advances*100
Hypotheses
To ascertain the significant difference in various parameters of NPA between PSBs and PVSBs,
ANOVA test by formulating the following hypotheses is attempted.
H1: There is no significant difference in GNPA ratio between PSBs and PVSBs.
H2: There is no significant difference in NNPA ratio between PSBs and PVSBs.
H3: There is no significant difference in GNPA to Total Assets ratio between PSBs and PVSBs.
H4: There is no significant difference in NNPA to Total Assets ratio between PSBs and PVSBs.
H5: There is no significant difference in Slippage ratio between PSBs and PVSBs.
H6: There is no significant difference in Net Slippage ratio of between PSBs and PVSBs.
H7: There is no significant difference in Restructured Standard Asset ratio between PSBs and
PVSBs.
H8: There is no significant difference in the Stressed Asset ratio between PSBs and PVSBs.
H9: There is no significant difference in the Impaired Asset ratio between PSBs and PVSBs.
ISSN: 2249-2496 Impact Factor: 7.081
290 International Journal of Research in Social Sciences
http://www.ijmra.us, Email: [email protected]
5. Results and Discussion
The results of the analysis are furnished in the following paragraphs.
5.1 Trends in NPAs of PSBs and PVSBs
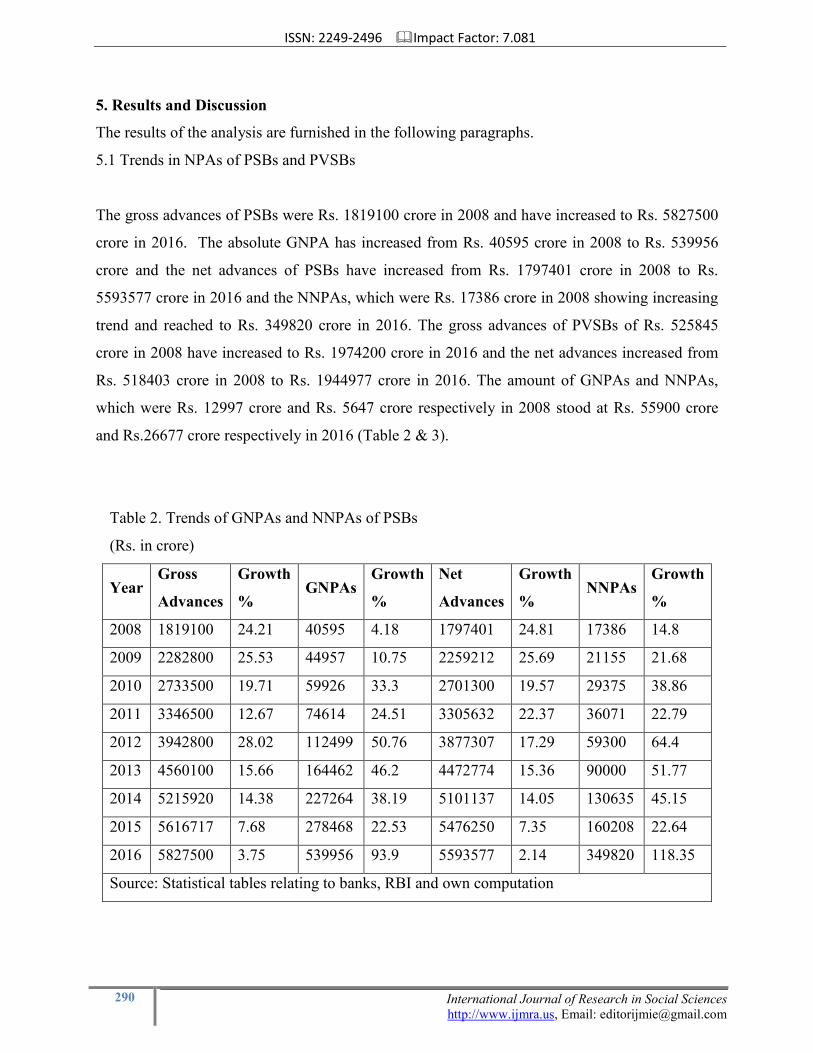
The gross advances of PSBs were Rs. 1819100 crore in 2008 and have increased to Rs. 5827500
crore in 2016. The absolute GNPA has increased from Rs. 40595 crore in 2008 to Rs. 539956
crore and the net advances of PSBs have increased from Rs. 1797401 crore in 2008 to Rs.
5593577 crore in 2016 and the NNPAs, which were Rs. 17386 crore in 2008 showing increasing
trend and reached to Rs. 349820 crore in 2016. The gross advances of PVSBs of Rs. 525845
crore in 2008 have increased to Rs. 1974200 crore in 2016 and the net advances increased from
Rs. 518403 crore in 2008 to Rs. 1944977 crore in 2016. The amount of GNPAs and NNPAs,
which were Rs. 12997 crore and Rs. 5647 crore respectively in 2008 stood at Rs. 55900 crore
and Rs.26677 crore respectively in 2016 (Table 2 & 3).
Table 2. Trends of GNPAs and NNPAs of PSBs
(Rs. in crore)
Year Gross
Advances
Growth
% GNPAs
Growth
%
Net
Advances
Growth
% NNPAs
Growth
%
2008 1819100 24.21 40595 4.18 1797401 24.81 17386 14.8
2009 2282800 25.53 44957 10.75 2259212 25.69 21155 21.68
2010 2733500 19.71 59926 33.3 2701300 19.57 29375 38.86
2011 3346500 12.67 74614 24.51 3305632 22.37 36071 22.79
2012 3942800 28.02 112499 50.76 3877307 17.29 59300 64.4
2013 4560100 15.66 164462 46.2 4472774 15.36 90000 51.77
2014 5215920 14.38 227264 38.19 5101137 14.05 130635 45.15
2015 5616717 7.68 278468 22.53 5476250 7.35 160208 22.64
2016 5827500 3.75 539956 93.9 5593577 2.14 349820 118.35
Source: Statistical tables relating to banks, RBI and own computation
ISSN: 2249-2496 Impact Factor: 7.081
291 International Journal of Research in Social Sciences
http://www.ijmra.us, Email: [email protected]
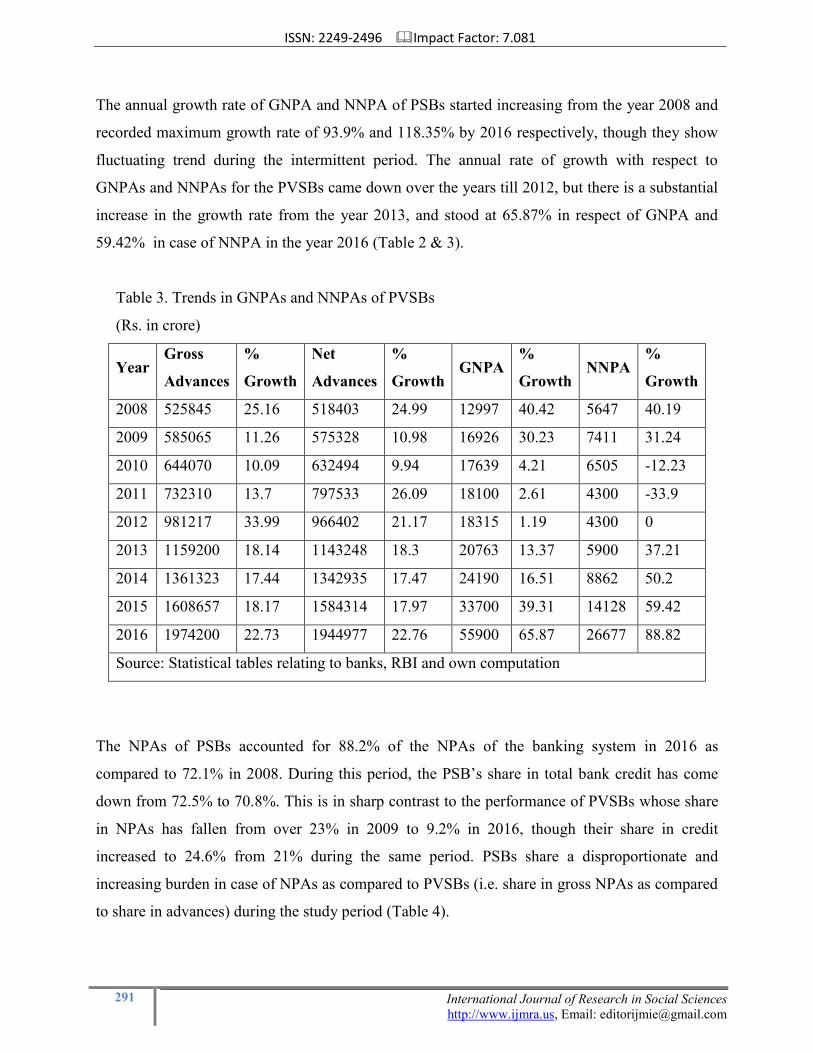
The annual growth rate of GNPA and NNPA of PSBs started increasing from the year 2008 and
recorded maximum growth rate of 93.9% and 118.35% by 2016 respectively, though they show
fluctuating trend during the intermittent period. The annual rate of growth with respect to
GNPAs and NNPAs for the PVSBs came down over the years till 2012, but there is a substantial
increase in the growth rate from the year 2013, and stood at 65.87% in respect of GNPA and
59.42% in case of NNPA in the year 2016 (Table 2 & 3).
Table 3. Trends in GNPAs and NNPAs of PVSBs
(Rs. in crore)
Year Gross
Advances
%
Growth
Net
Advances
%
Growth GNPA
%
Growth NNPA
%
Growth
2008 525845 25.16 518403 24.99 12997 40.42 5647 40.19
2009 585065 11.26 575328 10.98 16926 30.23 7411 31.24
2010 644070 10.09 632494 9.94 17639 4.21 6505 -12.23
2011 732310 13.7 797533 26.09 18100 2.61 4300 -33.9
2012 981217 33.99 966402 21.17 18315 1.19 4300 0
2013 1159200 18.14 1143248 18.3 20763 13.37 5900 37.21
2014 1361323 17.44 1342935 17.47 24190 16.51 8862 50.2
2015 1608657 18.17 1584314 17.97 33700 39.31 14128 59.42
2016 1974200 22.73 1944977 22.76 55900 65.87 26677 88.82
Source: Statistical tables relating to banks, RBI and own computation
The NPAs of PSBs accounted for 88.2% of the NPAs of the banking system in 2016 as
compared to 72.1% in 2008. During this period, the PSB‟s share in total bank credit has come
down from 72.5% to 70.8%. This is in sharp contrast to the performance of PVSBs whose share
in NPAs has fallen from over 23% in 2009 to 9.2% in 2016, though their share in credit
increased to 24.6% from 21% during the same period. PSBs share a disproportionate and
increasing burden in case of NPAs as compared to PVSBs (i.e. share in gross NPAs as compared
to share in advances) during the study period (Table 4).
ISSN: 2249-2496 Impact Factor: 7.081
292 International Journal of Research in Social Sciences
http://www.ijmra.us, Email: [email protected]
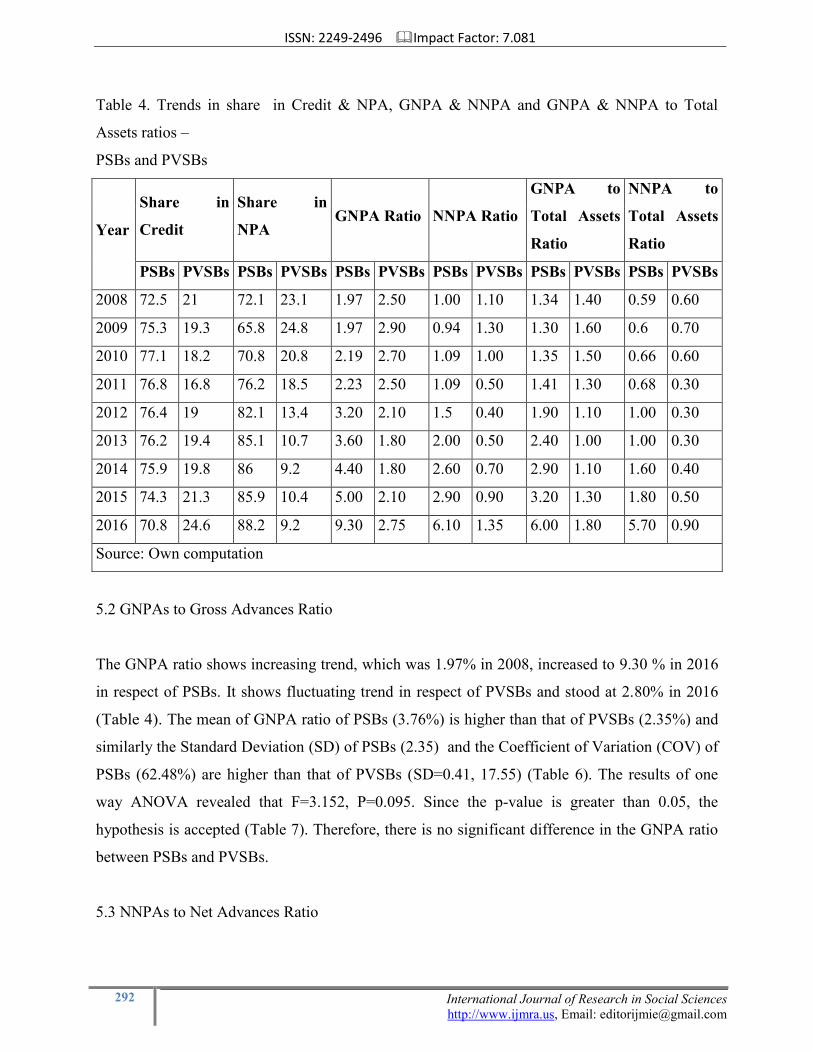
Table 4. Trends in share in Credit & NPA, GNPA & NNPA and GNPA & NNPA to Total
Assets ratios –
PSBs and PVSBs
Year
Share in
Credit
Share in
NPA GNPA Ratio NNPA Ratio
GNPA to
Total Assets
Ratio
NNPA to
Total Assets
Ratio
PSBs PVSBs PSBs PVSBs PSBs PVSBs PSBs PVSBs PSBs PVSBs PSBs PVSBs
2008 72.5 21 72.1 23.1 1.97 2.50 1.00 1.10 1.34 1.40 0.59 0.60
2009 75.3 19.3 65.8 24.8 1.97 2.90 0.94 1.30 1.30 1.60 0.6 0.70
2010 77.1 18.2 70.8 20.8 2.19 2.70 1.09 1.00 1.35 1.50 0.66 0.60
2011 76.8 16.8 76.2 18.5 2.23 2.50 1.09 0.50 1.41 1.30 0.68 0.30
2012 76.4 19 82.1 13.4 3.20 2.10 1.5 0.40 1.90 1.10 1.00 0.30
2013 76.2 19.4 85.1 10.7 3.60 1.80 2.00 0.50 2.40 1.00 1.00 0.30
2014 75.9 19.8 86 9.2 4.40 1.80 2.60 0.70 2.90 1.10 1.60 0.40
2015 74.3 21.3 85.9 10.4 5.00 2.10 2.90 0.90 3.20 1.30 1.80 0.50
2016 70.8 24.6 88.2 9.2 9.30 2.75 6.10 1.35 6.00 1.80 5.70 0.90
Source: Own computation
5.2 GNPAs to Gross Advances Ratio
The GNPA ratio shows increasing trend, which was 1.97% in 2008, increased to 9.30 % in 2016
in respect of PSBs. It shows fluctuating trend in respect of PVSBs and stood at 2.80% in 2016
(Table 4). The mean of GNPA ratio of PSBs (3.76%) is higher than that of PVSBs (2.35%) and
similarly the Standard Deviation (SD) of PSBs (2.35) and the Coefficient of Variation (COV) of
PSBs (62.48%) are higher than that of PVSBs (SD=0.41, 17.55) (Table 6). The results of one
way ANOVA revealed that F=3.152, P=0.095. Since the p-value is greater than 0.05, the
hypothesis is accepted (Table 7). Therefore, there is no significant difference in the GNPA ratio
between PSBs and PVSBs.
5.3 NNPAs to Net Advances Ratio
ISSN: 2249-2496 Impact Factor: 7.081
293 International Journal of Research in Social Sciences
http://www.ijmra.us, Email: [email protected]
The NNPA ratio in respect of PSBs increased substantially from 2008 (1.00%) to 6.10% in 2016
and it shows fluctuating trend in respect of PVSBs and stood at 1.30% in 2016 (Table 4). The
mean of NNPA ratio of PSBs (2.14%) is higher than that of PVSBs (0.86%) and similarly the SD
of PSBs 1.65% and the COV of PSBs (77.38%) are higher than that of PVSBs
(SD=0.36,COV=41.24%) (Table 6). The results of one way ANOVA revealed that F=5.117,
P=0.038. Since the p-value is less than 0.05, the hypothesis is rejected (Table 7). Therefore,
there is significant difference in between PSBs and PVSBs.
5.4 GNPAs to Total Assets Ratio
It is observed from Table 4 that the GNPA to Total Assets ratio shows increasing trend, which
was 1.34% in 2008, increased to 6.00 % in 2016 in respect of PSBs. It shows fluctuating trend in
respect of PVSBs and stood at 1.80% in 2016 (Table 4). It can be observed that the mean of
GNPA to Total Assets ratio of PSBs (2.42%) is higher than that of PVSBs (1.34%) and similarly
the SD of PSBs (1.52) and the COV of PSBs (62.80%) are higher than that of PVSBs (SD=0.26,
COV=19.36%) (Table 6). The results of one way ANOVA revealed that F=4.382, P=0.52. Since
the p-value is greater than 0.05, the hypothesis is accepted (Table 7). Therefore, there is no
significant difference in the GNPA to Total Asset ratio between PSBs and PVSBs.
5.5 Net NPA to Total Assets Ratio
It is observed that the NNPA to Total Assets ratio shows increasing trend, which was 0.59% in
2008, increased to 5.70% in 2016 in respect of PSBs. It shows fluctuating trend in respect of
PVSBs and increased from 0.60 in 2008 to 0.90% in 2016 (Table 4). It can be observed that the
mean of NNPA to Total Assets ratio of PSBs (1.51%) is higher than that of PVSBs (0.51%) and
similarly the Standard Deviation of PSBs (1.63) and the COV of PSBs (107.63%) are higher than
that of PVSBs (SD=0.21, COV=40.80%)(Table 6). The results of one way ANOVA revealed
that F= 3.355, P=0.086. Since the p-value is greater than 0.05, the hypothesis is accepted
(Table7). Therefore, there is no significant difference in the GNPA ratio between PSBs and
PVSBs.
ISSN: 2249-2496 Impact Factor: 7.081
294 International Journal of Research in Social Sciences
http://www.ijmra.us, Email: [email protected]
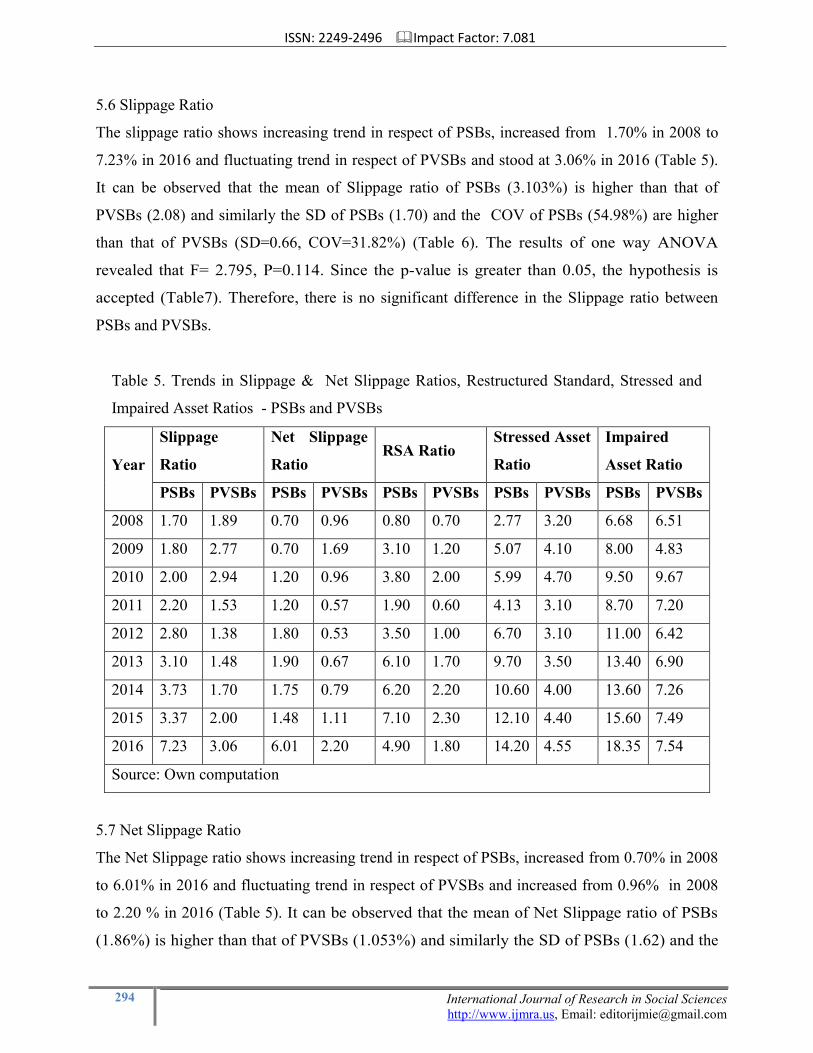
5.6 Slippage Ratio
The slippage ratio shows increasing trend in respect of PSBs, increased from 1.70% in 2008 to
7.23% in 2016 and fluctuating trend in respect of PVSBs and stood at 3.06% in 2016 (Table 5).
It can be observed that the mean of Slippage ratio of PSBs (3.103%) is higher than that of
PVSBs (2.08) and similarly the SD of PSBs (1.70) and the COV of PSBs (54.98%) are higher
than that of PVSBs (SD=0.66, COV=31.82%) (Table 6). The results of one way ANOVA
revealed that F= 2.795, P=0.114. Since the p-value is greater than 0.05, the hypothesis is
accepted (Table7). Therefore, there is no significant difference in the Slippage ratio between
PSBs and PVSBs.
Table 5. Trends in Slippage & Net Slippage Ratios, Restructured Standard, Stressed and
Impaired Asset Ratios - PSBs and PVSBs
Year
Slippage
Ratio
Net Slippage
Ratio RSA Ratio
Stressed Asset
Ratio
Impaired
Asset Ratio
PSBs PVSBs PSBs PVSBs PSBs PVSBs PSBs PVSBs PSBs PVSBs
2008 1.70 1.89 0.70 0.96 0.80 0.70 2.77 3.20 6.68 6.51
2009 1.80 2.77 0.70 1.69 3.10 1.20 5.07 4.10 8.00 4.83
2010 2.00 2.94 1.20 0.96 3.80 2.00 5.99 4.70 9.50 9.67
2011 2.20 1.53 1.20 0.57 1.90 0.60 4.13 3.10 8.70 7.20
2012 2.80 1.38 1.80 0.53 3.50 1.00 6.70 3.10 11.00 6.42
2013 3.10 1.48 1.90 0.67 6.10 1.70 9.70 3.50 13.40 6.90
2014 3.73 1.70 1.75 0.79 6.20 2.20 10.60 4.00 13.60 7.26
2015 3.37 2.00 1.48 1.11 7.10 2.30 12.10 4.40 15.60 7.49
2016 7.23 3.06 6.01 2.20 4.90 1.80 14.20 4.55 18.35 7.54
Source: Own computation
5.7 Net Slippage Ratio
The Net Slippage ratio shows increasing trend in respect of PSBs, increased from 0.70% in 2008
to 6.01% in 2016 and fluctuating trend in respect of PVSBs and increased from 0.96% in 2008
to 2.20 % in 2016 (Table 5). It can be observed that the mean of Net Slippage ratio of PSBs
(1.86%) is higher than that of PVSBs (1.053%) and similarly the SD of PSBs (1.62) and the
ISSN: 2249-2496 Impact Factor: 7.081
295 International Journal of Research in Social Sciences
http://www.ijmra.us, Email: [email protected]
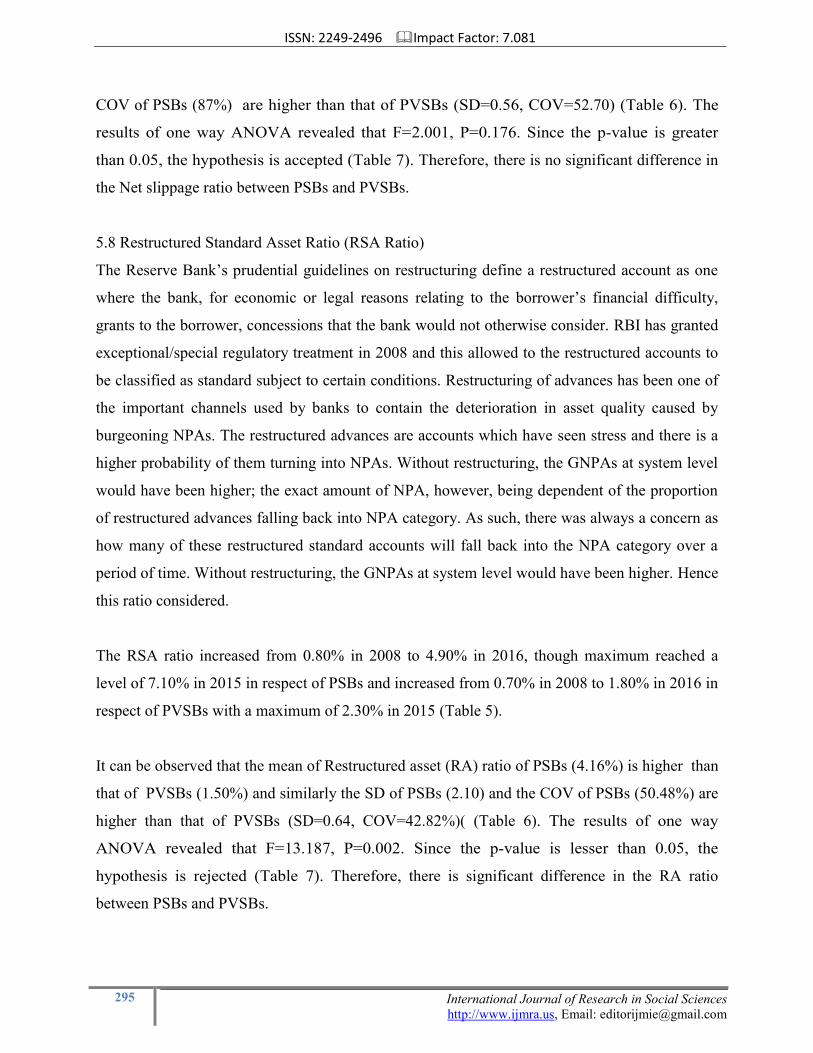
COV of PSBs (87%) are higher than that of PVSBs (SD=0.56, COV=52.70) (Table 6). The
results of one way ANOVA revealed that F=2.001, P=0.176. Since the p-value is greater
than 0.05, the hypothesis is accepted (Table 7). Therefore, there is no significant difference in
the Net slippage ratio between PSBs and PVSBs.
5.8 Restructured Standard Asset Ratio (RSA Ratio)
The Reserve Bank‟s prudential guidelines on restructuring define a restructured account as one
where the bank, for economic or legal reasons relating to the borrower‟s financial difficulty,
grants to the borrower, concessions that the bank would not otherwise consider. RBI has granted
exceptional/special regulatory treatment in 2008 and this allowed to the restructured accounts to
be classified as standard subject to certain conditions. Restructuring of advances has been one of
the important channels used by banks to contain the deterioration in asset quality caused by
burgeoning NPAs. The restructured advances are accounts which have seen stress and there is a
higher probability of them turning into NPAs. Without restructuring, the GNPAs at system level
would have been higher; the exact amount of NPA, however, being dependent of the proportion
of restructured advances falling back into NPA category. As such, there was always a concern as
how many of these restructured standard accounts will fall back into the NPA category over a
period of time. Without restructuring, the GNPAs at system level would have been higher. Hence
this ratio considered.
The RSA ratio increased from 0.80% in 2008 to 4.90% in 2016, though maximum reached a
level of 7.10% in 2015 in respect of PSBs and increased from 0.70% in 2008 to 1.80% in 2016 in
respect of PVSBs with a maximum of 2.30% in 2015 (Table 5).
It can be observed that the mean of Restructured asset (RA) ratio of PSBs (4.16%) is higher than
that of PVSBs (1.50%) and similarly the SD of PSBs (2.10) and the COV of PSBs (50.48%) are
higher than that of PVSBs (SD=0.64, COV=42.82%)( (Table 6). The results of one way
ANOVA revealed that F=13.187, P=0.002. Since the p-value is lesser than 0.05, the
hypothesis is rejected (Table 7). Therefore, there is significant difference in the RA ratio
between PSBs and PVSBs.
ISSN: 2249-2496 Impact Factor: 7.081
296 International Journal of Research in Social Sciences
http://www.ijmra.us, Email: [email protected]
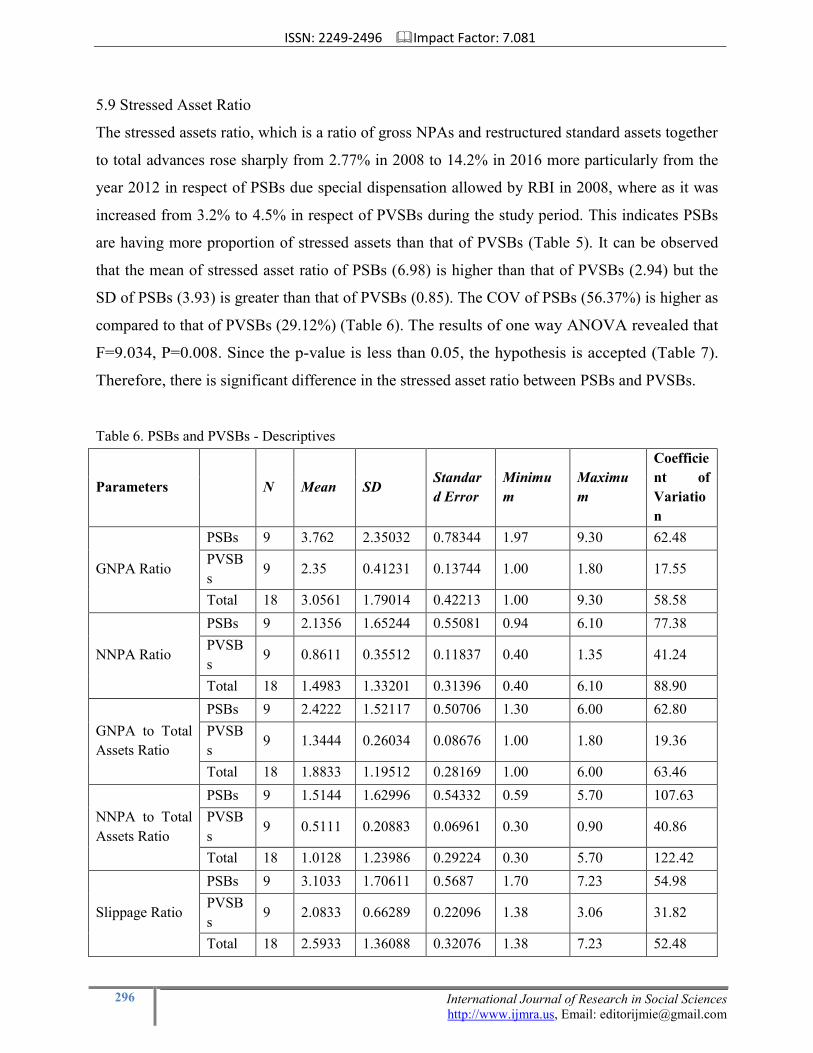
5.9 Stressed Asset Ratio
The stressed assets ratio, which is a ratio of gross NPAs and restructured standard assets together
to total advances rose sharply from 2.77% in 2008 to 14.2% in 2016 more particularly from the
year 2012 in respect of PSBs due special dispensation allowed by RBI in 2008, where as it was
increased from 3.2% to 4.5% in respect of PVSBs during the study period. This indicates PSBs
are having more proportion of stressed assets than that of PVSBs (Table 5). It can be observed
that the mean of stressed asset ratio of PSBs (6.98) is higher than that of PVSBs (2.94) but the
SD of PSBs (3.93) is greater than that of PVSBs (0.85). The COV of PSBs (56.37%) is higher as
compared to that of PVSBs (29.12%) (Table 6). The results of one way ANOVA revealed that
F=9.034, P=0.008. Since the p-value is less than 0.05, the hypothesis is accepted (Table 7).
Therefore, there is significant difference in the stressed asset ratio between PSBs and PVSBs.
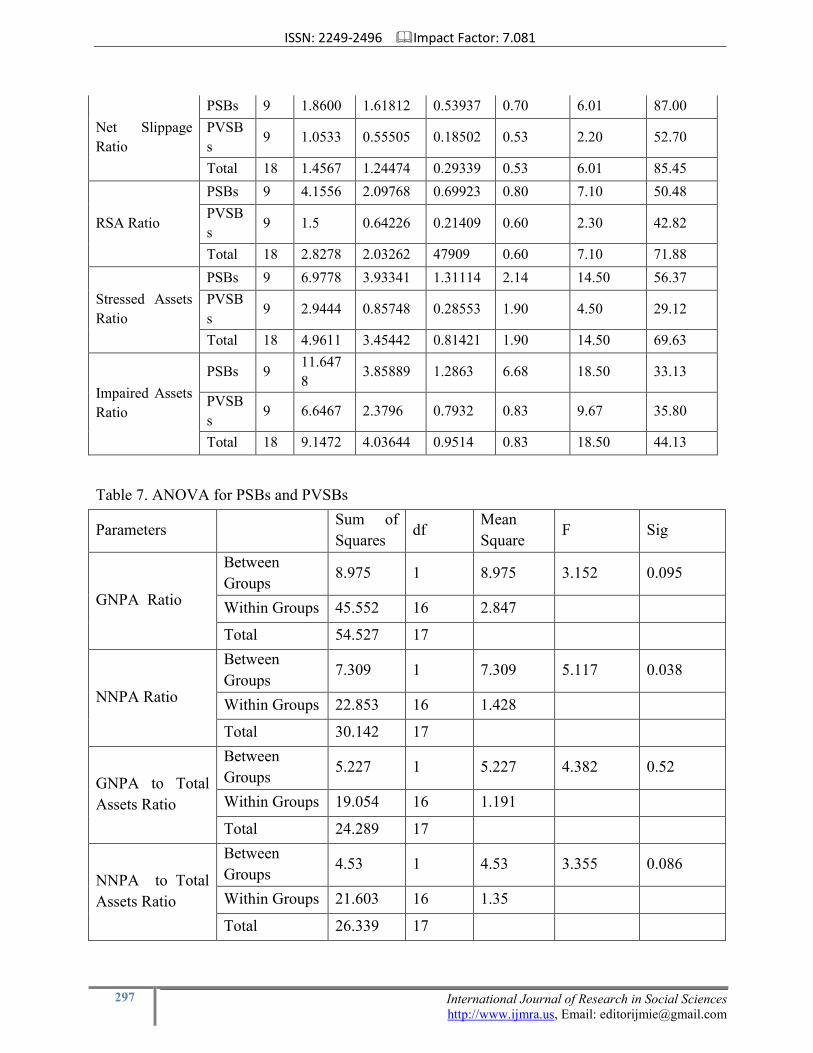
Table 6. PSBs and PVSBs - Descriptives
Parameters
N Mean SD Standar
d Error
Minimu
m
Maximu
m
Coefficie
nt of
Variatio
n
GNPA Ratio
PSBs 9 3.762 2.35032 0.78344 1.97 9.30 62.48
PVSB
s 9 2.35 0.41231 0.13744 1.00 1.80 17.55
Total 18 3.0561 1.79014 0.42213 1.00 9.30 58.58
NNPA Ratio
PSBs 9 2.1356 1.65244 0.55081 0.94 6.10 77.38
PVSB
s 9 0.8611 0.35512 0.11837 0.40 1.35 41.24
Total 18 1.4983 1.33201 0.31396 0.40 6.10 88.90
GNPA to Total
Assets Ratio
PSBs 9 2.4222 1.52117 0.50706 1.30 6.00 62.80
PVSB
s 9 1.3444 0.26034 0.08676 1.00 1.80 19.36
Total 18 1.8833 1.19512 0.28169 1.00 6.00 63.46
NNPA to Total
Assets Ratio
PSBs 9 1.5144 1.62996 0.54332 0.59 5.70 107.63
PVSB
s 9 0.5111 0.20883 0.06961 0.30 0.90 40.86
Total 18 1.0128 1.23986 0.29224 0.30 5.70 122.42
Slippage Ratio
PSBs 9 3.1033 1.70611 0.5687 1.70 7.23 54.98
PVSB
s 9 2.0833 0.66289 0.22096 1.38 3.06 31.82
Total 18 2.5933 1.36088 0.32076 1.38 7.23 52.48
ISSN: 2249-2496 Impact Factor: 7.081
297 International Journal of Research in Social Sciences
http://www.ijmra.us, Email: [email protected]
Net Slippage
Ratio
PSBs 9 1.8600 1.61812 0.53937 0.70 6.01 87.00
PVSB
s 9 1.0533 0.55505 0.18502 0.53 2.20 52.70
Total 18 1.4567 1.24474 0.29339 0.53 6.01 85.45
RSA Ratio
PSBs 9 4.1556 2.09768 0.69923 0.80 7.10 50.48
PVSB
s 9 1.5 0.64226 0.21409 0.60 2.30 42.82
Total 18 2.8278 2.03262 47909 0.60 7.10 71.88
Stressed Assets
Ratio
PSBs 9 6.9778 3.93341 1.31114 2.14 14.50 56.37
PVSB
s 9 2.9444 0.85748 0.28553 1.90 4.50 29.12
Total 18 4.9611 3.45442 0.81421 1.90 14.50 69.63
Impaired Assets
Ratio
PSBs 9 11.647
8 3.85889 1.2863 6.68 18.50 33.13
PVSB
s 9 6.6467 2.3796 0.7932 0.83 9.67 35.80
Total 18 9.1472 4.03644 0.9514 0.83 18.50 44.13
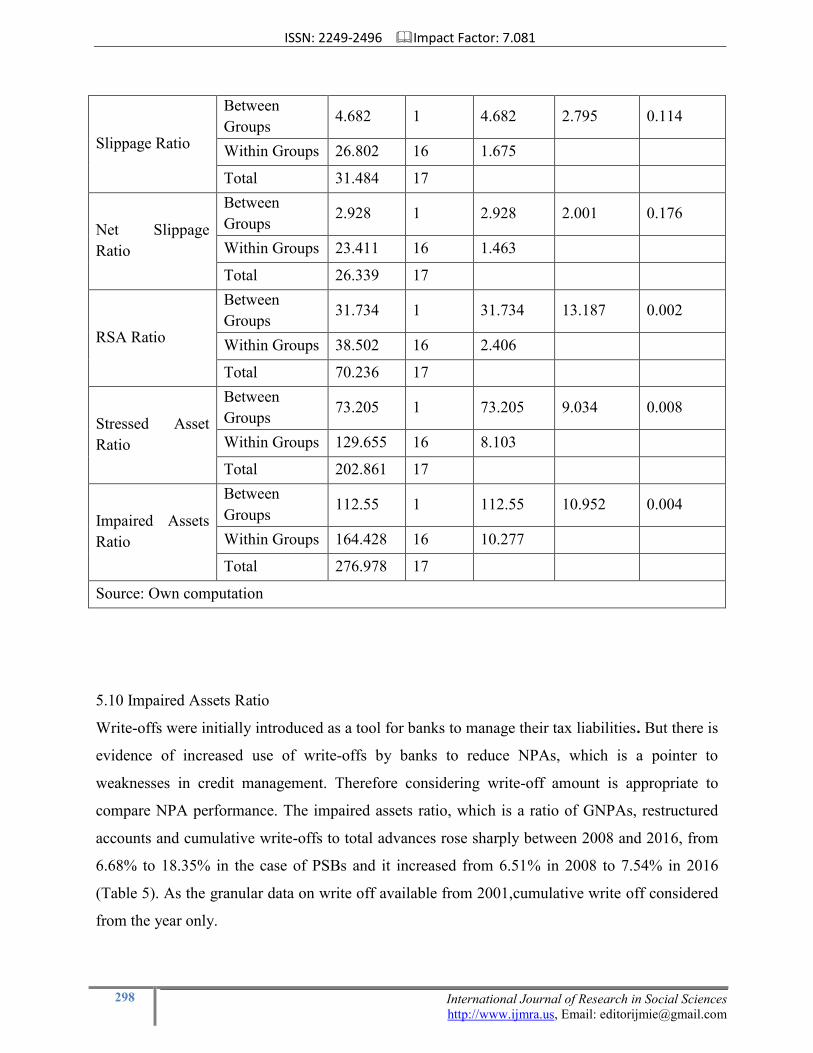
Table 7. ANOVA for PSBs and PVSBs
Parameters
Sum of
Squares df
Mean
Square F Sig
GNPA Ratio
Between
Groups 8.975 1 8.975 3.152 0.095
Within Groups 45.552 16 2.847
Total 54.527 17
NNPA Ratio
Between
Groups 7.309 1 7.309 5.117 0.038
Within Groups 22.853 16 1.428
Total 30.142 17
GNPA to Total
Assets Ratio
Between
Groups 5.227 1 5.227 4.382 0.52
Within Groups 19.054 16 1.191
Total 24.289 17
NNPA to Total
Assets Ratio
Between
Groups 4.53 1 4.53 3.355 0.086
Within Groups 21.603 16 1.35
Total 26.339 17
ISSN: 2249-2496 Impact Factor: 7.081
298 International Journal of Research in Social Sciences
http://www.ijmra.us, Email: [email protected]
Slippage Ratio
Between
Groups 4.682 1 4.682 2.795 0.114
Within Groups 26.802 16 1.675
Total 31.484 17
Net Slippage
Ratio
Between
Groups 2.928 1 2.928 2.001 0.176
Within Groups 23.411 16 1.463
Total 26.339 17
RSA Ratio
Between
Groups 31.734 1 31.734 13.187 0.002
Within Groups 38.502 16 2.406
Total 70.236 17
Stressed Asset
Ratio
Between
Groups 73.205 1 73.205 9.034 0.008
Within Groups 129.655 16 8.103
Total 202.861 17
Impaired Assets
Ratio
Between
Groups 112.55 1 112.55 10.952 0.004
Within Groups 164.428 16 10.277
Total 276.978 17
Source: Own computation
5.10 Impaired Assets Ratio
Write-offs were initially introduced as a tool for banks to manage their tax liabilities. But there is
evidence of increased use of write-offs by banks to reduce NPAs, which is a pointer to
weaknesses in credit management. Therefore considering write-off amount is appropriate to
compare NPA performance. The impaired assets ratio, which is a ratio of GNPAs, restructured
accounts and cumulative write-offs to total advances rose sharply between 2008 and 2016, from
6.68% to 18.35% in the case of PSBs and it increased from 6.51% in 2008 to 7.54% in 2016
(Table 5). As the granular data on write off available from 2001,cumulative write off considered
from the year only.
ISSN: 2249-2496 Impact Factor: 7.081
299 International Journal of Research in Social Sciences
http://www.ijmra.us, Email: [email protected]
It can be observed that the mean of impaired asset ratio of PSBs (11.65) is higher than that of
PVSBs (6.65) and the SD of PSBs (3.86) is lesser than that of PVSBs (2.37). The COV of PSBs
(33.13%) is less as compared to that of PVSBs (35.80%) (Table 6). The results of one way
ANOVA revealed that F=10.952, P=0.004. Since the p-value is less than 0.05, the
hypothesis is rejected (Table 7). Therefore, there is significant difference in the impaired asset
ratio between PSBs and PVSBs.
6. Conclusion
The study is descriptive research and analytical study. This study analyzed the trends of NPAs of
PSBs and PVSBs in India and found that the NPAs of both the groups have been increasing
regularly year by year but the magnitude of NPA is comparatively higher in PSBs than PVSBs.
PSBs share a disproportionate and increasing burden in case of NPAs as compared to PVSBs
(i.e. share in GNPAs as compared to share in advances) during the study period. Further it
analysed the asset quality in terms of GNPA & NNPA to Total Assets ratios, Slippage & Net
Slippage ratios, RSA ratio, Stressed Asset and Impaired Asset ratios besides GNPA and NNPA
ratios based on the secondary data. ANOVA and F-test are used with the help of SPSS to
ascertain the significant difference in various parameters of NPA between PSBs and PVSBs. It
was observed that there is significant difference between PSBs and PVSBs in respect of NNPA
ratio, RSA ratio, Stressed Asset and Impaired Asset ratios and there is no significant difference
in respect of GNPA ratio, GNPA & NNPA to Total Assets ratios, Slippage and Net Slippage
ratios, Thus the results indicate the asset quality of PVSBs is better than that of PSBs during the
study period, though the difference in respect of some of the parameters is not significant.
References
[1] Harpreet Kaur, and Neeraj Kumar Saddy, “A Comparative study of non-performing
assets of public and private sector banks”, International Journal of Research in Commerce and
Management, Vol. 2, Issue 9, 2011, pp. 82-89.
[2] Kavitha, N, “The Impact of Non-performing Assets on the Profitability of Indian
Scheduled Commercial Banks: An empirical Evidence”, International Journal of Research in
Commerce and Management, Vol.3, Issue 1, 2012, pp. 27-30.
ISSN: 2249-2496 Impact Factor: 7.081
300 International Journal of Research in Social Sciences
http://www.ijmra.us, Email: [email protected]
[3] Mahadeva Murthy, and S.N. Pathi, “An assessment of Risk Management in Banking
sector: A study with special reference to public and private sector banks in India”, Indian
Journal of Advanced Research in Management, Vol. 4, Issue 3, December 2013, pp. 18-33.
[4] Mohnani Priyanka, and Deshmukh Monal, “A Study of Non-Performing Assets on
Selected Public and Private Sector Banks”, International Journal of Science and Research, Vol.
2, Issue 4, April 2013.
[5] Pacha Malyadri, and S. Sirisha, “A Comparative Study of Non-Performing Assets in
Indian Banking Industry”, International Journal of Economic Practices and Theories, Vol. 1,
Issue 2, October 2011, pp.77-87.
[6] Sultan Singh, Mohina, and Sahila Choudhry, “Analysis of asset quality of private sector
Indian Banks”, Vol. 3, Issue 1, 2013, pp. 58-60.


![Arcil NON PERFORMING ASSET seminar [kompatibilitätsmodus]](https://img.pdfslide.us/doc/110x75/5485a7685806b5d1588b47b6/arcil-non-performing-asset-seminar-kompatibilitaetsmodus.jpg)


![11042 Microsoft PowerPoint - Non Performing Asset [Compatibility Mode]](https://img.pdfslide.us/doc/110x75/577cc1011a28aba71191ebac/11042-microsoft-powerpoint-non-performing-asset-compatibility-mode.jpg)
