Embed Size (px)
Citation preview

Comparative Advantage, Information and the Allocation of
Workers to Tasks: Evidence from an Agricultural Labor Market
Andrew D. Foster
and
Mark R. Rosenzweig
University of Pennsylvania
February 1996
The research reported in this paper was supported in part by NICHD grant No. HD-28687. Weare grateful to two anonymous referees for helpful comments and to Howard Bouis for makingthe data used in this paper available to us.

1
To understand the occupational distribution of workers characterized by any set of
observed characteristics such as sex, height, or skin color requires attention to a variety of
mechanisms that have been identified in the literature as determining who gets what jobs.
Among these are the operation of comparative advantage, the influence of preferences over
occupations by workers and over worker characteristics by employers, and the effects of partial
employer ignorance about workers' productivities and thus the reliance on statistical averages.
Given that observed worker characteristics may be correlated with both their own productivities
and preferences, may be arguments in employers' preference functions, or may provide
employers with partial information on worker productivity in a setting characterized by incomplete
information, it is not surprising that the relative importance of these factors has not been
identified.
One salient example of a strong relationship between a measurable worker characteristic
and the task distribution that has generated much controversy is the well-known disproportionate
allocation of women to weeding versus other agricultural activities in Asian agriculture. Table 1
presents the allocation of time to agricultural tasks based on detailed survey data from three
Asian societies - the Philippines, India and Pakistan - that show how women are
"overrepresented" in weeding activities compared to men. These data also suggest that the
differentials in time allocation may be particularly strong when women are engaged in activities
compensated using time wages, compared to when their compensation may more directly be
related to their productivity (self-cultivation and piece-rate work). The reasons for this salient
feature of Asian agriculture, where the technology of production is well known and the labor
market is much less complex than in developed societies, still have not been settled. For
example, Boserup, in her important distinction between "plow" agricultural and "shifting"
cultivation, suggests that the observed division of labor in the plowing economies in Asia reflects
a natural comparative advantage; another observer of this pattern, however, Kalpana Bardhan
(1984), assumes that the predominance of women in certain agricultural activities reflects
employer discrimination and monopsony power.
The notion that employer preferences importantly influence the occupational distribution

2
of workers in both developed and low-income countries has been the focus of a large literature
that is mostly inconclusive. In addition, some economists have argued that it is not possible to
test whether occupational allocations are in part the result of preferences by workers that covary
with observed characteristics (Zellner, 1975). Tests of the roles of differential productivities in
occupational allocations, in the absence of direct observations on productivity, are also known to
be difficult. As pointed out in Heckman and Sedlacek (1988), the principal problem that arises in
a attempts to test the idea that workers are allocated according to comparative advantage is
comparative advantage itself - because workers undertaking a particular task may be particularly
well-suited to that task (or unsuited to the alternative), the sample of people for which one
observes a wage observation in a particular task is not a random sample of the population as a
whole and thus the estimated wage equation by task is subject to selectivity bias.
The solution proposed in Heckman and Sedlacek (HS) to identify the operation of
comparative advantage and obtain consistent estimates of occupation-or task-specific wage
equations makes use of statistical methods that correct for selectivity bias. The advantage of this
approach is that, as long as the distributional and other assumptions required by the approach
are met, it provides consistent estimates of the parameters on measured variables in the wage
and task allocation equations. A comparison of these equations thus makes it possible to assess
directly whether individuals with attributes that make them more likely to do a particular task are
also likely to be better remunerated in that task and to test for the possibility that worker
preferences also influence the allocation across tasks. Moreover, the selectivity correction model
provides additional evidence on the issue of comparative advantage by indicating whether
unmeasured aspects of productivity influence the allocation decision.
There are two difficulties with the selection-correction modelling approach. First, it
requires the imposition of a significant amount of structure on the data. While flexible
distributional assumptions can be used, as in HS, this approach increases the computational
burden and data requirements of the process. Moreover, the fact that consistent estimation of
the wage equation requires use of information from the allocation equation implies that any
misspecification in the latter will also contaminate the estimates of the former.

In Foster and Rosenzweig (1993) we exploited these data by using observations on both1
time wages and piece-rate wages for the same workers regardless of task to draw inferencesabout the roles of information and preferences solely in wage determination. In that analysis, onlyone type of skill was assumed so that comparative advantage was not present. Thus, individualworkers were assumed to have identical productivity across tasks. Observations on workers whowork in multiple tasks and under different payment regimes are used here to test theseassumptions (which are rejected) and to identify the roles of task-specific skills, employerinformation and preferences in task allocations.
3
Second, the approach does not permit an assessment of the role of imperfect information
in the allocation of workers to tasks. Although the parameters of the wage and allocation
equations under imperfect information will be estimated consistently using the selection model,
the approach does not provide insight into the question of whether or not employers have
complete information on worker productivity. Thus, for example, it is not possible to distinguish
between a world in which most women perform a particular task because they have comparative
advantage in it from one in which many women have comparative advantage in other tasks but
are allocated to a particular task because women on average have comparative advantage in
that task and employers cannot differentiate women with comparative advantage in different
tasks (and similarly for men); i.e., statistical discrimination.
In this paper, we show that with data from a labor market in which (1) productivity
estimates for workers are explicitly available and (2) the same worker is observed earning wages
in different activities, tests can be performed of the roles of comparative advantage, information
problems and preferences in determining the allocation of workers across tasks with minimal
imposition of structure not implied by economic theory. The data we use to carry out the tests,
from the Bukidnon area of the Philippines, is also characterized by a marked division of
agricultural tasks by sex (Table 1), and provides information on individual worker's abilities based
on their piece-rate wages. We thus apply the methods to explaining in particular why women1
weed and men harvest.
In section 1, we set out the theoretical and statistical framework that establishes tests for
the existence of comparative advantage and the role of preferences under perfect information in
determining the sorting of workers among tasks based on task-specific piece-rate wage data.
Section 2 expands the framework to incorporate imperfect information and to establish tests of

4
the role of employer perceptions in task allocation when time wages are paid. The estimation
method is briefly described in section 3, which is followed in section 4 by a description of the data
and a discussion of sample selectivity and the determinants of payment regimes. The test results
based on methods which impose no distributional assumptions are presented in section 5, which
also includes a discussion of estimates from the standard probit selection model applied to the
same data. The estimates indicate that in the labor market that we study, which is not atypical of
most rural labor markets of Asia, a one-factor productivity model adequately describes the data,
that more productive workers have a comparative advantage in harvesting relative to weeding
and that productivity differences sort workers across these tasks according to the theory of
comparative advantage. The tests also indicate that the greater presence of female workers in
weeding activities compared to men is not due to women preferring such activities compared to
men; in the piece-rate sector differential productivities and comparative advantage appear to
explain the division of labor by sex. We also find, however, that more than half of the variance in
the true productivity of workers is not known by employers and this ignorance is manifested in the
task allocations by sex in the time-wage market. In that sector, in which employers appear to
select workers for tasks, employers do not prefer men over women in harvesting among workers
perceived to have the same productivity, but the disproportionate presence of women in weeding
among workers compensated by time wages in part arises from statistical discrimination.
Employer expectations about worker productivity, given worker-observed characteristics, are,
however, unbiased. Finally, the normal-distribution version of the selection model provides
results that are broadly but not entirely consistent with the findings that exploit direct information
on the productivity of workers who engage in multiple tasks.
I. Perfect Information Labor Markets
a. Theory
We begin the analysis by examining a labor market environment in which there is
perfect information about worker productivity available to both employers and researchers. We
show the circumstances under which it is possible, with information on actual worker productivity,

wjit jt µji
Although µ is by construction equal to the log of productivity (as measured by output per2i
unit time in task 1), we will in general refer to it simply as "productivity" except when it isimportant to distinguish between actual productivity and its log.
5
(1)
to differentiate among and to test for the existence of three determinants of the allocation of
workers among tasks: (1) differences in the productivity of workers at different tasks
(comparative advantage); (2) preferences of individuals for different types of work, and (3)
preferences of employers for different types of workers.
The role of comparative advantage in task allocation under perfect information is
captured by the Roy model (1951), which has been recently formalized by Heckman and
Sedlachek (1985). The basic features of the model are that each worker i has endowments µ ,ji
one for each possible task j, reflecting the productivity in each of the tasks. In the absence of
preferences of workers and employers for particular tasks or types of workers, respectively, the
allocation of workers to tasks will be the result of each worker choosing the occupation in which
that worker is most highly rewarded given the task prices. Task prices reflect the relative value of
the two activities given the demand for the two types of work on the part of employers as well as
the availability of workers by type. Specifically, if w is the log wage that would be received byjit
worker i at time t working at task j and is the log of the j task price (i.e., the price per unit ofjtth
output in task j) received by worker i at time t then we may write
and the worker will choose task j whenever w >w for all k j. jit kit
While the above model incorporates the possibility that worker heterogeneity is
characterized by multiple productivity factors, a significant simplification arises if one factor is
sufficient--that is if µ = µ where the and µ are task and individual-specific effects, respectively,ji j i j i
and is normalized to one so that µ =µ .This simplification assumes that workers who are more1 i 1i
productive in one task are also more productive in the other task but the percentage by which2

wjit jt jµi
ai 0 µµi
If worker A earns 10 percent more than worker B in task 2 (i.e., if µ =µ +.1) then A32A 2B
should earn ×10 percent more in task 1.1
This assumption is made primarily for purposes of illustration; however, as discussed4
below, it provides a reasonably approximation to agricultural labor markets in many developingcountries including the area of the Philippines that is studied in this paper.
In a two factor world, of course, a =a(µ ,µ ). We focus on the one-factor model for ease5i 1i 2i
of presentation; moreover, as shown below, a one-factor model adequately capture the structureof wages in the rural area of the Philippines that is the focus of our empirical analysis.
6
(2)
(3)
one worker is more productive than another is different in the two tasks. Under these conditions3
the wage equation (1) may be written
Equilibrium in this context with two tasks can be illustrated by a simple figure that plots
the log wage in each task as a function of µ (see figure 1). If both tasks are performed in thei
economy the task prices will adjust (thus shifting the intercepts of the lines in figure 1) to equate
supply and demand in the two tasks. In equilibrium, for >1, there is some M such that the less2
productive workers (those with µ <M) will receive a higher wage in task 1 and thus will choosei
that activity while more productive workers (those with µ >M) will choose task 2. i
If the labor markets operate as a spot market in which workers choose different tasks in4
each period, exogenous changes in the demand for the two tasks will result in changes in the
task prices (thus shifting the intercepts of the two lines) that equilibrate demand and supply for
the two tasks. Figure 1 illustrates the case where there is an increase in the demand for task 1,
which results in a shift in the allocation of workers toward that sector and an increase in the
average productivity of workers in that sector. Workers with intermediate levels of productivity (in
this case those with M<µ <M') will select different tasks at different points in time, and thus thei
share of time allocated by an individual to task 1 and the probability of working at task 1 at all will
be decreasing in µ . If a denotes the share of time spent by individual i in task 1 over a giveni i
interval then we may write, in linear form, the task allocation equation corresponding to (2), as 5

Note that the allocation in any particular period will also depend on the task prices in that6
period. Equation (3) should be thought of as the result of aggregating period-specific allocationdecisions which depend on task prices in the respective period. Thus in a given labor market fora specified interval the task-price effects may be captured as a constant.
7
where and are constants. Note that observed characteristics, x , do not appear in either (2)0 µ i
or (3), as productivity, known by employers and employees, is the sole determinant of worker and
employer choice.6
Incorporation of worker preferences into the model is straightforward. If worker utility at
time t depends on the wage received and the task performed then the share of time spent in the
different activities will depend on tastes for different tasks. The basic structure of the model
changes, however, depending on how tastes are distributed among workers. In the simplest
case where there is no heterogeneity in tastes (e.g., everyone prefers task 1 to task 2), relative
task prices will adjust to reflect the relative desirability of the two tasks and the basic structure of
the model will be unchanged, i.e., equations (2) and (3) are sufficient to describe the wage
economy. If tastes are correlated with productivity but not with observed characteristics x net ofi
productivity then if more productive workers prefer task 2, the relationship between productivity
and the share of time spent in the task 1 will mimic or reinforce the comparative advantage
result, while if the opposite is true it is possible that more productive workers will be observed to
spend less time doing the task in which they have comparative advantage. This latter point is
important because it implies that it may be difficult to distinguish the hypothesis that more
productive workers choose task 1 because they are more productive (and thus better
compensated) in that sector from the hypothesis that more productive workers simply prefer
doing task 1 in the sense that they would undertake that task even if they were not more highly
rewarded for doing it. As we show below, this difficulty can be addressed if there are information
asymmetries.
If tastes for tasks on the part of workers are correlated, but not perfectly, with a k-vector
of observed characteristics x , then the share of time spent in the different activities will bei
related to x net of both productivity µ and task prices. Thusi i
ai 0 µµi xxi
wjit jt jµi jxi
That is equally productive men and women doing the same task will receive the same7
wage even if ceteris paribus men prefer to do one task and women the other. This implication isalso used by HS. If, however, there is imperfect competition, monopsonistic employers mightexploit worker preferences. In that case worker charactersitics observed by employers andcorrelated with worker preferences will enter the wage equation.
8
(4)
(5)
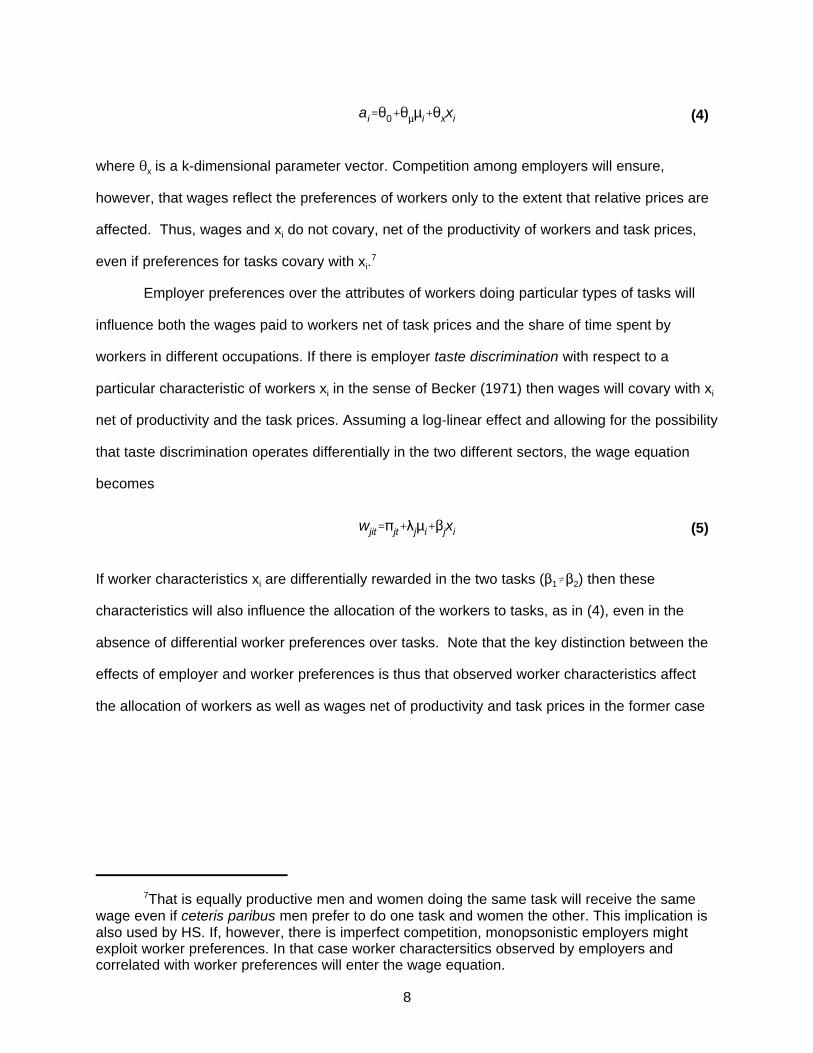
where is a k-dimensional parameter vector. Competition among employers will ensure,x
however, that wages reflect the preferences of workers only to the extent that relative prices are
affected. Thus, wages and x do not covary, net of the productivity of workers and task prices,i
even if preferences for tasks covary with x . i7
Employer preferences over the attributes of workers doing particular types of tasks will
influence both the wages paid to workers net of task prices and the share of time spent by
workers in different occupations. If there is employer taste discrimination with respect to a
particular characteristic of workers x in the sense of Becker (1971) then wages will covary with xi i
net of productivity and the task prices. Assuming a log-linear effect and allowing for the possibility
that taste discrimination operates differentially in the two different sectors, the wage equation
becomes
If worker characteristics x are differentially rewarded in the two tasks ( ) then thesei 1 2
characteristics will also influence the allocation of the workers to tasks, as in (4), even in the
absence of differential worker preferences over tasks. Note that the key distinction between the
effects of employer and worker preferences is thus that observed worker characteristics affect
the allocation of workers as well as wages net of productivity and task prices in the former case

Of course employee preferences will affect wages through their effect on the equilibrium8
task prices; the point is that they do not lead to differential wages by characteristics net of task,productivity, and the task price. Note that, even if it is found that employer preferences areexpressed in wage rates net of task prices, this does not necessarily imply imperfect competition.It is possible that all employers share the same preferences, for example.
We ignore here the possibility that employers only exercise their tastes by excluding9
individuals from particular tasks, in which case this distinction is of little value from an empiricalperspective and of little relevance in the setting which will be the focus of our analysis, wheremost individuals are found to do both tasks. More problematically, using this approach it does notseem possible to distinguish a model based on worker preferences from one in which employersexercise their tastes by excluding individuals from particular tasks but are prohibited by legal orother means from paying different wages to equally productive individuals within tasks.
9
while in the latter the x 's only affect task allocations. These results with respect to thei8 9
correlation of x with wages and task allocations, net of worker productivity and task prices, arei
summarized in the first two columns of Table 2.
b. Identification of the roles of comparative advantage and preferences in the complete
information setting using piece-rate wages
We have shown that by estimating the appropriate wage and allocation equations it is in
principle possible to test for and measure the roles of productivity and preferences in determining
the allocation of workers to tasks in an economy. The principal problem is that, even in the case
of complete information among market actors, the equations include a variable that is not
generally measured - actual worker productivity. Without this information, tests of the hypothesis
that workers are allocated according to comparative advantage have necessarily been based on
methods that impose substantial structure on the data. Moreover, because it is necessary to
condition on worker productivity in order to determine whether employer or worker preferences
importantly influence wages or allocations, test for these effects have generally been
inconclusive.
In this section, we show how tests of the number of unique productivity factors and of the
significance of comparative advantage and of preferences in determining task allocation under
perfect information can be carried out with minimal structure imposed by using data
characterizing an environment, not uncommon in low-income labor markets, in which (1) workers
are paid on a piece-rate basis for some part of the year, so that productivity estimates for

wjit jt µji ejit
µ̂jit µji ejit
µ̂jit (µ̂ji1,µ̂ji2)2(µji)
10
(6)
workers are explicitly available, and (2) the same worker is observed earning wages in different
activities/occupations.
It is easily seen how piece-rate data may be used to conduct an analysis of the allocation
of workers to tasks in the presence of complete information. First note that the piece-rate wage
earned by a worker in a particular task on a given day is the product of the piece-rate price for
that task on that day and the amount produced in that day (productivity), where the latter consists
of a persistent component reflecting the amount of work done by the individual and a residual
reflecting measurement error and idiosyncratic variation arising from, for example, the fact that
variation in crop density will imply that the amount of crop picked by a given worker will vary from
day to day. Taking logarithms yields the wage equation (1) plus an error term:
In order to use piece-rate data to obtain productivity estimates from equation (6), it is first
necessary to obtain estimates of the piece-rate price terms. OLS cannot be used for this
purpose, however, for the reasons discussed in HS. If two piece-rate observations are observed
for a sub-sample of the population, however, consistent estimates of may be obtainedjt
(exclusive of a constant) by estimating equation (6) in first differences (within individuals). The
fact that a sub-sample of individuals with two piece-rate observations is not necessarily a random
sample of the population presents no particular problem for the estimation of the because, byjt
assumption, all individuals face the same task price. By subtracting task-price effects from the
piece rate wages one is left with consistent estimates of worker productivity
If it is additionally assumed that the measurement errors are uncorrelated, the covariance
of two of the estimates of for the same task, , provides a consistent
estimate of the variance of task-specific productivity in the population among those with at least
two piece-rate observations in that task. Moreover, by further imposing the plausible restriction
that the variance of the measurement error term is the same across all workers, a comparison of
the measured variance of µ among those workers with only one piece-rate observation to theji
same measure taken from the population with more than one piece-rate observation provides a

w1it µi e1it
wjit jµi ji ejit
(wjit,w1it) j2(µi)
(w1i1,w1i2)2(µi)
(wji1,wji2)2
j2(µi)
2( ji)
2(µ̂jit) 2(µ) 2(ejit)
11
(7)
(8)
(9)
(10)
(11)
test of whether the variance in productivity within the two groups is the same because
.
It is also possible to test whether a one-factor model adequately describes the distribution
of productivity across workers. Consider a respecification of (6) in which we normalize according
to one occupation or task (and supress the task prices). Assume that the log piece-rate wage for
individual i in occupation 1 at time t is given by
Then for any other occupation j the log piece-rate wage for the same individual is given by (8) if
there is a unique productivity factor for that occupation
where is the occupation-specific productivity factor for individual i and is an occupation-ji j
specific parameter.
With two piece-rate observations for each occupation inclusive of the normalized
occupation it is possible to identify the variances of the normalized or common productivity factor
µ and the task-specific productivity factors as well as to identify the as long as the time-i ji j
varying productivity shocks e are orthogonal. In that case, the observed sample moments, forjit
two piece-rate wage occupations, are given by:
There are three independent equations derived from the four wage observations relating
the three observed moments to the three model parameters. Thus, the variances of the common
and occupation-specific productivity factors are identified and it is possible to test whether a one-

µ
(ai,wji1) (xi,xi) (ai,xi) (wji1,xi)
(wji1,wji2) (xi,xi) (wji1,xi)2
x
(ai,xi) (wji1,wji2) (ai,wji1) (wji1,xi)
(xi,xi) (wji1,wji2) (wji1,xi)2
Because task prices estimated in this way are only determined up to a constant, this10
approach will not identify employer discrimination by sex if that discrimination results in aconstant sex-premium across tasks and time periods. Unfortunately the data set we use does notcontain information on piece-rate prices that might otherwise be used to address this issuedirectly. In any case, it seems unlikely that employers would use different piece-rate prices fordifferent individuals doing the same task in the same period even if they paid different wageswhen compensating these individuals on a time-rate basis.
12
(12)
(13)
factor model is adequate, i.e, ( )=0. In the one-factor case, the parameter , which is also2ji j
identified, characterizes the extent of comparative advantage across the two tasks.
With additional information on worker allocations in the piece-rate sector, it is also
possible to test for the operation of comparative advantage and worker preferences in the
allocation of workers to tasks within a sector where problems of imperfect information do not
arise. In particular, the allocation equation (equation 4) parameters reflecting the operation of
comparative advantage and of preferences in terms of the observed moments for the wages and
task allocations are:
and
where it has been assumed for notational simplicity that x is a scalar. As discussed, ifi
comparative advantage plays a role in occupational allocations, then 0 and in the absence ofµ
worker preferences that are related to measured characteristics of workers, occupational
allocations should not be influenced by any measured characteristic x net of actual productivityi
so that =0. Testing for employer preferences is more difficult because both wages andx
allocation are influenced under this variant of the model; however, following a suggestion of HS
some insight can be gained by comparing separate estimates of piece-rate prices for individuals
with different characteristics. 10

µi µi ui
w Tjit
Tjt lnE(e
Tj µi xt)
Tjt
Tj µi ln e
Tj udFu(u)
Tjt
Tj µi
Tj
This assumption will hold, for example, if log-productivity is a linear function of worker11
attributes only some of which are observable to the employer and the vector of unobservablecharacteristics can, in turn, be written as a linear function of the observable characteristics andan i.i.d. (across individuals) error vector. Among other things, this restriction rules out thepossibility that information is more precise for individuals with greater exposure to the labormarket as shown by Foster and Rosenzweig (1993) in the context of India. This assumption isnecessary in order for the log time wage to be written as a linear function of µ * and a task-ispecific constant (see equation (15)).
13
(14)
(15)
2. Imperfect Information in the Labor Market
a. Theory
The principal additional implication for the allocation of workers across occupations in the
absence of complete information on worker productivity is that employers are unable either to
match perfectly workers to jobs or to attract the right workers to the right jobs by adjusting wages
appropriately and thus must use observable characteristics to assign wages and determine
allocations. To capture this idea in the existing framework let µ *=E(µ |x ) denote the expectationi i i
of the log of productivity based on characteristics known to the time-wage employer and assume
that the actual log of productivity may be written as the sum of µ * and a residual u withi i
distribution F that does not depend on x :u i11
Then because competition among employers will ensure that the wage received by individual i is
equal to the expected value of having him work at task j (i.e., his expected productivity given
observed characteristics x ), his log time wage w , may be writteni jitT
where the superscript T identifies the log wages and prices as those associated with time-rate
employment. Note that equation (15) differs from equation (2) by the presence of the constant jT
and by the fact that µ *, expected log productivity, appears in the wage equation rather than µ . Iti i
is worth noting that the fact that is a task-specific constant implies that in a comparison of twojT

a Ti
T0
Tµ µi
Tuui
Txxi
14
(16)
individuals, the one with higher expected log productivity will also have higher expected
productivity and thus a higher time wage for the same task and time period.
Allocations under time wages may be characterized using a figure analogous to figure (1)
by replacing µ on the horizontal axis with µ *; there will now be some intermediate level ofi i
expected productivity such that those workers with characteristics yielding an expected
productivity above that level will receive higher wages if they work at task 2, while those with an
expected productivity below that level will receive higher wages if they work at task 1. Thus in the
absence of preferences over particular tasks by the workers and over particular types of workers
by employers, the share of time allocated by an individual to task 1 will depend, analogously to
the perfect information case, only on his expected productivity and task prices; x will not covaryi
with tasks net of µ *. However, again analogously to the perfect information case, when workersi
are heterogeneous in preferences for tasks that are correlated with employer observable
characteristics of the worker x , the share of time spent in task 2 (weeding) will depend oni
expected productivity as well as x but wages will not covary with x net of µ * and task prices, asit i i
in (4).
In the imperfect information environment it is possible that worker task preferences are
correlated with characteristics that are unobservable to the employers and also correlated with
productivity (including productivity itself). Thus the allocation equation under these circumstances
includes not only µ * and x but also u , so that:i i i
This equation allows us to distinguish the comparative advantage hypothesis from the hypothesis
that more productive workers simply happen to prefer to undertake the task in which they have
comparative advantage, a distinction which, as noted above, cannot be made in the perfect
information case. The idea is that workers with similar levels of expected productivity, µ *, willi
receive similar time wages; thus if workers with higher u are found to be spending more (or less)i
time in the sector in which they have comparative advantage, then we may infer that worker
w Tjit
Tjt
Tj µi
Tj
Tj xi
Of course, if preferences are not correlated with the unpreceived component of worker12
productivity, it is possible that =0 while preferences may still play a role in the distribution ofuT
workers across occupation.
15
(17)
preferences are importantly influencing the allocation of workers to tasks.12
Finally, insights drawn from the complete information case are also applicable in the case
of employer preferences: taste discrimination by employers will imply that workers with particular
observed characteristics will receive higher wages given their expected productivity, a fact that
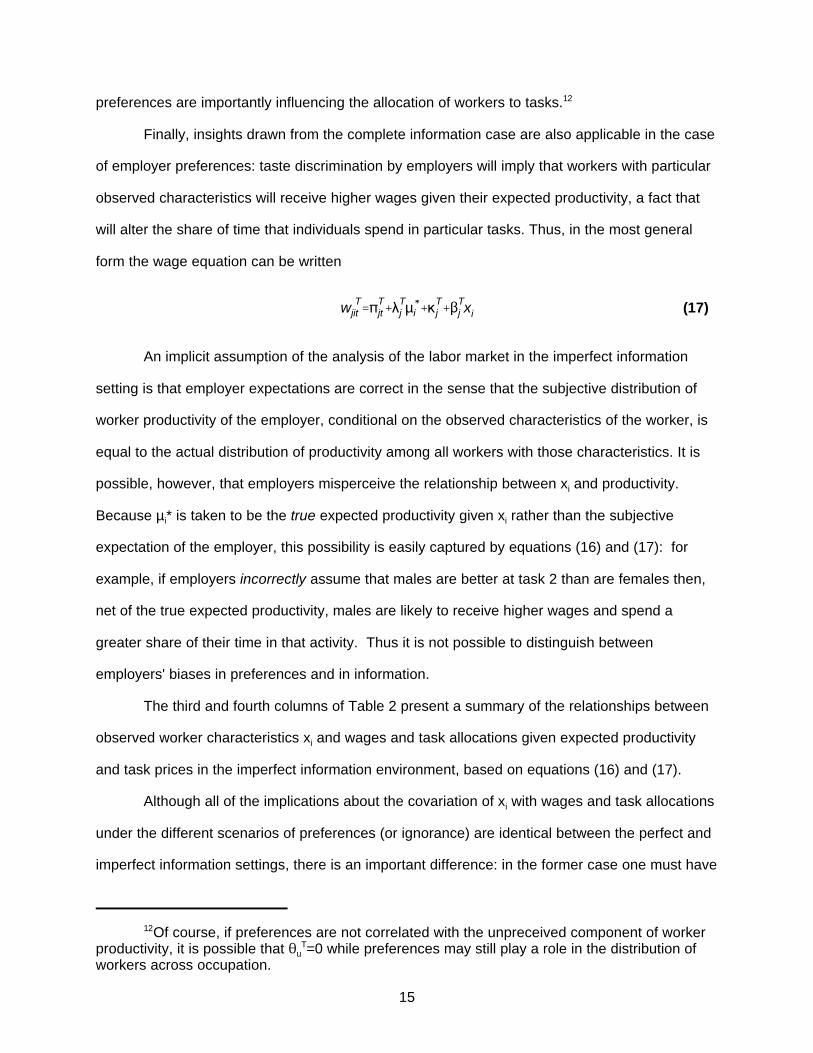
will alter the share of time that individuals spend in particular tasks. Thus, in the most general
form the wage equation can be written
An implicit assumption of the analysis of the labor market in the imperfect information
setting is that employer expectations are correct in the sense that the subjective distribution of
worker productivity of the employer, conditional on the observed characteristics of the worker, is
equal to the actual distribution of productivity among all workers with those characteristics. It is
possible, however, that employers misperceive the relationship between x and productivity. i
Because µ * is taken to be the true expected productivity given x rather than the subjectivei i
expectation of the employer, this possibility is easily captured by equations (16) and (17): for
example, if employers incorrectly assume that males are better at task 2 than are females then,
net of the true expected productivity, males are likely to receive higher wages and spend a
greater share of their time in that activity. Thus it is not possible to distinguish between
employers' biases in preferences and in information.
The third and fourth columns of Table 2 present a summary of the relationships between
observed worker characteristics x and wages and task allocations given expected productivityi
and task prices in the imperfect information environment, based on equations (16) and (17).
Although all of the implications about the covariation of x with wages and task allocationsi
under the different scenarios of preferences (or ignorance) are identical between the perfect and
imperfect information settings, there is an important difference: in the former case one must have

Tx
(a Ti ,xi)
2(µi ) (a Ti ,µi ) (xi,µi )
2(xi)2(µi ) (xi,µi )
2
a Ti
˜T0
˜Tµµi
˜Txxi
˜Tx
(a Ti ,xi)
2(µi) (a Ti ,µi) (xi,µi)
2(xi)2(µi) (xi,µi)
2
N1 (a Ti ,xi)
2(ui)
N22(xi)
2(ui)
˜Tx
Because actual productivity is, in effect, a noisy estimate of employer-perceived13
productivity (equation 14), this result is simply a manifestation of measurement-error bias.
16
(18)
(19)
(20)
available a measure of actual worker productivity while in the latter case one must identify that
component of worker productivity that is known by employers. Inferences drawn from
relationships (4) and (5) involving actual productivity when employers are partially ignorant of true
productivity can be incorrect. It may be established, for example, that the coefficient on an xi
variable in the allocation equation (16) in terms of the moments of the observed variables and
perceived productivity µ * isi
Consider, now an alternate version of equation (16) with expected productivity replaced with true
productivity, (µ replaced by µ ), and dropping u for simplicity:i i i*
Now the analog to equation (18) is
where N and N denote the numerator and denominator of equation (18), respectively.1 2
In the absence of worker preferences with respect to tasks and employer taste
discrimination =0 and thus N =0. But under these circumstances will not be zero if both x 1
(u )>0 and (a ,x )>0. The first of these conditions is exactly the condition that some aspects2 T 13i i i
of productivity are not known by time-wage employers. The second says that x is correlated withi
a as will be the case if x is known by the employer and correlated with productivity. Thus, thei iT
finding that identically-productive workers with different values of x have different distributions ofi
time in different tasks does not necessarily imply either that workers have preferences with
respect to tasks or employers exercise taste discrimination in environments where employers are
µi yi it
Assuming a one factor model, it does not matter from which task the piece and time-14
rate wages are taken as long as there is sufficient information on both tasks to obtain a preciseestimate of the parameter . Thus, to simplify subsequent discussion it will be assumed that,2unless otherwise stated, all piece-rate wages are from task 1 and all time wages from the sametask (either 1 or 2).
17
(21)
partially ignorant of worker productivities and use x as a productivity signal. i
An analogous equation holds for wages: if true productivity is used instead of perceived
productivity to estimate equation (17) worker characteristics that are known by the employer and
predict productivity will appear to affect wages even when structurally =0. This, along with thej T
differential allocation across tasks reflect, of course, statistical discrimination (see, e.g., Aigner
and Cain 1977): among workers with the same true productivity, that worker with the higher
employer-perceived productivity will receive a higher wage in both tasks, receive a higher
differential wage in the high-wage task (due to comparative advantage), and work more in the
high-wage task as a result.
b. Estimation under incomplete information using piece-rate and time wages
As noted, in the presence of incomplete information the problem of identifying the
determinants of task allocations is more complex because, even when actual productivity is
known, it is also necessary to obtain an estimate of that component of actual productivity that is
perceived by employers. While direct observations of expected productivity are not available, we
now show that the key parameters of the allocation and wage equations (assuming a one factor
model) can be estimated consistently using information for each worker on one piece-rate wage
observation (w ), one time-wage observation (w ), and at least one worker characteristic thatj1t j1tP 14 T
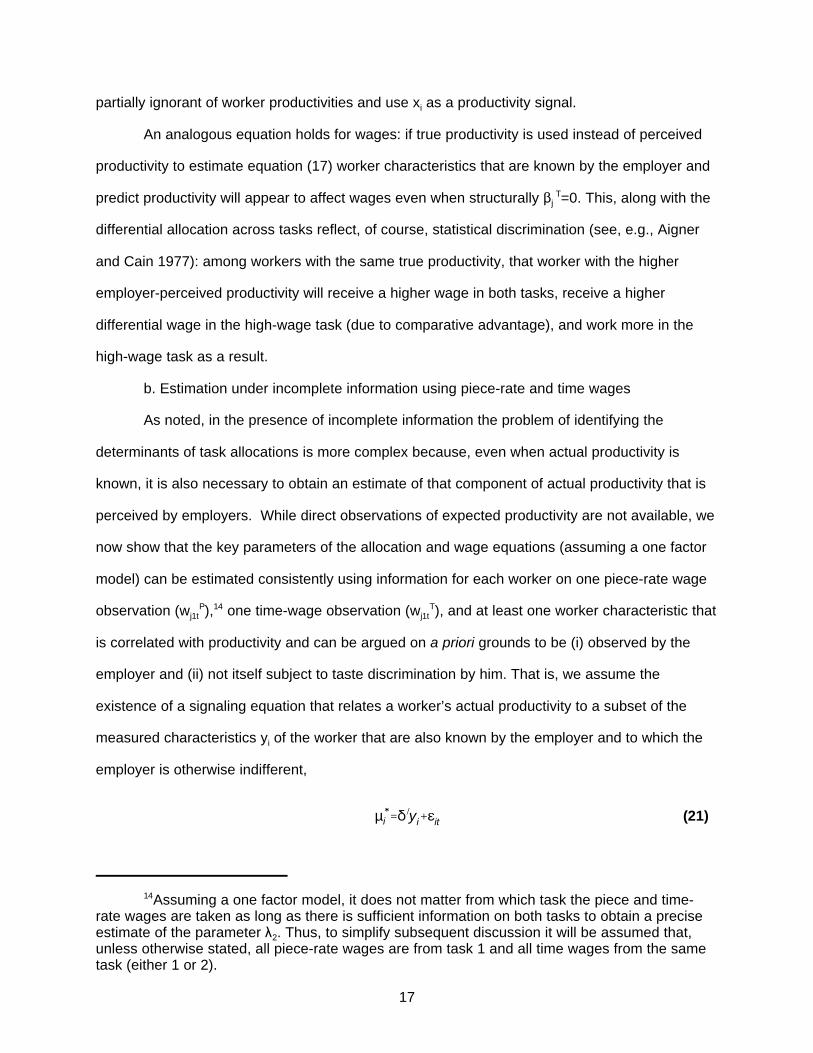
is correlated with productivity and can be argued on a priori grounds to be (i) observed by the
employer and (ii) not itself subject to taste discrimination by him. That is, we assume the
existence of a signaling equation that relates a worker’s actual productivity to a subset of the
measured characteristics y of the worker that are also known by the employer and to which thei
employer is otherwise indifferent,
Tj
(yi,wT
i1t)
(yi,wP
ijt )
2(µi )(w P
i1t,wT
ijt ) (yi,wP
ijt )
(yi,wT
i1t)
Analogous but more complicated expressions that allow for 0,can also be derived.15 Tj
The estimates that we obtain, described below, allow for the most general model.
18
(22)
(23)
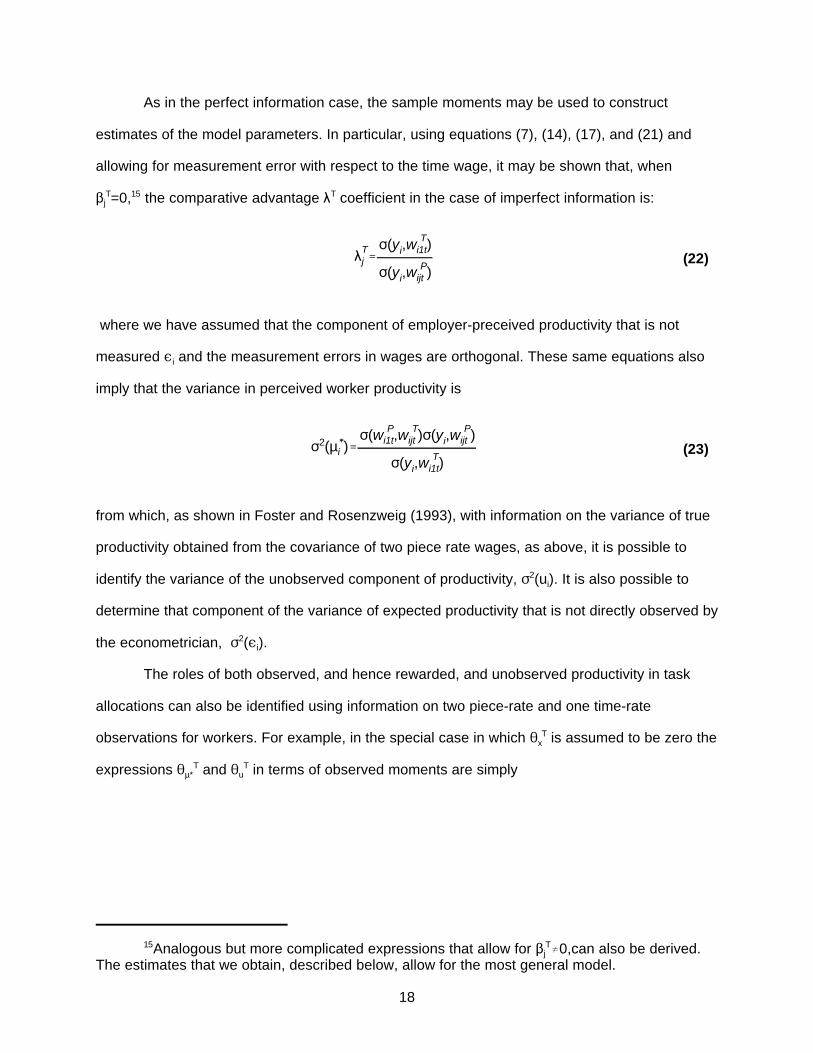
As in the perfect information case, the sample moments may be used to construct
estimates of the model parameters. In particular, using equations (7), (14), (17), and (21) and
allowing for measurement error with respect to the time wage, it may be shown that, when
=0, the comparative advantage coefficient in the case of imperfect information is:jT 15 T
where we have assumed that the component of employer-preceived productivity that is not
measured and the measurement errors in wages are orthogonal. These same equations alsoi
imply that the variance in perceived worker productivity is
from which, as shown in Foster and Rosenzweig (1993), with information on the variance of true
productivity obtained from the covariance of two piece rate wages, as above, it is possible to
identify the variance of the unobserved component of productivity, (u ). It is also possible to2i
determine that component of the variance of expected productivity that is not directly observed by
the econometrician, ( ).2i
The roles of both observed, and hence rewarded, and unobserved productivity in task
allocations can also be identified using information on two piece-rate and one time-rate
observations for workers. For example, in the special case in which is assumed to be zero thexT
expressions and in terms of observed moments are simply µ* uT T

Tµ
(w p1i1,a
Ti )
(w p1i1,w
T1i1)
Tu
(w p1i1,a
Ti ) (xi,w
T1i1) (w T
1i1,aT
i ) (xi,wp
1i1)
(w p1i1,w
p1i2) (xi,w
T1i1) (w p
1i1,wT
1i1) (xi,wp
1i1)
Recall that if the preferences of the worker depend on productivity, expected productivity16
may vary by task if the willingness of a worker to do a task in a particular period signalssomething additional about his productivity to the employer. In this case, expected productivity ina particular period (as measured from one time-rate wage equation) will be a noisy estimate ofaverage expected productivity, thus biasing the coefficient on expected productivity to zero. Evenif this is the case, however, this specification may be used to test for the effect of unobservedproductivity on allocation to task.
19
(24)
(25)
and
respectively. Even when all measured worker characteristics x are included in the allocation
equation; exclusion of at least one characteristic from the wage equation (i.e., the assumption16
that there is at least one worker characteristic about which employers do not care other than as a
predictor of productivity ) is sufficient for identification of all of the parameters of the allocation
equation.
3. Estimation Method
The estimation method that we use to implement the test of the two-factor model and to
obtain the estimates of the task allocation and wage equations matches the theoretical moments
of the system of equations, e.g., the right-hand-sides of equations (9) through (11), denoted by ,
to the sample moments, e.g., the left-hand-side variables in (9) through (11), denoted by M. The
objective function Q=(m- ( ))' (m- ( )) is minimized with respect to the parameter vector ; m
is the vector of elements obtained by stringing out the lower triangular elements of the matrix M,
( ) is the corresponding vector obtained from which depends on the set of model parameters
, and is a weighting matrix. The weighting matrix is that which corresponds to the "optimal
minimum distance" estimator discussed by Chamberlain (1982, 1984), also known as the optimal

This estimator was used by Abowd and Card (1989) to estimate an error components17
model of U.S. wage rates.
An important assumption of the tests that we have discussed is that productivity as18
measured in the piece-rate labor market is a relevant measure of productivity in the time-wagelabor market. There are a number of potential problems with this assumption. It might be argued,for example, that productivity differentials depend on differences in effort in addition to differences in fixed characteristics like strength or skill level. Because the returns to effort are
20
weighting matrix (OWM) or arbitrary generalized least squares estimator (AGLS) estimator This17
estimator yields consistent parameter estimates and standard errors without imposing any
parametric distributional assumptions.
As noted, for all of our tests we need at least two measures of productivity (piece-rate
wages) for the same task for each worker to identify the relevant parameters of each equation.
This is because each task-specific piece-rate wage is a noisy measure of productivity but each
measure can be used, in effect, as an instrument for the other. However, more efficient
estimates can be achieved by including groups of workers for whom we have only one
productivity observation under the assumption that the parameters including the variances in
measurement errors and in all other unobserved constructs, such as productivity µ, are the same
for all workers The generalization of the OWM method to multiple groups, with cross-group
parameter constraints, is straightforward. As noted, if it assumed only that measurement error
variances are the same for workers regardless of their participation in task and payment regimes,
then it is possible to perform identification tests involving the assumption of equality for subsets
of parameters across groups. In particular, tests, reported below, of the equality of the group-
specific variances of productivity µ provide information on whether subsamples of workers
chosen on the basis of payment regime (which determines whether or not productivity is
measured) or task are representative of the entire population of workers.
4. The Data and Sample Selectivity
The critical information needed to identify the operation of comparative advantage and of
preferences, if any, in determining the allocation of workers across occupations or tasks that
does not require auxiliary assumptions is the productivity of workers. As noted, one important
indicator of worker productivity is a worker's performance under a piece-rate regime. The data18

greater when an individual is paid on a piece-rate basis than when he/she is paid time wages,one would expect greater differences in productivity in the piece-rate and the time wage sector.While this argument has merit, it should be recognized that because individuals with morefavorable endowments (e.g. those with greater strength or skills) will need to provide less effortto produce the same output as those with lower endowments, these workers are likely to do moreeffective work in a given day than workers with less favorable endowments in both sectors. Thuswhile differences in the return to effort in the two sectors will affect productivity differentials, it willnot affect the ranking of workers by productivity.
Although we focus on the distinction between piece-rates and time-wage earnings, there is19
some heterogeneity in the form of payment within each type of work. Piece-rates includes cashpayments on a unit basis as well as in-kind payments that are a share of the harvest. It shouldalso be noted that the appropriate unit to be used in the piece-rate payment for plowing orweeding may, for example, be the plot of land.
58.7 percent of men and 31.5 percent of women aged 18-59 in the sample households were20
observed to work at least once in the labor market.
21
used in this paper are well-suited to an analysis of these issues. They are from a stratified
random panel of 448 farming households in Bukidnon in northern Mindanao, Philippines where,
as is typical of agriculture in the Philippines, piece-rate and time-wage work coexist. These19
households were interviewed in four rounds at four month intervals in 1984-85 as part of an
International Food Policy Research Institute study by Bouis and Haddad (1990). In addition to
detailed information on agricultural production (principally of corn, rice and sugar cane) and basic
anthropometric and demographic information for each household member that may be relevant
to productivity and plausibly known by employers, the survey provides extensive information on
labor market activity in the study area.
For every individual in the sample households and in each round we observe days
worked off the farm and average daily wages received by crop, task and type of payment (piece-
rate versus time-wage). Information on days worked by family and hired laborers on the farm20
and supervisor-days by crop, task and type of payment is also available for each study household
in each round. Thus each round provides averages of (t-specific) daily spot-market prices and
aggregates of the binary task allocation decisions made in each daily spot market. We use the
totals across all four rounds of task-specific days to construct measures of task allocations by
form of payment for each worker. Individual observations on wages are based on the reported

In order to carry out the various stages of the analysis detailed in the previous section it21
is necessary to use samples of workers with varying numbers of harvesting and weedingobservations by form of payment. Table A in the Appendix presents a breakdown of the sampleof weeding or harvesting wage workers for various combinations of payment-method and tasks.
22
average wages in each round by task so that a worker with two task-specific wage “observations”
under one payment regime is a worker who has worked at least one day in two different rounds
at that task under the specified payment regime.
The tasks performed by all workers are divided into four categories - plowing and sowing,
weeding, harvesting and other. More than 93% of wage workers, totalling 657 workers, perform
both weeding and harvesting activities over the course of the four-round sample period, and
weeding and harvesting account for 94% of all days spent by agricultural wage workers in
agricultural activities. We thus focus on the allocation of time between these major task
categories. The allocations of work time by men and women across these two tasks are similar
to those reported in Table 1 with respect to all tasks - among these workers, of whom 62% are
men, of the days spent either harvesting or weeding for time wages across all four rounds, men
and women spend 63.2% and 93.7% of their days weeding, respectively. The corresponding
figures for piece-rate days are 18.4% and 30.0%, respectively.21
Our strategy is to exploit the piece-rate data provided for workers who work for piece
rates to test first whether a one-factor productivity model accurately characterizes the data and
then, on the basis of that structure, to test the hypothesis that comparative advantage and/or
worker preferences are reflected in the task allocations, under the reasonable assumption that
neither information problems nor wage discrimination afflicts piece-rate payment regimes. For
testing issues of asymmetric information and discrimination the tests require that we have
information on time-wage workers who also receive at least one piece-rate wage, to gauge their
productivity. It is important therefore to assess the selectivity of subsamples of such workers
chosen on the basis of payment regimes. In particular, it should not be the case, as was
evidently true in the United States in the late nineteenth and early twentieth centuries (Goldin
(1986)), that women primarily work in piece-rate jobs while men work for time-wages.

This gives rise to the possibility of adverse selection, with those workers having higher22
levels of u, that part of productivity unobserved by employers, being more likely to participate inpiece-rate tasks when offered the choice. Evidence of this tendency is provided in Foster andRosenzweig (1993).
The following logistic regression was estimated using the sample of wages by task and type23
of payment weighted by the number of days worked:logit PIECE = -.997 - .1043 MALE + 3.390 CORNHARV
where PIECE is one if the task is paid using piece-rates, MALE is one for males, andCORNHARV is one if the task was corn harvesting. The hypothesis that coefficient on MALE isnot significantly different from zero is not rejected at conventional levels of significance (p-value=.474). Note that the fact that women are not "crowded" into piece-rate jobs suggests theabsence of taste discrimination, although it is not inconsistent with statistical discrimination.
Although 34.1 percent of all those who work in the labor force are only observed to24
contribute one observation, these individuals contribute relatively few days to the labor market.Specifically, those contributing observations with both forms of payment contribute 0.5 percent ofall days to the labor market.
23
Employment under both payment regimes, however, is the norm for both men and
women in the study area over the course of the study period. This is in part due to the fact that at
certain times of the year only one or the other form of payment method is offered due to differing
time-sequences of agricultural tasks across employers. During other parts of the year, both
piece-rate and time-wage jobs are available. Of adult workers in the sample households who22
contribute at least two observations to the labor market data (i.e., at the very least they
performed the same job in two different rounds or different jobs in the same or different rounds),
70.7 percent of men and 67.7 percent of women worked both for piece-rate and time wages. Of
workers with at least four wage observations during the sample period, 89 percent of women and
82 percent of men received both time and piece-rate wages. Moreover, although women are
more likely to be in the labor market during the corn-harvest period and are therefore more likely
to be paid piece rates (which are typically paid during corn harvest operations), net of this
particular activity we cannot reject the hypothesis that men and women are equally likely to do
piece work. This is not surprising, given that neither men nor women are attached to particular23
employers. Long-term contractual arrangements serving as disciplinary mechanisms are absent
and differentials in labor-force commitment, which do vary by sex in this setting, are irrelevant.24
Thus, those workers who are employed under both time-wage and piece-rate regimes do not

24
constitute an especially select sample of rural Philippines labor market workers as a whole.
Although the evidence suggests that worker characteristics do not appear to be related to
payment method, the type of agricultural activity does affect the likelihood that piece-rate or time
wages are used. In particular, harvesting activities are far more likely to be paid on a piece-rate-
basis (59.1% of all harvesting days are compensated by piece-rate wages) compared to weeding
activities (14.6% of weeding days). As a consequence, less than a third of workers are observed
to have worked at least once as both weeders and harvesters for piece-rates. Is this group of
workers selective with respect to productivity? What affects payment type within task? One
important factor is that the relationship between supervisory costs and the number of workers
employed is quite different in the two payment regimes. For example, when few workers are
employed on a time-wage basis then these workers are typically monitored by having them work
alongside family members--there is no need for any individual to give up other productive
activities to supervise these workers. As the number of workers increases, however, this
situation changes and explicit supervision becomes necessary. By contrast, under piece rates,
because of the need to monitor output (so that appropriate compensation can be paid), someone
must be available to supervise even one worker. Because one supervisor is likely to be able to
keep track of the output of a number of workers, the supervisory cost per worker is likely to be
decreasing in the number of workers employed in the piece-rate sector. By implication
supervisory costs per worker may be lower under time wages when there are relatively few
workers and under piece rates when a larger number of workers are hired.
To affirm that costs of supervision are associated with payment regimes within the same
task or crop, we regressed the number of supervisor-days per hired-worker-day on the number of
hired labor days categorized by type of wage contract for each of the study households that
employed wage workers. Because we anticipated that the choice of piece work and the number
of hired workers may in part reflect differences in supervisory costs associated with employer
attributes we removed employer-specific fixed effects. The fixed-effects estimates, reported in
Table B in the Appendix, indicate that, for a given farm and within an activity, supervision costs
per worker decrease significantly with the number of piece-rate labor days and increase

piece 1.95 .307plow .618weed 3.24harv(15.5)(2.60) (6.66) (30.3)
.871sugar .122rice .235corn .0584land(7.85) (0.98) (1.53) (12.8)
This figure is obtained by equating the predicted supervisor costs in time-wages and piece-25
work as a function of labor days in a particular round and dividing by the average number of daysper round (120):
1.64 = 10 *.0780/(120*(.0203+.0193)).2
Decisions about the relative advantage of piece-work versus time-work will also reflect26
differences in the profitability of the two types of payments net of supervisory costs; however, aslong as differences in per-worker profitability net of supervisory costs are not systematicallyrelated to the number of workers employed, the conclusion that piece-work will be moreadvantageous for large employers will be maintained.
25
(26)
(although not significantly) with the number of time-wage labor days. There seem to be fixed
costs associated with piece-rate supervision, thus making piece-rates most useful in periods
when many workers are employed and, presumably, on farms that employ large numbers of hired
laborers. The point estimates indicate that supervisory costs will be lower for piece rates than for
time wages when the number of workers per day employed in a particular task exceeds 1.64. 25 26
If per-worker supervisory costs are lower when relatively large numbers of workers are
employed then we should observe that large farms are more likely to employ workers on a piece-
rate basis for a given task compared to small farms. In order to test this hypothesis we estimated
a logistic regression, weighted by days worked, relating piece-rate use to task, crop and owned
area. The resulting estimates clearly show that large farms are more likely to use piece-rates:
where "piece" represents piece-rate payments, "land" is owned land area, and the other variables
control for crop and task (asymptotic t-ratios are in parentheses).
These analyses thus indicate that most wage workers are employed under both of the
two basic payment methods and that, within tasks, payment form depends importantly on the
characteristics (size) of the employer and does not appear to vary with the sex of workers. An
important implication of this is that because the same employer is not likely to employ the same
worker for both piece-rate and also for time-rate wages in the same task, the existence of
information on workers' individual productivity in the economy, based on piece-rate performance,

We find that although relatively few individuals contribute to this sub-population, the27
selectivity appears to be based on the availability of both piece-rate tasks in different regionsrather than aspects of the workers themselves.
26
does not necessarily mean that the information is well-diffused among employers. The
Philippines setting thus appears to be well-suited to an investigation of the roles of both
comparative advantage in the piece-rate sector and information constraints and employer
preferences in the determination of (time) wages.
5. Results
a. Is there only one productivity factor?
In order to carry out the tests of the determinants of the distribution of workers across the
weeding and harvesting activities and the role of sex and other visible worker characteristics in
task allocations, it is first necessary to test whether a two-factor or one-factor productivity model
best fits the data - whether weeding and harvesting skills are distinct. To do this requires, as
noted, a sample of workers with two-piece rate observations in both weeding and harvesting in
order to eliminate the influence of measurement error. A problem with this test is that the
estimates are obtained from a sample that may not be representative of the population as a
whole. In particular, if this sub-sample is a small part of the sample of wage workers then the
power of the test is likely to be reduced because those doing both tasks are likely to be especially
good (or especially bad) at both. However, if the one factor model does accurately characterize27
the data, then because is a parameter rather than the moment of a selected population1
estimates of based on those who do both piece-rates will be relevant to the population at1
large.
As was discussed, payment methods within tasks appear to be a function of land size
and perhaps other technical features of agricultural production but not workers. Indeed, in the
Bukidnon sample, in only five of the 29 barrios surveyed does one observe any significant
proportion (more than 9%) of worker-days allocated to weeding compensated by piece-rates.
Such work is not available at all in more than half of the barrios. Moreover, as expected, in the
five barrios with significant piece-rate weeding work, average landholdings are 54% larger than

27
those in the other barrios (6.97 versus 4.54 acres), a difference that is statistically significant at
the .007 level. To perform the test of the one-factor model therefore, we use the subsample of
wage workers who resided in the five barrios where weeding under piece-rates is a significant
option. The number of workers working for piece-rates in those barrios with at least one wage
observation in both weeding and harvesting is 83, which is 81% of all wage workers who
harvested or weeded in that barrio.
In testing the one-factor model, in order to minimize the selectivity of the sample we used
all of the 81% of workers with at least one piece-rate observation in both activities across the
four rounds. These piece-rate workers consist of three groups: (i) those workers who worked in
at least two rounds in each activity across all four rounds of the data, the sub-sample minimally
necessary and sufficient for identification of the model; (ii) those who worked in at least two
rounds in harvesting and in only one round in weeding and (iii) those workers who worked in only
one round in each activity. Under the assumption that the measurement error variances in each
group are the same, we can test whether the productivity variances are identical across groups
and thus the validity of treating all of these workers as if they were drawn from the same
distribution.
Table 3 reports the estimates and test statistics for the one- and two-factor models
estimated from the three-group sample using moment equations (9), (10), and (11) augmented to
allow for task prices (round and task-specific dummies, which are not reported). The first column
reports the estimates under the assumption that there is one factor. This model fits the data as
indicated by the chi-square statistic, which indicates whether the set of 15 restrictions on the
data implied by the model are rejected. The addition of the second factor (the relaxation of one
restriction), reported in the second column, does not add significantly to the model fit. Thus the
assumption that there is one skill type with respect to weeding and harvesting is not rejected. In
both models we also could not reject the hypothesis that the productivity variances, measured
with evident precision, are equal across the three groups. The estimate of in the one-factor2
model in column one, also estimated with precision, indicates that those workers that are more
productive receive a greater return in harvesting then in weeding; more productive workers
28
evidently have comparative advantage in harvesting.
b. The comparative advantage hypothesis and worker preferences in the piece-rate
sector
The comparative advantage hypothesis and the estimates in Table 3 imply that more
productive workers should allocate themselves within the piece-rate sector, where employer
preferences and information are irrelevant, disproportionately to harvesting. To test this
hypothesis along with the hypothesis that women prefer to weed relative to men net of
productivity differences, we estimated the allocation equation (4) in the piece-rate sector using
the OWM method using all workers who worked in at least one round for a piece-rate harvest
wage. These workers were divided between those who worked in at least two rounds for harvest
piece-rate wages and those with only one piece-rate harvest wage and the constraint was
imposed that the measurement error variances are equal across groups. Given this assumption,
we could not reject the hypothesis that the µ variances are also equal.
The first column of Table 4 reports the OWM estimates of the effect of increased
productivity on the likelihood that a worker weeds (proportion of all piece-rate days across the
four rounds spent weeding) based on the restricted model, which cannot be rejected, that
workers in the groups differentiated by the number of harvest piece-rate observations have the
same productivity distribution. This estimate, which is precise, indicates that more productive
workers, who have a comparative advantage in harvesting (Table 3), are less likely to be
observed weeding. The column-two estimates indicate, moreover, that net of productivity,
women are no more likely than men to weed; there is no evidence that women prefer weeding
compared to men. The model fits the data, suggesting that in the piece-rate sector comparative
advantage, and not worker preferences, explains the allocation of men and women across the
harvesting and weeding tasks.
c. Comparative advantage and discrimination in the time-wage sector
To test whether comparative advantage operates in the time-wage sector and to test
whether there is discrimination in that sector with respect to sex, we use a sample of workers
with at least two harvest piece-rate wage observations (from which we obtain an estimate of their

It is worth noting that, at least in principle, the extent of imperfect information and its28
implications for worker allocations could be different for the small subset of wage workersinvolved only in time-rate employment who are, of necessity, excluded from the analysis. If, forexample, information were more precise for time-rate only workers compared to those workingfor both forms of payment, then the estimates presented below might somewhat understate theextent to which more productive workers are allocated to harvesting in the time-wage sector as awhole although they would accurately portray the situation among the vast majority of workers(i.e., those working for both forms of payment). The fact, as discussed below, that those time-rate workers with only one piece-rate observation do not differ significantly from those withmultiple piece-rate observations suggests, however, that the extent of this difference, if present,is likely to be small.
29
productivity robust to measurement error) and at least one time-wage observation combined with
a sample of workers with only one piece-rate and at least one time-wage observation. As for28
the test of comparative advantage in the piece-rate sector, we first estimate the allocation
equation using true productivity (equation (19)). The first column of Table 5 reports the OWM
estimates of the share of total days worked for time wages over the four rounds that were spent
weeding as a function of actual productivity µ. These estimates confirm the comparative
advantage hypothesis - more productive workers (as measured in the piece-rate sector) evidently
worked fewer days in weeding tasks than less productive workers over the survey period.
In the second column of the table, we also include a sex dummy in the specification. In
this case, unlike in the piece-rate sector, the coefficient is significant at the .11 level, suggesting
that, among equally productive men and women, women spend more days weeding than men.
This model also fits the data, indicating again that workers observed working for harvesting
piece-rate wages in only one round are drawn from the same productivity distribution as workers
observed at least twice in piece-rate harvesting. Because the results from the piece-rate sector
did not support the hypothesis that women prefer weeding, the result that women work more
days in weeding under time wages than do men net of differences in productivity is consistent
with the hypotheses that there is statistical discrimination, tastes discrimination or both.
To distinguish between tastes and statistical discrimination, it is necessary, as noted, to
estimate time wage and time-wage task allocation equations using perceived, not actual,
productivity. Table 6 reports estimates of the model incorporating equations (8), (14), (21), (17)
and (16) using the OWM method applied to workers with at least one weeding time-wage and
30
with at least one harvest piece-rate wage observation across all four rounds, the most common
category of worker. Again, two groups of workers are used - those workers with only one harvest
piece-rate wage observation and at least one weeding time wage and those workers with at least
two harvest piece-rate wage observations and at least one weeding time wage. The set of
worker characteristics (x ) assumed to be observable by employers consists of the worker'si
height, sex, age and schooling.
The model is estimated in three variants. In the first, the allocation equation (16) includes
only the perceived (by employers) productivity variable µ*. In the second, the allocation equation
also includes the component of productivity that is not observed by the employer, u , asi
determined by the fact that it is not reflected in the time wages. This specification permits a test
of the hypothesis that only rewards as determined by the employer, based on his available
information, matter for the task allocation in the time-wage sector. As noted, this approach
permits us to distinguish the hypothesis of comparative advantage from the hypothesis that
worker preferences that are related to productivity, but not observable characteristics such as
sex, net of productivity are responsible for the allocation of workers to tasks. Finally, in the third
variant of the model a dummy for sex is included in the allocation equation, which permits a test
of the hypothesis that employers discriminate against female workers by allocating them to a
particular activity in greater proportions than men who have the same expected productivity,
given the information available to the employer (tastes discrimination).
The first column of Table 6 reports the estimated relationships between perceived
productivity and the measured characteristics of workers plausibly known by employers, and the
estimates of the variances of that part of employer-perceived productivity that is not captured by
the measured variables ( ( )) and of that part of actual productivity not known by employers2
( (u)). The variance estimates indicate that the proportion of the total variance in productivity2
that is not known by employers is 45.9%; there is clearly an information problem in this spot-
market labor market. The results also indicate that men, taller workers and older workers (the
age range of workers is from 10 through 59) are more productive (and thus relatively more so in
harvesting activities), while those wage workers with more schooling are less productive in these
This latter result does not, of course, imply that schooling reduces productivity, but is29
likely the result of selection within the population of adults to agricultural wage work.
Note that this noise does not present a problem for the estimation of the effects of30
productivity on allocation because, given our methods, we only require that there is informationon the covariation between productivity and allocation across workers, not the actual productivitylevel of each worker.
31
agricultural tasks.29
A natural question that arises in this context is how it can be that employers do not know
worker productivity even though piece-rate payment is common. The answer has to do with two
facts: (1) given the nature of agricultural production the demand and supply of hired labor is quite
variable and (2) production in any particular day has a substantial stochastic component. The
implication of the first fact is that there is little incentive on the part of employers to invest in the
acquistion of information about a particular worker--a worker who is hired during the harvesting
season for a few days may not be needed during the planting season, and may not be available
in other periods because his labor is needed on his own farm. The implication of the second fact
is that a worker must be observed for a substantial number of days before an accurate
assessment of productivity can be made. A comparison of the data on the variance in the log of
the piece-rate wage rates with the variance in the log of productivity as estimated from the piece-
rate wage indicates that the stochastic component is 78% of the total variation in the piece-
wage. 30
The second column of Table 6 reports the estimated relationship between employer-
perceived productivity and the time wage in weeding ( ), which like that for true productivity in2T
the piece-rate wage sector is less than one, suggesting that in the time-wage sector those
workers perceived to be more productive are thought by employers to have a comparative
advantage in harvesting. All three specifications of the task-allocation equation that include
perceived productivity, reported in the last three columns of Table 6, also indicate that
comparative advantage operates in task allocations in the time-wage market. The second
specification (column 4) also indicates that the component of productivity not known by
employers plays no role in task allocation, suggesting that any unmeasured characteristics,

Evidence that information asymmetries affect wage payments in a number of different31
ways in other rural Asian societies is presented in Foster and Rosenzweig (1993).
In preliminary analysis we estimated a bivariate probit model of task choice given form32
of payment but could not reject the hypothesis of independence across tasks (t-value of 0.66 and1.14 piece-rate and time wages respectively); we thus present results using univariate probitselection for each sector. An alternative specification would have been the trinomial probit modelused by HS; although we also consider three sectors this procedure would not be appropriate forour analysis because activity in the three sectors is not mutually exclusive: over a given intervalan individual may be involved in both weeding and harvesting. A quadranomial probit modelallowing for simultaneous work in different tasks could in principle be used but would beextremely demanding in terms of computational resources.
32
including tastes, that are correlated with productivity do not play a role in the allocation of
workers across tasks.
Finally, in the last specification, we find that employers do not, among workers with the
same perceived productivity, allocate workers across tasks according to their sex. These findings
along with those of Tables 4 and 5 thus suggest that the disproportionate presence of female
workers in the weeding activity compared to that of men is not due to either employer bias or
worker preferences; it is the result of real productivity differences and of employers' partial
information on workers' true abilities and their (evidently unbiased) knowledge of overall
differences in the productivities of women and men in the labor market. Ignorance but not
preferences or bias plays a role along with comparative advantage in the division of labor
between men and women in this Philippines wage labor market.31
d. Estimates based on selection-correction models
A central feature of our ability to identify the effects of comparative advantage has been
the use of multiple wage observations for the same person performing different tasks and
receiving different forms of payment, which avoids the problem of selectivity that arises in the
context of empirical analysis of the Roy model. It is therefore of interest to determine the extent
to which these results can be replicated with a more traditional approach that does not make use
of this type of information. We therefore also examine estimates obtained from the same data
using a standard probit-selection model of wages and occupations. Because the selection32
approach, as noted, does not straightforwardly permit identification of the effects of worker and

w Tjit
Tji
Tj ( yi i) e T
jit
A Tjit
Tjt
Tjµ ( yi i)
Tuui
Tjx xi e T
Ajit
T Tjµ
Tj
2( i)
A is a latent variable denoting desired activity in sector j in a period t. Thus for A >033 *jit 1it
and A >0, a= A /( A +A ) and the linearized equations (16) and (28) have the same2it i t 1it t 1it 2it* * *
structure with the exception that that the constant in the latter is allowed to vary by time and task.
This equation follows the standard practice of assuming that equation (29) has been34
normalized so that the compound residual has variance one.
33
(27)
(28)
employer preferences we focus on the issue of whether this approach yields interpretable
evidence on the allocation of workers by comparative advantage.
In order to be able to interpret the results of the standard selection estimation procedure
in terms of the parameters of our model model we first rewrite the time wage and selection
equations as function only of observables and residuals. The wage equation, obtained by
substituting (21) into (17) is
For the selectivity equation, consistent with the specification of the share equation (16), we
assume that a latent variable A that represents the propensity for i to undertake activity j in ajit*
given round may be written as a function of µ , u and x with w observed if and only if A >0. i i jit jit* T T
Taking a linear approximation and substituting in (21) yields33
It is further assumed that all residuals exhibit a joint normal distribution. Identification of the
regression coefficients is obtained from to i) the distributional assumption and ii) the exclusion of
some x variables from the wage equation. This means that with semi-parametric estimators of
selection, it is necessary to assume that a subset of the measured variables available to the
researcher that affect task choices either are not observed by the employer or are not considered
to be relevant to productivity, net of y, by the employer.
Maximum likelihood estimation of (27) and (28) provides an estimateof the covariation of
the residuals from those equations, which is . This corresponds to the selection34
term in the selectivity-corrected wage equation from two-step estimation (Heckman, 1974). Thus
under time wages, allocation by comparative advantage will only be evident in terms of the
wjit ji j( yi i) ejit Ajit j0 jµ( yi i) jx xi eAjit
2u( ) 0
jµ j2( i)
The corresponding wage and latent activity equations under piece rates are35
and , respectively.
34
unobservables if , that is if employers know something about worker characteristics other
than those observed by the researcher. If workers are paid by piece rates, however, any variation
in productivity that is not explained by characteristics included in the wage equation will result in
a correlation in the residuals of the wage and selection equations. That is, using notation
analagous to that in equations (27) and (28), the relevant correlation for piece rates is
, where in this case is that component of true productivity not measured by the y,
as opposed to that part of employer-perceived productivity that is not measured. Thus, our prior35
results indicating that workers with higher µ have a comparative advantage in harvesting ( for
weeding<1) and thus work more as harvesters ( (weeding)< (harvesting)), implies that willµ2 µ1
be greater for harvesting than weeding. This will also be true for time wages; however, our
finding that time-wage employers know little about worker productivity net of height, schooling,
sex and age (the y we use) suggests that both estimated task-specific ’s could be close toT
zero.
To implement the selection model we sampled for each payment regime/ task in each
round one wage observation for each worker. We used each worker’s assets - farm acreage,
land value, and total wealth - as well as family size, family sex composition, and the means of the
adult family workers for height, schooling and age as variables (x) that influence an individual
worker’s task selection but not wages. We included in the wage equations worker age, height,
sex, and schooling. The resulting estimates of the wage equations, available by request from the
authors, are broadly consistent with the results from the previous analyses. Consistent with the
evidence of employer ignorance, neither of the ’s was statistically different from zero while atT
least one of the ’s was statistically significant by conventional standards when piece rates were
used. Moreover, the coefficients on the observable worker characteristics in each payment
regime show that those more likely to undertake weeding in terms of observable characteristics
are likely to receive lower wages and that those more likely to undertake harvesting are likely to
Indeed, HS find that it is necessary to make a number of alterations to the standard36
approach in order to obtain results that adequately fit their data.
35
receive higher harvest wages. This result is consistent with the notion that more productive
workers are likely to undertake harvesting rather than weeding.
The selectivity terms for the two tasks under piece-rate wages, however, are of the same
magnitude, suggesting either that (i) the allocation equation parameters are the same across
tasks so that more productive individuals are relatively likely to work in the piece-rate sector (than
to not work at all or to work on-farm or for time-rate wages) but not differentially in the two tasks
or (ii) there are two productivity factors, so that those who are weeding are relatively productive
in weeding and those harvesting are relatively productive in that task. Neither of these
interpretations is supported by our less restrictive analysis that makes use of worker movements
across payment regimes and tasks and measures of productivity.
The results from a simple version of the standard selection-correction analysis thus do
not appear to completely uncover the role of comparative advantage as a determinant of the
allocation of workers to activities. The implementation of the selection model used (probit
selection into each task), however, does not adequately address the multi-faceted occupational
choice faced by workers in this population and imposes an arbitrary distributional assumption. A
more complex procedure might well yield more interpretable results.36
6. Conclusion
Although there is an extensive literature documenting the sometimes large differences in
worker characteristics such as sex and age across occupations in many countries of the world,
studies of occupational stratification have provided limited insight into the factors that explain
these patterns, particularly in circumstances in which information asymmetries may be important.
In this paper we have shown how piece-rate and time-wage data can be used to distinguish,
without the imposition of ad hoc structure, among four possible mechanisms that may influence
the sorting across occupations of workers characterized by particular measured characteristics:
(1) comparative advantage (2) preferences on the part of workers (3) preferences on the part of

36
employers, and (4) statistical discrimination.
We applied these methods to data collected from a unique panel data set from a casual
labor market in rural Philippines which displays a common and controversial activity stratification
in which women devote a substantially greater amount of time than do men to weeding
compared to other agricultural activities. The tests provided a number of striking results. First,
variations in productivity with respect to weeding and harvesting can be adequately characterized
by a one-factor model. That is, workers who are more productive in one sector (weeding) are
also more productive in harvesting, although more productive individuals have a comparative
advantage in harvesting. Second, as predicted on the basis of economic theory, we find
evidence that the activity allocations in the piece-rate labor market are significantly related to
productivity differentials: more productive workers are in fact more likely to work in harvesting,
although seasonal variation in the relative demand for the two tasks implies that most workers
will undertake both tasks over the course of the year. Because women in this labor market on
average have productivity levels that give them comparative advantage in weeding, this result
partially explains the allocation of women to the weeding sector in this economy. Third, we find
no evidence that the allocation of workers to tasks in either the piece-rate or the time-wage
sector is due to preferences on the part of workers for certain types of activities that are
correlated with observed characteristics of the workers. Thus, the fact that more women are
found to be weeding in this sector cannot be attributed to preferences on the part of women for
this activity. Moreover, in the context of the time-wage sector we can also rule out the possibility
that allocations result from preferences that are correlated with unobserved (to the employer)
aspects of productivity. Fourth, we find no evidence that the allocation of workers to tasks in
either sector is a result of tastes discrimination on the part of employers.
Our results also suggest, however, that there are information problems in the time-wage
sector and that statistical discrimination plays an important role in the allocation of workers in that
sector. Because women are on average less productive than are men in these tasks and
therefore have comparative advantage in weeding and because employers cannot completely
discern differences in individual worker productivity, given a man and a woman with equal levels

37
of productivity, the woman is more likely to be employed in weeding. Given that information
asymmetries play no role in the allocation of workers to tasks in the piece-rate sector, this result
also explains why occupational segmentation by sex is greater for time-wage employment than
for piece-rate employment or on-farm work, a salient feature of Asian agriculture.
Finally, it should be noted that the finding that the allocation of workers by sex to tasks in
the rural Philippines results from comparative advantage as well as informational asymmetries
does not imply that preferences on the part of workers are not important in that labor market, only
that worker preferences are not correlated with sex. Indeed, task prices can reflect worker
preferences and preferences expressed in household allocations may play a role in determining
differentials across workers in productivity. In this paper we have taken existing productivity
differentials as given. Our results also do not imply that employers' preferences do not play an
important role in other labor markets. Nor does the finding that a single factor adequately
characterizes variation in productivity in an agricultural labor markets imply that a single-factor
can adequately characterize variation in productivity in other, more complex, labor markets,
although a one-factor wage model has been found to fit based on U.S. labor market data in Card
and Lemieux (1993). Nonetheless, the evidence from this paper suggests that inferences about
the relative importance of worker and employer preferences as determinants of the allocation of
workers to tasks should not be drawn without a careful assessment of the contributions of
comparative advantage and information asymmetries.
38
References
Abowd, John M. and D. Card, 1989, "On the Covariance Structure of Earnings and Hours
Changes", Econometrica, 57: 411-446.
Aigner, Dennis J. and Glen G. Cain (1977) "Statistical theories of discrimination in the labor
market", Industrial and Labor Relations Review, 30:175-187.
Bardhan, K. (1984) "Work patterns and social differentiation: Rural women of West Bengal", in
Binswanger, H.P. and Rosenzweig, M.R., eds., Contractual Arrangements, Employment,
and Wages in Rural Labor Markets in Asia, New Haven: Yale University Press, pp.184-
208.
Becker, G. (1971) The Economics of Discrimination, Chicago: Chicago University Press.
Boserup, E. (1970) Woman's role in economic development, London: Allen & Unwin.
Bouis, Howarth E. and Lawrence J. Haddad (1990) Agricultural Commercialization, Nutrition, and
the Rural Poor: A Study of Philippine Farm Households, Boulder: Lynne Rienner
Publishers.
Card, David and Thomas Lemieux, "Wage dispersion, returns to skill, and black-white wage
differentials", NBER Working Paper No. 4365, Cambridge, MA : National Bureau of
Economic Research, Inc., 1993.
Chamberlain, Gary (1982) "Multivariate regression models for panel data", Journal of
Econometrics, 18, 5-46.
Chamberlain, Gary (1984) "Panel data", in Griliches, Zvi and M. Intrilligator, eds., The Handbook
of Econometrics, Volume 2, Amsterdam: North Holland.
Foster, A. and M. Rosenzweig (1993) "Information, Learning, and Nutrition in Rural Labor
Markets", Journal of Human Resources 28(4):759-790.
Goldin, Claudia (1986) "Monitoring Costs and Occupational Segregation by Sex: A Historical
Analysis", Journal of Labor Economics 4(1)1-27.
Heckman, J. and G. Sedlacek (1985) "Heterogeneity, aggregation and market wage functions: an
empirical model of self-selection in the labor market", Journal of Political Economy 93:
1077-125.

39
Roy, A.D. (1951) "Some thoughts on the distribution of earnings", Oxford Economic Papers 3:
135-46.
Weiss, Andrew (1980) "Job queues and layoffs in labor markets with flexible wages", Journal of
Political Economy, 88(3):526-38.
Zellner, H. (1972) The determinants of occupational segregation", in LLoyd, C.B., ed., Sex,
Discrimination and the Divisiion of Labor, New York: Columbia University Press, pp. 125-
145.

40
Table 1Percentage of Total Days in Agricultural Tasks Spent Weeding by Men and
Women in Three Asian Countries
Sex For Time Wages On-farm For Piece-rateWages
Bukidnon, Philippines (1984-85)
Male 36.6 N.A. 15.8Female 77.2 N.A. 21.3
Ten ICRISAT Villages, India (1975-85)
Male 3.24 3.80 N.A.Female 33.7 27.0 N.A.
Northern Pakistan (1986-89)
Male N.A. 5.95 N.A.Female N.A. 16.1 N.A.
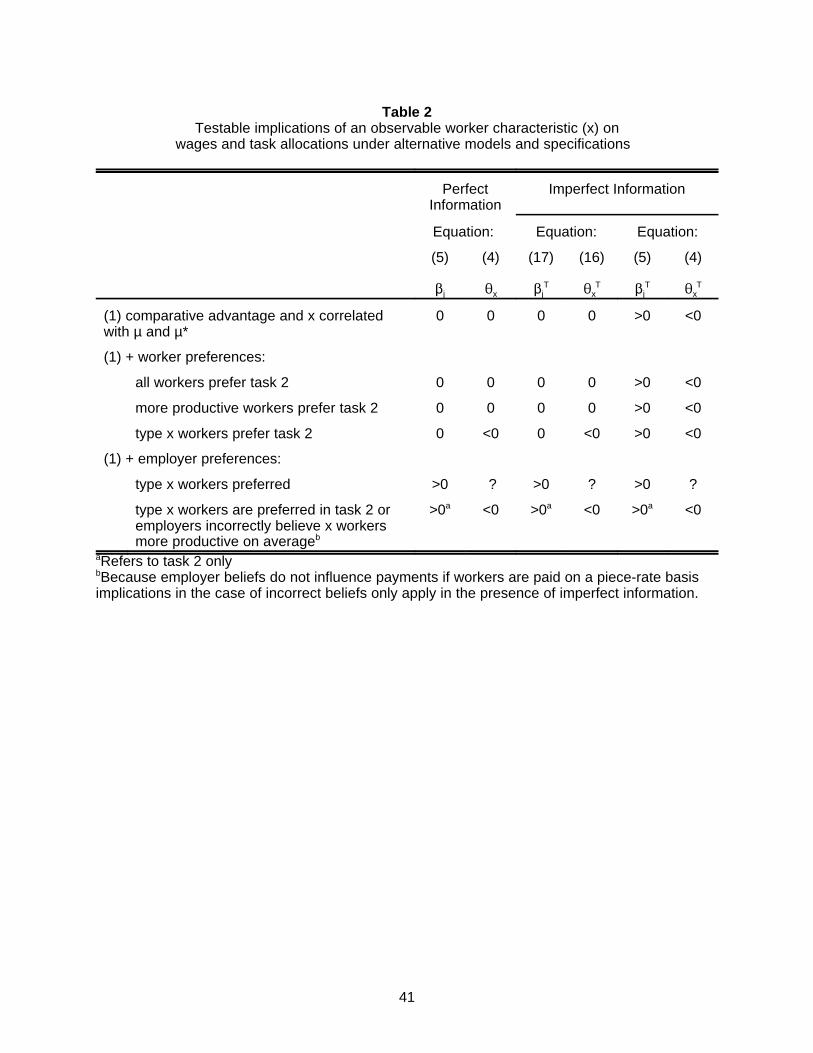
41
Table 2Testable implications of an observable worker characteristic (x) on
wages and task allocations under alternative models and specifications
Perfect Imperfect InformationInformation
Equation: Equation: Equation:
(5) (4) (17) (16) (5) (4)
j x jT
xT
jT
xT
(1) comparative advantage and x correlated 0 0 0 0 >0 <0with µ and µ*
(1) + worker preferences:
all workers prefer task 2 0 0 0 0 >0 <0
more productive workers prefer task 2 0 0 0 0 >0 <0
type x workers prefer task 2 0 <0 0 <0 >0 <0
(1) + employer preferences:
type x workers preferred >0 ? >0 ? >0 ?
type x workers are preferred in task 2 or >0 <0 >0 <0 >0 <0employers incorrectly believe x workersmore productive on averageb
a a a
Refers to task 2 onlya
Because employer beliefs do not influence payments if workers are paid on a piece-rate basisb
implications in the case of incorrect beliefs only apply in the presence of imperfect information.

42
Table 3Test of Single Versus Two-Factor Model Based on
Piece-Rate Observations: OWM Estimates
Factor (1) (2)
.611 .4492(4.45) (2..50)a
(µ ) .0822 .083721
(3.94) (4.01)
( ) -- .026022
(1.38)
(d.f.) 20.9 (15) 17.6 (14)2
Number of workers 83 83
Number of observations 216 216
Absolute value of asymptotic t-ratio in parentheses.a
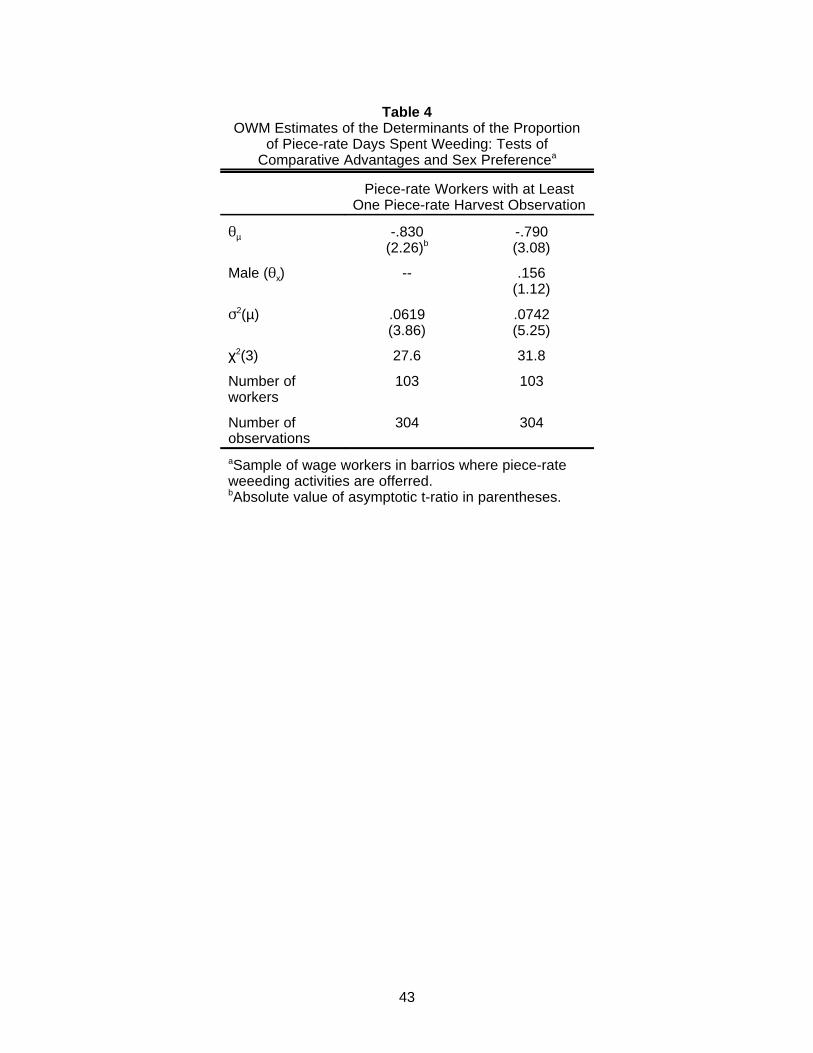
43
Table 4OWM Estimates of the Determinants of the Proportion
of Piece-rate Days Spent Weeding: Tests ofComparative Advantages and Sex Preferencea
Piece-rate Workers with at LeastOne Piece-rate Harvest Observation
-.830 -.790µ(2.26) (3.08)b
Male ( ) -- .156x(1.12)
(µ) .0619 .07422
(3.86) (5.25)
(3) 27.6 31.82
Number of 103 103workers
Number of 304 304observations
Sample of wage workers in barrios where piece-ratea
weeeding activities are offerred.Absolute value of asymptotic t-ratio in parentheses.b
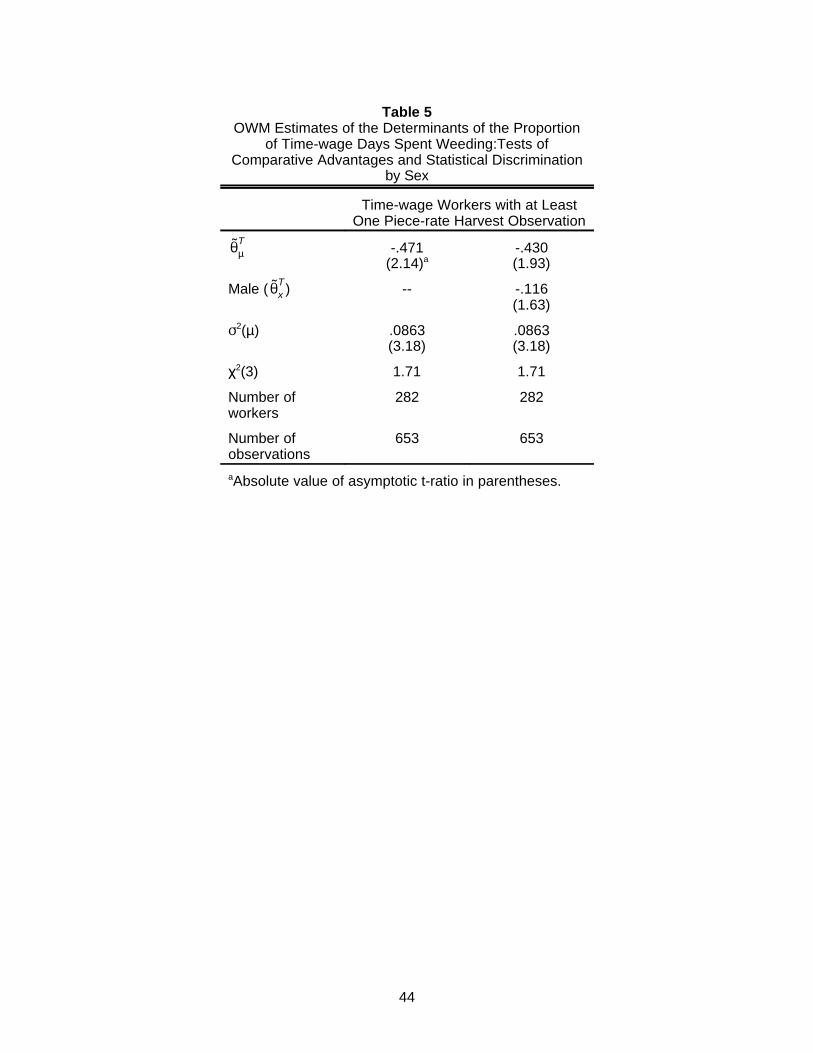
˜Tµ
˜Tx
44
Table 5OWM Estimates of the Determinants of the Proportion
of Time-wage Days Spent Weeding:Tests ofComparative Advantages and Statistical Discrimination
by Sex
Time-wage Workers with at LeastOne Piece-rate Harvest Observation
-.471 -.430(2.14) (1.93)a
Male ( ) -- -.116(1.63)
(µ) .0863 .08632
(3.18) (3.18)
(3) 1.71 1.712
Number of 282 282workers
Number of 653 653observations
Absolute value of asymptotic t-ratio in parentheses.a
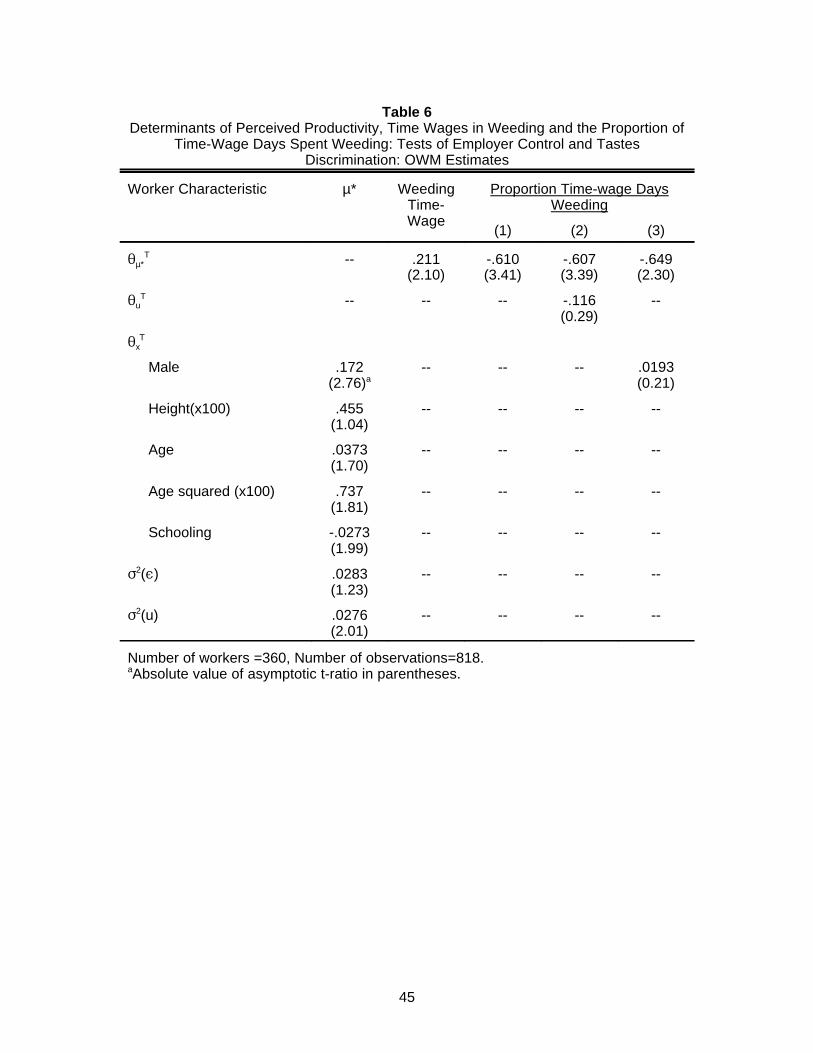
45
Table 6Determinants of Perceived Productivity, Time Wages in Weeding and the Proportion of
Time-Wage Days Spent Weeding: Tests of Employer Control and TastesDiscrimination: OWM Estimates
Worker Characteristic µ* Weeding Proportion Time-wage DaysTime- WeedingWage
(1) (2) (3)
-- .211 -.610 -.607 -.649µ*T
(2.10) (3.41) (3.39) (2.30)
-- -- -- -.116 --uT
(0.29)
xT
Male .172 -- -- -- .0193(2.76) (0.21)a
Height(x100) .455 -- -- -- --(1.04)
Age .0373 -- -- -- --(1.70)
Age squared (x100) .737 -- -- -- --(1.81)
Schooling -.0273 -- -- -- --(1.99)
( ) .0283 -- -- -- --2
(1.23)
(u) .0276 -- -- -- --2
(2.01)
Number of workers =360, Number of observations=818.Absolute value of asymptotic t-ratio in parentheses.a

46
Table A
Sample Criteria Sample Percent Percent Percent PercentSize (%) Total of piece- of time- male
Days rate wagedays daysweeding weeding
Total wage workers harvesting or 657 (100) 100 8.62 74.1 62.4weedinga
At least one time-wage weeding 424 (64.5) 81.5 8.15 86.8 63.9
At least one piece-rate harvest 454 (69.1) 74.4 5.38 78.6 63.9observation
+ at least one time-wage 291 (44.3) 65.6 5.93 78.6 69.8observation
+ at least one weeding 268 (40.8) 61.6 5.67 85.7 68.7time-wage observation
+at least one piece-rate 63 (9.59) 20.1 31.1 84.2 66.7weeding observation
At least two piece-rate harvest 217 (33.0) 53.6 5.29 82.3 72.4observations
93.4% of all wage workers are workers who weed and/or harvest. Weeding and harvestinga
are 94% of all days spent by agricultural wage workers in agricultural activities.

47
Table BFixed-Effects Estimates: Effect of Worker-Days per RoundBy Payment Method on Supervisory-Days per Worker-Day
Variable Coefficient t-ratios
Piece-work labor days (x10 ) -.0203 2.73-2
Time-wage labor days (x10 ) .0193 1.60-2
Piece work .0780 12.2
Plowing, planting .0337 6.27
Weeding -.0241 3.13
Harvesting -.0598 7.47
Sugar .00827 0.88
Rice -.00737 0.87
Corn .0159 1.53
F(9,5444) 30.1
Number of tasks 5909
Number of households 455

-1 10
1
task 2
Worker Productivity
ln wage
M M'
task1task 2'
task 1'
48
Figure 1Allocation of Workers to Task by Productivity