Embed Size (px)
Citation preview

JDE (Journal of Developing Economies) Vol. 2 No. 1 (2017): 14-26
JDE (Journal of Developing Economies)https://e-journal.unair.ac.id/JDE/index
COMPARATIVE ADVANTAGE ANALYSIS AND PRODUCTS MAPPING OF INDONESIA, MALAYSIA, PHILIPPINES, SINGAPORE, THAILAND, AND
VIETNAM EXPORT PRODUCTS Akhmad Jayadi*1 Harry Azhar Aziz2
1,2 Faculty of Economics and Business, Universitas Airlangga, Indonesia
ABSTRACTThe research aims to answer some questions. First, what kind of export product groups that the six countries have comparative advantage? Sec-ond, is there a shifting on its comparative advantage? Third, what is the re-lationship between six countries? Data used in this study is secondary data which published by the World Integrated Solution (WITS) of World Bank, from 1997 to 2014. Analytical tools applied are products mapping using Revealed Symmetric Comparative Advantage (RSCA) and Trade Balance Index (TBI). The results of this study showed as follows: first, on average, the comparative advantage of six countries increase. Second, Thailand and Vietnam’s comparative advantage and trade balance changes seems more dynamic than those of other four countries. Third, there is competition and complementary amongst six countries.
Keywords: Comparative Advantage, Export Specialization, Products Map-ping, Flying Geese JEL : P51, P33
To cite this document: Jayadi, A., & Aziz, H.A., (2017). Comparative Advantage Analysis and Products Mapping of Indonesia, Malaysia, Philip-pines, Singapore, Thailand, And Vietnam Export Products. JDE (Journal of Developing Economies), 2(1), 14-26.
Introduction
Amongst ASEAN countries, Indonesia, Malaysia, Philippines, Singapore, Thailand, and Vietnam are the biggest in GDP nominal. It’s trade also very dynamics either by the number of products or by the value. Those six countries became the investment destination, due to its abundance natural resource and human resource, as well as a big market for the goods and services.
In order to survive and compete in free trade, each country made specialization in some products. One will maximize its endowment factor, as the source of competitive and comparative advantage, to produce goods efficiently. According to Widodo (2008a) compara-tive advantages of some Asian countries are as follows: 1) China, Thailand and Indonesia cur-rently have high comparative advantage in unskilled labor-intensive industries. 2) Singapore, Malaysia, Indonesia and the Philippines have comparative advantage in human capital-inten-sive industries. 3) Japan and Korea have comparative advantage in technology- intensive in-dustries.
In the early development process, one country will rely on natural resources. The next step it will intensify the human capital resources. Later, the technology will be applied to be the base of the production. There is structural transformation during the development
ARTICLE INFOReceived: April 2nd, 2017Revised: May 3th, 2017Accepted: May 14th, 2017Online: June 20th, 2017
*Correspondence: Akhmad JayadiE-mail: [email protected]
JDE (Journal of Developing Economies) p-ISSN: 2541-1012; e-ISSN: 2528-2018DOI: http://dx.doi.org/10.20473/jde.v2i1.5119Open access under a Creative Commons Attribution 4.0 International
(CC-BY)
15
JDE (Journal of Developing Economies) Vol. 2 No. 1 (2017): 14-26
process. According to Aiginger (1999) in Widodo (2008b) the issue of dynamic s pecialization and convergence of trade patterns are important to economic policy and to the countries’ competitiveness.
The pattern which one country shift from one stage to upper stage of development (characterized by its industries) is known as “Flying Geese” (FG) model. The model was firstly introduced by Kaname Akamatsu in the 1930s (Widodo, 2008a), as a analogous sequential development or catching up process of manufacturing industries in developing countries.
This paper aims to analyze and map the comparative advantage and export specializa-tion of six ASEAN countries. Previous research had been conducted by several researchers (Dowlinga & Cheang, 2000; Ginzburg & Simonazzi, 2005; Shohibul, 2013; Widodo, 2009). The results showed that there is shifting comparative advantage among the countries.
Literature Review
According to Maule (1996), the more divergent the patterns of comparative advan-tage between countries members, the greater the belief of the existence of scope for trade creation in the free trade era. In contrast, a similar pattern of comparative advantage among countries members to the other world countries will affect the magnitude of trade problems possibility.
Dalum, et al (1998) research about the structural change in export specialization pat-terns of OECD countries found that national export specialization patterns is difficult to do. Specialization in international trade of OECD countries slightly declined in less than 30 years, and contrary to the general findings of technology specialization.
Kwan (2002) study about the increased flying geese pattern of economic development in China and Asia found that although industrial manufactured goods made rapid progress in China’s exports, but China’s competitiveness still in the low value-added products. China’s exports did not compete with Japanese exports, but rather complementary.
Wong and Chan (2003) found that in the beginning the ASEAN countries’ economy (excluding Singapore) based on natural resources (their economic growth depends on natural resources and primary products exports). Since 2001 the trade between China and ASEAN has shifted from primary commodities into manufactured products. Instead China’s exports to ASEAN more diverse, ranging from agricultural commodities, metals, mineral products to manufactured goods. In 1993, machine/electricity tools, minerals, vegetables, basic metals, textiles, clothing and footwear became the largest products of China and ASEAN’s trade.
Widodo (2008c) found that in early trade reform era (1983-1997) the comparative advantage of unskilled labor-intensive products and primary products increased significantly, and the more rapidly during periods of growth-oriented trade regime (1986-1988). Compar-ative advantages of natural resource-intensive products and human-intensive products also increased significantly, while the technology-intensive products increased moderately during those period.
Other study of Widodo (2008a) found the indications of transfer between the Japan in-dustrialization as the lead goose to Korea, ASEAN countries and China as the follower- geese. China, together with Thailand and Indonesia has a comparative advantage in unskilled la-bor-intensive industries. China has overtaken Japan in the human resource-intensive indus-tries. Until now, Japan still has a comparative advantage in technology-intensive industries. China still must compete intensively with South Korea and Singapore in technology-intensive industries.
Comparative advantage
Theories and concepts of comparative advantage provide by Ricardo, Hecksher and

16
Jayadi, A., & Aziz, H.A.
Comparative Advantage Analysis and Products Mapping of Indonesia, Malaysia, Philippines, Singapore, Thailand, And Vietnam Export Products
Ohlin, Krugman and Redding. Redding (2002) found that endogenous comparative advantage determined by changes in technology and innovation in the past. Its dynamics caused by the role of trade in inputs (Jones, 2000); friction of international trade and investment flows re-garding to geographical factors, institution, transportation, and cost of information (Venables, 2001); transmission of knowledge across borders (Grossman & Helpman, 1991); cross-country differences in technology (Trefler, 1995), and monopolistic competition in product differentia-tion with increasing returns to scale (Krugman, 1979; Widodo, 2008b).
A country’s comparative advantage is determined by relative prices before the trade. If the relative price of domestic products is lower than those of the world, then the country has a comparative advantage on those products. The relative price before the trade depends on its relative production costs. Due to the lack of the observation data on the relative costs and/or price of any domestic product, so Balassa (1965) developed an alternative approach by assuming that comparative advantage is reflected by its exports to the world. Comparative advantage of exports is represented by the composition of a country’s commodity exports to world exports (Maule, 1996).
Flying geese
According to Kojima (2000), flying geese paradigm developed by Kaname Akamatsu consists of four stages of catching-up process, i.e.: first stage, the industrial consumption goods imported from developing countries; second stage, the domestic production (import substitution strategy) begins. At the same time, the country had to import capital goods; third stage, the domestic production is exported. This stage reflects the success of the implemen-tation of industrial catching-up process along the consequential patterns of import- produc-tion-export (MPE); and the fourth stage, the advanced status in the consumer goods industry has been lifted away. It is seen from the decline in exports of consumer goods, and the be-ginning of capital goods export. Industry then relocated to developing countries (off- shore production) based on comparative advantage (Ljungwall & Sjöberg, 2005; Widodo, 2008a).
To simplify the analysis, illustrate that we are sitting in a room. Outside, there are the geese flying, which represent the products are exported to be analyzed. The room has a win-dow that represents an analytical tool. Through the window we saw the geese are flying. Each (group of) geese are distinguished by their group, namely A, B, C and D (Widodo, 2009).
Products mapping
In Widodo, (2008c) Products mapping is made using two analysis tools, i.e. Revealed Symmetric Comparative Advantage (RSCA) and the Trade Balance Index (TBI). RSCA by Dalum, et al (1998) is an indicator of comparative advantage, while the TBI by Lafay is an indicator of export-import activity (Widodo, 2008c).
Revealed symmetric comparative advantage (RSCA). RSCA is a simple transformation of the Revealed Comparative Advantage (RCA) by Balassa (1965). RCA index is defined as fol-lows:
( / )/( / )RCA X X X Xij ij in rj rn= (1)
RCAij represents the country’s i comparative advantage for product j. Xij represents the total exports of country i in commodity group j. The r letter refers to all states without state i, and the n letter refers to all product groups except the group of product j (Widodo, 2009).
RSCA index is formulated as follows:
( )/( )RSCA RCA RCA1 1ij ij ij= - + (2)
17
JDE (Journal of Developing Economies) Vol. 2 No. 1 (2017): 14-26
RSCAij index values range from -1 to +1 (-1 ≤ RSCAij ≤ +1). If RSCAij more than 0 means that country i have a comparative advantage in product group j, on the contrary, if RSCAij less than 0 then the country i do not have a comparative advantage in product group j (Widodo, 2009).
Trade balance index (TBI). According to Lafay TBI is used to analyze whether a country has specialized in the export (as a net-exporter) or the import (as a net-importer) for a particular product group (Widodo, 2009).
TBI is defined as follows:
( )/( )TBI X M X Mij ij in ij ij= - + (3)
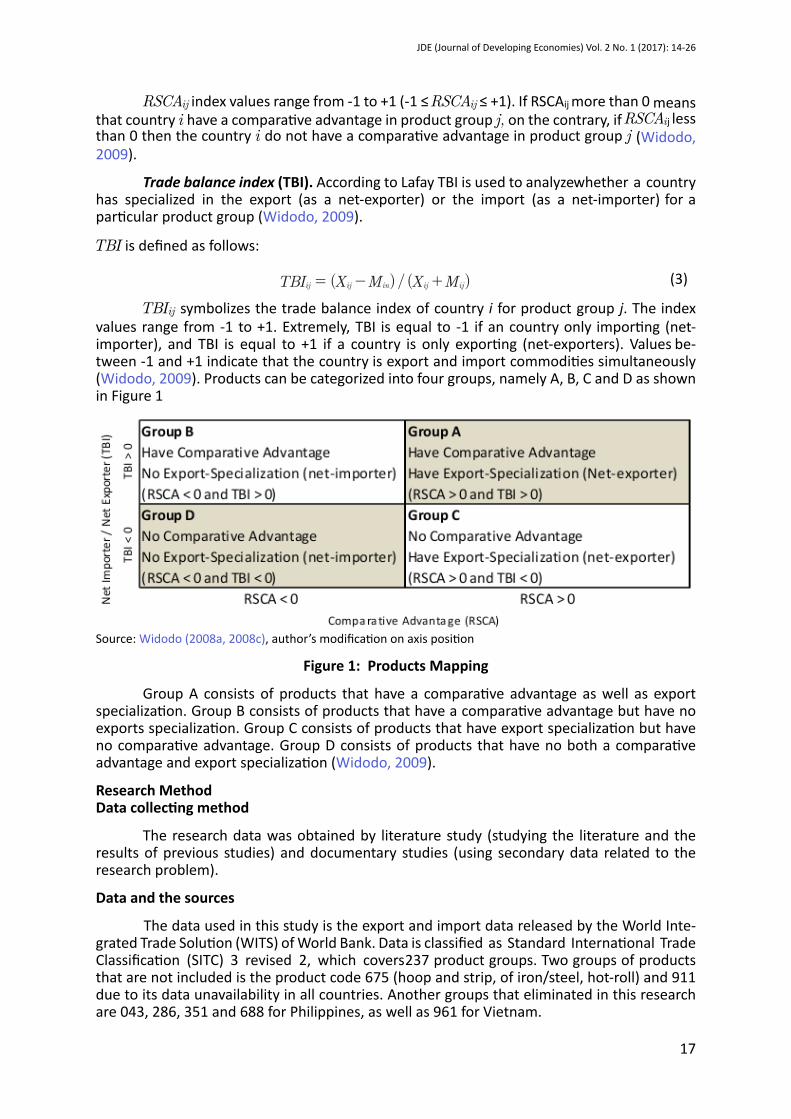
TBIij symbolizes the trade balance index of country i for product group j. The index values range from -1 to +1. Extremely, TBI is equal to -1 if an country only importing (net- importer), and TBI is equal to +1 if a country is only exporting (net-exporters). Values be-tween -1 and +1 indicate that the country is export and import commodities simultaneously (Widodo, 2009). Products can be categorized into four groups, namely A, B, C and D as shown in Figure 1
Source: Widodo (2008a, 2008c), author’s modification on axis position
Figure 1: Products Mapping
Group A consists of products that have a comparative advantage as well as export specialization. Group B consists of products that have a comparative advantage but have no exports specialization. Group C consists of products that have export specialization but have no comparative advantage. Group D consists of products that have no both a comparative advantage and export specialization (Widodo, 2009).
Research MethodData collecting method
The research data was obtained by literature study (studying the literature and the results of previous studies) and documentary studies (using secondary data related to the research problem).
Data and the sources
The data used in this study is the export and import data released by the World Inte-grated Trade Solution (WITS) of World Bank. Data is classified as Standard International Trade Classification (SITC) 3 revised 2, which covers 237 product groups. Two groups of products that are not included is the product code 675 (hoop and strip, of iron/steel, hot-roll) and 911 due to its data unavailability in all countries. Another groups that eliminated in this research are 043, 286, 351 and 688 for Philippines, as well as 961 for Vietnam.
18
Jayadi, A., & Aziz, H.A.
Comparative Advantage Analysis and Products Mapping of Indonesia, Malaysia, Philippines, Singapore, Thailand, And Vietnam Export Products
Completely, data of this study are: the export and import of Indonesia, Malaysia, Phil-ippines, Singapore, Thailand and Vietnam, to the world, and world’s exports (and import) to (and from) all countries. Each data are from 1997 to 2014 in US$.
Results and DiscussionAnalysis of the average number of export product groups
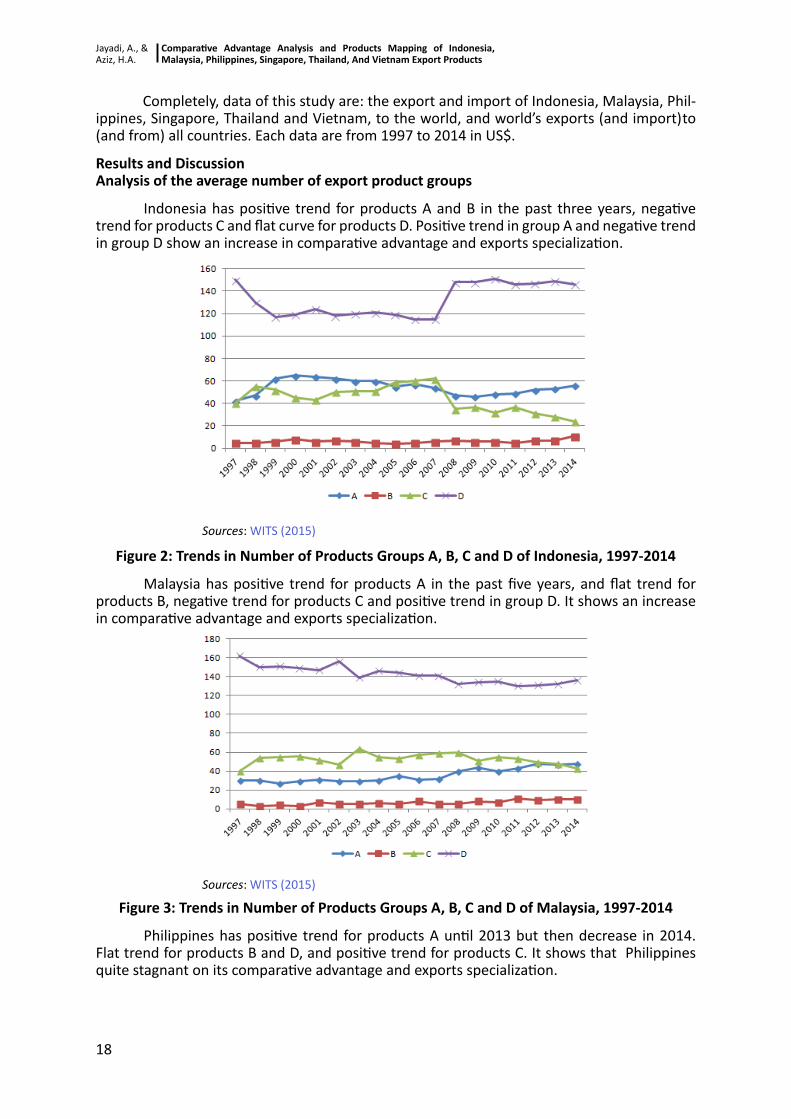
Indonesia has positive trend for products A and B in the past three years, negative trend for products C and flat curve for products D. Positive trend in group A and negative trend in group D show an increase in comparative advantage and exports specialization.
Sources: WITS (2015)
Figure 2: Trends in Number of Products Groups A, B, C and D of Indonesia, 1997-2014
Malaysia has positive trend for products A in the past five years, and flat trend for products B, negative trend for products C and positive trend in group D. It shows an increase in comparative advantage and exports specialization.
Sources: WITS (2015)
Figure 3: Trends in Number of Products Groups A, B, C and D of Malaysia, 1997-2014
Philippines has positive trend for products A until 2013 but then decrease in 2014. Flat trend for products B and D, and positive trend for products C. It shows that Philippines quite stagnant on its comparative advantage and exports specialization.

19
JDE (Journal of Developing Economies) Vol. 2 No. 1 (2017): 14-26
Sources: WITS (2015)
Figure 4: Trends in Number of Products Groups A, B, C and D of Philippines, 1997-2014
Singapore has positive trend for products C (in the past three years) and products A, negative trend for products D and B. Singapore shows significant increasing in comparative advantage and exports specialization.
Sources: WITS (2015)
Figure 5: Trends in Number of Products Groups A, B, C and D of Singapore, 1997-2014
Thailand has positive trend for products A (in the past two years) and products C, neg-ative trend for products D, and flat curve for products B. Thailand shows increasing in compar-ative advantage and exports specialization.
Sources: WITS (2015)
Figure 6: Trends in Number of Products Groups A, B, C and D of Thailand, 1997-2014
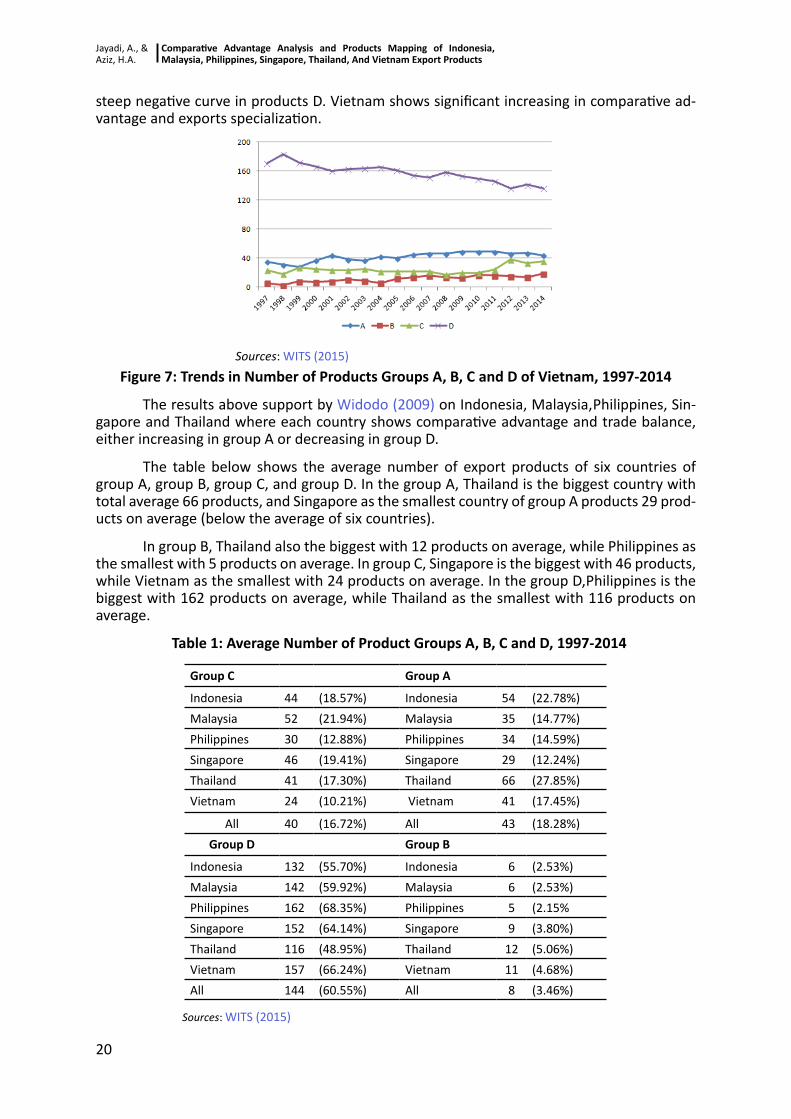
Vietnam has positive trend for products B and C, negative trend for products A and
20
Jayadi, A., & Aziz, H.A.
Comparative Advantage Analysis and Products Mapping of Indonesia, Malaysia, Philippines, Singapore, Thailand, And Vietnam Export Products
steep negative curve in products D. Vietnam shows significant increasing in comparative ad-vantage and exports specialization.
Sources: WITS (2015)
Figure 7: Trends in Number of Products Groups A, B, C and D of Vietnam, 1997-2014
The results above support by Widodo (2009) on Indonesia, Malaysia, Philippines, Sin-gapore and Thailand where each country shows comparative advantage and trade balance, either increasing in group A or decreasing in group D.
The table below shows the average number of export products of six countries of group A, group B, group C, and group D. In the group A, Thailand is the biggest country with total average 66 products, and Singapore as the smallest country of group A products 29 prod-ucts on average (below the average of six countries).
In group B, Thailand also the biggest with 12 products on average, while Philippines as the smallest with 5 products on average. In group C, Singapore is the biggest with 46 products, while Vietnam as the smallest with 24 products on average. In the group D, Philippines is the biggest with 162 products on average, while Thailand as the smallest with 116 products on average.
Table 1: Average Number of Product Groups A, B, C and D, 1997-2014
Group C Group A
Indonesia 44 (18.57%) Indonesia 54 (22.78%)Malaysia 52 (21.94%) Malaysia 35 (14.77%)Philippines 30 (12.88%) Philippines 34 (14.59%)Singapore 46 (19.41%) Singapore 29 (12.24%)Thailand 41 (17.30%) Thailand 66 (27.85%)Vietnam 24 (10.21%) Vietnam 41 (17.45%)
All 40 (16.72%) All 43 (18.28%)Group D Group B
Indonesia 132 (55.70%) Indonesia 6 (2.53%)Malaysia 142 (59.92%) Malaysia 6 (2.53%)Philippines 162 (68.35%) Philippines 5 (2.15%Singapore 152 (64.14%) Singapore 9 (3.80%)Thailand 116 (48.95%) Thailand 12 (5.06%)Vietnam 157 (66.24%) Vietnam 11 (4.68%)All 144 (60.55%) All 8 (3.46%)
Sources: WITS (2015)

21
JDE (Journal of Developing Economies) Vol. 2 No. 1 (2017): 14-26
The result is different with finding by Widodo (2009), which put Singapore as the big-gest in group A, and Philippines in group D. There is shifting in 6 years (2008 to 2014). It also happen in group B and C, where Singapore does not dominate the group.
Products mapping analysis of Indonesia, Malaysia, Philippines, Singapore, Thailand, and Vietnam’s export
Products mapping of Indonesia, Malaysia, Philippines, Singapore, Thailand, and Viet-nam’s export show the changes in top-ten (ten biggest in the value) of groups A product over 18 years (from 1997 to 2014). The ten products are the one which have comparative advan-tage in international trade and the country as a net exporter of the products.
Indonesia. Nine of top-ten export products of Indonesia in 1997 came from primary sector: agriculture (6 products) as well as mining (3 products). Only one product derived from secondary sector, i.e. natural and artificial gas (341).
Sources: WITS (2015)
Figure 8: Products Mapping and the Top-Ten Export Products of Indonesia, 1997
Sources: WITS (2015)
Figure 9: Products Mapping and the Top-Ten Export Products of Indonesia, 2014
Indonesia’s top-ten export product in 2014 contributed by only one product from sec-ondary sector, namely other man-made fibers (267). The other nine of the primary sectors are: six from agriculture (vegetable oil, natural rubber, cocoa, animal and vegetable oils, spic-es, and plywood) and three from mining (tin, and coal).
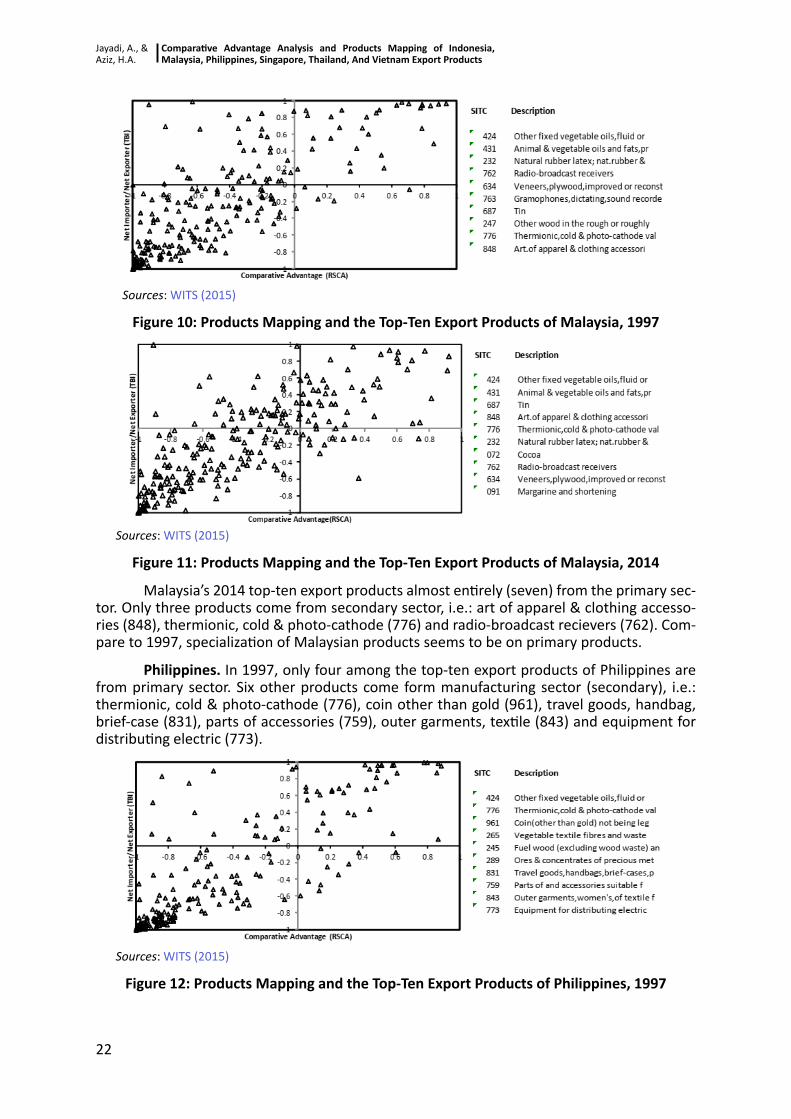
Malaysia. In 1997, four among the top-ten export products of Malaysia are from the manufacturing sector (secondary). The five other products derived from agriculture (prima-ry). In this year, Malaysia already specialized on technology products, i.e.: radio- broadcast reciever (762), gramophones, dictating and sound recorder (763) and thermionic, cold and photo cathode (776).
22
Jayadi, A., & Aziz, H.A.
Comparative Advantage Analysis and Products Mapping of Indonesia, Malaysia, Philippines, Singapore, Thailand, And Vietnam Export Products
Sources: WITS (2015)
Figure 10: Products Mapping and the Top-Ten Export Products of Malaysia, 1997
Sources: WITS (2015)
Figure 11: Products Mapping and the Top-Ten Export Products of Malaysia, 2014
Malaysia’s 2014 top-ten export products almost entirely (seven) from the primary sec-tor. Only three products come from secondary sector, i.e.: art of apparel & clothing accesso-ries (848), thermionic, cold & photo-cathode (776) and radio-broadcast recievers (762). Com-pare to 1997, specialization of Malaysian products seems to be on primary products.
Philippines. In 1997, only four among the top-ten export products of Philippines are from primary sector. Six other products come form manufacturing sector (secondary), i.e.: thermionic, cold & photo-cathode (776), coin other than gold (961), travel goods, handbag, brief-case (831), parts of accessories (759), outer garments, textile (843) and equipment for distributing electric (773).
Sources: WITS (2015)
Figure 12: Products Mapping and the Top-Ten Export Products of Philippines, 1997
23
JDE (Journal of Developing Economies) Vol. 2 No. 1 (2017): 14-26
Sources: WITS (2015)
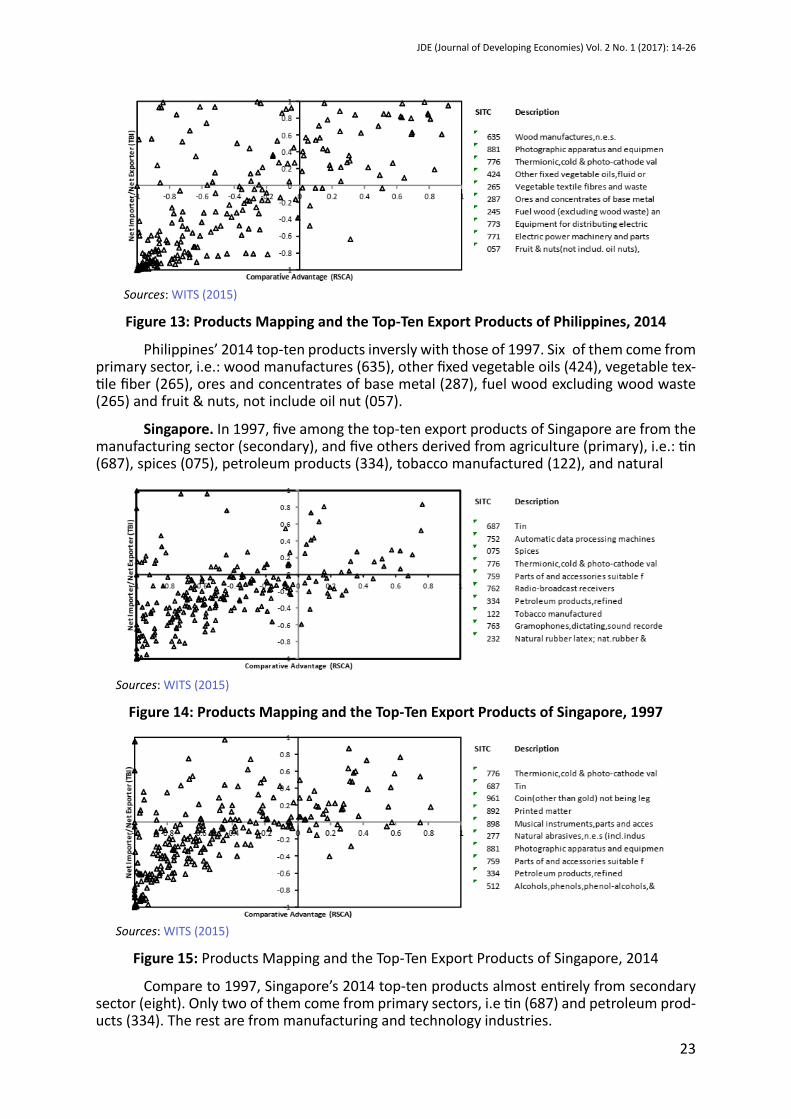
Figure 13: Products Mapping and the Top-Ten Export Products of Philippines, 2014
Philippines’ 2014 top-ten products inversly with those of 1997. Six of them come from primary sector, i.e.: wood manufactures (635), other fixed vegetable oils (424), vegetable tex-tile fiber (265), ores and concentrates of base metal (287), fuel wood excluding wood waste (265) and fruit & nuts, not include oil nut (057).
Singapore. In 1997, five among the top-ten export products of Singapore are from the manufacturing sector (secondary), and five others derived from agriculture (primary), i.e.: tin (687), spices (075), petroleum products (334), tobacco manufactured (122), and natural
Sources: WITS (2015)
Figure 14: Products Mapping and the Top-Ten Export Products of Singapore, 1997
Sources: WITS (2015)
Figure 15: Products Mapping and the Top-Ten Export Products of Singapore, 2014
Compare to 1997, Singapore’s 2014 top-ten products almost entirely from secondary sector (eight). Only two of them come from primary sectors, i.e tin (687) and petroleum prod-ucts (334). The rest are from manufacturing and technology industries.

24
Jayadi, A., & Aziz, H.A.
Comparative Advantage Analysis and Products Mapping of Indonesia, Malaysia, Philippines, Singapore, Thailand, And Vietnam Export Products
Thailand. In 1997, among the top-ten export products of Thailand’s are from the man-ufacturing sector (secondary), i.e.: jewelry, goldsmith and other art (897), television recievers (761) and parts of accessories (759). The seven other products derived from agriculture and mining (primary).
Sources: WITS (2015)
Figure 16: Products Mapping and the Top-Ten Export Products of Thailand, 1997
Sources: WITS (2015)
Figure 17: Products Mapping and the Top-Ten Export Products of Thailand, 2014
Four of Thailand’s 2014 top-ten come from the secondary sector. There is shifting spe-cialization on technology based industries. It can be seen from its products, e.g.: radio- broad-cast recievers (762), materials for rubber (621), motor vehicles for transport (782) and starch-es, inulin & wheat gluten (592).
Sources: WITS (2015)
Figure 18: Products Mapping and the Top-Ten Export Products of Vietnam, 1997

25
JDE (Journal of Developing Economies) Vol. 2 No. 1 (2017): 14-26
Sources: WITS (2015)
Figure 19: Products Mapping and the Top-Ten Export Products of Vietnam, 2014
Vietnam. In 1997, four among the top-ten export products of Vietnam’s are from the manufacturing sector (secondary), i.e.: footwear 9851), outer garments, textile (842), travel goods, handbag, brief-case (831) and silk (261). The rest are from primary sector.
Vietnam’s 2014 top-ten are like 1997, which is half of it come from secondary sector. The five of primary sectors products are: spices (075), rice (042), coffee and coffee substitutes (071), crustaceans and molluscs (037) and fish, crustaceans and molluscs (036).
The results shows that between comparative advantage and trade balance have pos-itive relationship. The product with high index in RSCA also has high TBI index. The results support by Widodo (2009) in his study of Indonesia, Malaysia, Singapore, Thailand and Phil-ippines.
Conclusion
From the discussion above, it can be concluded that: first, on average, the comparative advantage of six countries increase. It can be seen from the negative trend of groups D curve, or positive trend of groups A curve. Second, Thailand and Vietnam’s comparative advantage and trade balance changes seems more dynamic than those of other four countries.
Third, there is competition and complementary amongst six countries. Indonesia, Thailand and Vietnam are competing in the similar industries (primary sector), while Malaysia and Singapore are in secondary sector (manufacture and technology). It supported Shohibul (2013) study that Indonesia is not consistent for manufactured products, but consistent with primary sector.
The six countries showed flying geese pattern where Singapore is the leader among the others in manufactured and technology products. It is followed sequently by Malaysia, Philippines, Indonesia, Thailand, and Vietnam. This is support Kojima’s study on Asian economic develop-ment.
References
Balassa, B. (1965). Trade liberalisation and “revealed” comparative advantage 1. The Man-chester School of Economic and Social Sudies, 33(2), 99–123.
Dalum, B., Laursen, K., & Villumsen, G. (1998). Structural change in OECD export specialisation patterns: De-specialisation and ‘stickiness.’ International Review of Applied Economics, 12(3), 423–443.
Dowlinga, M., & Cheang, C. T. (2000). Shifting comparative advantage in Asia: New tests of the “flying geese” model. Journal of Asian Economics, 11(4), 443–463.

26
Jayadi, A., & Aziz, H.A.
Comparative Advantage Analysis and Products Mapping of Indonesia, Malaysia, Philippines, Singapore, Thailand, And Vietnam Export Products
Ginzburg, A., & Simonazzi, A. (2005). Patterns of industrialization and the flying geese model: The case of electronics in East Asia. Journal of Asian Economics, 15(6), 1051–1078.
Grossman, G. M., & Helpman, E. (1991). Innovation and growth in the global economy. MIT press.
Jones, R.W. (2000). Globalization and the Theory of Input Trade. MIT Press, Cambridge.
Kojima, K. (2000). The “flying geese” model of Asian economic development: Origin, theoret-ical extensions, and regional policy implications. Journal of Asian Economics, 11(4), 375–401.
Krugman, P. R. (1979). Increasing returns, monopolistic competition, and international trade. Journal of International Economics, 9(4), 469–479.
Kwan, C. H. (2002). The rise of China and Asia’s flying-geese pattern of economic develop-ment: An empirical analysis based on US import statistics. NRI Papers, 52(1), 1–11.
Ljungwall, C., & Sjöberg, Ö. (2005). The economic impact of globalization in Asia-Pacific: The case of the flying geese. China Center for Economic Research Working Paper Series, E2005007.
Maule, A. (1996). Some implications of AFTA for Thailand: A revealed comparative advantage approach. ASEAN Economic Bulletin, 14–38.
Redding, S. (2002). Specialization dynamics. Journal of International Economics, 58(2), 299–334.
Shohibul, A. (2013). Revealed comparative advantage measure: ASEAN-China trade flows. Journal of Economics and Sustainable Development, 4(7), 136–145.
Trefler, D. (1995). The case of the missing trade and other mysteries. The American Economic Review, 1029–1046.
Venables, A. J. (2001). Geography and international inequalities: The impact of new technolo-gies. Journal of Industry, Competition and Trade, 1(2), 135–159.
Widodo, T. (2008a). Dynamic changes in comparative advantage: Japan “flying geese” model and its implications for China. Journal of Chinese Economic and Foreign Trade Studies.
Widodo, T. (2008b). Pattern of Specialization: Case Studies of India and China. Gadjah Mada International Journal of Business, 10(1).
Widodo, T. (2008c). The structure of protection in Indonesian manufacturing sector. ASEAN Economic Bulletin, 161–178.
Widodo, T. (2009). Comparative advantage: Theory, empirical measures and case studies. Re-view of Economic and Business Studies (REBS), 4, 57–82.
WITS. (2015). Exports By Country Product to World in US$ Thousand 1997-2014. WITS. https://wits.worldbank.org/
Wong, J., & Chan, S. (2003). China-ASEAN free trade agreement: Shaping future economic relations. Asian Survey, 43(3), 507–526.