Embed Size (px)
Citation preview
Emkay Research is also available on www.emkayglobal.com and Bloomberg EMKAY<GO>. Please refer to the last page of the report on Restrictions on Distribution. In Singapore, this research report or research analyses may only be distributed to Institutional Investors, Expert Investors or Accredited Investors as defined in the Securities and Futures Act, Chapter 289 of Singapore.
©
Your success is our success
Emkay
India Equity Research | Oil & Gas
August 23, 2021
Company Update
Gulf Oil Lubricants Refer to important disclosures at the end of this report
Share price adequately reflects EV risks; maintain BUY with a reduced TP of Rs800
We believe GOLI’s share price is adequately reflecting the upcoming, multi-decade EV
transition; our Auto research team has modeled share of EVs in vehicle population (parc)
at 10% by FY30E and 41% by FY40E, with share of EV sales at 31%/66% in FY30E/40E.
2W, 3W and buses would see the fastest EV adoption followed by PVs and LCVs, while
M&HCVs would see fairly muted impact over the next decade. We model Indian lube
volumes to see a CAGR of ~2% in FY21-30E and ~1% in FY30E-40E.
We shift to DCF-valuation from P/E, and reduce TP to Rs800 (Sep’22E) from Rs1,000
(Mar’22E). We expect GOLI to sustain volume growth at 2-3x of industry, and thus forecast
volume CAGR of ~4% over FY21-30E, followed by a 2% terminal FCFF growth post FY30.
With stabilizing base oil prices, recent RSP hikes and volume recovery, EBITDA margin
should return to 15%+ by FY23E, and RoICs to the earlier range of 40-45% from FY24E.
GOLI is valued attractively at FY23E/24E FCFF yield of 8%/11% and stock at a 5-year low
(excl. Mar’20 Covid). Key risk is capital allocation, even as we model a rising payout. BUY!
.
Relative price chart
Source: Bloomberg This report is solely produced by Emkay Global. The following person(s) are responsible for the production of the recommendation:
Sabri Hazarika
+91 22 6612 1282
Tanay Gabhawala
+91 22 6612 1336
-40
-30
-20
-10
0
10
550
605
660
715
770
825
Aug-20 Oct-20 Dec-20Feb-21 Apr-21 Jun-21 Aug-21
%Rs
Gulf Oil Lubricants (LHS) Rel to Nifty (RHS)
EVs to grow but concerns on medium to long-term Indian lube demand overblown:
Based on our auto analysts’ forecast, FY21-30E non-EV parc is estimated to see 3.5% CAGR
while beyond FY30, it is likely to remain stagnant. Our basic industry lube demand model in
turn implies a 1.9%/1.4% CAGR in these periods. We note that players like GOLI’s exposure
to segments like STC buses and 3W is minimal, which have sizeable EV risks. While 2W
(GOLI’s volume share: 20%+) could see wide EV adoption, impact on PVs-4W (5%) and LCVs
would be in varying degrees. M&HCVs, which is sizeable in the lube mix, are unlikely to see
much EV conversions. Industrials would also be outside this. GOLI has maintained its 2-3x
industry growth guidance (at least for the next 3-4 years), which implies continuing market
share gains. We build in ~4% CAGR till FY30 and a ~2% terminal growth rate beyond this.
EBITDA margins likely to have bottomed out in Q1FY22 with guidance at 15-17%: The
last 1.5 years saw volatility in GOLI’s margins owing to Covid and the sharp rise in base oil
prices. However, with Covid situation improving and an uptick in global GRMs aiding higher
refinery utilization, input costs should stabilize going ahead. Management has indicated LOBS
prices are not moving up further and June-July saw good sales recovery. The company took
four price hikes in H1CY21 and has largely covered the rise in COGS. Against 10% EBITDA
margin in Q1FY22, management expects to return to 15-17% levels. With realizations up,
EBITDA/ltr, which was Rs15.3 in Q1, is expected to reach Rs24-26 in FY23-24.
Strong financial metrics; healthy FCF to be put in EV chain and dividends: Our DCF-
based TP implies 15.3x Sep’23E target PE (20x Mar’23E earlier) but is more objective with
the long-term outlook embedded. GOLI’s financials are strong with a 35-40% recurring RoIC,
8-11% FCFF yield and 3-4x asset turnover in FY23-24. FCFF would be robust at ~Rs2bn p.a.,
to be put in the EV value chain (which we believe is a justifiable long-term de-risking strategy),
capex and dividend. We do not expect core decadal expansion capex to be much and
anticipate dividend payout to progressively increase going ahead (vs. 40% now). We cut FY22
EPS by 15% building Q1 number and FY23/24E by 4%/2% by lowering volumes. Key risks
are recurring Covid waves, adverse commodities -currency and FCF usage/capital allocation.
Please see our sector model portfolio (Emkay Alpha Portfolio): Oil & Gas (Page 10)
CMP Target Price
Rs 572 Rs 800 (▼) as of (August 20, 2021) 12 months
Rating Upside
BUY (■) 39.9 %
Change in Estimates
EPS Chg FY22E/FY23E (%) (15)/(4)
Target Price change (%) (20.0)
Target Period (Months) 12
Previous Reco BUY
Emkay vs Consensus
EPS Estimates
FY22E FY23E
Emkay 37.3 48.1
Consensus 42.9 48.6
Mean Consensus TP (12M) Rs 897
Stock Details
Bloomberg Code GOLI IN
Face Value (Rs) 2
Shares outstanding (mn) 50
52 Week H/L 846 / 571
M Cap (Rs bn/USD bn) 29 / 0.39
Daily Avg Volume (nos.) 73,829
Daily Avg Turnover (US$ mn) 0.7
Shareholding Pattern Jun '21
Promoters 72.0%
FIIs 10.1%
DIIs 5.5%
Public and Others 12.4%
Price Performance
(%) 1M 3M 6M 12M
Absolute (13) (18) (21) (13)
Rel. to Nifty (17) (25) (28) (40)
Financial Snapshot (Standalone)
(Rs mn) FY20 FY21 FY22E FY23E FY24E
Revenue 16,442 16,522 18,719 20,434 22,108
EBITDA 2,872 2,652 2,549 3,101 3,526
EBITDA Margin (%) 17.5 16.1 13.6 15.2 15.9
APAT 2,025 2,001 1,874 2,422 2,853
EPS (Rs) 40.4 39.8 37.3 48.1 56.7
EPS (% chg) 13.2 (1.6) (6.3) 29.2 17.8
ROE (%) 30.0 24.5 20.4 23.3 24.3
P/E (x) 14.2 14.4 15.4 11.9 10.1
EV/EBITDA (x) 9.4 9.8 9.8 7.8 6.5
P/BV (x) 3.8 3.3 3.0 2.6 2.3
Source: Company, Emkay Research
Gulf Oil Lubricants (GOLI IN) India Equity Research | Company Update
Emkay Research is also available on www.emkayglobal.com and Bloomberg EMKAY<GO>. Please refer to the last page of the report on Restrictions on Distribution. In Singapore, this research report or research analyses may only be distributed to Institutional Investors, Expert Investors or Accredited Investors as defined in the Securities and Futures Act, Chapter 289 of Singapore.
August 23, 2021 | 2
Story in Charts
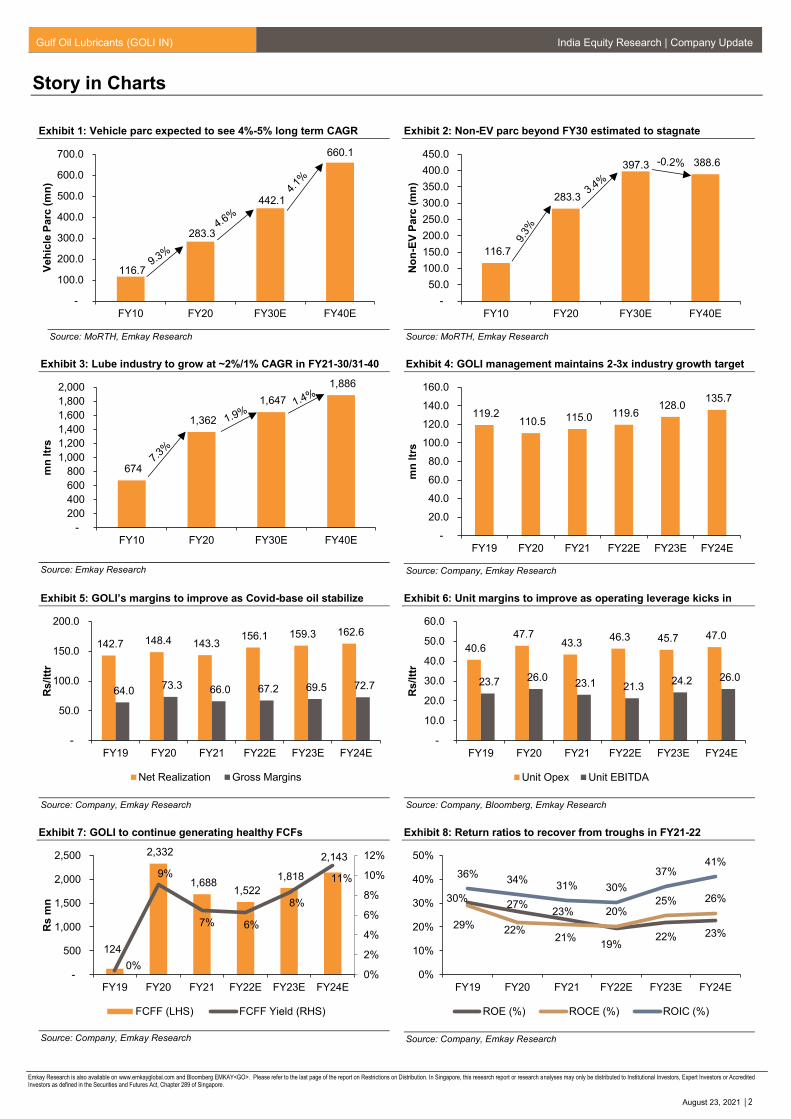
Exhibit 1: Vehicle parc expected to see 4%-5% long term CAGR
Source: MoRTH, Emkay Research
Exhibit 2: Non-EV parc beyond FY30 estimated to stagnate
Source: MoRTH, Emkay Research
Exhibit 3: Lube industry to grow at ~2%/1% CAGR in FY21-30/31-40
Source: Emkay Research
Exhibit 4: GOLI management maintains 2-3x industry growth target
Source: Company, Emkay Research
Exhibit 5: GOLI’s margins to improve as Covid-base oil stabilize
Source: Company, Emkay Research
Exhibit 6: Unit margins to improve as operating leverage kicks in
Source: Company, Bloomberg, Emkay Research
Exhibit 7: GOLI to continue generating healthy FCFs
Source: Company, Emkay Research
Exhibit 8: Return ratios to recover from troughs in FY21-22
Source: Company, Emkay Research
116.7
283.3
442.1
660.1
-
100.0
200.0
300.0
400.0
500.0
600.0
700.0
FY10 FY20 FY30E FY40E
Veh
icle
Parc
(m
n)
116.7
283.3
397.3 388.6
-
50.0
100.0
150.0
200.0
250.0
300.0
350.0
400.0
450.0
FY10 FY20 FY30E FY40E
No
n-E
V P
arc
(m
n)
674
1,362
1,647
1,886
-
200
400
600
800
1,000
1,200
1,400
1,600
1,800
2,000
FY10 FY20 FY30E FY40E
mn
ltr
s
119.2 110.5 115.0 119.6
128.0 135.7
-
20.0
40.0
60.0
80.0
100.0
120.0
140.0
160.0
FY19 FY20 FY21 FY22E FY23E FY24E
mn
ltr
s
142.7 148.4 143.3 156.1 159.3 162.6
64.0 73.3 66.0 67.2 69.5 72.7
-
50.0
100.0
150.0
200.0
FY19 FY20 FY21 FY22E FY23E FY24E
Rs/l
ttr
Net Realization Gross Margins
40.6
47.7 43.3
46.3 45.7 47.0
23.7 26.0 23.1 21.3
24.2 26.0
-
10.0
20.0
30.0
40.0
50.0
60.0
FY19 FY20 FY21 FY22E FY23E FY24E
Rs/l
ttr
Unit Opex Unit EBITDA
124
2,332
1,688 1,522
1,818
2,143
0%
9%
7% 6%
8%
11%
0%
2%
4%
6%
8%
10%
12%
-
500
1,000
1,500
2,000
2,500
FY19 FY20 FY21 FY22E FY23E FY24E
Rs m
n
FCFF (LHS) FCFF Yield (RHS)
30%27%
23%
19%22% 23%
29%22%
21%
20%25% 26%
36%34%
31% 30%
37%41%
0%
10%
20%
30%
40%
50%
FY19 FY20 FY21 FY22E FY23E FY24E
ROE (%) ROCE (%) ROIC (%)
Gulf Oil Lubricants (GOLI IN) India Equity Research | Company Update
Emkay Research is also available on www.emkayglobal.com and Bloomberg EMKAY<GO>. Please refer to the last page of the report on Restrictions on Distribution. In Singapore, this research report or research analyses may only be distributed to Institutional Investors, Expert Investors or Accredited Investors as defined in the Securities and Futures Act, Chapter 289 of Singapore.
August 23, 2021 | 3
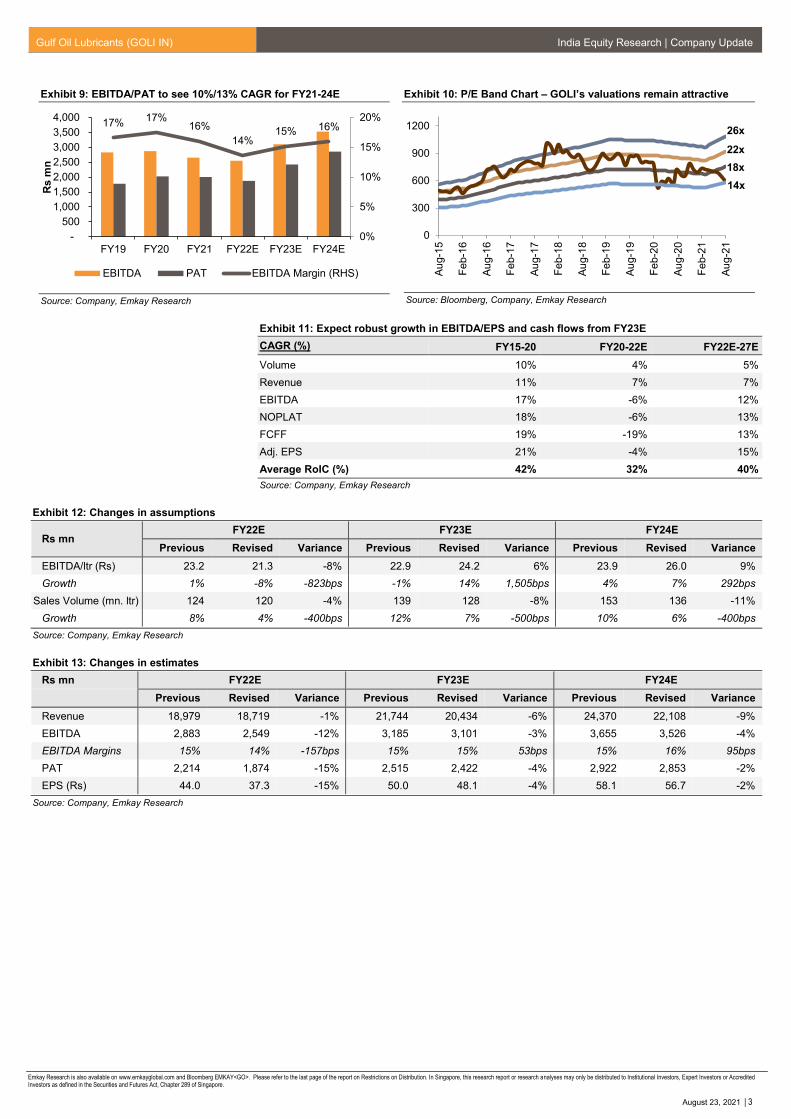
Exhibit 9: EBITDA/PAT to see 10%/13% CAGR for FY21-24E
Source: Company, Emkay Research
Exhibit 10: P/E Band Chart – GOLI’s valuations remain attractive
Source: Bloomberg, Company, Emkay Research
Exhibit 11: Expect robust growth in EBITDA/EPS and cash flows from FY23E
CAGR (%) FY15-20 FY20-22E FY22E-27E
Volume 10% 4% 5%
Revenue 11% 7% 7%
EBITDA 17% -6% 12%
NOPLAT 18% -6% 13%
FCFF 19% -19% 13%
Adj. EPS 21% -4% 15%
Average RoIC (%) 42% 32% 40%
Source: Company, Emkay Research
Exhibit 12: Changes in assumptions
Rs mn FY22E FY23E FY24E
Previous Revised Variance Previous Revised Variance Previous Revised Variance
EBITDA/ltr (Rs) 23.2 21.3 -8% 22.9 24.2 6% 23.9 26.0 9%
Growth 1% -8% -823bps -1% 14% 1,505bps 4% 7% 292bps
Sales Volume (mn. ltr) 124 120 -4% 139 128 -8% 153 136 -11%
Growth 8% 4% -400bps 12% 7% -500bps 10% 6% -400bps
Source: Company, Emkay Research
Exhibit 13: Changes in estimates
Rs mn FY22E FY23E FY24E
Previous Revised Variance Previous Revised Variance Previous Revised Variance
Revenue 18,979 18,719 -1% 21,744 20,434 -6% 24,370 22,108 -9%
EBITDA 2,883 2,549 -12% 3,185 3,101 -3% 3,655 3,526 -4%
EBITDA Margins 15% 14% -157bps 15% 15% 53bps 15% 16% 95bps
PAT 2,214 1,874 -15% 2,515 2,422 -4% 2,922 2,853 -2%
EPS (Rs) 44.0 37.3 -15% 50.0 48.1 -4% 58.1 56.7 -2%
Source: Company, Emkay Research
17%17%
16%
14%15% 16%
0%
5%
10%
15%
20%
-
500
1,000
1,500
2,000
2,500
3,000
3,500
4,000
FY19 FY20 FY21 FY22E FY23E FY24E
Rs m
n
EBITDA PAT EBITDA Margin (RHS)
0
300
600
900
1200
Au
g-1
5
Fe
b-1
6
Au
g-1
6
Fe
b-1
7
Au
g-1
7
Fe
b-1
8
Au
g-1
8
Fe
b-1
9
Au
g-1
9
Fe
b-2
0
Au
g-2
0
Fe
b-2
1
Au
g-2
1
14x
18x
22x
26x
Gulf Oil Lubricants (GOLI IN) India Equity Research | Company Update
Emkay Research is also available on www.emkayglobal.com and Bloomberg EMKAY<GO>. Please refer to the last page of the report on Restrictions on Distribution. In Singapore, this research report or research analyses may only be distributed to Institutional Investors, Expert Investors or Accredited Investors as defined in the Securities and Futures Act, Chapter 289 of Singapore.
August 23, 2021 | 4
Exhibit 14: DCF Valuation
DCF Assumptions Sep’23E (Rs mn) Standalone
Risk Free Rate 6.5% NPV Of FCF 16,782
Risk Premium 5.5% Terminal Value 46,352
Beta 0.6 PV Of TV 17,865
Cost Of Equity 10.0% Total Value 34,647
Cost Of Debt 9.0% Less: Net Debt (Sep’22E) -5,619
Post Tax Cost Of Debt 6.8% Equity Value 40,266
Average Debt: Equity Ratio 0.0% No. Of Shares O/S (mn) 50
WACC 10.0% Core Business Fair Value (Rs.) 800
Terminal Growth Rate 2.0%
Source: Company, Emkay Research
Exhibit 15: PE-Based Valuation
Rs FY19 FY20 FY21 FY22E FY23E FY24E
EPS 35.7 40.4 39.8 37.3 48.1 56.7
Target Multiple (x) 15.3
Target Price 800
Source: Company, Emkay Research
Q1FY22 Result Update
Gulf Oil Lubricants India reported revenue/EBITDA/PAT of Rs4.17bn/421mn/304mn in
Q1FY22, up 73%/66%/77% yoy, down 19%/46%/49% qoq and 13%/37%/43% below our
estimates. The revenue miss was mainly due to 13% lower-than-expected volumes, while
EBITDA/ltr came in 27% below estimates as unit opex was higher than expectations.
Employee cost was up 14% yoy/3% qoq to Rs298mn, while Other Expenses increased
65% yoy to Rs975mn (down 16% qoq). Interest cost rose to Rs40mn (due to forex loss),
while Other Income was down 17% yoy/15% qoq to Rs108mn. The tax rate was in line at
25.4%.
Total reported lube sales volume rose 57% yoy/fell 21% qoq to 27.5mn ltr. The second
Covid wave (Apr-May) largely impacted the B2C segment. Rural India faced the bigger
impact yoy, affecting agri-sales. Industrial operated partially or fully though, and B2B was
overall better. GOLI continued double-digit growth in automotive, driven by PM and CVO.
Volumes have started to recover from June and are currently robust.
Net realization was up 3% qoq to Rs151.8/ltr (in line), while unit COGS rose 7% (also in
line). Gross margin fell 3% qoq to Rs61.6/ltr (1% above est.). Rising input costs led to focus
on margin management and a series of price hikes were taken in the last 6 months. Unit
opex fell 5% yoy/rose 12% qoq to Rs46.3/ltr (16% above est.). EBITDA/ltr came in at
Rs15.3, down 31% qoq/up 5% yoy with margin at 10% vs. 15% in Q4.
The company expects to regain margin trajectory as new prices come into play. Advertising
and marketing activities continued. The board has approved (subject to shareholder
approval at AGM) to amend the objects clause of MoA to enable the company to explore
and pursue business opportunities in areas of e-Mobility and EV value chain (including EV
batteries, chargers and charging-related infra).
Gulf Oil Lubricants (GOLI IN) India Equity Research | Company Update
Emkay Research is also available on www.emkayglobal.com and Bloomberg EMKAY<GO>. Please refer to the last page of the report on Restrictions on Distribution. In Singapore, this research report or research analyses may only be distributed to Institutional Investors, Expert Investors or Accredited Investors as defined in the Securities and Futures Act, Chapter 289 of Singapore.
August 23, 2021 | 5
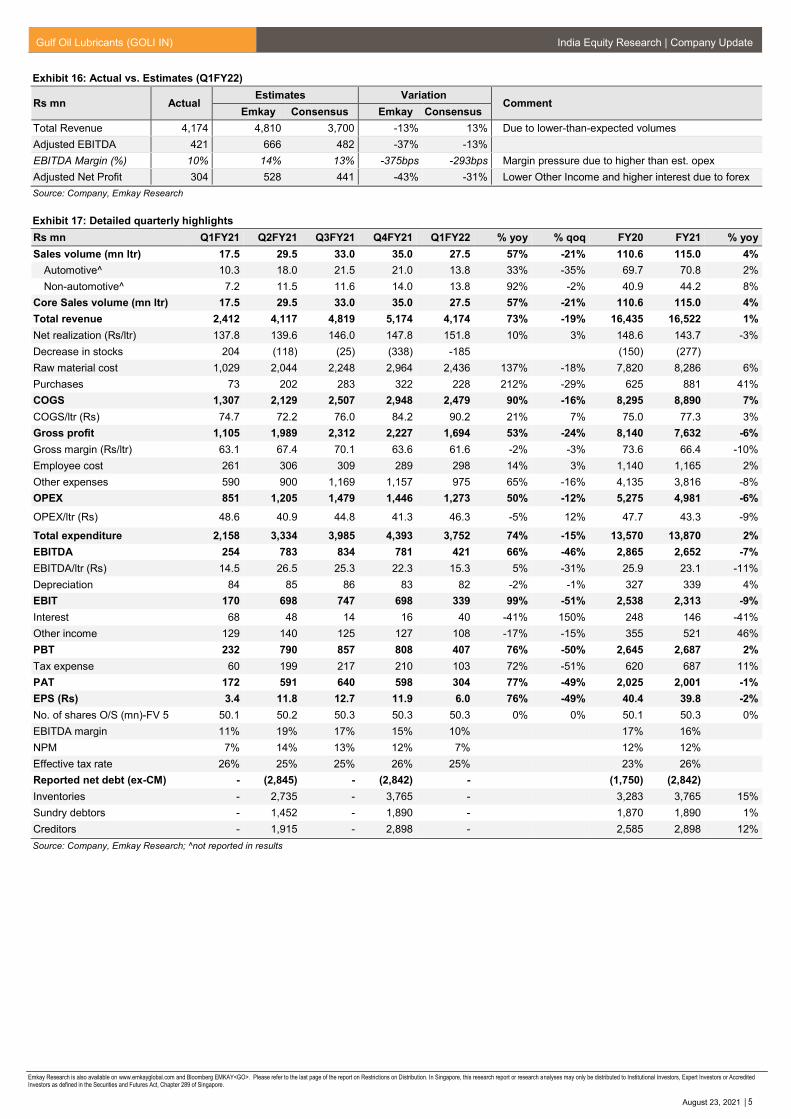
Exhibit 16: Actual vs. Estimates (Q1FY22)
Rs mn Actual Estimates Variation
Comment Emkay Consensus Emkay Consensus
Total Revenue 4,174 4,810 3,700 -13% 13% Due to lower-than-expected volumes
Adjusted EBITDA 421 666 482 -37% -13%
EBITDA Margin (%) 10% 14% 13% -375bps -293bps Margin pressure due to higher than est. opex
Adjusted Net Profit 304 528 441 -43% -31% Lower Other Income and higher interest due to forex
Source: Company, Emkay Research
Exhibit 17: Detailed quarterly highlights
Rs mn Q1FY21 Q2FY21 Q3FY21 Q4FY21 Q1FY22 % yoy % qoq FY20 FY21 % yoy
Sales volume (mn ltr) 17.5 29.5 33.0 35.0 27.5 57% -21% 110.6 115.0 4%
Automotive^ 10.3 18.0 21.5 21.0 13.8 33% -35% 69.7 70.8 2%
Non-automotive^ 7.2 11.5 11.6 14.0 13.8 92% -2% 40.9 44.2 8%
Core Sales volume (mn ltr) 17.5 29.5 33.0 35.0 27.5 57% -21% 110.6 115.0 4%
Total revenue 2,412 4,117 4,819 5,174 4,174 73% -19% 16,435 16,522 1%
Net realization (Rs/ltr) 137.8 139.6 146.0 147.8 151.8 10% 3% 148.6 143.7 -3%
Decrease in stocks 204 (118) (25) (338) -185 (150) (277)
Raw material cost 1,029 2,044 2,248 2,964 2,436 137% -18% 7,820 8,286 6%
Purchases 73 202 283 322 228 212% -29% 625 881 41%
COGS 1,307 2,129 2,507 2,948 2,479 90% -16% 8,295 8,890 7%
COGS/ltr (Rs) 74.7 72.2 76.0 84.2 90.2 21% 7% 75.0 77.3 3%
Gross profit 1,105 1,989 2,312 2,227 1,694 53% -24% 8,140 7,632 -6%
Gross margin (Rs/ltr) 63.1 67.4 70.1 63.6 61.6 -2% -3% 73.6 66.4 -10%
Employee cost 261 306 309 289 298 14% 3% 1,140 1,165 2%
Other expenses 590 900 1,169 1,157 975 65% -16% 4,135 3,816 -8%
OPEX 851 1,205 1,479 1,446 1,273 50% -12% 5,275 4,981 -6%
OPEX/ltr (Rs) 48.6 40.9 44.8 41.3 46.3 -5% 12% 47.7 43.3 -9%
Total expenditure 2,158 3,334 3,985 4,393 3,752 74% -15% 13,570 13,870 2%
EBITDA 254 783 834 781 421 66% -46% 2,865 2,652 -7%
EBITDA/ltr (Rs) 14.5 26.5 25.3 22.3 15.3 5% -31% 25.9 23.1 -11%
Depreciation 84 85 86 83 82 -2% -1% 327 339 4%
EBIT 170 698 747 698 339 99% -51% 2,538 2,313 -9%
Interest 68 48 14 16 40 -41% 150% 248 146 -41%
Other income 129 140 125 127 108 -17% -15% 355 521 46%
PBT 232 790 857 808 407 76% -50% 2,645 2,687 2%
Tax expense 60 199 217 210 103 72% -51% 620 687 11%
PAT 172 591 640 598 304 77% -49% 2,025 2,001 -1%
EPS (Rs) 3.4 11.8 12.7 11.9 6.0 76% -49% 40.4 39.8 -2%
No. of shares O/S (mn)-FV 5 50.1 50.2 50.3 50.3 50.3 0% 0% 50.1 50.3 0%
EBITDA margin 11% 19% 17% 15% 10% 17% 16%
NPM 7% 14% 13% 12% 7% 12% 12%
Effective tax rate 26% 25% 25% 26% 25% 23% 26%
Reported net debt (ex-CM) - (2,845) - (2,842) - (1,750) (2,842)
Inventories - 2,735 - 3,765 - 3,283 3,765 15%
Sundry debtors - 1,452 - 1,890 - 1,870 1,890 1%
Creditors - 1,915 - 2,898 - 2,585 2,898 12%
Source: Company, Emkay Research; ^not reported in results
Gulf Oil Lubricants (GOLI IN) India Equity Research | Company Update
Emkay Research is also available on www.emkayglobal.com and Bloomberg EMKAY<GO>. Please refer to the last page of the report on Restrictions on Distribution. In Singapore, this research report or research analyses may only be distributed to Institutional Investors, Expert Investors or Accredited Investors as defined in the Securities and Futures Act, Chapter 289 of Singapore.
August 23, 2021 | 6
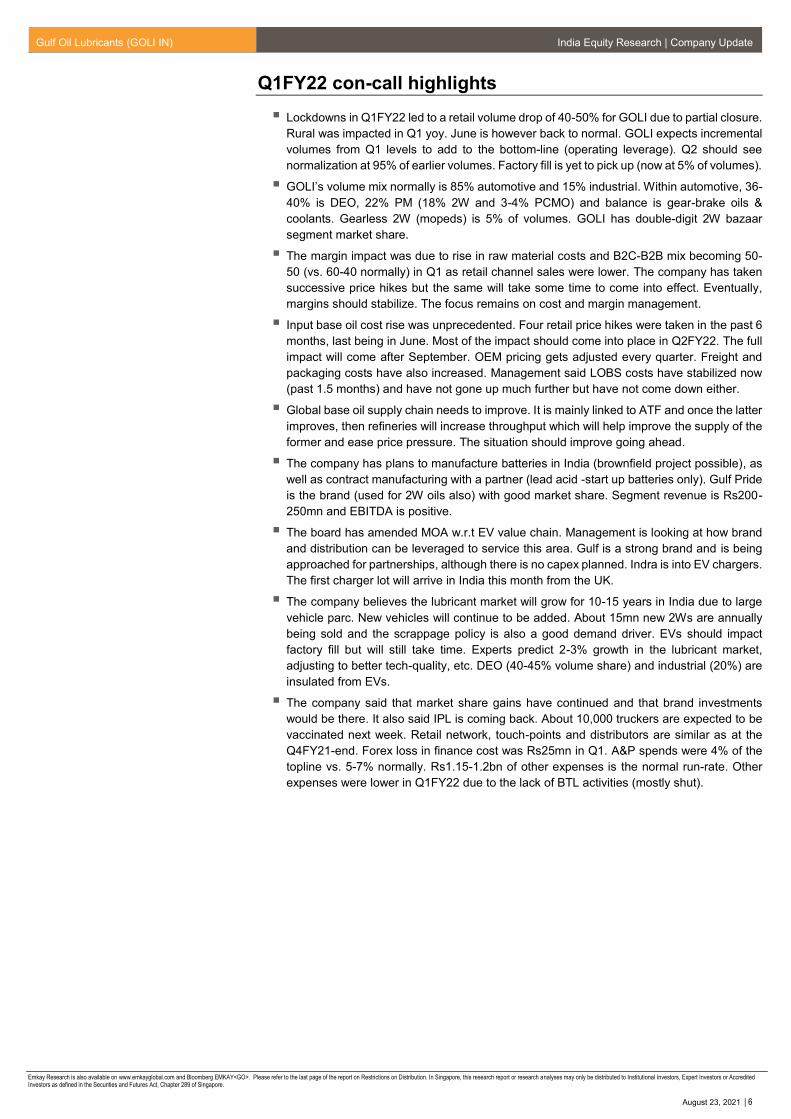
Q1FY22 con-call highlights
Lockdowns in Q1FY22 led to a retail volume drop of 40-50% for GOLI due to partial closure.
Rural was impacted in Q1 yoy. June is however back to normal. GOLI expects incremental
volumes from Q1 levels to add to the bottom-line (operating leverage). Q2 should see
normalization at 95% of earlier volumes. Factory fill is yet to pick up (now at 5% of volumes).
GOLI’s volume mix normally is 85% automotive and 15% industrial. Within automotive, 36-
40% is DEO, 22% PM (18% 2W and 3-4% PCMO) and balance is gear-brake oils &
coolants. Gearless 2W (mopeds) is 5% of volumes. GOLI has double-digit 2W bazaar
segment market share.
The margin impact was due to rise in raw material costs and B2C-B2B mix becoming 50-
50 (vs. 60-40 normally) in Q1 as retail channel sales were lower. The company has taken
successive price hikes but the same will take some time to come into effect. Eventually,
margins should stabilize. The focus remains on cost and margin management.
Input base oil cost rise was unprecedented. Four retail price hikes were taken in the past 6
months, last being in June. Most of the impact should come into place in Q2FY22. The full
impact will come after September. OEM pricing gets adjusted every quarter. Freight and
packaging costs have also increased. Management said LOBS costs have stabilized now
(past 1.5 months) and have not gone up much further but have not come down either.
Global base oil supply chain needs to improve. It is mainly linked to ATF and once the latter
improves, then refineries will increase throughput which will help improve the supply of the
former and ease price pressure. The situation should improve going ahead.
The company has plans to manufacture batteries in India (brownfield project possible), as
well as contract manufacturing with a partner (lead acid -start up batteries only). Gulf Pride
is the brand (used for 2W oils also) with good market share. Segment revenue is Rs200-
250mn and EBITDA is positive.
The board has amended MOA w.r.t EV value chain. Management is looking at how brand
and distribution can be leveraged to service this area. Gulf is a strong brand and is being
approached for partnerships, although there is no capex planned. Indra is into EV chargers.
The first charger lot will arrive in India this month from the UK.
The company believes the lubricant market will grow for 10-15 years in India due to large
vehicle parc. New vehicles will continue to be added. About 15mn new 2Ws are annually
being sold and the scrappage policy is also a good demand driver. EVs should impact
factory fill but will still take time. Experts predict 2-3% growth in the lubricant market,
adjusting to better tech-quality, etc. DEO (40-45% volume share) and industrial (20%) are
insulated from EVs.
The company said that market share gains have continued and that brand investments
would be there. It also said IPL is coming back. About 10,000 truckers are expected to be
vaccinated next week. Retail network, touch-points and distributors are similar as at the
Q4FY21-end. Forex loss in finance cost was Rs25mn in Q1. A&P spends were 4% of the
topline vs. 5-7% normally. Rs1.15-1.2bn of other expenses is the normal run-rate. Other
expenses were lower in Q1FY22 due to the lack of BTL activities (mostly shut).
Gulf Oil Lubricants (GOLI IN) India Equity Research | Company Update
Emkay Research is also available on www.emkayglobal.com and Bloomberg EMKAY<GO>. Please refer to the last page of the report on Restrictions on Distribution. In Singapore, this research report or research analyses may only be distributed to Institutional Investors, Expert Investors or Accredited Investors as defined in the Securities and Futures Act, Chapter 289 of Singapore.
August 23, 2021 | 7
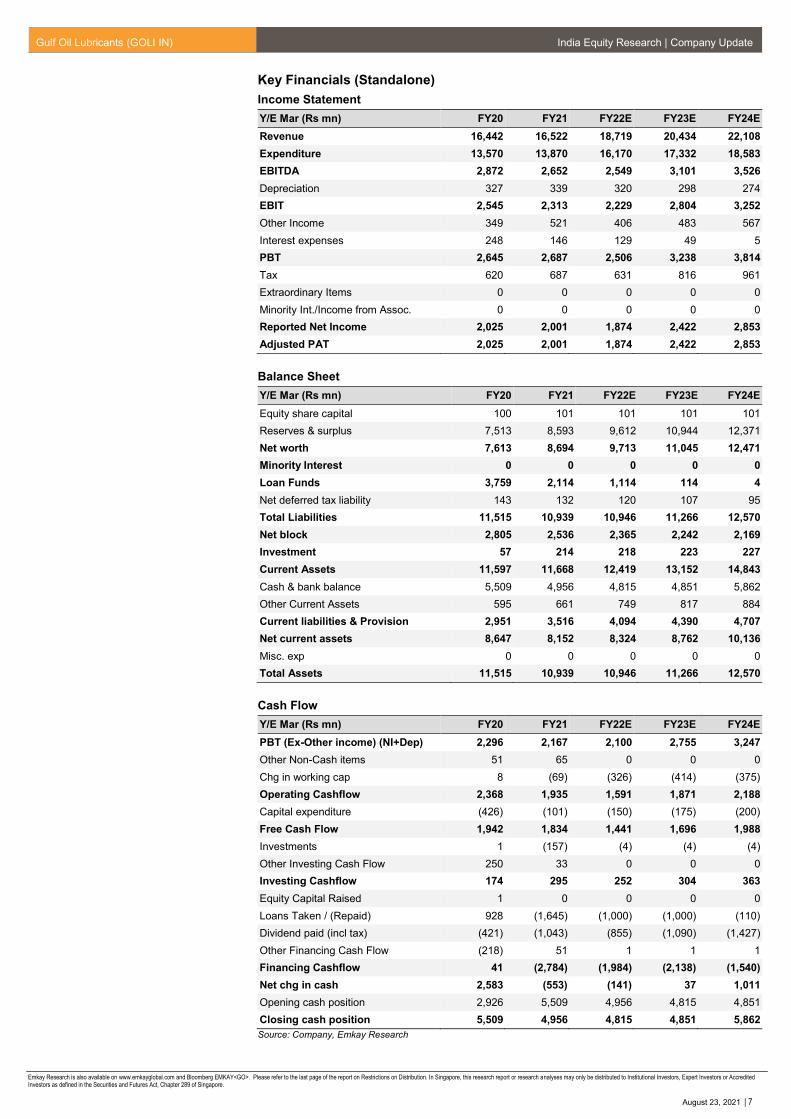
Key Financials (Standalone)
Income Statement
Y/E Mar (Rs mn) FY20 FY21 FY22E FY23E FY24E
Revenue 16,442 16,522 18,719 20,434 22,108
Expenditure 13,570 13,870 16,170 17,332 18,583
EBITDA 2,872 2,652 2,549 3,101 3,526
Depreciation 327 339 320 298 274
EBIT 2,545 2,313 2,229 2,804 3,252
Other Income 349 521 406 483 567
Interest expenses 248 146 129 49 5
PBT 2,645 2,687 2,506 3,238 3,814
Tax 620 687 631 816 961
Extraordinary Items 0 0 0 0 0
Minority Int./Income from Assoc. 0 0 0 0 0
Reported Net Income 2,025 2,001 1,874 2,422 2,853
Adjusted PAT 2,025 2,001 1,874 2,422 2,853
Balance Sheet
Y/E Mar (Rs mn) FY20 FY21 FY22E FY23E FY24E
Equity share capital 100 101 101 101 101
Reserves & surplus 7,513 8,593 9,612 10,944 12,371
Net worth 7,613 8,694 9,713 11,045 12,471
Minority Interest 0 0 0 0 0
Loan Funds 3,759 2,114 1,114 114 4
Net deferred tax liability 143 132 120 107 95
Total Liabilities 11,515 10,939 10,946 11,266 12,570
Net block 2,805 2,536 2,365 2,242 2,169
Investment 57 214 218 223 227
Current Assets 11,597 11,668 12,419 13,152 14,843
Cash & bank balance 5,509 4,956 4,815 4,851 5,862
Other Current Assets 595 661 749 817 884
Current liabilities & Provision 2,951 3,516 4,094 4,390 4,707
Net current assets 8,647 8,152 8,324 8,762 10,136
Misc. exp 0 0 0 0 0
Total Assets 11,515 10,939 10,946 11,266 12,570
Cash Flow
Y/E Mar (Rs mn) FY20 FY21 FY22E FY23E FY24E
PBT (Ex-Other income) (NI+Dep) 2,296 2,167 2,100 2,755 3,247
Other Non-Cash items 51 65 0 0 0
Chg in working cap 8 (69) (326) (414) (375)
Operating Cashflow 2,368 1,935 1,591 1,871 2,188
Capital expenditure (426) (101) (150) (175) (200)
Free Cash Flow 1,942 1,834 1,441 1,696 1,988
Investments 1 (157) (4) (4) (4)
Other Investing Cash Flow 250 33 0 0 0
Investing Cashflow 174 295 252 304 363
Equity Capital Raised 1 0 0 0 0
Loans Taken / (Repaid) 928 (1,645) (1,000) (1,000) (110)
Dividend paid (incl tax) (421) (1,043) (855) (1,090) (1,427)
Other Financing Cash Flow (218) 51 1 1 1
Financing Cashflow 41 (2,784) (1,984) (2,138) (1,540)
Net chg in cash 2,583 (553) (141) 37 1,011
Opening cash position 2,926 5,509 4,956 4,815 4,851
Closing cash position 5,509 4,956 4,815 4,851 5,862
Source: Company, Emkay Research
Gulf Oil Lubricants (GOLI IN) India Equity Research | Company Update
Emkay Research is also available on www.emkayglobal.com and Bloomberg EMKAY<GO>. Please refer to the last page of the report on Restrictions on Distribution. In Singapore, this research report or research analyses may only be distributed to Institutional Investors, Expert Investors or Accredited Investors as defined in the Securities and Futures Act, Chapter 289 of Singapore.
August 23, 2021 | 8
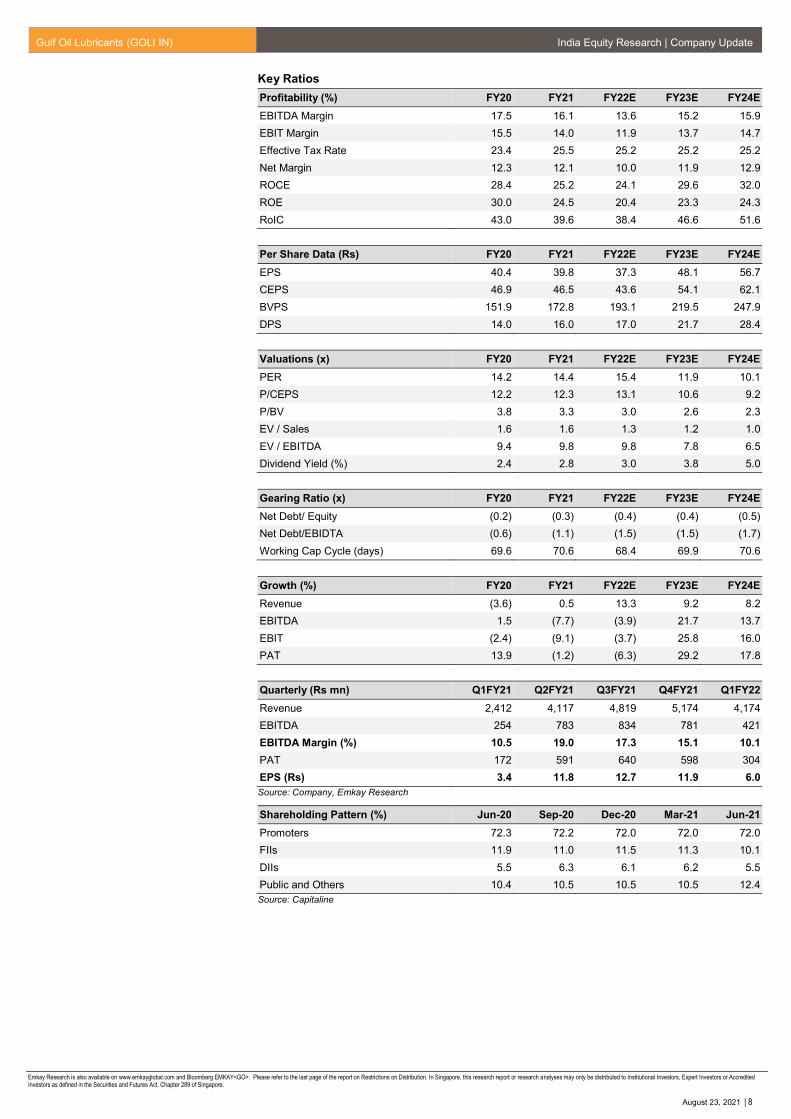
Key Ratios
Profitability (%) FY20 FY21 FY22E FY23E FY24E
EBITDA Margin 17.5 16.1 13.6 15.2 15.9
EBIT Margin 15.5 14.0 11.9 13.7 14.7
Effective Tax Rate 23.4 25.5 25.2 25.2 25.2
Net Margin 12.3 12.1 10.0 11.9 12.9
ROCE 28.4 25.2 24.1 29.6 32.0
ROE 30.0 24.5 20.4 23.3 24.3
RoIC 43.0 39.6 38.4 46.6 51.6
Per Share Data (Rs) FY20 FY21 FY22E FY23E FY24E
EPS 40.4 39.8 37.3 48.1 56.7
CEPS 46.9 46.5 43.6 54.1 62.1
BVPS 151.9 172.8 193.1 219.5 247.9
DPS 14.0 16.0 17.0 21.7 28.4
Valuations (x) FY20 FY21 FY22E FY23E FY24E
PER 14.2 14.4 15.4 11.9 10.1
P/CEPS 12.2 12.3 13.1 10.6 9.2
P/BV 3.8 3.3 3.0 2.6 2.3
EV / Sales 1.6 1.6 1.3 1.2 1.0
EV / EBITDA 9.4 9.8 9.8 7.8 6.5
Dividend Yield (%) 2.4 2.8 3.0 3.8 5.0
Gearing Ratio (x) FY20 FY21 FY22E FY23E FY24E
Net Debt/ Equity (0.2) (0.3) (0.4) (0.4) (0.5)
Net Debt/EBIDTA (0.6) (1.1) (1.5) (1.5) (1.7)
Working Cap Cycle (days) 69.6 70.6 68.4 69.9 70.6
Growth (%) FY20 FY21 FY22E FY23E FY24E
Revenue (3.6) 0.5 13.3 9.2 8.2
EBITDA 1.5 (7.7) (3.9) 21.7 13.7
EBIT (2.4) (9.1) (3.7) 25.8 16.0
PAT 13.9 (1.2) (6.3) 29.2 17.8
Quarterly (Rs mn) Q1FY21 Q2FY21 Q3FY21 Q4FY21 Q1FY22
Revenue 2,412 4,117 4,819 5,174 4,174
EBITDA 254 783 834 781 421
EBITDA Margin (%) 10.5 19.0 17.3 15.1 10.1
PAT 172 591 640 598 304
EPS (Rs) 3.4 11.8 12.7 11.9 6.0
Source: Company, Emkay Research
Shareholding Pattern (%) Jun-20 Sep-20 Dec-20 Mar-21 Jun-21
Promoters 72.3 72.2 72.0 72.0 72.0
FIIs 11.9 11.0 11.5 11.3 10.1
DIIs 5.5 6.3 6.1 6.2 5.5
Public and Others 10.4 10.5 10.5 10.5 12.4
Source: Capitaline
Gulf Oil Lubricants (GOLI IN) India Equity Research | Company Update
Emkay Research is also available on www.emkayglobal.com and Bloomberg EMKAY<GO>. Please refer to the last page of the report on Restrictions on Distribution. In Singapore, this research report or research analyses may only be distributed to Institutional Investors, Expert Investors or Accredited Investors as defined in the Securities and Futures Act, Chapter 289 of Singapore.
August 23, 2021 | 9
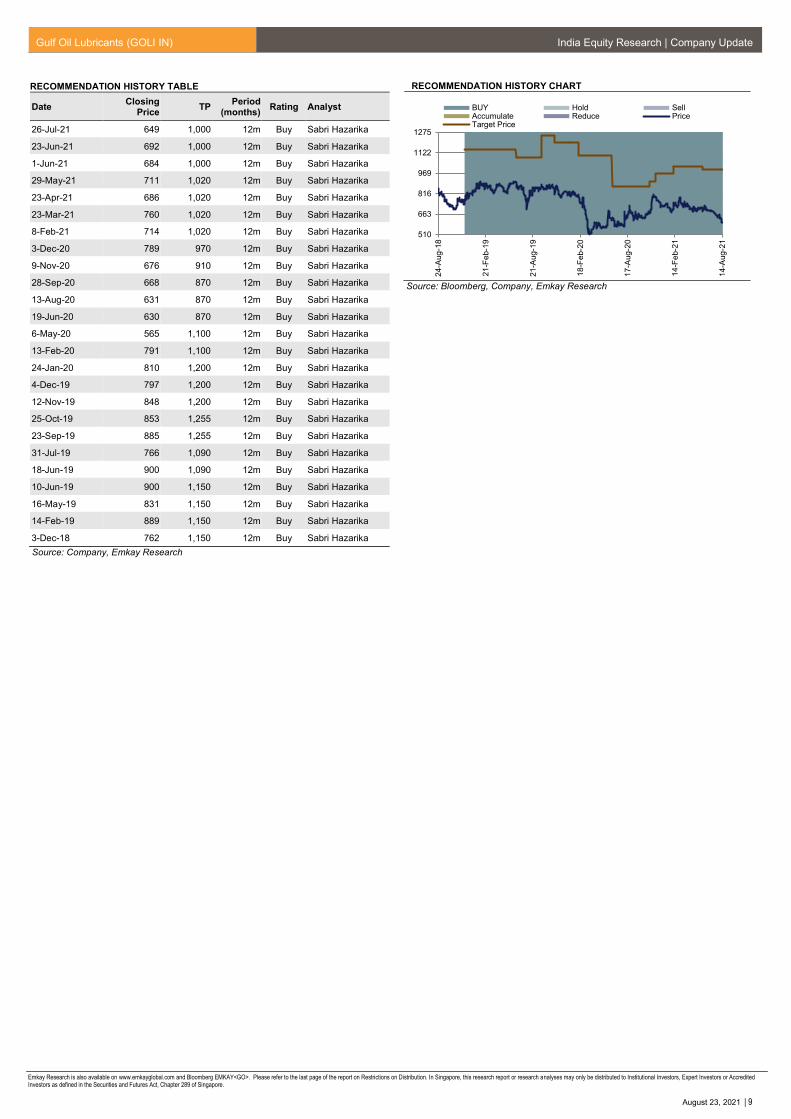
RECOMMENDATION HISTORY TABLE
Date Closing
Price TP
Period (months)
Rating Analyst
26-Jul-21 649 1,000 12m Buy Sabri Hazarika
23-Jun-21 692 1,000 12m Buy Sabri Hazarika
1-Jun-21 684 1,000 12m Buy Sabri Hazarika
29-May-21 711 1,020 12m Buy Sabri Hazarika
23-Apr-21 686 1,020 12m Buy Sabri Hazarika
23-Mar-21 760 1,020 12m Buy Sabri Hazarika
8-Feb-21 714 1,020 12m Buy Sabri Hazarika
3-Dec-20 789 970 12m Buy Sabri Hazarika
9-Nov-20 676 910 12m Buy Sabri Hazarika
28-Sep-20 668 870 12m Buy Sabri Hazarika
13-Aug-20 631 870 12m Buy Sabri Hazarika
19-Jun-20 630 870 12m Buy Sabri Hazarika
6-May-20 565 1,100 12m Buy Sabri Hazarika
13-Feb-20 791 1,100 12m Buy Sabri Hazarika
24-Jan-20 810 1,200 12m Buy Sabri Hazarika
4-Dec-19 797 1,200 12m Buy Sabri Hazarika
12-Nov-19 848 1,200 12m Buy Sabri Hazarika
25-Oct-19 853 1,255 12m Buy Sabri Hazarika
23-Sep-19 885 1,255 12m Buy Sabri Hazarika
31-Jul-19 766 1,090 12m Buy Sabri Hazarika
18-Jun-19 900 1,090 12m Buy Sabri Hazarika
10-Jun-19 900 1,150 12m Buy Sabri Hazarika
16-May-19 831 1,150 12m Buy Sabri Hazarika
14-Feb-19 889 1,150 12m Buy Sabri Hazarika
3-Dec-18 762 1,150 12m Buy Sabri Hazarika
Source: Company, Emkay Research
RECOMMENDATION HISTORY CHART
Source: Bloomberg, Company, Emkay Research
510
663
816
969
1122
1275
24
-Aug
-18
21
-Fe
b-1
9
21
-Aug
-19
18
-Fe
b-2
0
17
-Aug
-20
14
-Fe
b-2
1
14
-Aug
-21
BUY Hold SellAccumulate Reduce PriceTarget Price
Gulf Oil Lubricants (GOLI IN) India Equity Research | Company Update
Emkay Research is also available on www.emkayglobal.com and Bloomberg EMKAY<GO>. Please refer to the last page of the report on Restrictions on Distribution. In Singapore, this research report or research analyses may only be distributed to Institutional Investors, Expert Investors or Accredited Investors as defined in the Securities and Futures Act, Chapter 289 of Singapore.
August 23, 2021| 10
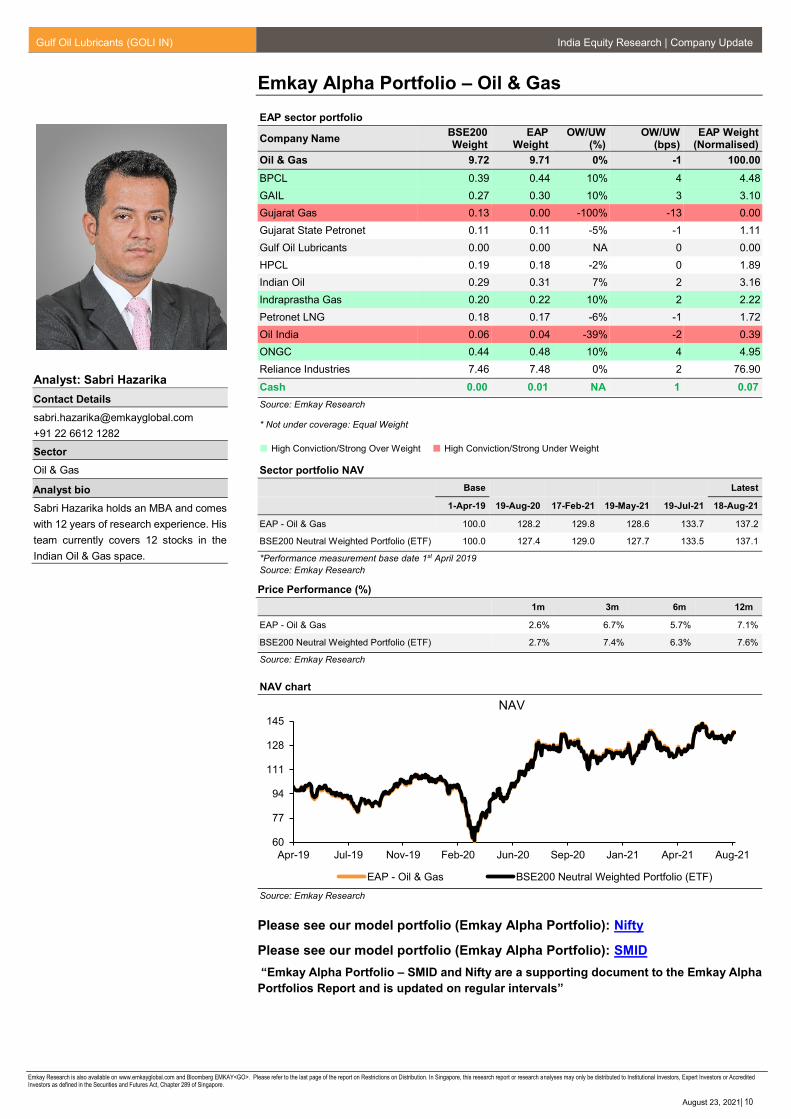
Emkay Alpha Portfolio – Oil & Gas
EAP sector portfolio
Company Name BSE200 Weight
EAP Weight
OW/UW (%)
OW/UW (bps)
EAP Weight (Normalised)
Oil & Gas 9.72 9.71 0% -1 100.00
BPCL 0.39 0.44 10% 4 4.48
GAIL 0.27 0.30 10% 3 3.10
Gujarat Gas 0.13 0.00 -100% -13 0.00
Gujarat State Petronet 0.11 0.11 -5% -1 1.11
Gulf Oil Lubricants 0.00 0.00 NA 0 0.00
HPCL 0.19 0.18 -2% 0 1.89
Indian Oil 0.29 0.31 7% 2 3.16
Indraprastha Gas 0.20 0.22 10% 2 2.22
Petronet LNG 0.18 0.17 -6% -1 1.72
Oil India 0.06 0.04 -39% -2 0.39
ONGC 0.44 0.48 10% 4 4.95
Reliance Industries 7.46 7.48 0% 2 76.90
Cash 0.00 0.01 NA 1 0.07
Source: Emkay Research
* Not under coverage: Equal Weight
High Conviction/Strong Over Weight High Conviction/Strong Under Weight
Sector portfolio NAV
Base Latest
1-Apr-19 19-Aug-20 17-Feb-21 19-May-21 19-Jul-21 18-Aug-21
EAP - Oil & Gas 100.0 128.2 129.8 128.6 133.7 137.2
BSE200 Neutral Weighted Portfolio (ETF) 100.0 127.4 129.0 127.7 133.5 137.1
*Performance measurement base date 1st April 2019
Source: Emkay Research
Price Performance (%)
1m 3m 6m 12m
EAP - Oil & Gas 2.6% 6.7% 5.7% 7.1%
BSE200 Neutral Weighted Portfolio (ETF) 2.7% 7.4% 6.3% 7.6%
Source: Emkay Research
NAV chart
Source: Emkay Research
Please see our model portfolio (Emkay Alpha Portfolio): Nifty
Please see our model portfolio (Emkay Alpha Portfolio): SMID
“Emkay Alpha Portfolio – SMID and Nifty are a supporting document to the Emkay Alpha
Portfolios Report and is updated on regular intervals”
60
77
94
111
128
145
Apr-19 Jul-19 Nov-19 Feb-20 Jun-20 Sep-20 Jan-21 Apr-21 Aug-21
NAV
EAP - Oil & Gas BSE200 Neutral Weighted Portfolio (ETF)
Analyst: Sabri Hazarika
Contact Details
+91 22 6612 1282
Sector
Oil & Gas
Analyst bio
Sabri Hazarika holds an MBA and comes
with 12 years of research experience. His
team currently covers 12 stocks in the
Indian Oil & Gas space.
Gulf Oil Lubricants (GOLI IN) India Equity Research | Company Update
Emkay Research is also available on www.emkayglobal.com and Bloomberg EMKAY<GO>. Please refer to the last page of the report on Restrictions on Distribution. In Singapore, this research report or research analyses may only be distributed to Institutional Investors, Expert Investors or Accredited Investors as defined in the Securities and Futures Act, Chapter 289 of Singapore.
August 23, 2021| 11
Emkay Rating Distribution
Ratings Expected Return within the next 12-18 months.
BUY Over 15%
HOLD Between -5% to 15%
SELL Below -5%
Completed Date: 23 Aug 2021 02:34:11 (SGT) Dissemination Date: 23 Aug 2021 02:35:11 (SGT)
Sources for all charts and tables are Emkay Research unless otherwise specified.
GENERAL DISCLOSURE/DISCLAIMER BY EMKAY GLOBAL FINANCIAL SERVICES LIMITED (EGFSL): Emkay Global Financial Services Limited (CIN-L67120MH1995PLC084899) and its affiliates are a full-service, brokerage, investment banking, investment management and financing group. Emkay Global Financial Services Limited (EGFSL) along with its affiliates are participants in virtually all securities trading markets in India. EGFSL was established in 1995 and is one of India's leading brokerage and distribution house. EGFSL is a corporate trading member of Bombay Stock Exchange Limited (BSE), National Stock Exchange of India Limited (NSE), MCX Stock Exchange Limited (MCX-SX). EGFSL along with its subsidiaries offers the most comprehensive avenues for investments and is engaged in the businesses including stock broking (Institutional and retail), merchant banking, commodity broking, depository participant, portfolio management, insurance broking and services rendered in connection with distribution of primary market issues and financial products like mutual funds, fixed deposits. Details of associates are available on our website i.e. www.emkayglobal.com EGFSL is registered as Research Analyst with SEBI bearing registration Number INH000000354 as per SEBI (Research Analysts) Regulations, 2014. EGFSL hereby declares that it has not defaulted with any stock exchange nor its activities were suspended by any stock exchange with whom it is registered in last five years, except that NSE had disabled EGFSL from trading on October 05, October 08 and October 09, 2012 for a manifest error resulting into a bonafide erroneous trade on October 05, 2012. However, SEBI and Stock Exchanges have conducted the routine inspection and based on their observations have issued advice letters or levied minor penalty on EGFSL for certain operational deviations in ordinary/routine course of business. EGFSL has not been debarred from doing business by any Stock Exchange / SEBI or any other authorities; nor has its certificate of registration been cancelled by SEBI at any point of time. EGFSL offers research services to clients as well as prospects. The analyst for this report certifies that all of the views expressed in this report accurately reflect his or her personal views about the subject company or companies and its or their securities, and no part of his or her compensation was, is or will be, directly or indirectly related to specific recommendations or views expressed in this report. Other disclosures by Emkay Global Financial Services Limited (Research Entity) and its Research Analyst under SEBI (Research Analyst) Regulations, 2014 with reference to the subject company(s) covered in this report EGFSL and/or its affiliates may seek investment banking or other business from the company or companies that are the subject of this material. Our salespeople, traders, and other professionals may provide oral or written market commentary or trading strategies to our clients that reflect opinions that are contrary to the opinions expressed herein, and our proprietary trading and investing businesses may make investment decisions that may be inconsistent with the recommendations expressed herein. In reviewing these materials, you should be aware that any or all of the foregoing, among other things, may give rise to real or potential conflicts of interest including but not limited to those stated herein. Additionally, other important information regarding our relationships with the company or companies that are the subject of this material is provided herein. This report is not directed to, or intended for distribution to or use by, any person or entity who is a citizen or resident of or located in any locality, state, country or other jurisdiction where such distribution, publication, availability or use would be contrary to law or regulation or which would subject EGFSL or its group companies to any registration or licensing requirement within such jurisdiction. Specifically, this document does not constitute an offer to or solicitation to any U.S. person for the purchase or sale of any financial instrument or as an official confirmation of any transaction to any U.S. person. Unless otherwise stated, this message should not be construed as official confirmation of any transaction. No part of this document may be used by private customers in United Kingdom. All material presented in this report, unless specifically indicated otherwise, is under copyright to Emkay. None of the material, nor its content, nor any copy of it, may be altered in any way, transmitted to, copied or distributed to any other party, without the prior express written permission of EGFSL . All trademarks, service marks and logos used in this report are trademarks or registered trademarks of EGFSL or its Group Companies. The information contained herein is not intended for publication or distribution or circulation in any manner whatsoever and any unauthorized reading, dissemination, distribution or copying of this communication is prohibited unless otherwise expressly authorized. Please ensure that you have read “Risk Disclosure Document for Capital Market and Derivatives Segments” as prescribed by Securities and Exchange Board of India before investing in Indian Securities Market. In so far as this report includes current or historic information, it is believed to be reliable, although its accuracy and completeness cannot be guaranteed.
This publication has not been reviewed or authorized by any regulatory authority. There is no planned schedule or frequency for updating research publication relating to any issuer.
Please contact the primary analyst for valuation methodologies and assumptions associated with the covered companies or price targets Disclaimer for U.S. persons only: This research report is a product of Emkay Global Financial Services Limited (Emkay), which is the employer of the research analyst(s) who has prepared the research report. The research analyst(s) preparing the research report is/are resident outside the United States (U.S.) and are not associated persons of any U.S. regulated broker-dealer and therefore the analyst(s) is/are not subject to supervision by a U.S. broker-dealer, and is/are not required to satisfy the regulatory licensing requirements of Financial Institutions Regulatory Authority (FINRA) or required to otherwise comply with U.S. rules or regulations regarding, among other things, communications with a subject company, public appearances and trading securities held by a research analyst account. This report is intended for distribution to "Major Institutional Investors" as defined by Rule 15a-6(b)(4) of the U.S. Securities and Exchange Act, 1934 (the Exchange Act) and interpretations thereof by U.S. Securities and Exchange Commission (SEC) in reliance on Rule 15a 6(a)(2). If the recipient of this report is not a Major Institutional Investor as specified above, then it should not act upon this report and return the same to the sender. Further, this report may not be copied, duplicated and/or transmitted onward to any U.S. person, which is not the Major Institutional Investor. In reliance on the exemption from registration provided by Rule 15a-6 of the Exchange Act and interpretations thereof by the SEC in order to conduct certain business with Major Institutional Investors.
Gulf Oil Lubricants (GOLI IN) India Equity Research | Company Update
Emkay Research is also available on www.emkayglobal.com and Bloomberg EMKAY<GO>. Please refer to the last page of the report on Restrictions on Distribution. In Singapore, this research report or research analyses may only be distributed to Institutional Investors, Expert Investors or Accredited Investors as defined in the Securities and Futures Act, Chapter 289 of Singapore.
August 23, 2021| 12
ANALYST CERTIFICATION BY EMKAY GLOBAL FINANCIAL SERVICES LIMITED (EGFSL) The research analyst(s) primarily responsible for the content of this research report, in part or in whole, certifies that the views about the companies and their securities expressed in this report accurately reflect his/her personal views. The analyst(s) also certifies that no part of his/her compensation was, is, or will be, directly or indirectly, related to specific recommendations or views expressed in the report. The research analyst (s) primarily responsible of the content of this research report, in part or in whole, certifies that he or his associate1 does not serve as an officer, director or employee of the issuer or the new listing applicant (which includes in the case of a real estate investment trust, an officer of the management company of the real estate investment trust; and in the case of any other entity, an officer or its equivalent counterparty of the entity who is responsible for the management of the issuer or the new listing applicant). The research analyst(s) primarily responsible for the content of this research report or his associate does not have financial interests2 in relation to an issuer or a new listing applicant that the analyst reviews. EGFSL has procedures in place to eliminate, avoid and manage any potential conflicts of interests that may arise in connection with the production of research reports. The research analyst(s) responsible for this report operates as part of a separate and independent team to the investment banking function of the EGFSL and procedures are in place to ensure that confidential information held by either the research or investment banking function is handled appropriately. There is no direct link of EGFSL compensation to any specific investment banking function of the EGFSL. 1 An associate is defined as (i) the spouse, or any minor child (natural or adopted) or minor step-child, of the analyst; (ii) the trustee of a trust of which the analyst, his spouse, minor child (natural or adopted) or minor step-child, is a beneficiary or discretionary object; or (iii) another person accustomed or obliged to act in accordance with the directions or instructions of the analyst. 2 Financial interest is defined as interest that are commonly known financial interest, such as investment in the securities in respect of an issuer or a new listing applicant, or financial accommodation arrangement between the issuer or the new listing applicant and the firm or analysis. This term does not include commercial lending conducted at the arm’s length, or investments in any collective investment scheme other than an issuer or new listing applicant notwithstanding the fact that the scheme has investments in securities in respect of an issuer or a new listing applicant.
COMPANY-SPECIFIC / REGULATORY DISCLOSURES BY EMKAY GLOBAL FINANCIAL SERVICES LIMITED (EGFSL):
Disclosures by Emkay Global Financial Services Limited (Research Entity) and its Research Analyst under SEBI (Research Analyst) Regulations, 2014 with reference to the subject company(s) covered in this report-: 1. EGFSL, its subsidiaries and/or other affiliates do not have a proprietary position in the securities recommended in this report as of August 23, 2021 2. EGFSL, and/or Research Analyst does not market make in equity securities of the issuer(s) or company(ies) mentioned in this Research Report Disclosure of previous investment recommendation produced: 3. EGFSL may have published other investment recommendations in respect of the same securities / instruments recommended in this research
report during the preceding 12 months. Please contact the primary analyst listed in the first page of this report to view previous investment recommendations published by EGFSL in the preceding 12 months.
4. EGFSL , its subsidiaries and/or other affiliates and Research Analyst or his/her relative’s does not have any material conflict of interest in the securities recommended in this report as of August 23, 2021.
5. EGFSL, its subsidiaries and/or other affiliates and Research Analyst or his/her relative’s does not have actual/beneficial ownership of 1% or more securities of the subject company at the end of the month immediately preceding the August 23, 2021
6. EGFSL, its subsidiaries and/or other affiliates and Research Analyst have not received any compensation in whatever form including compensation for investment banking or merchant banking or brokerage services or for products or services other than investment banking or merchant banking or brokerage services from securities recommended in this report (subject company) in the past 12 months.
7. EGFSL, its subsidiaries and/or other affiliates and/or and Research Analyst have not received any compensation or other benefits from securities recommended in this report (subject company) or third party in connection with the research report.
8. Securities recommended in this report (Subject Company) has not been client of EGFSL, its subsidiaries and/or other affiliates and/or and Research Analyst during twelve months preceding the August 23, 2021
Gulf Oil Lubricants (GOLI IN) India Equity Research | Company Update
Emkay Research is also available on www.emkayglobal.com and Bloomberg EMKAY<GO>. Please refer to the last page of the report on Restrictions on Distribution. In Singapore, this research report or research analyses may only be distributed to Institutional Investors, Expert Investors or Accredited Investors as defined in the Securities and Futures Act, Chapter 289 of Singapore.
August 23, 2021| 13
RESTRICTIONS ON DISTRIBUTION
General This report is not directed to, or intended for distribution to or use by, any person or entity who is a citizen or resident of or located in any locality, state, country or other jurisdiction where such distribution, publication, availability or use would be contrary to law or regulation.
Australia This report is not for distribution into Australia.
Hong Kong This report is not for distribution into Hong Kong.
Indonesia This report is being distributed in Indonesia by PT DBS Vickers Sekuritas Indonesia.
Malaysia This report is not for distribution into Malaysia.
Singapore
This report is distributed in Singapore by DBS Bank Ltd (Company Regn. No. 16800306E) or DBSVS (Company Regn. No. 1860024G) both of which are Exempt Financial Advisers as defined in the Financial Advisers Act and regulated by the Monetary Authority of Singapore. DBS Bank Ltd and/or DBSVS, may distribute reports produced by its respective foreign entities, affiliates or other foreign research houses pursuant to an agreement under Regulation 32C of the financial Advisers Regulations. Singapore recipients should contact DBS Bank Ltd at 6327 2288 for matters arising from, or in connection with the report.
Thailand This report is being distributed in Thailand by DBS Vickers Securities (Thailand) Co Ltd.
United Kingdom
This report is disseminated in the United Kingdom by DBS Vickers Securities (UK) Ltd, ("DBSVUK"). DBSVUK is authorised and regulated by the Financial Conduct Authority in the United Kingdom.
In respect of the United Kingdom, this report is solely intended for the clients of DBSVUK, its respective connected and associated corporations and affiliates only and no part of this document may be (i) copied, photocopied or duplicated in any form or by any means or (ii) redistributed without the prior written consent of DBSVUK. This communication is directed at persons having professional experience in matters relating to investments. Any investment activity following from this communication will only be engaged in with such persons. Persons who do not have professional experience in matters relating to investments should not rely on this communication.
Dubai International Financial Centre
This research report is being distributed by DBS Bank Ltd., (DIFC Branch) having its office at units 608-610, 6th Floor, Gate Precinct Building 5, PO Box 506538, Dubai International Financial Centre (DIFC), Dubai, United Arab Emirates. DBS Bank Ltd., (DIFC Branch) is regulated by The Dubai Financial Services Authority. This research report is intended only for professional clients (as defined in the DFSA rulebook) and no other person may act upon it.
United Arab Emirates
This report is provided by DBS Bank Ltd (Company Regn. No. 196800306E) which is an Exempt Financial Adviser as defined in the Financial Advisers Act and regulated by the Monetary Authority of Singapore. This report is for information purposes only and should not be relied upon or acted on by the recipient or considered as a solicitation or inducement to buy or sell any financial product. It does not constitute a personal recommendation or take into account the particular investment objectives, financial situation, or needs of individual clients. You should contact your relationship manager or investment adviser if you need advice on the merits of buying, selling or holding a particular investment. You should note that the information in this report may be out of date and it is not represented or warranted to be accurate, timely or complete. This report or any portion thereof may not be reprinted, sold or redistributed without our written consent.
United States
DBSVUSA did not participate in its preparation. The research analyst(s) named on this report are not registered as research analysts with FINRA and are not associated persons of DBSVUSA. The research analyst(s) are not subject to FINRA Rule 2241 restrictions on analyst compensation, communications with a subject company, public appearances and trading securities held by a research analyst. This report is being distributed in the United States by DBSVUSA, which accepts responsibility for its contents. This report may only be distributed to Major U.S. Institutional Investors (as defined in SEC Rule 15a-6) and to such other institutional investors and qualified persons as DBSVUSA may authorize. Any U.S. person receiving this report who wishes to effect transactions in any securities referred to herein should contact DBSVUSA directly and not its affiliate.
Other jurisdictions In any other jurisdictions, except if otherwise restricted by laws or regulations, this report is intended only for qualified, professional, institutional or sophisticated investors as defined in the laws and regulations of such jurisdictions.
Emkay Global Financial Services Ltd.
CIN - L67120MH1995PLC084899
7th Floor, The Ruby, Senapati Bapat Marg, Dadar - West, Mumbai - 400028. India
Tel: +91 22 66121212 Fax: +91 22 66121299 Web: www.emkayglobal.com

![Q4 & FY16 Investor Update [Company Update]](https://img.pdfslide.us/doc/110x75/577c7fc91a28abe054a60c7a/q4-fy16-investor-update-company-update.jpg)
![Earnings Update Q1FY16 [Company Update]](https://img.pdfslide.us/doc/110x75/577cb4121a28aba7118c49d7/earnings-update-q1fy16-company-update.jpg)
![Investor Update - March 2016 [Company Update]](https://img.pdfslide.us/doc/110x75/577c852e1a28abe054bc09a3/investor-update-march-2016-company-update.jpg)
![Investor Update Q1 FY16 [Company Update]](https://img.pdfslide.us/doc/110x75/577cb41b1a28aba7118c4de4/investor-update-q1-fy16-company-update.jpg)
![Result Update Presentation [Company Update]](https://img.pdfslide.us/doc/110x75/577ca5841a28abea748b9163/result-update-presentation-company-update.jpg)


![Performance Update - 4Q FY16 [Company Update]](https://img.pdfslide.us/doc/110x75/577c7f5c1a28abe054a43af3/performance-update-4q-fy16-company-update.jpg)
![Update of Legal Proceedings initiated by the Company [Company Update]](https://img.pdfslide.us/doc/110x75/577cb4161a28aba7118c4baa/update-of-legal-proceedings-initiated-by-the-company-company-update.jpg)
![Company Update [Company Update]](https://img.pdfslide.us/doc/110x75/577c982f1a28ab163a8b480c/company-update-company-update.jpg)
![Investor Update [Company Update]](https://img.pdfslide.us/doc/110x75/577c7caa1a28abe0549b8763/investor-update-company-update-578043b3b5bc3.jpg)
![Investor Update/ Presentation [Company Update]](https://img.pdfslide.us/doc/110x75/577ca57b1a28abea748b8d65/investor-update-presentation-company-update.jpg)
![Q3 FY16 Performance Update [Company Update]](https://img.pdfslide.us/doc/110x75/577ca52b1a28abea748b69f1/q3-fy16-performance-update-company-update.jpg)
![Earnings Update [Company Update]](https://img.pdfslide.us/doc/110x75/577c7f491a28abe054a3eab4/earnings-update-company-update.jpg)
![Information Update [Company Update]](https://img.pdfslide.us/doc/110x75/577c7bd21a28abe054987811/information-update-company-update.jpg)
![Earnings Update Q3FY16 [Company Update]](https://img.pdfslide.us/doc/110x75/577ca5961a28abea748b9878/earnings-update-q3fy16-company-update.jpg)
![Performance Update [Company Update]](https://img.pdfslide.us/doc/110x75/577c7c411a28abe05499ee66/performance-update-company-update.jpg)
![Results Update Presentation [Company Update]](https://img.pdfslide.us/doc/110x75/577ca7a11a28abea748c7c9d/results-update-presentation-company-update.jpg)

![Updates [Company Update]](https://img.pdfslide.us/doc/110x75/577c82d41a28abe054b2758b/updates-company-update-5785d6a0e383b.jpg)
![Quarterly Investor Update [Company Update]](https://img.pdfslide.us/doc/110x75/577ca5321a28abea748b6bd2/quarterly-investor-update-company-update.jpg)
![Quarterly Update [Company Update]](https://img.pdfslide.us/doc/110x75/577cb4b01a28aba7118c9d76/quarterly-update-company-update-578abd0f0e24d.jpg)
![Updates on Investor Update [Company Update]](https://img.pdfslide.us/doc/110x75/577cb4961a28aba7118c90ad/updates-on-investor-update-company-update.jpg)
![Earnings Update Q4FY15 [Company Update]](https://img.pdfslide.us/doc/110x75/577cb4b01a28aba7118c9d6b/earnings-update-q4fy15-company-update.jpg)