Embed Size (px)
Citation preview
Company Review: Müller
A guide to your milk buyer
February 2012
2
Müller
Company profile
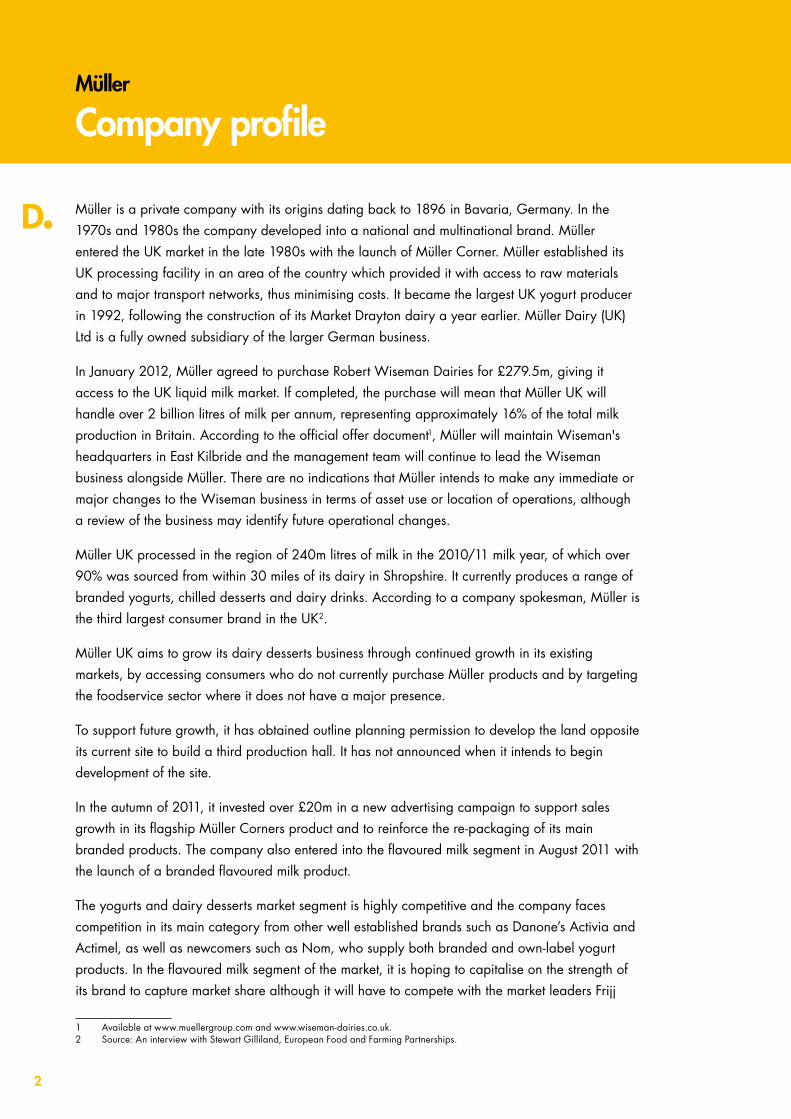
Müller is a private company with its origins dating back to 1896 in Bavaria, Germany. In the 1970s and 1980s the company developed into a national and multinational brand. Müller entered the UK market in the late 1980s with the launch of Müller Corner. Müller established its UK processing facility in an area of the country which provided it with access to raw materials and to major transport networks, thus minimising costs. It became the largest UK yogurt producer in 1992, following the construction of its Market Drayton dairy a year earlier. Müller Dairy (UK) Ltd is a fully owned subsidiary of the larger German business.
In January 2012, Müller agreed to purchase Robert Wiseman Dairies for £279.5m, giving it access to the UK liquid milk market. If completed, the purchase will mean that Müller UK will handle over 2 billion litres of milk per annum, representing approximately 16% of the total milk production in Britain. According to the official offer document1, Müller will maintain Wiseman's headquarters in East Kilbride and the management team will continue to lead the Wiseman business alongside Müller. There are no indications that Müller intends to make any immediate or major changes to the Wiseman business in terms of asset use or location of operations, although a review of the business may identify future operational changes.
Müller UK processed in the region of 240m litres of milk in the 2010/11 milk year, of which over 90% was sourced from within 30 miles of its dairy in Shropshire. It currently produces a range of branded yogurts, chilled desserts and dairy drinks. According to a company spokesman, Müller is the third largest consumer brand in the UK2.
Müller UK aims to grow its dairy desserts business through continued growth in its existing markets, by accessing consumers who do not currently purchase Müller products and by targeting the foodservice sector where it does not have a major presence.
To support future growth, it has obtained outline planning permission to develop the land opposite its current site to build a third production hall. It has not announced when it intends to begin development of the site.
In the autumn of 2011, it invested over £20m in a new advertising campaign to support sales growth in its flagship Müller Corners product and to reinforce the re-packaging of its main branded products. The company also entered into the flavoured milk segment in August 2011 with the launch of a branded flavoured milk product.
The yogurts and dairy desserts market segment is highly competitive and the company faces competition in its main category from other well established brands such as Danone’s Activia and Actimel, as well as newcomers such as Nom, who supply both branded and own-label yogurt products. In the flavoured milk segment of the market, it is hoping to capitalise on the strength of its brand to capture market share although it will have to compete with the market leaders Frijj
1 Available at www.muellergroup.com and www.wiseman-dairies.co.uk.2 Source: An interview with Stewart Gilliland, European Food and Farming Partnerships.
3
(Dairy Crest) and Yazoo (Friesland Campina) as well as the retailer labelled offerings.
Although the market for chilled yogurt and pot desserts is growing, rising costs and the decline in consumer spending has impacted on the company’s competitiveness. Following some major changes in its senior management, with both its UK CEO and Marketing Director leaving the company, it also announced a number of redundancies across their UK and Ireland operation in December 2011. It is expected that the majority of job losses will occur at its Market Drayton facility.
Current position
• Remains the number one brand overall in yogurt and chilled desserts category although it has been overtaken as market leader in the spoonable yogurts and fromage frais category by Danone’s Activia product.
• Retailer own-label products and tertiary brands have entered into corner-yogurt market, increasing competition within the category.
• Capacity at its Market Drayton facility is now at two billion pots per year following a £12m investment, allowing it to service the domestic market from UK production.
• Müller leads the yogurt market in terms of advertising spend3 and invested £20 million in its 2011 advertising campaign.
Future challenges and opportunities:
• The yogurt market has high household penetration, so requires continuous investment in new products, packaging and marketing to grow consumer sales.
• Is faced with the potential of increasing volatility and rises in input costs arising from use of imported inputs such as ingredients and packaging.
• Aims to extend its product range and expand consumption occasions to support volume growth.
• Faced with challenge of balancing rising costs against maintaining market share and offering value to consumers in an increasingly price-competitive market.
• To grow market share, it will have to contend with its main competitor Danone and new entrants such as Nom.
• The acquisition of Robert Wiseman Dairies provides Müller with access to the UK liquid milk market and allows it to offer customers a larger range of products.
• Will face the challenge of securing profitable margins within the liquid milk market due to the current resistance of retailers to negotiate increased selling prices to compensate for increasing input costs.
3 Had the highest advertising spend in the yogurt/fromage frais category in 2010 and 2011 according to Nielsen Media Research UK.

4
Müller
Procurement analysis
Milk purchases
The table below gives details of Müller’s milk supply base for the 2010/11 milk year.
Direct supplies
Third party supplies Total
Change from previous year
Million litres 230 10 240 n.c. Numbers 156 156 4%
Source: Müller UK.
Müller’s milk purchases totalled 240m litres in 2010/11 with over 95% sourced from directly contracted farms. This was an increase on the previous year due to higher deliveries from direct suppliers, although these were compensated for through a reduction in purchases from third parties. Balancing requirements are sourced locally from Robert Wiseman Dairies or Dairy Crest and any seasonal surplus milk is sold on.
Recruitment
The company is not currently recruiting for its Market Drayton facility as it is currently purchasing in excess of its processing requirements. Recruitment of direct suppliers, when it does occur, is limited to the 30-mile radius of its Market Drayton facility.
Contracts
The table below summarises the main features of the supply pools operated by Müller UK.
Milk pools Contract details
Million litres 230Producer numbers 156End use ProcessingCatchment area 30 mile radius of Market DraytonAnnual average price 2010/11*
27.3ppl*
Annual average price as of Sep 11*
29.4ppl*
Reasons for price changes
changes in input costs and returns from market
*Prices based on milkprices.com standard litre4. Figures relate to the milk year 2010/11.
4 The standard litre used by milkprices.com is defined as 4% butterfat, 3.3% protein, Bactoscans of 30,000/ml and SCC’s of 200,000/ml for a million litre/year producer on every other day collection (EODC).
5
Müller offers one milk contract which, following consultations with its direct suppliers, was simplified to ensure that producers were incentivised to meet quality requirements. The contract is based on constituent payments for butterfat and protein content and does not include any seasonality payments.
As part of the company’s aim to improve relationships with its direct suppliers to better understand challenges of both parties, it has introduced a series of producer group meetings. The meetings aim to provide information on markets and company performance to small groups of direct suppliers. The company has established a dedicated liaison contact for direct suppliers to enable farmers to maximise the financial return from their contracts.
Price Review
There is currently no formal negotiation process in place to determine prices and decisions to change farmgate prices are solely those of Müller. One month’s notice is required when the price changes, although the company aim to give more notice where possible. As part of its strategy to improve relationships, it aims to move towards a system of farmer representation, although it is uncertain how they will be involved in decisions on milk prices.
Müller’s prices are not reported on DairyCo league table, however, according to the milkprices.com5 standard litre, it was paying 27.3ppl as at 31 March 2011. It implemented price increases of 0.5ppl in May and July 2011, followed by a further 1.1ppl in October. The October price increase comprised a 0.7ppl increase on the base price and a further 0.4ppl for milk in the top quality bands for SCC and Bactoscans. Citing market pressures and rising costs, Müller announced a 0.5ppl cut in its milk price from January 2012, the first major milk buyer to reduce prices in the year.
Exit policy
Müller launched a new contract in 2008, which offered different terms to the old contract. Producers on the old contract were on six months notice, which was retained, but the standard notice period for new producers is now 12 months. Müller is required to give 24 months notice to terminate the contract, although these terms can be extended through negotiation.
Farm Assurance
All farms supplying to Müller are assured under the Red Tractor Farm Assurance Dairy Scheme (formerly ADF).
5 See www.milkprices.com
6
Supplier Benefits
In recognising its reliance on a reliable source of quality raw materials, Müller has worked to improve its relationship with its direct suppliers. It holds farmer seminars through the year on topics chosen by farmers such as current business issues, market updates, animal health and milk quality. The seminars are supported by Kite Consultants who provide the technical advice and are held with an aim to improve operational efficiencies on farm.
Highlights...
• Limited opportunities for new direct suppliers for its yogurt business as Müller is currently purchasing in excess of its processing requirements.
• Müller operates an A/B pricing system with payments on deliveries above a base level paid at a different rate which is subject to commodity market conditions.
• Has worked to improve relationships with direct suppliers through increased communications and by matching company milk requirements with contract terms.
• Has obtained planning permission on new development to allow for additional capacity although there are no plans to invest in new facilities at present.
7
Müller
Production analysis
Product portfolio
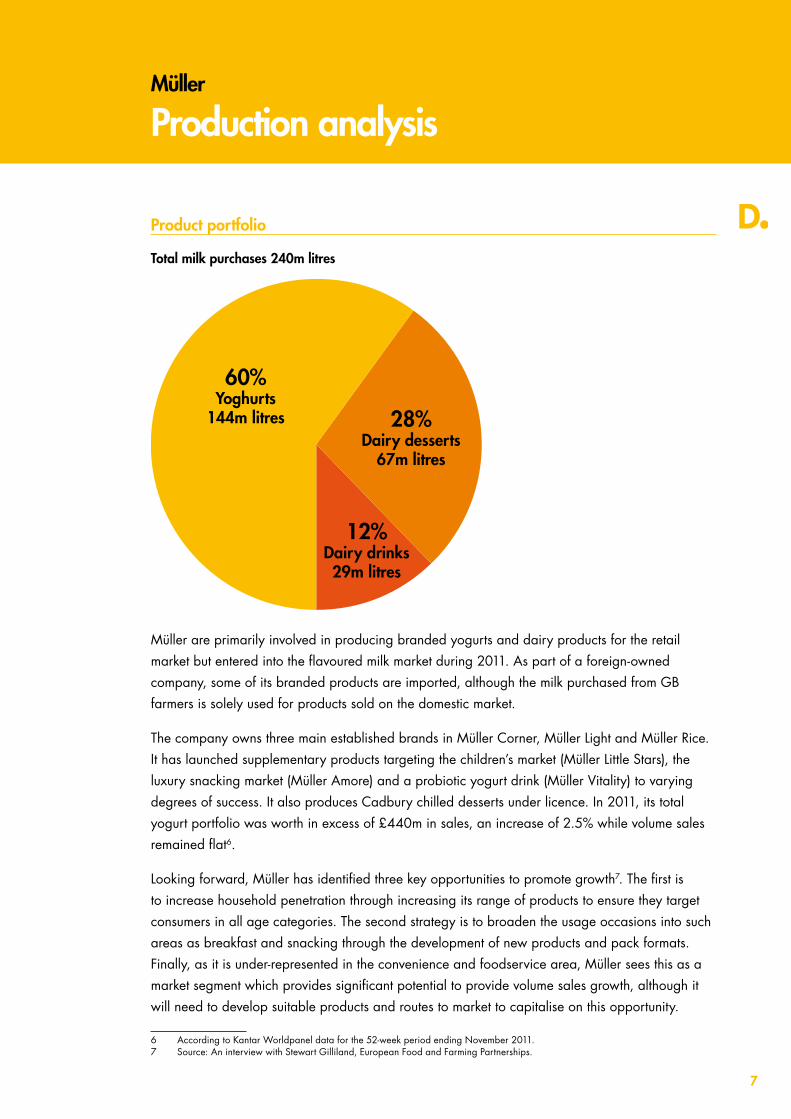
Total milk purchases 240m litres
60%Yoghurts
144m litres 28%Dairy desserts
67m litres
12%Dairy drinks29m litres
Müller are primarily involved in producing branded yogurts and dairy products for the retail market but entered into the flavoured milk market during 2011. As part of a foreign-owned company, some of its branded products are imported, although the milk purchased from GB farmers is solely used for products sold on the domestic market.
The company owns three main established brands in Müller Corner, Müller Light and Müller Rice. It has launched supplementary products targeting the children’s market (Müller Little Stars), the luxury snacking market (Müller Amore) and a probiotic yogurt drink (Müller Vitality) to varying degrees of success. It also produces Cadbury chilled desserts under licence. In 2011, its total yogurt portfolio was worth in excess of £440m in sales, an increase of 2.5% while volume sales remained flat6.
Looking forward, Müller has identified three key opportunities to promote growth7. The first is to increase household penetration through increasing its range of products to ensure they target consumers in all age categories. The second strategy is to broaden the usage occasions into such areas as breakfast and snacking through the development of new products and pack formats. Finally, as it is under-represented in the convenience and foodservice area, Müller sees this as a market segment which provides significant potential to provide volume sales growth, although it will need to develop suitable products and routes to market to capitalise on this opportunity.
6 According to Kantar Worldpanel data for the 52-week period ending November 2011.7 Source: An interview with Stewart Gilliland, European Food and Farming Partnerships.
8
Production facilities
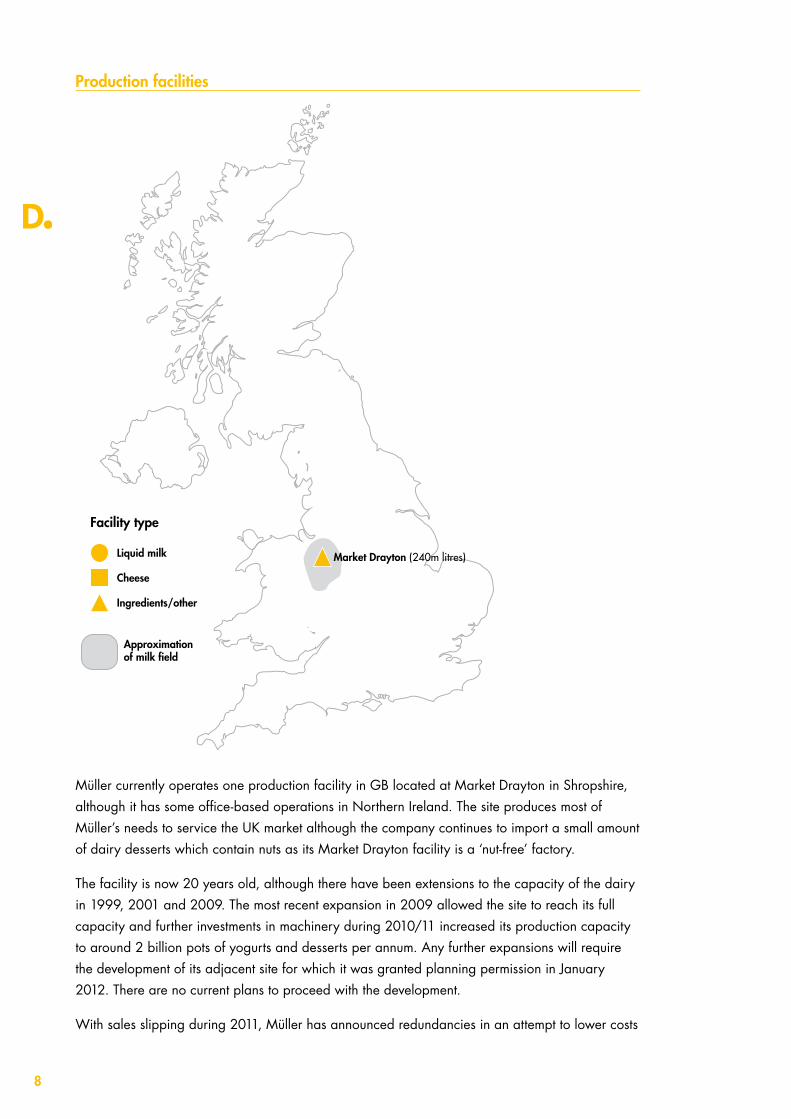
Liquid milk
Approximationof milk field
Facility type
Cheese
Ingredients/other
Market Drayton (240m litres)
Müller currently operates one production facility in GB located at Market Drayton in Shropshire, although it has some office-based operations in Northern Ireland. The site produces most of Müller’s needs to service the UK market although the company continues to import a small amount of dairy desserts which contain nuts as its Market Drayton facility is a ‘nut-free’ factory.
The facility is now 20 years old, although there have been extensions to the capacity of the dairy in 1999, 2001 and 2009. The most recent expansion in 2009 allowed the site to reach its full capacity and further investments in machinery during 2010/11 increased its production capacity to around 2 billion pots of yogurts and desserts per annum. Any further expansions will require the development of its adjacent site for which it was granted planning permission in January 2012. There are no current plans to proceed with the development.
With sales slipping during 2011, Müller has announced redundancies in an attempt to lower costs
9
and retain its competitiveness. While these are currently under consultation, market commentators indicate that the majority of the 55 jobs are likely to be lost at the Market Drayton site.
In October 2011, Müller launched a £20 million ‘Wünderful Stuff’ advertising campaign to support the introduction of its new blue packaging across the core Müller range. The redesigned packaging was introduced during the summer of 2011 with the aim of re-invigorating the brand. According to the Marketing Director8 in charge of the campaign, the adverts were designed to make the brand stand out from the crowd rather than promote specific features of the products.
The completion of Müller’s takeover of Robert Wiseman Dairies will give the company its six liquid milk processing dairies and network of distribution centres. The facilities provide in the region of 2.15 billion litres of finished milk capacity. The dairies are solely involved in the production of liquid milk, directed primarily to the own-label liquid market although there is a small portfolio of branded products. The takeover also gives Müller a stake in the joint venture established between Robert Wiseman Dairies and A2 Corporation Limited (A2C) of New Zealand to produce and market a2 Milk™. The Company Review of Robert Wiseman Dairies9 provides further information on the production facilities and operations of the business.
Markets
Yogurts and dairy desserts are consumed by the majority of people in the UK, with high market penetration. However, in the current economic climate, retail sales are predominantly driven by deals. In the year ending March 2011, the yogurt category showed growth of approximately 5.5% in volume terms and 4.6% in value terms to an estimated total value of £1.3 billion10. Volumes were driven by the shift in consumer habits towards healthier foods, although the heavy promotional activities impacted on value sales11.
Branded products increased market share at the expense of own-label yogurts during this period, reporting sales growth of 9% compared to a 5% decline in sales of own-label yogurts. Müller’s portfolio held a 36% share of the market in year ending March 2011, which was only slightly up from the previous year. Müller’s main competitor in the market for spoonable yogurts is Danone, who saw an upturn of 8% in volume sales and 10% in value sales over its product range during the same period. This translated into a marginal increase in its market share to 18% of total volume sales.
The yogurt drinks segment of the category has seen a decline in both value and volume sales over the year with volumes down by just over 2% and value declining by 5%, impacted by promotional activity in the branded sector. The own-label category grew during the period at the expense of branded products, as it now offers comparable products across the range; from low fat to twin pots. Volume sales were up by 3% over the period while value sales increased by just under 5%. At the same time, branded yogurt drinks saw a drop in both volume and value sales of 3% and 7% respectively. The growth of the own-label sector will mean that branded manufacturers will need to find ways to justify higher prices to consumers, either through innovative products or promotional activity.
8 Brand Republic. Müller’s Lee Rolston on getting consumers talking about the yogurt category. 27 October 2011.9 Available to download from www.dairyco.org.uk10 Unless otherwise indicated, retail volume and value figures are based on Kantar Worldpanel data for the 52-week period ending
20 March 2011.11 Yogurt and Dessert – UK. June 2011. Mintel.
10
Within this category Müller produce the probiotic drink Müller Vitality which holds the number two position in the category behind Danone. In the year ending March 2011, Danone held almost half of the market in terms of volumes, driven by its range of Actimel yogurt drinks.
During 2011, Müller also launched a product into the growing flavoured milk category as part of a strategy to extend its product range. This category of the dairy market was worth approximately £92m in the year ending March 2011, a 3% increase in value terms, although volumes did not change significantly over the period, slowing down after showing double-digit growth in previous years. The market leaders are branded products Frijj (Dairy Crest) and Yazoo (Friesland Campina), followed by own-label products.
The own-label component of this market holds in the region of 30% of value and volume, compared to 70% for branded products. However, in the year ending March 2011, it was the own-label segment which performed better, reporting 4% growth in volume and value sales. Branded products, on the other hand, reported only a 2% increase in value sales with no noticeable growth in volume sales, resulting in a reduction in market share. The situation of higher average values indicates that manufacturers were able to realise higher prices through the year without seriously impacting sales.
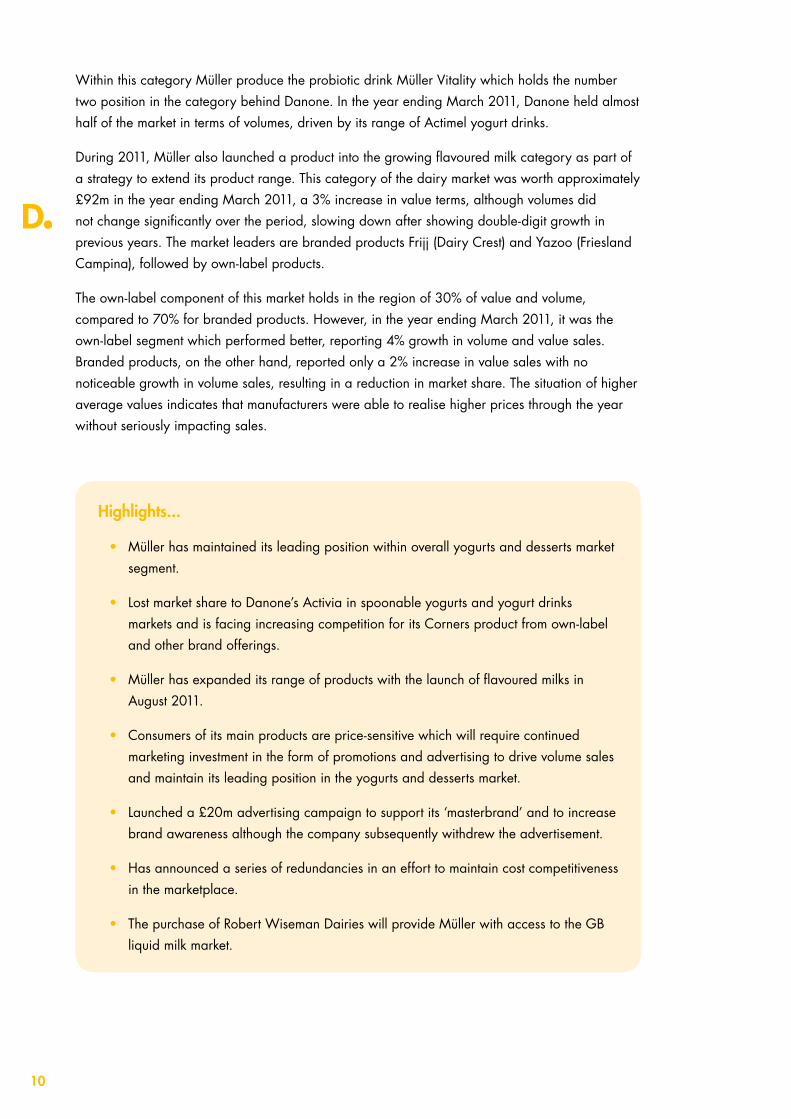
Highlights...
• Müller has maintained its leading position within overall yogurts and desserts market segment.
• Lost market share to Danone’s Activia in spoonable yogurts and yogurt drinks markets and is facing increasing competition for its Corners product from own-label and other brand offerings.
• Müller has expanded its range of products with the launch of flavoured milks in August 2011.
• Consumers of its main products are price-sensitive which will require continued marketing investment in the form of promotions and advertising to drive volume sales and maintain its leading position in the yogurts and desserts market.
• Launched a £20m advertising campaign to support its ‘masterbrand’ and to increase brand awareness although the company subsequently withdrew the advertisement.
• Has announced a series of redundancies in an effort to maintain cost competitiveness in the marketplace.
• The purchase of Robert Wiseman Dairies will provide Müller with access to the GB liquid milk market.
11
Müller
Financial analysis
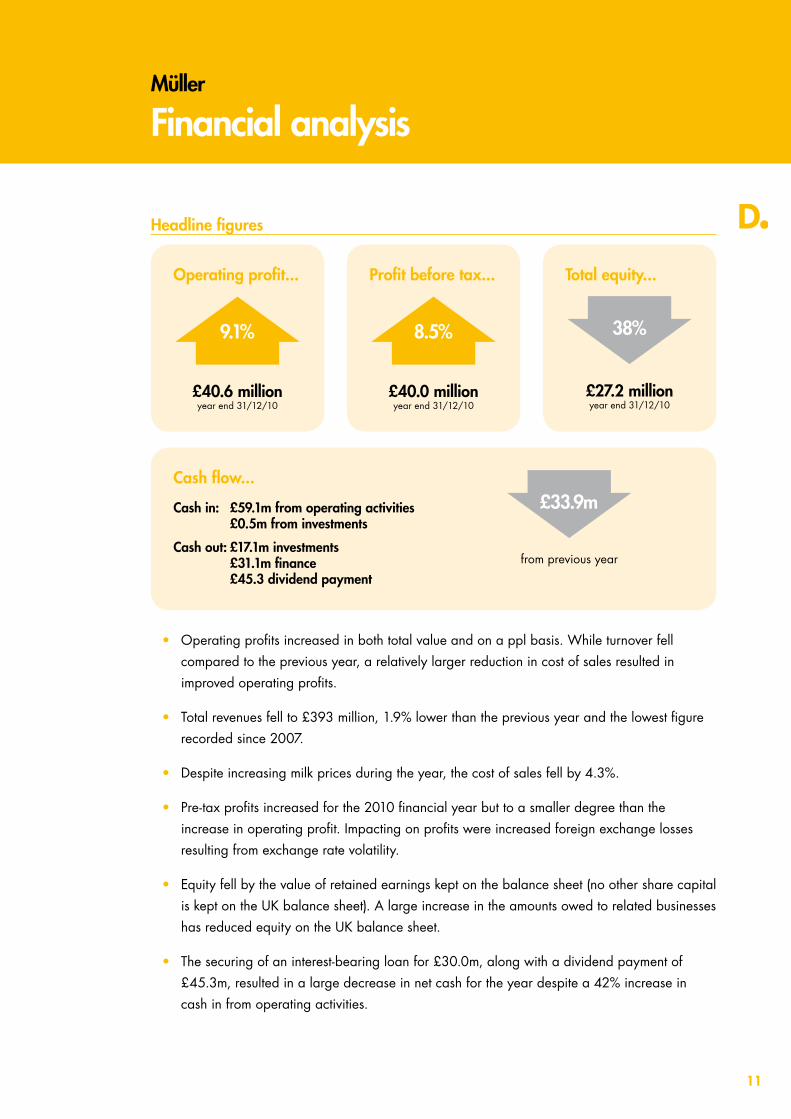
Headline figures
Operating profit...
9.1%
£40.6 million year end 31/12/10
Profit before tax...
8.5%
£40.0 million year end 31/12/10
Total equity...
38%
£27.2 million year end 31/12/10
Cash flow...
Cash in: £59.1m from operating activities £0.5m from investments
Cash out: £17.1m investments £31.1m finance £45.3 dividend payment
£33.9m
from previous year
• Operating profits increased in both total value and on a ppl basis. While turnover fell compared to the previous year, a relatively larger reduction in cost of sales resulted in improved operating profits.
• Total revenues fell to £393 million, 1.9% lower than the previous year and the lowest figure recorded since 2007.
• Despite increasing milk prices during the year, the cost of sales fell by 4.3%.
• Pre-tax profits increased for the 2010 financial year but to a smaller degree than the increase in operating profit. Impacting on profits were increased foreign exchange losses resulting from exchange rate volatility.
• Equity fell by the value of retained earnings kept on the balance sheet (no other share capital is kept on the UK balance sheet). A large increase in the amounts owed to related businesses has reduced equity on the UK balance sheet.
• The securing of an interest-bearing loan for £30.0m, along with a dividend payment of £45.3m, resulted in a large decrease in net cash for the year despite a 42% increase in cash in from operating activities.
12
Financial Ratios
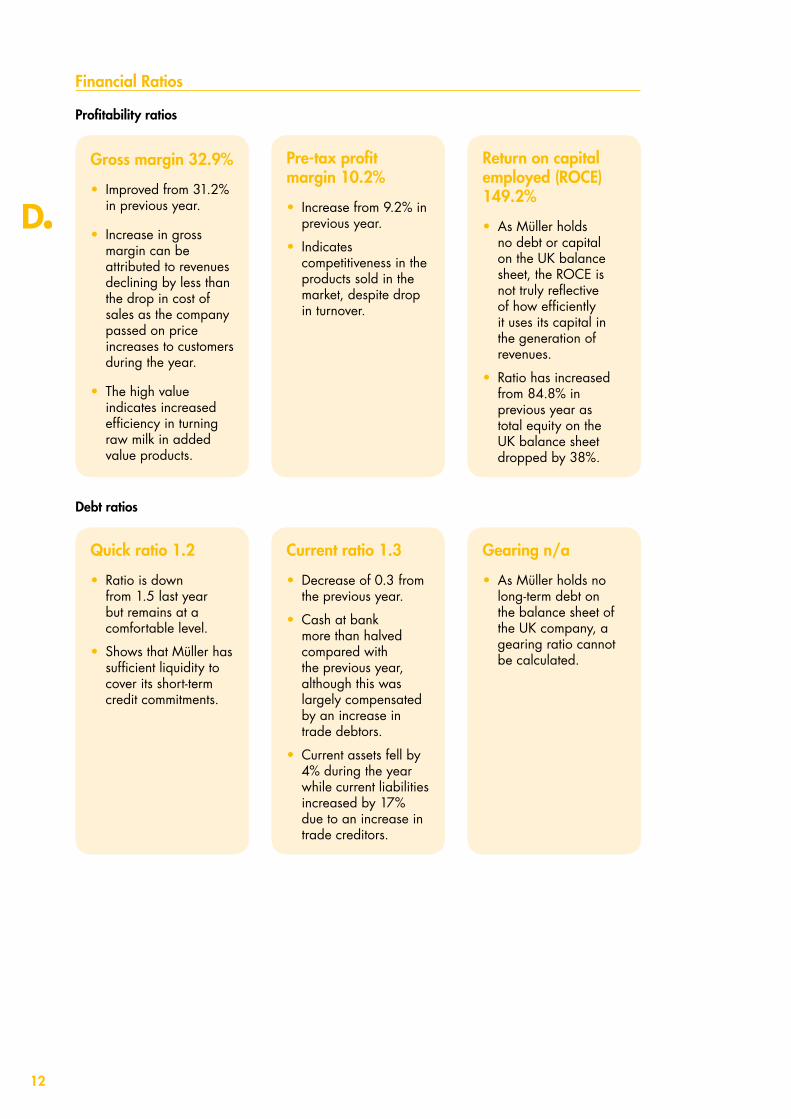
Profitability ratios
Gross margin 32.9%
• Improved from 31.2% in previous year.
• Increase in gross margin can be attributed to revenues declining by less than the drop in cost of sales as the company passed on price increases to customers during the year.
• The high value indicates increased efficiency in turning raw milk in added value products.
Pre-tax profit margin 10.2%
• Increase from 9.2% in previous year.
• Indicates competitiveness in the products sold in the market, despite drop in turnover.
Return on capital employed (ROCE) 149.2%
• As Müller holds no debt or capital on the UK balance sheet, the ROCE is not truly reflective of how efficiently it uses its capital in the generation of revenues.
• Ratio has increased from 84.8% in previous year as total equity on the UK balance sheet dropped by 38%.
Debt ratios
Quick ratio 1.2
• Ratio is down from 1.5 last year but remains at a comfortable level.
• Shows that Müller has sufficient liquidity to cover its short-term credit commitments.
Current ratio 1.3
• Decrease of 0.3 from the previous year.
• Cash at bank more than halved compared with the previous year, although this was largely compensated by an increase in trade debtors.
• Current assets fell by 4% during the year while current liabilities increased by 17% due to an increase in trade creditors.
Gearing n/a
• As Müller holds no long-term debt on the balance sheet of the UK company, a gearing ratio cannot be calculated.

13
Efficiency ratios
Debtor days 37.6
• Has reduced debtor days by just under 2 days from last year.
• The company is collecting debt within a comparable timescale to the industry average.
Creditor days 56.7
• Reduced from 66.9 in previous year due to lower accruals.
• As Müller holds only trade and short-term debt on its UK balance sheet, this ratio may not give an accurate representation of how quickly it pays its suppliers.
Return on total assets n/a
• Return on assets reflects how well a company generates revenues from its asset base. As Müller does not hold all of its UK assets on the balance sheet, an accurate ratio cannot be calculated.
Highlights...
• Müller reports solid financial results. However, it must be taken into consideration that a full account of the financial situation of its UK operations cannot be determined as it appears that its debt and some of its assets are held on the accounts of its parent company.
• The UK company has maintained gross margins and pre-tax profit margin levels year-on-year despite rising input costs as it was able to pass on cost increases to suppliers.
• Müller will continue to be impacted by foreign exchange volatility as it imports raw materials (excluding milk) from Europe.
14
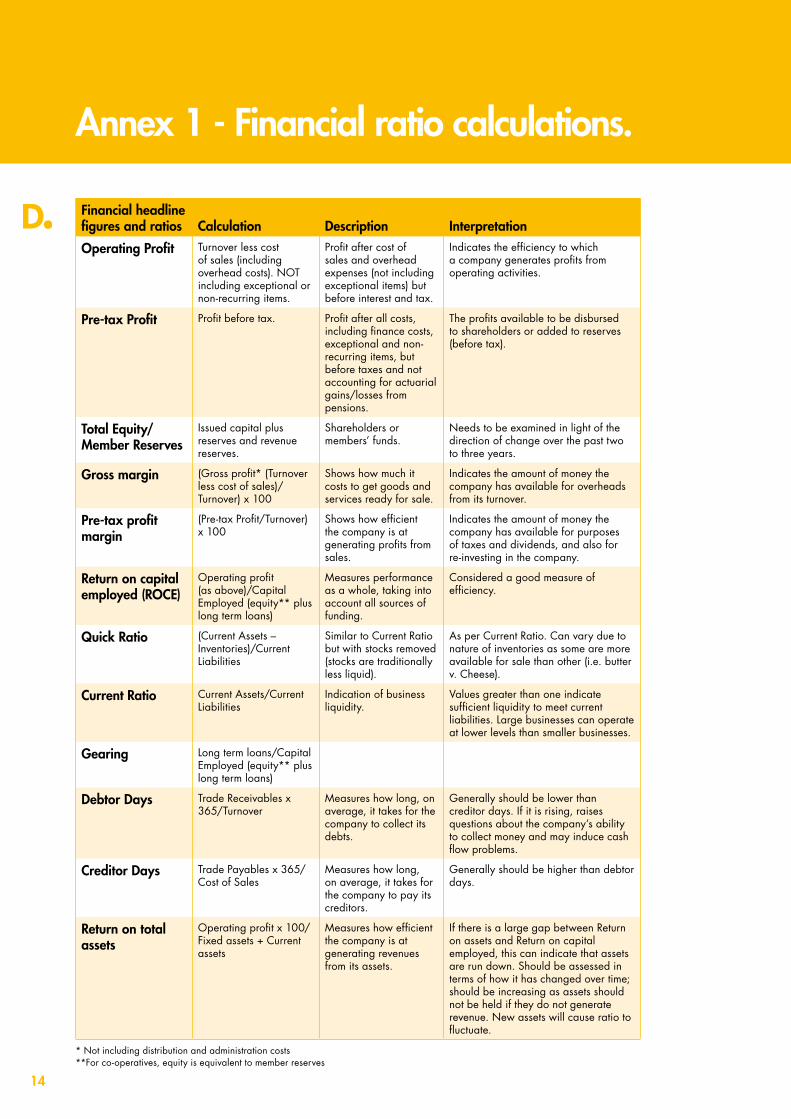
Annex 1 - Financial ratio calculations.
Financial headline figures and ratios Calculation Description Interpretation
Operating Profit Turnover less cost of sales (including overhead costs). NOT including exceptional or non-recurring items.
Profit after cost of sales and overhead expenses (not including exceptional items) but before interest and tax.
Indicates the efficiency to which a company generates profits from operating activities.
Pre-tax Profit Profit before tax. Profit after all costs, including finance costs, exceptional and non-recurring items, but before taxes and not accounting for actuarial gains/losses from pensions.
The profits available to be disbursed to shareholders or added to reserves (before tax).
Total Equity/Member Reserves
Issued capital plus reserves and revenue reserves.
Shareholders or members’ funds.
Needs to be examined in light of the direction of change over the past two to three years.
Gross margin (Gross profit* (Turnover less cost of sales)/Turnover) x 100
Shows how much it costs to get goods and services ready for sale.
Indicates the amount of money the company has available for overheads from its turnover.
Pre-tax profit margin
(Pre-tax Profit/Turnover) x 100
Shows how efficient the company is at generating profits from sales.
Indicates the amount of money the company has available for purposes of taxes and dividends, and also for re-investing in the company.
Return on capital employed (ROCE)
Operating profit (as above)/Capital Employed (equity** plus long term loans)
Measures performance as a whole, taking into account all sources of funding.
Considered a good measure of efficiency.
Quick Ratio (Current Assets – Inventories)/Current Liabilities
Similar to Current Ratio but with stocks removed (stocks are traditionally less liquid).
As per Current Ratio. Can vary due to nature of inventories as some are more available for sale than other (i.e. butter v. Cheese).
Current Ratio Current Assets/Current Liabilities
Indication of business liquidity.
Values greater than one indicate sufficient liquidity to meet current liabilities. Large businesses can operate at lower levels than smaller businesses.
Gearing Long term loans/Capital Employed (equity** plus long term loans)
Debtor Days Trade Receivables x 365/Turnover
Measures how long, on average, it takes for the company to collect its debts.
Generally should be lower than creditor days. If it is rising, raises questions about the company’s ability to collect money and may induce cash flow problems.
Creditor Days Trade Payables x 365/Cost of Sales
Measures how long, on average, it takes for the company to pay its creditors.
Generally should be higher than debtor days.
Return on total assets
Operating profit x 100/Fixed assets + Current assets
Measures how efficient the company is at generating revenues from its assets.
If there is a large gap between Return on assets and Return on capital employed, this can indicate that assets are run down. Should be assessed in terms of how it has changed over time; should be increasing as assets should not be held if they do not generate revenue. New assets will cause ratio to fluctuate.
* Not including distribution and administration costs **For co-operatives, equity is equivalent to member reserves
15
While the Agriculture and Horticulture Development Board, operating through its DairyCo division, seeks to ensure that the information contained within this document is accurate at the time of printing, no warranty is given in respect thereof and, to the maximum extent permitted by law, the Agriculture and Horticulture Development Board accepts no liability for loss, damage or injury howsoever caused (including that caused by negligence) or suffered directly or indirectly in relation to information and opinions contained in or omitted from this document.
Copyright, Agriculture and Horticulture Development Board 2012. No part of this publication may be reproduced in any material form (including by photocopy or storage in any medium by electronic means) or any copy or adaptation stored, published or distributed (by physical, electronic or other means) without the prior permission in writing of the Agriculture and Horticulture Development Board, other than by reproduction in an unmodified form for the sole purpose of use as an information resource when DairyCo is clearly acknowledged as the source, or in accordance with the provisions of the Copyright, Designs and Patents Act 1988. All rights reserved.
AHDB® is a registered trademark of the Agriculture and Horticulture Development Board.
DairyCo® is a registered trademark of the Agriculture and Horticulture Development Board, for use by its DairyCo division.
All other trademarks, logos and brand names contained in this publication are the trademarks of their respective holders. No rights are granted without the prior written permission of the relevant owners.

Agriculture and Horticulture Development Board Stoneleigh Park Kenilworth WarwickshireCV8 2TL
T: 024 7669 2051E: [email protected]
www.dairyco.org.uk
DairyCo is a division of the Agriculture and Horticulture Development Board