Embed Size (px)
Citation preview
EVN – the company for energy, water and environmental servicesMarch 2022
Agenda
EVN at a glance
Business development (FY 2020/21)
Back-up information
Company presentation, March 2022 2
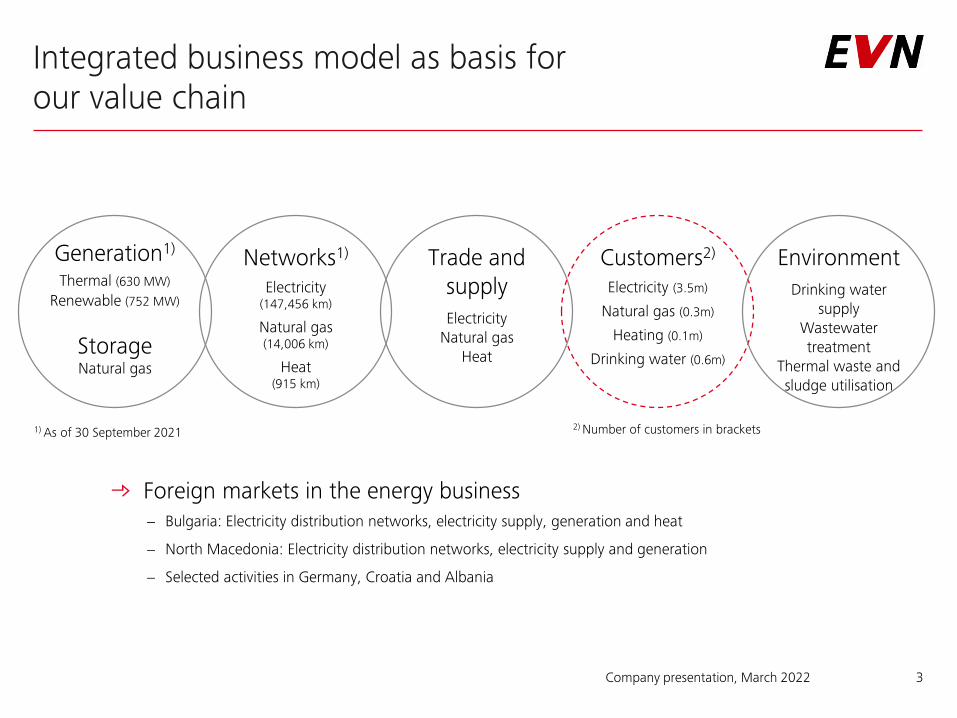
Integrated business model as basis for our value chain
Company presentation, March 2022 3
Generation1)
Thermal (630 MW)
Renewable (752 MW)
StorageNatural gas
Networks1)
Electricity(147,456 km)
Natural gas(14,006 km)
Heat(915 km)
Trade and supplyElectricity
Natural gasHeat
Customers2)
Electricity (3.5m)
Natural gas (0.3m)
Heating (0.1m)
Drinking water (0.6m)
EnvironmentDrinking water
supplyWastewater treatment
Thermal waste and sludge utilisation
2) Number of customers in brackets
Foreign markets in the energy business− Bulgaria: Electricity distribution networks, electricity supply, generation and heat
− North Macedonia: Electricity distribution networks, electricity supply and generation
− Selected activities in Germany, Croatia and Albania
1) As of 30 September 2021
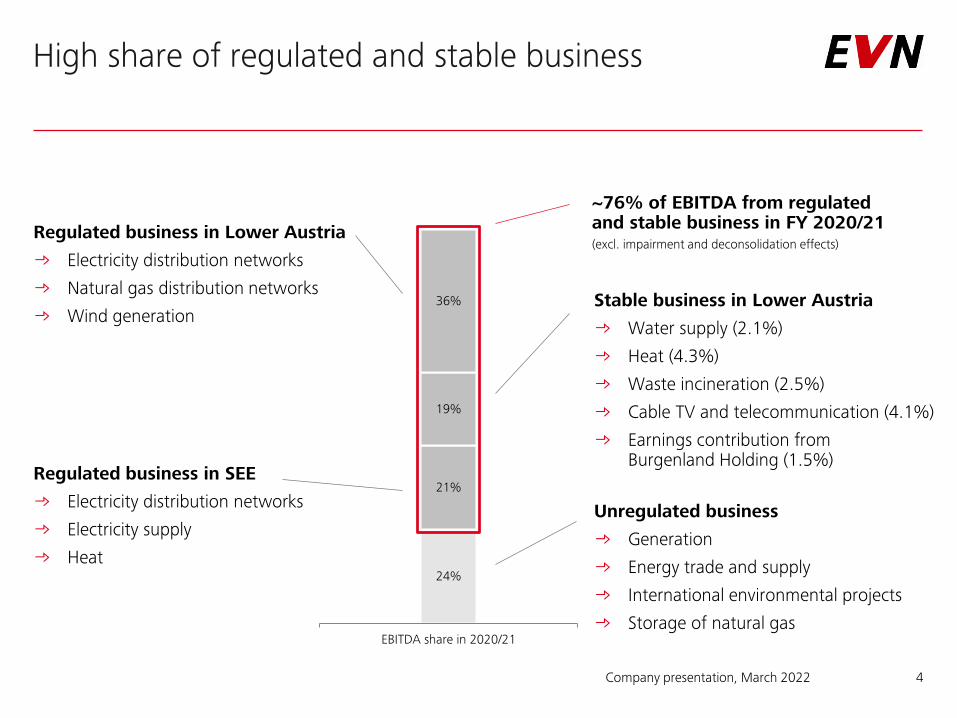
24%
21%
19%
36%
EBITDA share in 2020/21
High share of regulated and stable business
Regulated business in Lower Austria Electricity distribution networks
Natural gas distribution networks
Wind generation
Regulated business in SEE Electricity distribution networks
Electricity supply
Heat
Stable business in Lower Austria Water supply (2.1%)
Heat (4.3%)
Waste incineration (2.5%)
Cable TV and telecommunication (4.1%)
Earnings contribution from Burgenland Holding (1.5%)
Unregulated business Generation
Energy trade and supply
International environmental projects
Storage of natural gas
~76% of EBITDA from regulated and stable business in FY 2020/21(excl. impairment and deconsolidation effects)
4Company presentation, March 2022
Company presentation, March 2022 5
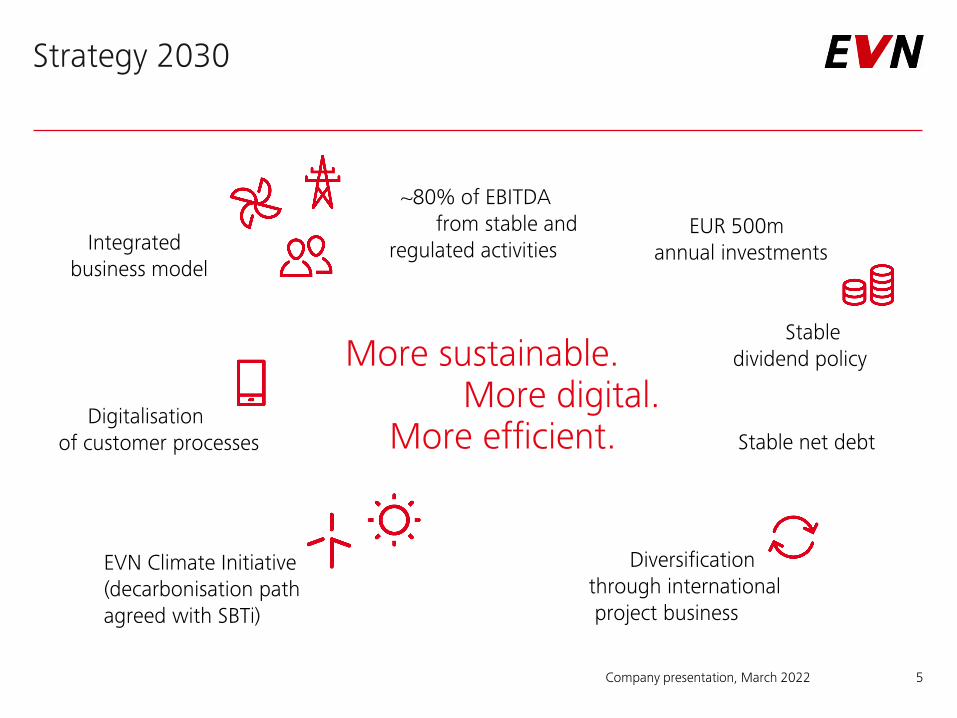
~80% of EBITDAfrom stable and
regulated activitiesEUR 500m
annual investmentsIntegratedbusiness model
Digitalisation of customer processes
Stabledividend policy
Diversification through international project business
Stable net debt
More sustainable.More digital.
More efficient.
EVN Climate Initiative(decarbonisation pathagreed with SBTi)
Strategy 2030
EVN Climate Initiative
Expansion targets for renewables until 2030
− Wind (+350 MW) and PV (+300 MW)
CO2 reduction goals agreed with Science Based Targets initiative
− Well-below 2°C goal of Paris Agreement
Climate neutrality in selected subsidiaries (PAS 2060)
Company presentation, March 2022 6
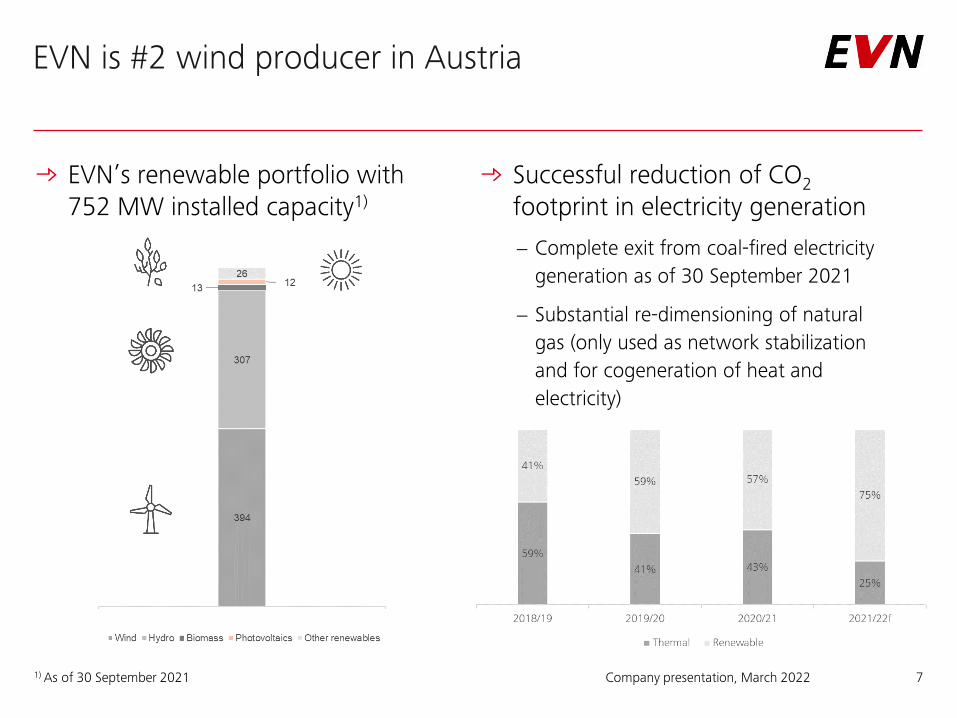
EVN is #2 wind producer in Austria
EVN’s renewable portfolio with 752 MW installed capacity1)
Successful reduction of CO2
footprint in electricity generation
− Complete exit from coal-fired electricity generation as of 30 September 2021
− Substantial re-dimensioning of natural gas (only used as network stabilization and for cogeneration of heat and electricity)
Company presentation, March 2022 71) As of 30 September 2021
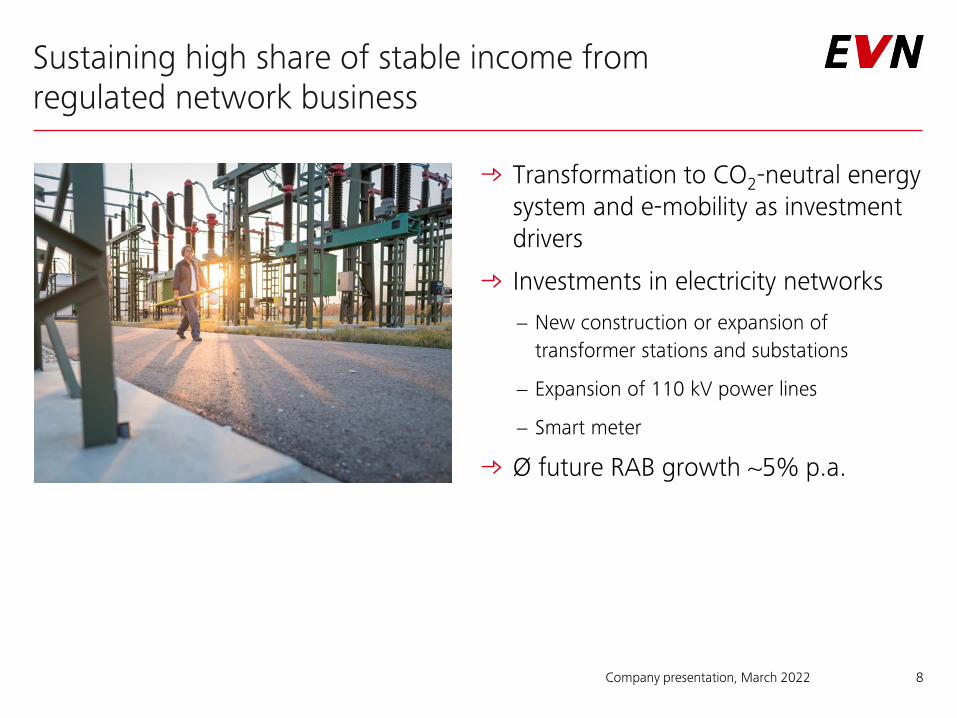
Sustaining high share of stable income from regulated network business
Transformation to CO2-neutral energy system and e-mobility as investment drivers
Investments in electricity networks
− New construction or expansion of transformer stations and substations
− Expansion of 110 kV power lines
− Smart meter
Ø future RAB growth ~5% p.a.
Company presentation, March 2022 8
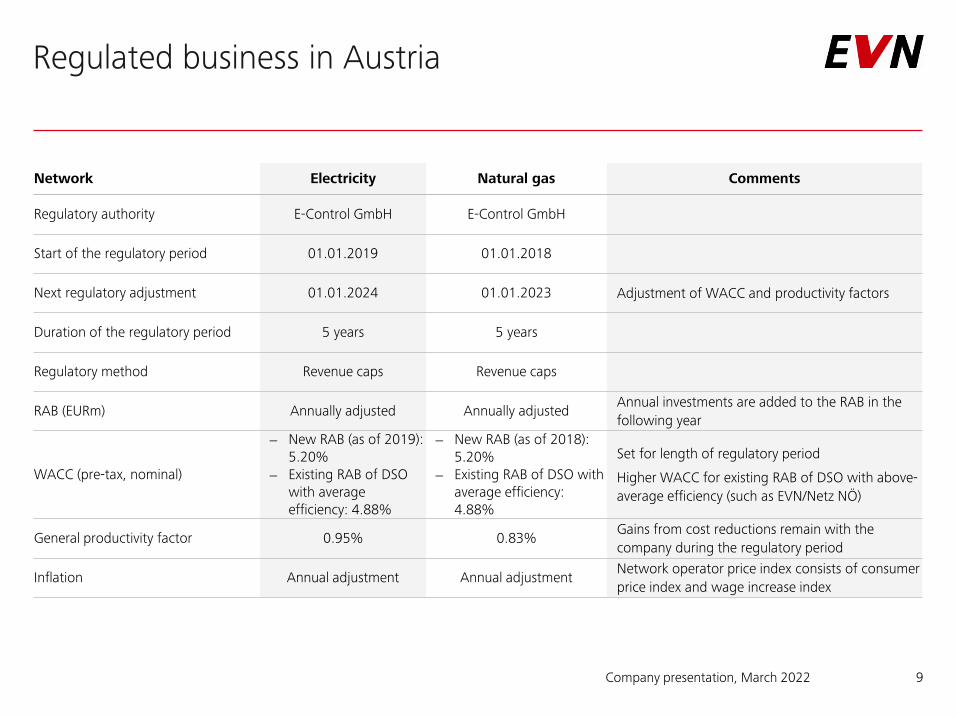
Regulated business in Austria
Company presentation, March 2022 9
Network Electricity Natural gas Comments
Regulatory authority E-Control GmbH E-Control GmbH
Start of the regulatory period 01.01.2019 01.01.2018
Next regulatory adjustment 01.01.2024 01.01.2023 Adjustment of WACC and productivity factors
Duration of the regulatory period 5 years 5 years
Regulatory method Revenue caps Revenue caps
RAB (EURm) Annually adjusted Annually adjustedAnnual investments are added to the RAB in the following year
WACC (pre-tax, nominal)
− New RAB (as of 2019): 5.20%
− Existing RAB of DSO with average efficiency: 4.88%
− New RAB (as of 2018): 5.20%
− Existing RAB of DSO with average efficiency: 4.88%
Set for length of regulatory period
Higher WACC for existing RAB of DSO with above-average efficiency (such as EVN/Netz NÖ)
General productivity factor 0.95% 0.83%Gains from cost reductions remain with the company during the regulatory period
Inflation Annual adjustment Annual adjustmentNetwork operator price index consists of consumer price index and wage increase index
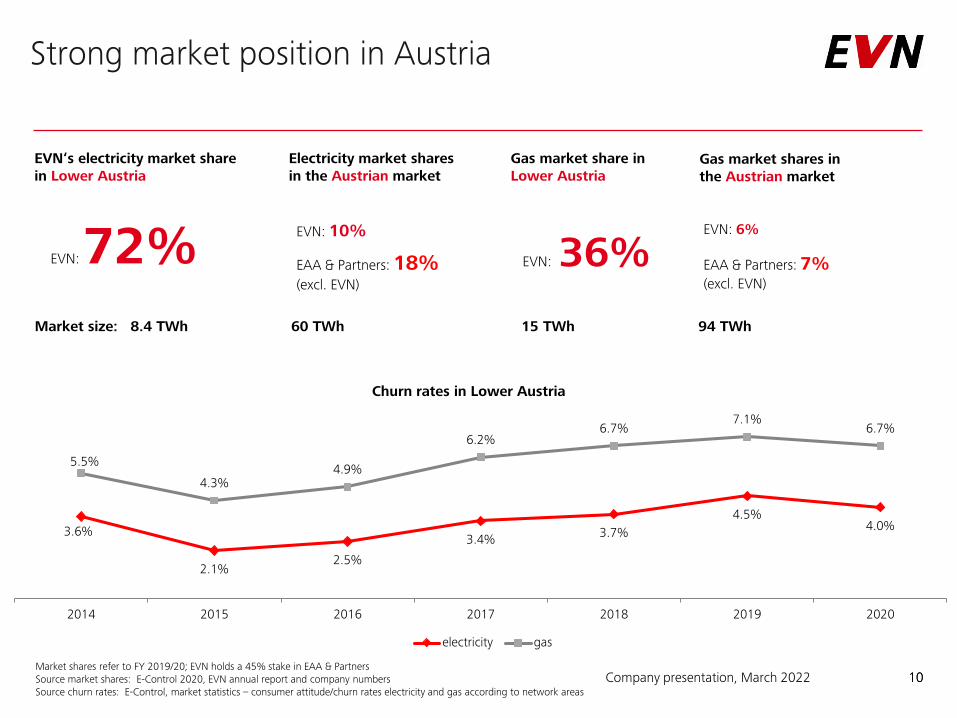
Strong market position in Austria
10
60 TWh 94 TWh15 TWhMarket size: 8.4 TWh
Market shares refer to FY 2019/20; EVN holds a 45% stake in EAA & PartnersSource market shares: E-Control 2020, EVN annual report and company numbersSource churn rates: E-Control, market statistics – consumer attitude/churn rates electricity and gas according to network areas
EVN‘s electricity market sharein Lower Austria
Gas market share in Lower Austria
Electricity market sharesin the Austrian market
Gas market shares in the Austrian market
EVN: 72% EVN: 36%EVN: 6%EVN: 10%
EAA & Partners: 18%(excl. EVN)
EAA & Partners: 7%(excl. EVN)
10
Churn rates in Lower Austria
3.6%
2.1%2.5%
3.4% 3.7%4.5%
4.0%
5.5%
4.3%4.9%
6.2%6.7%
7.1%6.7%
2014 2015 2016 2017 2018 2019 2020
electricity gas
Company presentation, March 2022
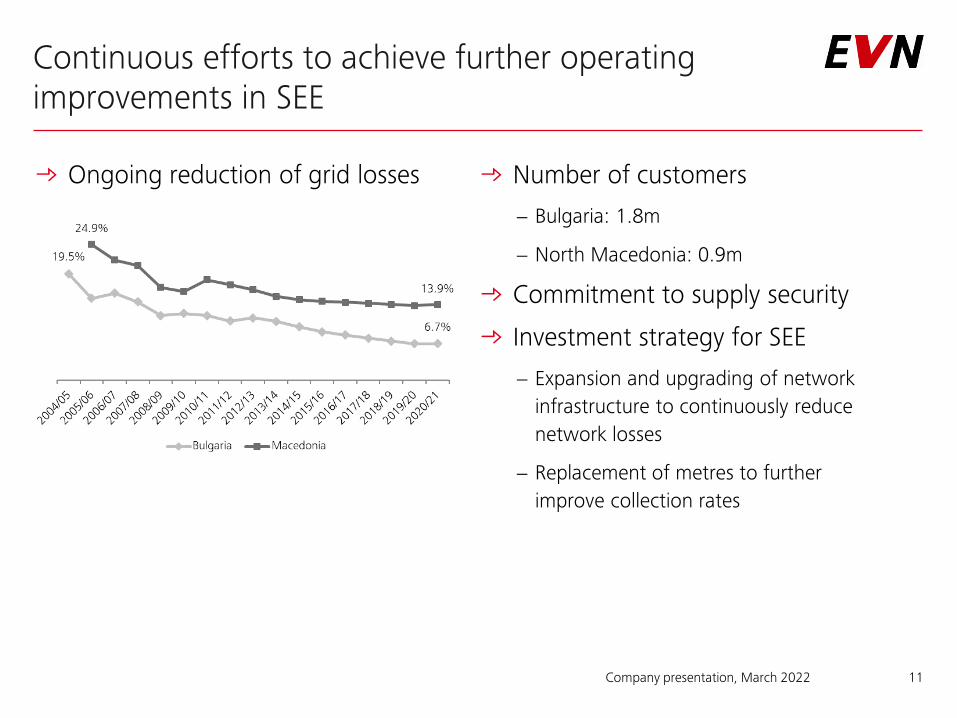
Continuous efforts to achieve further operating improvements in SEE
Ongoing reduction of grid losses Number of customers
− Bulgaria: 1.8m
− North Macedonia: 0.9m
Commitment to supply security
Investment strategy for SEE
− Expansion and upgrading of network infrastructure to continuously reduce network losses
− Replacement of metres to further improve collection rates
Company presentation, March 2022 11
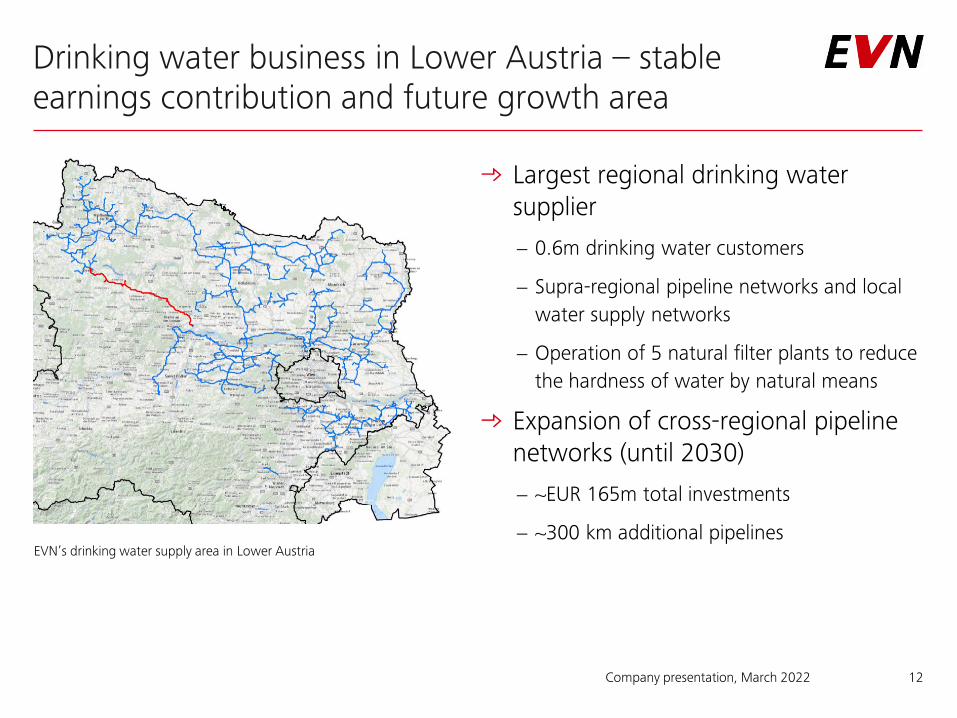
Drinking water business in Lower Austria – stable earnings contribution and future growth area
Largest regional drinking water supplier
− 0.6m drinking water customers
− Supra-regional pipeline networks and local water supply networks
− Operation of 5 natural filter plants to reduce the hardness of water by natural means
Expansion of cross-regional pipeline networks (until 2030)
− ~EUR 165m total investments
− ~300 km additional pipelines
12Company presentation, March 2022
EVN’s drinking water supply area in Lower Austria
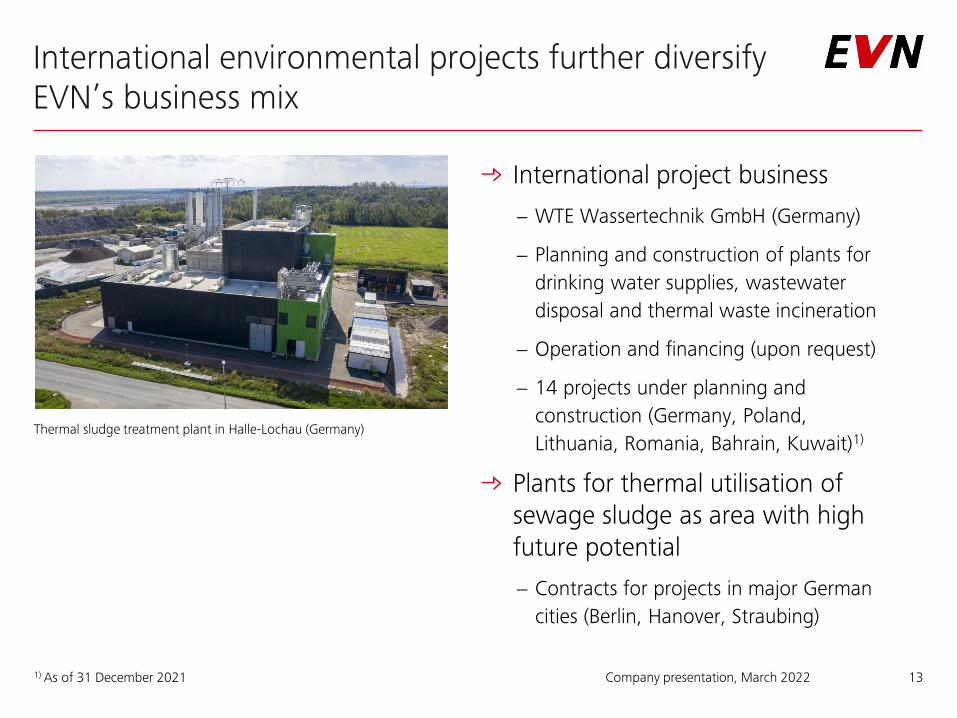
International environmental projects further diversify EVN’s business mix
International project business
− WTE Wassertechnik GmbH (Germany)
− Planning and construction of plants for drinking water supplies, wastewater disposal and thermal waste incineration
− Operation and financing (upon request)
− 14 projects under planning and construction (Germany, Poland, Lithuania, Romania, Bahrain, Kuwait)1)
Plants for thermal utilisation of sewage sludge as area with high future potential
− Contracts for projects in major German cities (Berlin, Hanover, Straubing)
13Company presentation, March 20221) As of 31 December 2021
Thermal sludge treatment plant in Halle-Lochau (Germany)
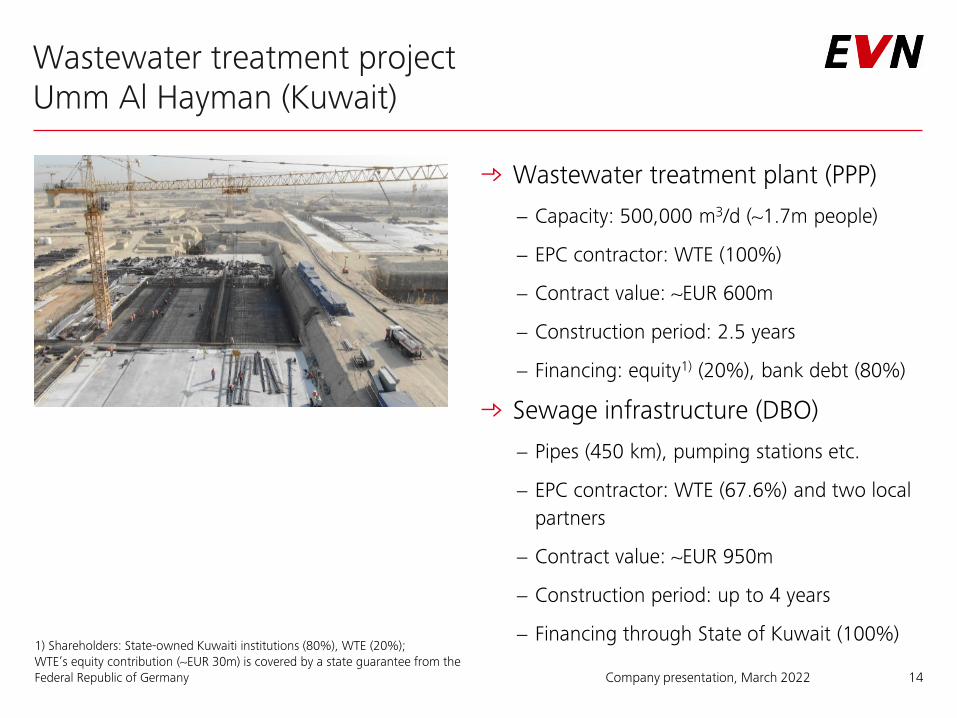
Wastewater treatment project Umm Al Hayman (Kuwait)
Wastewater treatment plant (PPP)
− Capacity: 500,000 m3/d (~1.7m people)
− EPC contractor: WTE (100%)
− Contract value: ~EUR 600m
− Construction period: 2.5 years
− Financing: equity1) (20%), bank debt (80%)
Sewage infrastructure (DBO)
− Pipes (450 km), pumping stations etc.
− EPC contractor: WTE (67.6%) and two local partners
− Contract value: ~EUR 950m
− Construction period: up to 4 years
− Financing through State of Kuwait (100%)
Company presentation, March 2022 14
1) Shareholders: State-owned Kuwaiti institutions (80%), WTE (20%); WTE’s equity contribution (~EUR 30m) is covered by a state guarantee from the Federal Republic of Germany
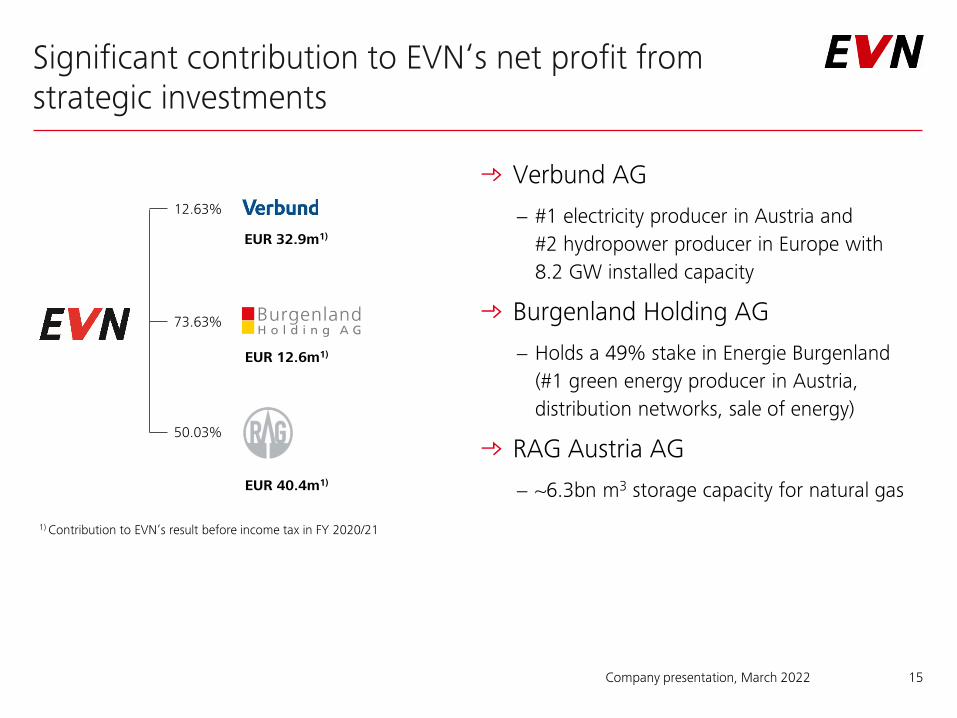
Significant contribution to EVN‘s net profit from strategic investments
Verbund AG
− #1 electricity producer in Austria and#2 hydropower producer in Europe with 8.2 GW installed capacity
Burgenland Holding AG
− Holds a 49% stake in Energie Burgenland (#1 green energy producer in Austria, distribution networks, sale of energy)
RAG Austria AG
− ~6.3bn m3 storage capacity for natural gas
15
12.63%
73.63%
50.03%
EUR 32.9m1)
1) Contribution to EVN’s result before income tax in FY 2020/21
EUR 12.6m1)
EUR 40.4m1)
Company presentation, March 2022
Key messages to our shareholders
High share of earnings from regulated and stable business
Continuous strengthening and expansion of domestic regulated and stable activities
− Networks, wind generation, heating, drinking water supply
Active role in energy transition
Sustainable company with ESG-focused strategy
− CO2 reduction goals agreed with Science Based Targets initiative; renewable expansion; exit from coal
Robustness of integrated business model
Highly reliable dividend stock
16Company presentation, March 2022
Outlook for 2021/22
Group net result for 2021/22 is expected to range from approximately EUR 200m to EUR 240m
− Stronger or longer distortions on the energy markets could have a negative impact on expected earnings
Investment strategy
− Annual investments up to EUR 500m over the coming years
− Thereof approximately three-fourths will be directed to renewable generation, networks, district heating and drinking water in Lower Austria
− Wind and photovoltaic projects in Lower Austria, Bulgaria and North Macedonia
17Company presentation, March 2022
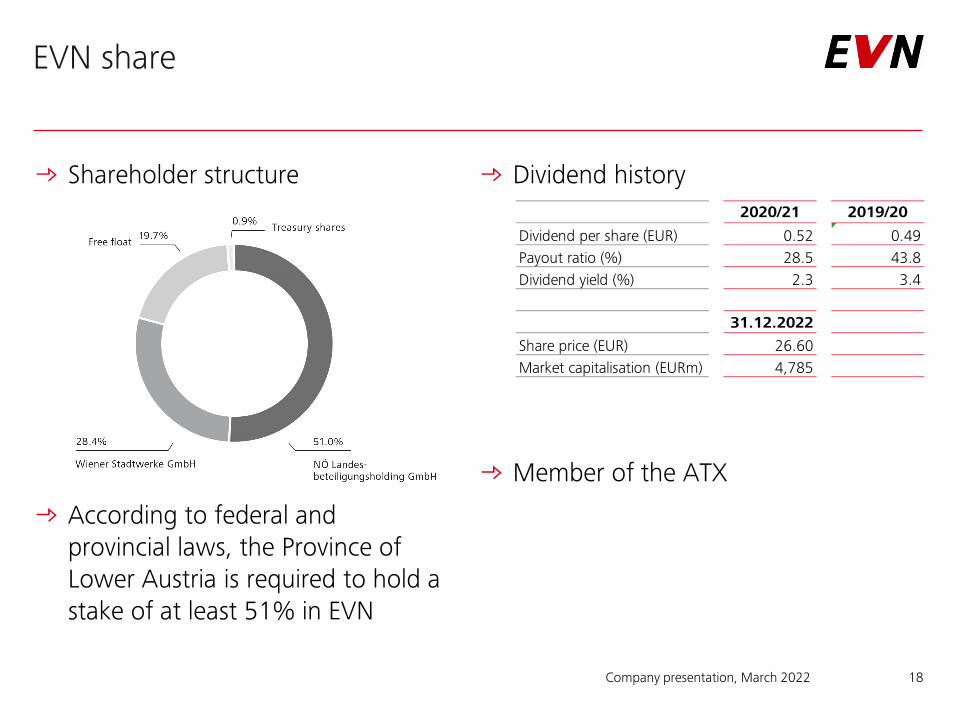
EVN share
Shareholder structure
According to federal and provincial laws, the Province of Lower Austria is required to hold a stake of at least 51% in EVN
Dividend history
Member of the ATX
Company presentation, March 2022 18
2020/21 2019/20Dividend per share (EUR) 0.52 0.49Payout ratio (%) 28.5 43.8Dividend yield (%) 2.3 3.4
31.12.2022Share price (EUR) 26.60Market capitalisation (EURm) 4,785
Agenda
EVN at a glance
Business development (FY 2020/21)
Back-up information
19Company presentation, March 2022
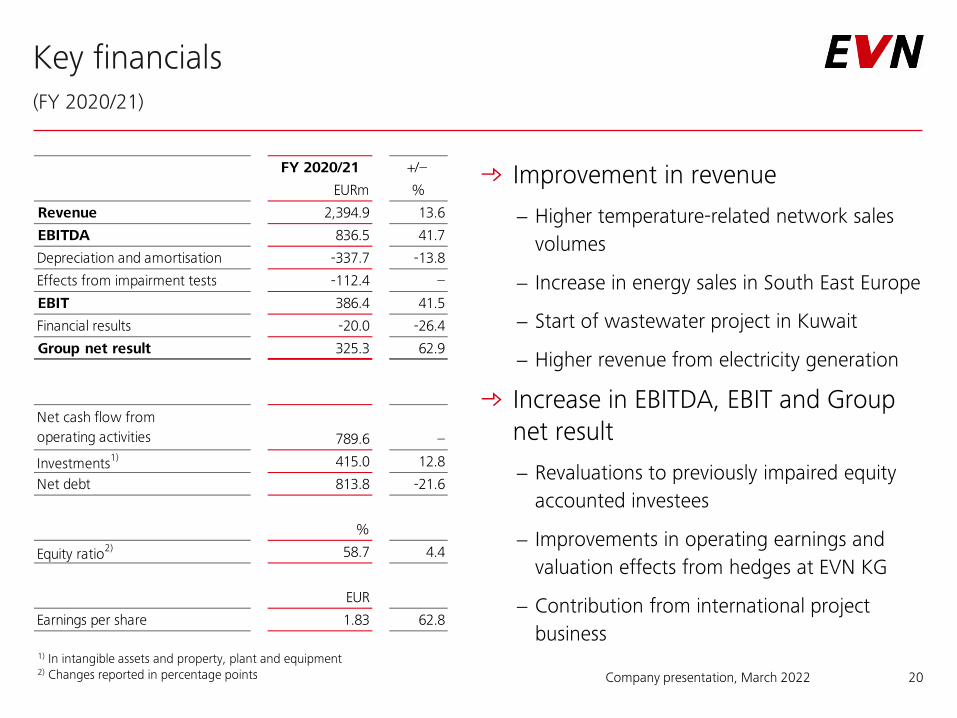
Key financials(FY 2020/21)
Improvement in revenue
− Higher temperature-related network sales volumes
− Increase in energy sales in South East Europe
− Start of wastewater project in Kuwait
− Higher revenue from electricity generation
Increase in EBITDA, EBIT and Group net result
− Revaluations to previously impaired equity accounted investees
− Improvements in operating earnings and valuation effects from hedges at EVN KG
− Contribution from international project business
Company presentation, March 2022 20
1) In intangible assets and property, plant and equipment2) Changes reported in percentage points
FY 2020/21 +/–
EURm %
Revenue 2,394.9 13.6
EBITDA 836.5 41.7
Depreciation and amortisation -337.7 -13.8
Effects from impairment tests -112.4 –
EBIT 386.4 41.5
Financial results -20.0 -26.4
Group net result 325.3 62.9
789.6 –
Investments1) 415.0 12.8
Net debt 813.8 -21.6
%
Equity ratio2) 58.7 4.4
EUR
Earnings per share 1.83 62.8
Net cash flow from operating activities
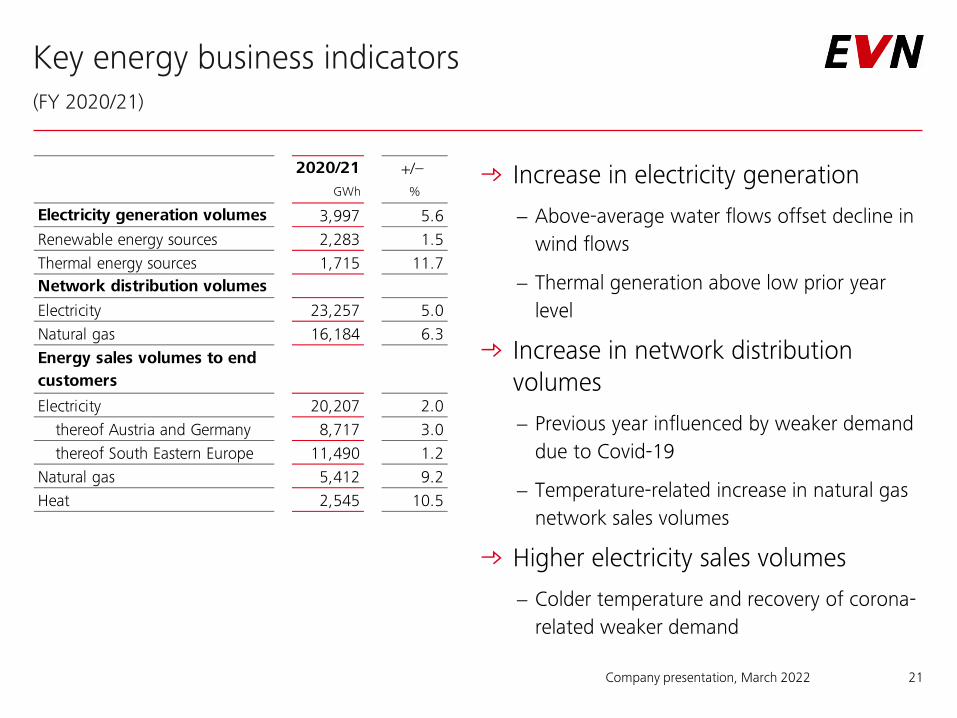
Key energy business indicators (FY 2020/21)
Increase in electricity generation
− Above-average water flows offset decline in wind flows
− Thermal generation above low prior year level
Increase in network distribution volumes
− Previous year influenced by weaker demand due to Covid-19
− Temperature-related increase in natural gas network sales volumes
Higher electricity sales volumes
− Colder temperature and recovery of corona-related weaker demand
Company presentation, March 2022 21
2020/21 +/– GWh %
Electricity generation volumes 3,997 5.6Renewable energy sources 2,283 1.5Thermal energy sources 1,715 11.7Network distribution volumesElectricity 23,257 5.0Natural gas 16,184 6.3Energy sales volumes to end customers
Electricity 20,207 2.0thereof Austria and Germany 8,717 3.0thereof South Eastern Europe 11,490 1.2
Natural gas 5,412 9.2Heat 2,545 10.5
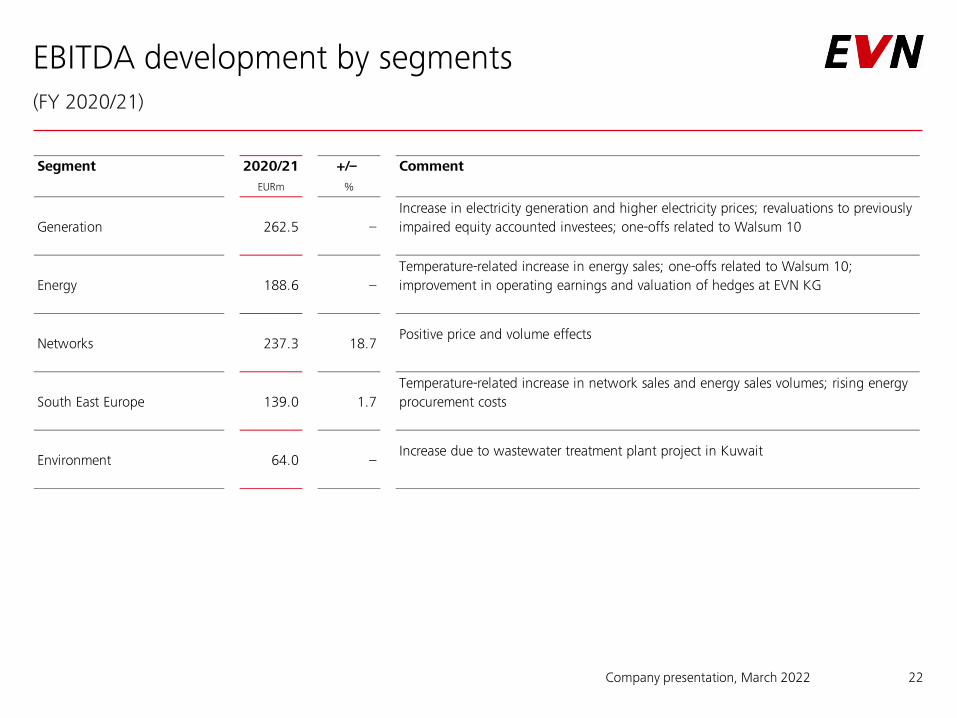
EBITDA development by segments(FY 2020/21)
22Company presentation, March 2022
Segment 2020/21 +/– CommentEURm %
Generation 262.5 –Increase in electricity generation and higher electricity prices; revaluations to previously impaired equity accounted investees; one-offs related to Walsum 10
Energy 188.6 –Temperature-related increase in energy sales; one-offs related to Walsum 10; improvement in operating earnings and valuation of hedges at EVN KG
Networks 237.3 18.7Positive price and volume effects
South East Europe 139.0 1.7Temperature-related increase in network sales and energy sales volumes; rising energy procurement costs
Environment 64.0 –Increase due to wastewater treatment plant project in Kuwait
Agenda
EVN at a glance
Business development (FY 2020/21)
Back-up information
23Company presentation, March 2022
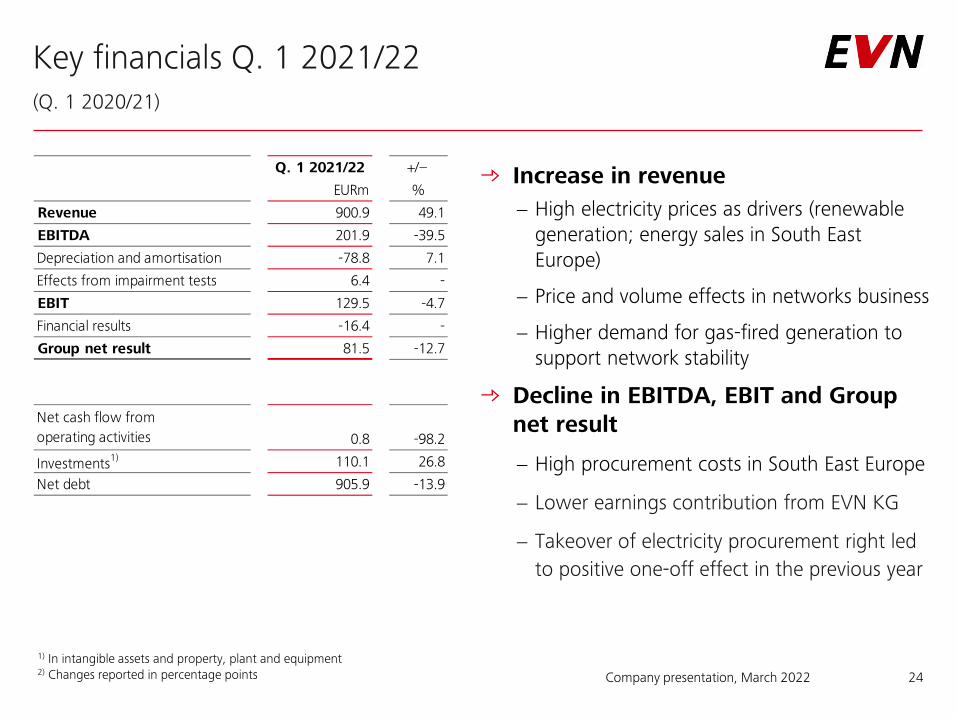
Key financials Q. 1 2021/22(Q. 1 2020/21)
Increase in revenue− High electricity prices as drivers (renewable
generation; energy sales in South East Europe)
− Price and volume effects in networks business
− Higher demand for gas-fired generation to support network stability
Decline in EBITDA, EBIT and Group net result
− High procurement costs in South East Europe
− Lower earnings contribution from EVN KG
− Takeover of electricity procurement right led to positive one-off effect in the previous year
Company presentation, March 2022 24
1) In intangible assets and property, plant and equipment2) Changes reported in percentage points
Q. 1 2021/22 +/–
EURm %
Revenue 900.9 49.1
EBITDA 201.9 -39.5
Depreciation and amortisation -78.8 7.1
Effects from impairment tests 6.4 -
EBIT 129.5 -4.7
Financial results -16.4 -
Group net result 81.5 -12.7
0.8 -98.2
Investments1) 110.1 26.8
Net debt 905.9 -13.9
Net cash flow from operating activities
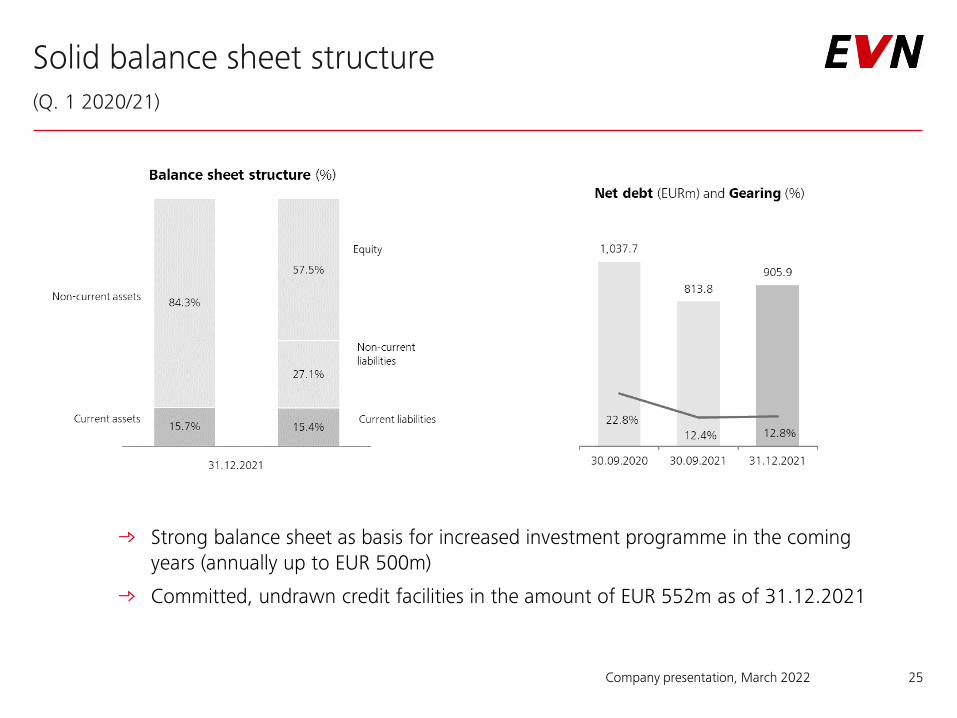
Solid balance sheet structure(Q. 1 2020/21)
Strong balance sheet as basis for increased investment programme in the coming years (annually up to EUR 500m)
Committed, undrawn credit facilities in the amount of EUR 552m as of 31.12.2021
25Company presentation, March 2022
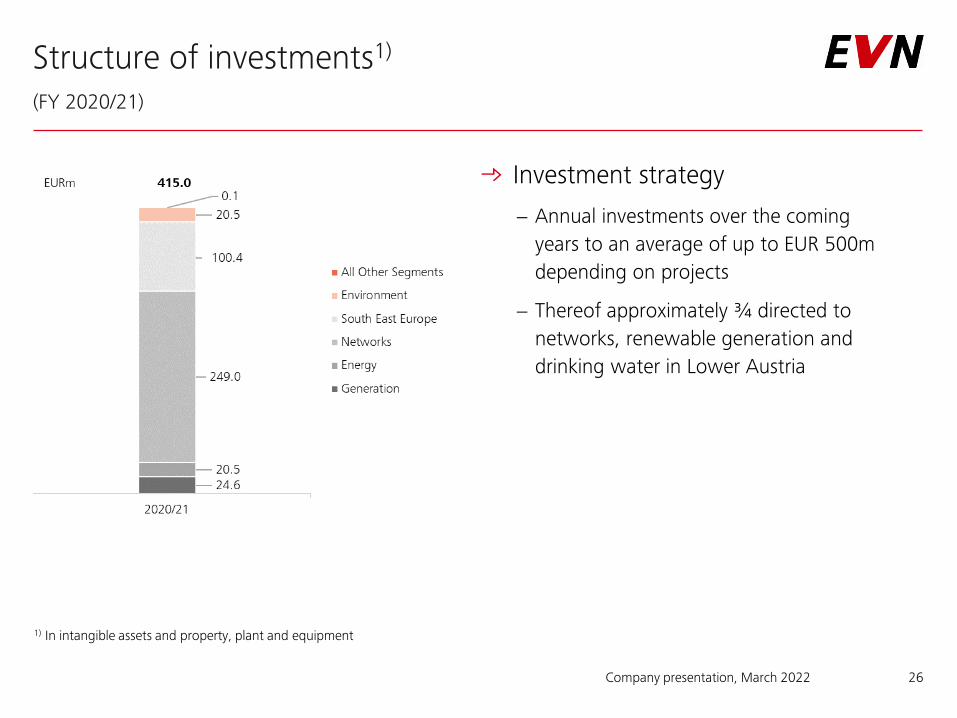
Structure of investments1)
(FY 2020/21)
Investment strategy
− Annual investments over the coming years to an average of up to EUR 500m depending on projects
− Thereof approximately ¾ directed to networks, renewable generation and drinking water in Lower Austria
26
1) In intangible assets and property, plant and equipment
Company presentation, March 2022
Dividend and financial policy
Stable dividend policy
− Hold the absolute amount of the dividend constant at a level of at least EUR 0.52 per share
− Commitment to appropriate participation in future earnings growth
Financial policy
− EVN’s goal is to maintain solid A category ratings in the future
− In order to achieve such ratings, EVN is strictly monitoring the adjusted target ratios of both rating agencies
Credit ratings
− Moody‘s: A1, stable outlook (May 2021)
− Scope Ratings: A+, stable outlook (November 2021)
Company presentation, March 2022 27
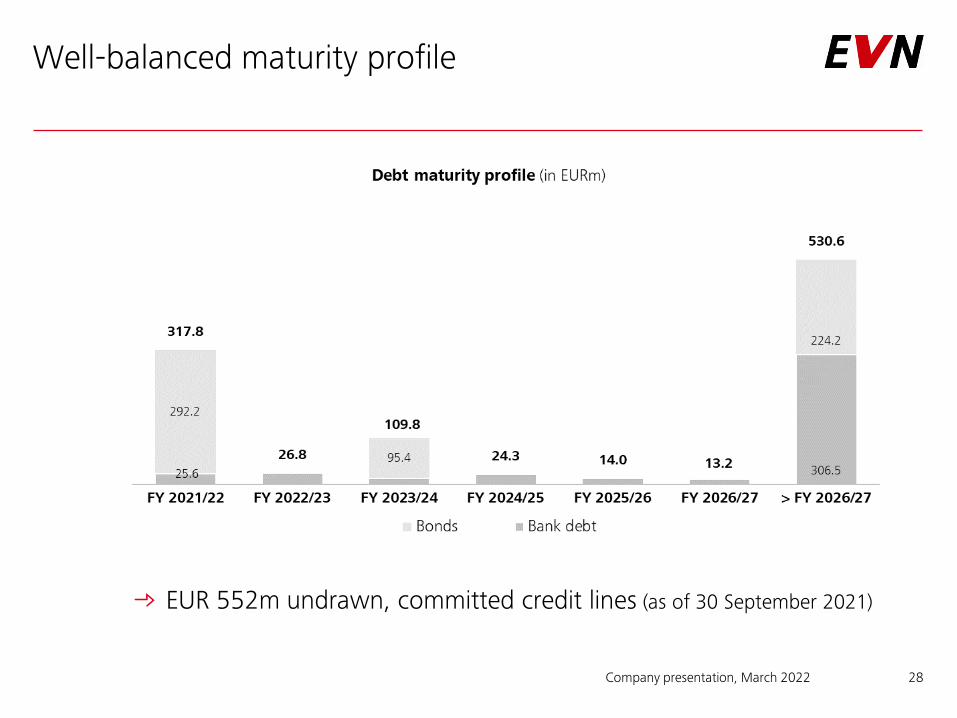
Well-balanced maturity profile
EUR 552m undrawn, committed credit lines (as of 30 September 2021)
28Company presentation, March 2022

Challenging market environment
29
Source: EVN, end-of February 2022
Company presentation, March 2022
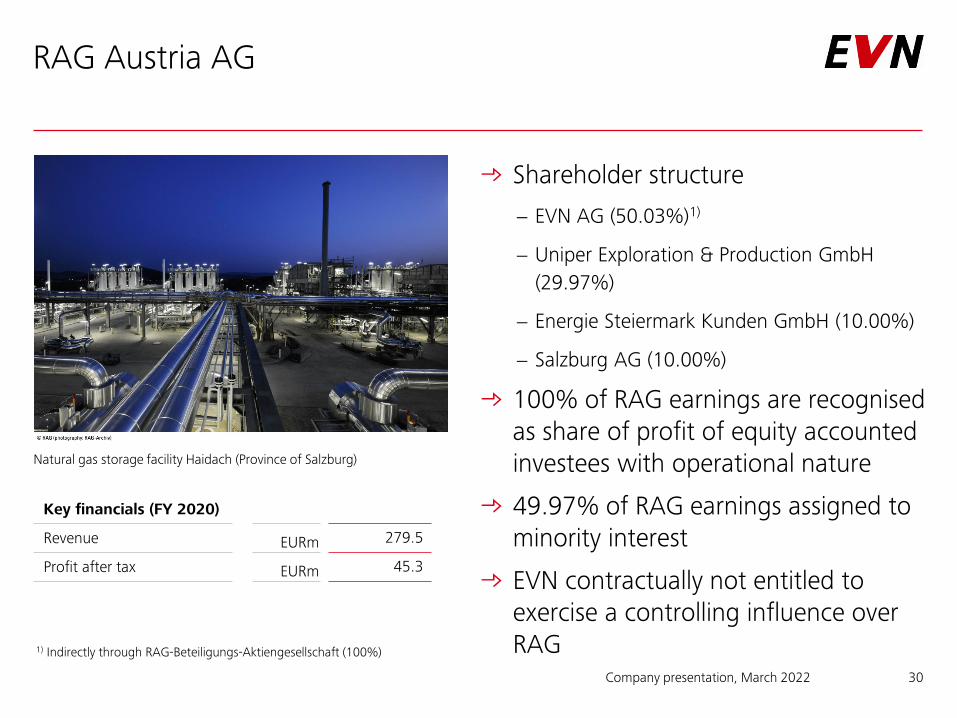
RAG Austria AG
Shareholder structure
− EVN AG (50.03%)1)
− Uniper Exploration & Production GmbH (29.97%)
− Energie Steiermark Kunden GmbH (10.00%)
− Salzburg AG (10.00%)
100% of RAG earnings are recognisedas share of profit of equity accounted investees with operational nature
49.97% of RAG earnings assigned to minority interest
EVN contractually not entitled to exercise a controlling influence over RAG
Company presentation, March 2022 30
Natural gas storage facility Haidach (Province of Salzburg)
1) Indirectly through RAG-Beteiligungs-Aktiengesellschaft (100%)
Key financials (FY 2020)
Revenue EURm 279.5
Profit after tax EURm 45.3
Contact details
Stefan Szyszkowitz, CEO
IR contact partners:
− Gerald Reidinger
− Matthias Neumüller
− Karin Krammer
− Doris Lohwasser (maternity leave)
IR contact details
− E-mail: [email protected]
− Phone: +43 2236 200-12128
− Phone: +43 2236 200-12867
Information on the internet
− www.evn.at
− www.investor.evn.at
− www.responsibility.evn.at
Headquarters of EVN AG
− EVN Platz2344 Maria Enzersdorf
Financial calendar
− Next event: Results HY. 1 2021/22, 25 May 2021
− www.investor.evn.at/financial-calender
31Company presentation, March 2022

Disclaimer
32
Certain statements made in this presentation may constitute „Forward-Looking Statements” within the meaning of the U.S. federal securities law. Forward-looking information is subject to various known and unknown risks and uncertainties. These include statements concerning our expectations and other statements that are not historical facts.
The Company believes any such statements are based on reasonable assumptions and reflect the judgement of EVN’s management based on factors currently known by it.
No assurance can be given that these forward-looking statements will prove accurate and correct, or that anticipated, projected future results will be achieved.
For additional information regarding risks, investors are referred to EVN’s latest Annual report.
Company presentation, March 2022