Embed Size (px)
Citation preview
Company Presentation / January 2015
1
Quiñenco Overview Recent Events Financial Overview
Main Operating Companies
Conclusions
2
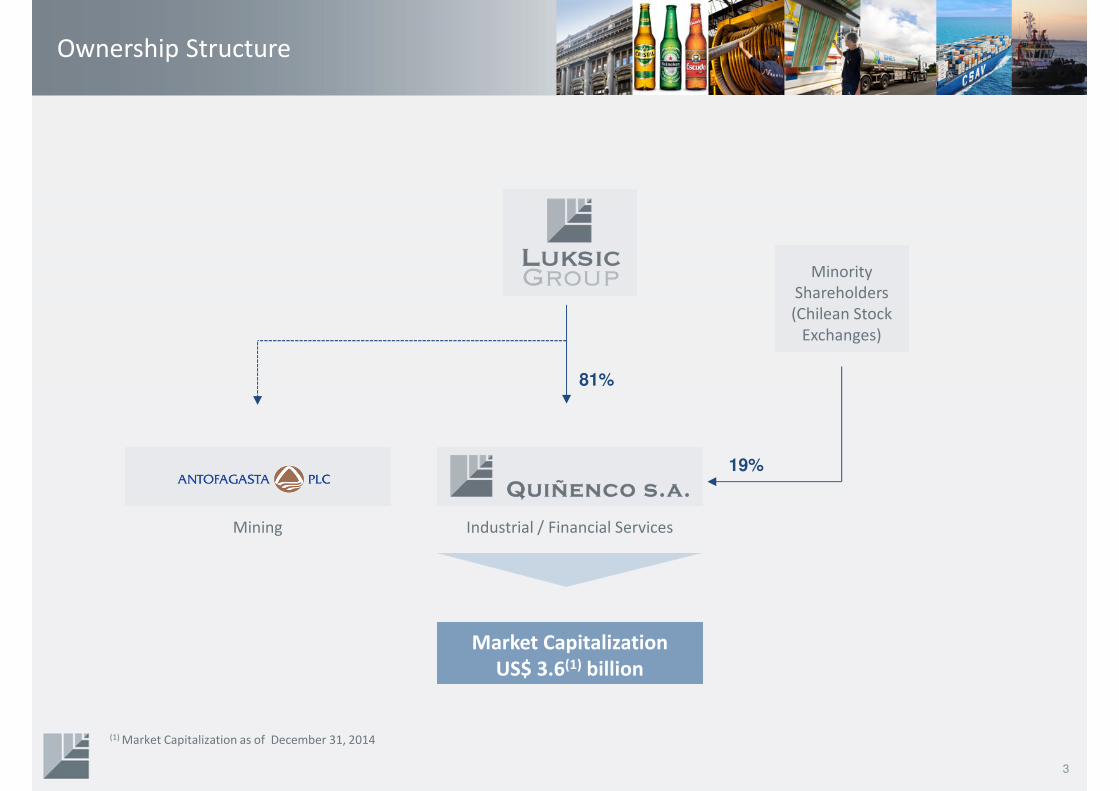
Ownership Structure
(1) Market Capitalization as of December 31, 2014
Mining Industrial / Financial Services
81%
19%
Minority
Shareholders
(Chilean Stock
Exchanges)
Market Capitalization
US$ 3.6(1) billion
3
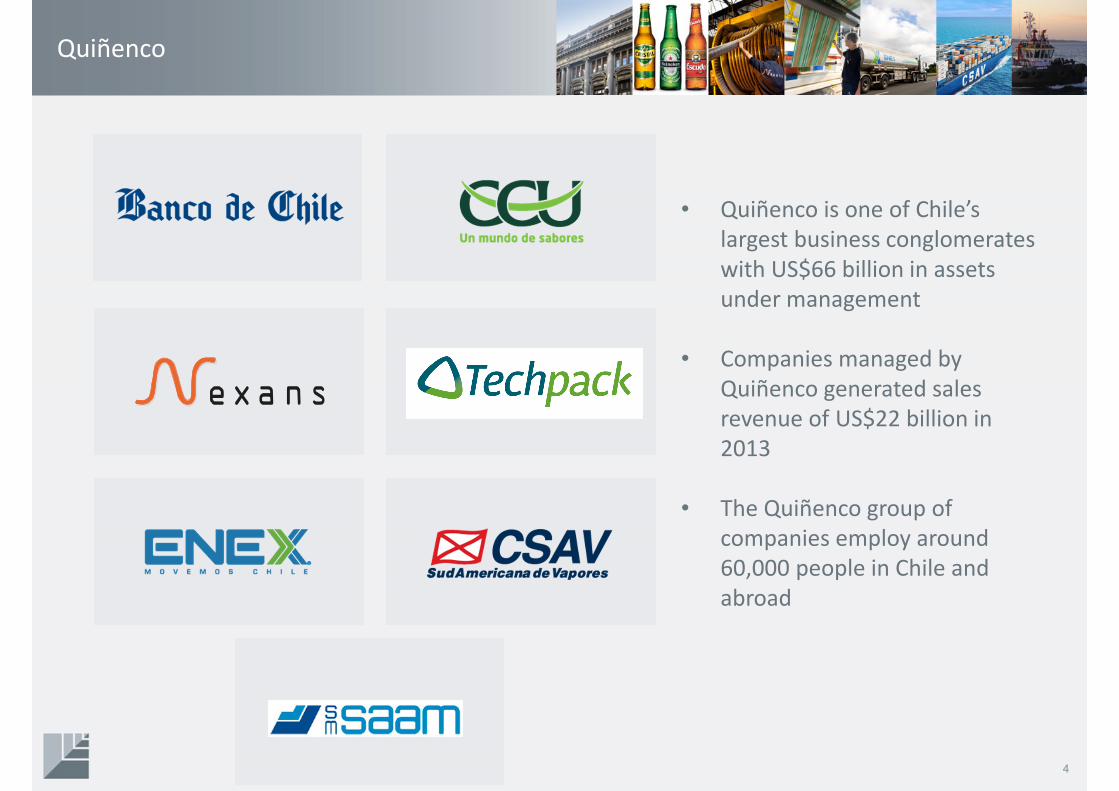
Quiñenco
• Quiñenco is one of Chile’s
largest business conglomerates
with US$66 billion in assets
under management
• Companies managed by
Quiñenco generated sales
revenue of US$22 billion in
2013
• The Quiñenco group of
companies employ around
60,000 people in Chile and
abroad
4
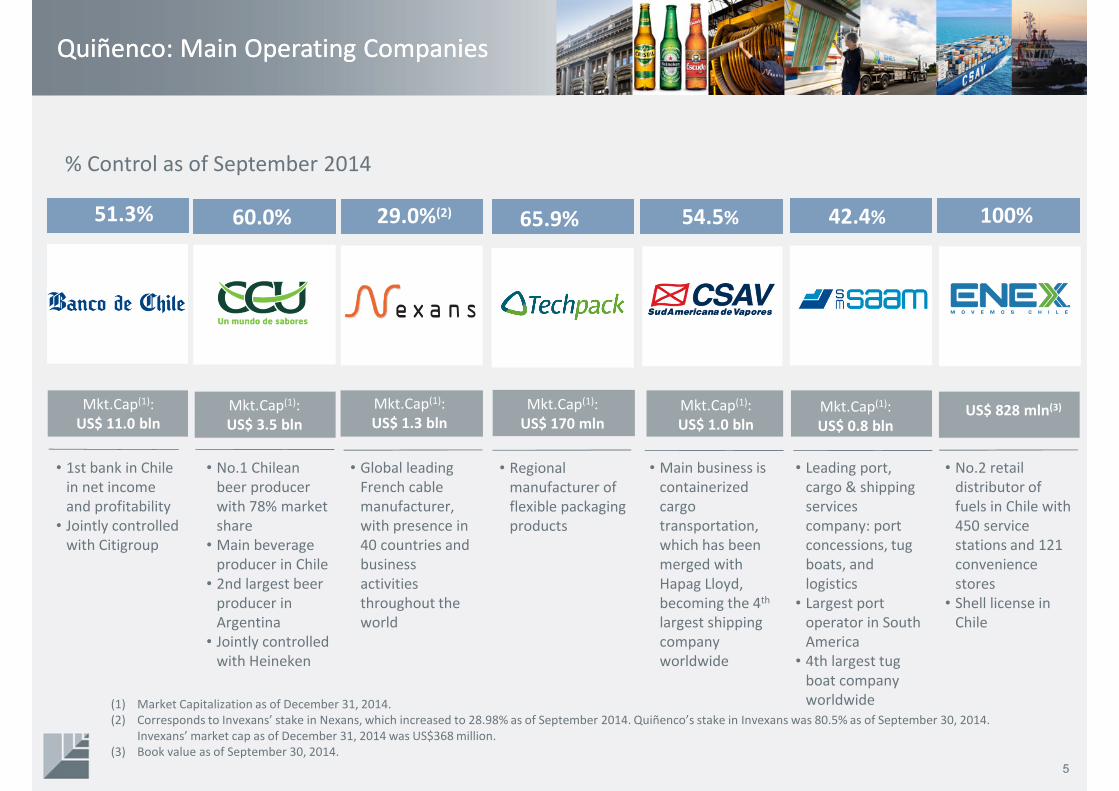
Quiñenco: Main Operating Companies
5
Quiñenco: Main Operating Companies
(1) Market Capitalization as of December 31, 2014.
(2) Corresponds to Invexans’ stake in Nexans, which increased to 28.98% as of September 2014. Quiñenco’s stake in Invexans was 80.5% as of September 30, 2014.
Invexans’ market cap as of December 31, 2014 was US$368 million.
(3) Book value as of September 30, 2014.
51.3%
5
% Control as of September 2014
• 1st bank in Chile
in net income
and profitability
• Jointly controlled
with Citigroup
• No.1 Chilean
beer producer
with 78% market
share
• Main beverage
producer in Chile
• 2nd largest beer
producer in
Argentina
• Jointly controlled
with Heineken
• Global leading
French cable
manufacturer,
with presence in
40 countries and
business
activities
throughout the
world
• Main business is
containerized
cargo
transportation,
which has been
merged with
Hapag Lloyd,
becoming the 4th
largest shipping
company
worldwide
• Leading port,
cargo & shipping
services
company: port
concessions, tug
boats, and
logistics
• Largest port
operator in South
America
• 4th largest tug
boat company
worldwide
• No.2 retail
distributor of
fuels in Chile with
450 service
stations and 121
convenience
stores
• Shell license in
Chile
Mkt.Cap(1):
US$ 11.0 blnMkt.Cap(1):
US$ 3.5 bln
Mkt.Cap(1):
US$ 1.3 blnMkt.Cap(1):
US$ 1.0 blnMkt.Cap(1):
US$ 0.8 blnUS$ 828 mln(3)
60.0% 29.0%(2) 65.9% 54.5% 42.4% 100%
Mkt.Cap(1):
US$ 170 mln
• Regional
manufacturer of
flexible packaging
products
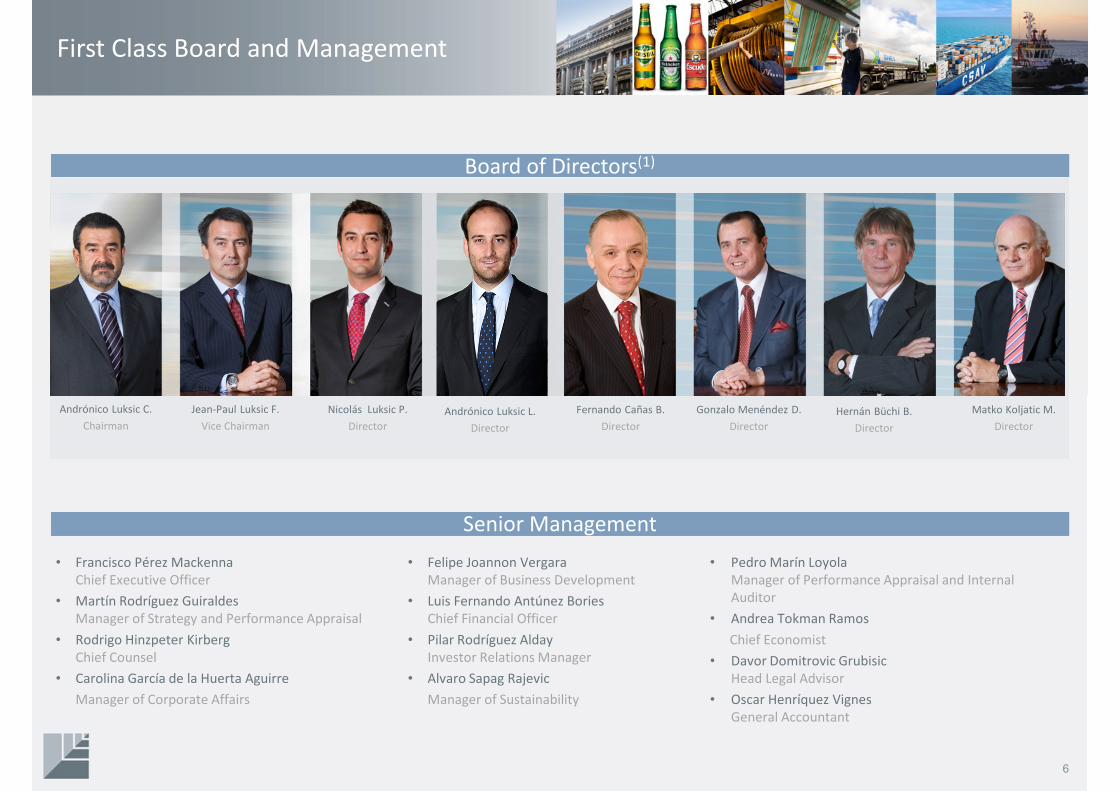
First Class Board and Management
• Francisco Pérez Mackenna
Chief Executive Officer
• Martín Rodríguez Guiraldes
Manager of Strategy and Performance Appraisal
• Rodrigo Hinzpeter Kirberg
Chief Counsel
• Carolina García de la Huerta Aguirre
Manager of Corporate Affairs
• Felipe Joannon Vergara
Manager of Business Development
• Luis Fernando Antúnez Bories
Chief Financial Officer
• Pilar Rodríguez Alday
Investor Relations Manager
• Alvaro Sapag Rajevic
Manager of Sustainability
• Pedro Marín Loyola
Manager of Performance Appraisal and Internal
Auditor
• Andrea Tokman Ramos
Chief Economist
• Davor Domitrovic Grubisic
Head Legal Advisor
• Oscar Henríquez Vignes
General Accountant
Andrónico Luksic C.
Chairman
Jean-Paul Luksic F.
Vice Chairman
Gonzalo Menéndez D.
Director
Hernán Büchi B.
Director
Matko Koljatic M.
Director
Fernando Cañas B.
Director
Board of Directors(1)
Senior Management
6
Nicolás Luksic P.
Director
Andrónico Luksic L.
Director
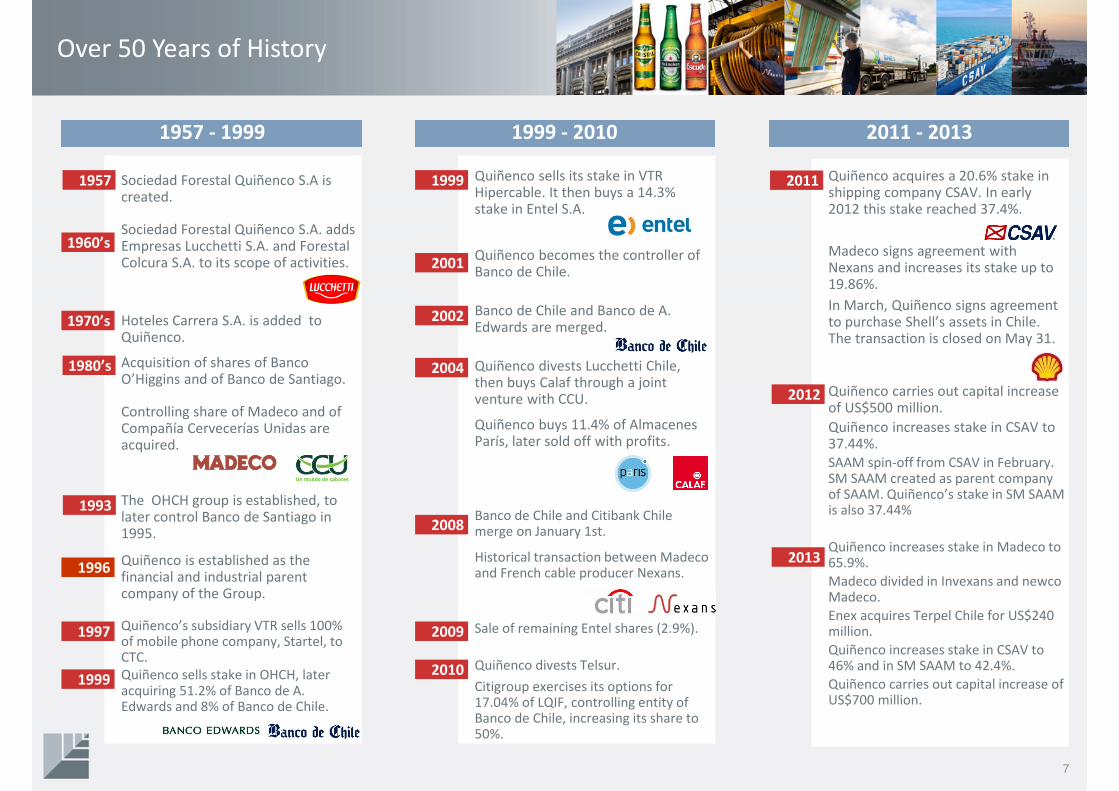
Over 50 Years of History
Sociedad Forestal Quiñenco S.A is created.
Sociedad Forestal Quiñenco S.A. adds Empresas Lucchetti S.A. and ForestalColcura S.A. to its scope of activities.
Hoteles Carrera S.A. is added to Quiñenco.
Acquisition of shares of BancoO’Higgins and of Banco de Santiago.
Controlling share of Madeco and of Compañía Cervecerías Unidas are acquired.
The OHCH group is established, to later control Banco de Santiago in 1995.
Quiñenco is established as the financial and industrial parent company of the Group.
Quiñenco’s subsidiary VTR sells 100% of mobile phone company, Startel, to CTC.
Quiñenco sells stake in OHCH, later acquiring 51.2% of Banco de A. Edwards and 8% of Banco de Chile.
Quiñenco sells its stake in VTR Hipercable. It then buys a 14.3% stake in Entel S.A.
Quiñenco becomes the controller of Banco de Chile.
Banco de Chile and Banco de A. Edwards are merged.
Quiñenco divests Lucchetti Chile, then buys Calaf through a joint venture with CCU.
Quiñenco buys 11.4% of AlmacenesParís, later sold off with profits.
Banco de Chile and Citibank Chile merge on January 1st.
Historical transaction between Madecoand French cable producer Nexans.
Sale of remaining Entel shares (2.9%).
Quiñenco divests Telsur.
Citigroup exercises its options for 17.04% of LQIF, controlling entity of Banco de Chile, increasing its share to 50%.
1957
1960’s
1970’s
1980’s
1993
1996
1997
1999
2001
2002
2004
2008
2009
2010
2011
1957 - 1999 1999 - 2010 2011 - 2013
7
Quiñenco acquires a 20.6% stake in shipping company CSAV. In early 2012 this stake reached 37.4%.
Madeco signs agreement with Nexans and increases its stake up to 19.86%.
In March, Quiñenco signs agreement to purchase Shell’s assets in Chile. The transaction is closed on May 31.
Quiñenco carries out capital increase of US$500 million.
Quiñenco increases stake in CSAV to 37.44%.
SAAM spin-off from CSAV in February. SM SAAM created as parent company of SAAM. Quiñenco’s stake in SM SAAM is also 37.44%
Quiñenco increases stake in Madeco to 65.9%.
Madeco divided in Invexans and newcoMadeco.
Enex acquires Terpel Chile for US$240 million.
Quiñenco increases stake in CSAV to 46% and in SM SAAM to 42.4%.
Quiñenco carries out capital increase of US$700 million.
2012
2013
1999
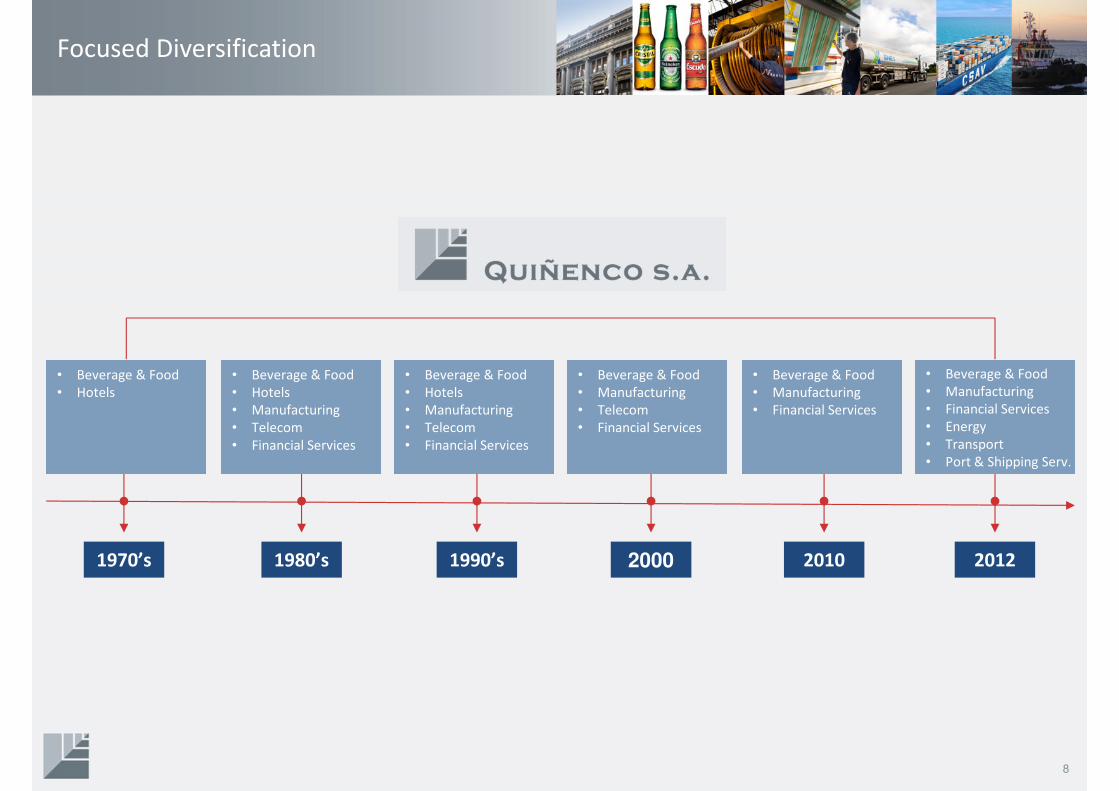
Focused Diversification
1970’s 1980’s 1990’s 2000 2010 2012
• Beverage & Food
• Hotels
• Beverage & Food
• Hotels
• Manufacturing
• Telecom
• Financial Services
• Beverage & Food
• Hotels
• Manufacturing
• Telecom
• Financial Services
• Beverage & Food
• Manufacturing
• Telecom
• Financial Services
• Beverage & Food
• Manufacturing
• Financial Services
• Beverage & Food
• Manufacturing
• Financial Services
• Energy
• Transport
• Port & Shipping Serv.
8
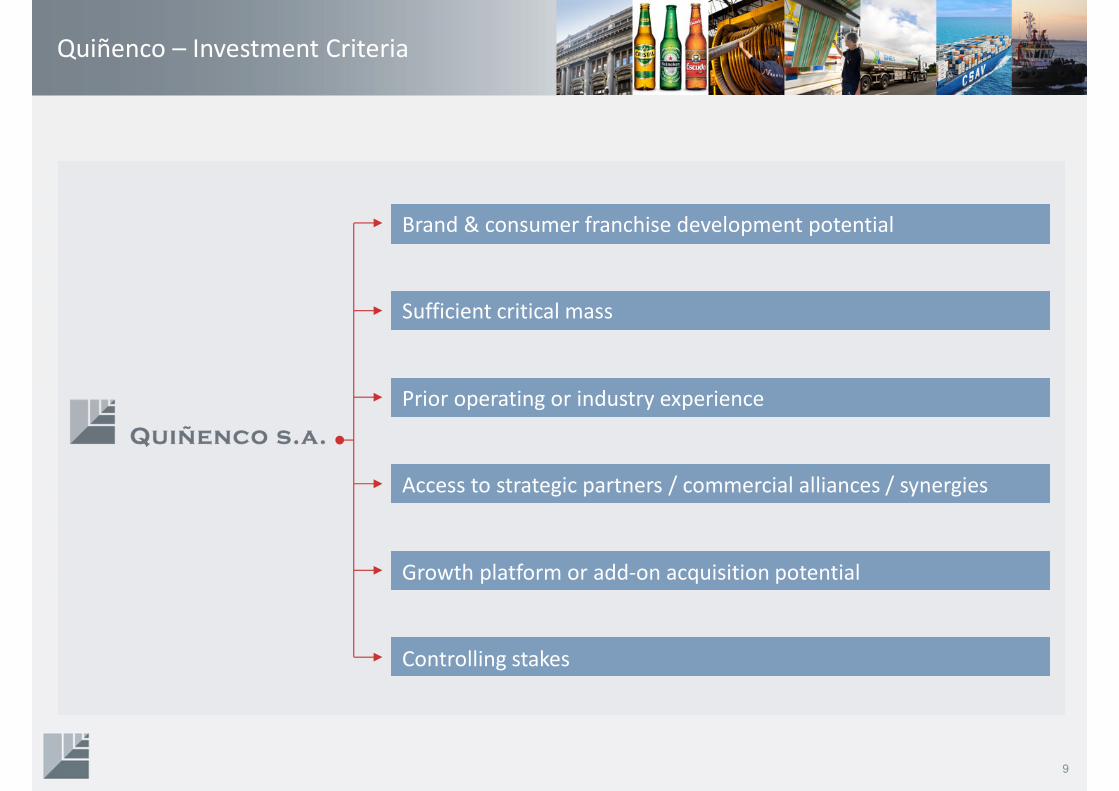
Quiñenco – Investment Criteria
Brand & consumer franchise development potential
Sufficient critical mass
Prior operating or industry experience
Access to strategic partners / commercial alliances / synergies
Growth platform or add-on acquisition potential
Controlling stakes
9
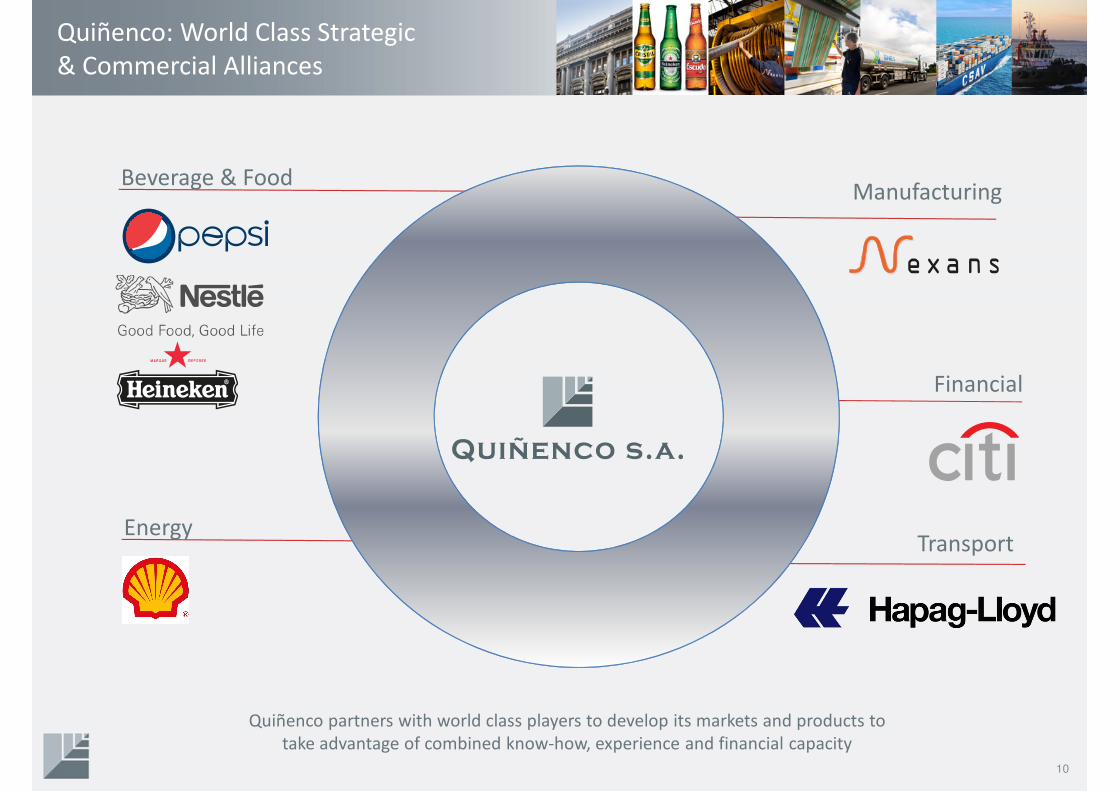
Quiñenco: World Class Strategic
& Commercial Alliances
Quiñenco partners with world class players to develop its markets and products to
take advantage of combined know-how, experience and financial capacity
Financial
ManufacturingBeverage & Food
10
EnergyTransport
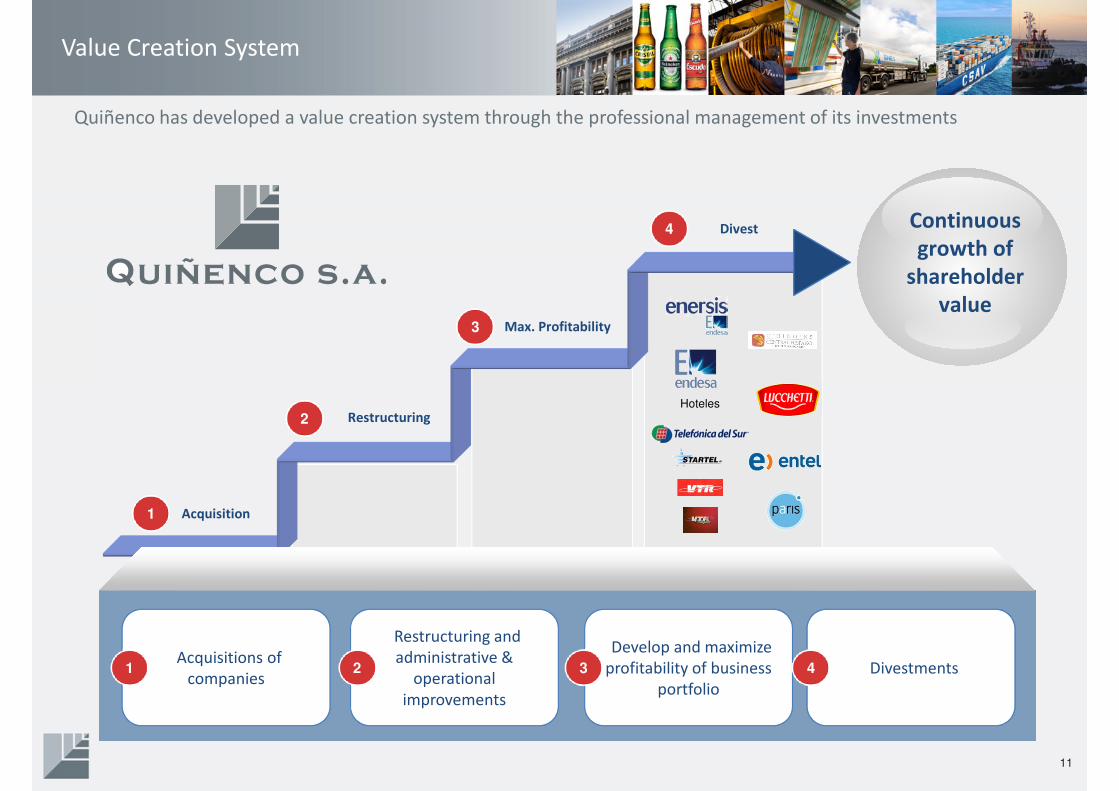
Value Creation System
Quiñenco has developed a value creation system through the professional management of its investments
Divest
Max. Profitability
Restructuring
Acquisition1
2
3
4 Continuous
growth of
shareholder
value
Hoteles
•Acquisitions of
companies
•Restructuring and
administrative &
operational
improvements
•Develop and maximize
profitability of business
portfolio
•Divestments1 2 3 4
11
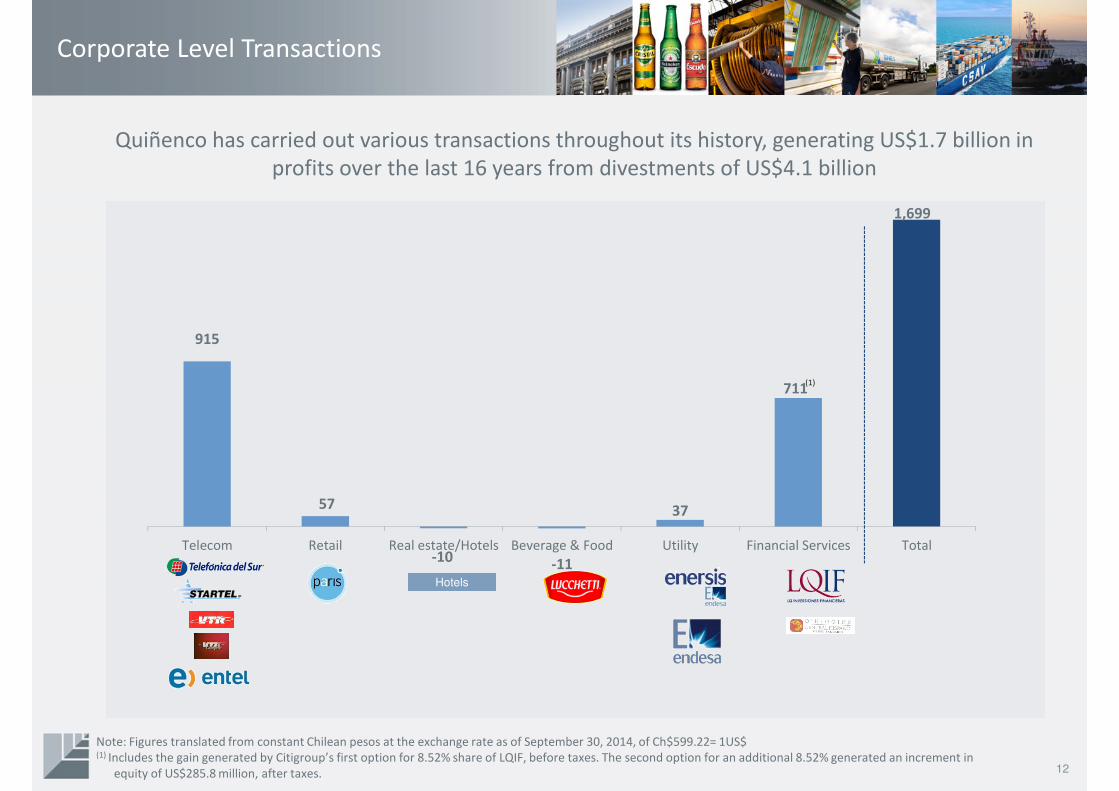
Corporate Level Transactions
Quiñenco has carried out various transactions throughout its history, generating US$1.7 billion in
profits over the last 16 years from divestments of US$4.1 billion
12
Note: Figures translated from constant Chilean pesos at the exchange rate as of September 30, 2014, of Ch$599.22= 1US$(1) Includes the gain generated by Citigroup’s first option for 8.52% share of LQIF, before taxes. The second option for an additional 8.52% generated an increment in
equity of US$285.8 million, after taxes.
Hotels
915
57
-10 -11
37
711
1,699
Telecom Retail Real estate/Hotels Beverage & Food Utility Financial Services Total
(1)
671
1,450
1,989 2,028
2,7213,071
2,142
3,275
5,789
5,137
6,8586,541
5,597
2002 2003 2004 2005 2006 2007 2008 2009 2010 2011 2012 2013 sep-14
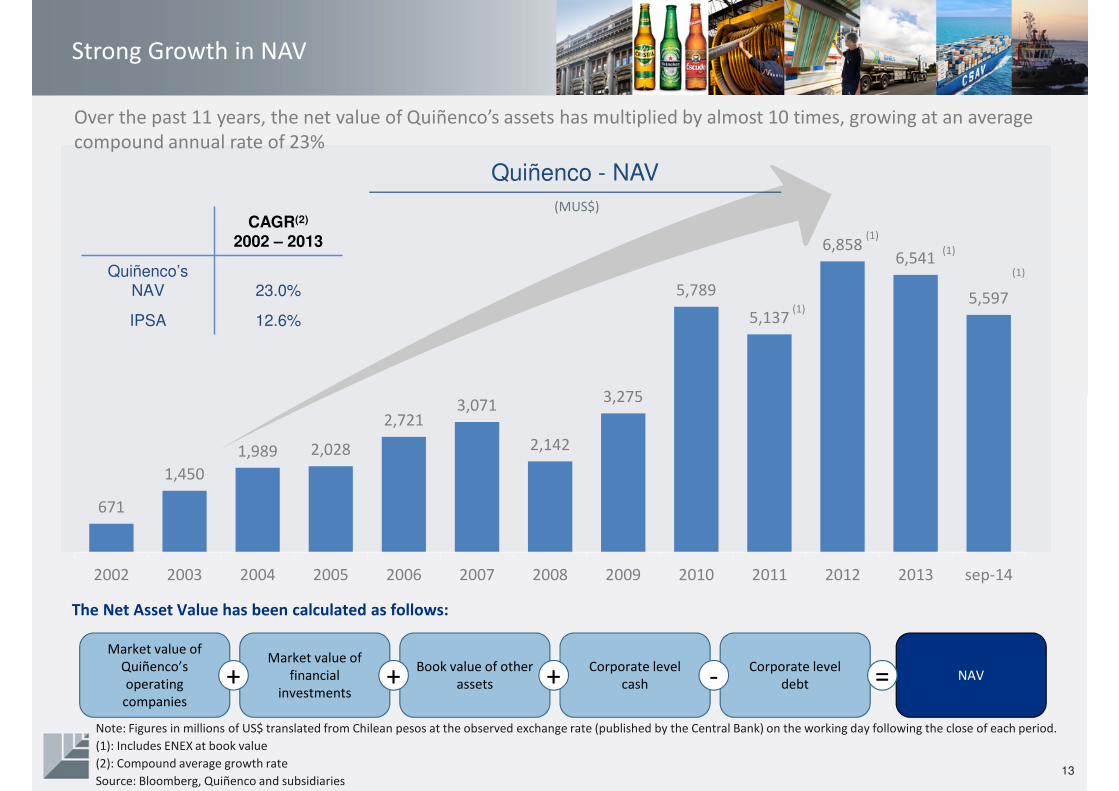
Strong Growth in NAV
Over the past 11 years, the net value of Quiñenco’s assets has multiplied by almost 10 times, growing at an average
compound annual rate of 23%
Note: Figures in millions of US$ translated from Chilean pesos at the observed exchange rate (published by the Central Bank) on the working day following the close of each period.
(1): Includes ENEX at book value
(2): Compound average growth rate
Source: Bloomberg, Quiñenco and subsidiaries
Market value of
Quiñenco’s
operating
companies
Market value of
financial
investments
Book value of other
assets
Corporate level
cash
Corporate level
debtNAV+ + + - =
The Net Asset Value has been calculated as follows:
CAGR(2)
2002 – 2013
Quiñenco’sNAV 23.0%
IPSA 12.6%
Quiñenco - NAV
(MUS$)
13
(1)
(1)
(1)
(1)
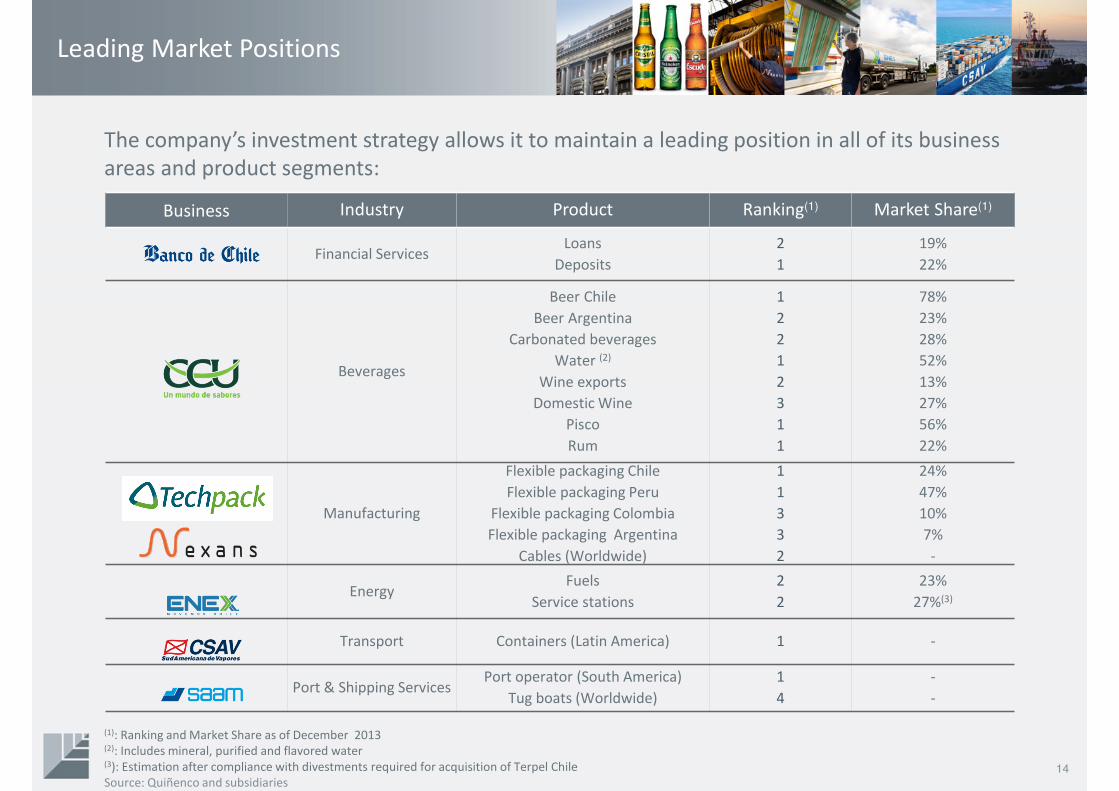
Leading Market Positions
The company’s investment strategy allows it to maintain a leading position in all of its business
areas and product segments:
(1): Ranking and Market Share as of December 2013 (2): Includes mineral, purified and flavored water(3): Estimation after compliance with divestments required for acquisition of Terpel Chile
Source: Quiñenco and subsidiaries
Business Industry Product Ranking(1) Market Share(1)
Financial ServicesLoans
Deposits
2
1
19%
22%
Beverages
Beer Chile
Beer Argentina
Carbonated beverages
Water (2)
Wine exports
Domestic Wine
Pisco
Rum
1
2
2
1
2
3
1
1
78%
23%
28%
52%
13%
27%
56%
22%
Manufacturing
Flexible packaging Chile
Flexible packaging Peru
Flexible packaging Colombia
Flexible packaging Argentina
Cables (Worldwide)
1
1
3
3
2
24%
47%
10%
7%
-
EnergyFuels
Service stations
2
2
23%
27%(3)
Transport Containers (Latin America) 1 -
Port & Shipping ServicesPort operator (South America)
Tug boats (Worldwide)
1
4
-
-
14
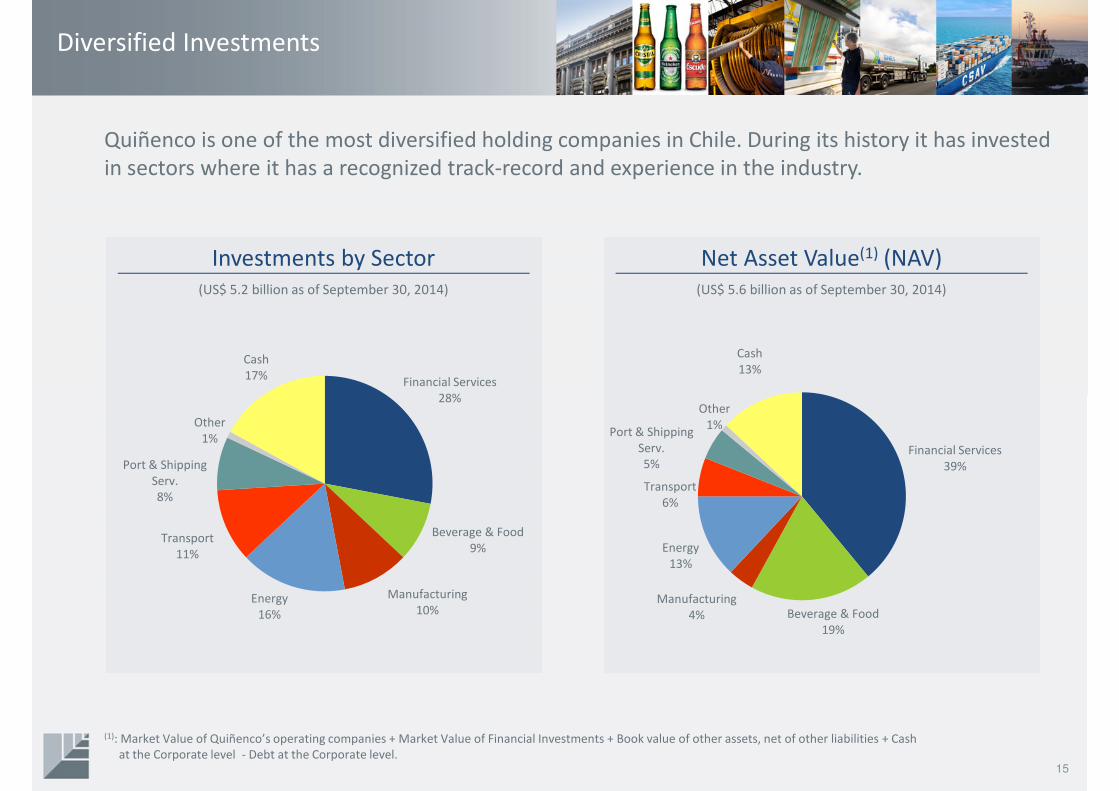
Diversified Investments
Quiñenco is one of the most diversified holding companies in Chile. During its history it has invested
in sectors where it has a recognized track-record and experience in the industry.
(1): Market Value of Quiñenco’s operating companies + Market Value of Financial Investments + Book value of other assets, net of other liabilities + Cash
at the Corporate level - Debt at the Corporate level.
Investments by Sector Net Asset Value(1) (NAV)
15
Financial Services
28%
Beverage & Food
9%
Manufacturing
10%Energy
16%
Transport
11%
Port & Shipping
Serv.
8%
Other
1%
Cash
17%
(US$ 5.2 billion as of September 30, 2014) (US$ 5.6 billion as of September 30, 2014)
Financial Services
39%
Beverage & Food
19%
Manufacturing
4%
Energy
13%
Transport
6%
Port & Shipping
Serv.
5%
Other
1%
Cash
13%
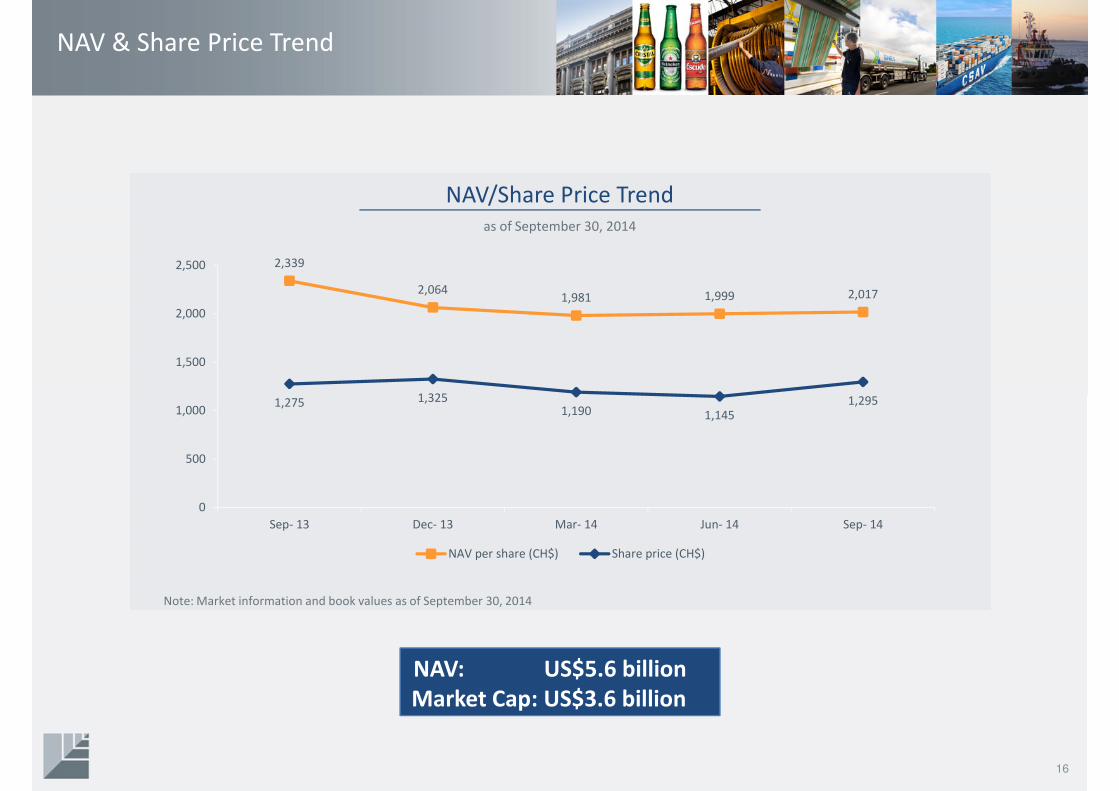
NAV & Share Price Trend
NAV/Share Price Trendas of September 30, 2014
Note: Market information and book values as of September 30, 2014
16
2,339
2,0641,981 1,999 2,017
1,275 1,3251,190 1,145
1,295
0
500
1,000
1,500
2,000
2,500
Sep- 13 Dec- 13 Mar- 14 Jun- 14 Sep- 14
NAV per share (CH$) Share price (CH$)
NAV: US$5.6 billion
Market Cap: US$3.6 billion
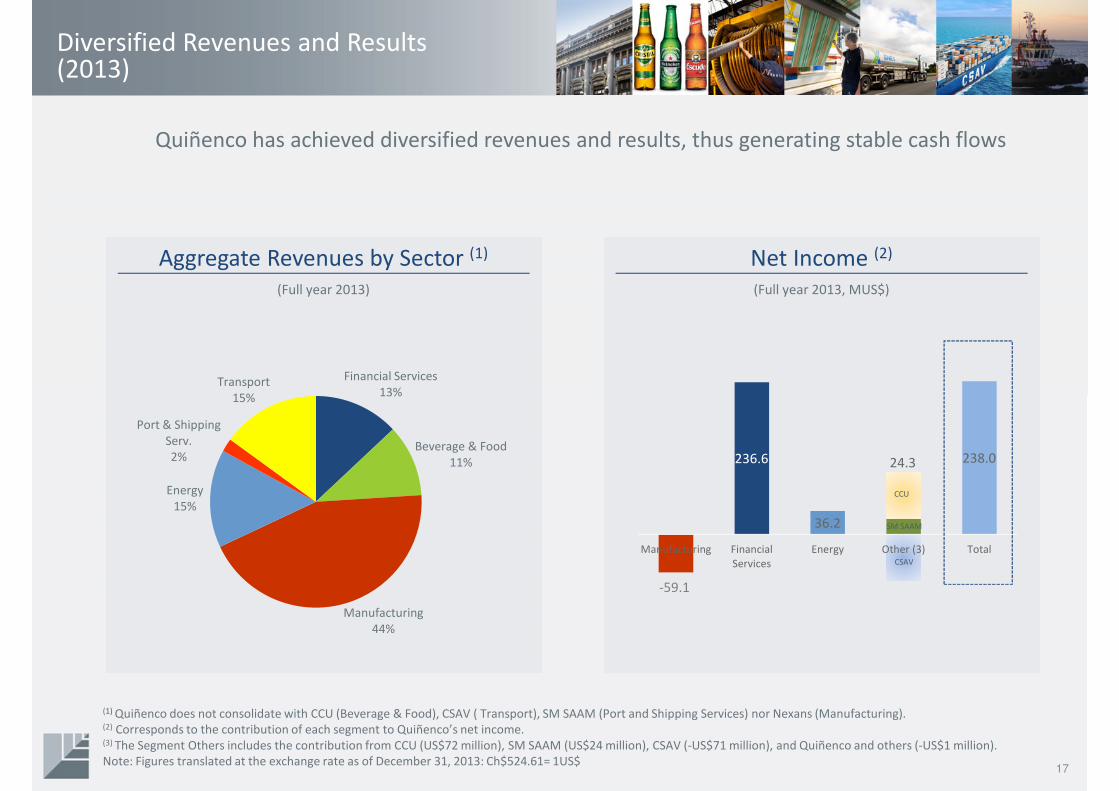
Diversified Revenues and Results(2013)
Quiñenco has achieved diversified revenues and results, thus generating stable cash flows
(1) Quiñenco does not consolidate with CCU (Beverage & Food), CSAV ( Transport), SM SAAM (Port and Shipping Services) nor Nexans (Manufacturing).(2) Corresponds to the contribution of each segment to Quiñenco’s net income. (3) The Segment Others includes the contribution from CCU (US$72 million), SM SAAM (US$24 million), CSAV (-US$71 million), and Quiñenco and others (-US$1 million).
Note: Figures translated at the exchange rate as of December 31, 2013: Ch$524.61= 1US$
Aggregate Revenues by Sector (1) Net Income (2)
(Full year 2013) (Full year 2013, MUS$)
Financial Services
13%
Beverage & Food
11%
Manufacturing
44%
Energy
15%
Port & Shipping
Serv.
2%
Transport
15%
17
-59.1
236.6
36.2
238.0
Manufacturing Financial
Services
Energy Other (3) Total
CCU
SM SAAM
CSAV
24.3
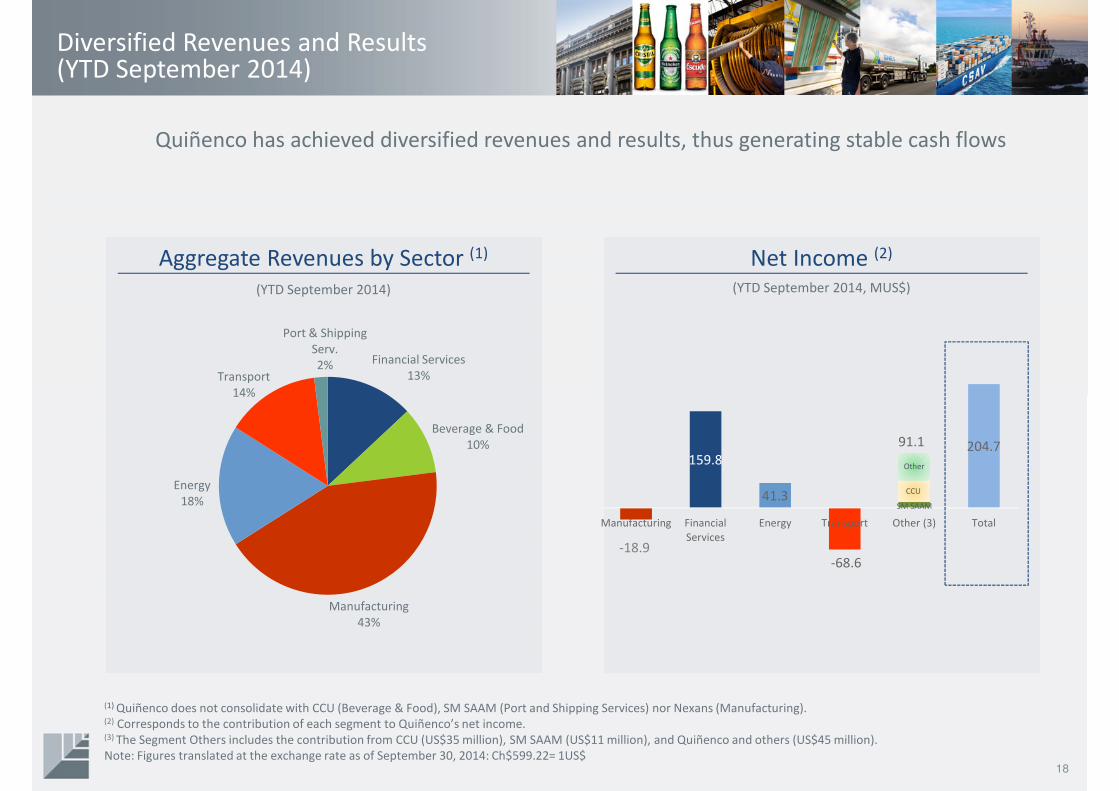
Diversified Revenues and Results(YTD September 2014)
Quiñenco has achieved diversified revenues and results, thus generating stable cash flows
Aggregate Revenues by Sector (1) Net Income (2)
(YTD September 2014) (YTD September 2014, MUS$)
18
Financial Services
13%
Beverage & Food
10%
Manufacturing
43%
Energy
18%
Transport
14%
Port & Shipping
Serv.
2%
(1) Quiñenco does not consolidate with CCU (Beverage & Food), SM SAAM (Port and Shipping Services) nor Nexans (Manufacturing).(2) Corresponds to the contribution of each segment to Quiñenco’s net income. (3) The Segment Others includes the contribution from CCU (US$35 million), SM SAAM (US$11 million), and Quiñenco and others (US$45 million).
Note: Figures translated at the exchange rate as of September 30, 2014: Ch$599.22= 1US$
-18.9
159.8
41.3
-68.6
204.7
Manufacturing Financial
Services
Energy Transport Other (3) Total
91.1
CCU
SM SAAM
Other
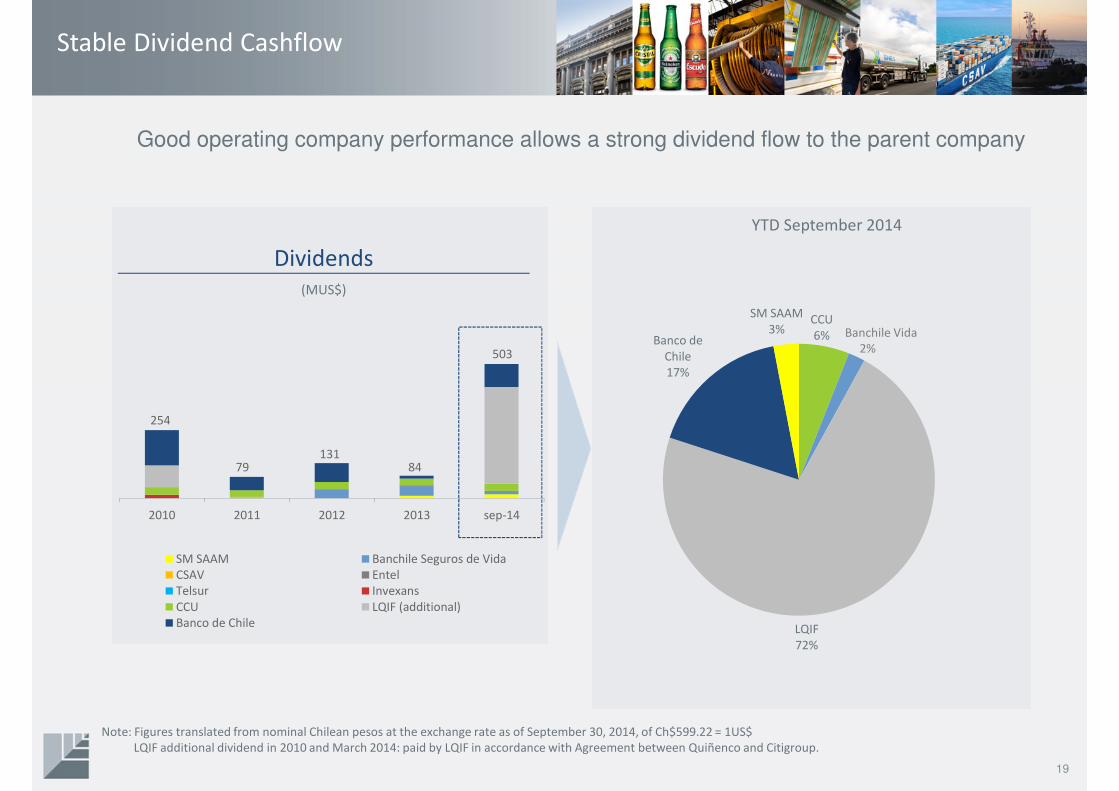
Stable Dividend Cashflow
Good operating company performance allows a strong dividend flow to the parent company
Dividends Composition of Dividends
(MUS$) (YTD March 2012)
19
2010 2011 2012 2013 sep-14
SM SAAM Banchile Seguros de Vida
CSAV Entel
Telsur Invexans
CCU LQIF (additional)
Banco de Chile
CCU
6%
LQIF
72%
Banco de
Chile
17%
SM SAAM
3%
Note: Figures translated from nominal Chilean pesos at the exchange rate as of September 30, 2014, of Ch$599.22 = 1US$
LQIF additional dividend in 2010 and March 2014: paid by LQIF in accordance with Agreement between Quiñenco and Citigroup.
YTD September 2014
Banchile Vida
2%
254
79131
84
503
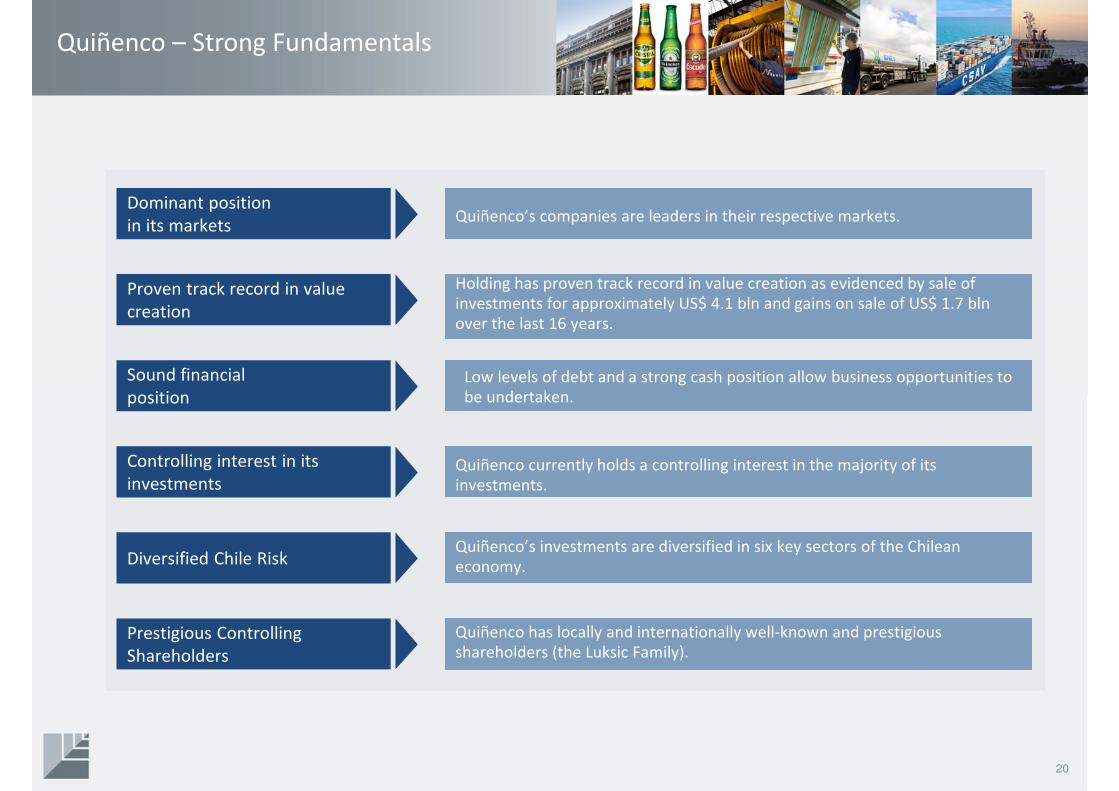
Quiñenco – Strong Fundamentals
Dominant position
in its markets
Proven track record in value
creation
Sound financial
position
Controlling interest in its
investments
Diversified Chile Risk
Prestigious Controlling
Shareholders
Quiñenco’s companies are leaders in their respective markets.
Holding has proven track record in value creation as evidenced by sale of investments for approximately US$ 4.1 bln and gains on sale of US$ 1.7 blnover the last 16 years.
Low levels of debt and a strong cash position allow business opportunities to be undertaken.
Quiñenco currently holds a controlling interest in the majority of its investments.
Quiñenco’s investments are diversified in six key sectors of the Chilean economy.
Quiñenco has locally and internationally well-known and prestigious shareholders (the Luksic Family).
20
Recent EventsQuiñenco
Overview
Financial Overview
Main Operating Companies
Conclusions
21
Quiñenco raises funds through debt and equity, increases number of Board members, and announces Tender Offer for Invexans
Bond Issuance
• In July 2013 and July 2014 Quiñenco successfully placed
UF 4,000,000 (approx. US$180 million) and UF 2,375,000
(approx. US$100 million) respectively, in bonds in the
local market.
Capital Increase
• In November 2013 Quiñenco successfully concluded its
capital increase, raising Ch$350 billion (approximately
US$700 million) through the issuance of around 318
million shares at a price of Ch$1,100. During the Rights
Offering period 99.98% of the total shares were
subscribed.
Board of Directors
• In April 2014, the Extraordinary Shareholders’ Meeting
approved increasing the number of Directors from 7 to 8
members, incorporating Andrónico Luksic Lederer.
22
Tender Offer for Invexans
• On December 4, Quiñenco announced that the Board
of Directors approved a Tender Offer for 19.55% of
Invexans which is not held by Quiñenco, at a price of
Ch$10 per share. The offer started on December 15,
2014, and lasts 30 days.
Recent Events Operating Companies
23
Company Recent Events NAV (% of Total)
• Leadership in net income and profitability in the Chilean financial system.
• High levels of efficiency with cost-income ratio of 41%.
• Diversification of its financing structure through the issuance of approximately US$785 million in in Switzerland, US$168 million in Hong Kong, US$167 million in Japan, and US$400 million in commercial papers in the USA in 2013, and around US$460 million in bonds in Switzerland, Japan, and Hong Kong during 2014.
• In January 2014 LQIF carried out a secondary offering, equivalent to a 7.2% stake in the Bank, receiving approx. US$ 818 million. Thus the Bank’s free float increased from 17.6% to 24.8%. LQIF’s stake in the Bank decreased to 51%.
• Quiñenco received an extraordinary dividend of US$390 million corresponding to this transaction, and reported an increment in equity of US$156 million.
39%
Recent Events Operating Companies
24
Company Recent Events NAV (% of Total)
• On May 7, 2014, CCU announced its incursion in Bolivia, through the acquisition of a 35% stake of Bebidas Bolivianas (BBO). CCU could push this up to 51%. BBO produces and commercializes alcoholic and non alcoholic beverages.
• On June 6, 2014, CCU announced the termination of the import and distribution contract of Corona and Negra Modelo (beer) in Argentina and the production and distribution license for Budweiser in Uruguay, maintained by its subsidiary CUCSA in Argentina with subsidiaries of ABINBEV. CICSA received a compensation of US$34.2 million for the termination.
• On November 10, CCU announced the agreement to establish a partnership with Grupo Postobónto enter the beer market in Colombia. CCU and Postobón are to participate in equal parts in the joint operation, Central Cervecera de Colombia S.A.S., investing approximately US$400 million , following a gradual investment plan subject to the fulfillment of certain milestones. The partnership involves the construction of a beer plant with a total capacity of 3 million hectoliters. Completion is subject to regulatory authorization in Colombia.
19%
• During the first nine months of 2014, Enex’s operating income grew 69% respect to the same period in 2013, reflecting 33% growth in sales boosted by the acquisition of Terpel Chile, as well as improved margins.
• Enex recently received the Network Excellence prize granted annually by Shell, from among the 40 countries where it has licensees of the Shell brand, based on the modernization of its service stations and growth of its network in Chile.
13%
Recent Events Operating Companies
25
Company Recent Events NAV (% of Total)
• On January 22, 2014, CSAV announced a non-binding MOU with the German shipping company HapagLloyd (HL), to merge CSAV’s container business with HL, becoming shareholder in the merged company with a 30% stake. On April 16, 2014, CSAV and HL signed a binding MOU, subject to approval from antitrust authorities in various jurisdictions.
• CSAV announced two capital increases, one for US$200 million to complete the financing of its 7 new vessels, approved by the Shareholders’ Meeting held on March 21, 2014, and a second capital increase of up to US$400 million, subject to execution of the merger.
• CSAV completed successfully the US$200 million capital increase in August 2014. Quiñenco increased its stake in the company to 54.5% , subscribing a total of US$176 million.
• On October 29, 2014, CSAV received two containerships, Copiapó and Cautín, the first 2 of a total 7 to be received.
• On December 2, 2014, CSAV and Hapag-Lloyd announced the completion of the merger and became the 4th largest container liner shipping company in the world. CSAV has an initial shareholding of 30% in the merged company (HL), which will increase to 34% after subscribing 259 million euros in HL’s first capital increase. HL has a fleet of around 200 vessels with a total capacity of 1 million TEU, transported volume of 7.5 million TEUs and combined revenues of around US$12 billion. The financial effects of the transaction are estimated at a gain of US$510 million for CSAV, which translates to an estimated gain of US$278 million for Quiñenco.
• CSAV’s Chairman and CEO were recently elected as members of HL’s Board of Directors.
• CSAV is carrying out a capital increase of US$400 million, issuing 11,680 million shares at Ch$21 per share. The preferred rights offering period started on December 15, 2014, concluding on January 13, 2015. During this period Quiñenco subscribed its share amounting to US$216 million. In accordance with the main use of funds established for this follow-on, on December 19, 2014, CSAV subscribed €259 million in Hapag Lloyd’s €370 million capital increase, thus increasing its stake to 34%.
6%
Recent Events Operating Companies
26
Company Recent Events NAV (% of Total)
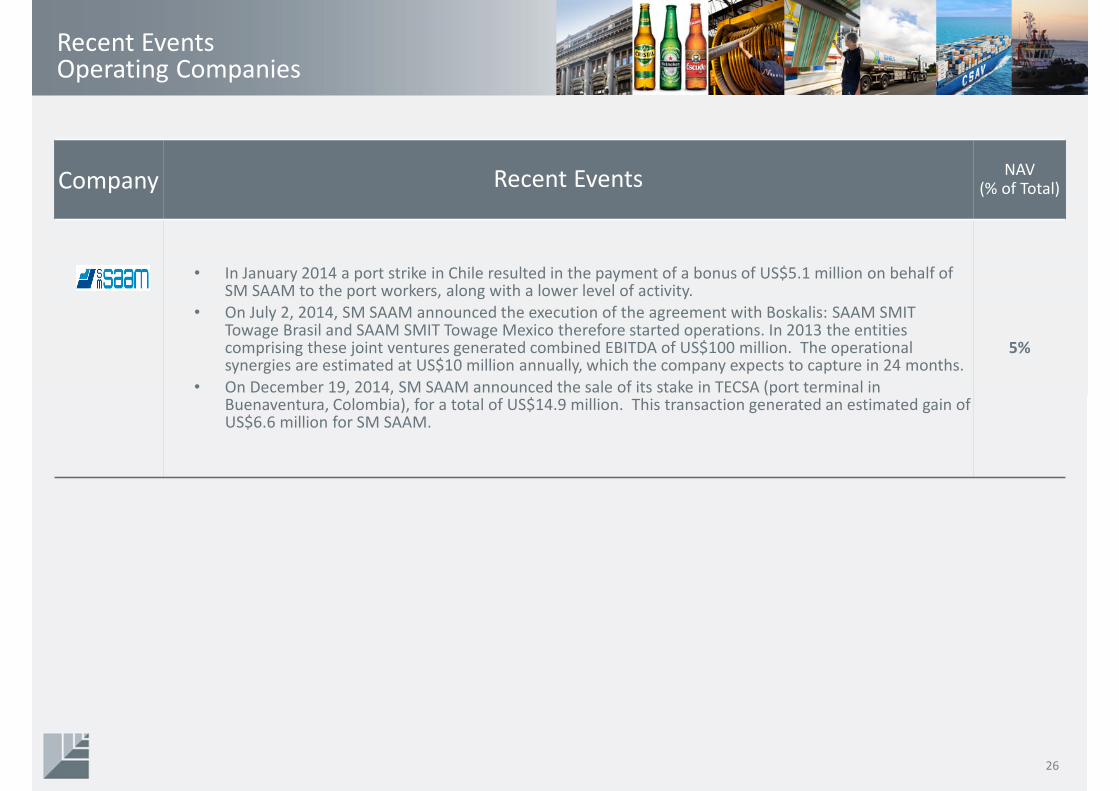
• In January 2014 a port strike in Chile resulted in the payment of a bonus of US$5.1 million on behalf of SM SAAM to the port workers, along with a lower level of activity.
• On July 2, 2014, SM SAAM announced the execution of the agreement with Boskalis: SAAM SMIT Towage Brasil and SAAM SMIT Towage Mexico therefore started operations. In 2013 the entities comprising these joint ventures generated combined EBITDA of US$100 million. The operational synergies are estimated at US$10 million annually, which the company expects to capture in 24 months.
• On December 19, 2014, SM SAAM announced the sale of its stake in TECSA (port terminal in Buenaventura, Colombia), for a total of US$14.9 million. This transaction generated an estimated gain of US$6.6 million for SM SAAM.
5%

Recent Events Operating Companies
27
Company Recent Events NAV (% of Total)
• Invexans increased its stake in Nexans to 28.98%,
• Invexans completed a capital increase of US$270 million , in order to increase its stake in Nexans and reduce the company’s liabilities, including a long term debt of US$30 million. Quiñenco increased its stake in Invexans from 65.9% to 80.5% following the capital increase.
• On May 22, 2014, Invexans and Nexans announced the termination of the agreement signed in 2011, due to the fact that its main objective of establishing Invexans as a relevant shareholder had been achieved. Invexans stated that it does not intend to increase its stake above 30% or reduce its stake partially or completely.
• On March 10 2014, Madeco announced the closure of its profile’s subsidiary Indalum, due to a sustained loss of competitiveness. This follows the closure of the brass mills business unit in 2013, thus focusing its activities on flexible packaging.
• In April 2014, Madeco’s Shareholders’ Meeting approved changing the company’s name to Techpack.
• On June 10, 2014, Techpack announced the acquisition of the Chilean packaging company HYC Packaging, specialized in the manufacture of flexible packages, for US$34.3 million. With this addition Techpack consolidates its position as regional leader in flexible packaging in the region and increases its installed capacity to 80,000 tons a year.
• Towards the end of September Techpack launched a US$150 million capital increase, approved by its shareholders last April, in order to finance the company’s strategic plan focused on flexible packaging, which contemplates investments in companies that Techpack has in Chile, Peru, Argentina and Colombia (including a new plant), and the potential acquisition of new companies in these and other markets in the region, as well as a partial prepayment of liabilities. During the rights offering period Quiñencosubscribed its pro rata share amounting to US$ 98.7 million. In all, Techpack raised US$149 million.
• In October 2014, Techpack sold the brand Madeco to Nexans for US$1 million.
4%
Financial OverviewQuiñenco
Overview
Recent Events Main Operating Companies
Conclusions
28
Sound Results
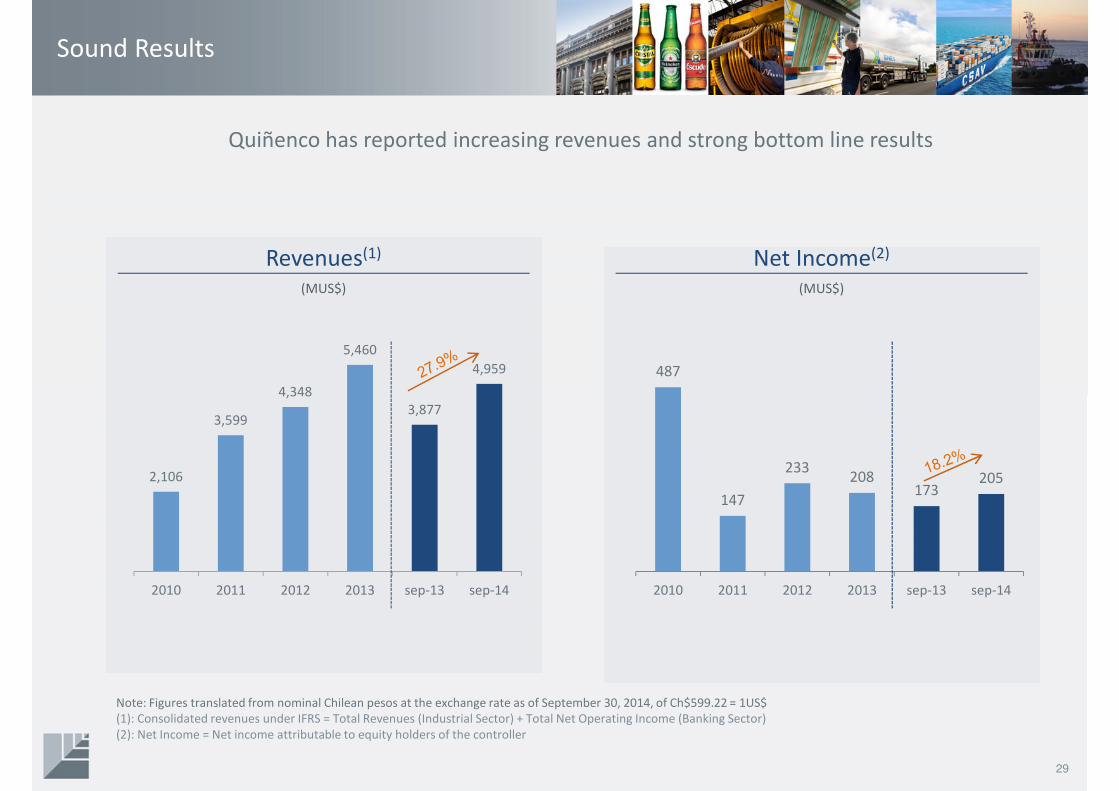
Quiñenco has reported increasing revenues and strong bottom line results
Revenues(1) Net Income(2)
(MUS$) (MUS$)
29
2,106
3,599
4,348
5,460
3,877
4,959
2010 2011 2012 2013 sep-13 sep-14
487
147
233208
173205
2010 2011 2012 2013 sep-13 sep-14
Note: Figures translated from nominal Chilean pesos at the exchange rate as of September 30, 2014, of Ch$599.22 = 1US$
(1): Consolidated revenues under IFRS = Total Revenues (Industrial Sector) + Total Net Operating Income (Banking Sector)
(2): Net Income = Net income attributable to equity holders of the controller
Quiñenco Holding: Conservative Financial Structure
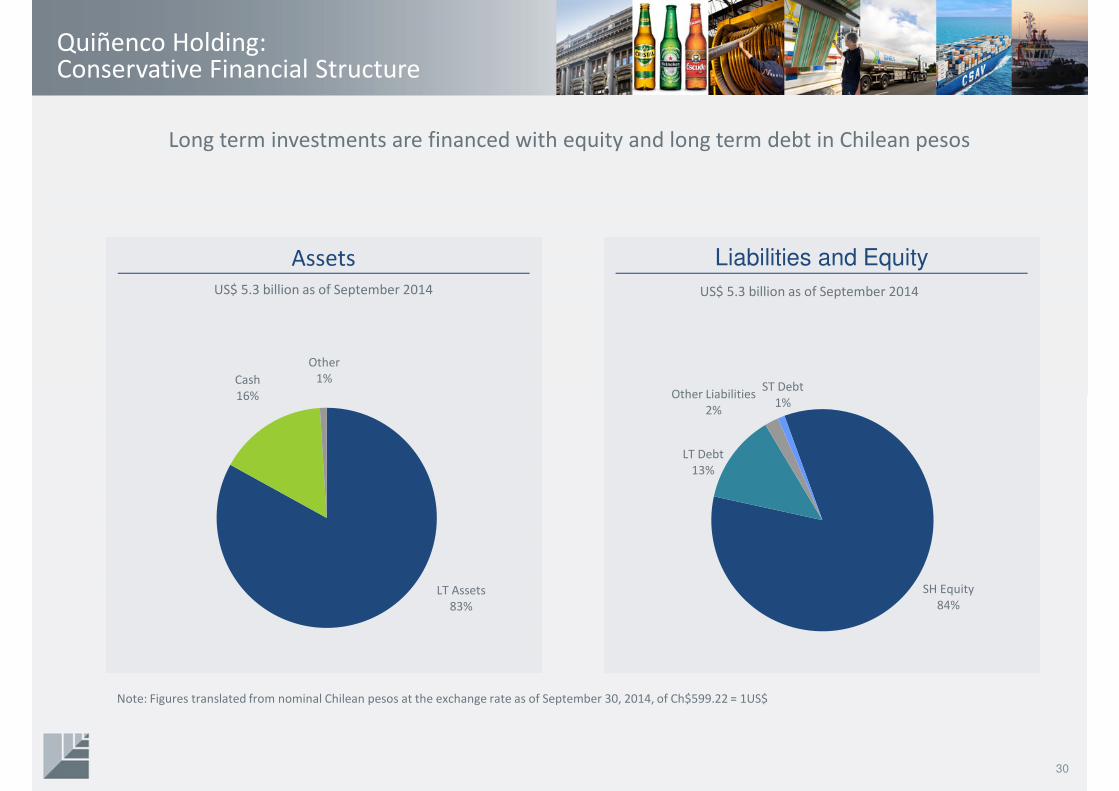
Long term investments are financed with equity and long term debt in Chilean pesos
Assets Liabilities and Equity
30
US$ 5.3 billion as of September 2014 US$ 5.3 billion as of September 2014
LT Assets
83%
Cash
16%
Other
1%
SH Equity
84%
LT Debt
13%
Other Liabilities
2%
ST Debt
1%
Note: Figures translated from nominal Chilean pesos at the exchange rate as of September 30, 2014, of Ch$599.22 = 1US$
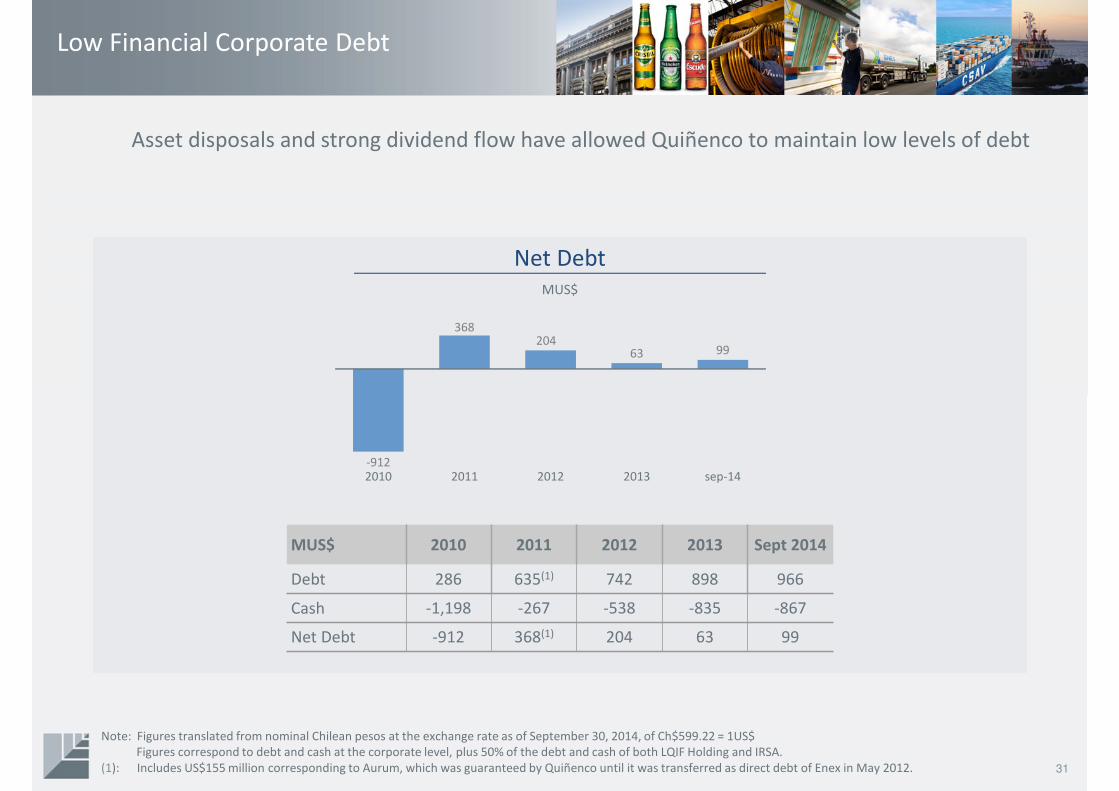
Low Financial Corporate Debt
Asset disposals and strong dividend flow have allowed Quiñenco to maintain low levels of debt
Net DebtMUS$
31
MUS$ 2010 2011 2012 2013 Sept 2014
Debt 286 635(1) 742 898 966
Cash -1,198 -267 -538 -835 -867
Net Debt -912 368(1) 204 63 99
Note: Figures translated from nominal Chilean pesos at the exchange rate as of September 30, 2014, of Ch$599.22 = 1US$
Figures correspond to debt and cash at the corporate level, plus 50% of the debt and cash of both LQIF Holding and IRSA.
(1): Includes US$155 million corresponding to Aurum, which was guaranteed by Quiñenco until it was transferred as direct debt of Enex in May 2012.
-912
368204
63 99
2010 2011 2012 2013 sep-14
Main Operating CompaniesQuiñenco
Overview
Recent Events Financial Overview
Conclusions
32
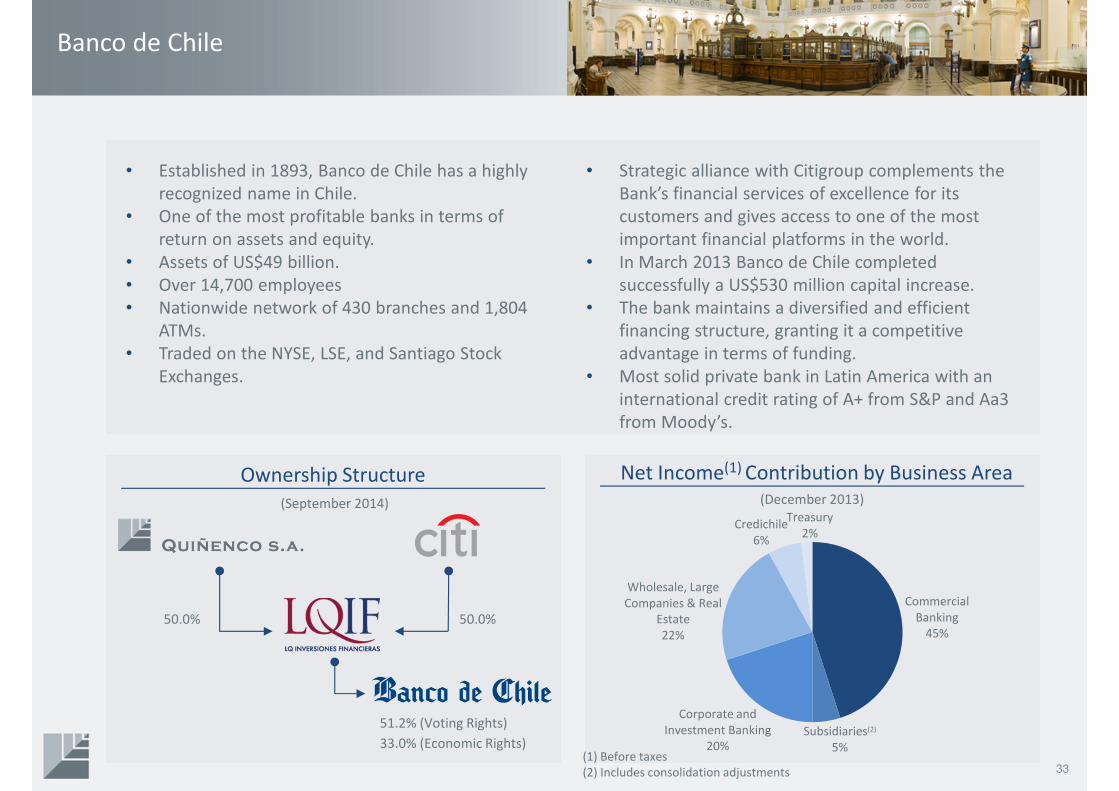
Banco de Chile
Ownership Structure Net Income(1) Contribution by Business Area(December 2013)
• Established in 1893, Banco de Chile has a highly
recognized name in Chile.
• One of the most profitable banks in terms of
return on assets and equity.
• Assets of US$49 billion.
• Over 14,700 employees
• Nationwide network of 430 branches and 1,804
ATMs.
• Traded on the NYSE, LSE, and Santiago Stock
Exchanges.
• Strategic alliance with Citigroup complements the
Bank’s financial services of excellence for its
customers and gives access to one of the most
important financial platforms in the world.
• In March 2013 Banco de Chile completed
successfully a US$530 million capital increase.
• The bank maintains a diversified and efficient
financing structure, granting it a competitive
advantage in terms of funding.
• Most solid private bank in Latin America with an
international credit rating of A+ from S&P and Aa3
from Moody’s.
51.2% (Voting Rights)
33.0% (Economic Rights)
50.0%50.0%
33
Commercial
Banking
45%
Subsidiaries(2)
5%
Corporate and
Investment Banking
20%
Wholesale, Large
Companies & Real
Estate
22%
Credichile
6%
Treasury
2%
(September 2014)
(1) Before taxes
(2) Includes consolidation adjustments
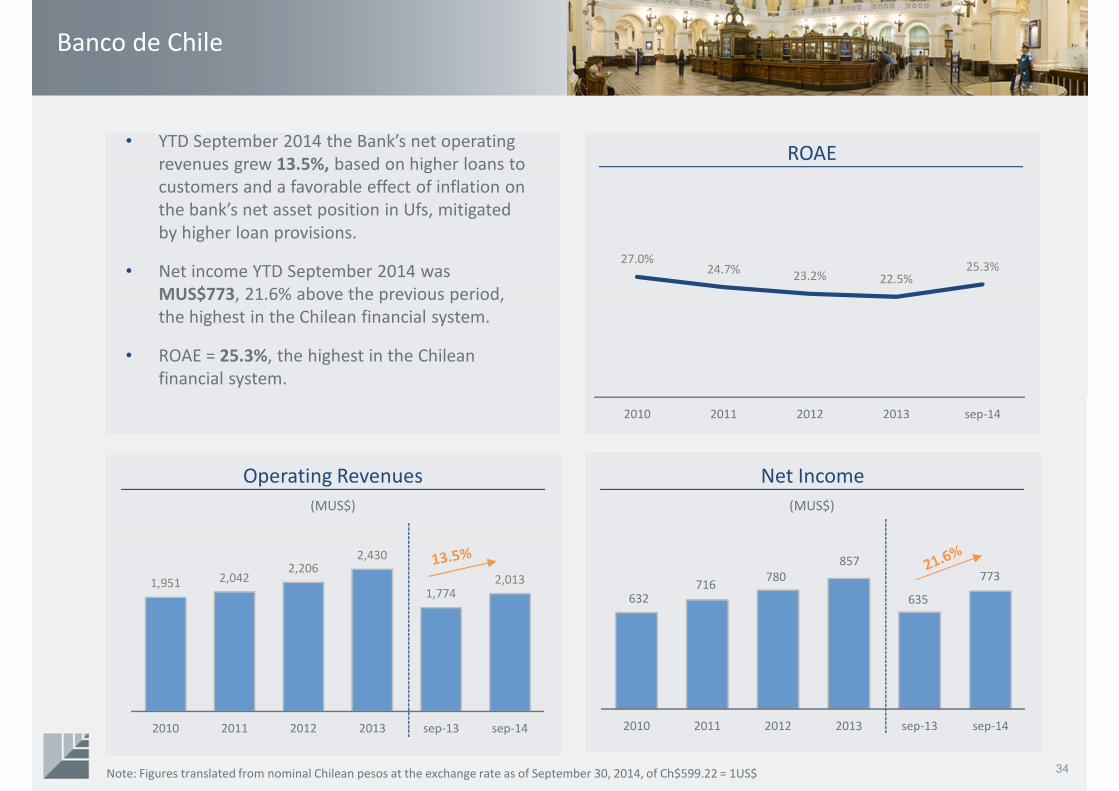
Banco de Chile
Operating Revenues
(MUS$)
Net Income
(MUS$)
ROAE• YTD September 2014 the Bank’s net operating
revenues grew 13.5%, based on higher loans to
customers and a favorable effect of inflation on
the bank’s net asset position in Ufs, mitigated
by higher loan provisions.
• Net income YTD September 2014 was
MUS$773, 21.6% above the previous period,
the highest in the Chilean financial system.
• ROAE = 25.3%, the highest in the Chilean
financial system.
34
27.0%24.7%
23.2% 22.5%25.3%
2010 2011 2012 2013 sep-14
1,951 2,0422,206
2,430
1,7742,013
2010 2011 2012 2013 sep-13 sep-14
632716
780
857
635
773
2010 2011 2012 2013 sep-13 sep-14
Note: Figures translated from nominal Chilean pesos at the exchange rate as of September 30, 2014, of Ch$599.22 = 1US$
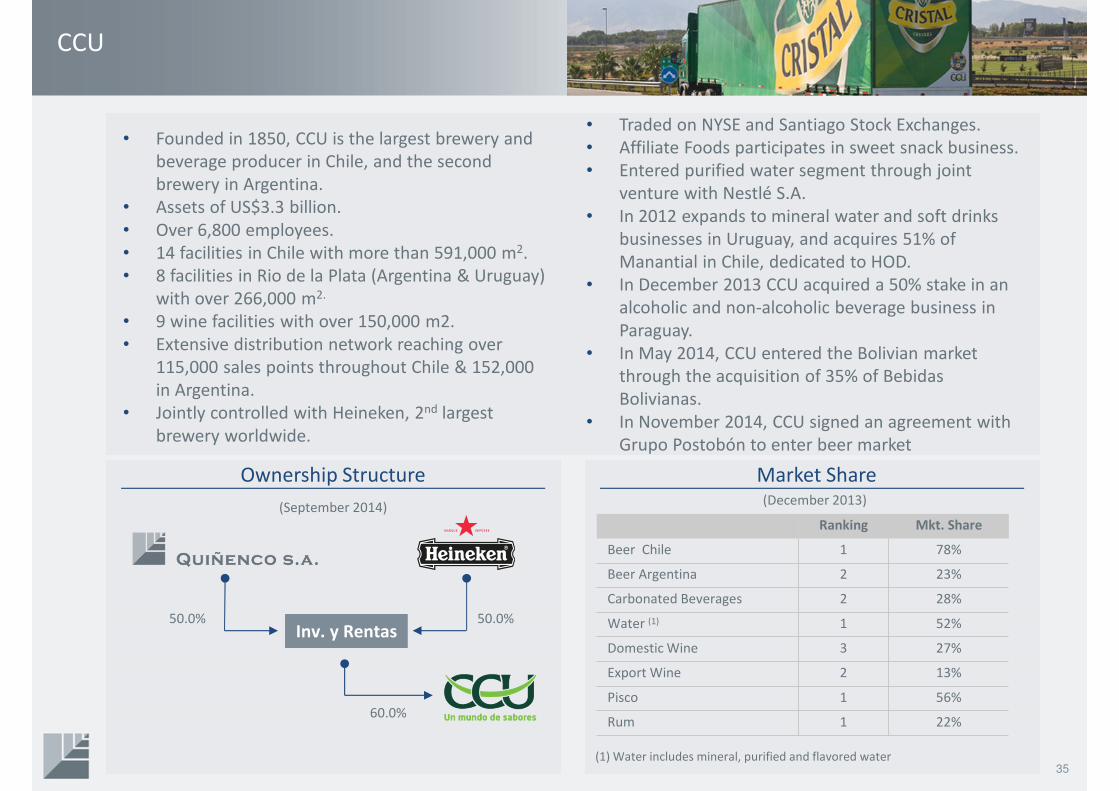
CCU
Ownership Structure Market Share(December 2013)
• Founded in 1850, CCU is the largest brewery and
beverage producer in Chile, and the second
brewery in Argentina.
• Assets of US$3.3 billion.
• Over 6,800 employees.
• 14 facilities in Chile with more than 591,000 m2.
• 8 facilities in Rio de la Plata (Argentina & Uruguay)
with over 266,000 m2.
• 9 wine facilities with over 150,000 m2.
• Extensive distribution network reaching over
115,000 sales points throughout Chile & 152,000
in Argentina.
• Jointly controlled with Heineken, 2nd largest
brewery worldwide.
• Traded on NYSE and Santiago Stock Exchanges.
• Affiliate Foods participates in sweet snack business.
• Entered purified water segment through joint
venture with Nestlé S.A.
• In 2012 expands to mineral water and soft drinks
businesses in Uruguay, and acquires 51% of
Manantial in Chile, dedicated to HOD.
• In December 2013 CCU acquired a 50% stake in an
alcoholic and non-alcoholic beverage business in
Paraguay.
• In May 2014, CCU entered the Bolivian market
through the acquisition of 35% of Bebidas
Bolivianas.
• In November 2014, CCU signed an agreement with
Grupo Postobón to enter beer market
50.0%50.0%Inv. y Rentas
60.0%
Ranking Mkt. Share
Beer Chile 1 78%
Beer Argentina 2 23%
Carbonated Beverages 2 28%
Water (1) 1 52%
Domestic Wine 3 27%
Export Wine 2 13%
Pisco 1 56%
Rum 1 22%
35
(September 2014)
(1) Water includes mineral, purified and flavored water
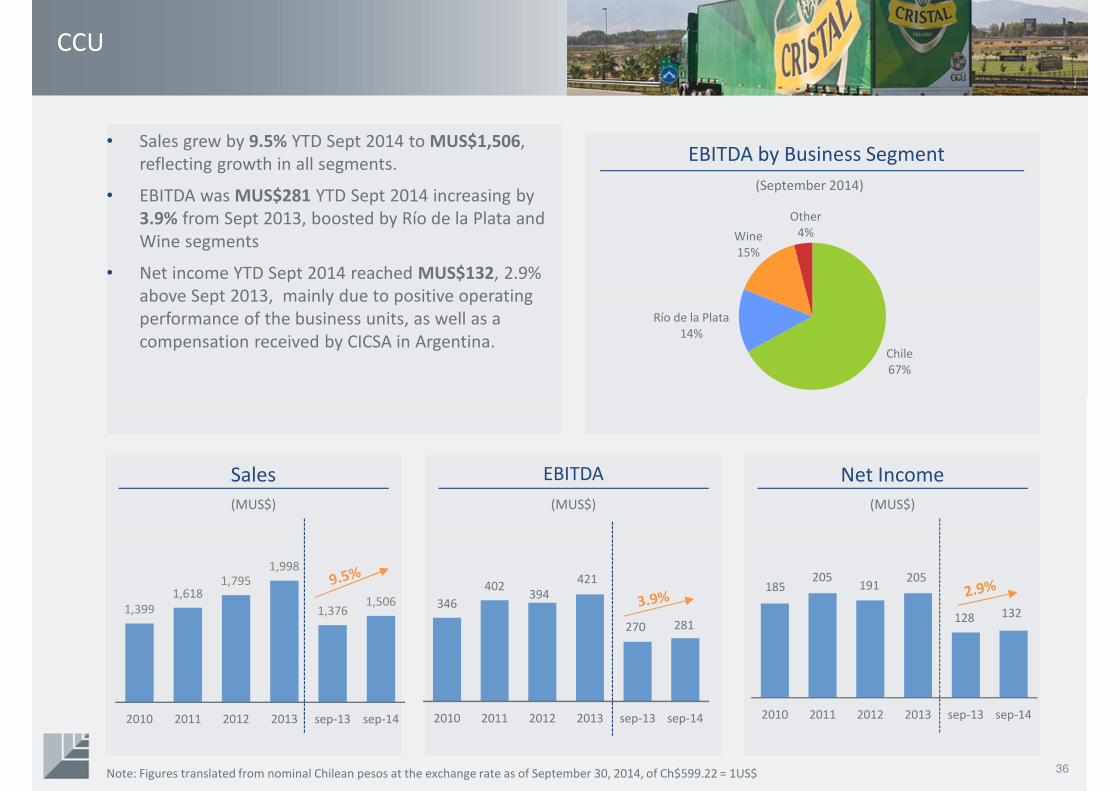
CCU
Sales
(MUS$)
EBITDA by Business Segment• Sales grew by 9.5% YTD Sept 2014 to MUS$1,506,
reflecting growth in all segments.
• EBITDA was MUS$281 YTD Sept 2014 increasing by
3.9% from Sept 2013, boosted by Río de la Plata and
Wine segments
• Net income YTD Sept 2014 reached MUS$132, 2.9%
above Sept 2013, mainly due to positive operating
performance of the business units, as well as a
compensation received by CICSA in Argentina.
EBITDA
(MUS$)
Net Income
(MUS$)
36
Chile
67%
Río de la Plata
14%
Wine
15%
Other
4%
1,399
1,6181,795
1,998
1,3761,506
2010 2011 2012 2013 sep-13 sep-14
346
402394
421
270 281
2010 2011 2012 2013 sep-13 sep-14
185205
191205
128 132
2010 2011 2012 2013 sep-13 sep-14
Note: Figures translated from nominal Chilean pesos at the exchange rate as of September 30, 2014, of Ch$599.22 = 1US$
(September 2014)
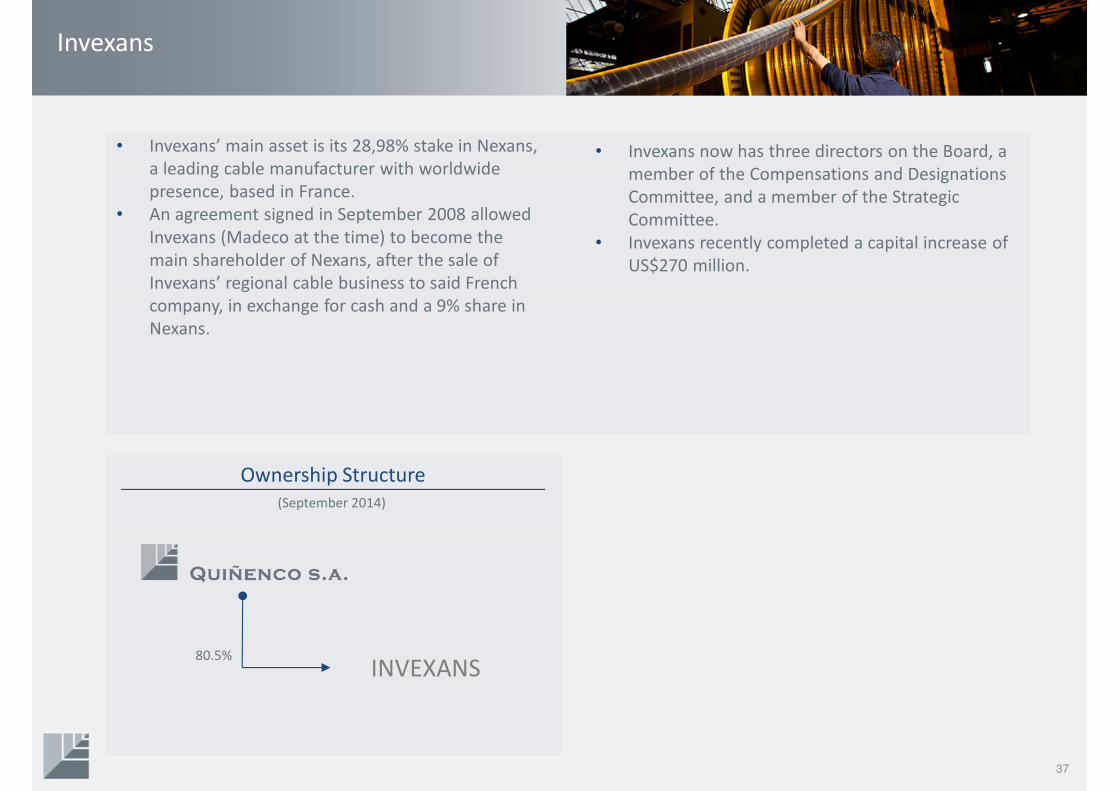
Invexans
37
• Invexans’ main asset is its 28,98% stake in Nexans,
a leading cable manufacturer with worldwide
presence, based in France.
• An agreement signed in September 2008 allowed
Invexans (Madeco at the time) to become the
main shareholder of Nexans, after the sale of
Invexans’ regional cable business to said French
company, in exchange for cash and a 9% share in
Nexans.
• Invexans now has three directors on the Board, a
member of the Compensations and Designations
Committee, and a member of the Strategic
Committee.
• Invexans recently completed a capital increase of
US$270 million.
Ownership Structure
(September 2014)
INVEXANS80.5%
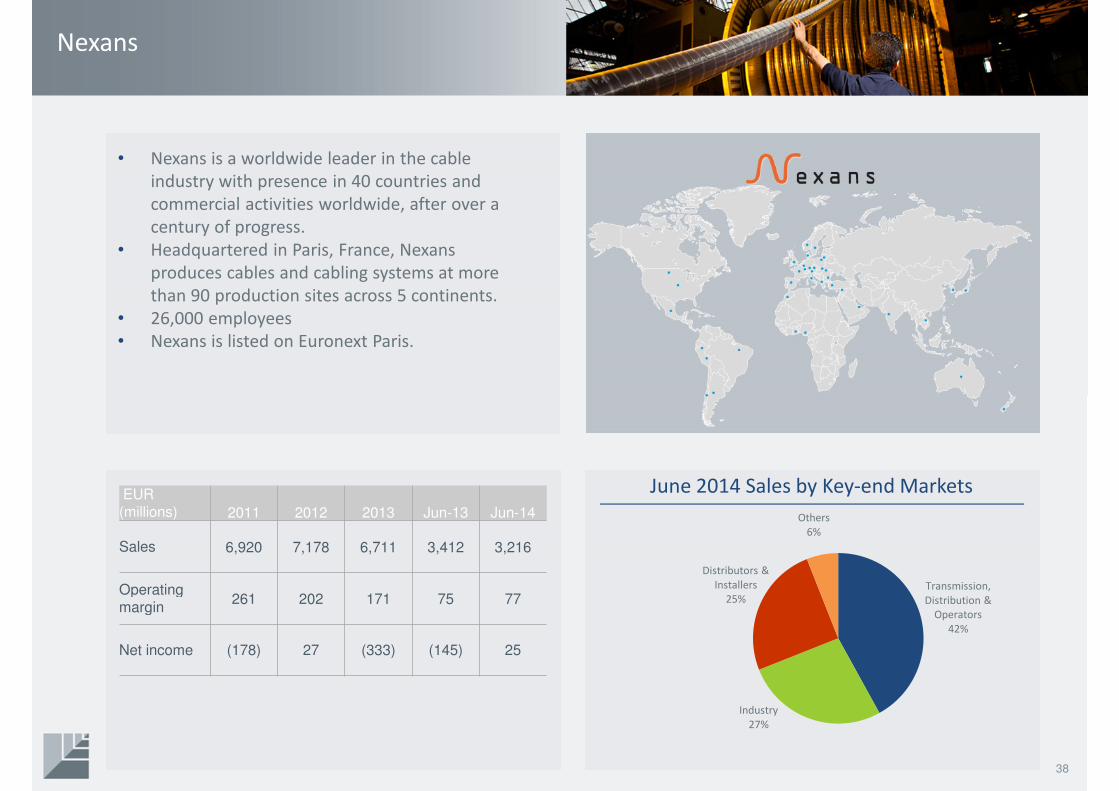
Nexans
June 2014 Sales by Key-end Markets
• Nexans is a worldwide leader in the cable
industry with presence in 40 countries and
commercial activities worldwide, after over a
century of progress.
• Headquartered in Paris, France, Nexans
produces cables and cabling systems at more
than 90 production sites across 5 continents.
• 26,000 employees
• Nexans is listed on Euronext Paris.
Transmission,
Distribution &
Operators
42%
Industry
27%
Distributors &
Installers
25%
Others
6%
38
EUR (millions) 2011 2012 2013 Jun-13 Jun-14
Sales 6,920 7,178 6,711 3,412 3,216
Operatingmargin
261 202 171 75 77
Net income (178) 27 (333) (145) 25
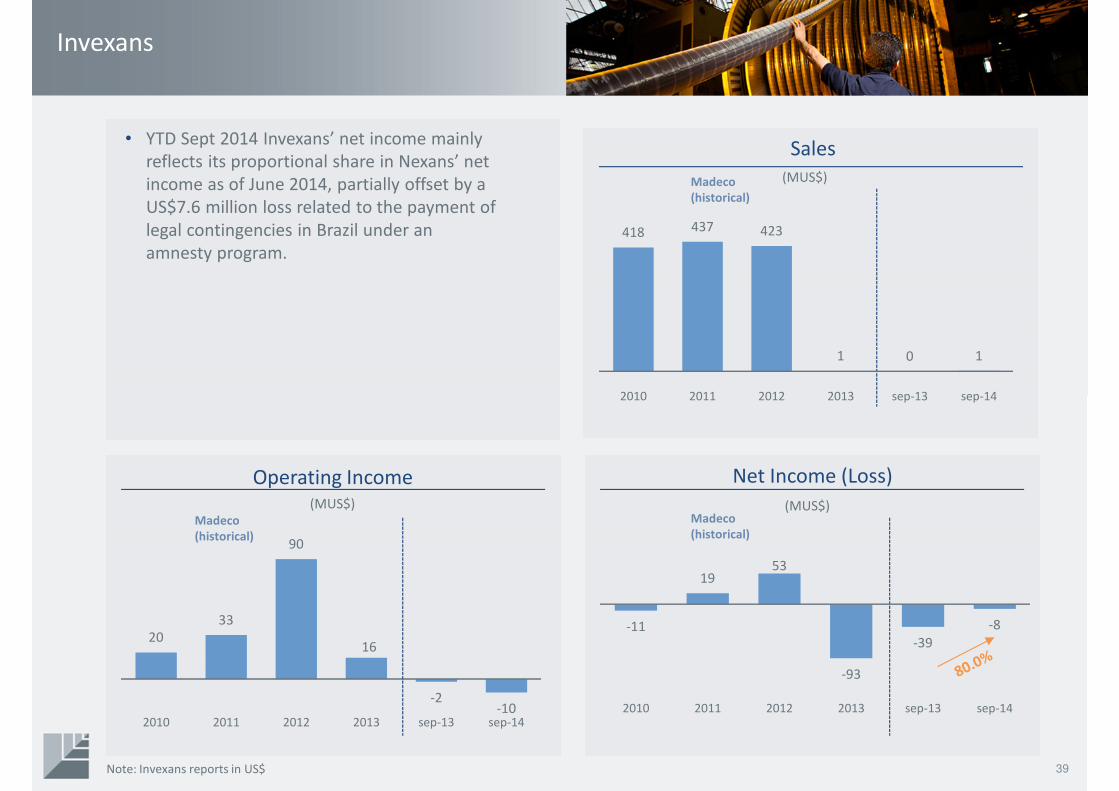
20
33
90
16
-2-10
2010 2011 2012 2013 sep-13 sep-14
Invexans
39
Sales
Operating Income Net Income (Loss)
Note: Invexans reports in US$
418 437 423
1 0 1
2010 2011 2012 2013 sep-13 sep-14
-11
1953
-93
-39
-8
2010 2011 2012 2013 sep-13 sep-14
Madeco
(historical)
Madeco
(historical)Madeco
(historical)
• YTD Sept 2014 Invexans’ net income mainly
reflects its proportional share in Nexans’ net
income as of June 2014, partially offset by a
US$7.6 million loss related to the payment of
legal contingencies in Brazil under an
amnesty program.
(MUS$)
(MUS$)
(MUS$)
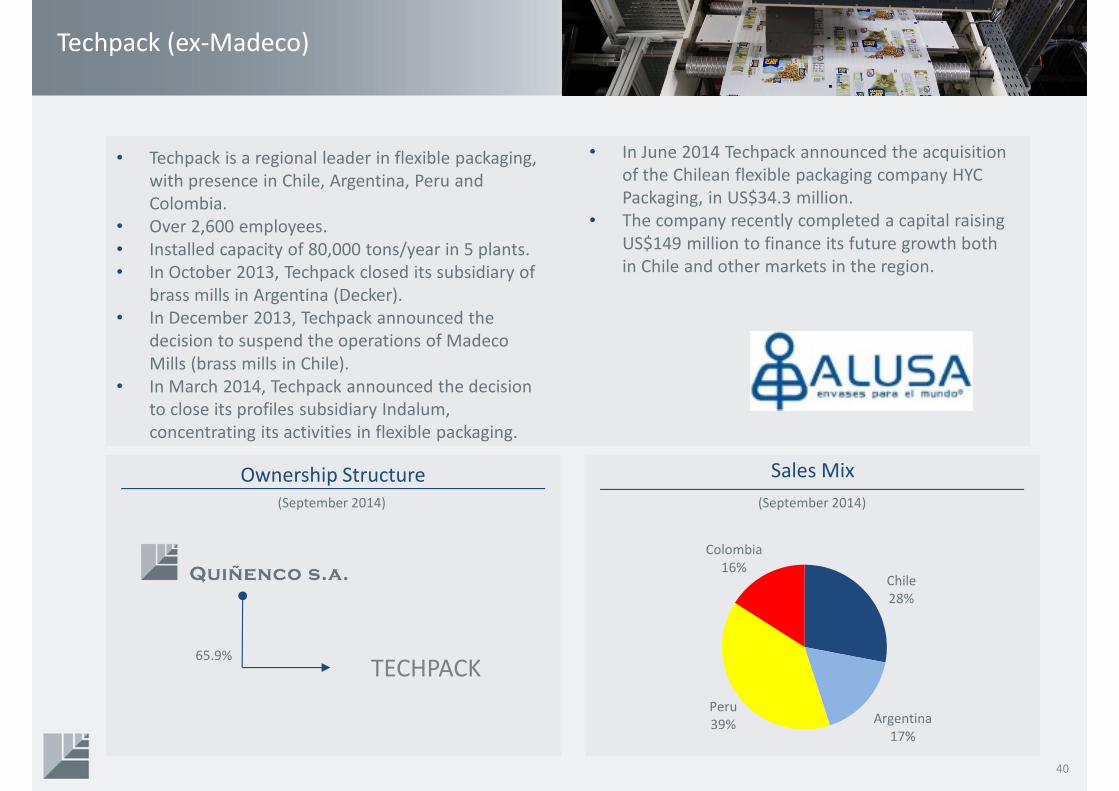
Techpack (ex-Madeco)
40
• Techpack is a regional leader in flexible packaging,
with presence in Chile, Argentina, Peru and
Colombia.
• Over 2,600 employees.
• Installed capacity of 80,000 tons/year in 5 plants.
• In October 2013, Techpack closed its subsidiary of
brass mills in Argentina (Decker).
• In December 2013, Techpack announced the
decision to suspend the operations of Madeco
Mills (brass mills in Chile).
• In March 2014, Techpack announced the decision
to close its profiles subsidiary Indalum,
concentrating its activities in flexible packaging.
Sales Mix
Chile
28%
Argentina
17%
Peru
39%
Colombia
16%
• In June 2014 Techpack announced the acquisition
of the Chilean flexible packaging company HYC
Packaging, in US$34.3 million.
• The company recently completed a capital raising
US$149 million to finance its future growth both
in Chile and other markets in the region.
Ownership Structure
(September 2014)
TECHPACK65.9%
(September 2014)
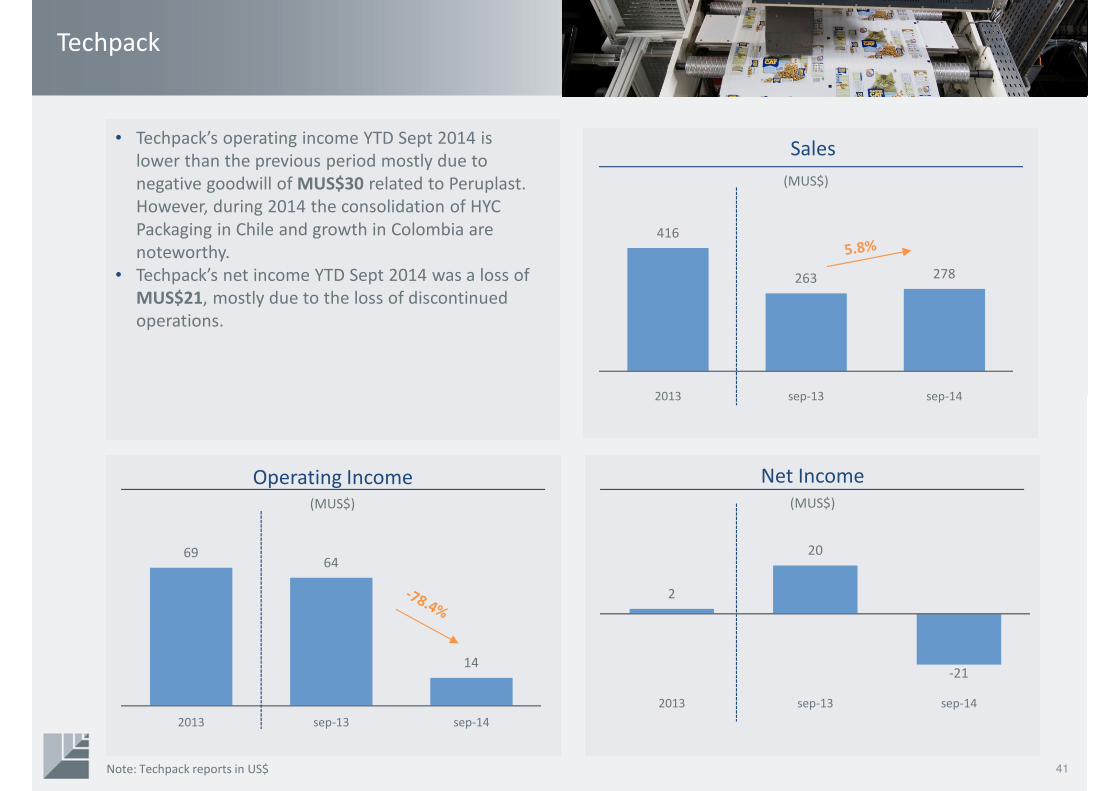
6964
14
2013 sep-13 sep-14
Techpack
41
Sales
Operating Income Net Income
Note: Techpack reports in US$
416
263 278
2013 sep-13 sep-14
2
20
-21
2013 sep-13 sep-14
• Techpack’s operating income YTD Sept 2014 is
lower than the previous period mostly due to
negative goodwill of MUS$30 related to Peruplast.
However, during 2014 the consolidation of HYC
Packaging in Chile and growth in Colombia are
noteworthy.
• Techpack’s net income YTD Sept 2014 was a loss of
MUS$21, mostly due to the loss of discontinued
operations.
(MUS$)
(MUS$)
(MUS$)
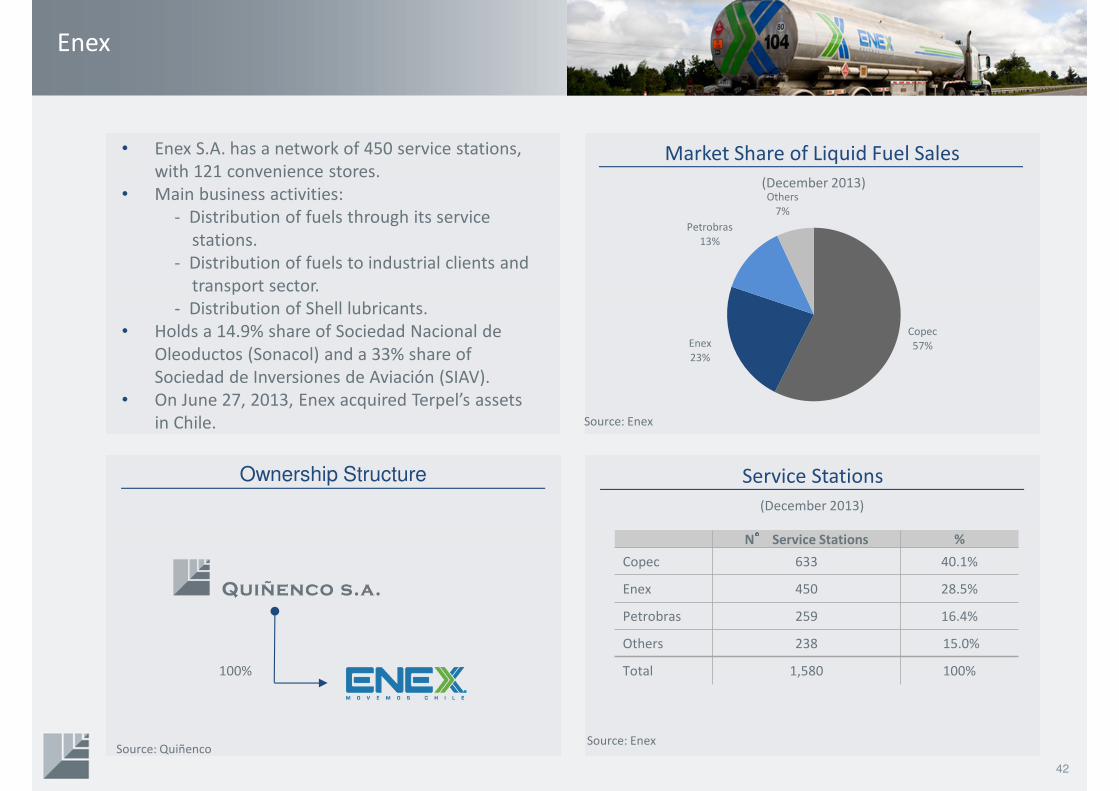
Enex
Service Stations
(December 2013)
Market Share of Liquid Fuel Sales• Enex S.A. has a network of 450 service stations,
with 121 convenience stores.
• Main business activities:
- Distribution of fuels through its service
stations.
- Distribution of fuels to industrial clients and
transport sector.
- Distribution of Shell lubricants.
• Holds a 14.9% share of Sociedad Nacional de
Oleoductos (Sonacol) and a 33% share of
Sociedad de Inversiones de Aviación (SIAV).
• On June 27, 2013, Enex acquired Terpel’s assets
in Chile.
Source: Quiñenco
(December 2013)
Ownership Structure
100%
Source: Enex
Source: Enex
N°°°° Service Stations %
Copec 633 40.1%
Enex 450 28.5%
Petrobras 259 16.4%
Others 238 15.0%
Total 1,580 100%
42
Copec
57%Enex
23%
Petrobras
13%
Others
7%
Enex
Net Income
(MUS$)
Sales
(MUS$)
Operating Income
(MUS$)
43
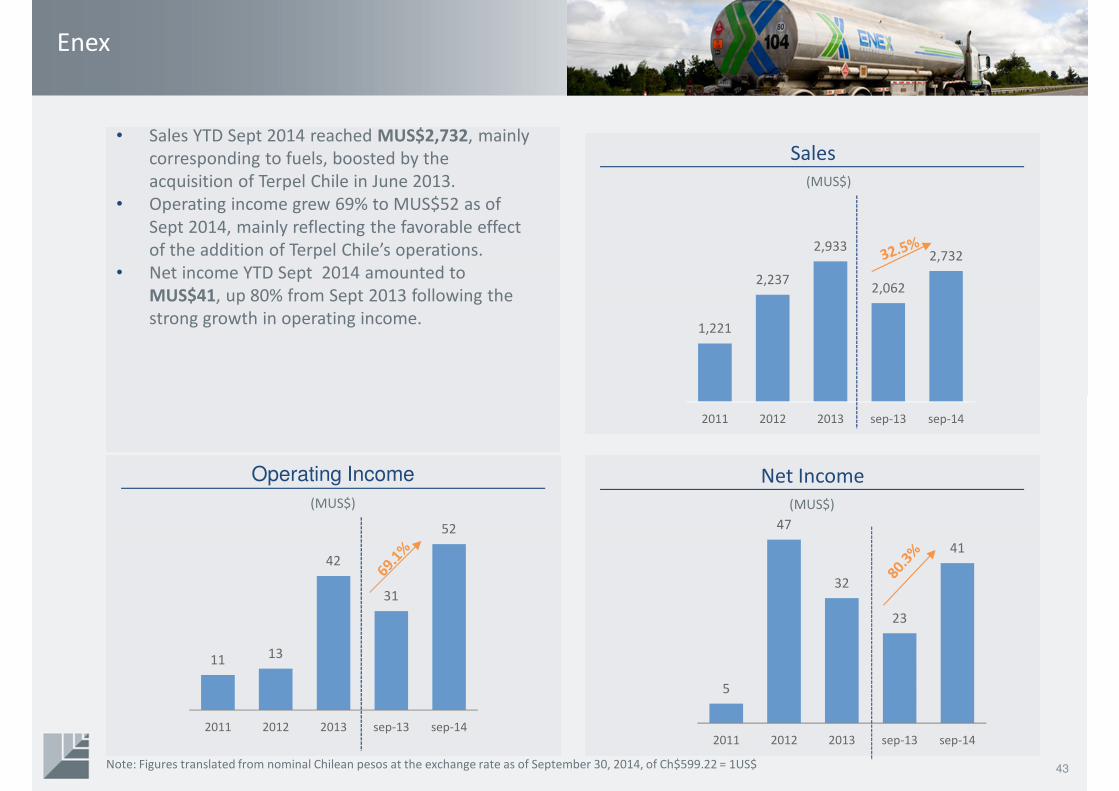
• Sales YTD Sept 2014 reached MUS$2,732, mainly
corresponding to fuels, boosted by the
acquisition of Terpel Chile in June 2013.
• Operating income grew 69% to MUS$52 as of
Sept 2014, mainly reflecting the favorable effect
of the addition of Terpel Chile’s operations.
• Net income YTD Sept 2014 amounted to
MUS$41, up 80% from Sept 2013 following the
strong growth in operating income. 1,221
2,237
2,933
2,062
2,732
2011 2012 2013 sep-13 sep-14
11 13
42
31
52
2011 2012 2013 sep-13 sep-14
5
47
32
23
41
2011 2012 2013 sep-13 sep-14
Note: Figures translated from nominal Chilean pesos at the exchange rate as of September 30, 2014, of Ch$599.22 = 1US$
CSAV
Ownership Structure Sales Mix
(September 2014)
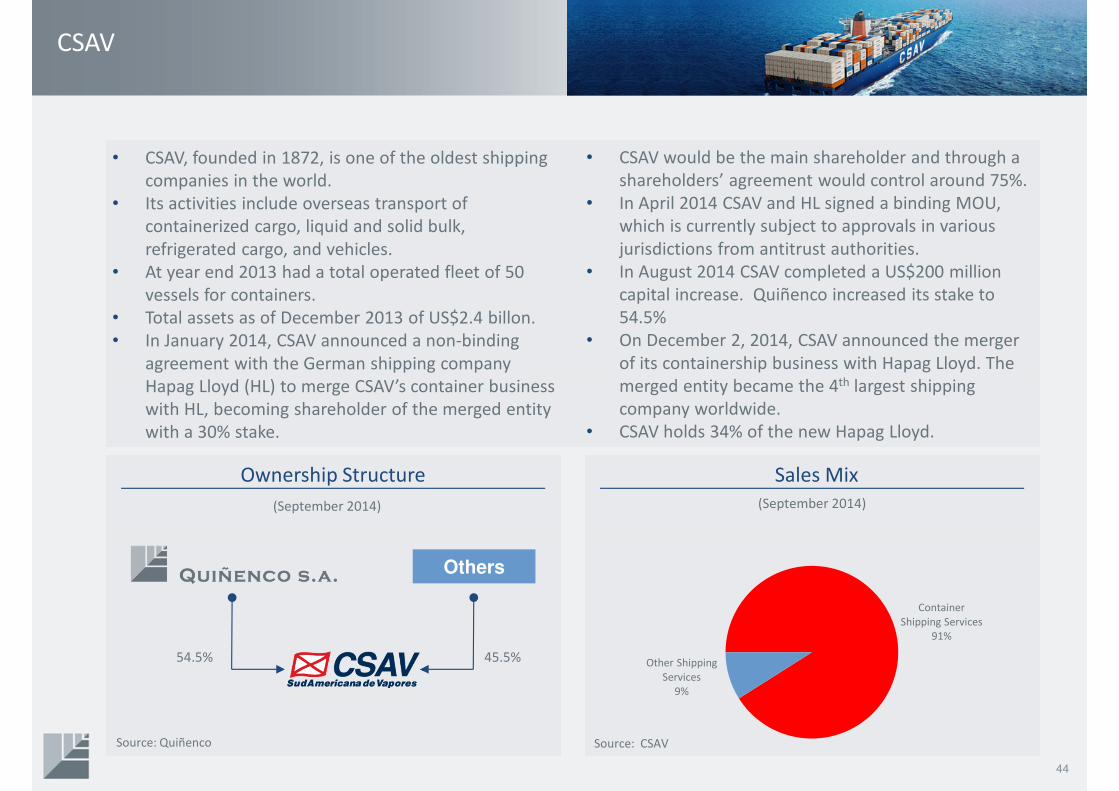
• CSAV, founded in 1872, is one of the oldest shipping
companies in the world.
• Its activities include overseas transport of
containerized cargo, liquid and solid bulk,
refrigerated cargo, and vehicles.
• At year end 2013 had a total operated fleet of 50
vessels for containers.
• Total assets as of December 2013 of US$2.4 billon.
• In January 2014, CSAV announced a non-binding
agreement with the German shipping company
Hapag Lloyd (HL) to merge CSAV’s container business
with HL, becoming shareholder of the merged entity
with a 30% stake.
• CSAV would be the main shareholder and through a
shareholders’ agreement would control around 75%.
• In April 2014 CSAV and HL signed a binding MOU,
which is currently subject to approvals in various
jurisdictions from antitrust authorities.
• In August 2014 CSAV completed a US$200 million
capital increase. Quiñenco increased its stake to
54.5%
• On December 2, 2014, CSAV announced the merger
of its containership business with Hapag Lloyd. The
merged entity became the 4th largest shipping
company worldwide.
• CSAV holds 34% of the new Hapag Lloyd.
Source: Quiñenco
45.5%54.5%
Source: CSAV
Container
Shipping Services
91%
Other Shipping
Services
9%
44
Others
(September 2014)
CSAV
EBITDA
(MUS$)
Net Income/Loss
(MUS$)
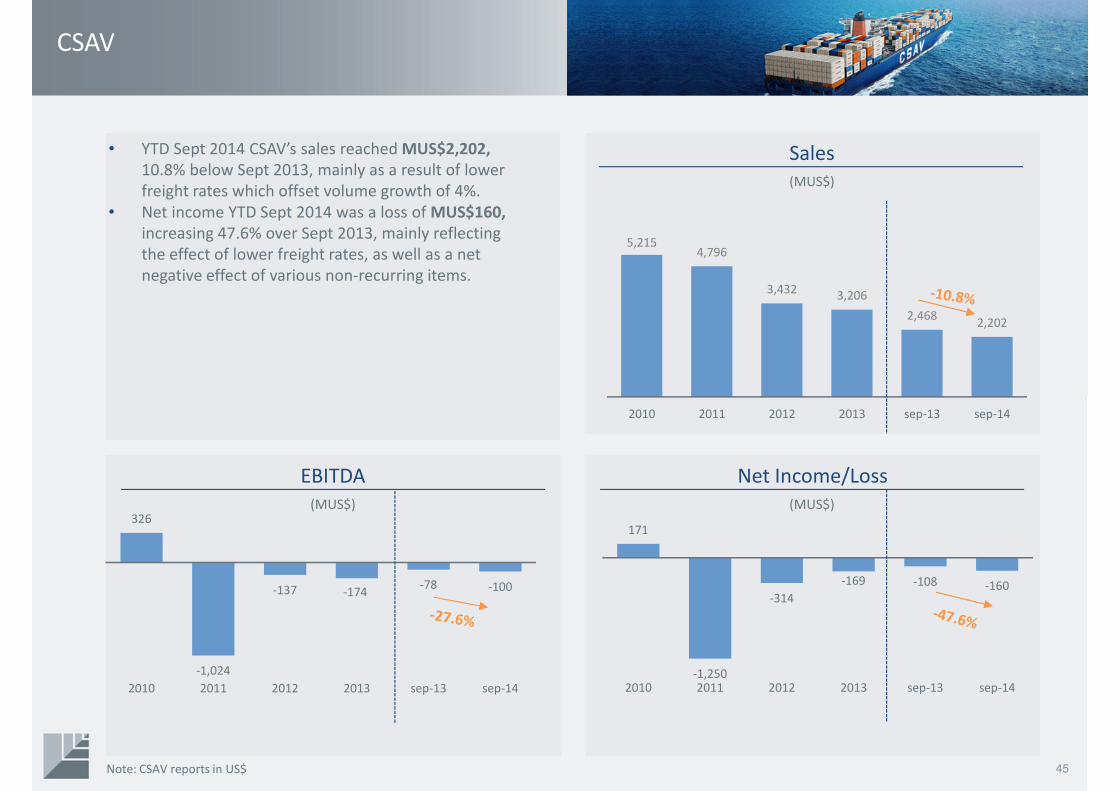
Sales• YTD Sept 2014 CSAV’s sales reached MUS$2,202,
10.8% below Sept 2013, mainly as a result of lower
freight rates which offset volume growth of 4%.
• Net income YTD Sept 2014 was a loss of MUS$160,
increasing 47.6% over Sept 2013, mainly reflecting
the effect of lower freight rates, as well as a net
negative effect of various non-recurring items.
(MUS$)
45Note: CSAV reports in US$
5,2154,796
3,4323,206
2,4682,202
2010 2011 2012 2013 sep-13 sep-14
326
-1,024
-137 -174-78 -100
2010 2011 2012 2013 sep-13 sep-14
171
-1,250
-314
-169 -108 -160
2010 2011 2012 2013 sep-13 sep-14
SM SAAM
Ownership Structure EBITDA Mix1
(September 2014)
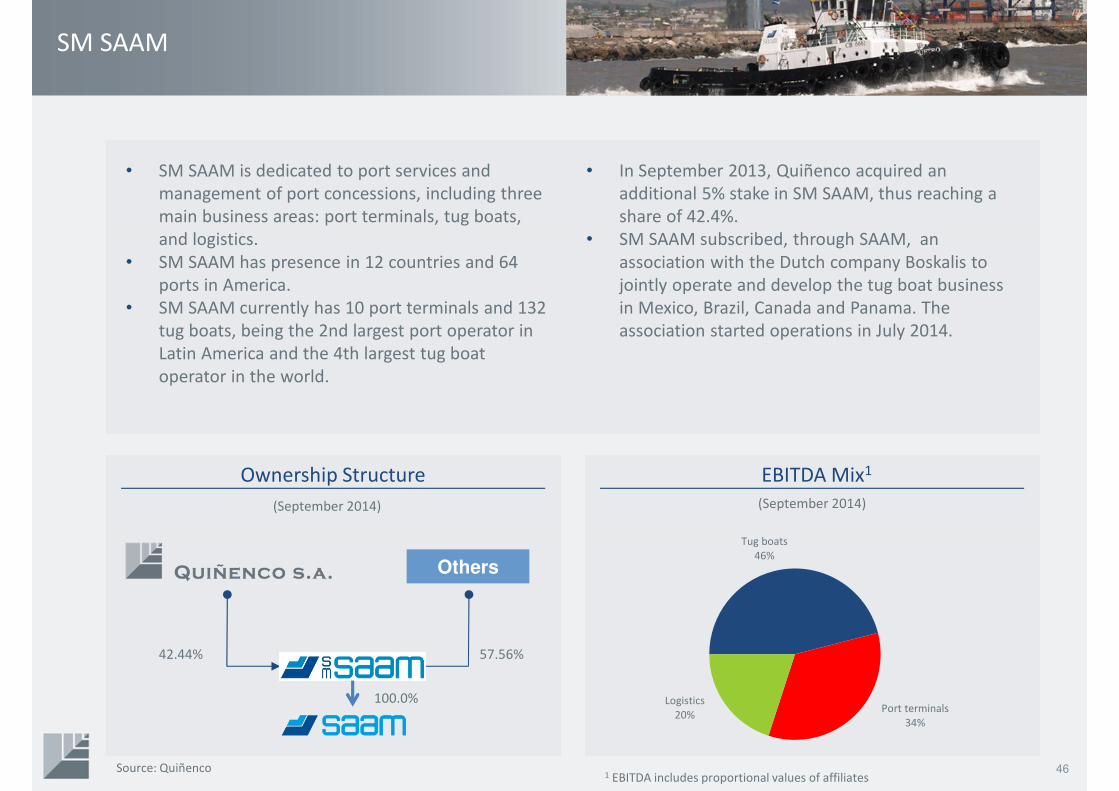
• SM SAAM is dedicated to port services and
management of port concessions, including three
main business areas: port terminals, tug boats,
and logistics.
• SM SAAM has presence in 12 countries and 64
ports in America.
• SM SAAM currently has 10 port terminals and 132
tug boats, being the 2nd largest port operator in
Latin America and the 4th largest tug boat
operator in the world.
• In September 2013, Quiñenco acquired an
additional 5% stake in SM SAAM, thus reaching a
share of 42.4%.
• SM SAAM subscribed, through SAAM, an
association with the Dutch company Boskalis to
jointly operate and develop the tug boat business
in Mexico, Brazil, Canada and Panama. The
association started operations in July 2014.
Source: Quiñenco
57.56%42.44%
46
Others
1 EBITDA includes proportional values of affiliates
100.0%
Tug boats
46%
Port terminals
34%
Logistics
20%
(September 2014)
SM SAAM
47
Net Income
(MUS$)
Sales
(MUS$)
Operating Income
(MUS$)
Note: SM SAAM reports in US$
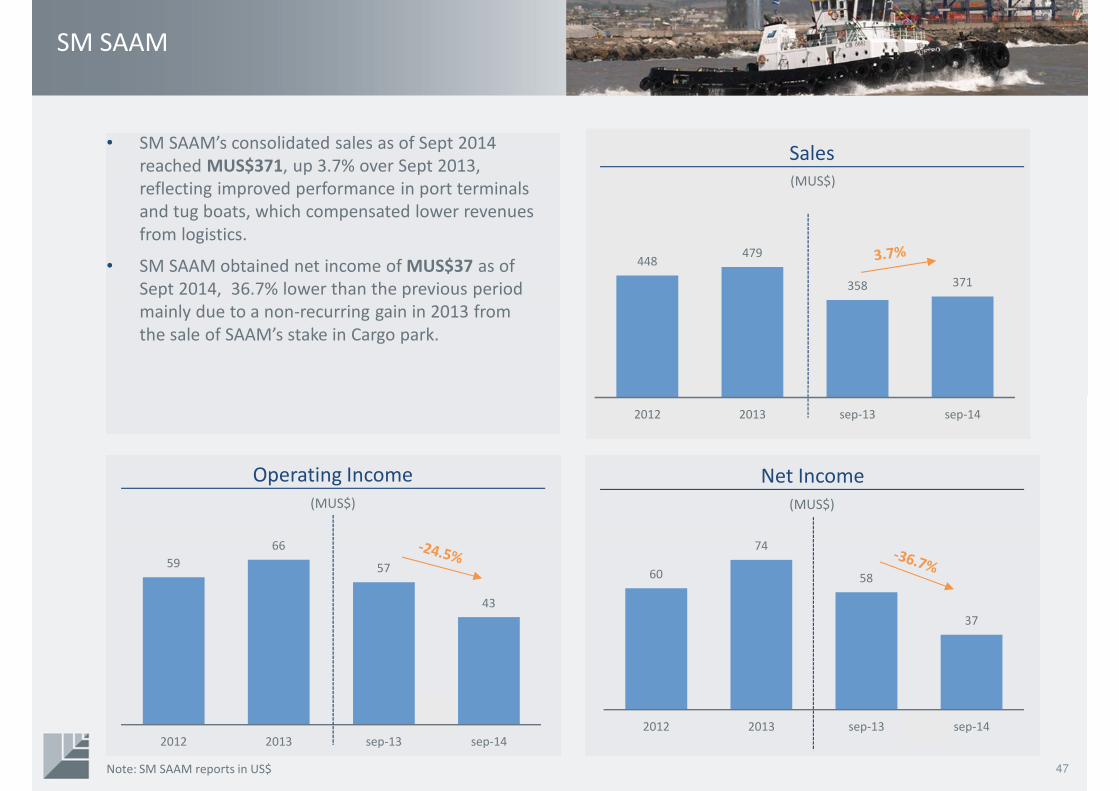
• SM SAAM’s consolidated sales as of Sept 2014
reached MUS$371, up 3.7% over Sept 2013,
reflecting improved performance in port terminals
and tug boats, which compensated lower revenues
from logistics.
• SM SAAM obtained net income of MUS$37 as of
Sept 2014, 36.7% lower than the previous period
mainly due to a non-recurring gain in 2013 from
the sale of SAAM’s stake in Cargo park.
448479
358 371
2012 2013 sep-13 sep-14
59
66
57
43
2012 2013 sep-13 sep-14
60
74
58
37
2012 2013 sep-13 sep-14
ConclusionsQuiñenco
Overview
Recent Events Financial Overview
Main Operating Companies
48
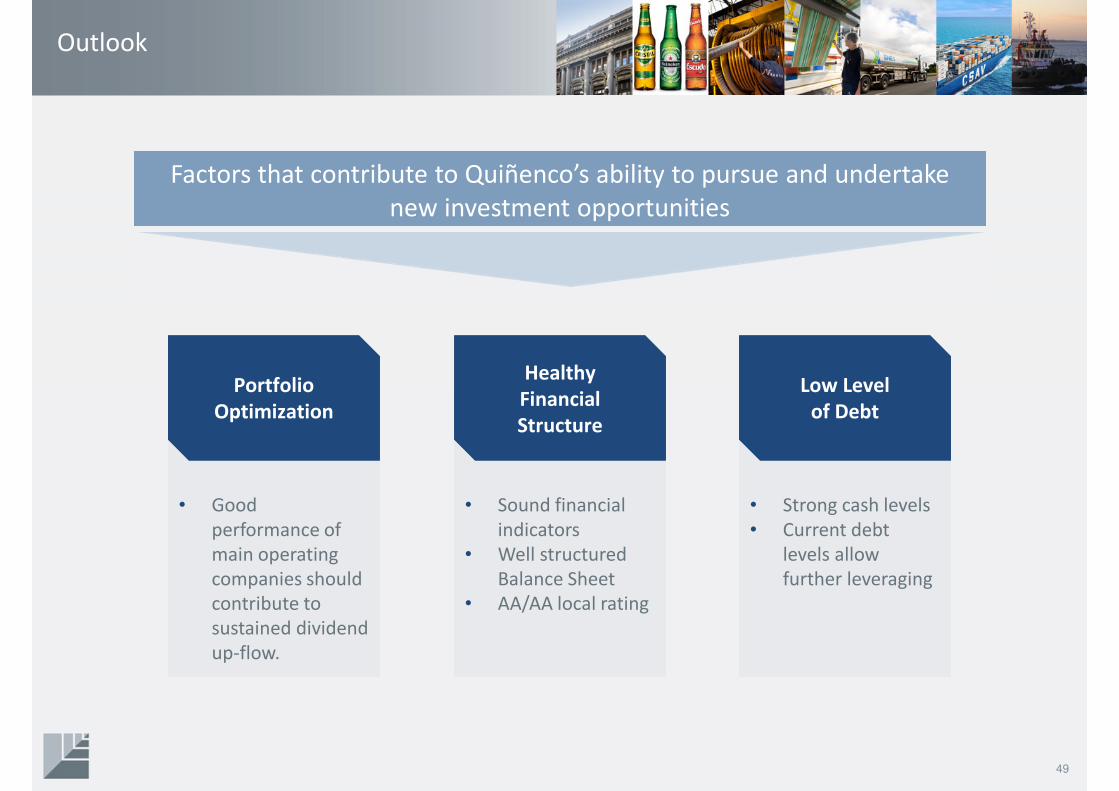
Outlook
Portfolio
Optimization
Healthy
Financial
Structure
Low Level
of Debt
• Good
performance of
main operating
companies should
contribute to
sustained dividend
up-flow.
• Sound financial
indicators
• Well structured
Balance Sheet
• AA/AA local rating
• Strong cash levels
• Current debt
levels allow
further leveraging
Factors that contribute to Quiñenco’s ability to pursue and undertake
new investment opportunities
49
50