Embed Size (px)
Citation preview

6 December 2017
Company presentation
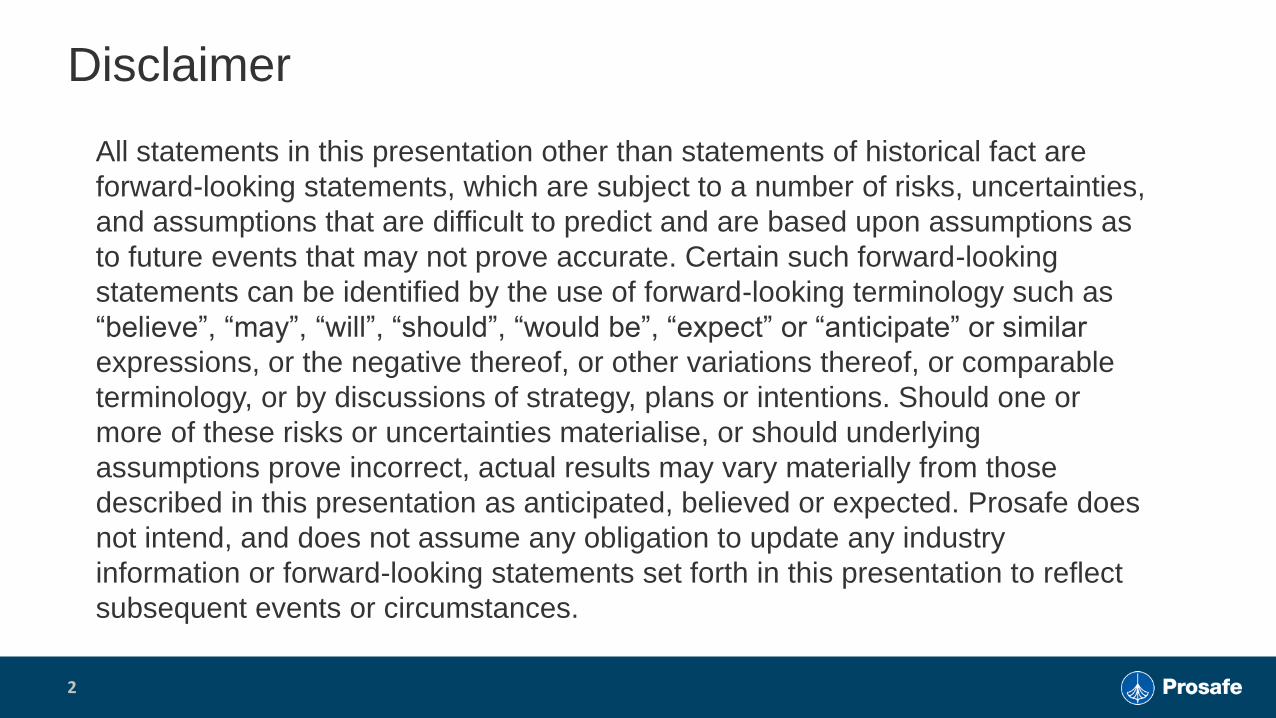
Disclaimer
All statements in this presentation other than statements of historical fact are
forward-looking statements, which are subject to a number of risks, uncertainties,
and assumptions that are difficult to predict and are based upon assumptions as
to future events that may not prove accurate. Certain such forward-looking
statements can be identified by the use of forward-looking terminology such as
“believe”, “may”, “will”, “should”, “would be”, “expect” or “anticipate” or similar
expressions, or the negative thereof, or other variations thereof, or comparable
terminology, or by discussions of strategy, plans or intentions. Should one or
more of these risks or uncertainties materialise, or should underlying
assumptions prove incorrect, actual results may vary materially from those
described in this presentation as anticipated, believed or expected. Prosafe does
not intend, and does not assume any obligation to update any industry
information or forward-looking statements set forth in this presentation to reflect
subsequent events or circumstances.
2

Introduction
Plan the work - Work the plan
Status and outlook
Summary
3
Agenda

Who we are
4
World’s most diversified fleet of 8 semi-submersible
accommodation-, service- and safety vessels and one TSV vessel.
Three new builds at Cosco and one monohull under management.
Mid to late cyclical, typically exposed to brownfield MMO type work
as well as hook-up & commissioning and decommissioning
Working the plan to be the world leader within offshore
accommodation
Headquartered in Cyprus - offices in Brazil, UK, Norway and
Singapore
1
2
4
5
Book value of total assets is ca. USD 1.7 billion / ca. 500 employees 3

Exploring various opportunities for strategic optionality
5
Boreas (‘15) Zephyrus (‘16) Notos (‘16)
Concordia (’05/’15)
Axis Vega (’17E) Axis Nova (’17E)
Regalia (’85/’09)
Caledonia (’82/’12)
Astoria (‘83/’12)
Bristolia (’83/’08)
Swift (’85/’09)
High End Mid Water
Further strategic opportunities at
different levels:
1. Pooling/JV
2. Management
3. Acquisition (stranded assets)
4. Consolidation
RoW | Marketed
Opportunities
Strengthening Prosafe’s
leading market position
Drilling Support
Scandinavia (’84/’15)
Eurus (’19E)
Prosafe is high grading the fleet and looking for every opportunity to gain strategic optionality

Prosafe: well positioned in global niche
Prosafe is a leading company in a global niche
Prosafe is the only listed, pure play offshore accommodation company in the world
Prosafe is restructured and streamlined
Market indicators: oil price up, break-even levels down, oil industry cash positive
Prosafe as a mid to late cyclical company will benefit from several demand drivers across the value
chain in a recovering market
6
Exploration Installation &
Commissioning Operation
P&A and
Decomission-
ing
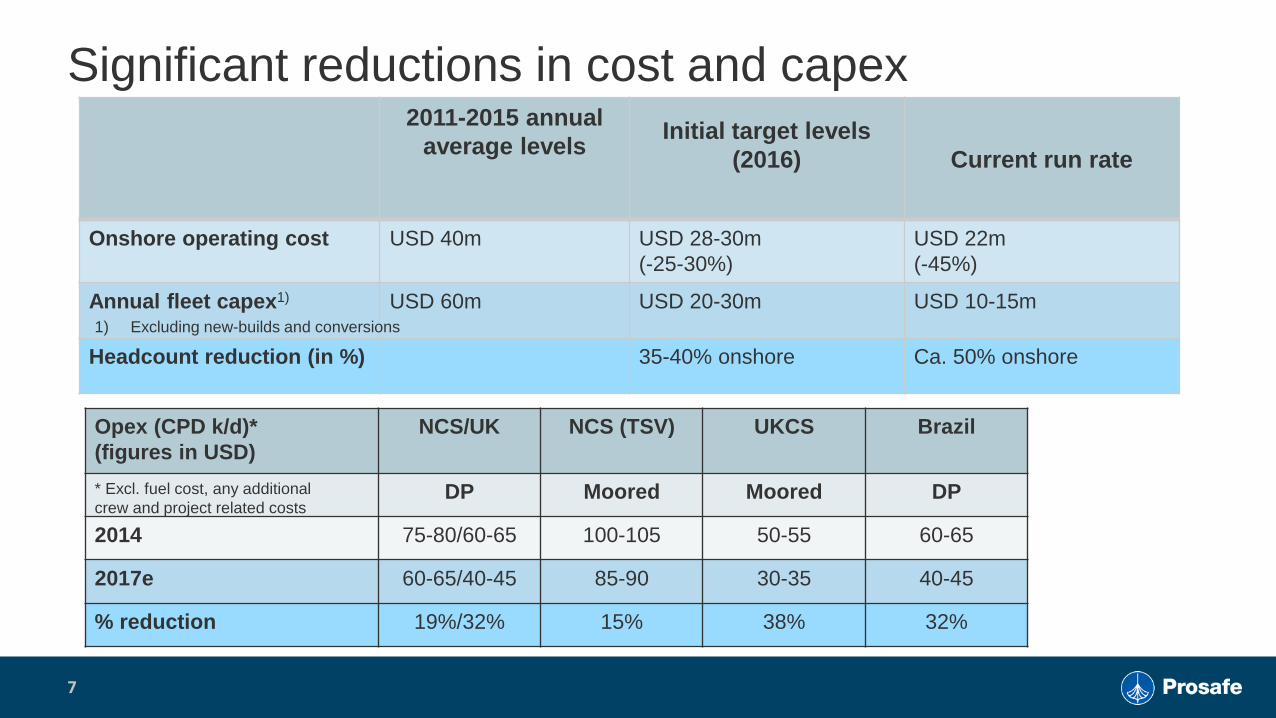
Significant reductions in cost and capex
7
2011-2015 annual
average levels Initial target levels
(2016)
Current run rate
Onshore operating cost USD 40m USD 28-30m
(-25-30%)
USD 22m
(-45%)
Annual fleet capex1) USD 60m USD 20-30m USD 10-15m
Headcount reduction (in %) 35-40% onshore Ca. 50% onshore
1) Excluding new-builds and conversions
Opex (CPD k/d)*
(figures in USD)
NCS/UK NCS (TSV) UKCS Brazil
DP Moored Moored DP
2014 75-80/60-65 100-105 50-55 60-65
2017e 60-65/40-45 85-90 30-35 40-45
% reduction 19%/32% 15% 38% 32%
* Excl. fuel cost, any additional
crew and project related costs

Highlights
Plan the work - Work the plan
Status and outlook
Summary
8
Agenda

1997 1998-2006 2011-2016 2016 2017+
Creation:
Merger between
Procon Offshore
and Safe Offshore
Growth and
consolidation:
1. Acq. of Discoverer ASA
2. Acq. of Safe Scandinavia
3. Acq. of Regalia
4. Acq. of Polyconcord/SH
5. Acq. of Consafe Offsh.
Fleet renewal
and rightsizing:
1. Renewal
2. Conversion to
TSV
3. Scrapping
Engaging in M&A:
1. Acq. of
Nova/Vega
9
Proactive in restructuring of the industry
«Next phase
restructuring»
1.Consolidation
2. More scrapping
Regalia (’85/’09)

Fleet renewal – controlling 3 new builds at COSCO
Negotiations with COSCO regarding Safe Nova,
Safe Vega and Safe Eurus ongoing
• The standstill agreement between Prosafe and
COSCO related to Safe Nova and Safe Vega has
been extended until December 2017
Looking for optionality and value creation
potential from financing terms, price and timing
of delivery
Right to cancel Safe Nova and Safe Vega
newbuild contracts and claim a refund of
instalments plus interest equal to approx. USD
60 million secured by Bank of China
10
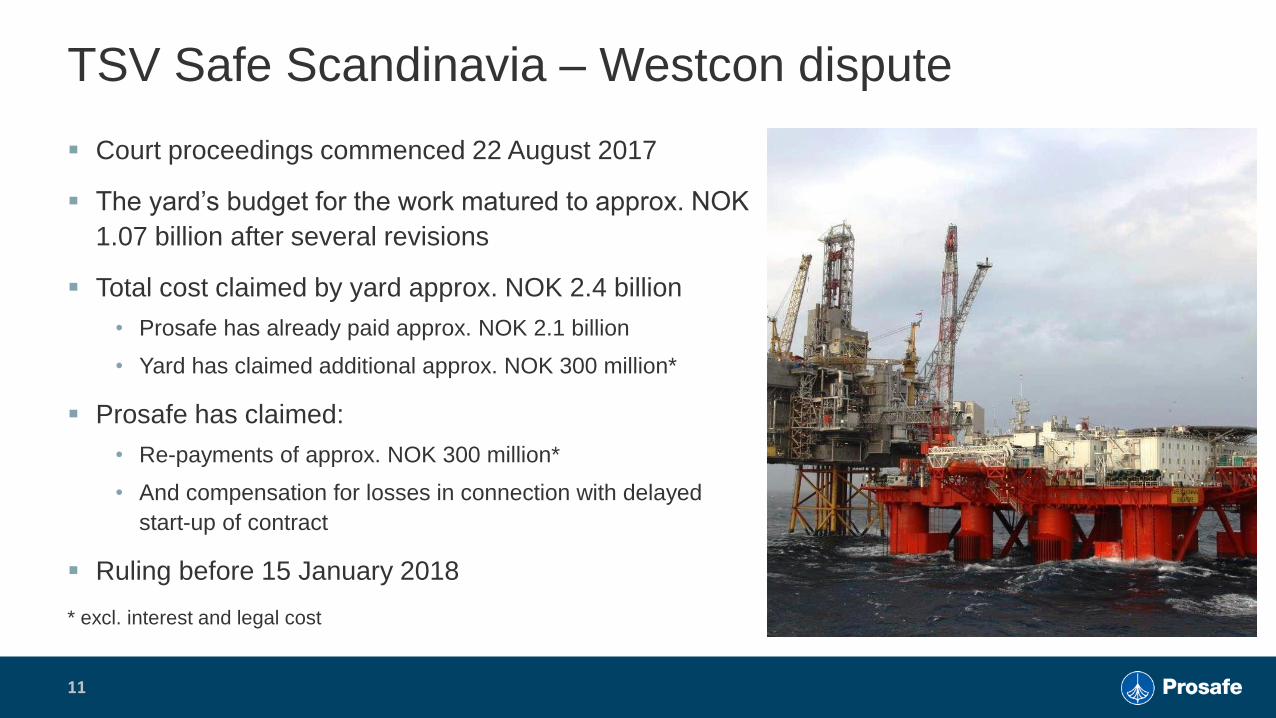
TSV Safe Scandinavia – Westcon dispute
Court proceedings commenced 22 August 2017
The yard’s budget for the work matured to approx. NOK
1.07 billion after several revisions
Total cost claimed by yard approx. NOK 2.4 billion
• Prosafe has already paid approx. NOK 2.1 billion
• Yard has claimed additional approx. NOK 300 million*
Prosafe has claimed:
• Re-payments of approx. NOK 300 million*
• And compensation for losses in connection with delayed
start-up of contract
Ruling before 15 January 2018
* excl. interest and legal cost
11

Highlights
Plan the work - Work the plan
Status and outlook
Summary
12
Agenda

Contributing to fleet renewal and high-grading
13

Contract portfolio Firm order book at end Q3 2017 of approx. MUSD 375
14

Prospects and tendering – Prosafe business intel
15
Nine tenders ongoing for 2017
through 2019 – two in the North Sea
The prospect list with a three-year
look-out remains at a relatively high
level
18 prospects with high probability of
going to tender – majority from 2018
onwards
P90, P50 and P10 are prospects probability of moving to a tender.
Source: Prosafe
Tenders and Prospects - outlook is generally three years

Safe Boreas commenced contract with Statoil
In early August, Safe Boreas commenced on a
13-month firm contract with Statoil at the
Mariner installation in the UK North Sea
In addition, Statoil can exercise six one-month
options
Total value of the firm contract is approximately
USD 131.8 million, including a re-phasing
charge of USD 30 million that was paid to the
company in 2016
Some work related to Offshore Technical
Guidelines (OTG) strengthening work was
undertaken at the yard prior to commencement
16

TSV Safe Scandinavia - Strong performance at Oseberg
Firm contract with Statoil until end June
2018 at Oseberg East on the NCS
Strong and efficient operational and
technical performance
• Drilling with TSV support started in March 2016
• Services provided: Drilling support, well
intervention, accommodation and other vessel
support
17

Safe Scandinavia – Positioning beyond 2018
In dialogue with blue chip companies to
collaborate within Plug and Abandonment
(P&A) and decommissioning:
• Permanent P&A
• Ambition to reduce the total project time for P&A,
“Making safe” / Decommissioning preparation by
up to 30-50% with activities undertaken in parallel
• Well intervention
• “Making Safe” / other Decommissioning
preparation activities concurrently with well
abandonment
Marketing started – North Sea focus
18

North Sea: Prospects developing from 2019 onwards
Currently low tendering activity due to
low and deferred operator spending
Longer term, expect increased
tendering and contracts related to
support accumulating maintenance
backlog and modification work at
ageing infrastructure in the North Sea
Prospects developing, although
trending towards 2019 onwards
19
Age of fixed facilities in the North Sea
1980 2000 2020 2040 2060
Brage
Draugen
Ekofisk
Gullfaks
Statfjord
Varg
VeslefrikkLatest year ofreportedproduction as of2015
Source:
www.norskpetroleum.no

Brazil: Anticipate tender activity for long term
20
Opportunity
GTD: General Technical Description (minimum technical requirements)
Source: Prosafe
Petrobras technical
specifications (‘GTD’) have
evolved substantially since
2010 – some of the highest
requirements of any operator
9 vessels of 8 owners
operating in 2015
Presently 5 vessels contracted,
reducing to 1 vessel by mid-
2018
Anticipated tender activity to
address vessel shortage

Mexico expected to return to a strong market longer term
Mexico remains a major oil producer
At the peak of the flotel market, around 9000 POB
were in Mexico (2015)
In 2017, the total capacity in Mexico is around 4000
POB
Ageing infrastructure will mean an ongoing demand
for maintenance
Currently only 5 vessels active
Pemex expected to demand better, high-end vessels
Longer term also demand from other E&P companies
now positioning in Mexico in connection with ‘farm
out’ projects
21

Summary
Currently low tendering activity due to deferred operator spending.
Most activity outside the North Sea
The prospect list with a three-year look-out remains at a relatively
high level
Positioning TSV Safe Scandinavia towards and beyond June 2018
for strategic optionality based on vessel’s unique characteristics in
drilling and well support operations, as well as decom preparations
Looking for optionality and value creation potential from financing
terms, price and timing of delivery of COSCO new builds
Cost and capex significantly reduced
Continue to be proactive in industry restructuring
Working the plan to be the world leader within offshore
accommodation
22

Appendix
23

EBITDA and capex guidance
24
Guidance
2017 EBITDA Ca. MUSD 120
Average capex per year Ca. MUSD 10-15 1)
1) Incl. SPS for the Safe Caledonia and
OTG 13/14 works on Boreas in 2017
and without any new build deliveries
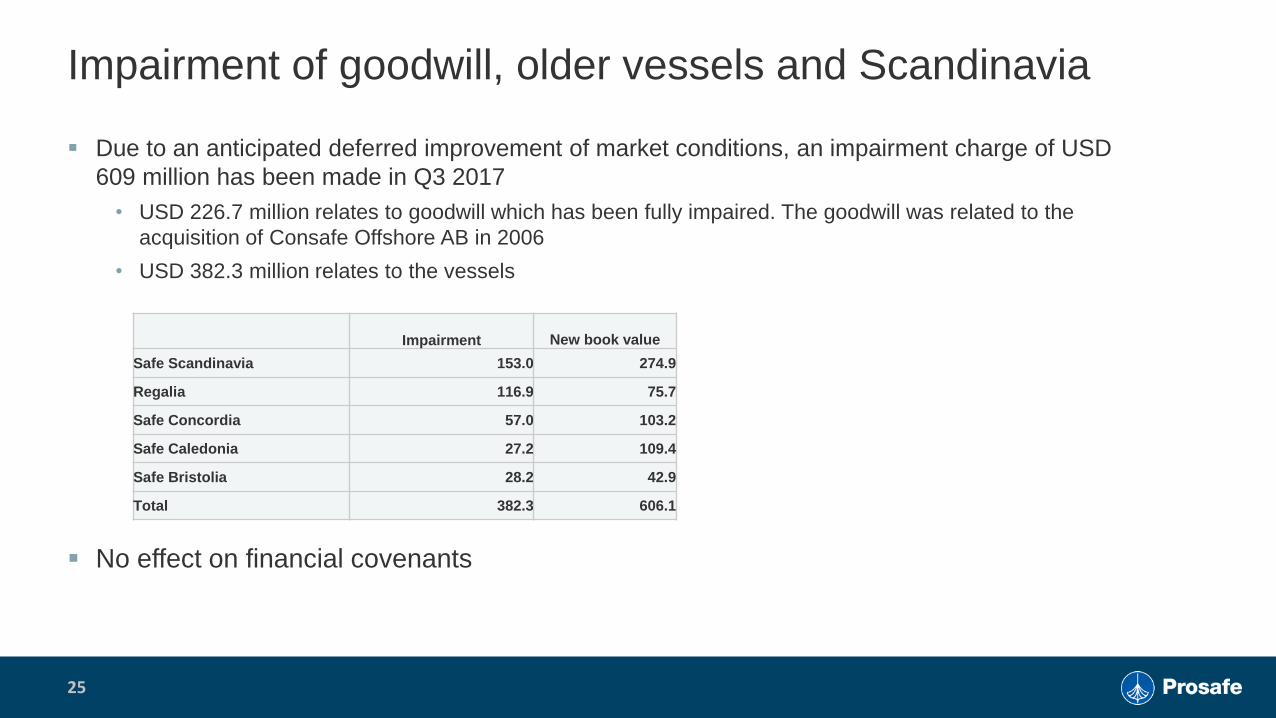
Impairment of goodwill, older vessels and Scandinavia
Due to an anticipated deferred improvement of market conditions, an impairment charge of USD
609 million has been made in Q3 2017
• USD 226.7 million relates to goodwill which has been fully impaired. The goodwill was related to the
acquisition of Consafe Offshore AB in 2006
• USD 382.3 million relates to the vessels
25
Impairment
New book value
Safe Scandinavia 153.0 274.9
Regalia 116.9 75.7
Safe Concordia 57.0 103.2
Safe Caledonia 27.2 109.4
Safe Bristolia 28.2 42.9
Total 382.3 606.1
No effect on financial covenants

Income statement
26
(Unaudited figures in USD million) Q3 17 Q2 17 Q3 16 9M 17 9M 16 2016
Operating revenues 68.9 61.7 129.8 206.3 348.2 474.0
Operating expenses (41.3) (37.3) (61.5) (123.5) (173.0) (220.8)
EBITDA 27.6 24.4 68.3 82.8 175.2 253.2
Depreciation (34.8) (33.8) (29.1) (102.0) (81.6) (115.7)
Impairment (609.0) 0.0 0.0 (609.0) 0.0 (84.7)
Operating profit/(loss) (616.2) (9.4) 39.2 (628.2) 93.6 52.8
Interest income 0.5 0.4 0.1 1.0 0.2 0.3
Interest expenses (19.1) (18.0) (28.7) (55.7) (67.2) (85.6)
Other financial items 2.3 (4.9) 196.8 1.0 188.5 222.2
Net financial items (16.3) (22.5) 168.2 (53.7) 121.5 136.9
Profit/(Loss) before taxes (632.5) (31.9) 207.4 (681.9) 215.1 189.7
Taxes (2.5) (1.1) (5.5) (5.2) (9.8) (17.1)
Net profit/(loss) (635.0) (33.0) 201.9 (687.1) 205.3 172.6
EPS (8.89) (0.46) 16.13 (9.62) 34.63 8.36
Diluted EPS (7.22) (0.38) 15.78 (7.81) 34.10 8.10
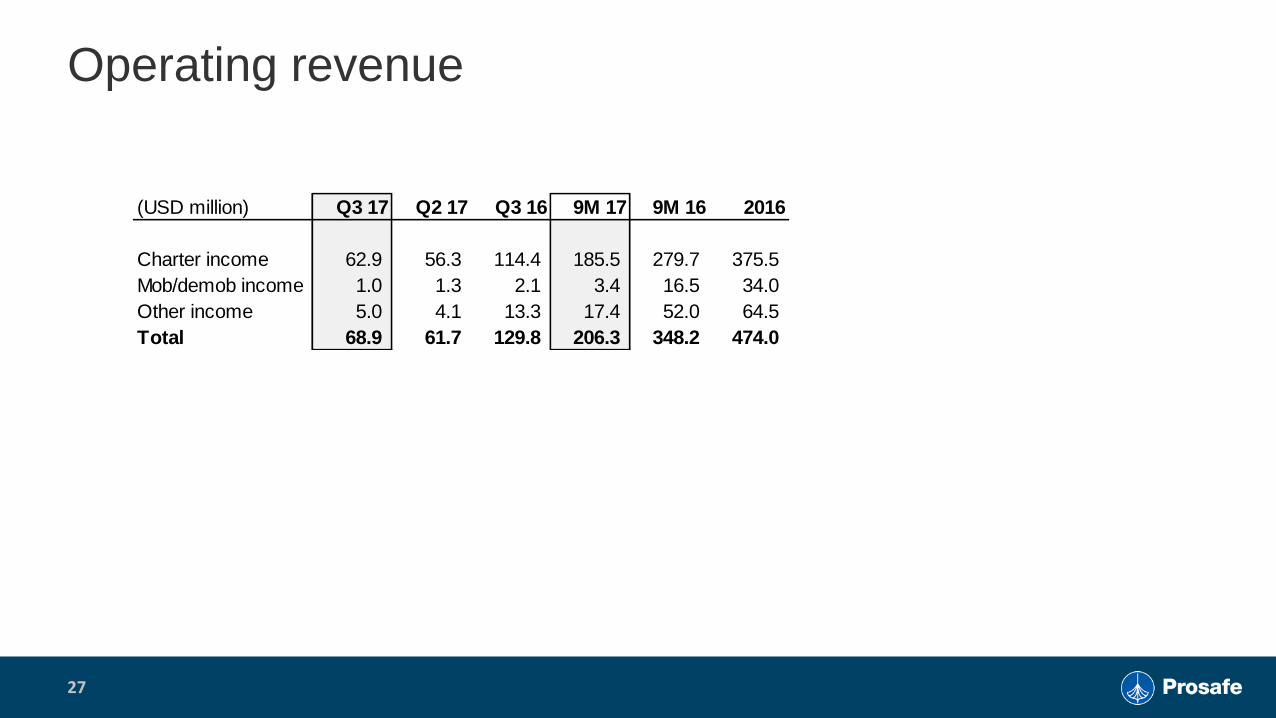
Operating revenue
27
(USD million) Q3 17 Q2 17 Q3 16 9M 17 9M 16 2016
Charter income 62.9 56.3 114.4 185.5 279.7 375.5
Mob/demob income 1.0 1.3 2.1 3.4 16.5 34.0
Other income 5.0 4.1 13.3 17.4 52.0 64.5
Total 68.9 61.7 129.8 206.3 348.2 474.0

Balance sheet
28
(Unaudited figures in USD million) 30.09.17 30.06.17 31.12.16 30.09.16
Goodwill 0.0 226.7 226.7 226.7
Vessels 1 555.0 1 967.0 2 029.3 1 887.3
New builds 124.9 124.9 122.2 318.8
Other non-current assets 11.2 12.3 13.9 4.1
Total non-current assets 1 691.1 2 330.9 2 392.1 2 436.9
Cash and deposits 207.8 218.8 205.7 183.4
Other current assets 58.4 41.6 89.1 90.9
Total current assets 266.2 260.4 294.8 274.3
Total assets 1 957.3 2 591.3 2 686.9 2 711.2
Share capital 7.9 7.9 7.9 6.7
Other equity 447.7 1 077.4 1 121.6 1 070.3
Total equity 455.6 1 085.3 1 129.5 1 077.0
Interest-free long-term liabilities 67.9 68.2 62.2 102.1
Interest-bearing long-term debt 1 329.0 1 335.7 1 342.9 1 373.3
Total long-term liabilities 1 396.9 1 403.9 1 405.1 1 475.4
Other interest-free current liabilities 86.2 84.2 104.4 105.8
Current portion of long-term debt 18.6 17.9 47.9 53.0
Total current liabilities 104.8 102.1 152.3 158.8
Total equity and liabilities 1 957.3 2 591.3 2 686.9 2 711.2


![2016-08-30 Company presentation Clarksons [Read-Only] Filer/Presentations... · Company presentation. Disclaimer All statements in this presentation other than statements of historical](https://img.pdfslide.us/doc/110x75/5d66ea8388c99356168ba42b/2016-08-30-company-presentation-clarksons-read-only-company-presentation.jpg)