Embed Size (px)
Citation preview
Company Overview
Presentation prepared for Bolsa de Santiago - MILA’s Conference
Fernando Hasenberg – CFOO
Santiago, Chile
June 2012
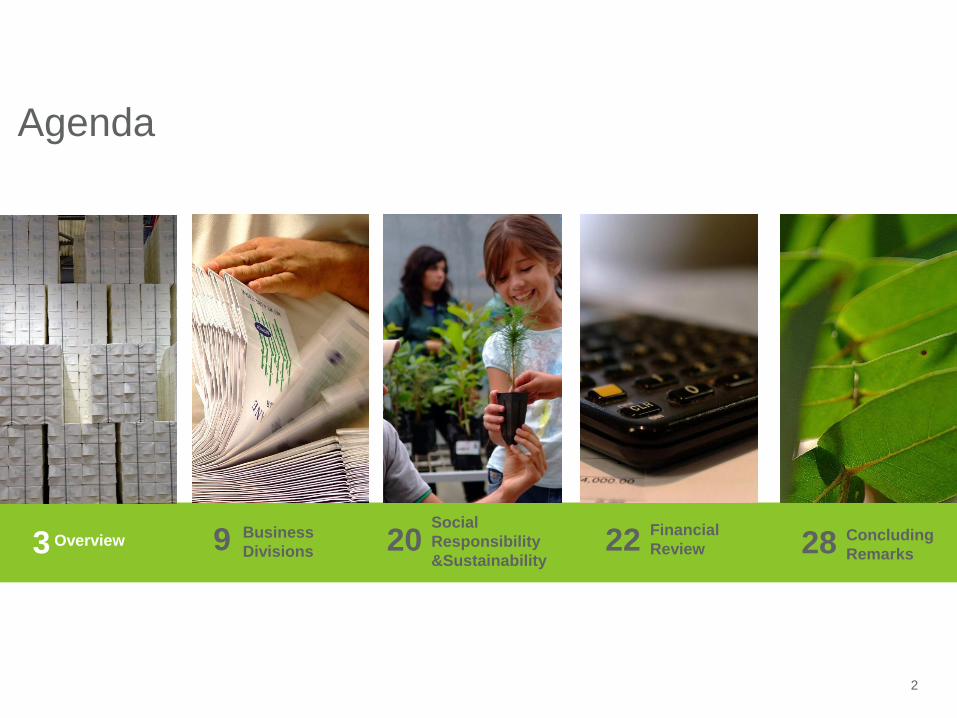
Agenda
Overview 3
2
9 Business
Divisions 20 Social
Responsibility
&Sustainability 22
Financial
Review 28 Concluding
Remarks
3
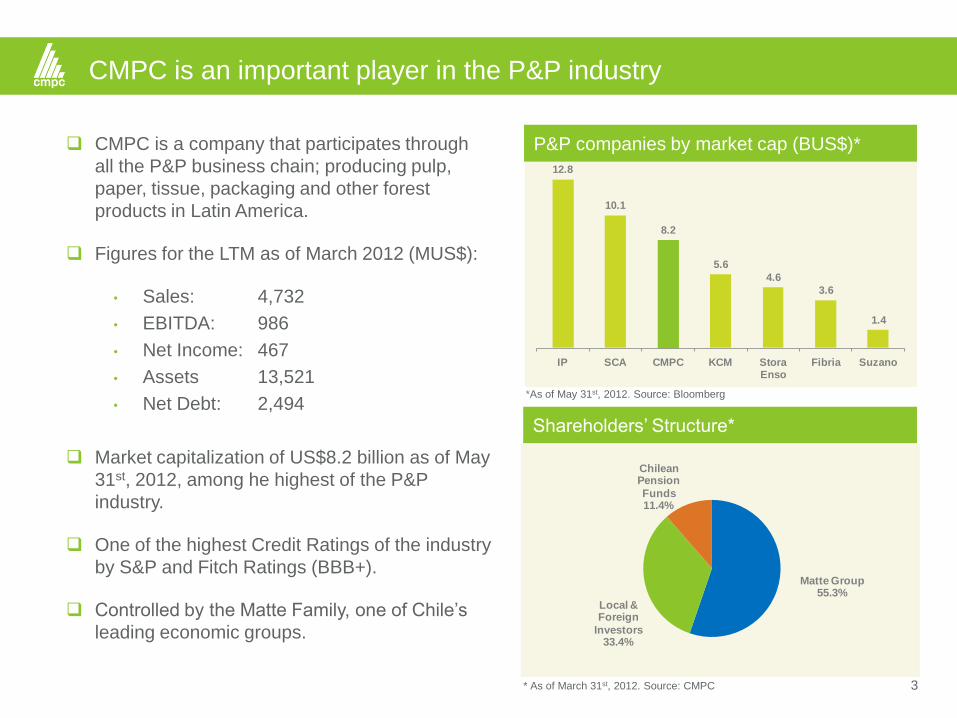
CMPC is an important player in the P&P industry
Shareholders’ Structure*
CMPC is a company that participates through
all the P&P business chain; producing pulp,
paper, tissue, packaging and other forest
products in Latin America.
Figures for the LTM as of March 2012 (MUS$):
• Sales: 4,732
• EBITDA: 986
• Net Income: 467
• Assets 13,521
• Net Debt: 2,494
Market capitalization of US$8.2 billion as of May
31st, 2012, among he highest of the P&P
industry.
One of the highest Credit Ratings of the industry
by S&P and Fitch Ratings (BBB+).
Controlled by the Matte Family, one of Chile’s
leading economic groups.
*As of May 31st, 2012. Source: Bloomberg
* As of March 31st, 2012. Source: CMPC
Matte Group55.3%
Local & Foreign
Investors33.4%
Chilean Pension
Funds11.4%
12.8
10.1
8.2
5.6
4.6
3.6
1.4
IP SCA CMPC KCM Stora Enso
Fibria Suzano
P&P companies by market cap (BUS$)*
4
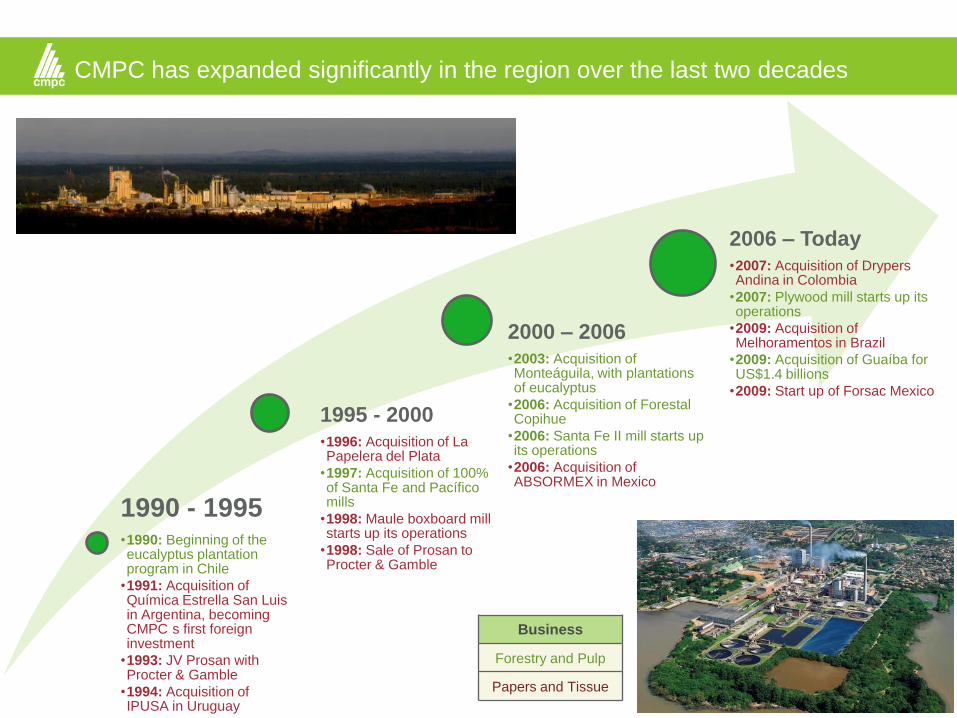
1990 - 1995 •1990: Beginning of the eucalyptus plantation program in Chile
•1991: Acquisition of Química Estrella San Luis in Argentina, becoming CMPC s first foreign investment
•1993: JV Prosan with Procter & Gamble
•1994: Acquisition of IPUSA in Uruguay
1995 - 2000 •1996: Acquisition of La Papelera del Plata
•1997: Acquisition of 100% of Santa Fe and Pacífico mills
•1998: Maule boxboard mill starts up its operations
•1998: Sale of Prosan to Procter & Gamble
2000 – 2006 •2003: Acquisition of Monteáguila, with plantations of eucalyptus
•2006: Acquisition of Forestal Copihue
•2006: Santa Fe II mill starts up its operations
•2006: Acquisition of ABSORMEX in Mexico
2006 – Today •2007: Acquisition of Drypers Andina in Colombia
•2007: Plywood mill starts up its operations
•2009: Acquisition of Melhoramentos in Brazil
•2009: Acquisition of Guaíba for US$1.4 billions
•2009: Start up of Forsac Mexico
CMPC has expanded significantly in the region over the last two decades
Business
Forestry and Pulp
Papers and Tissue
5
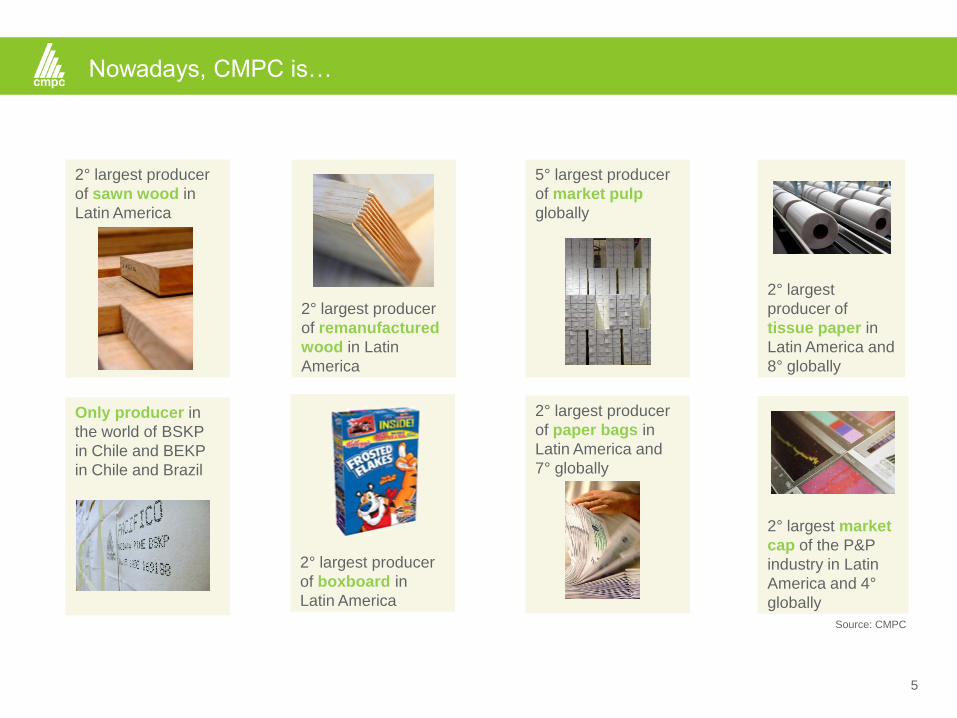
Nowadays, CMPC is…
2° largest producer
of sawn wood in
Latin America
2° largest producer
of remanufactured
wood in Latin
America
5° largest producer
of market pulp
globally
2° largest
producer of
tissue paper in
Latin America and
8° globally
2° largest producer
of boxboard in
Latin America
2° largest producer
of paper bags in
Latin America and
7° globally
2° largest market
cap of the P&P
industry in Latin
America and 4°
globally
Only producer in
the world of BSKP
in Chile and BEKP
in Chile and Brazil
Source: CMPC
6
Plywood
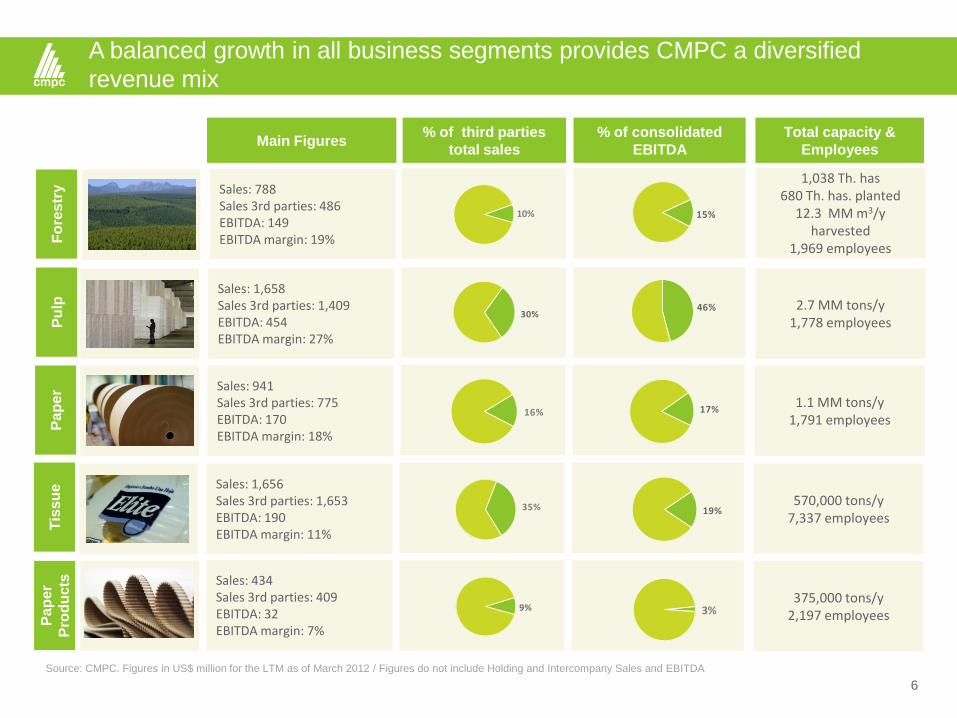
A balanced growth in all business segments provides CMPC a diversified
revenue mix
10%
30%
16%
35%
9%
Source: CMPC. Figures in US$ million for the LTM as of March 2012 / Figures do not include Holding and Intercompany Sales and EBITDA
1.1 MM tons/y
500,000 tons/y
Main Figures % of third parties
total sales
% of consolidated
EBITDA
Total capacity &
Employees
Fo
res
try
Pu
lp
Pap
er
Tis
su
e
Pap
er
Pro
du
cts
Sales: 788 Sales 3rd parties: 486 EBITDA: 149 EBITDA margin: 19%
1,038 Th. has 680 Th. has. planted
12.3 MM m3/y harvested
1,969 employees
Sales: 1,658 Sales 3rd parties: 1,409 EBITDA: 454 EBITDA margin: 27%
2.7 MM tons/y 1,778 employees
Sales: 941 Sales 3rd parties: 775 EBITDA: 170 EBITDA margin: 18%
1.1 MM tons/y 1,791 employees
Sales: 1,656 Sales 3rd parties: 1,653 EBITDA: 190 EBITDA margin: 11%
570,000 tons/y 7,337 employees
Sales: 434 Sales 3rd parties: 409 EBITDA: 32 EBITDA margin: 7%
375,000 tons/y 2,197 employees
15%
19%
46%
17%
3%
7
Plywood
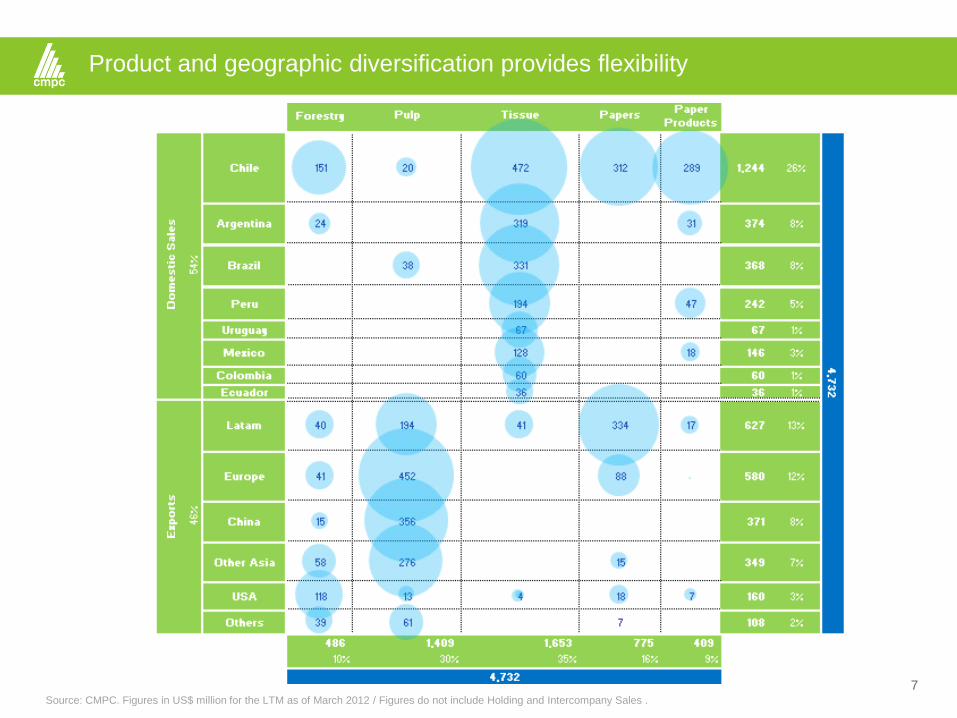
Product and geographic diversification provides flexibility
Source: CMPC. Figures in US$ million for the LTM as of March 2012 / Figures do not include Holding and Intercompany Sales .
Agenda
Overview 3
8
9 Business
Divisions 20 Social
Responsibility
&Sustainability 22
Financial
Review 28 Concluding
Remarks
9
Plywood
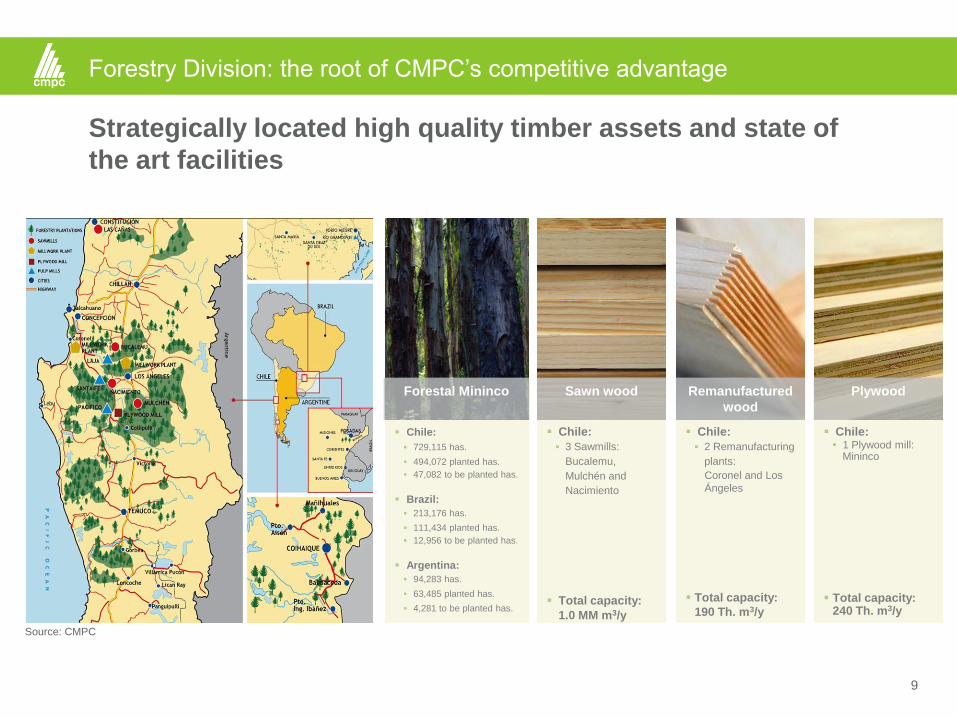
Forestry Division: the root of CMPC’s competitive advantage
Forestal Mininco
Chile:
729,115 has.
494,072 planted has.
47,082 to be planted has.
Brazil:
213,176 has.
111,434 planted has.
12,956 to be planted has.
Argentina:
94,283 has.
63,485 planted has.
4,281 to be planted has.
Chile:
3 Sawmills:
Bucalemu,
Mulchén and
Nacimiento
Total capacity:
1.0 MM m3/y
Strategically located high quality timber assets and state of
the art facilities
Sawn wood
Chile:
2 Remanufacturing
plants:
Coronel and Los
Ángeles
Total capacity:
190 Th. m3/y
Remanufactured
wood
Chile: • 1 Plywood mill:
Mininco
Total capacity: 240 Th. m3/y
Plywood
Source: CMPC
10
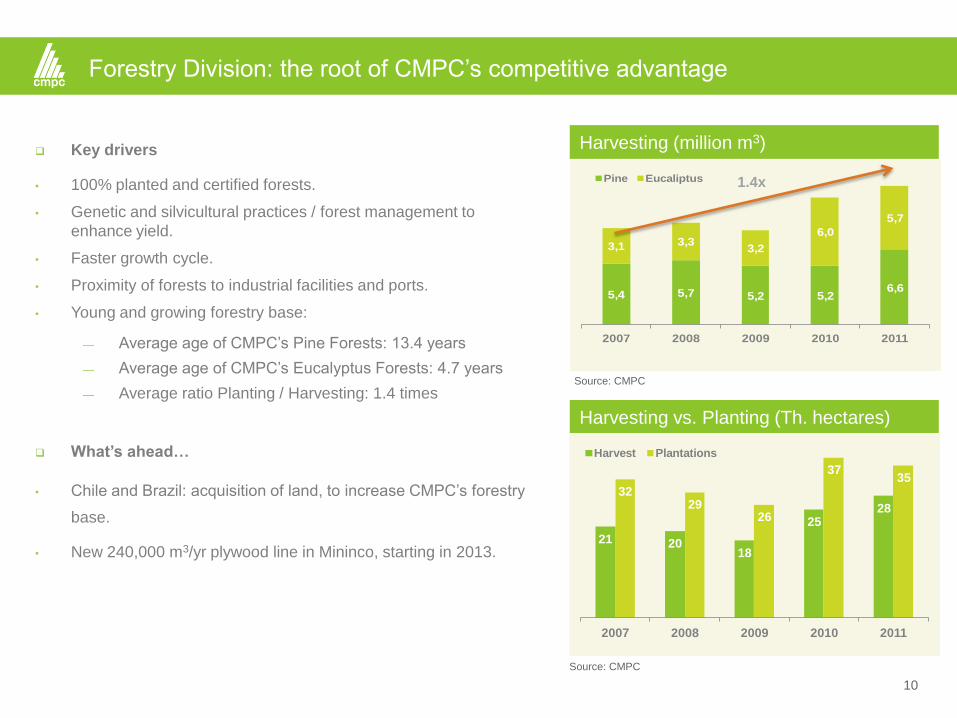
Forestry Division: the root of CMPC’s competitive advantage
What’s ahead…
• Chile and Brazil: acquisition of land, to increase CMPC’s forestry
base.
• New 240,000 m3/yr plywood line in Mininco, starting in 2013.
Key drivers
• 100% planted and certified forests.
• Genetic and silvicultural practices / forest management to
enhance yield.
• Faster growth cycle.
• Proximity of forests to industrial facilities and ports.
• Young and growing forestry base:
— Average age of CMPC’s Pine Forests: 13.4 years
— Average age of CMPC’s Eucalyptus Forests: 4.7 years
— Average ratio Planting / Harvesting: 1.4 times
5,4 5,7 5,2 5,26,6
3,1 3,33,2
6,0
5,7
2007 2008 2009 2010 2011
Pine Eucaliptus
Harvesting (million m3)
1.4x
Harvesting vs. Planting (Th. hectares)
21 2018
2528
3229
26
3735
2007 2008 2009 2010 2011
Harvest Plantations
Source: CMPC
Source: CMPC
11
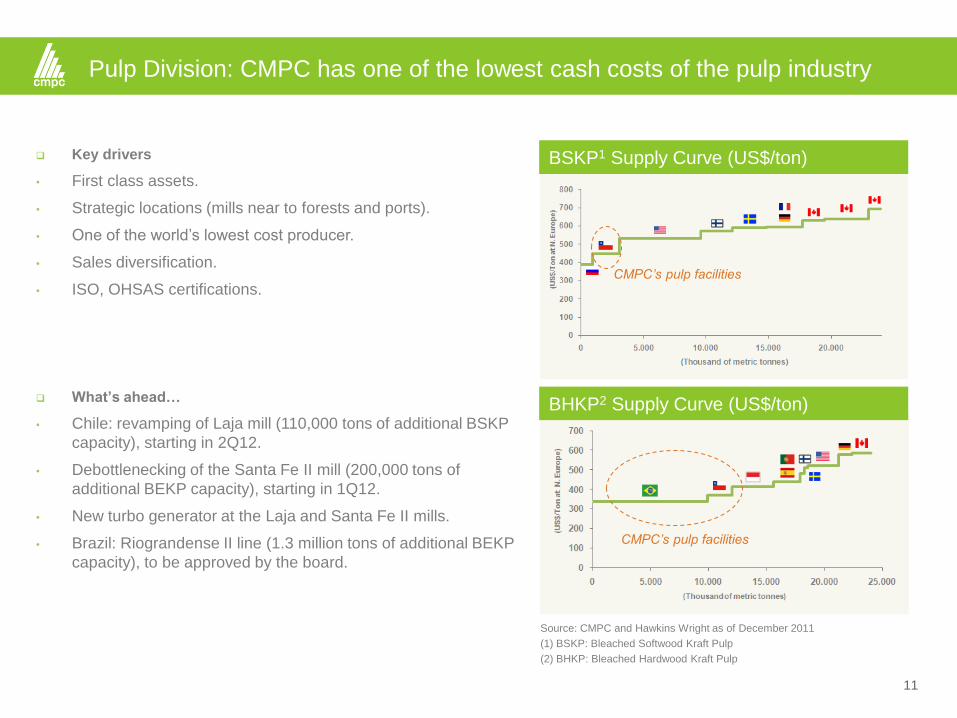
BSKP1 Supply Curve (US$/ton)
Pulp Division: CMPC has one of the lowest cash costs of the pulp industry
Key drivers
• First class assets.
• Strategic locations (mills near to forests and ports).
• One of the world’s lowest cost producer.
• Sales diversification.
• ISO, OHSAS certifications.
What’s ahead…
• Chile: revamping of Laja mill (110,000 tons of additional BSKP
capacity), starting in 2Q12.
• Debottlenecking of the Santa Fe II mill (200,000 tons of
additional BEKP capacity), starting in 1Q12.
• New turbo generator at the Laja and Santa Fe II mills.
• Brazil: Riograndense II line (1.3 million tons of additional BEKP
capacity), to be approved by the board.
BHKP2 Supply Curve (US$/ton)
Source: CMPC and Hawkins Wright as of December 2011
(1) BSKP: Bleached Softwood Kraft Pulp
(2) BHKP: Bleached Hardwood Kraft Pulp
CMPC’s pulp facilities
CMPC’s pulp facilities
12
Plywood
Pulp Division: CMPC has one of the lowest cash costs of the pulp industry
Chile
2 mills:
Pacífico (Pine)
Laja (Pine)
Total Capacity : 760 Th. tons/y
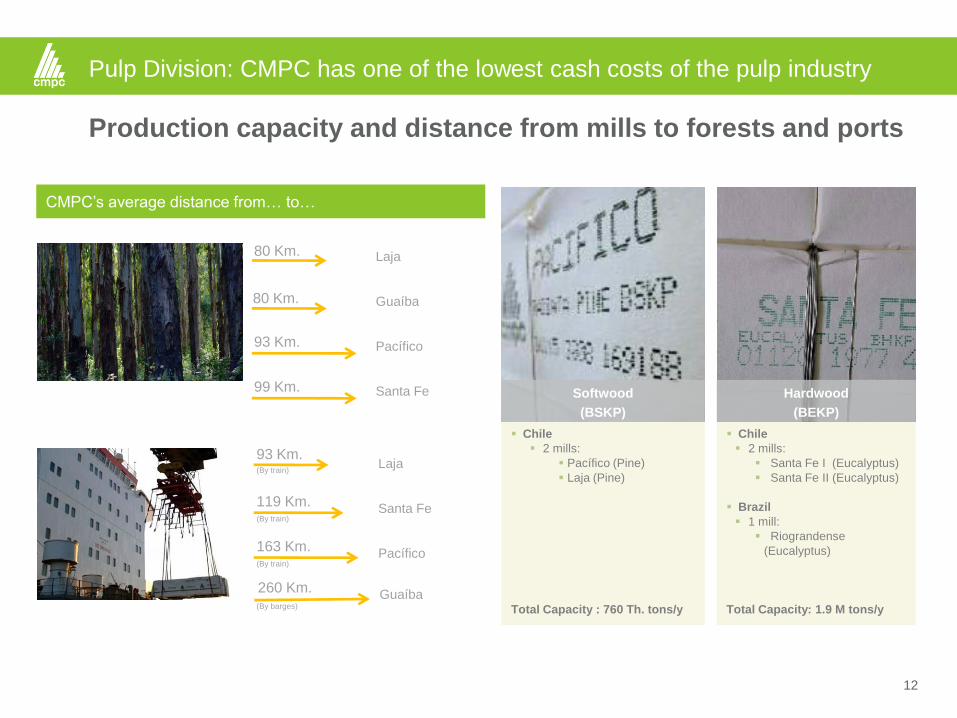
Production capacity and distance from mills to forests and ports
Softwood
(BSKP)
Chile
2 mills:
Santa Fe I (Eucalyptus)
Santa Fe II (Eucalyptus)
Brazil
1 mill:
Riograndense
(Eucalyptus)
Total Capacity: 1.9 M tons/y
Hardwood
(BEKP)
Santa Fe
Laja
Pacífico 163 Km.
93 Km.
119 Km.
Pacífico
Laja
Guaíba 80 Km.
80 Km.
93 Km.
Santa Fe 99 Km.
Guaíba 260 Km.
(By train)
(By train)
(By train)
(By barges)
CMPC’s average distance from… to…
13
Plywood
1
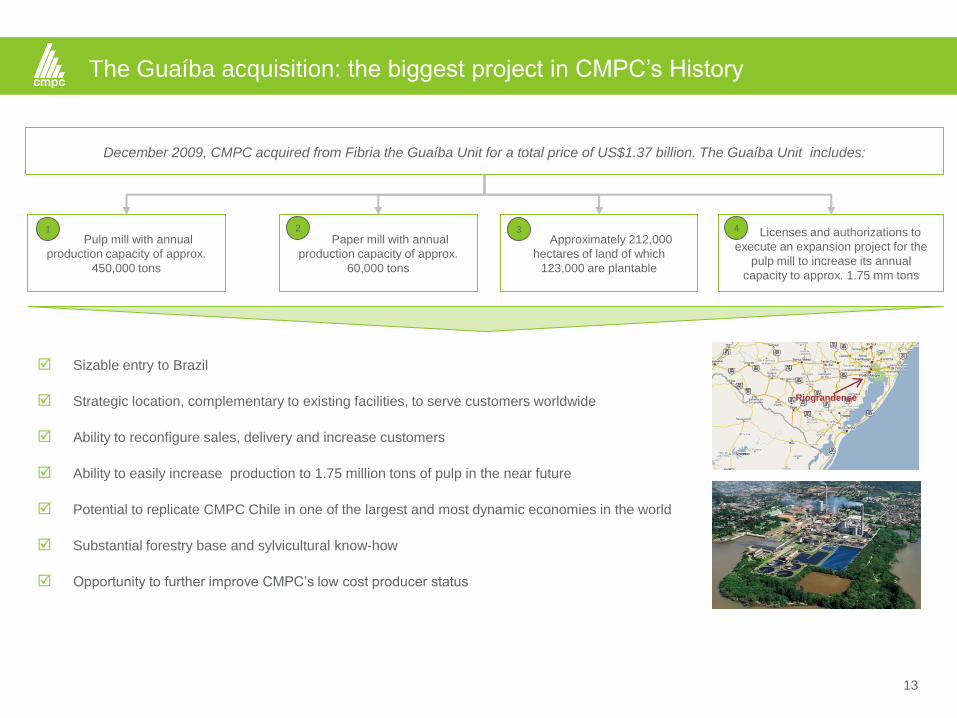
December 2009, CMPC acquired from Fibria the Guaíba Unit for a total price of US$1.37 billion. The Guaíba Unit includes:
Sizable entry to Brazil
Strategic location, complementary to existing facilities, to serve customers worldwide
Ability to reconfigure sales, delivery and increase customers
Ability to easily increase production to 1.75 million tons of pulp in the near future
Potential to replicate CMPC Chile in one of the largest and most dynamic economies in the world
Substantial forestry base and sylvicultural know-how
Opportunity to further improve CMPC’s low cost producer status
The Guaíba acquisition: the biggest project in CMPC’s History
Pulp mill with annual
production capacity of approx.
450,000 tons
Paper mill with annual
production capacity of approx.
60,000 tons
Approximately 212,000
hectares of land of which
123,000 are plantable
Licenses and authorizations to
execute an expansion project for the
pulp mill to increase its annual
capacity to approx. 1.75 mm tons
2 3 4
Riograndense
14
Plywood
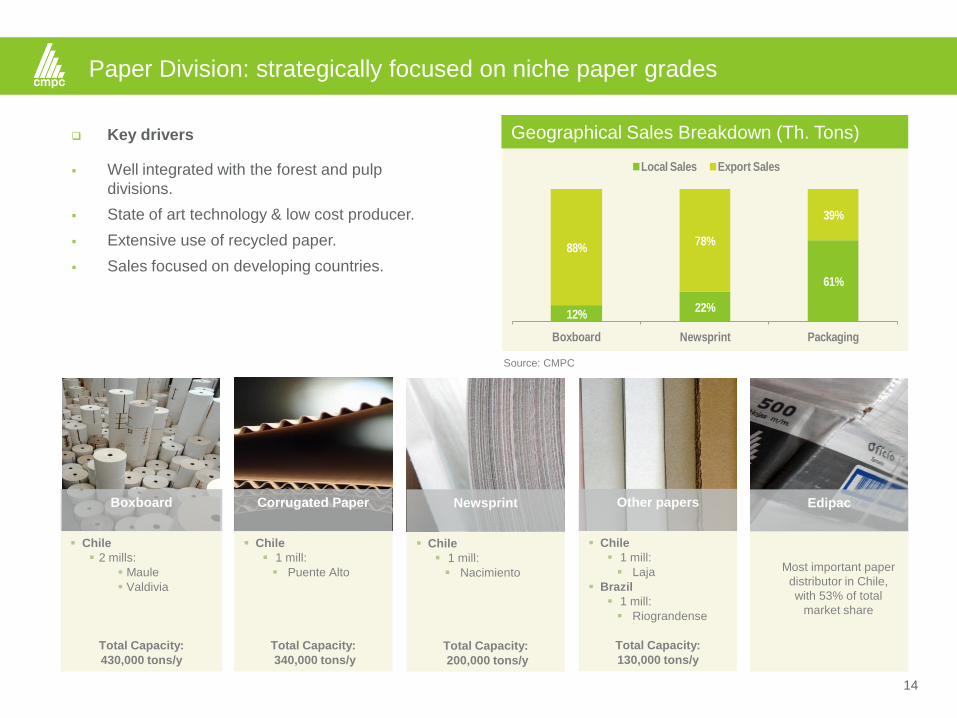
Paper Division: strategically focused on niche paper grades
Chile
2 mills:
Maule
Valdivia
Total Capacity:
430,000 tons/y
Boxboard
Chile
1 mill:
Puente Alto
Total Capacity:
340,000 tons/y
Corrugated Paper
Chile
1 mill:
Nacimiento
Total Capacity:
200,000 tons/y
Newsprint
Chile
1 mill:
Laja
Brazil
1 mill:
Riograndense
Total Capacity:
130,000 tons/y
Other papers
Most important paper
distributor in Chile,
with 53% of total
market share
Edipac
Key drivers
Well integrated with the forest and pulp
divisions.
State of art technology & low cost producer.
Extensive use of recycled paper.
Sales focused on developing countries.
Geographical Sales Breakdown (Th. Tons)
Source: CMPC
12%22%
61%
88%78%
39%
Boxboard Newsprint Packaging
Local Sales Export Sales
15
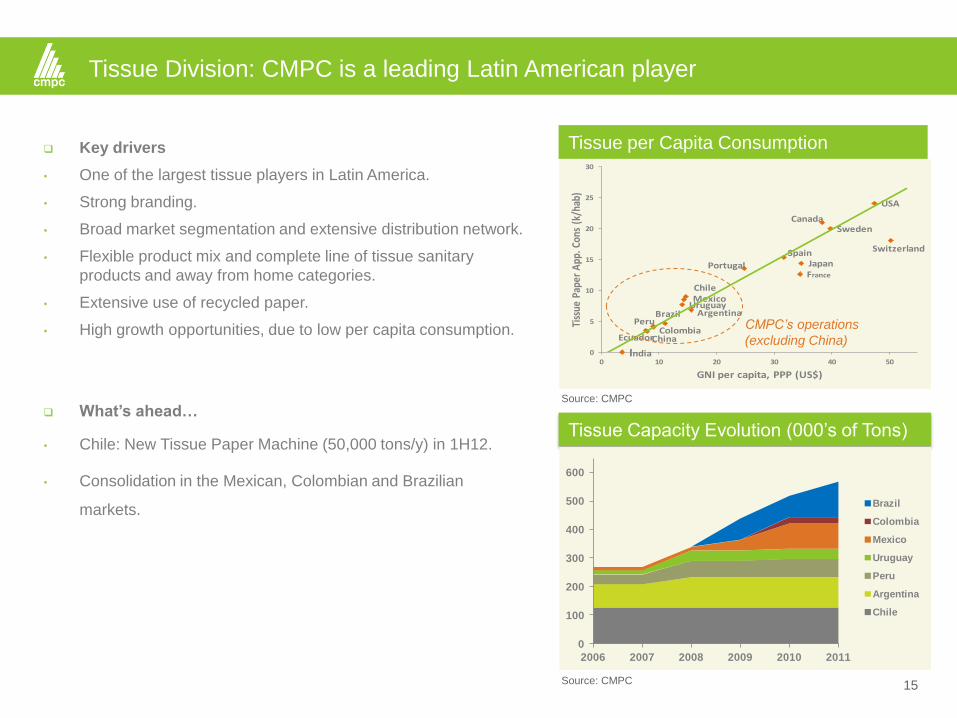
Tissue Division: CMPC is a leading Latin American player
Key drivers
• One of the largest tissue players in Latin America.
• Strong branding.
• Broad market segmentation and extensive distribution network.
• Flexible product mix and complete line of tissue sanitary
products and away from home categories.
• Extensive use of recycled paper.
• High growth opportunities, due to low per capita consumption.
What’s ahead…
• Chile: New Tissue Paper Machine (50,000 tons/y) in 1H12.
• Consolidation in the Mexican, Colombian and Brazilian
markets.
Tissue Capacity Evolution (000’s of Tons)
Tissue per Capita Consumption
India
ChinaEcuador
PeruColombia
BrazilUruguayMexicoChile
Argentina
Portugal
Spain
France
Japan
CanadaSweden
USA
Switzerland
0
5
10
15
20
25
30
0 10 20 30 40 50
Tiss
ue P
aper
App
. Con
s (k
/hab
)
GNI per capita, PPP (US$)
0
100
200
300
400
500
600
2006 2007 2008 2009 2010 2011
Brazil
Colombia
Mexico
Uruguay
Peru
Argentina
Chile
Source: CMPC
Source: CMPC
CMPC’s operations
(excluding China)
16
Plywood
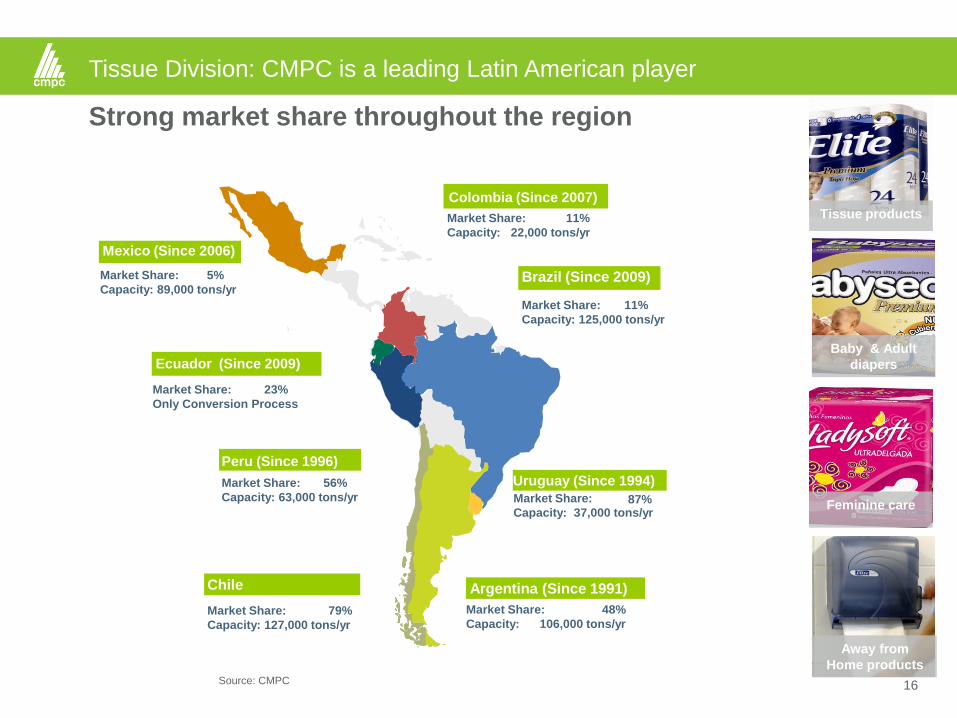
Tissue Division: CMPC is a leading Latin American player
Strong market share throughout the region
Market Share:
Capacity: 89,000 tons/yr
5%
Mexico (Since 2006)
Colombia (Since 2007)
Market Share:
Capacity: 125,000 tons/yr
11%
Brazil (Since 2009)
Market Share:
Capacity: 37,000 tons/yr 87%
Market Share:
Only Conversion Process
23%
Ecuador (Since 2009)
Market Share:
Capacity: 63,000 tons/yr
56%
Peru (Since 1996)
Market Share:
Capacity: 127,000 tons/yr
79%
Chile
Market Share:
Capacity: 106,000 tons/yr
48%
Argentina (Since 1991)
Market Share: 11%
Capacity: 22,000 tons/yr
Uruguay (Since 1994)
Tissue products
Baby & Adult
diapers
Feminine care
Away from
Home products Source: CMPC
17
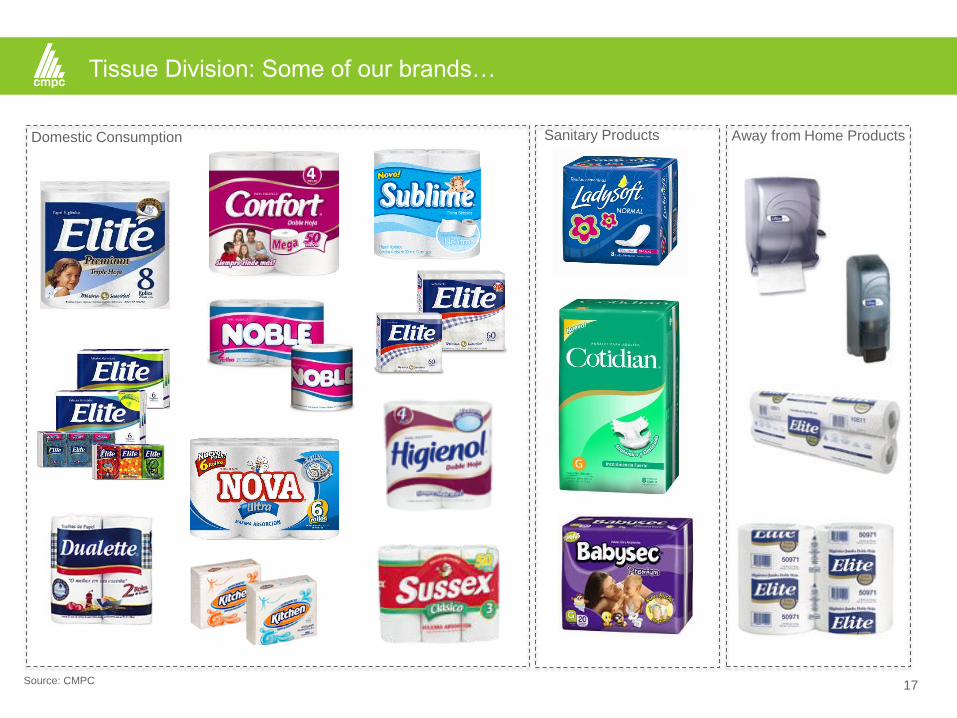
Tissue Division: Some of our brands…
Domestic Consumption Sanitary Products Away from Home Products
Source: CMPC
18
Plywood
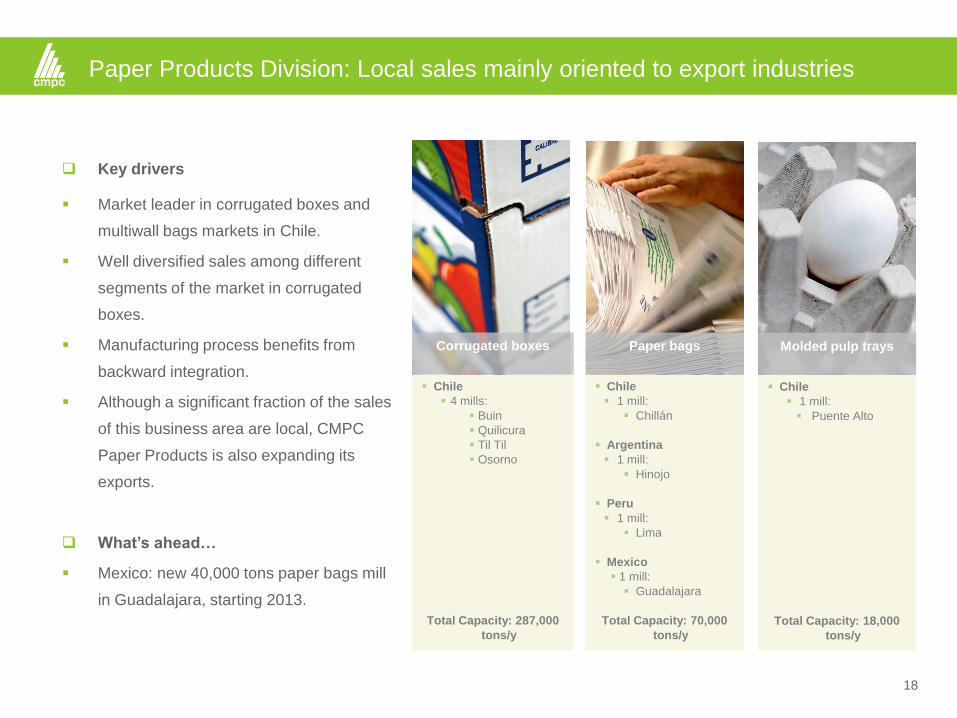
Paper Products Division: Local sales mainly oriented to export industries
Chile
4 mills:
Buin
Quilicura
Til Til
Osorno
Total Capacity: 287,000
tons/y
Corrugated boxes
Chile
1 mill:
Chillán
Argentina
1 mill:
Hinojo
Peru
1 mill:
Lima
Mexico
1 mill:
Guadalajara
Total Capacity: 70,000
tons/y
Paper bags
Chile
1 mill:
Puente Alto
Total Capacity: 18,000
tons/y
Molded pulp trays
Key drivers
Market leader in corrugated boxes and
multiwall bags markets in Chile.
Well diversified sales among different
segments of the market in corrugated
boxes.
Manufacturing process benefits from
backward integration.
Although a significant fraction of the sales
of this business area are local, CMPC
Paper Products is also expanding its
exports.
What’s ahead…
Mexico: new 40,000 tons paper bags mill
in Guadalajara, starting 2013.
Agenda
Overview 3
19
9 Business
Divisions 20 Social
Responsibility
&Sustainability 22
Financial
Review 28 Concluding
Remarks
20
Plywood
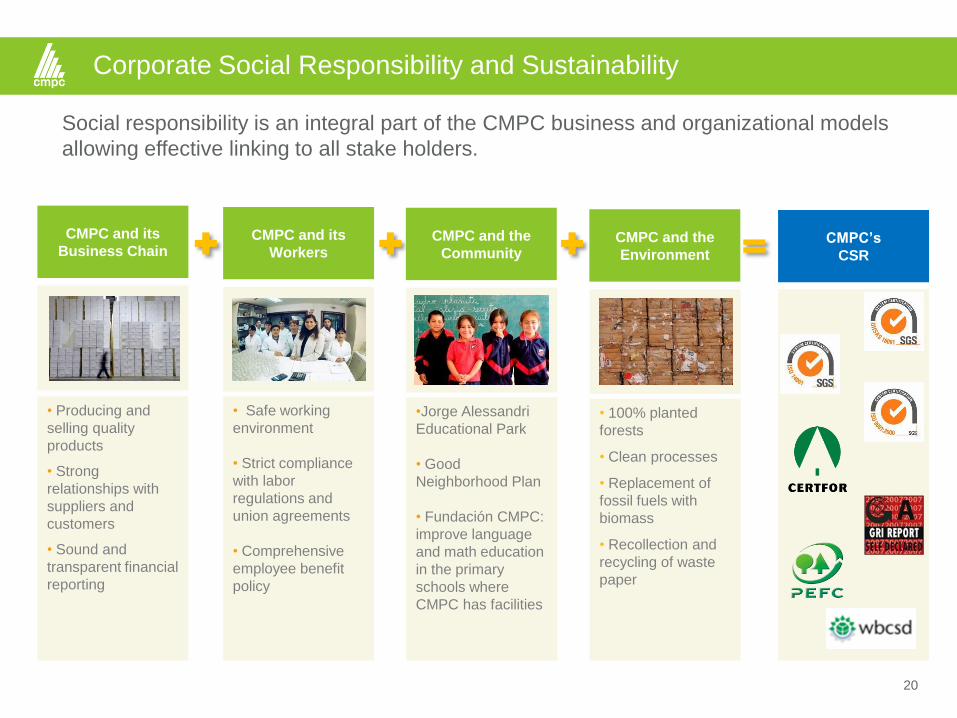
Corporate Social Responsibility and Sustainability
Social responsibility is an integral part of the CMPC business and organizational models
allowing effective linking to all stake holders.
CMPC and its
Business Chain
• Producing and
selling quality
products
• Strong
relationships with
suppliers and
customers
• Sound and
transparent financial
reporting
CMPC and its
Workers
• Safe working
environment
• Strict compliance
with labor
regulations and
union agreements
• Comprehensive
employee benefit
policy
CMPC and the
Community
•Jorge Alessandri
Educational Park
• Good
Neighborhood Plan
• Fundación CMPC:
improve language
and math education
in the primary
schools where
CMPC has facilities
CMPC and the
Environment
• 100% planted
forests
• Clean processes
• Replacement of
fossil fuels with
biomass
• Recollection and
recycling of waste
paper
CMPC’s
CSR

Agenda
Overview 3
21
9 Business
Divisions 20 Social
Responsibility
&Sustainability 22
Financial
Review 28 Concluding
Remarks
22
Plywood
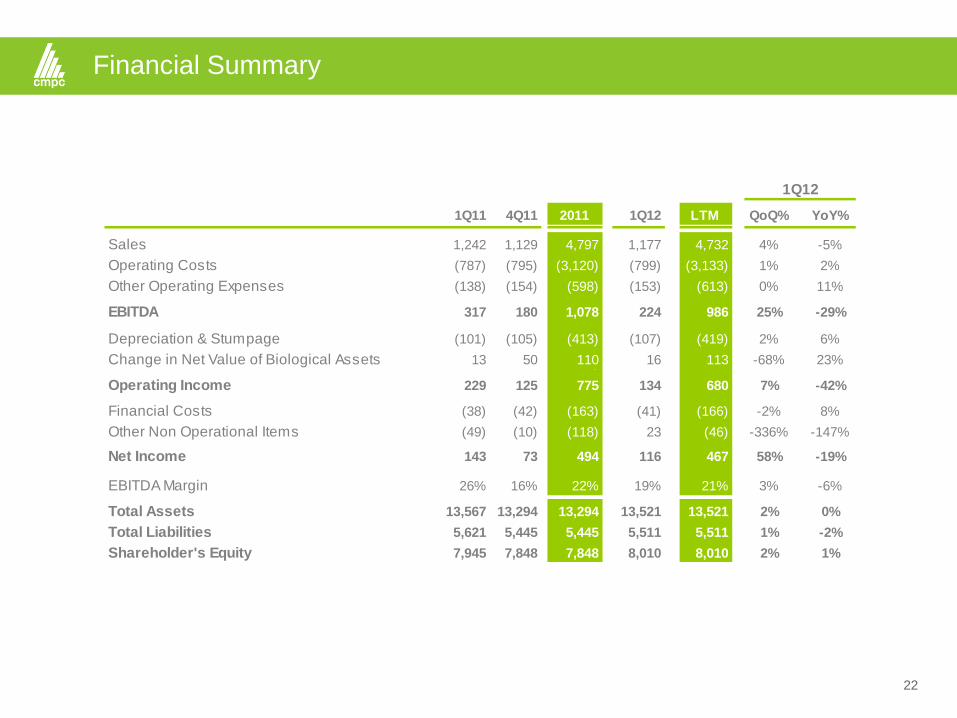
Financial Summary
1Q11 4Q11 2011 1Q12 LTM QoQ% YoY%
Sales 1,242 1,129 4,797 1,177 4,732 4% -5%
Operating Costs (787) (795) (3,120) (799) (3,133) 1% 2%
Other Operating Expenses (138) (154) (598) (153) (613) 0% 11%0
EBITDA 317 180 1,078 224 986 25% -29%
Depreciation & Stumpage (101) (105) (413) (107) (419) 2% 6%
Change in Net Value of Biological Assets 13 50 110 16 113 -68% 23%0
Operating Income 229 125 775 134 680 7% -42%0
Financial Costs (38) (42) (163) (41) (166) -2% 8%
Other Non Operational Items (49) (10) (118) 23 (46) -336% -147%0
Net Income 143 73 494 116 467 58% -19%
EBITDA Margin 26% 16% 22% 19% 21% 3% -6%
Total Assets 13,567 13,294 13,294 13,521 13,521 2% 0%
Total Liabilities 5,621 5,445 5,445 5,511 5,511 1% -2%
Shareholder's Equity 7,945 7,848 7,848 8,010 8,010 2% 1%
1Q12
23
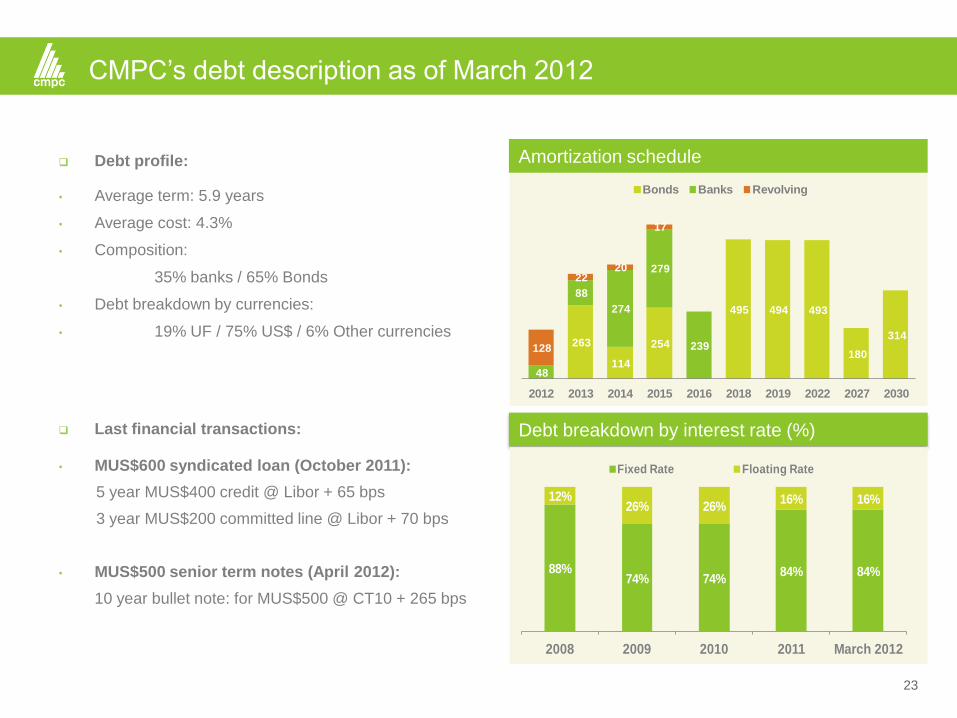
CMPC’s debt description as of March 2012
Last financial transactions:
• MUS$600 syndicated loan (October 2011):
5 year MUS$400 credit @ Libor + 65 bps
3 year MUS$200 committed line @ Libor + 70 bps
• MUS$500 senior term notes (April 2012):
10 year bullet note: for MUS$500 @ CT10 + 265 bps
Debt profile:
• Average term: 5.9 years
• Average cost: 4.3%
• Composition:
35% banks / 65% Bonds
• Debt breakdown by currencies:
• 19% UF / 75% US$ / 6% Other currencies
Debt breakdown by interest rate (%)
Amortization schedule
88%74% 74%
84% 84%
12%26% 26%
16% 16%
2008 2009 2010 2011 March 2012
Fixed Rate Floating Rate
263
114
254
495 494 493
180
314
48
88
274
279
239 128
22 20
17
2012 2013 2014 2015 2016 2018 2019 2022 2027 2030
Bonds Banks Revolving
24
Plywood
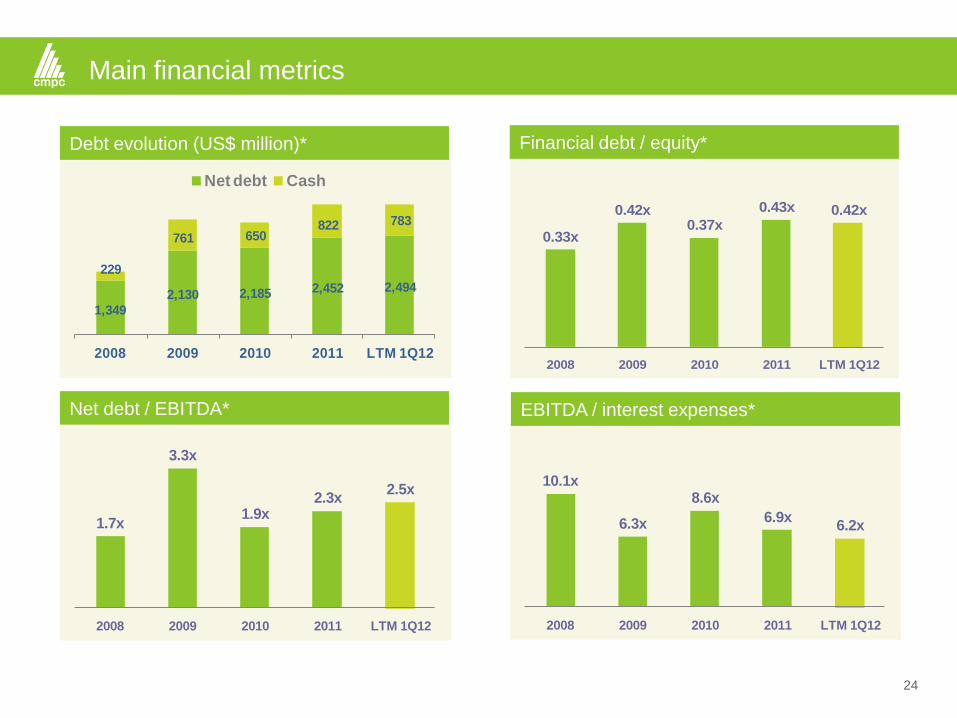
Main financial metrics
Debt evolution (US$ million)*
1,349
2,130 2,185 2,452 2,494
229
761 650822 783
2008 2009 2010 2011 LTM 1Q12
Net debt Cash
0.33x
0.42x0.37x
0.43x 0.42x
2008 2009 2010 2011 LTM 1Q12
Net debt / EBITDA*
1.7x
3.3x
1.9x2.3x
2.5x
2008 2009 2010 2011 LTM 1Q12
10.1x
6.3x
8.6x
6.9x6.2x
2008 2009 2010 2011 LTM 1Q12
Financial debt / equity*
EBITDA / interest expenses*
25
Plywood
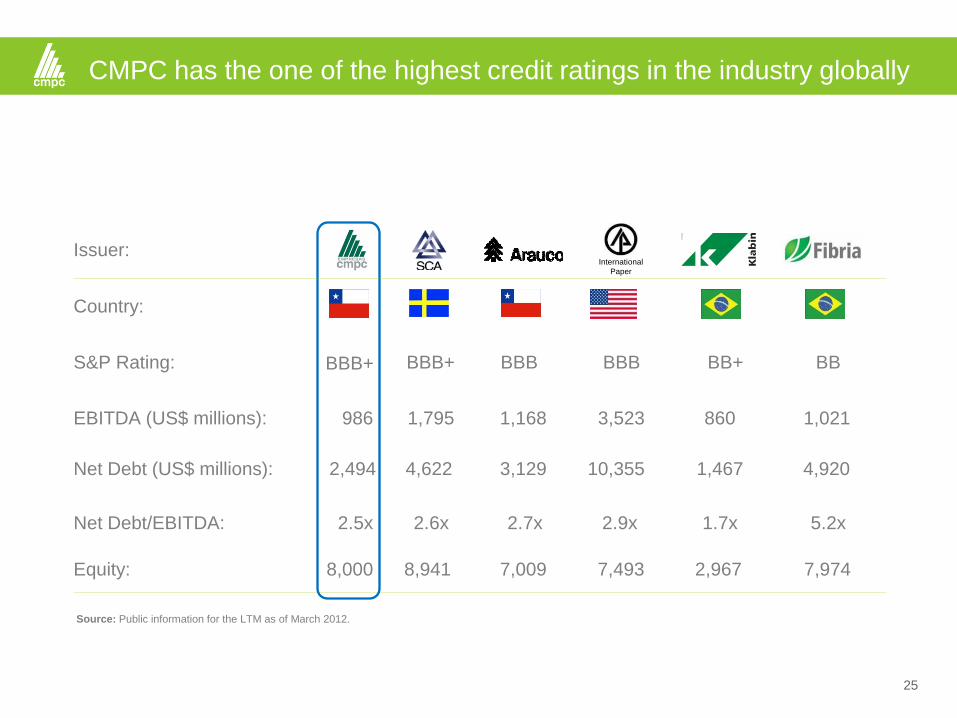
CMPC has the one of the highest credit ratings in the industry globally
Country:
S&P Rating: BBB+ BBB+ BBB BBB BB BB+
EBITDA (US$ millions): 986 1,795 1,168 3,523 1,021 860
Net Debt (US$ millions): 2,494 4,622 3,129 10,355 4,920 1,467
International
Paper
Source: Public information for the LTM as of March 2012.
Issuer:
Net Debt/EBITDA: 2.5x 2.6x 2.7x 2.9x 5.2x 1.7x
Equity: 8,000 8,941 7,009 7,493 7,974 2,967
26
Plywood
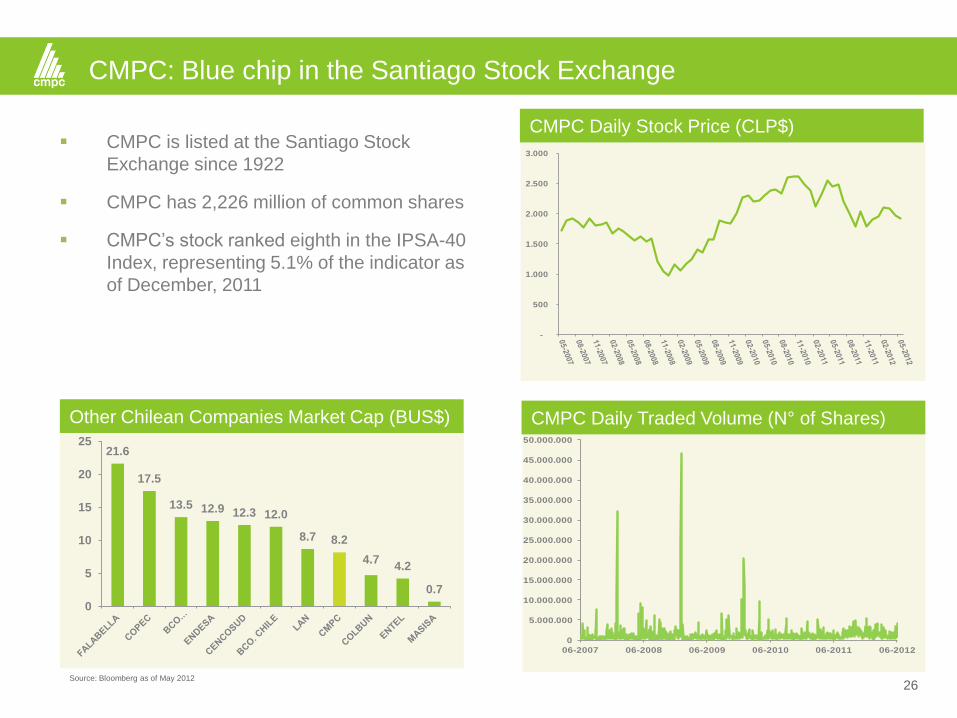
CMPC: Blue chip in the Santiago Stock Exchange
CMPC is listed at the Santiago Stock
Exchange since 1922
CMPC has 2,226 million of common shares
CMPC’s stock ranked eighth in the IPSA-40
Index, representing 5.1% of the indicator as
of December, 2011
CMPC Daily Stock Price (CLP$)
Source: Bloomberg as of May 2012
-
500
1.000
1.500
2.000
2.500
3.000
21.6
17.5
13.5 12.9 12.3 12.0
8.7 8.2
4.7 4.2
0.7
0
5
10
15
20
25
Other Chilean Companies Market Cap (BUS$)
0
5.000.000
10.000.000
15.000.000
20.000.000
25.000.000
30.000.000
35.000.000
40.000.000
45.000.000
50.000.000
06-2007 06-2008 06-2009 06-2010 06-2011 06-2012
CMPC Daily Traded Volume (N° of Shares)
Agenda
Overview 3
27
9 Business
Divisions 20 Social
Responsibility
&Sustainability 22
Financial
Review 28 Concluding
Remarks
28
Investment Highlights
CMPC is:
World class company in the industry.
Low cost producer in most of our product lines.
Products and geographical diversification allows strong cash.
generation in spite of economic and price cycles.
One of the highest rated credits in the industry.
Committed to sustainable growth.
Strong balance sheet prepared for growth opportunities.
Experienced management and strong shareholders.
Q & A
The foregoing material is a presentation of general background information about CMPC’s activities as of the date of the presentation. It is information given in a summary
form and does not purport to be complete. It is not intended to be relied upon as advice to investors or potential investors and does not take into account the investment
objectives, financial situation or needs of any particular investor. These should be considered, with or without professional advice, when deciding if an investment is
appropriate.
Forward Looking Statements
This presentation contains statements that constitute “forward-looking statements” within the meaning of securities laws of applicable jurisdictions. Examples of these
forward-looking statements include, but are not limited to (i) statements regarding our future results of operations and financial condition, (ii) statements of plans, objectives
or goals, and (iii) statements of assumptions underlying those statements. Words such as “may,” “will,” “expect,” “intend,” “plan,” “estimate,” “anticipate,” “believe,”
continue”, “probability,” “risk,” and other similar words are intended to identify forward-looking statements but are not the exclusive means of identifying those statements.
By their very nature, forward-looking statements involve inherent risks and uncertainties, both general and specific, and risks exist that the predictions, forecasts,
projections and other forward-looking statements will not be achieved. We caution readers that a number of important factors could cause actual results to differ materially
from the plans, objectives, expectations, estimates and intentions expressed in such forward-looking statements.

Contact: [email protected]