Embed Size (px)
Citation preview
© Babcock & Wilcox Enterprises, Inc. All rights reserved. 1
August 2016
Company Overview
© Babcock & Wilcox Enterprises, Inc. All rights reserved. 2
Safe Harbor Statement
Forward‐looking statements. Babcock & Wilcox Enterprises, Inc. (“B&W”) cautions that this presentation contains forward‐looking statements, including, without limitation, statements relating to our strategic objectives; management’s expectations regarding the industries in which we operate; our guidance and forecasts for 2016, including estimated annual revenue; our projected operating margin improvements, savings and restructuring costs, including pursuant to our recently announced restructuring plan; growth through acquisitions; our projected tax rate; and our recent acquisition of SPIG S.p.A. (“SPIG”). These forward‐looking statements are based on management’s current expectations and involve a number of risks and uncertainties, including, among other things, our ability to realize anticipated savings and operational benefits from the restructuring plan; our ability to successfully integrate SPIG and realize the expected synergies from the acquisition; our ability to realize the benefits of expected cross‐selling opportunities resulting from the SPIG acquisition; changes in the jurisdictional mix of our income and losses; disruptions experienced with customers and suppliers; adverse changes in the industries in which we operate; changes or termination of contracts in backlog; the timing and amount of repurchases of our common stock, if any; and the inability to grow and diversify through acquisitions. If one or more of these risks or other risks materialize, actual results may vary materially from those expressed. For a more complete discussion of these and other risk factors, see B&W’s filings with the Securities and Exchange Commission, including our most recent annual report on Form 10‐K and subsequent quarterly reports on Form 10‐Q. B&W cautions not to place undue reliance on these forward‐looking statements, which speak only as of the date of this presentation, and undertake no obligation to update or revise any forward‐looking statement, except to the extent required by applicable law.
Non‐GAAP financial information. This presentation includes Adjusted Operating Income and Adjusted Earnings per Share as non‐GAAP financial measures. A reconciliation of Adjusted Operating Income and Adjusted Earnings per Share to the most directly comparable GAAP measures is included at the end of this presentation. These measures should be considered in addition to results prepared in accordance with GAAP, but are not a substitute for GAAP results.
© Babcock & Wilcox Enterprises, Inc. All rights reserved. 3
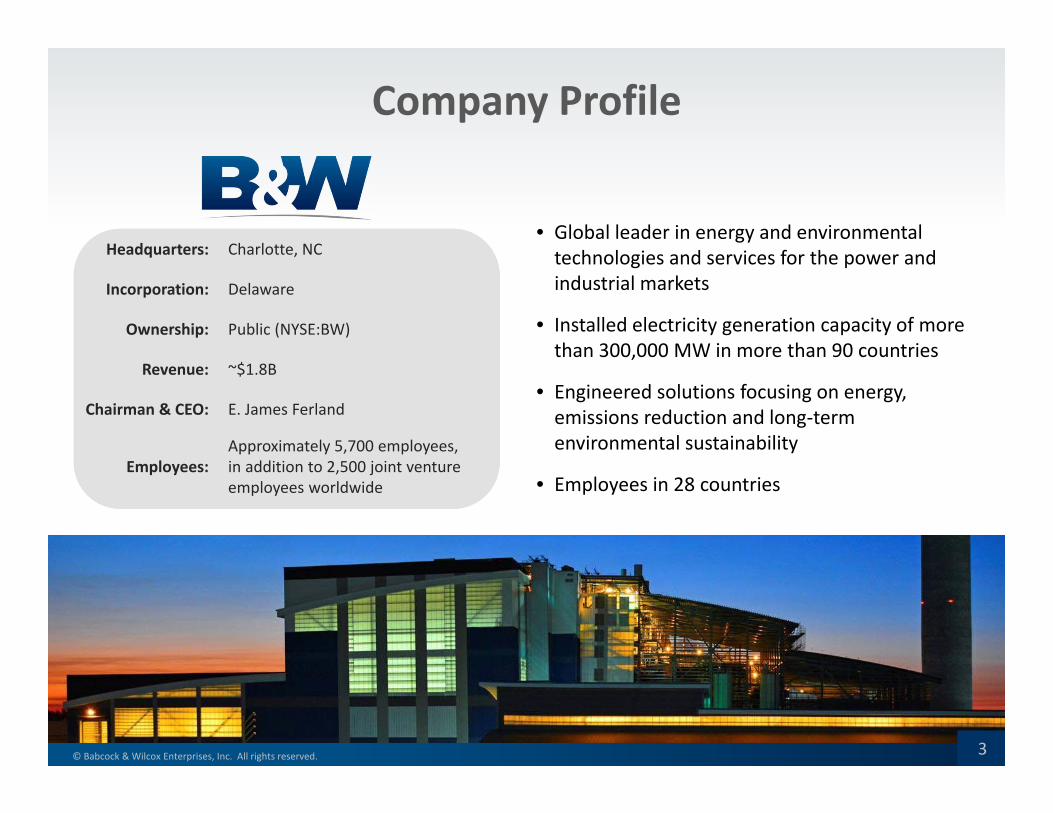
Company Profile
Headquarters: Charlotte, NC
Incorporation: Delaware
Ownership: Public (NYSE:BW)
Revenue: ~$1.8B
Chairman & CEO: E. James Ferland
Employees:Approximately 5,700 employees, in addition to 2,500 joint venture employees worldwide
• Global leader in energy and environmental technologies and services for the power and industrial markets
• Installed electricity generation capacity of more than 300,000 MW in more than 90 countries
• Engineered solutions focusing on energy, emissions reduction and long‐term environmental sustainability
• Employees in 28 countries
3
© Babcock & Wilcox Enterprises, Inc. All rights reserved. 4
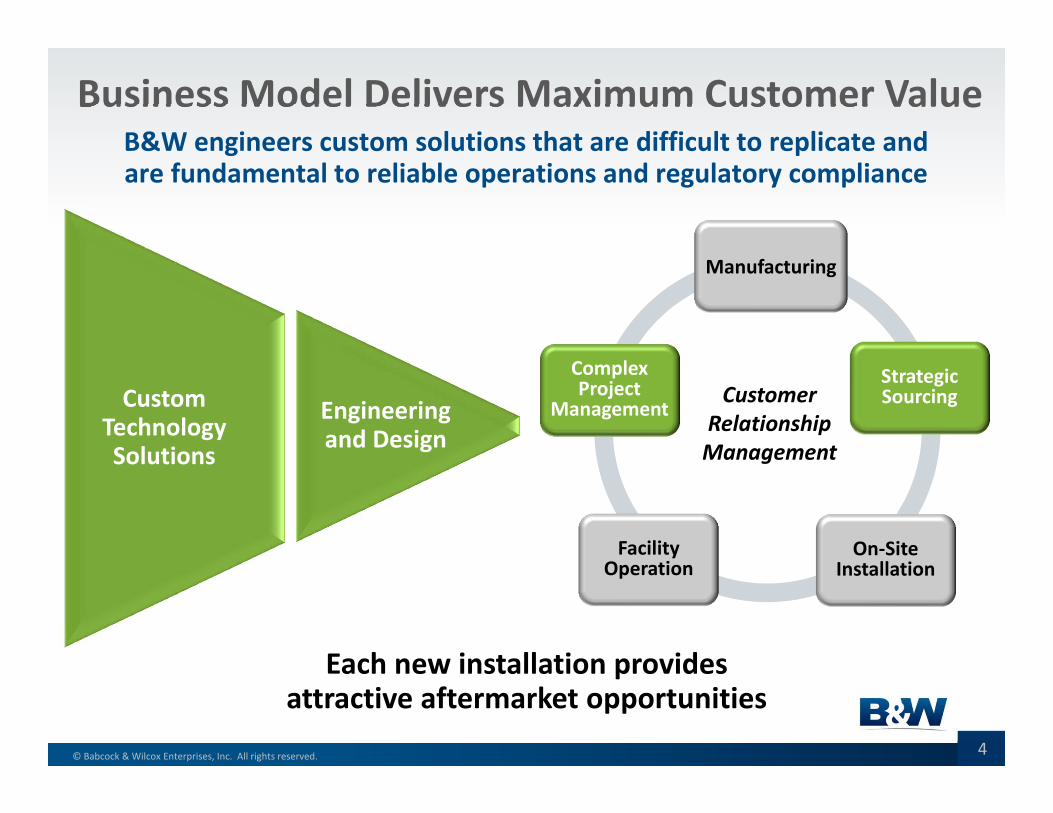
Business Model Delivers Maximum Customer ValueB&W engineers custom solutions that are difficult to replicate and are fundamental to reliable operations and regulatory compliance
Engineering and Design
Custom Technology Solutions
Facility Operation
Strategic Sourcing
Manufacturing
On‐Site Installation
Complex Project
ManagementCustomer
Relationship Management
Each new installation provides attractive aftermarket opportunities
© Babcock & Wilcox Enterprises, Inc. All rights reserved. 5
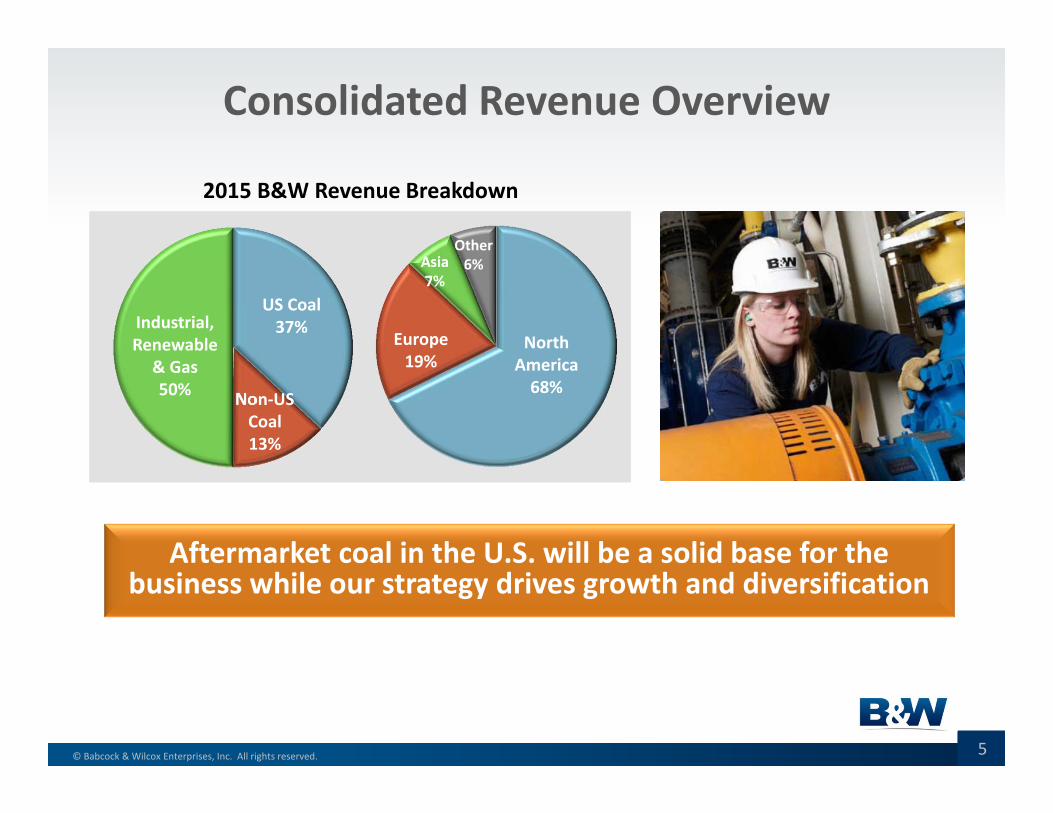
Consolidated Revenue Overview
2015 B&W Revenue Breakdown
US Coal37%
Non‐US Coal13%
Industrial, Renewable
& Gas50%
North America68%
Europe19%
Asia7%
Other6%
Aftermarket coal in the U.S. will be a solid base for the business while our strategy drives growth and diversification
© Babcock & Wilcox Enterprises, Inc. All rights reserved. 6
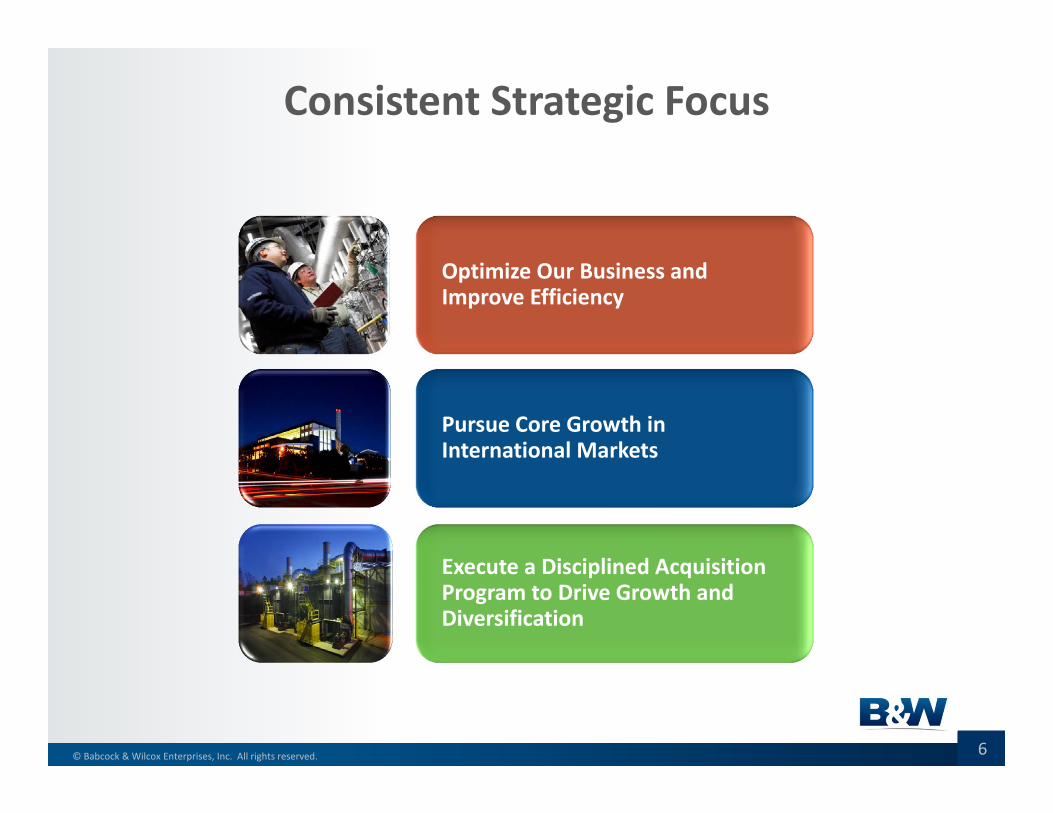
Optimize Our Business and Improve Efficiency
Pursue Core Growth in International Markets
Execute a Disciplined Acquisition Program to Drive Growth and Diversification
Consistent Strategic Focus
© Babcock & Wilcox Enterprises, Inc. All rights reserved. 7
c
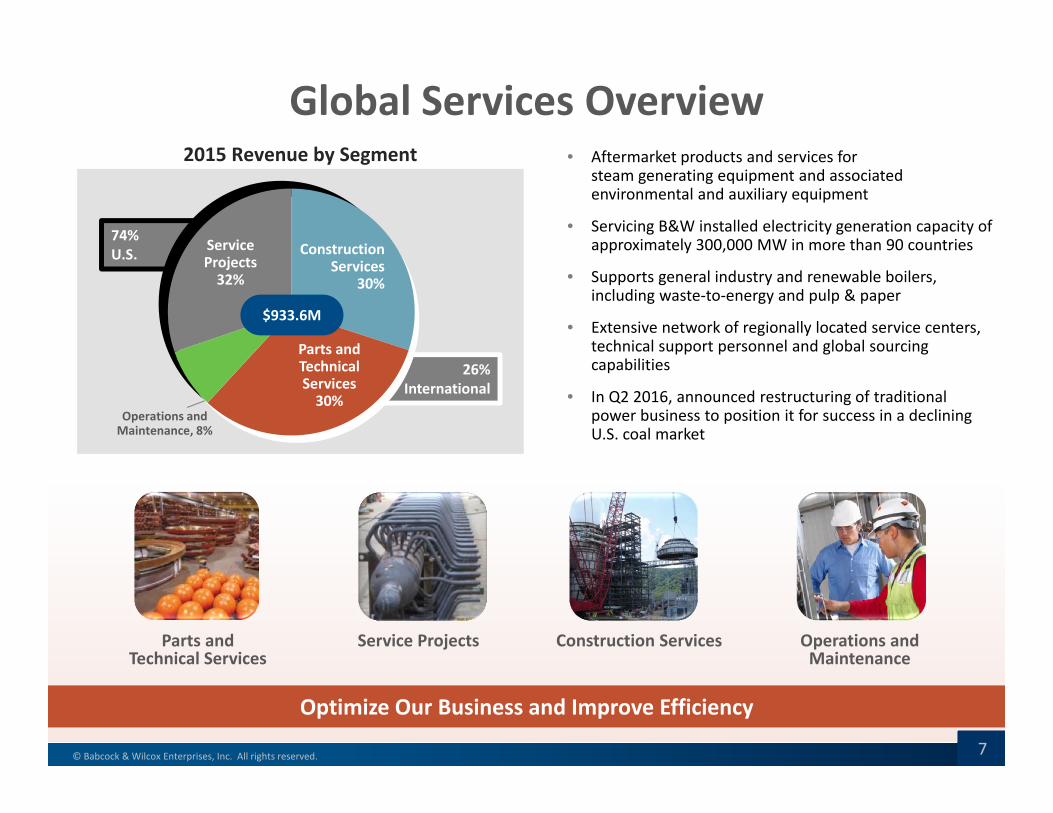
74%U.S.
26%International
Parts and Technical Services 30%
$933.6M
Service Projects32%
Construction Services
30%
Global Services Overview• Aftermarket products and services for
steam generating equipment and associated environmental and auxiliary equipment
• Servicing B&W installed electricity generation capacity of approximately 300,000 MW in more than 90 countries
• Supports general industry and renewable boilers, including waste‐to‐energy and pulp & paper
• Extensive network of regionally located service centers, technical support personnel and global sourcing capabilities
• In Q2 2016, announced restructuring of traditional power business to position it for success in a declining U.S. coal market
2015 Revenue by Segment
Parts and Technical Services
Service Projects Construction Services Operations and Maintenance
Optimize Our Business and Improve Efficiency
Operations and Maintenance, 8%
7
© Babcock & Wilcox Enterprises, Inc. All rights reserved. 8
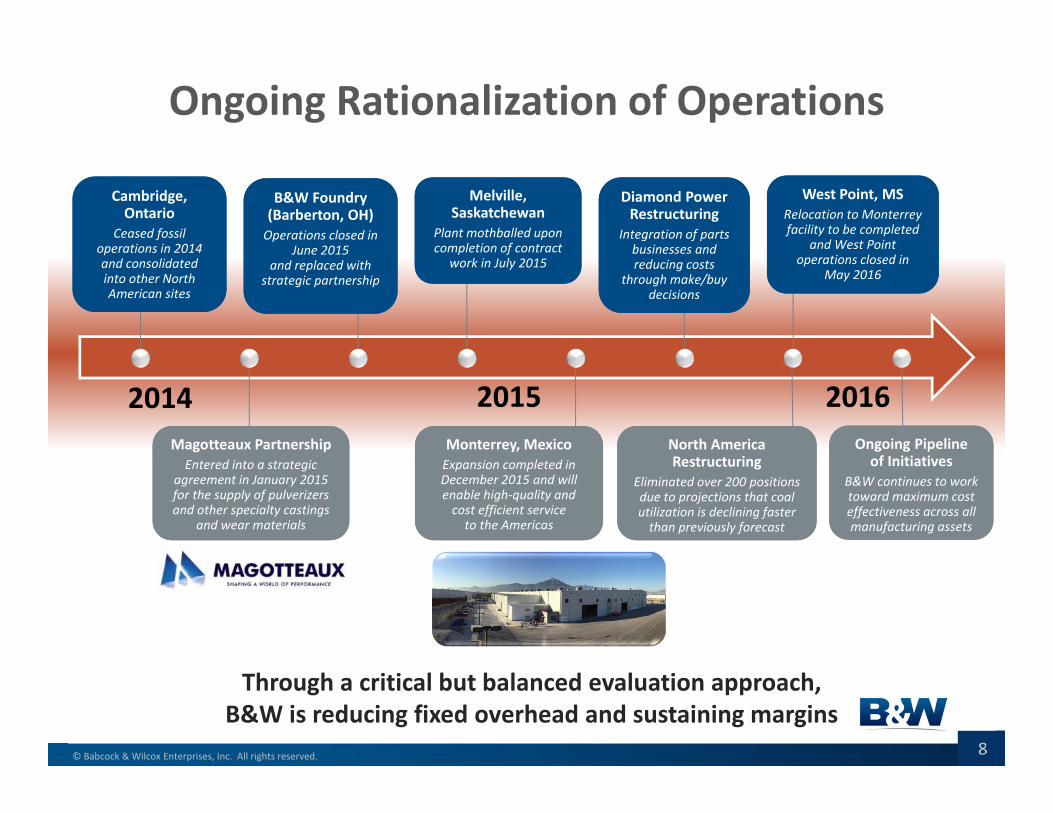
Ongoing Rationalization of Operations
Cambridge, Ontario
Ceased fossil operations in 2014 and consolidated into other North American sites
Cambridge, Ontario
Ceased fossil operations in 2014 and consolidated into other North American sites
B&W Foundry (Barberton, OH)Operations closed in
June 2015 and replaced with
strategic partnership
B&W Foundry (Barberton, OH)Operations closed in
June 2015 and replaced with
strategic partnership
Melville, Saskatchewan
Plant mothballed upon completion of contract
work in July 2015
Melville, Saskatchewan
Plant mothballed upon completion of contract
work in July 2015
West Point, MSRelocation to Monterrey facility to be completed
and West Point operations closed in
May 2016
West Point, MSRelocation to Monterrey facility to be completed
and West Point operations closed in
May 2016
Magotteaux PartnershipEntered into a strategic
agreement in January 2015 for the supply of pulverizersand other specialty castings
and wear materials
Magotteaux PartnershipEntered into a strategic
agreement in January 2015 for the supply of pulverizersand other specialty castings
and wear materials
Monterrey, MexicoExpansion completed in December 2015 and will enable high‐quality and cost efficient service to the Americas
Monterrey, MexicoExpansion completed in December 2015 and will enable high‐quality and cost efficient service to the Americas
2014 2015 2016
Through a critical but balanced evaluation approach, B&W is reducing fixed overhead and sustaining margins
Diamond Power Restructuring
Integration of parts businesses and reducing costs
through make/buy decisions
Diamond Power Restructuring
Integration of parts businesses and reducing costs
through make/buy decisions
Ongoing Pipeline of Initiatives
B&W continues to work toward maximum cost effectiveness across all manufacturing assets
Ongoing Pipeline of Initiatives
B&W continues to work toward maximum cost effectiveness across all manufacturing assets
North America Restructuring
Eliminated over 200 positions due to projections that coal utilization is declining faster than previously forecast
North America Restructuring
Eliminated over 200 positions due to projections that coal utilization is declining faster than previously forecast
© Babcock & Wilcox Enterprises, Inc. All rights reserved. 9© Babcock & Wilcox Enterprises, Inc. All rights reserved.
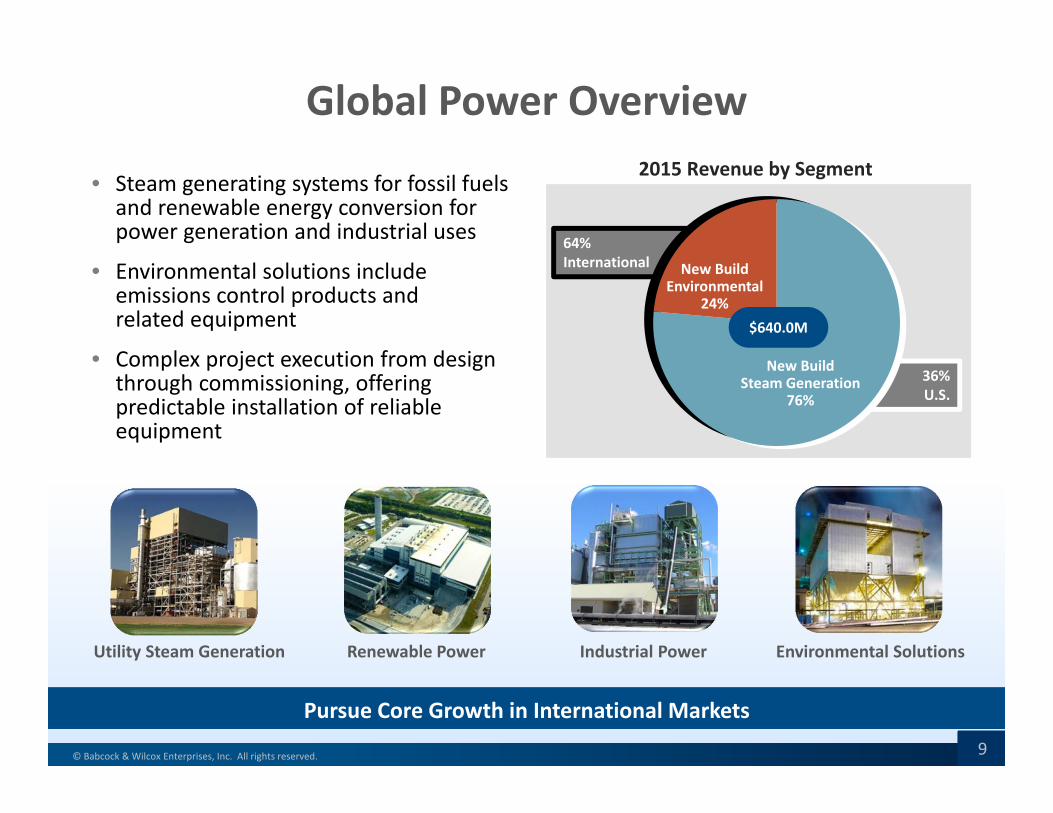
Global Power Overview
• Steam generating systems for fossil fuels and renewable energy conversion for power generation and industrial uses
• Environmental solutions include emissions control products and related equipment
• Complex project execution from design through commissioning, offering predictable installation of reliable equipment
Utility Steam Generation Renewable Power Industrial Power Environmental Solutions
36%U.S.
64%International
2015 Revenue by Segment
$640.0M
New Build Environmental
24%
New Build Steam Generation
76%
Pursue Core Growth in International Markets9

© Babcock & Wilcox Enterprises, Inc. All rights reserved. 10
Recent Project Awards Demonstrate Global Expansion is Underway
Emissions Control Project in Colorado March 2015 – $40.3M Emissions Control Project in Colorado March 2015 – $40.3M
Biomass Power Plant in EnglandMarch 2015 – >$220MBiomass Power Plant in EnglandMarch 2015 – >$220M
Carbon Black Emissions ProjectFebruary 2016Carbon Black Emissions ProjectFebruary 2016
Biomass Power Plant in EnglandSeptember 2015 – >$190MBiomass Power Plant in EnglandSeptember 2015 – >$190M
Waste‐to‐Energy Power Plant in EnglandJanuary 2016 – >$90M
Waste‐to‐Energy Power Plant in EnglandJanuary 2016 – >$90M
Supercritical Coal‐Fired Boilerin the PhilippinesMarch 2016 – >$80M
Supercritical Coal‐Fired Boilerin the PhilippinesMarch 2016 – >$80M
© Babcock & Wilcox Enterprises, Inc. All rights reserved. 11
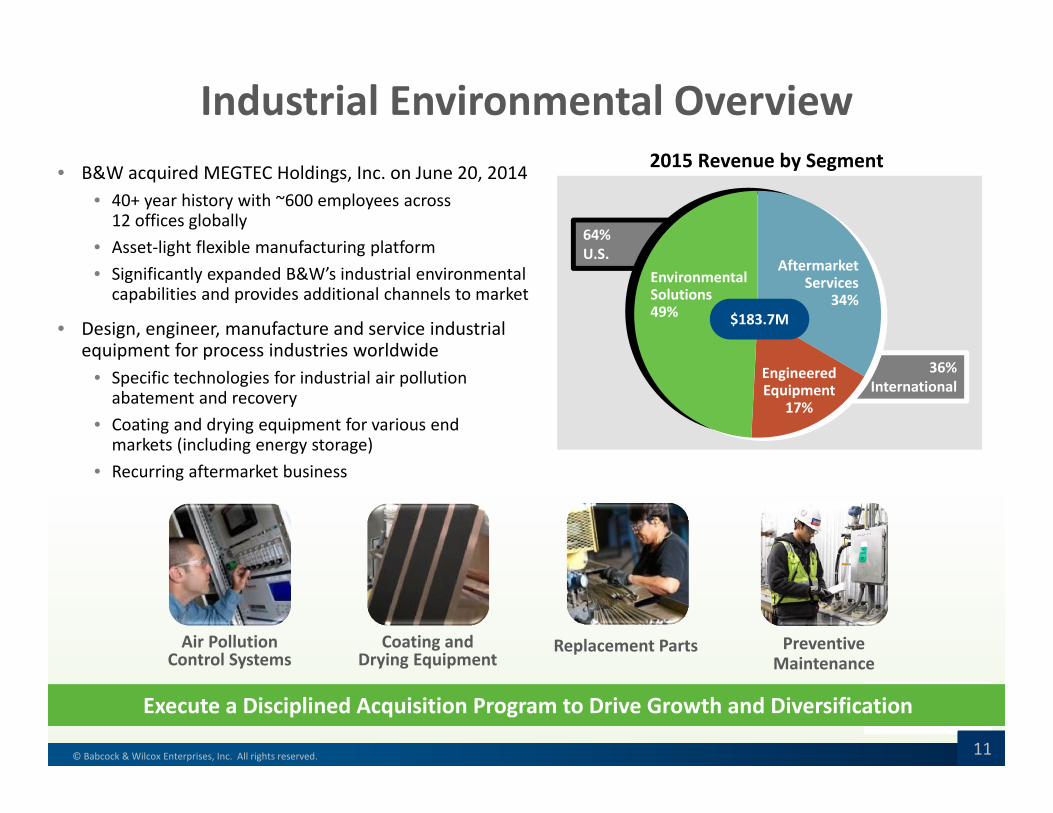
36%International
64%U.S.
Industrial Environmental Overview• B&W acquired MEGTEC Holdings, Inc. on June 20, 2014
• 40+ year history with ~600 employees across 12 offices globally
• Asset‐light flexible manufacturing platform• Significantly expanded B&W’s industrial environmental capabilities and provides additional channels to market
• Design, engineer, manufacture and service industrial equipment for process industries worldwide
• Specific technologies for industrial air pollution abatement and recovery
• Coating and drying equipment for various end markets (including energy storage)
• Recurring aftermarket business
2015 Revenue by Segment
Air Pollution Control Systems
Coating and Drying Equipment
Replacement Parts Preventive Maintenance
Execute a Disciplined Acquisition Program to Drive Growth and Diversification
Engineered Equipment
17%
$183.7M
EnvironmentalSolutions49%
AftermarketServices
34%
11
© Babcock & Wilcox Enterprises, Inc. All rights reserved. 12
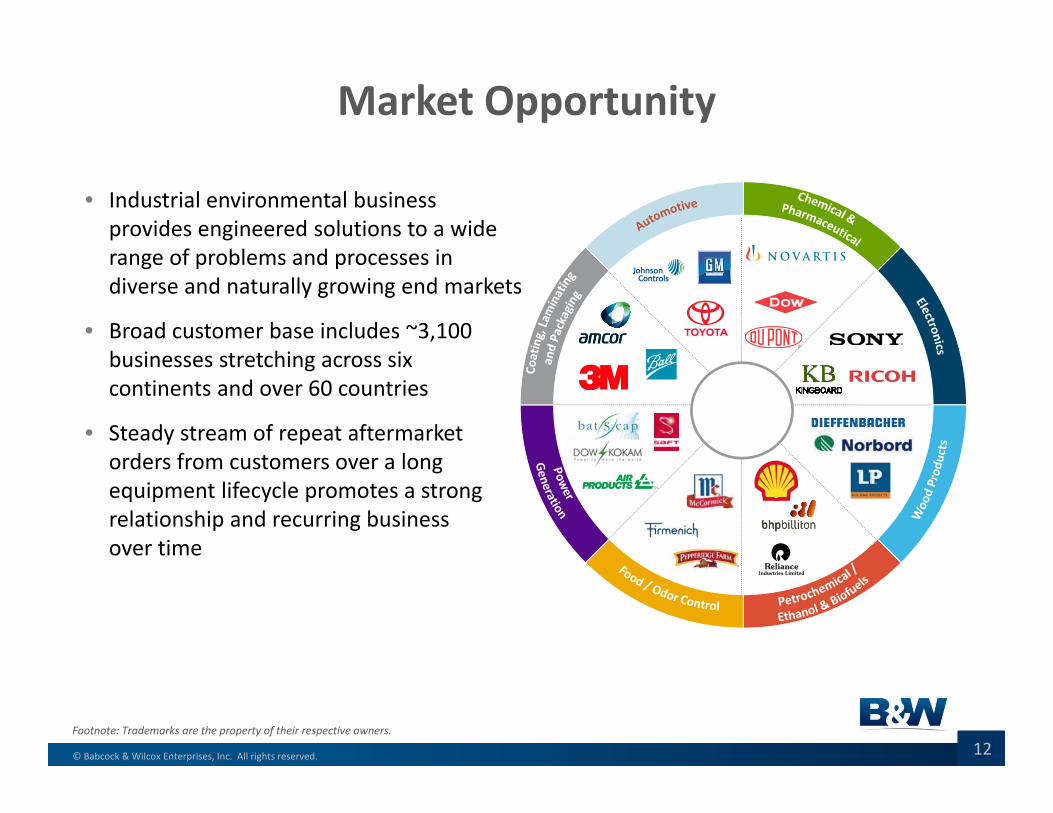
Market Opportunity
• Industrial environmental business provides engineered solutions to a wide range of problems and processes in diverse and naturally growing end markets
• Broad customer base includes ~3,100 businesses stretching across six continents and over 60 countries
• Steady stream of repeat aftermarket orders from customers over a long equipment lifecycle promotes a strong relationship and recurring business over time
[MEGTEC]
Footnote: Trademarks are the property of their respective owners.
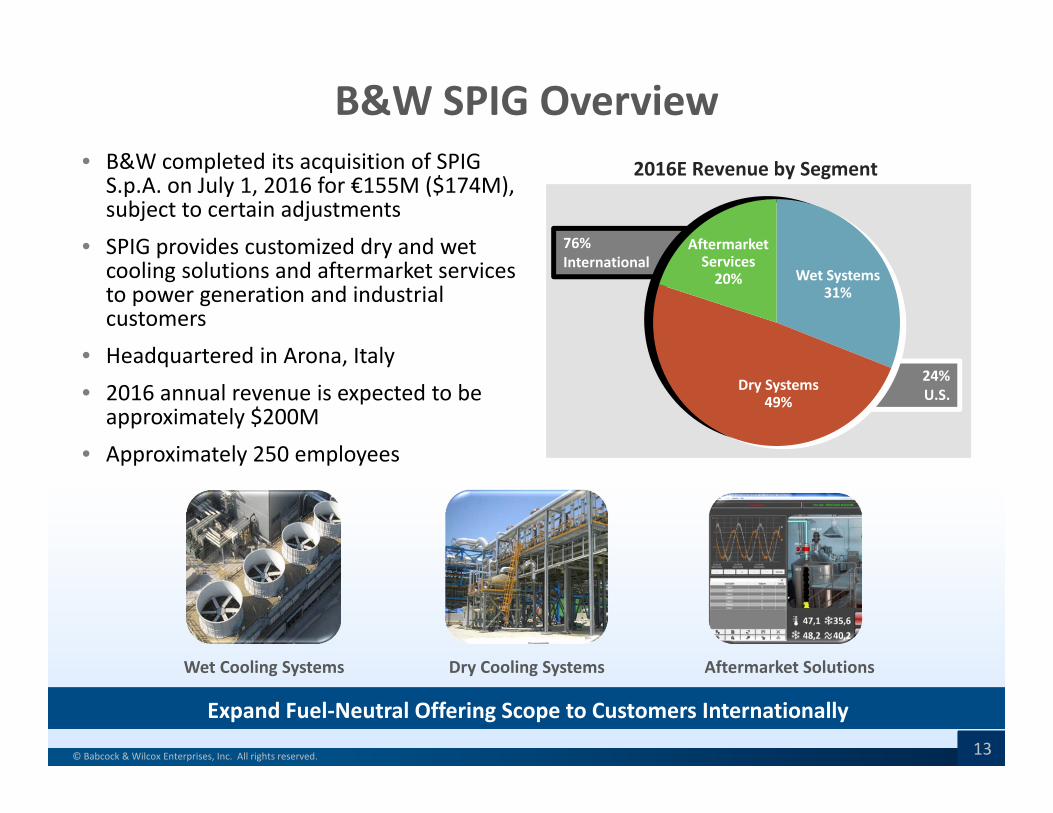
© Babcock & Wilcox Enterprises, Inc. All rights reserved. 13© Babcock & Wilcox Enterprises, Inc. All rights reserved.
• B&W completed its acquisition of SPIG S.p.A. on July 1, 2016 for €155M ($174M), subject to certain adjustments
• SPIG provides customized dry and wet cooling solutions and aftermarket services to power generation and industrial customers
• Headquartered in Arona, Italy• 2016 annual revenue is expected to be approximately $200M
• Approximately 250 employees
Wet Cooling Systems Dry Cooling Systems Aftermarket Solutions
24%U.S.
76%International
2016E Revenue by Segment
Aftermarket Services20%
Dry Systems49%
Expand Fuel‐Neutral Offering Scope to Customers Internationally
Wet Systems31%
B&W SPIG Overview
13
© Babcock & Wilcox Enterprises, Inc. All rights reserved. 14
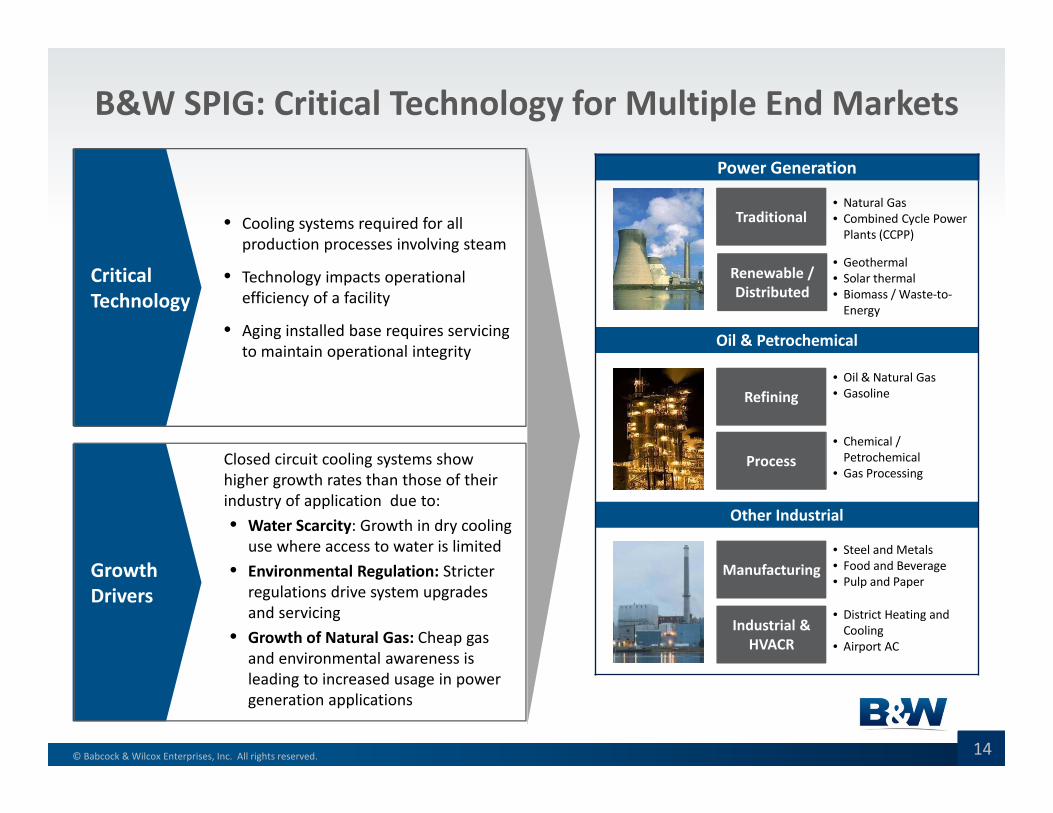
Power Generation
Oil & Petrochemical
Other Industrial
Manufacturing
ProcessClosed circuit cooling systems show higher growth rates than those of their industry of application due to:• Water Scarcity: Growth in dry cooling
use where access to water is limited• Environmental Regulation: Stricter
regulations drive system upgrades and servicing
• Growth of Natural Gas: Cheap gas and environmental awareness is leading to increased usage in power generation applications
• Cooling systems required for all production processes involving steam
• Technology impacts operational efficiency of a facility
• Aging installed base requires servicing to maintain operational integrity
Refining
Industrial & HVACR
Traditional
Renewable / Distributed
Critical Technology
Growth Drivers
• Natural Gas• Combined Cycle Power Plants (CCPP)
• Geothermal• Solar thermal• Biomass / Waste‐to‐Energy
• Oil & Natural Gas• Gasoline
• Chemical / Petrochemical
• Gas Processing
• Steel and Metals• Food and Beverage• Pulp and Paper
• District Heating andCooling
• Airport AC
B&W SPIG: Critical Technology for Multiple End Markets
© Babcock & Wilcox Enterprises, Inc. All rights reserved. 15
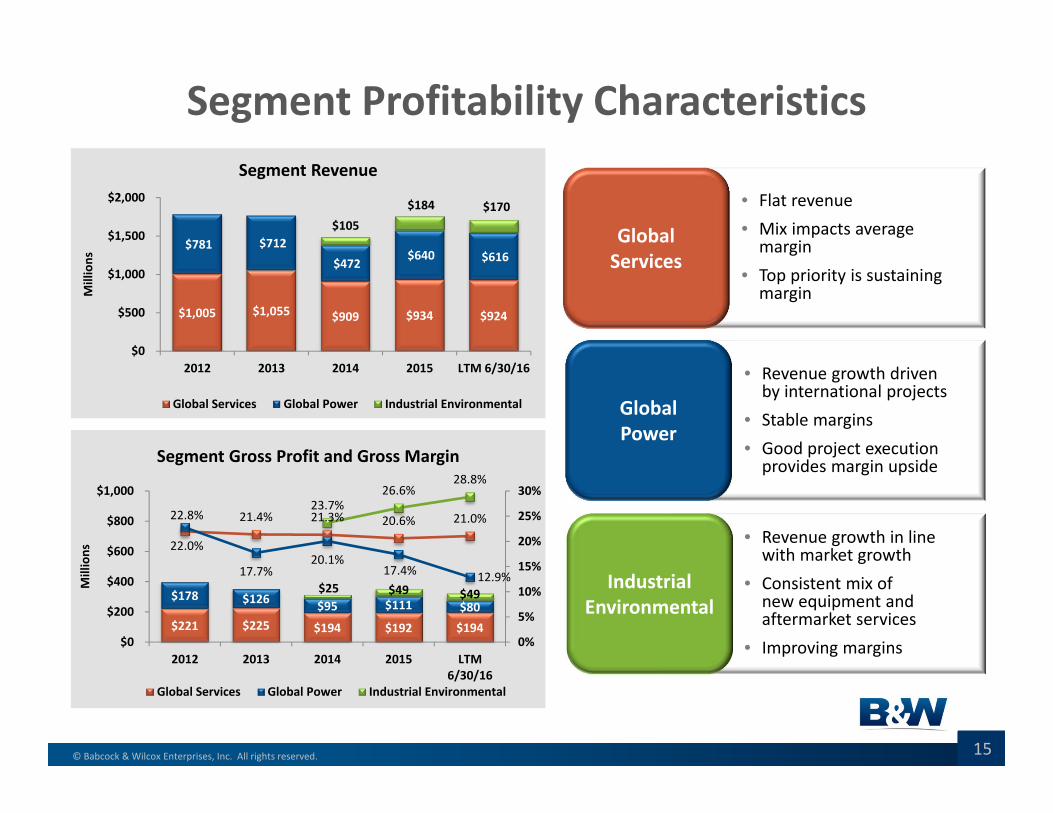
Segment Profitability Characteristics
Global Services
Global Power
Industrial Environmental
• Revenue growth in line with market growth
• Consistent mix of new equipment and aftermarket services
• Improving margins
• Revenue growth driven by international projects
• Stable margins • Good project execution provides margin upside
• Flat revenue• Mix impacts average margin
• Top priority is sustaining margin
$1,005 $1,055 $909 $934 $924
$781 $712 $472
$640 $616
$105 $184 $170
$0
$500
$1,000
$1,500
$2,000
2012 2013 2014 2015 LTM 6/30/16
Millions
Segment Revenue
Global Services Global Power Industrial Environmental
$221 $225 $194 $192 $194
$178 $126 $95 $111 $80$25 $49 $49
22.0%
21.4% 21.3% 20.6% 21.0%22.8%
17.7%20.1%
17.4% 12.9%
23.7%26.6%
28.8%
0%
5%
10%
15%
20%
25%
30%
$0
$200
$400
$600
$800
$1,000
2012 2013 2014 2015 LTM6/30/16
Millions
Segment Gross Profit and Gross Margin
Global Services Global Power Industrial Environmental
© Babcock & Wilcox Enterprises, Inc. All rights reserved. 16
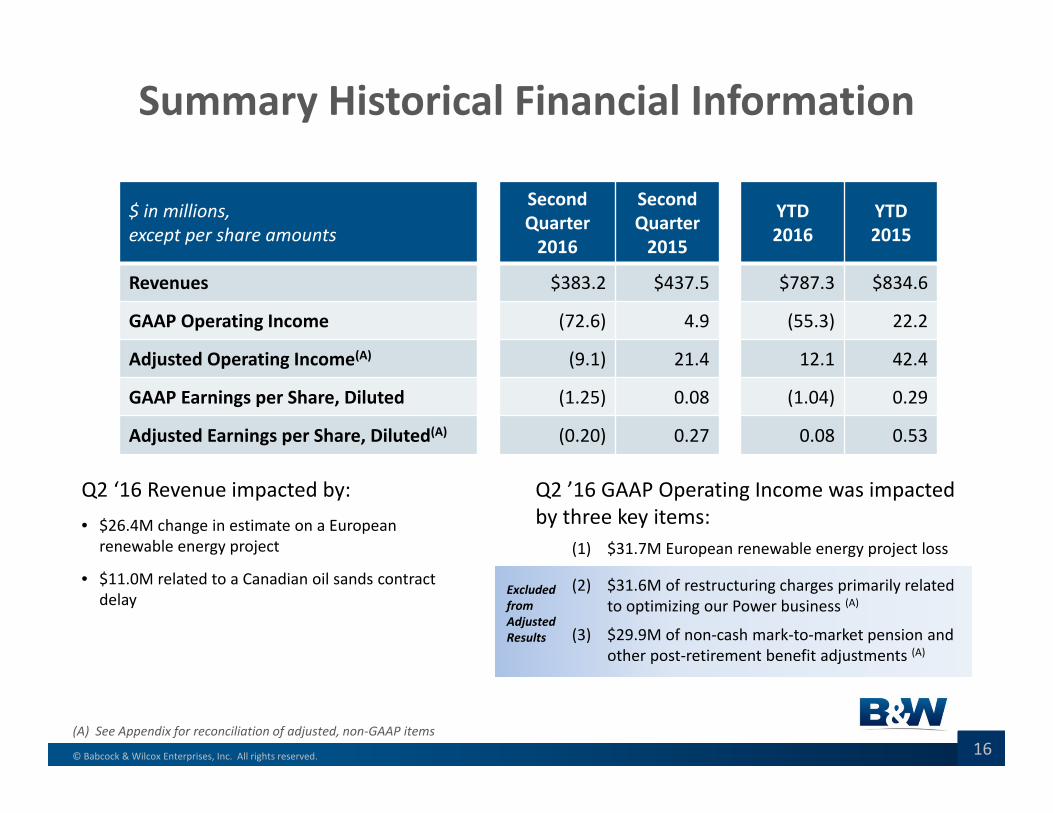
Summary Historical Financial Information
$ in millions, except per share amounts
Second Quarter 2016
SecondQuarter2015
YTD2016
YTD2015
Revenues $383.2 $437.5 $787.3 $834.6
GAAP Operating Income (72.6) 4.9 (55.3) 22.2
Adjusted Operating Income(A) (9.1) 21.4 12.1 42.4
GAAP Earnings per Share, Diluted (1.25) 0.08 (1.04) 0.29
Adjusted Earnings per Share, Diluted(A) (0.20) 0.27 0.08 0.53
Q2 ’16 GAAP Operating Income was impacted by three key items:
(1) $31.7M European renewable energy project loss
(2) $31.6M of restructuring charges primarily related to optimizing our Power business (A)
(3) $29.9M of non‐cash mark‐to‐market pension and other post‐retirement benefit adjustments (A)
(A) See Appendix for reconciliation of adjusted, non‐GAAP items
Q2 ‘16 Revenue impacted by:• $26.4M change in estimate on a European
renewable energy project
• $11.0M related to a Canadian oil sands contract delay
Excluded from Adjusted Results
© Babcock & Wilcox Enterprises, Inc. All rights reserved. 17
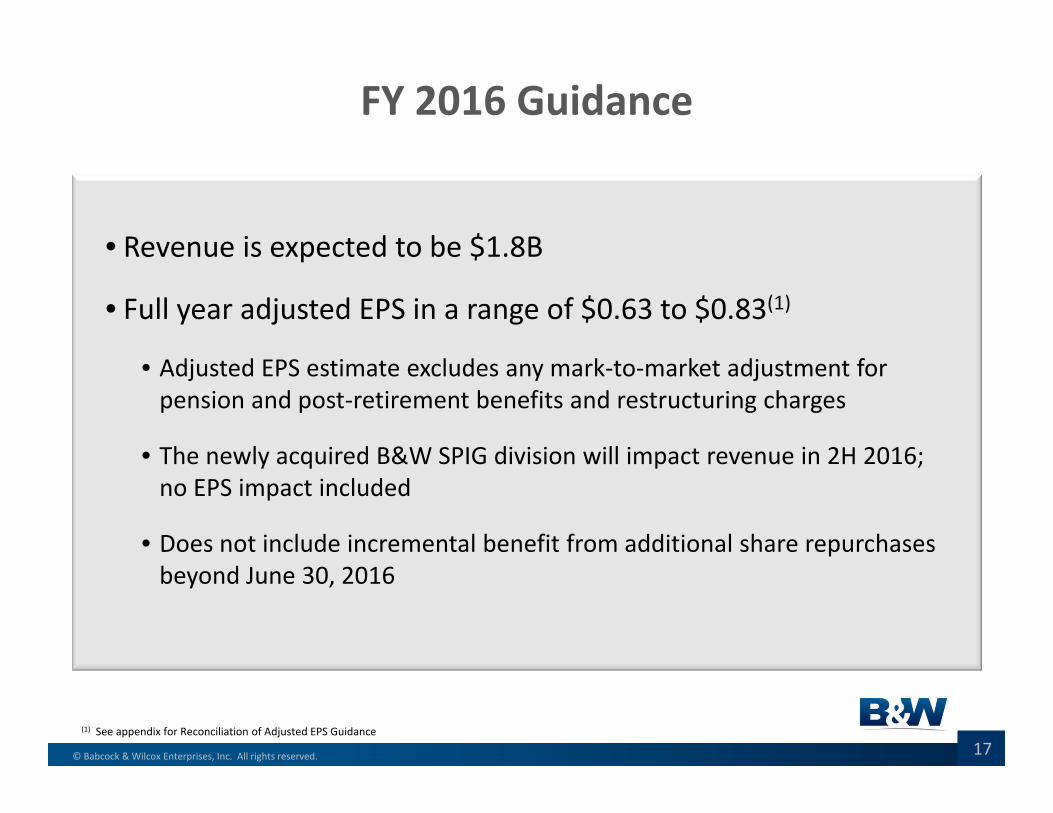
FY 2016 Guidance
• Revenue is expected to be $1.8B
• Full year adjusted EPS in a range of $0.63 to $0.83(1)
• Adjusted EPS estimate excludes any mark‐to‐market adjustment for pension and post‐retirement benefits and restructuring charges
• The newly acquired B&W SPIG division will impact revenue in 2H 2016; no EPS impact included
• Does not include incremental benefit from additional share repurchases beyond June 30, 2016
(1) See appendix for Reconciliation of Adjusted EPS Guidance
© Babcock & Wilcox Enterprises, Inc. All rights reserved. 18
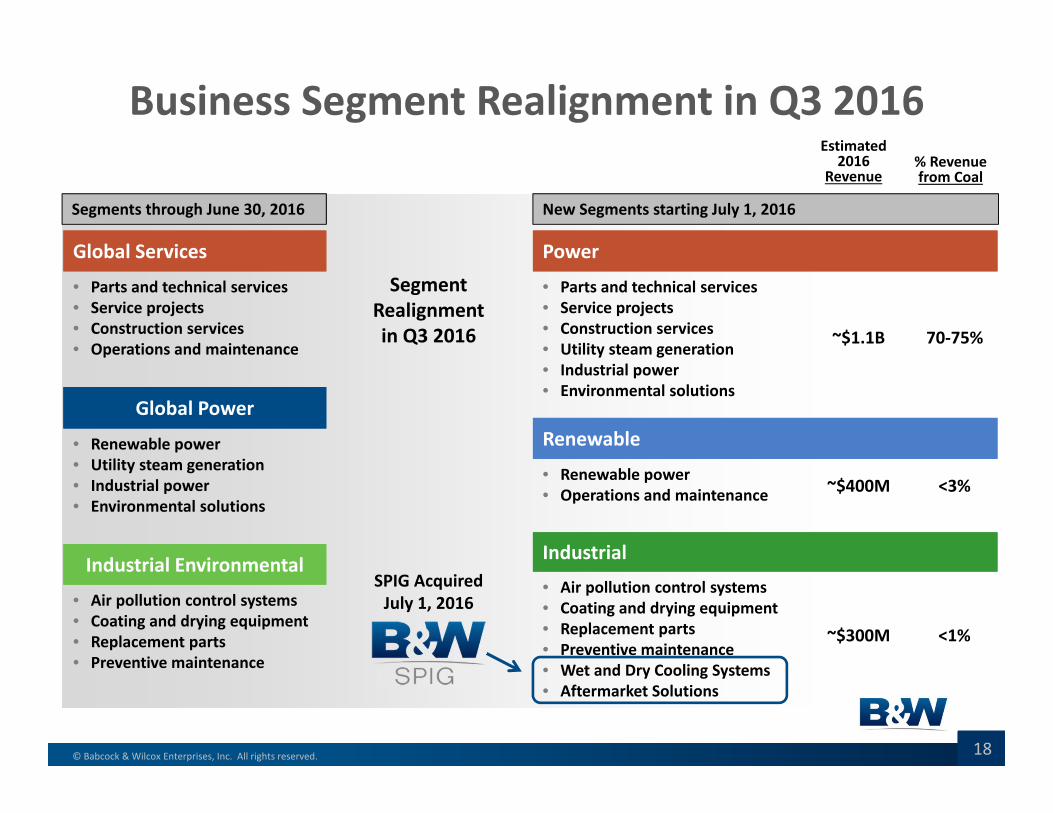
Power
• Parts and technical services• Service projects• Construction services• Utility steam generation• Industrial power• Environmental solutions
Renewable
• Renewable power• Operations and maintenance
Industrial
• Air pollution control systems • Coating and drying equipment• Replacement parts• Preventive maintenance• Wet and Dry Cooling Systems• Aftermarket Solutions
Global Services
• Parts and technical services• Service projects• Construction services• Operations and maintenance
Global Power
• Renewable power• Utility steam generation• Industrial power• Environmental solutions
Industrial Environmental
• Air pollution control systems • Coating and drying equipment• Replacement parts• Preventive maintenance
Business Segment Realignment in Q3 2016
Segment Realignmentin Q3 2016
SPIG AcquiredJuly 1, 2016
~$400M
~$1.1B
~$300M
<3%
70‐75%
<1%
Estimated2016
Revenue% Revenue from Coal
Segments through June 30, 2016 New Segments starting July 1, 2016
© Babcock & Wilcox Enterprises, Inc. All rights reserved. 19© Babcock & Wilcox Enterprises, Inc. All rights reserved.
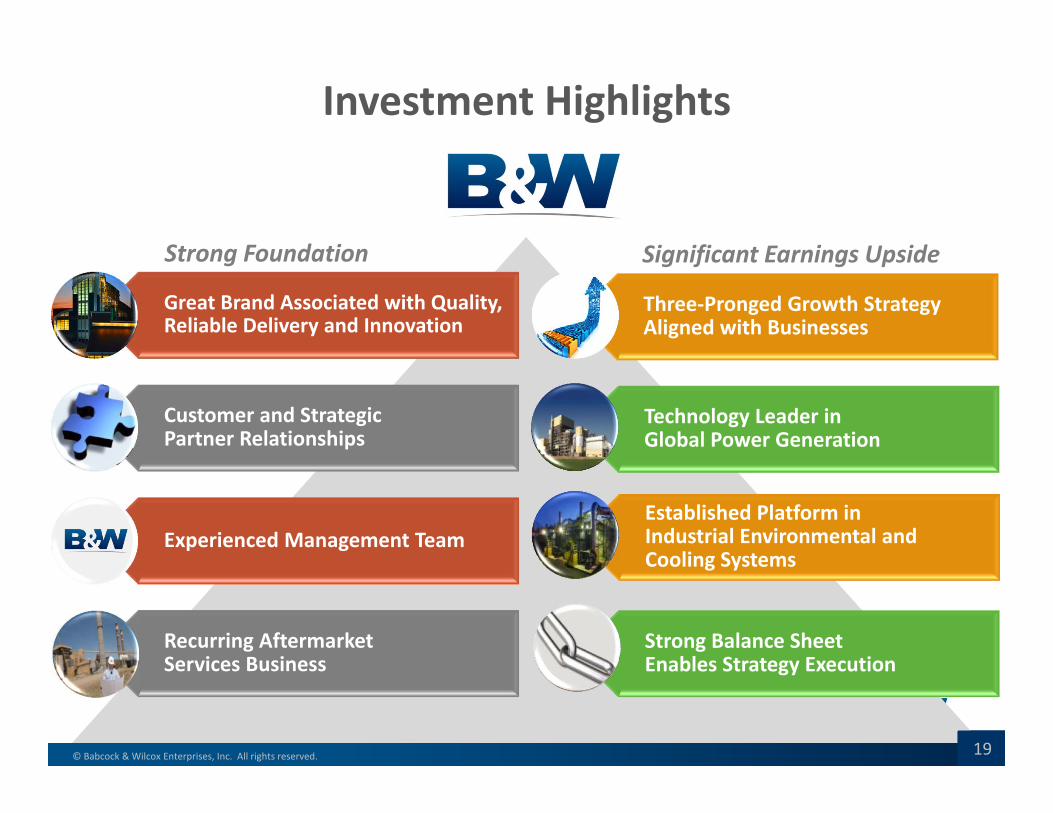
Investment Highlights
Great Brand Associated with Quality, Reliable Delivery and Innovation
Customer and Strategic Partner Relationships
Experienced Management Team
Recurring Aftermarket Services Business
Strong Balance Sheet Enables Strategy Execution
Established Platform in Industrial Environmental and Cooling Systems
Technology Leader in Global Power Generation
Three‐Pronged Growth Strategy Aligned with Businesses
Significant Earnings UpsideStrong Foundation
19
© Babcock & Wilcox Enterprises, Inc. All rights reserved. 20
Appendix
© Babcock & Wilcox Enterprises, Inc. All rights reserved. 21
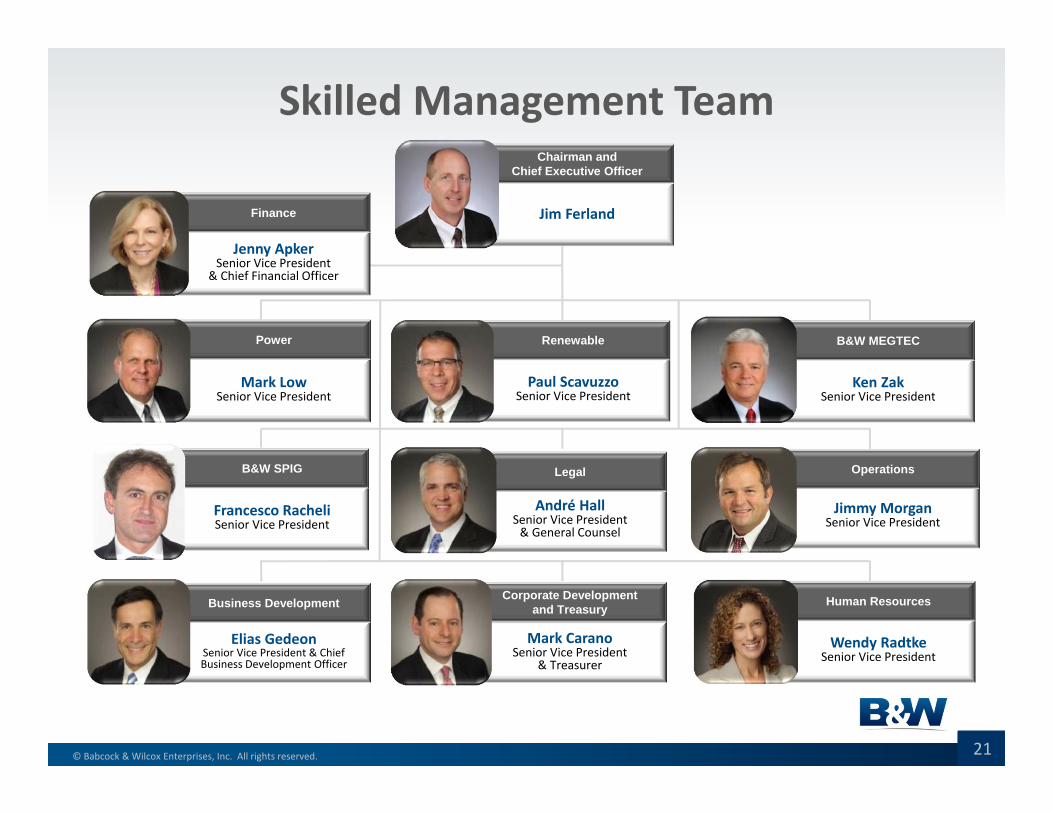
Skilled Management Team
Jenny ApkerSenior Vice President
& Chief Financial Officer
Finance
Elias GedeonSenior Vice President & Chief Business Development Officer
Business Development
Jim Ferland
Chairman and Chief Executive Officer
Mark CaranoSenior Vice President
& Treasurer
Corporate Developmentand Treasury
André HallSenior Vice President & General Counsel
Legal
Jimmy MorganSenior Vice President
Operations
Wendy RadtkeSenior Vice President
Human Resources
Mark LowSenior Vice President
Power
Paul ScavuzzoSenior Vice President
Renewable
Ken ZakSenior Vice President
B&W MEGTEC
Francesco RacheliSenior Vice President
B&W SPIG
© Babcock & Wilcox Enterprises, Inc. All rights reserved. 22© Babcock & Wilcox Enterprises, Inc. All rights reserved.
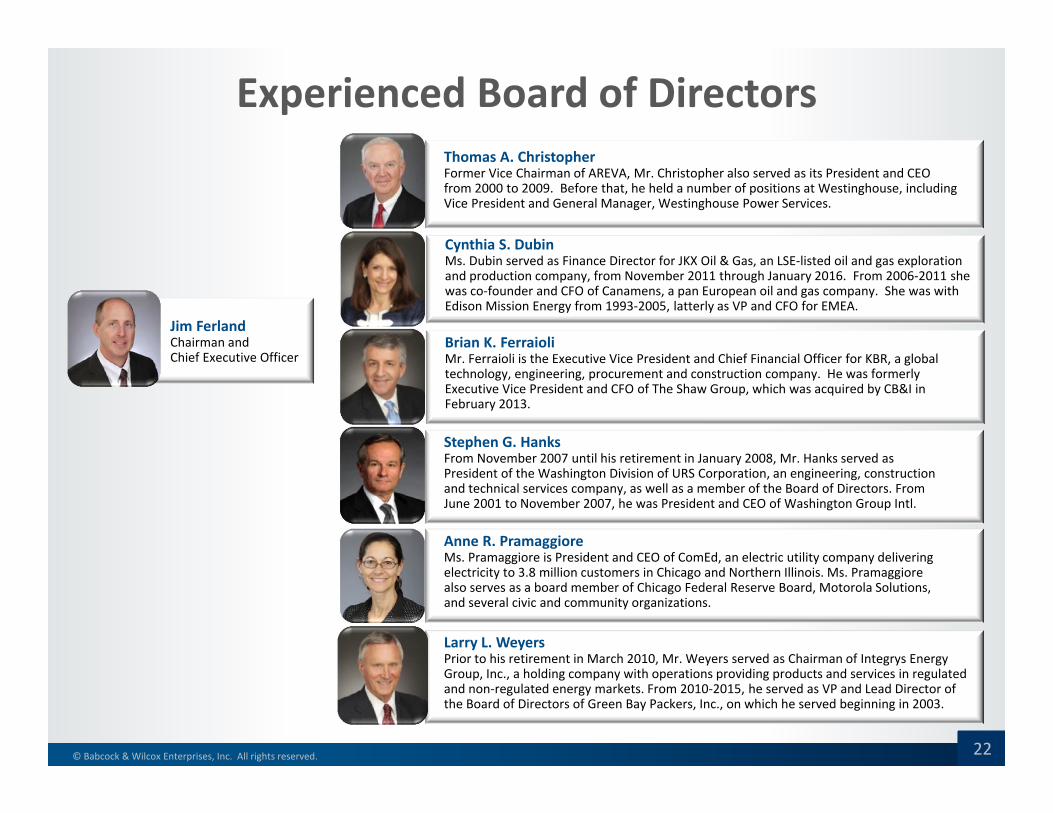
Experienced Board of DirectorsThomas A. ChristopherFormer Vice Chairman of AREVA, Mr. Christopher also served as its President and CEO from 2000 to 2009. Before that, he held a number of positions at Westinghouse, including Vice President and General Manager, Westinghouse Power Services.
Cynthia S. DubinMs. Dubin served as Finance Director for JKX Oil & Gas, an LSE‐listed oil and gas exploration and production company, from November 2011 through January 2016. From 2006‐2011 she was co‐founder and CFO of Canamens, a pan European oil and gas company. She was with Edison Mission Energy from 1993‐2005, latterly as VP and CFO for EMEA.
Brian K. FerraioliMr. Ferraioli is the Executive Vice President and Chief Financial Officer for KBR, a global technology, engineering, procurement and construction company. He was formerly Executive Vice President and CFO of The Shaw Group, which was acquired by CB&I in February 2013.
Stephen G. HanksFrom November 2007 until his retirement in January 2008, Mr. Hanks served as President of the Washington Division of URS Corporation, an engineering, construction and technical services company, as well as a member of the Board of Directors. From June 2001 to November 2007, he was President and CEO of Washington Group Intl.
Anne R. PramaggioreMs. Pramaggiore is President and CEO of ComEd, an electric utility company delivering electricity to 3.8 million customers in Chicago and Northern Illinois. Ms. Pramaggiore also serves as a board member of Chicago Federal Reserve Board, Motorola Solutions, and several civic and community organizations.
Larry L. WeyersPrior to his retirement in March 2010, Mr. Weyers served as Chairman of Integrys Energy Group, Inc., a holding company with operations providing products and services in regulated and non‐regulated energy markets. From 2010‐2015, he served as VP and Lead Director of the Board of Directors of Green Bay Packers, Inc., on which he served beginning in 2003.
Jim FerlandChairman and Chief Executive Officer
22
© Babcock & Wilcox Enterprises, Inc. All rights reserved. 23
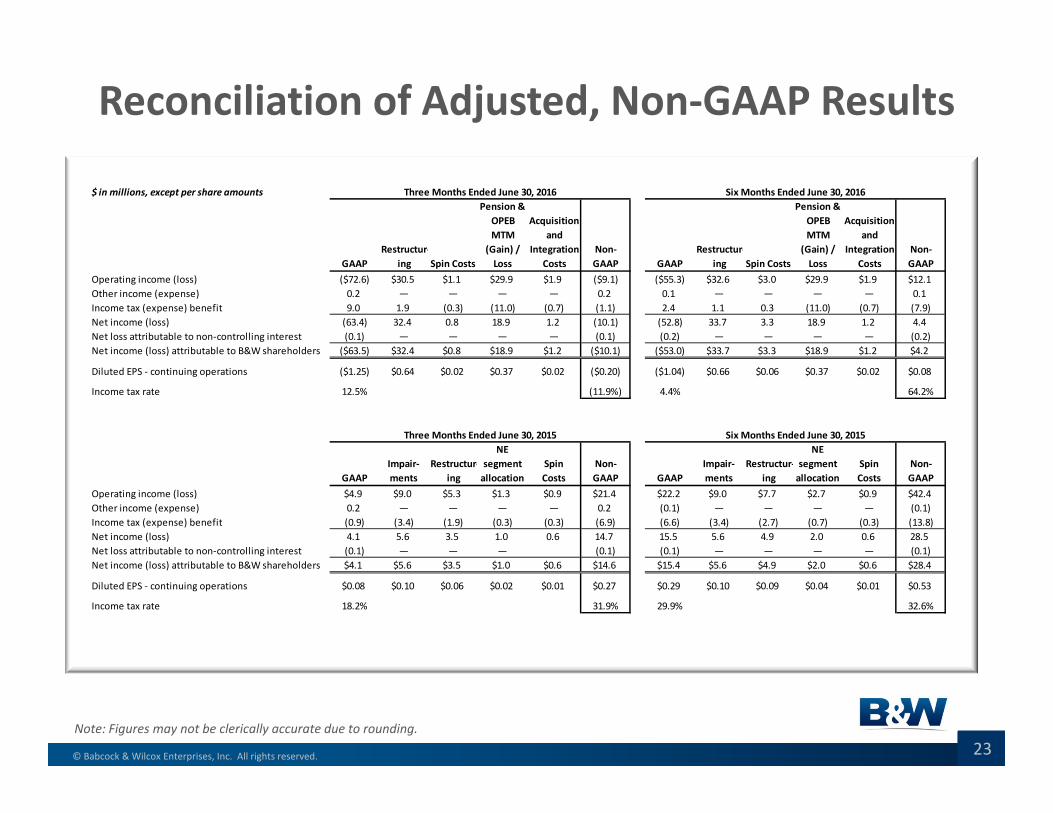
Reconciliation of Adjusted, Non‐GAAP Results
Note: Figures may not be clerically accurate due to rounding.
$ in millions, except per share amounts
GAAPRestructur‐
ing Spin Costs
Pension & OPEB MTM
(Gain) / Loss
Acquisition and
Integration Costs
Non‐GAAP GAAP
Restructur‐ing Spin Costs
Pension & OPEB MTM
(Gain) / Loss
Acquisition and
Integration Costs
Non‐GAAP
Operating income (loss) ($72.6) $30.5 $1.1 $29.9 $1.9 ($9.1) ($55.3) $32.6 $3.0 $29.9 $1.9 $12.1Other income (expense) 0.2 — — — — 0.2 0.1 — — — — 0.1Income tax (expense) benefit 9.0 1.9 (0.3) (11.0) (0.7) (1.1) 2.4 1.1 0.3 (11.0) (0.7) (7.9)Net income (loss) (63.4) 32.4 0.8 18.9 1.2 (10.1) (52.8) 33.7 3.3 18.9 1.2 4.4Net loss attributable to non‐controlling interest (0.1) — — — — (0.1) (0.2) — — — — (0.2)Net income (loss) attributable to B&W shareholders ($63.5) $32.4 $0.8 $18.9 $1.2 ($10.1) ($53.0) $33.7 $3.3 $18.9 $1.2 $4.2
Diluted EPS ‐ continuing operations ($1.25) $0.64 $0.02 $0.37 $0.02 ($0.20) ($1.04) $0.66 $0.06 $0.37 $0.02 $0.08
Income tax rate 12.5% (11.9%) 4.4% 64.2%
GAAPImpair‐ments
Restructur‐ing
NE segment allocation
Spin Costs
Non‐GAAP GAAP
Impair‐ments
Restructur‐ing
NE segment allocation
Spin Costs
Non‐GAAP
Operating income (loss) $4.9 $9.0 $5.3 $1.3 $0.9 $21.4 $22.2 $9.0 $7.7 $2.7 $0.9 $42.4Other income (expense) 0.2 — — — — 0.2 (0.1) — — — — (0.1)Income tax (expense) benefit (0.9) (3.4) (1.9) (0.3) (0.3) (6.9) (6.6) (3.4) (2.7) (0.7) (0.3) (13.8)Net income (loss) 4.1 5.6 3.5 1.0 0.6 14.7 15.5 5.6 4.9 2.0 0.6 28.5Net loss attributable to non‐controlling interest (0.1) — — — (0.1) (0.1) — — — — (0.1)Net income (loss) attributable to B&W shareholders $4.1 $5.6 $3.5 $1.0 $0.6 $14.6 $15.4 $5.6 $4.9 $2.0 $0.6 $28.4
Diluted EPS ‐ continuing operations $0.08 $0.10 $0.06 $0.02 $0.01 $0.27 $0.29 $0.10 $0.09 $0.04 $0.01 $0.53
Income tax rate 18.2% 31.9% 29.9% 32.6%
Three Months Ended June 30, 2016
Three Months Ended June 30, 2015
Six Months Ended June 30, 2016
Six Months Ended June 30, 2015
© Babcock & Wilcox Enterprises, Inc. All rights reserved. 24
Reconciliation of Adjusted EPS Guidance
Management has provided full year adjusted earnings per diluted share ("adjusted EPS") guidance of $0.63 to $0.83. It is not possible for management to identify the amount or significance of future adjustments associated with potential mark to market adjustments to our pension and other postretirement benefit plan liabilities or other non‐routine costs that we adjust in our presentation of adjusted EPS guidance. These items are dependent on future events and/or market inputs that are not reasonably estimable at this time. Accordingly, management is unable to reconcile without unreasonable effort the Company's forecasted range of adjusted EPS for the full year included in the FY 2016 Guidance slide within this presentation to a comparable GAAP range. However, items excluded from our adjusted EPS guidance include the historical adjustments noted in the prior slides, and our adjusted EPS guidance also excludes future estimable adjusting items, including charges relating to previously announced restructuring initiatives of $0.20‐$0.40 per share, additional spin costs of approximately $0.02 per share and additional acquisition and integration costs of approximately $0.01 per share.
© Babcock & Wilcox Enterprises, Inc. All rights reserved. 25