Embed Size (px)
Citation preview

Condensed Interim Report for the First Quarter Ended 30 September 2014 1
Company Information 2
Company Profile 4
Directors’ Review 6
Financial Information
Condensed Interim Unconsolidated Balance Sheet (Unaudited) 10
Condensed Interim Unconsolidated Profit and Loss Account (Unaudited) 11
Condensed Interim Unconsolidated Statement of Comprehensive Income (Unaudited) 12
Condensed Interim Unconsolidated Cash Flow Statement (Unaudited) 13
Condensed Interim Unconsolidated Statement of Changes in Equity (Unaudited) 14
Notes to the Condensed Interim Unconsolidated Financial Information (Unaudited) 15
Consolidated Financial Information
Condensed Interim Consolidated Balance Sheet (Unaudited) 34
Condensed Interim Consolidated Profit and Loss Account (Unaudited) 35
Condensed Interim Consolidated Statement of Comprehensive Income (Unaudited) 36
Condensed Interim Consolidated Cash Flow Statement (Unaudited) 37
Condensed Interim Consolidated Statement of Changes in Equity (Unaudited) 38
Notes to the Condensed Interim Consolidated Financial Information (Unaudited) 39
CONTENTS
Crescent Steel and Allied Products Limited2
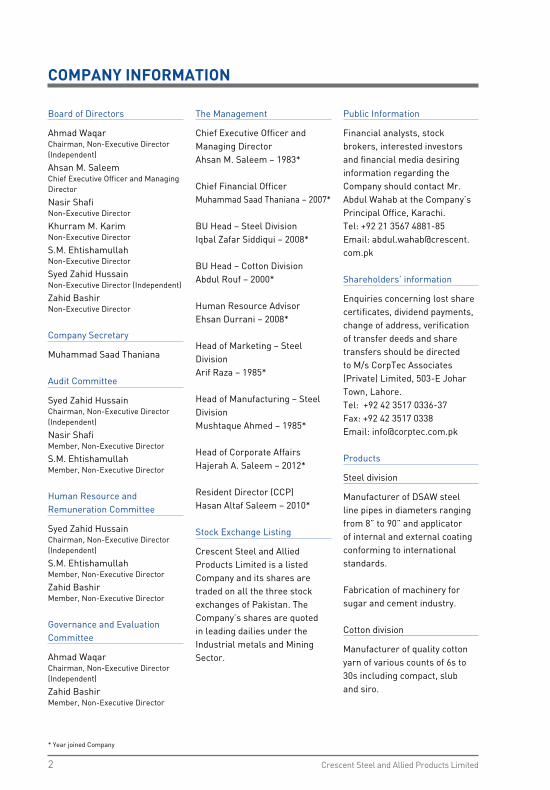
Board of Directors
Ahmad WaqarChairman, Non-Executive Director (Independent)
Ahsan M. SaleemChief Executive Officer and Managing Director
Nasir ShafiNon-Executive Director
Khurram M. KarimNon-Executive Director
S.M. EhtishamullahNon-Executive Director
Syed Zahid HussainNon-Executive Director (Independent)
Zahid BashirNon-Executive Director
Company Secretary
Muhammad Saad Thaniana
Audit Committee
Syed Zahid Hussain Chairman, Non-Executive Director (Independent)
Nasir ShafiMember, Non-Executive Director
S.M. EhtishamullahMember, Non-Executive Director
Human Resource and Remuneration Committee
Syed Zahid Hussain Chairman, Non-Executive Director (Independent)
S.M. EhtishamullahMember, Non-Executive Director
Zahid BashirMember, Non-Executive Director
Governance and Evaluation Committee
Ahmad WaqarChairman, Non-Executive Director (Independent)
Zahid BashirMember, Non-Executive Director
The Management
Chief Executive Officer and Managing DirectorAhsan M. Saleem – 1983*
Chief Financial OfficerMuhammad Saad Thaniana – 2007*
BU Head – Steel Division Iqbal Zafar Siddiqui – 2008*
BU Head – Cotton Division Abdul Rouf – 2000*
Human Resource AdvisorEhsan Durrani – 2008*
Head of Marketing – Steel Division Arif Raza – 1985*
Head of Manufacturing – Steel Division Mushtaque Ahmed – 1985*
Head of Corporate AffairsHajerah A. Saleem – 2012*
Resident Director (CCP)Hasan Altaf Saleem – 2010*
Stock Exchange Listing
Crescent Steel and Allied Products Limited is a listed Company and its shares are traded on all the three stock exchanges of Pakistan. The Company’s shares are quoted in leading dailies under the Industrial metals and Mining Sector.
Public Information
Financial analysts, stock brokers, interested investors and financial media desiring information regarding the Company should contact Mr. Abdul Wahab at the Company’s Principal Office, Karachi.Tel: +92 21 3567 4881-85Email: [email protected]
Shareholders’ information
Enquiries concerning lost share certificates, dividend payments, change of address, verification of transfer deeds and share transfers should be directed to M/s CorpTec Associates (Private) Limited, 503-E Johar Town, Lahore. Tel: +92 42 3517 0336-37Fax: +92 42 3517 0338Email: [email protected]
Products
Steel division
Manufacturer of DSAW steel line pipes in diameters ranging from 8” to 90” and applicator of internal and external coating conforming to international standards.
Fabrication of machinery for sugar and cement industry.
Cotton division
Manufacturer of quality cotton yarn of various counts of 6s to 30s including compact, slub and siro.
* Year joined Company
COMPANY INFORMATION
Condensed Interim Report for the First Quarter Ended 30 September 2014 3
Auditors
KPMG Taseer Hadi & Co.
Legal advisor
Hassan and Hassan, Advocates, Lahore
Bankers
Allied Bank Limited Al-Baraka Bank (Pakistan) Ltd.Habib Metropolitan Bank Limited Industrial Commercial Bank of China MCB Bank LimitedSummit Bank LimitedStandard Chartered Bank (Pakistan) Limited
Registered office
10th Floor, BOP Tower, 10-B, Block E-2, Main Boulevard, Gulberg-III, Lahore.Tel: +92 42 3578 3801-03Fax: +92 42 3578 3811
Liaison office Lahore
10th Floor, BOP Tower, 10-B, Block E-2, Main Boulevard, Gulberg-III, Lahore.Tel: +92 42 3578 3801-03Fax: +92 42 3578 3811Email: [email protected]
Principal office
9th Floor, Sidco Avenue Centre, 264 R.A. Lines, Karachi-74200.Tel: +92 21 3567 4881-85Fax: +92 21 3568 0476Email: [email protected]
Factory – Steel division
Pipe and Coating plants
A/25, S.I.T.E., Nooriabad, DistrictJamshoro, Sindh.Tel: +92 25 4670 020-22 +92 25 4670 055Email: [email protected]
Engineering unit
17 Km Summundri Road, Dalowal, District Faisalabad, Punjab. Tel : +92 41 2569 825-26Fax: +92 41 2679 825
Mills – Cotton Division
Crescent Cotton Products (Spinning Unit)1st Mile, Lahore Road, Jaranwala, District Faisalabad, Punjab. Tel : +92 41 4318 061-65Fax: +92 41 4318 066Email: [email protected]
Power plant
Shakarganj Energy (Private) Limited 57 Km Jhang Sargodha Road, Bhone, District Jhang.Tel: +92 48 6889 210 – 12
Crescent Hadeed (Private) Limited
57 Kilometer, Jhang Sargodha Road, Bhone, District JhangTel: 047 6006111
Corporate website
To visit our website, go to www.crescent.com.pk or scan QR code
For Condensed Interim Report for the first quarter ended September 2014, go to http://www.crescent.com.pk/wp-content/uploads/2014/10/Quarter-Sep14.pdf or scan QR code
COMPANY INFORMATION
Crescent Steel and Allied Products Limited4
Crescent Steel and Allied
Products Limited (CSAPL) is a
Public Limited Company listed
on all the Stock Exchanges of
Pakistan. It started commercial
production in March 1987. The
manufacturing facilities consist
of a Spiral Pipe Production line
and an Internal/External Coating
line, both located side by side
at the Sindh Industrial Trading
Estate, Nooriabad in Jamshoro,
Sindh and a Cotton Spinning Unit
of 19,680 spindles at Jaranwala,
Punjab. Company’s Investment
and Infrastructure Development
Division manages an investment
portfolio and real estate.
Crescent Steel and Allied
Products Limited is an equal
opportunity employer with a
sense of social responsibility
and strongly supports education,
healthcare and environmental
causes.
STEEL DIVISION
The Spiral Pipe Plant has the
capability of manufacturing
high quality steel pipes in the
diameter range of 8” – 90”
(219 mm – 2,286 mm) in wall
thickness from 4 mm – 20
mm and material grades up
to API 5L X-80. The Company
has been gradually enhancing
the pipe production capacity
which has increased to the
present notional capacity of
90,000 tonnes extendable up
to maximum 200,000 tonnes
per annum. The Company
has authorization to use API
monogram of the American
Petroleum Institute (API) – the
highest international standard
accredited for quality of steel
line pipe. It also has the ISO
9001:2008 certification. In
addition, CSAPL is the first
Pakistani company to acquire oil
and gas industry specific ISO/
TS 29001, Quality Management
System Certification from API.
The external Coating Plant is
capable of applying coatings
such as Multi-Layer Polyolefin
coatings, Single Layer Fusion
Bonded Epoxy coatings, Liquid
Epoxy coatings and High
Temperature Heat Shrink Tape
Coatings on steel pipes ranging
from 4” – 60” (114 mm – 1,524
mm). Furthermore, the division
is also capable for cold applied
tape coatings on pipe diameter
above 60” (1,524 mm) and
internal epoxy coating for flow
efficiency and/or corrosion
protection on diameters ranging
from 8” – 60” (219 mm – 1524
mm).
CSAPL has diversified its
product offering by adding
capabilities to fabricate and
erect machinery especially for
sugar and cement industry.
This diversification enables
the Company to manufacture
machineries such as boilers,
cane shredders up to diameter
of 1700mm, juice heaters,
evaporators, batch and
continuous vacuum pans,
centrifugal machines, stainless
steel spray clusters and multi-
jet condensers, perforated
plates and vibro screens, and
high voltage transformer tanks.
Crescent Steel maintains
high quality norms in all its
products and has consistently
exceeded the requirements of
international standards both in
steel line pipe manufacturing
and coatings and will continue
to remain at the cutting edge of
technology, quality control and
quality assurance.
COTTON DIVISION
The Company is running
cotton spinning mill located
at Jaranwala near Faisalabad,
which is the hub of textile
industry and carries out this
activity under the name and
title of “Crescent Cotton
Products” (CCP) a division
of Crescent Steel and Allied
Products Limited. CCP is a
division of the Company but its
operating results are shown
separately. CCP as a division
holds ISO 9001: 2008 Quality
Management Credentials, is
registered with Ministry of
Textile Industry Pakistan and
is a member of International
Cotton Association Limited (ICA
Limited) and All Pakistan Textile
Mills Association (APTMA).
COMPANY PROFILE
Condensed Interim Report for the First Quarter Ended 30 September 2014 5
CCP produces good quality
cotton yarn with value addition
of Slub, Siro and Compact
Attachments. CCP consisting of
19,680 spindles is equipped with
modern high-tech European and
Japanese machinery ensuring
a high-quality yarn making
process, producing various
counts from 6s to 30s and has a
notional capacity (based on 20s)
of 6.5 million kgs per annum.
CCP products are consistently in
demand and generally sold at a
premium.
INVESTMENT AND
INFRASTRUCTURE
DEVELOPMENT DIVISION
The division manages a portfolio
of equity investments and real
estate. The portfolio is balanced
in a way that spreads risk over a
diversified spectrum and offers
potential for growth as well as
dividend yields.
SUBSIDIARY COMPANIES
CS CAPITAL (PRIVATE) LIMITED
CS Capital (Private) Limited
is a fully owned subsidiary.
The principal activity of the
subsidiary is to manage
investment portfolios in shares,
real estate, commodities and
other securities (strategic as
well as short term).
SHAKARGANJ ENERGY
(PRIVATE) LIMITED
Shakarganj Energy (Private)
Limited (SEL) has developed a
co-generation, bagasse fired
thermal generation power plant
due to commence commercial
operations in November 2013.
The primary business of the
subsidiary is to generate,
accumulate, distribute, sell and
supply electricity to FESCO,
PEPCO and to other distribution
companies as permitted.
This plant is currently under
commissioning at Bhone,
Punjab.
Solution De Energy (Private)
Limited
Solution De Energy (Private)
Limited was incorporated as
a private limited company
in Pakistan as a result of
Joint Venture (JV) agreement
executed on 8 October 2013.
The principle activity of the
company is to build, own,
operate and maintain 100MW
solar power project and
to generate, accumulate,
distribute, sell, and supply
electricity/power to PEPCO/
DISCOS under the agreement
with the Government of
Pakistan or to any other
consumer as permitted.
CRESCENT HADEED (PRIVATE)
LIMITED
Crescent Hadeed (Private)
Limited (the Company) was
incorporated on 15 May 2013
as a private limited company in
Pakistan under the provisions of
the Companies Ordinance, 1984.
The principal business of the
Company is to manufacture and
sale of steel billets through a
Steel Melting plant, to be located
at Bhone, District Jhang, Punjab.
The Company is currently in the
process of setting up its plant/
factory.
COMPANY PROFILE
Crescent Steel and Allied Products Limited6
Dear Shareholders
I am pleased to present the unaudited unconsolidated and consolidated condensed interim financial information of the Company and the Group respectively for the three months period ended 30 September 2014.
Economic OutlookThe first quarter of the new fiscal year was marred with political turmoil while the country continued to battle structural and economic challenges - specifically in terms of reliable energy, security and, the balance of payments position. A major development during the quarter is the fall in global oil prices and the subsequent easing in circular debt. Energy security continues to underpin growth, as businesses are unable to operate at desired capacity. Going forward, a stable macroeconomic environment hinges on the government’s ability to maintain foreign inflows, address security challenges and ensure follow through on structural and economic reforms.
Financial and Operational PerformanceOverall financial performance
On the basis of unconsolidated results for the three months period ended 30 September 2014 (Q1FY15) the Company’s after tax profit declined to Rs. 71.8 million as compared to Rs. 119.1 million in the same period last year. The decline in PAT is mainly attributable to the net loss before
tax of Cotton Division of Rs. 23.9 million (Q1FY14: Rs. 5.1 million) and Steel Division of Rs. 1.8 million (Q1FY14: Rs. 42.1 million) during the period respectively. IID Division posted a profit before tax of Rs. 100.2 million (Q1FY14: Rs. 183.1 million) during the period. Earnings per share (EPS) for the current period stood at Rs. 1.16 as compared to EPS of Rs. 1.92 in the corresponding period last year.
Sales revenue amounted to Rs. 497.9 million (Q1FY14: Rs. 965.5 million), contributed mainly (71.6%) by the cotton division at Rs. 357.0 million (Q1FY14: Rs. 937.4 million). Compared to same period last year, outsourcing of yarn manufacturing was not availed during the period due to volatility of the yarn market resulting in an overall decline in sales of cotton division and the Company. Sales revenue from the Steel Division amounted to Rs. 140.9 million (Q1FY14: Rs. 28.1 million) whereas investment income from IID Division amounted to Rs. 104.9 million (Q1FY14: Rs. 179.8 million including impacts of Rs. 211 million on reclassification of AFS investments to HFT).
On consolidated basis, operating loss before finance cost amounted to Rs. 14.7 million (2013 PBIT: Rs. 133.9 million) after eliminating aggregate dividend income of Rs. 109.6 million from associate and subsidiary company. Net share of loss from equity-accounted associates amounted to Rs. 64.0 million (Q1FY14 share of profit: Rs. 108.5 million). This significant decline is due to recognition of
deferred tax charge amounting to Rs. 644.8 million on undistributed profits of Rousch (Pakistan) Power Limited in the consolidated results of Altern Energy Limited (AEL) during quarter ending 30 June 2014. Consequently, consolidated loss after tax and LPS of the Group for Q1FY15 amounted to Rs. 86.5 million and Rs. 1.39 per share as compared to profit after tax of Rs. 212.3 million and EPS of Rs. 3.42 per share respectively in the corresponding period last year.
Summary of operating results as per unconsolidated financial information of the Company
• Sales revenue declined to Rs. 497.9 million as compared to Rs. 965.5 million in Q1FY14.
• Investment income decreased to Rs. 104.9 million as compared to Rs. 179.8 million in Q1FY14.
• Other income declined to Rs. 8.7 million as compared to Rs. 27.2 million in the corresponding period last year.
• Gross Profit increased to Rs. 15.3 million as compared to a gross loss of Rs. 1.3 million in Q1FY14.
• EBITDA decreased to Rs. 111.7 million as compared to Rs. 172.3 million in Q1FY14.
• EPS stood at Rs. 1.16 for the current period, as compared to EPS of Rs. 1.92 for Q1FY14.
• Return on average capital employed (annualized) was 7.5% for the current period as compared to 13.3% for the
DIRECTORS’ REVIEW
Condensed Interim Report for the First Quarter Ended 30 September 2014 7
corresponding period last year.
• Return on average equity (annualized) was 7.0% for the current quarter as compared to 12.1% for the corresponding period last year.
• Break-up value per share increased to Rs. 65.7 from Rs. 64.5 as at 30 June 2014.
Business SegmentsSteel segment
Segment performance
Steel segment underperformed during the quarter on account of low order intake. Tenders for bare pipe orders, are still at the customer’s evaluation stage; and delay in execution of projects by the customers. Therefore,
capacity to meet targeted production level. Compared to same period last year production was down by 11.5% while sales volume declined by 22.2%. Accordingly, the division reported sales revenue of Rs. 356.9 million including Rs. 20.5 million pertaining to export of fabric (Q1FY14: Rs. 937.4 million; including outsourced yarn conversion sales of Rs. 453.2 million).
Loss before tax for the period was Rs. 23.9 million (Q1FY14 PBT: Rs. 5.1 million) mainly due to an increase in power and gas tariff against a decline in yarn selling prices.
Investment and Infrastructure Development (IID) segment
Market Review
The benchmark KSE-100 posted gains of 4.06% in September to close the quarter at 29,726 points, up 0.25% - the lowest quarterly returns since Q4FY12. Strong corporate profitability and foreign flows despite an uncertain political environment helped contain the index within the 29,000 – 30,000 points range. The market however remained volatile throughout the quarter.
Segment performance – Unconsolidated
During the period under review, IID division’s CSAPL portfolio of equity investments recorded an ROI of 21.7% on average investments of Rs. 470 million (excluding strategic investments).
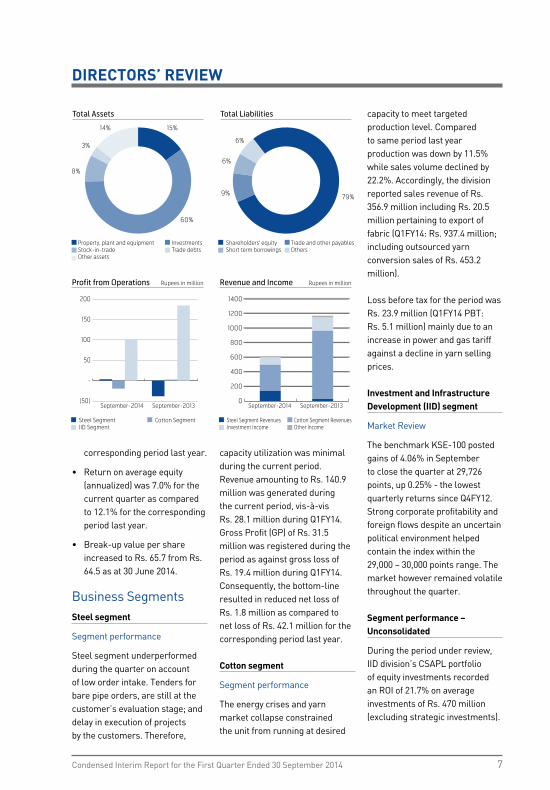
Profit from Operations
Steel Segment Cotton SegmentIID Segment
(50)
-
50
100
150
200
Rupees in million
September-2014 September-2013
Revenue and Income
Steel Segment Revenues Cotton Segment RevenuesInvestment Income Other Income
0
200
400
600
800
1000
1200
1400
Rupees in million
September-2014 September-2013
Total Assets
Property, plant and equipment InvestmentsStock-in-trade Trade debtsOther assets
15%
60%
8%
3%
14%
Total Liabilities
Shareholders' equity Trade and other payablesShort term borrowings Others
6%
79%9%
6%
capacity utilization was minimal during the current period. Revenue amounting to Rs. 140.9 million was generated during the current period, vis-à-vis Rs. 28.1 million during Q1FY14. Gross Profit (GP) of Rs. 31.5 million was registered during the period as against gross loss of Rs. 19.4 million during Q1FY14. Consequently, the bottom-line resulted in reduced net loss of Rs. 1.8 million as compared to net loss of Rs. 42.1 million for the corresponding period last year.
Cotton segment
Segment performance
The energy crises and yarn market collapse constrained the unit from running at desired
DIRECTORS’ REVIEW
Crescent Steel and Allied Products Limited8
Income from investment activities during the period amounted to Rs. 104.9 million (Q1FY14: Rs. 179.8 million). The division’s profit before tax stood at Rs. 100.2 million, compared to PBT of Rs. 183.1 million in Q1FY14. The YoY variance in PBT is due to profit impacts of Rs. 211.4 million booked in Q1FY14, against reclassification of AFS investments into HFT investments after a change in their status from closed end to open end funds.
Closing position of investment portfolio was Rs. 3,037.7 million as compared to Rs. 2,844.1 million as of 30 June 2014.
Segment performance – Consolidated
As per consolidated results, loss before taxation for IID Division for the Q1FY15 was Rs. 59.1 million compared to PBT of Rs. 266.6 million for Q1FY14. This is mainly attributable to share of loss amounting to Rs. 60.4 million (Q1FY14 share of profit: Rs. 94.8 million) from equity accounted investments in associate as explained earlier in the review.
The value of investments portfolio as of 30 September 2014 was Rs. 3,504.6 million as compared to Rs. 3,518.5 million as of 30 June 2014.
Financial PositionBalance sheet
Balance sheet footing stood at Rs. 5,152.9 million as of 30 September 2014, compared to Rs. 4,733.0 million as of 30 June 2014. Break-up value per share
increased to Rs. 65.7 from Rs. 64.5 as at 30 June 2014.
Current ratio as at 30 September 2014 declined marginally to 2.2: 1 from 2.3: 1 as at 30 June 2014. Gearing ratio increased to 11% as at 30 September 2014 over 5% as at 30 June 2014, mainly due to the availing of long term loan facility for planned capital expenditure of the Company.
On a Group basis, the consolidated balance sheet footing increased to Rs. 6,418.3 million, compared to Rs. 6,165.2 million as of 30 June 2014. Total shareholders’ fund reduced to Rs. 5,147.4 million from Rs. 5,246.2 million as of 30 June 2014. Break-up value per share declined to Rs. 82.9 from Rs. 84.5 as at 30 June 2014.
Future OutlookFuture outlook for steel division is promising, it is expected that orders will be issued against tenders of gas distribution companies in the second quarter of FY15; therefore we expect business activity to pick up during the third quarter of FY15 and thus provide momentum for the remainder of FY15.
Major projects in the water sector are also expected to be initiated during FY15. Order execution however depends largely on financial strength of the gas distribution companies and the lingering circular-debt issue. Steel prices are stable, and are expected to remain range-bound over the next six months.
Cotton and yarn prices have declined in local and international market on arrival of new crop. Demand for yarn in China as well as local market is low, which will keep the yarn prices under pressure. However, there is room for spinners to generate margins from difference in cotton and yarn prices provided adequate gas supply is available to operate at full capacity.
Performance of equity market will be largely based on consumer spending, foreign inflows, privatization, political and security situation. Inflation is expected to remain in single digit together with an unchanged monitory policy, while healthy corporate earnings are likely to back KSE-100 index in the remaining FY15.
Finally, I would like to thank all stakeholders for their patronage and look forward to their continued support.
For and on behalf of the Board of Directors
Ahsan M. SaleemChief Executive Officer28 October 2014
DIRECTORS’ REVIEW
Condensed Interim Report for the First Quarter Ended 30 September 2014 9
Crescent Steel and Allied Products Limited
Condensed Interim Unconsolidated Financial Information (Unaudited)
For the first quarter ended 30 September 2014
Crescent Steel and Allied Products Limited10
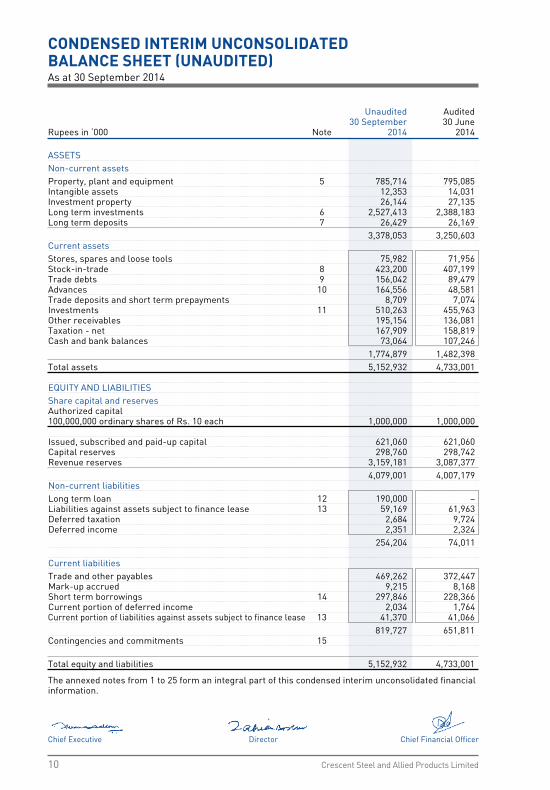
CONDENSED INTERIM UNCONSOLIDATED BALANCE SHEET (UNAUDITED)As at 30 September 2014
Chief Executive Director Chief Financial Officer
Unaudited Audited 30 September 30 JuneRupees in ‘000 Note 2014 2014
ASSETS Non-current assets Property, plant and equipment 5 785,714 795,085 Intangible assets 12,353 14,031 Investment property 26,144 27,135 Long term investments 6 2,527,413 2,388,183 Long term deposits 7 26,429 26,169 3,378,053 3,250,603 Current assets Stores, spares and loose tools 75,982 71,956 Stock-in-trade 8 423,200 407,199 Trade debts 9 156,042 89,479 Advances 10 164,556 48,581 Trade deposits and short term prepayments 8,709 7,074 Investments 11 510,263 455,963 Other receivables 195,154 136,081 Taxation - net 167,909 158,819 Cash and bank balances 73,064 107,246 1,774,879 1,482,398 Total assets 5,152,932 4,733,001 EQUITY AND LIABILITIES Share capital and reserves Authorized capital 100,000,000 ordinary shares of Rs. 10 each 1,000,000 1,000,000 Issued, subscribed and paid-up capital 621,060 621,060 Capital reserves 298,760 298,742 Revenue reserves 3,159,181 3,087,377 4,079,001 4,007,179 Non-current liabilities Long term loan 12 190,000 – Liabilities against assets subject to finance lease 13 59,169 61,963 Deferred taxation 2,684 9,724 Deferred income 2,351 2,324 254,204 74,011 Current liabilities Trade and other payables 469,262 372,447 Mark-up accrued 9,215 8,168 Short term borrowings 14 297,846 228,366 Current portion of deferred income 2,034 1,764 Current portion of liabilities against assets subject to finance lease 13 41,370 41,066 819,727 651,811 Contingencies and commitments 15 Total equity and liabilities 5,152,932 4,733,001
The annexed notes from 1 to 25 form an integral part of this condensed interim unconsolidated financial information.
Condensed Interim Report for the First Quarter Ended 30 September 2014 11
Chief Executive Director Chief Financial Officer
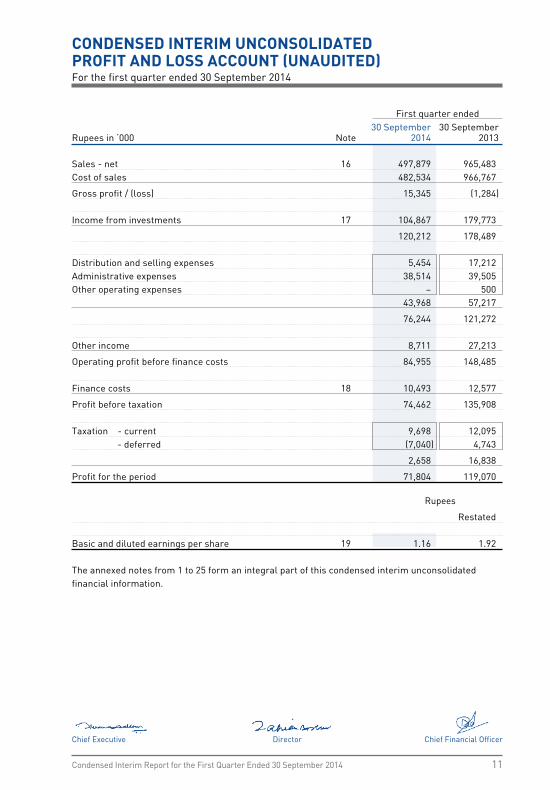
CONDENSED INTERIM UNCONSOLIDATED PROFIT AND LOSS ACCOUNT (UNAUDITED)For the first quarter ended 30 September 2014
First quarter ended 30 September 30 SeptemberRupees in ‘000 Note 2014 2013
Sales - net 16 497,879 965,483 Cost of sales 482,534 966,767
Gross profit / (loss) 15,345 (1,284) Income from investments 17 104,867 179,773
120,212 178,489 Distribution and selling expenses 5,454 17,212 Administrative expenses 38,514 39,505 Other operating expenses – 500 43,968 57,217
76,244 121,272 Other income 8,711 27,213
Operating profit before finance costs 84,955 148,485 Finance costs 18 10,493 12,577
Profit before taxation 74,462 135,908 Taxation - current 9,698 12,095 - deferred (7,040) 4,743
2,658 16,838
Profit for the period 71,804 119,070
Rupees
Restated Basic and diluted earnings per share 19 1.16 1.92
The annexed notes from 1 to 25 form an integral part of this condensed interim unconsolidated financial information.
Crescent Steel and Allied Products Limited12
CONDENSED INTERIM UNCONSOLIDATED STATEMENT OF COMPREHENSIVE INCOME (UNAUDITED)For the first quarter ended 30 September 2014
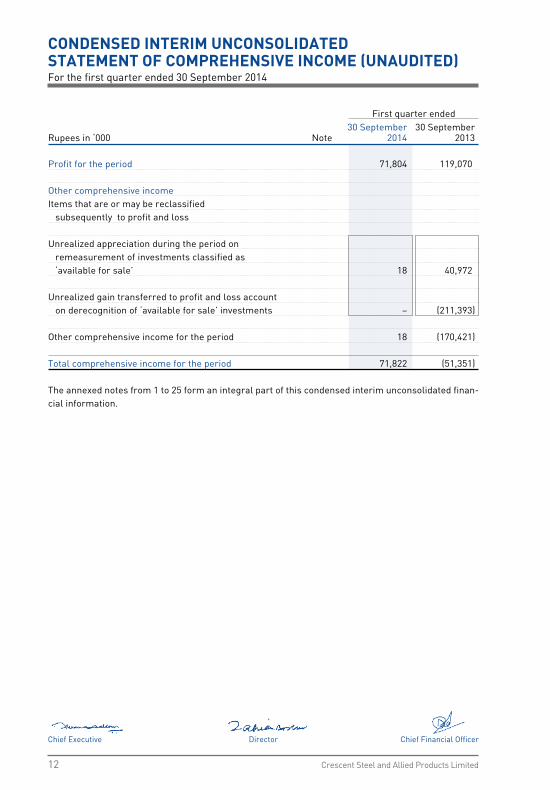
First quarter ended 30 September 30 SeptemberRupees in ‘000 Note 2014 2013
Profit for the period 71,804 119,070 Other comprehensive income Items that are or may be reclassified subsequently to profit and loss Unrealized appreciation during the period on remeasurement of investments classified as ‘available for sale’ 18 40,972 Unrealized gain transferred to profit and loss account on derecognition of ‘available for sale’ investments – (211,393) Other comprehensive income for the period 18 (170,421) Total comprehensive income for the period 71,822 (51,351) The annexed notes from 1 to 25 form an integral part of this condensed interim unconsolidated finan-cial information.
Chief Executive Director Chief Financial Officer
Condensed Interim Report for the First Quarter Ended 30 September 2014 13
CONDENSED INTERIM UNCONSOLIDATED CASH FLOW STATEMENT (UNAUDITED)For the first quarter ended 30 September 2014
First quarter ended 30 September 30 SeptemberRupees in ‘000 Note 2014 2013
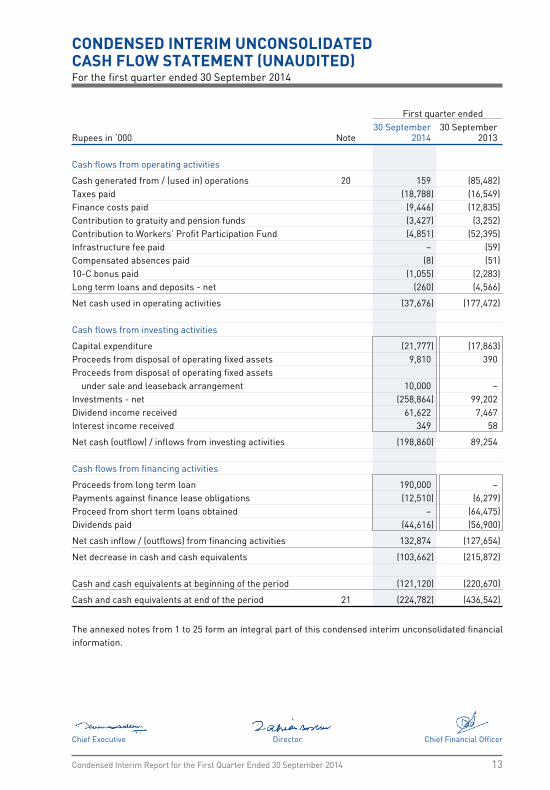
Cash flows from operating activities
Cash generated from / (used in) operations 20 159 (85,482)Taxes paid (18,788) (16,549)Finance costs paid (9,446) (12,835)Contribution to gratuity and pension funds (3,427) (3,252)Contribution to Workers’ Profit Participation Fund (4,851) (52,395)Infrastructure fee paid – (59)Compensated absences paid (8) (51)10-C bonus paid (1,055) (2,283)Long term loans and deposits - net (260) (4,566)
Net cash used in operating activities (37,676) (177,472) Cash flows from investing activities
Capital expenditure (21,777) (17,863)Proceeds from disposal of operating fixed assets 9,810 390 Proceeds from disposal of operating fixed assets under sale and leaseback arrangement 10,000 –Investments - net (258,864) 99,202 Dividend income received 61,622 7,467 Interest income received 349 58
Net cash (outflow) / inflows from investing activities (198,860) 89,254 Cash flows from financing activities
Proceeds from long term loan 190,000 – Payments against finance lease obligations (12,510) (6,279)Proceed from short term loans obtained – (64,475)Dividends paid (44,616) (56,900)
Net cash inflow / (outflows) from financing activities 132,874 (127,654)
Net decrease in cash and cash equivalents (103,662) (215,872) Cash and cash equivalents at beginning of the period (121,120) (220,670)
Cash and cash equivalents at end of the period 21 (224,782) (436,542)
The annexed notes from 1 to 25 form an integral part of this condensed interim unconsolidated financial information.
Chief Executive Director Chief Financial Officer
Crescent Steel and Allied Products Limited14
CONDENSED INTERIM UNCONSOLIDATED STATEMENT OF CHANGES IN EQUITY (UNAUDITED)For the first quarter ended 30 September 2014
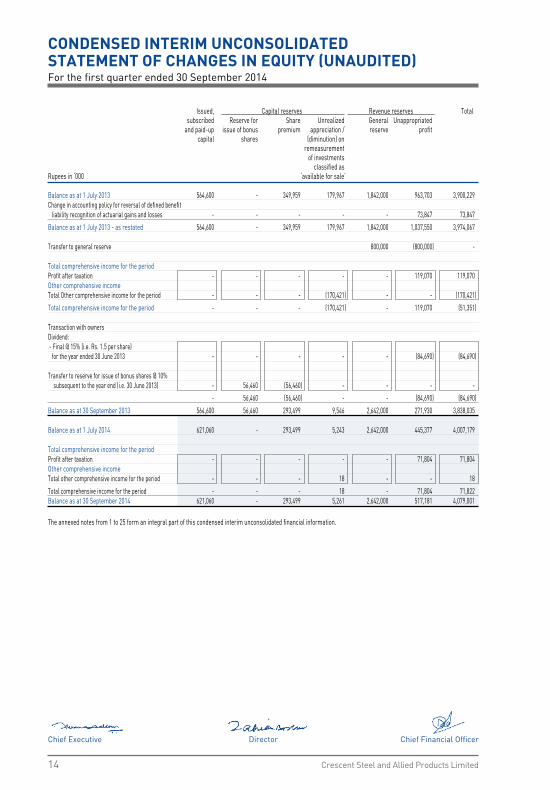
Issued, Capital reserves Revenue reserves Total subscribed Reserve for Share Unrealized General Unappropriated and paid-up issue of bonus premium appreciation / reserve profit capital shares (diminution) on remeasurement of investments classified as Rupees in ‘000 ‘available for sale’ Balance as at 1 July 2013 564,600 - 349,959 179,967 1,842,000 963,703 3,900,229 Change in accounting policy for reversal of defined benefit liability recognition of actuarial gains and losses - - - - - 73,847 73,847
Balance as at 1 July 2013 - as restated 564,600 - 349,959 179,967 1,842,000 1,037,550 3,974,067 Transfer to general reserve 800,000 (800,000) - Total comprehensive income for the period Profit after taxation - - - - - 119,070 119,070 Other comprehensive income Total Other comprehensive income for the period - - - (170,421) - - (170,421)
Total comprehensive income for the period - - - (170,421) - 119,070 (51,351) Transaction with owners Dividend: - Final @ 15% (i.e. Rs. 1.5 per share) for the year ended 30 June 2013 - - - - - (84,690) (84,690) Transfer to reserve for issue of bonus shares @ 10% subsequent to the year end (i.e. 30 June 2013) - 56,460 (56,460) - - - -
- 56,460 (56,460) - - (84,690) (84,690)
Balance as at 30 September 2013 564,600 56,460 293,499 9,546 2,642,000 271,930 3,838,035 Balance as at 1 July 2014 621,060 - 293,499 5,243 2,642,000 445,377 4,007,179
Total comprehensive income for the period Profit after taxation - - - - - 71,804 71,804 Other comprehensive income Total other comprehensive income for the period - - - 18 - - 18
Total comprehensive income for the period - - - 18 - 71,804 71,822 Balance as at 30 September 2014 621,060 - 293,499 5,261 2,642,000 517,181 4,079,001
The annexed notes from 1 to 25 form an integral part of this condensed interim unconsolidated financial information.
Chief Executive Director Chief Financial Officer
Condensed Interim Report for the First Quarter Ended 30 September 2014 15
NOTES TO THE CONDENSED INTERIM UNCONSOLIDATED FINANCIAL INFORMATION (UNAUDITED)For the first quarter ended 30 September 2014
1. THE COMPANY AND ITS OPERATIONS
Crescent Steel and Allied Products Limited (“the Company”) was incorporated on 1 August 1983 as a public limited company in Pakistan under the Companies Act, 1913 (now Companies Ordinance, 1984) and is quoted on all stock exchanges of Pakistan. The registered office of the Company is located at 10th floor, BOP Tower, 10-B, Block E-2, Main Boulevard, Gulberg-III, Lahore. Whereas its principal office is situated at 9th floor Sidco Avenue Centre 264 R.A. Lines, Karachi.
The Company operates three segments Steel, Cotton and Investment and Infrastructure
Development (IID) segment as disclosed in note 22.1. 2. BASIS OF PREPARATION
2.1 This condensed interim unconsolidated financial information of the Company for the three months period ended 30 September 2014 has been prepared in accordance with the requirements of the International Accounting Standards 34 “Interim Financial Reporting” and provisions of and directives issued under the Companies Ordinance, 1984. In case where requirements differ, the provisions of or directives issued under the Companies Ordinance, 1984 have been followed.
2.2 This condensed interim unconsolidated financial information of the Company does not include all
of the information required for full annual financial statements and should be read in conjunction with the annual separate financial statements of the Company as at and for the year ended 30 June 2014.
2.3 This condensed interim unconsolidated financial information is presented in Pakistan Rupees which
is also the Company’s functional currency and all financial information presented has been rounded off to the nearest thousand, except otherwise stated.
3. ACCOUNTING POLICIES
The accounting policies and methods of computation adopted in the preparation of this condensed interim unconsolidated financial information are the same as those applied in the preparation of audited annual separate financial statements of the Company for the year ended 30 June 2014.
4. ESTIMATES AND JUDGEMENTS
4.1 The preparation of condensed interim unconsolidated financial information requires management to make judgments, estimates and assumptions that affect the application of accounting policies and the reporting amounts of assets and liabilities, income and expenses. Actual results may differ from these estimates.
4.2 Estimates and judgements made by management in the preparation of this condensed interim
unconsolidated financial information are the same as those that were applied to the annual separate financial statements of the Company as at and for the year ended 30 June 2014.
Crescent Steel and Allied Products Limited16
NOTES TO THE CONDENSED INTERIM UNCONSOLIDATED FINANCIAL INFORMATION (UNAUDITED)For the first quarter ended 30 September 2014
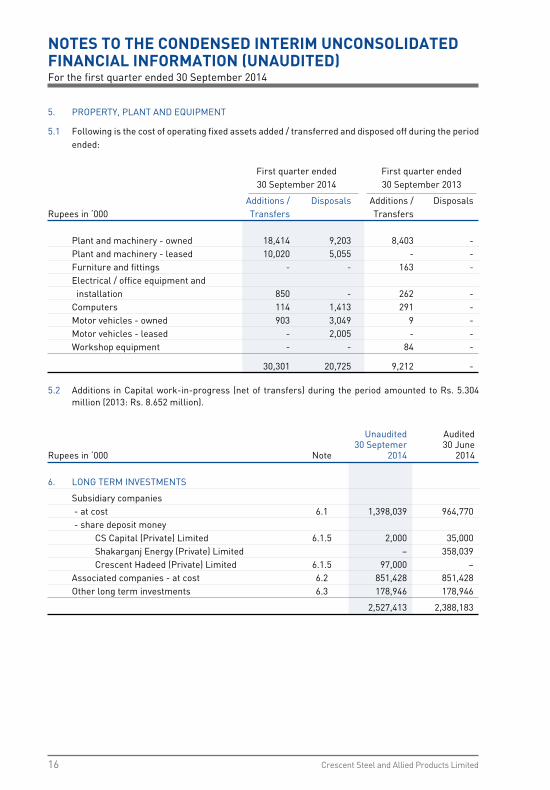
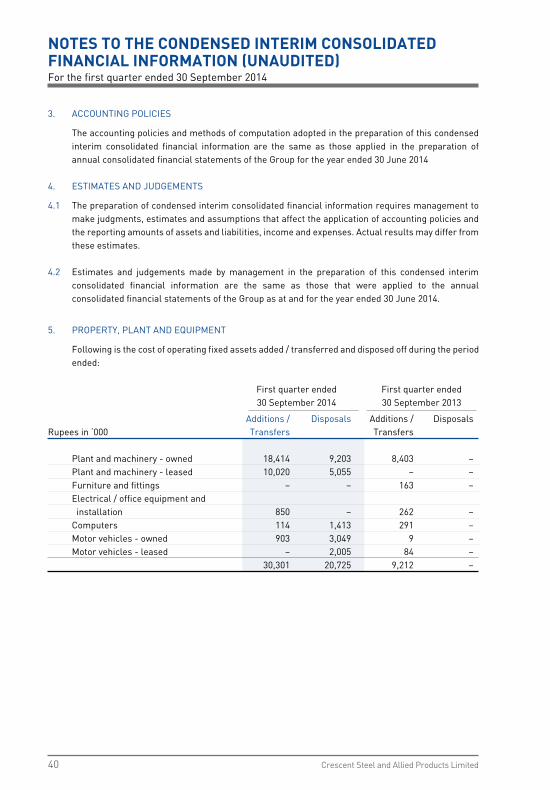
5. PROPERTY, PLANT AND EQUIPMENT
5.1 Following is the cost of operating fixed assets added / transferred and disposed off during the period ended:
First quarter ended First quarter ended 30 September 2014 30 September 2013
Additions / Disposals Additions / DisposalsRupees in ‘000 Transfers Transfers Plant and machinery - owned 18,414 9,203 8,403 - Plant and machinery - leased 10,020 5,055 - - Furniture and fittings - - 163 - Electrical / office equipment and installation 850 - 262 - Computers 114 1,413 291 - Motor vehicles - owned 903 3,049 9 - Motor vehicles - leased - 2,005 - - Workshop equipment - - 84 -
30,301 20,725 9,212 -
5.2 Additions in Capital work-in-progress (net of transfers) during the period amounted to Rs. 5.304 million (2013: Rs. 8.652 million).
Unaudited Audited 30 Septemer 30 JuneRupees in ‘000 Note 2014 2014
6. LONG TERM INVESTMENTS
Subsidiary companies - at cost 6.1 1,398,039 964,770 - share deposit money CS Capital (Private) Limited 6.1.5 2,000 35,000 Shakarganj Energy (Private) Limited – 358,039 Crescent Hadeed (Private) Limited 6.1.5 97,000 – Associated companies - at cost 6.2 851,428 851,428 Other long term investments 6.3 178,946 178,946
2,527,413 2,388,183
Condensed Interim Report for the First Quarter Ended 30 September 2014 17
NOTES TO THE CONDENSED INTERIM UNCONSOLIDATED FINANCIAL INFORMATION (UNAUDITED)For the first quarter ended 30 September 2014
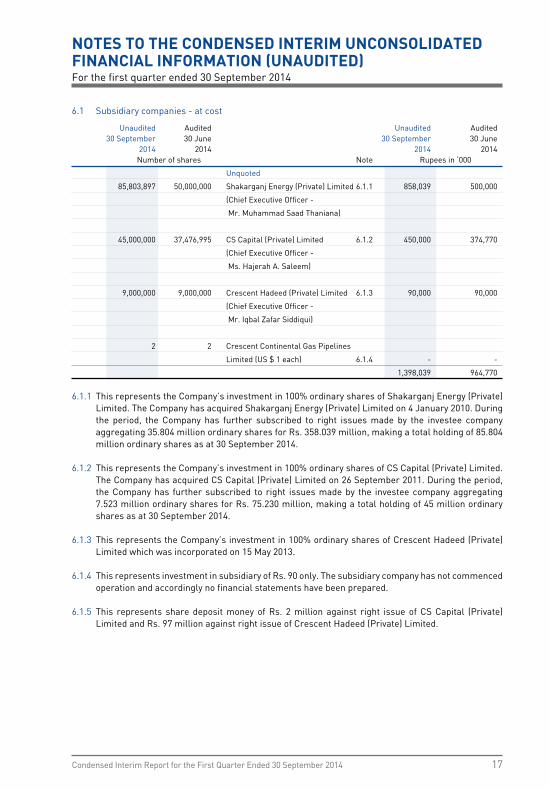
6.1 Subsidiary companies - at cost
Unaudited Audited Unaudited Audited 30 September 30 June 30 September 30 June 2014 2014 2014 2014 Number of shares Note Rupees in ‘000
Unquoted
85,803,897 50,000,000 Shakarganj Energy (Private) Limited 6.1.1 858,039 500,000
(Chief Executive Officer -
Mr. Muhammad Saad Thaniana)
45,000,000 37,476,995 CS Capital (Private) Limited 6.1.2 450,000 374,770
(Chief Executive Officer -
Ms. Hajerah A. Saleem)
9,000,000 9,000,000 Crescent Hadeed (Private) Limited 6.1.3 90,000 90,000
(Chief Executive Officer -
Mr. Iqbal Zafar Siddiqui)
2 2 Crescent Continental Gas Pipelines
Limited (US $ 1 each) 6.1.4 - -
1,398,039 964,770
6.1.1 This represents the Company’s investment in 100% ordinary shares of Shakarganj Energy (Private) Limited. The Company has acquired Shakarganj Energy (Private) Limited on 4 January 2010. During the period, the Company has further subscribed to right issues made by the investee company aggregating 35.804 million ordinary shares for Rs. 358.039 million, making a total holding of 85.804 million ordinary shares as at 30 September 2014.
6.1.2 This represents the Company’s investment in 100% ordinary shares of CS Capital (Private) Limited.
The Company has acquired CS Capital (Private) Limited on 26 September 2011. During the period, the Company has further subscribed to right issues made by the investee company aggregating 7.523 million ordinary shares for Rs. 75.230 million, making a total holding of 45 million ordinary shares as at 30 September 2014.
6.1.3 This represents the Company’s investment in 100% ordinary shares of Crescent Hadeed (Private) Limited which was incorporated on 15 May 2013.
6.1.4 This represents investment in subsidiary of Rs. 90 only. The subsidiary company has not commenced
operation and accordingly no financial statements have been prepared. 6.1.5 This represents share deposit money of Rs. 2 million against right issue of CS Capital (Private)
Limited and Rs. 97 million against right issue of Crescent Hadeed (Private) Limited.
Crescent Steel and Allied Products Limited18
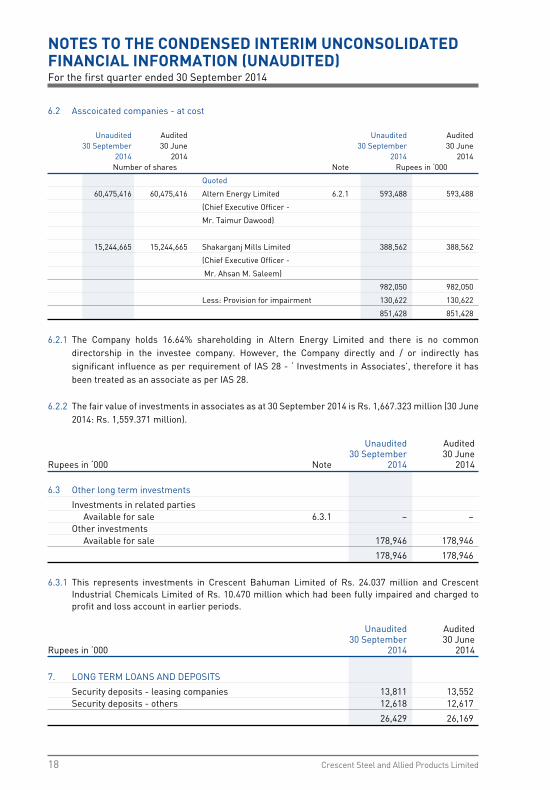
6.2 Asscoicated companies - at cost
Unaudited Audited Unaudited Audited 30 September 30 June 30 September 30 June 2014 2014 2014 2014 Number of shares Note Rupees in ‘000
Quoted
60,475,416 60,475,416 Altern Energy Limited 6.2.1 593,488 593,488
(Chief Executive Officer -
Mr. Taimur Dawood)
15,244,665 15,244,665 Shakarganj Mills Limited 388,562 388,562
(Chief Executive Officer -
Mr. Ahsan M. Saleem)
982,050 982,050
Less: Provision for impairment 130,622 130,622
851,428 851,428
6.2.1 The Company holds 16.64% shareholding in Altern Energy Limited and there is no common directorship in the investee company. However, the Company directly and / or indirectly has significant influence as per requirement of IAS 28 - ‘ Investments in Associates’, therefore it has been treated as an associate as per IAS 28.
6.2.2 The fair value of investments in associates as at 30 September 2014 is Rs. 1,667.323 million (30 June 2014: Rs. 1,559.371 million).
Unaudited Audited 30 September 30 JuneRupees in ‘000 Note 2014 2014
6.3 Other long term investments
Investments in related parties Available for sale 6.3.1 – – Other investments Available for sale 178,946 178,946
178,946 178,946
6.3.1 This represents investments in Crescent Bahuman Limited of Rs. 24.037 million and Crescent Industrial Chemicals Limited of Rs. 10.470 million which had been fully impaired and charged to profit and loss account in earlier periods.
Unaudited Audited 30 September 30 JuneRupees in ‘000 2014 2014
7. LONG TERM LOANS AND DEPOSITS
Security deposits - leasing companies 13,811 13,552 Security deposits - others 12,618 12,617
26,429 26,169
NOTES TO THE CONDENSED INTERIM UNCONSOLIDATED FINANCIAL INFORMATION (UNAUDITED)For the first quarter ended 30 September 2014
Condensed Interim Report for the First Quarter Ended 30 September 2014 19
Unaudited Audited 30 September 30 JuneRupees in ‘000 2014 2014
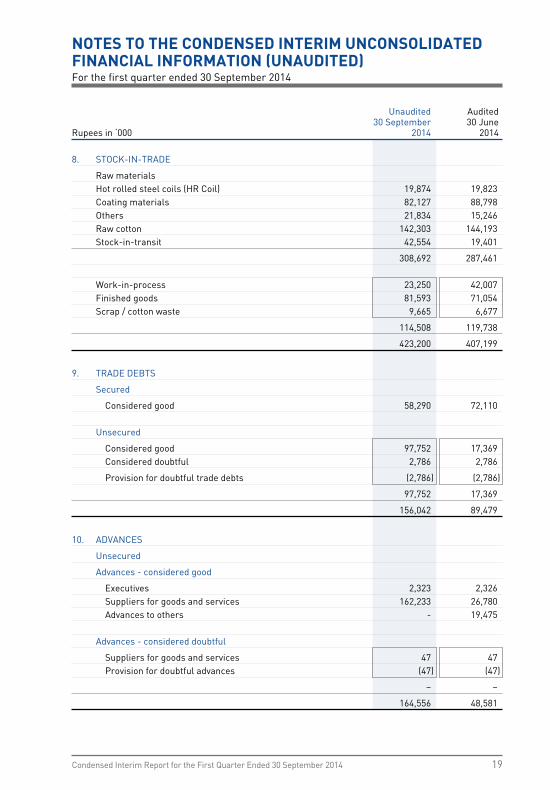
8. STOCK-IN-TRADE
Raw materials Hot rolled steel coils (HR Coil) 19,874 19,823 Coating materials 82,127 88,798 Others 21,834 15,246 Raw cotton 142,303 144,193 Stock-in-transit 42,554 19,401
308,692 287,461
Work-in-process 23,250 42,007 Finished goods 81,593 71,054 Scrap / cotton waste 9,665 6,677
114,508 119,738
423,200 407,199
9. TRADE DEBTS
Secured
Considered good 58,290 72,110 Unsecured
Considered good 97,752 17,369 Considered doubtful 2,786 2,786
Provision for doubtful trade debts (2,786) (2,786)
97,752 17,369
156,042 89,479
10. ADVANCES
Unsecured
Advances - considered good
Executives 2,323 2,326 Suppliers for goods and services 162,233 26,780 Advances to others - 19,475 Advances - considered doubtful
Suppliers for goods and services 47 47 Provision for doubtful advances (47) (47)
– –
164,556 48,581
NOTES TO THE CONDENSED INTERIM UNCONSOLIDATED FINANCIAL INFORMATION (UNAUDITED)For the first quarter ended 30 September 2014
Crescent Steel and Allied Products Limited20
Unaudited Audited 30 September 30 JuneRupees in ‘000 Note 2014 2014
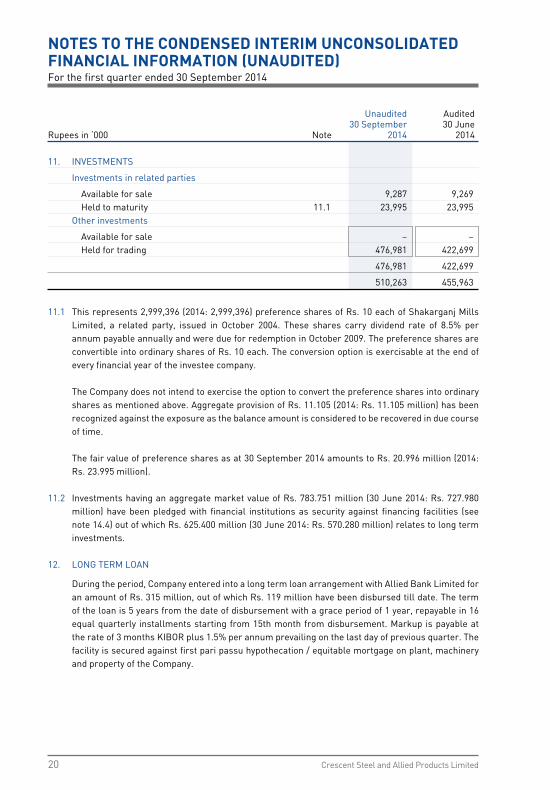
11. INVESTMENTS
Investments in related parties
Available for sale 9,287 9,269 Held to maturity 11.1 23,995 23,995 Other investments
Available for sale – – Held for trading 476,981 422,699
476,981 422,699
510,263 455,963
11.1 This represents 2,999,396 (2014: 2,999,396) preference shares of Rs. 10 each of Shakarganj Mills Limited, a related party, issued in October 2004. These shares carry dividend rate of 8.5% per annum payable annually and were due for redemption in October 2009. The preference shares are convertible into ordinary shares of Rs. 10 each. The conversion option is exercisable at the end of every financial year of the investee company.
The Company does not intend to exercise the option to convert the preference shares into ordinary shares as mentioned above. Aggregate provision of Rs. 11.105 (2014: Rs. 11.105 million) has been recognized against the exposure as the balance amount is considered to be recovered in due course of time.
The fair value of preference shares as at 30 September 2014 amounts to Rs. 20.996 million (2014: Rs. 23.995 million).
11.2 Investments having an aggregate market value of Rs. 783.751 million (30 June 2014: Rs. 727.980 million) have been pledged with financial institutions as security against financing facilities (see note 14.4) out of which Rs. 625.400 million (30 June 2014: Rs. 570.280 million) relates to long term investments.
12. LONG TERM LOAN
During the period, Company entered into a long term loan arrangement with Allied Bank Limited for an amount of Rs. 315 million, out of which Rs. 119 million have been disbursed till date. The term of the loan is 5 years from the date of disbursement with a grace period of 1 year, repayable in 16 equal quarterly installments starting from 15th month from disbursement. Markup is payable at the rate of 3 months KIBOR plus 1.5% per annum prevailing on the last day of previous quarter. The facility is secured against first pari passu hypothecation / equitable mortgage on plant, machinery and property of the Company.
NOTES TO THE CONDENSED INTERIM UNCONSOLIDATED FINANCIAL INFORMATION (UNAUDITED)For the first quarter ended 30 September 2014
Condensed Interim Report for the First Quarter Ended 30 September 2014 21
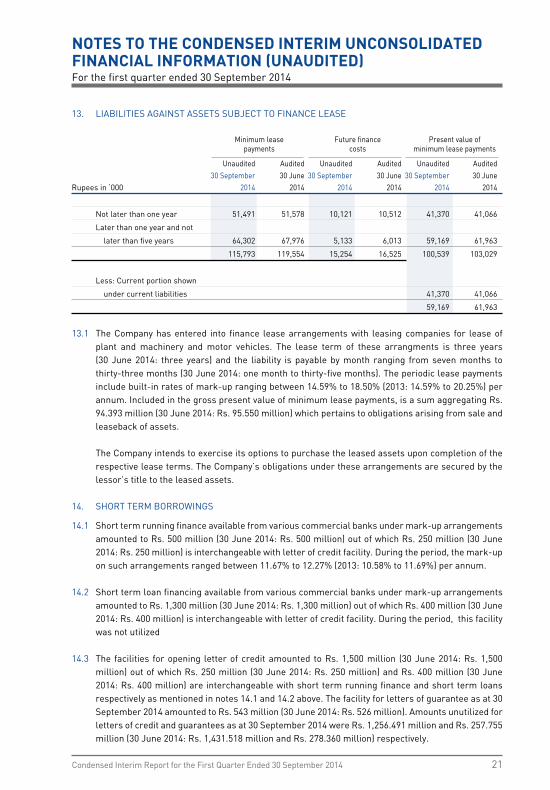
13. LIABILITIES AGAINST ASSETS SUBJECT TO FINANCE LEASE
Minimum lease Future finance Present value of payments costs minimum lease payments
Unaudited Audited Unaudited Audited Unaudited Audited 30 September 30 June 30 September 30 June 30 September 30 JuneRupees in ‘000 2014 2014 2014 2014 2014 2014
Not later than one year 51,491 51,578 10,121 10,512 41,370 41,066
Later than one year and not
later than five years 64,302 67,976 5,133 6,013 59,169 61,963
115,793 119,554 15,254 16,525 100,539 103,029
Less: Current portion shown
under current liabilities 41,370 41,066
59,169 61,963
13.1 The Company has entered into finance lease arrangements with leasing companies for lease of plant and machinery and motor vehicles. The lease term of these arrangments is three years (30 June 2014: three years) and the liability is payable by month ranging from seven months to thirty-three months (30 June 2014: one month to thirty-five months). The periodic lease payments include built-in rates of mark-up ranging between 14.59% to 18.50% (2013: 14.59% to 20.25%) per annum. Included in the gross present value of minimum lease payments, is a sum aggregating Rs. 94.393 million (30 June 2014: Rs. 95.550 million) which pertains to obligations arising from sale and leaseback of assets.
The Company intends to exercise its options to purchase the leased assets upon completion of the
respective lease terms. The Company’s obligations under these arrangements are secured by the lessor’s title to the leased assets.
14. SHORT TERM BORROWINGS
14.1 Short term running finance available from various commercial banks under mark-up arrangements amounted to Rs. 500 million (30 June 2014: Rs. 500 million) out of which Rs. 250 million (30 June 2014: Rs. 250 million) is interchangeable with letter of credit facility. During the period, the mark-up on such arrangements ranged between 11.67% to 12.27% (2013: 10.58% to 11.69%) per annum.
14.2 Short term loan financing available from various commercial banks under mark-up arrangements
amounted to Rs. 1,300 million (30 June 2014: Rs. 1,300 million) out of which Rs. 400 million (30 June 2014: Rs. 400 million) is interchangeable with letter of credit facility. During the period, this facility was not utilized
14.3 The facilities for opening letter of credit amounted to Rs. 1,500 million (30 June 2014: Rs. 1,500
million) out of which Rs. 250 million (30 June 2014: Rs. 250 million) and Rs. 400 million (30 June 2014: Rs. 400 million) are interchangeable with short term running finance and short term loans respectively as mentioned in notes 14.1 and 14.2 above. The facility for letters of guarantee as at 30 September 2014 amounted to Rs. 543 million (30 June 2014: Rs. 526 million). Amounts unutilized for letters of credit and guarantees as at 30 September 2014 were Rs. 1,256.491 million and Rs. 257.755 million (30 June 2014: Rs. 1,431.518 million and Rs. 278.360 million) respectively.
NOTES TO THE CONDENSED INTERIM UNCONSOLIDATED FINANCIAL INFORMATION (UNAUDITED)For the first quarter ended 30 September 2014
Crescent Steel and Allied Products Limited22
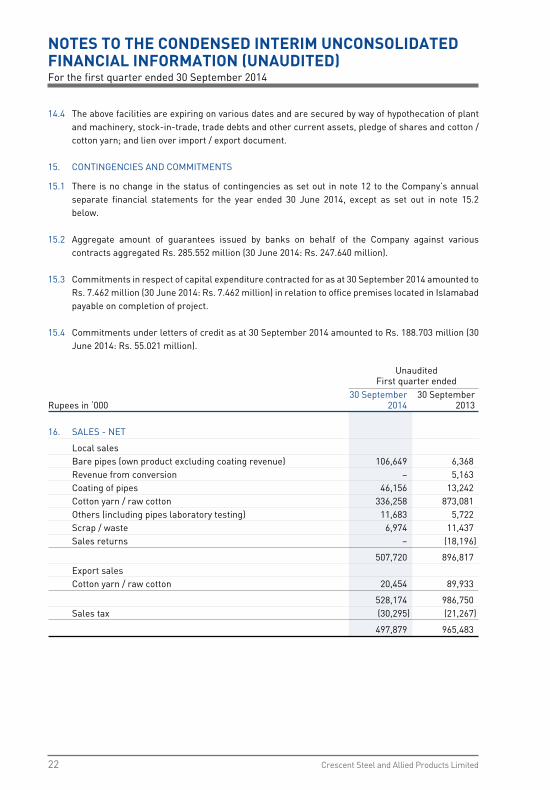
14.4 The above facilities are expiring on various dates and are secured by way of hypothecation of plant and machinery, stock-in-trade, trade debts and other current assets, pledge of shares and cotton / cotton yarn; and lien over import / export document.
15. CONTINGENCIES AND COMMITMENTS
15.1 There is no change in the status of contingencies as set out in note 12 to the Company’s annual separate financial statements for the year ended 30 June 2014, except as set out in note 15.2 below.
15.2 Aggregate amount of guarantees issued by banks on behalf of the Company against various
contracts aggregated Rs. 285.552 million (30 June 2014: Rs. 247.640 million). 15.3 Commitments in respect of capital expenditure contracted for as at 30 September 2014 amounted to
Rs. 7.462 million (30 June 2014: Rs. 7.462 million) in relation to office premises located in Islamabad payable on completion of project.
15.4 Commitments under letters of credit as at 30 September 2014 amounted to Rs. 188.703 million (30
June 2014: Rs. 55.021 million).
Unaudited First quarter ended 30 September 30 SeptemberRupees in ‘000 2014 2013
16. SALES - NET
Local sales Bare pipes (own product excluding coating revenue) 106,649 6,368 Revenue from conversion – 5,163 Coating of pipes 46,156 13,242 Cotton yarn / raw cotton 336,258 873,081 Others (including pipes laboratory testing) 11,683 5,722 Scrap / waste 6,974 11,437 Sales returns – (18,196)
507,720 896,817 Export sales Cotton yarn / raw cotton 20,454 89,933
528,174 986,750 Sales tax (30,295) (21,267)
497,879 965,483
NOTES TO THE CONDENSED INTERIM UNCONSOLIDATED FINANCIAL INFORMATION (UNAUDITED)For the first quarter ended 30 September 2014
Condensed Interim Report for the First Quarter Ended 30 September 2014 23
Unaudited First quarter ended 30 September 30 SeptemberRupees in ‘000 2014 2013
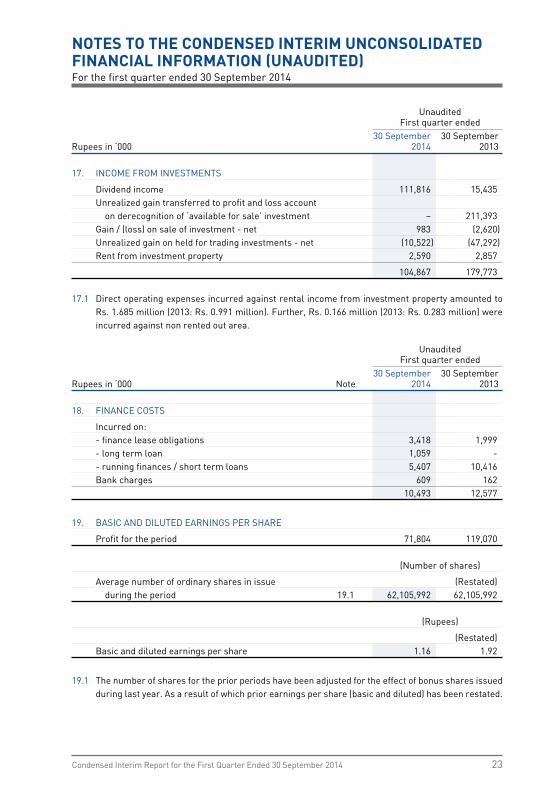
17. INCOME FROM INVESTMENTS
Dividend income 111,816 15,435 Unrealized gain transferred to profit and loss account on derecognition of ‘available for sale’ investment – 211,393 Gain / (loss) on sale of investment - net 983 (2,620) Unrealized gain on held for trading investments - net (10,522) (47,292) Rent from investment property 2,590 2,857
104,867 179,773 17.1 Direct operating expenses incurred against rental income from investment property amounted to
Rs. 1.685 million (2013: Rs. 0.991 million). Further, Rs. 0.166 million (2013: Rs. 0.283 million) were incurred against non rented out area.
Unaudited First quarter ended 30 September 30 SeptemberRupees in ‘000 Note 2014 2013 18. FINANCE COSTS
Incurred on: - finance lease obligations 3,418 1,999 - long term loan 1,059 - - running finances / short term loans 5,407 10,416 Bank charges 609 162 10,493 12,577
19. BASIC AND DILUTED EARNINGS PER SHARE
Profit for the period 71,804 119,070 (Number of shares)
Average number of ordinary shares in issue (Restated) during the period 19.1 62,105,992 62,105,992 (Rupees)
(Restated) Basic and diluted earnings per share 1.16 1.92
19.1 The number of shares for the prior periods have been adjusted for the effect of bonus shares issued
during last year. As a result of which prior earnings per share (basic and diluted) has been restated.
NOTES TO THE CONDENSED INTERIM UNCONSOLIDATED FINANCIAL INFORMATION (UNAUDITED)For the first quarter ended 30 September 2014
Crescent Steel and Allied Products Limited24
Unaudited First quarter ended 30 September 30 SeptemberRupees in ‘000 Note 2014 2013
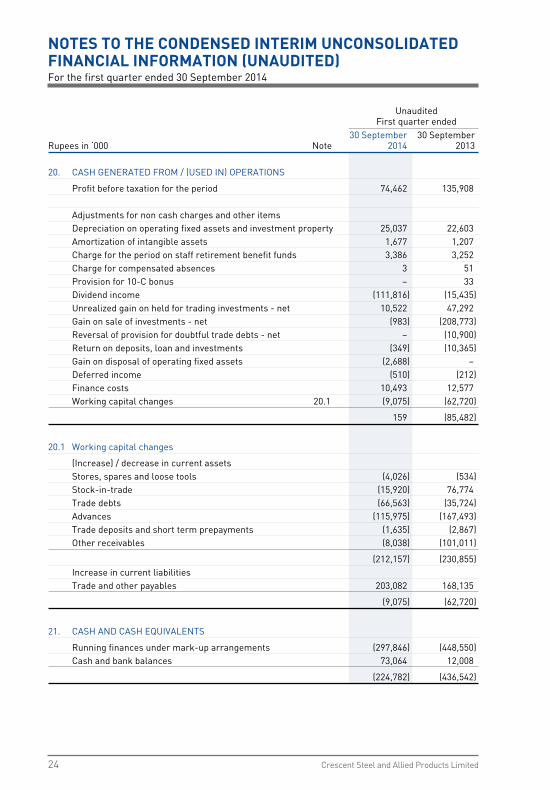
20. CASH GENERATED FROM / (USED IN) OPERATIONS
Profit before taxation for the period 74,462 135,908 Adjustments for non cash charges and other items Depreciation on operating fixed assets and investment property 25,037 22,603 Amortization of intangible assets 1,677 1,207 Charge for the period on staff retirement benefit funds 3,386 3,252 Charge for compensated absences 3 51 Provision for 10-C bonus – 33 Dividend income (111,816) (15,435) Unrealized gain on held for trading investments - net 10,522 47,292 Gain on sale of investments - net (983) (208,773) Reversal of provision for doubtful trade debts - net – (10,900) Return on deposits, loan and investments (349) (10,365) Gain on disposal of operating fixed assets (2,688) – Deferred income (510) (212) Finance costs 10,493 12,577 Working capital changes 20.1 (9,075) (62,720)
159 (85,482)
20.1 Working capital changes
(Increase) / decrease in current assets Stores, spares and loose tools (4,026) (534) Stock-in-trade (15,920) 76,774 Trade debts (66,563) (35,724) Advances (115,975) (167,493) Trade deposits and short term prepayments (1,635) (2,867) Other receivables (8,038) (101,011)
(212,157) (230,855) Increase in current liabilities Trade and other payables 203,082 168,135
(9,075) (62,720)
21. CASH AND CASH EQUIVALENTS
Running finances under mark-up arrangements (297,846) (448,550) Cash and bank balances 73,064 12,008
(224,782) (436,542)
NOTES TO THE CONDENSED INTERIM UNCONSOLIDATED FINANCIAL INFORMATION (UNAUDITED)For the first quarter ended 30 September 2014
Condensed Interim Report for the First Quarter Ended 30 September 2014 25
NOTES TO THE CONDENSED INTERIM UNCONSOLIDATED FINANCIAL INFORMATION (UNAUDITED)For the first quarter ended 30 September 2014
22.2 Segment revenues and results
Following is an analysis of the Company’s revenue and results by reportable segment
Unaudited
Steel Cotton IID TotalRupees in ‘000 segment segment segment
For the first quarter ended
30 September 2014
Sales - net 140,926 356,953 - 497,879 Cost of sales 109,417 373,117 - 482,534
Gross profit / (loss) 31,509 (16,164) - 15,345 Income from investments - - 104,867 104,867
31,509 (16,164) 104,867 120,212 Distribution and selling expenses 2,293 3,161 - 5,454 Administrative expenses 27,792 6,410 4,312 38,514 30,085 9,571 4,312 43,968
1,424 (25,735) 100,555 76,244 Other income 2,127 6,036 548 8,711
Operating profit / (loss) before finance costs 3,551 (19,699) 101,103 84,955 Finance costs 5,399 4,178 916 10,493
(Loss) / profit before taxation (1,848) (23,877) 100,187 74,462 Taxation 2,658
Profit for the period 71,804
22. SEGMENT REPORTING
22.1 Reportable segments
The Company’s reportable segments are as follows:
- Steel segment - It comprises of manufacturing and coating of steel pipes.
- Cotton segment - It comprises of manufacturing of yarn.
- Investment and Infrastructure Development (IID) segment - To effectively manage the investment portfolio in shares and other securities (strategic as well as short term) and investment property (held for rentals as well as long term appreciation).
Information regarding the Company’s reportable segments is presented below.
Crescent Steel and Allied Products Limited26
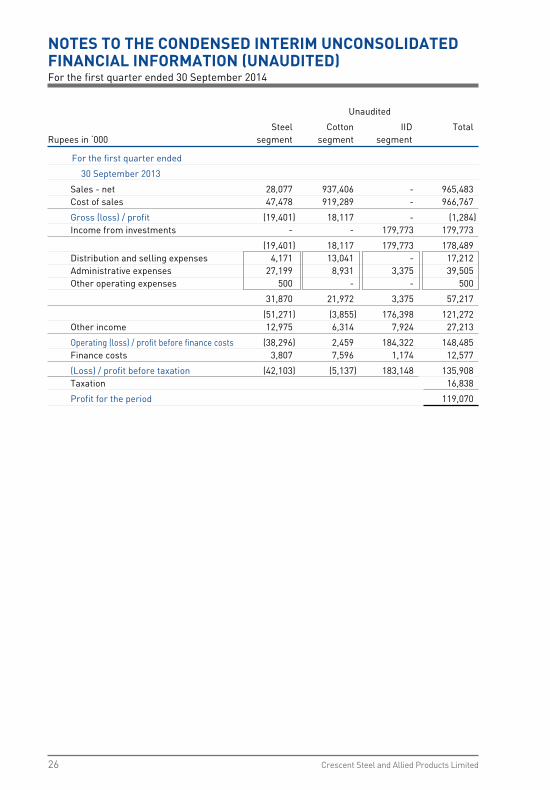
Unaudited
Steel Cotton IID TotalRupees in ‘000 segment segment segment
For the first quarter ended
30 September 2013
Sales - net 28,077 937,406 - 965,483 Cost of sales 47,478 919,289 - 966,767
Gross (loss) / profit (19,401) 18,117 - (1,284) Income from investments - - 179,773 179,773
(19,401) 18,117 179,773 178,489 Distribution and selling expenses 4,171 13,041 - 17,212 Administrative expenses 27,199 8,931 3,375 39,505 Other operating expenses 500 - - 500
31,870 21,972 3,375 57,217
(51,271) (3,855) 176,398 121,272 Other income 12,975 6,314 7,924 27,213
Operating (loss) / profit before finance costs (38,296) 2,459 184,322 148,485 Finance costs 3,807 7,596 1,174 12,577
(Loss) / profit before taxation (42,103) (5,137) 183,148 135,908 Taxation 16,838
Profit for the period 119,070
NOTES TO THE CONDENSED INTERIM UNCONSOLIDATED FINANCIAL INFORMATION (UNAUDITED)For the first quarter ended 30 September 2014
Condensed Interim Report for the First Quarter Ended 30 September 2014 27
22.2.1 Revenue reported above represents revenue generated from external customers. There were no inter-segment sales during the period (2013: Nil).
22.2.2 The accounting policies of the reportable segments are the same as the Company’s accounting policies as disclosed in the audited annual separate financial statements of the Company for the preceding year ended 30 June 2014. The Steel segment allocates certain percentage of the common expenditure to the Cotton and IID segments. In addition, financial charges between Steel and Cotton segments are allocated at average mark-up rate on the basis of funds utilized. This is the measure reported to management for the purposes of resource allocation and assessment of segment performance.
22.3 Revenue from major products and services
The analysis of the Company’s revenue from external customers for major products and services is given in note 16 to this condensed interim unconsolidated financial information.
22.4 Information about major customers
Revenue from major customers of Steel segment represents an aggregate amount of Rs. 109.616 million (2013: Rs. 21.980 million) of total Steel segment revenue of Rs. 140.926 milllion (2013: Rs. 28.077 million). Further, revenue from major customers of Cotton segment represents an aggregate amount of Rs. 111.919 million (2013: Rs. 143.911) of total Cotton segment revenue of Rs. 356.953 milllion (2013: Rs. 937.406 million).
NOTES TO THE CONDENSED INTERIM UNCONSOLIDATED FINANCIAL INFORMATION (UNAUDITED)For the first quarter ended 30 September 2014
Crescent Steel and Allied Products Limited28
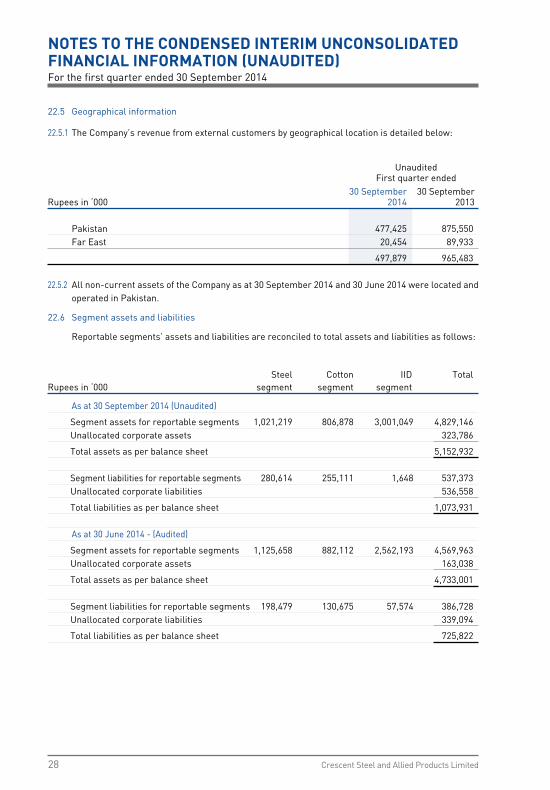
22.5 Geographical information 22.5.1 The Company’s revenue from external customers by geographical location is detailed below:
Unaudited First quarter ended 30 September 30 SeptemberRupees in ‘000 2014 2013
Pakistan 477,425 875,550 Far East 20,454 89,933
497,879 965,483
22.5.2 All non-current assets of the Company as at 30 September 2014 and 30 June 2014 were located and operated in Pakistan.
22.6 Segment assets and liabilities
Reportable segments’ assets and liabilities are reconciled to total assets and liabilities as follows:
Steel Cotton IID TotalRupees in ‘000 segment segment segment
As at 30 September 2014 (Unaudited)
Segment assets for reportable segments 1,021,219 806,878 3,001,049 4,829,146 Unallocated corporate assets 323,786
Total assets as per balance sheet 5,152,932
Segment liabilities for reportable segments 280,614 255,111 1,648 537,373 Unallocated corporate liabilities 536,558
Total liabilities as per balance sheet 1,073,931
As at 30 June 2014 - (Audited)
Segment assets for reportable segments 1,125,658 882,112 2,562,193 4,569,963 Unallocated corporate assets 163,038
Total assets as per balance sheet 4,733,001 Segment liabilities for reportable segments 198,479 130,675 57,574 386,728 Unallocated corporate liabilities 339,094
Total liabilities as per balance sheet 725,822
NOTES TO THE CONDENSED INTERIM UNCONSOLIDATED FINANCIAL INFORMATION (UNAUDITED)For the first quarter ended 30 September 2014
Condensed Interim Report for the First Quarter Ended 30 September 2014 29
22.6.1 For the purposes of monitoring segment performance and allocating resources between segments - all assets are allocated to reportable segments other than those directly relating to corporate
and taxation assets; and
- all liabilities are allocated to reportable segments other than those directly relating to corporate and taxation.
Cash and bank balances, borrowings and related mark-up receivable therefrom and payable
thereon, respectively are not allocated to reporting segments as these are managed by the Company’s central treasury function.
22.7 Other segment information
Steel Cotton IID TotalRupees in ‘000 segment segment segment
For the first quarter ended
30 September 2014
Capital expenditure 2,692 21,627 88 24,407 Depreciation and amortization 9,720 15,848 1,146 26,714 Non-cash items other than depreciation and amortization - net 5,775 3,529 (101,246) (91,942)
For the first quarter ended
30 September 2013
Capital expenditure 7,785 363 - 8,148 Depreciation and amortization 7,625 15,006 1,179 23,810 Non-cash items other than depreciation and amortization - net (6,368) 7,437 (183,549) (182,480)
23. TRANSACTIONS WITH RELATED PARTIES
Related parties comprise of subsidiary and associated companies, directors of the Company, companies in which directors also hold directorship, related group companies, key management personnel and staff retirement benefit funds.
NOTES TO THE CONDENSED INTERIM UNCONSOLIDATED FINANCIAL INFORMATION (UNAUDITED)For the first quarter ended 30 September 2014
Crescent Steel and Allied Products Limited30
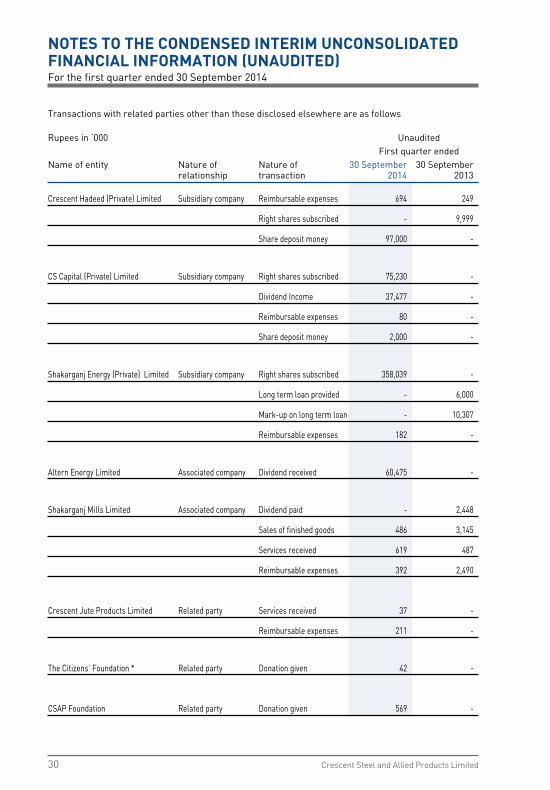
Transactions with related parties other than those disclosed elsewhere are as follows Rupees in ‘000 Unaudited First quarter ended Name of entity Nature of Nature of 30 September 30 September
relationship transaction 2014 2013
Crescent Hadeed (Private) Limited Subsidiary company Reimbursable expenses 694 249
Right shares subscribed - 9,999
Share deposit money 97,000 -
CS Capital (Private) Limited Subsidiary company Right shares subscribed 75,230 -
Dividend Income 37,477 -
Reimbursable expenses 80 -
Share deposit money 2,000 -
Shakarganj Energy (Private) Limited Subsidiary company Right shares subscribed 358,039 -
Long term loan provided - 6,000
Mark-up on long term loan - 10,307
Reimbursable expenses 182 -
Altern Energy Limited Associated company Dividend received 60,475 -
Shakarganj Mills Limited Associated company Dividend paid - 2,448
Sales of finished goods 486 3,145
Services received 619 487
Reimbursable expenses 392 2,490
Crescent Jute Products Limited Related party Services received 37 -
Reimbursable expenses 211 -
The Citizens’ Foundation * Related party Donation given 42 -
CSAP Foundation Related party Donation given 569 -
NOTES TO THE CONDENSED INTERIM UNCONSOLIDATED FINANCIAL INFORMATION (UNAUDITED)For the first quarter ended 30 September 2014
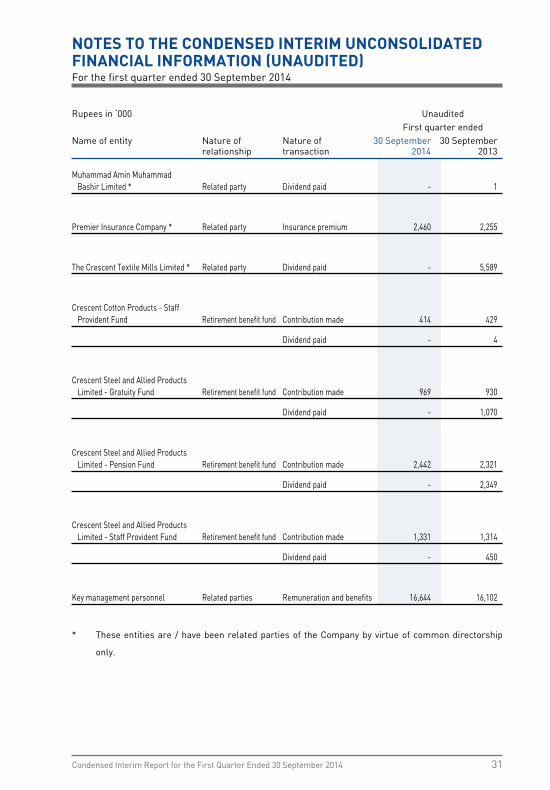
Condensed Interim Report for the First Quarter Ended 30 September 2014 31
Rupees in ‘000 Unaudited First quarter ended Name of entity Nature of Nature of 30 September 30 September
relationship transaction 2014 2013
Muhammad Amin Muhammad Bashir Limited * Related party Dividend paid - 1
Premier Insurance Company * Related party Insurance premium 2,460 2,255
The Crescent Textile Mills Limited * Related party Dividend paid - 5,589
Crescent Cotton Products - Staff Provident Fund Retirement benefit fund Contribution made 414 429
Dividend paid - 4
Crescent Steel and Allied Products Limited - Gratuity Fund Retirement benefit fund Contribution made 969 930
Dividend paid - 1,070
Crescent Steel and Allied Products Limited - Pension Fund Retirement benefit fund Contribution made 2,442 2,321
Dividend paid - 2,349
Crescent Steel and Allied Products Limited - Staff Provident Fund Retirement benefit fund Contribution made 1,331 1,314
Dividend paid - 450
Key management personnel Related parties Remuneration and benefits 16,644 16,102
* These entities are / have been related parties of the Company by virtue of common directorship
only.
NOTES TO THE CONDENSED INTERIM UNCONSOLIDATED FINANCIAL INFORMATION (UNAUDITED)For the first quarter ended 30 September 2014
Crescent Steel and Allied Products Limited32
23.1 Sale of finished goods, operating fixed assets and raw materials, rendering of services and rental income are based on commercial terms and at market prices which are approved by the Board of Directors.
23.2 Contributions to the employee retirement benefit funds are made in accordance with the terms of employee retirement benefit schemes and actuarial advice.
23.3 Key management personnel are those persons having authority and responsibility for planning, directing and controlling the activities of the Company, including directors of the Company. There were no transactions with key management personnel during the period other than their terms of employment / entitlements.
24. FINANCIAL RISK MANAGEMENT
The Company’s financial risk management objectives and policies are consistent with those disclosed in the audited annual separate financial statements of the Company as at and for the year ended 30 June 2014.
25. DATE OF AUTHORIZATION FOR ISSUE
This condensed interim unconsolidated financial information was authorized for issue in the Board of Directors meeting held on 28 October 2014.
NOTES TO THE CONDENSED INTERIM UNCONSOLIDATED FINANCIAL INFORMATION (UNAUDITED)For the first quarter ended 30 September 2014
Chief Executive Director Chief Financial Officer

Condensed Interim Report for the First Quarter Ended 30 September 2014 33
Crescent Steel and Allied Products Limited
Condensed Interim Consolidated Financial Information (Unaudited)
For the first quarter ended 30 September 2014
Crescent Steel and Allied Products Limited34
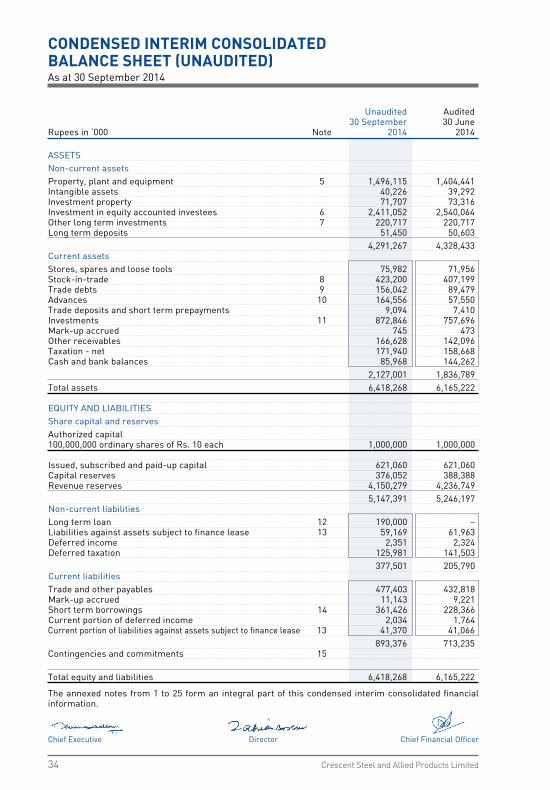
CONDENSED INTERIM CONSOLIDATED BALANCE SHEET (UNAUDITED)As at 30 September 2014
Unaudited Audited 30 September 30 JuneRupees in ‘000 Note 2014 2014
ASSETS Non-current assets Property, plant and equipment 5 1,496,115 1,404,441 Intangible assets 40,226 39,292 Investment property 71,707 73,316 Investment in equity accounted investees 6 2,411,052 2,540,064 Other long term investments 7 220,717 220,717 Long term deposits 51,450 50,603 4,291,267 4,328,433 Current assets Stores, spares and loose tools 75,982 71,956 Stock-in-trade 8 423,200 407,199 Trade debts 9 156,042 89,479 Advances 10 164,556 57,550 Trade deposits and short term prepayments 9,094 7,410 Investments 11 872,846 757,696 Mark-up accrued 745 473 Other receivables 166,628 142,096 Taxation - net 171,940 158,668 Cash and bank balances 85,968 144,262 2,127,001 1,836,789 Total assets 6,418,268 6,165,222 EQUITY AND LIABILITIES Share capital and reserves Authorized capital 100,000,000 ordinary shares of Rs. 10 each 1,000,000 1,000,000 Issued, subscribed and paid-up capital 621,060 621,060 Capital reserves 376,052 388,388 Revenue reserves 4,150,279 4,236,749 5,147,391 5,246,197 Non-current liabilities Long term loan 12 190,000 – Liabilities against assets subject to finance lease 13 59,169 61,963 Deferred income 2,351 2,324 Deferred taxation 125,981 141,503 377,501 205,790 Current liabilities Trade and other payables 477,403 432,818 Mark-up accrued 11,143 9,221 Short term borrowings 14 361,426 228,366 Current portion of deferred income 2,034 1,764 Current portion of liabilities against assets subject to finance lease 13 41,370 41,066 893,376 713,235 Contingencies and commitments 15 Total equity and liabilities 6,418,268 6,165,222
The annexed notes from 1 to 25 form an integral part of this condensed interim consolidated financial information.
Chief Executive Director Chief Financial Officer
Condensed Interim Report for the First Quarter Ended 30 September 2014 35
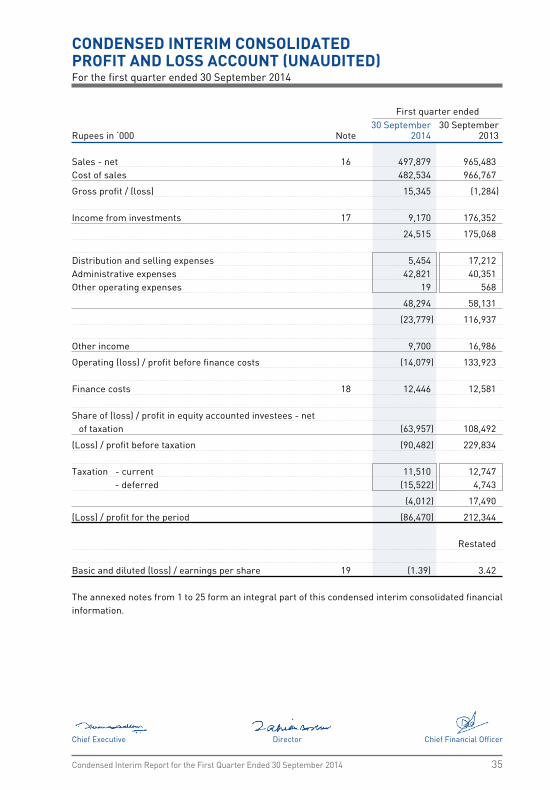
CONDENSED INTERIM CONSOLIDATED PROFIT AND LOSS ACCOUNT (UNAUDITED)For the first quarter ended 30 September 2014
First quarter ended 30 September 30 SeptemberRupees in ‘000 Note 2014 2013
Sales - net 16 497,879 965,483 Cost of sales 482,534 966,767
Gross profit / (loss) 15,345 (1,284) Income from investments 17 9,170 176,352
24,515 175,068
Distribution and selling expenses 5,454 17,212 Administrative expenses 42,821 40,351 Other operating expenses 19 568
48,294 58,131
(23,779) 116,937 Other income 9,700 16,986
Operating (loss) / profit before finance costs (14,079) 133,923 Finance costs 18 12,446 12,581 Share of (loss) / profit in equity accounted investees - net of taxation (63,957) 108,492
(Loss) / profit before taxation (90,482) 229,834 Taxation - current 11,510 12,747 - deferred (15,522) 4,743
(4,012) 17,490
(Loss) / profit for the period (86,470) 212,344 Restated Basic and diluted (loss) / earnings per share 19 (1.39) 3.42 The annexed notes from 1 to 25 form an integral part of this condensed interim consolidated financial information.
Chief Executive Director Chief Financial Officer
Crescent Steel and Allied Products Limited36
CONDENSED INTERIM CONSOLIDATED STATEMENT OF COMPREHENSIVE INCOME (UNAUDITED)For the first quarter ended 30 September 2014
First quarter ended 30 September 30 SeptemberRupees in ‘000 Note 2014 2013
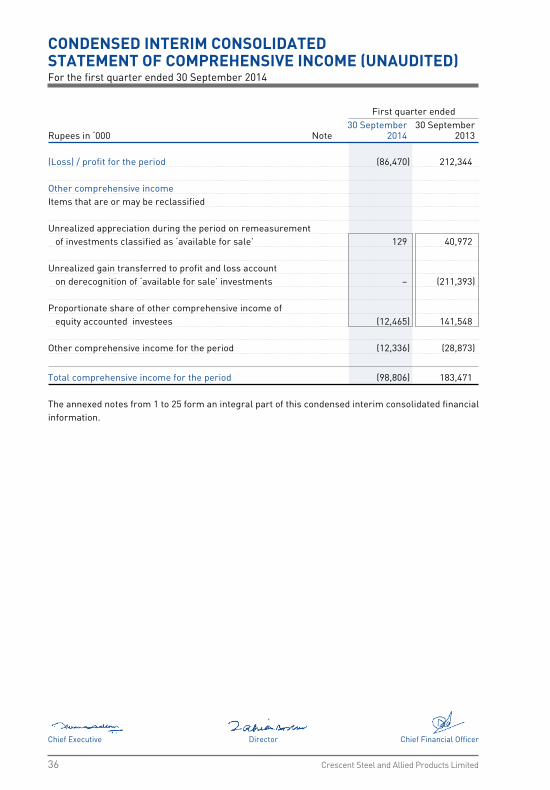
(Loss) / profit for the period (86,470) 212,344 Other comprehensive income Items that are or may be reclassified Unrealized appreciation during the period on remeasurement of investments classified as ‘available for sale’ 129 40,972 Unrealized gain transferred to profit and loss account on derecognition of ‘available for sale’ investments – (211,393) Proportionate share of other comprehensive income of equity accounted investees (12,465) 141,548 Other comprehensive income for the period (12,336) (28,873)
Total comprehensive income for the period (98,806) 183,471 The annexed notes from 1 to 25 form an integral part of this condensed interim consolidated financial information.
Chief Executive Director Chief Financial Officer
Condensed Interim Report for the First Quarter Ended 30 September 2014 37
CONDENSED INTERIM CONSOLIDATED CASH FLOW STATEMENT (UNAUDITED)For the first quarter ended 30 September 2014
First quarter ended 30 September 30 SeptemberRupees in ‘000 Note 2014 2013
Cash flows from operating activities
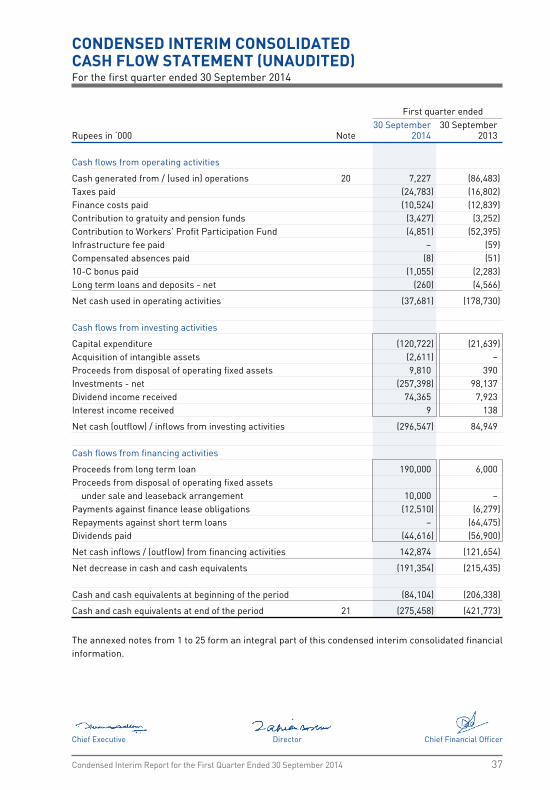
Cash generated from / (used in) operations 20 7,227 (86,483)Taxes paid (24,783) (16,802)Finance costs paid (10,524) (12,839)Contribution to gratuity and pension funds (3,427) (3,252)Contribution to Workers’ Profit Participation Fund (4,851) (52,395)Infrastructure fee paid – (59)Compensated absences paid (8) (51)10-C bonus paid (1,055) (2,283)Long term loans and deposits - net (260) (4,566)
Net cash used in operating activities (37,681) (178,730) Cash flows from investing activities
Capital expenditure (120,722) (21,639)Acquisition of intangible assets (2,611) – Proceeds from disposal of operating fixed assets 9,810 390 Investments - net (257,398) 98,137 Dividend income received 74,365 7,923 Interest income received 9 138
Net cash (outflow) / inflows from investing activities (296,547) 84,949 Cash flows from financing activities
Proceeds from long term loan 190,000 6,000 Proceeds from disposal of operating fixed assets under sale and leaseback arrangement 10,000 – Payments against finance lease obligations (12,510) (6,279)Repayments against short term loans – (64,475)Dividends paid (44,616) (56,900)
Net cash inflows / (outflow) from financing activities 142,874 (121,654)
Net decrease in cash and cash equivalents (191,354) (215,435) Cash and cash equivalents at beginning of the period (84,104) (206,338)
Cash and cash equivalents at end of the period 21 (275,458) (421,773)
The annexed notes from 1 to 25 form an integral part of this condensed interim consolidated financial information.
Chief Executive Director Chief Financial Officer
Crescent Steel and Allied Products Limited38
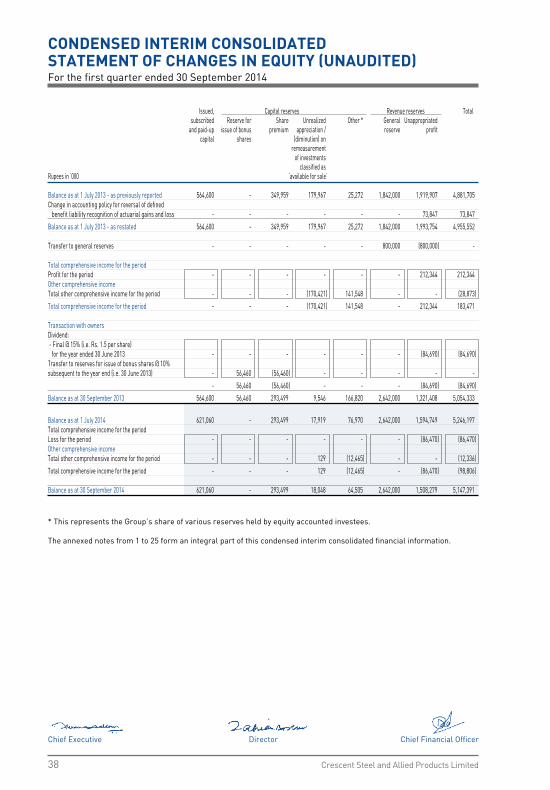
CONDENSED INTERIM CONSOLIDATED STATEMENT OF CHANGES IN EQUITY (UNAUDITED)For the first quarter ended 30 September 2014
Issued, Capital reserves Revenue reserves Total subscribed Reserve for Share Unrealized Other * General Unappropriated and paid-up issue of bonus premium appreciation / reserve profit capital shares (diminution) on remeasurement of investments classified as Rupees in ‘000 ‘available for sale’ Balance as at 1 July 2013 - as previously reported 564,600 - 349,959 179,967 25,272 1,842,000 1,919,907 4,881,705 Change in accounting policy for reversal of defined benefit liability recognition of actuarial gains and loss - - - - - - 73,847 73,847
Balance as at 1 July 2013 - as restated 564,600 - 349,959 179,967 25,272 1,842,000 1,993,754 4,955,552
Transfer to general reserves - - - - - 800,000 (800,000) -
Total comprehensive income for the period Profit for the period - - - - - - 212,344 212,344 Other comprehensive income Total other comprehensive income for the period - - - (170,421) 141,548 - - (28,873)
Total comprehensive income for the period - - - (170,421) 141,548 - 212,344 183,471 Transaction with owners Dividend: - Final @ 15% (i.e. Rs. 1.5 per share) for the year ended 30 June 2013 - - - - - - (84,690) (84,690)Transfer to reserves for issue of bonus shares @ 10% subsequent to the year end (i.e. 30 June 2013) - 56,460 (56,460) - - - - -
- 56,460 (56,460) - - - (84,690) (84,690)
Balance as at 30 September 2013 564,600 56,460 293,499 9,546 166,820 2,642,000 1,321,408 5,054,333
Balance as at 1 July 2014 621,060 - 293,499 17,919 76,970 2,642,000 1,594,749 5,246,197 Total comprehensive income for the period Loss for the period - - - - - - (86,470) (86,470)Other comprehensive income Total other comprehensive income for the period - - - 129 (12,465) - - (12,336)
Total comprehensive income for the period - - - 129 (12,465) - (86,470) (98,806) Balance as at 30 September 2014 621,060 - 293,499 18,048 64,505 2,642,000 1,508,279 5,147,391
* This represents the Group’s share of various reserves held by equity accounted investees. The annexed notes from 1 to 25 form an integral part of this condensed interim consolidated financial information.
Chief Executive Director Chief Financial Officer
Condensed Interim Report for the First Quarter Ended 30 September 2014 39
NOTES TO THE CONDENSED INTERIM CONSOLIDATED FINANCIAL INFORMATION (UNAUDITED)For the first quarter ended 30 September 2014
1. THE GROUP AND ITS OPERATIONS
1.1 The Group consists of Crescent Steel and Allied Products Limited (‘the Holding Company’) and its wholly owned subsidiary companies namely; Shakarganj Energy (Private) Limited, CS Capital (Private) Limited, Crescent Hadeed (Private) Limited and Crescent Continental Gas Pipelines Limited.
1.2 The Holding Company was incorporated on 1 August 1983 as a public limited company in Pakistan
under the Companies Act, 1913 (now Companies Ordinance, 1984) and is quoted on all stock exchanges of Pakistan. The registered office of the Holding Company is located at 10th floor, BOP Tower, 10-B, Block E-2, Main Boulevard, Gulberg-III, Lahore.
1.3 Shakarganj Energy (Private) Limited was incorporated on 2 April 2008 as a private limited company
in Pakistan under the Companies Ordinance, 1984. The Holding Company acquired this subsidiary on 4 January 2010. The principal activity of the Subsidiary Company is to build, own, operate and maintain a power plant and to generate, accumulate, distribute, sell and supply electricity / power to the Pakistan Electric Power Company (Private) Limited (PEPCO) / power distribution companies under agreement(s) with the Government of Pakistan or to any other consumer as permitted.
1.4 CS Capital (Private) Limited was incorporated on 5 November 2010 as a private limited company
in Pakistan under the Companies Ordinance, 1984. The Holding Company acquired this subsidiary on 26 September 2011. The principal activity of the Subsidiary Company is to manage portfolio of shares, commodities and other securities (strategic as well as short term).
1.5 Crescent Hadeed (Private) Limited was incorporated on 15 May 2013 as a private limited company
in Pakistan under the Companies Ordinance, 1984. The principal activity of the Subsidiary Company will be to manufacture steel billets.
1.6 Crescent Continental Gas Pipelines Limited is not carrying on any business operations. 1.7 Details regarding the Group’s associates are given in note 6 to this condensed interim consolidated
financial infomation. 2. BASIS OF PREPARATION
2.1 This condensed interim consolidated financial information of the Group for the three months period ended 30 September 2014 has been prepared in accordance with the requirements of the International Accounting Standards 34 “Interim Financial Reporting” and provisions of and directives issued under the Companies Ordinance, 1984. In case where requirements differ, the provisions of or directives issued under the Companies Ordinance, 1984 have been followed.
2.2 This condensed interim consolidated financial information of the Group does not include all of the
information required for full annual financial statements and should be read in conjunction with the annual consolidated financial statements of the Group as at and for the year ended 30 June 2014.
2.3 This condensed interim consolidated financial information is presented in Pakistan Rupees which is
also the Group’s functional currency and all financial information presented has been rounded off to the nearest thousand, except otherwise stated.
Crescent Steel and Allied Products Limited40
NOTES TO THE CONDENSED INTERIM CONSOLIDATED FINANCIAL INFORMATION (UNAUDITED)For the first quarter ended 30 September 2014
3. ACCOUNTING POLICIES
The accounting policies and methods of computation adopted in the preparation of this condensed interim consolidated financial information are the same as those applied in the preparation of annual consolidated financial statements of the Group for the year ended 30 June 2014
4. ESTIMATES AND JUDGEMENTS
4.1 The preparation of condensed interim consolidated financial information requires management to make judgments, estimates and assumptions that affect the application of accounting policies and the reporting amounts of assets and liabilities, income and expenses. Actual results may differ from these estimates.
4.2 Estimates and judgements made by management in the preparation of this condensed interim
consolidated financial information are the same as those that were applied to the annual consolidated financial statements of the Group as at and for the year ended 30 June 2014.
5. PROPERTY, PLANT AND EQUIPMENT
Following is the cost of operating fixed assets added / transferred and disposed off during the period ended:
First quarter ended First quarter ended 30 September 2014 30 September 2013
Additions / Disposals Additions / DisposalsRupees in ‘000 Transfers Transfers Plant and machinery - owned 18,414 9,203 8,403 – Plant and machinery - leased 10,020 5,055 – – Furniture and fittings – – 163 – Electrical / office equipment and installation 850 – 262 – Computers 114 1,413 291 – Motor vehicles - owned 903 3,049 9 – Motor vehicles - leased – 2,005 84 – 30,301 20,725 9,212 –
Condensed Interim Report for the First Quarter Ended 30 September 2014 41
NOTES TO THE CONDENSED INTERIM CONSOLIDATED FINANCIAL INFORMATION (UNAUDITED)For the first quarter ended 30 September 2014
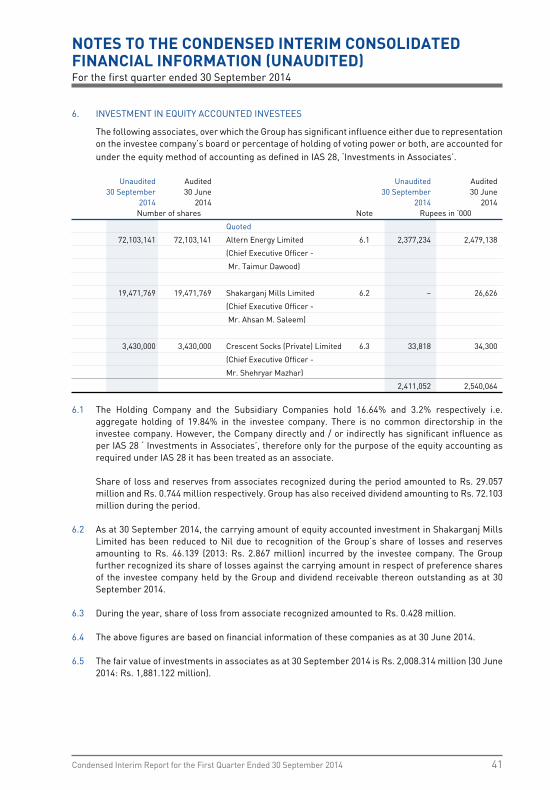
6. INVESTMENT IN EQUITY ACCOUNTED INVESTEES
The following associates, over which the Group has significant influence either due to representation on the investee company’s board or percentage of holding of voting power or both, are accounted for under the equity method of accounting as defined in IAS 28, ‘Investments in Associates’.
Unaudited Audited Unaudited Audited 30 September 30 June 30 September 30 June 2014 2014 2014 2014 Number of shares Note Rupees in ‘000
Quoted
72,103,141 72,103,141 Altern Energy Limited 6.1 2,377,234 2,479,138
(Chief Executive Officer -
Mr. Taimur Dawood)
19,471,769 19,471,769 Shakarganj Mills Limited 6.2 – 26,626
(Chief Executive Officer -
Mr. Ahsan M. Saleem)
3,430,000 3,430,000 Crescent Socks (Private) Limited 6.3 33,818 34,300
(Chief Executive Officer -
Mr. Shehryar Mazhar)
2,411,052 2,540,064
6.1 The Holding Company and the Subsidiary Companies hold 16.64% and 3.2% respectively i.e. aggregate holding of 19.84% in the investee company. There is no common directorship in the investee company. However, the Company directly and / or indirectly has significant influence as per IAS 28 ‘ Investments in Associates’, therefore only for the purpose of the equity accounting as required under IAS 28 it has been treated as an associate.
Share of loss and reserves from associates recognized during the period amounted to Rs. 29.057 million and Rs. 0.744 million respectively. Group has also received dividend amounting to Rs. 72.103 million during the period.
6.2 As at 30 September 2014, the carrying amount of equity accounted investment in Shakarganj Mills
Limited has been reduced to Nil due to recognition of the Group’s share of losses and reserves amounting to Rs. 46.139 (2013: Rs. 2.867 million) incurred by the investee company. The Group further recognized its share of losses against the carrying amount in respect of preference shares of the investee company held by the Group and dividend receivable thereon outstanding as at 30 September 2014.
6.3 During the year, share of loss from associate recognized amounted to Rs. 0.428 million. 6.4 The above figures are based on financial information of these companies as at 30 June 2014. 6.5 The fair value of investments in associates as at 30 September 2014 is Rs. 2,008.314 million (30 June
2014: Rs. 1,881.122 million).
Crescent Steel and Allied Products Limited42
Unaudited Audited 30 September 30 JuneRupees in ‘000 Note 2014 2014
7. OTHER LONG TERM INVESTMENTS
Investments in related parties
Available for sale 7.1 – –
Other investments
Available for sale 220,717 220,717
220,717 220,717
7.1 This represents investments in Crescent Bahuman Limited of Rs. 24.037 million and Crescent Industrial Chemicals Limited of Rs. 10.470 million which had been fully impaired and charged to profit and loss account in earlier periods.
Unaudited Audited 30 September 30 JuneRupees in ‘000 2014 2014
8. STOCK-IN-TRADE
Raw materials Hot rolled steel coils (HR Coil) 19,874 19,823 Coating materials 82,127 88,798 Others 21,834 15,246 Raw cotton 142,303 144,193 Stock-in-transit 42,554 19,401
308,692 287,461 Work-in-process 23,250 42,007 Finished goods 81,593 71,054 Scrap / cotton waste 9,665 6,677
114,508 119,738
423,200 407,199
9. TRADE DEBTS
Secured
Considered good 58,290 72,110 Unsecured
Considered good 97,752 17,369 Considered doubtful 2,786 2,786 Provision for doubtful trade debts (2,786) (2,786)
97,752 17,369
156,042 89,479
NOTES TO THE CONDENSED INTERIM CONSOLIDATED FINANCIAL INFORMATION (UNAUDITED)For the first quarter ended 30 September 2014
Condensed Interim Report for the First Quarter Ended 30 September 2014 43
Unaudited Audited 30 September 30 JuneRupees in ‘000 Note 2014 2014
10. ADVANCES
Unsecured
Advances - considered good
Executives 2,323 2,326 Suppliers for goods and services 162,233 26,780 Advances to others – 28,444 Advances - considered doubtful
Suppliers for goods and services 47 47 Provision for doubtful advances (47) (47)
– –
164,556 57,550
11. INVESTMENTS
Investments in related parties
Available for sale 66,434 66,305 Held to maturity 11.1 4,481 23,995
70,915 90,300 Other investments
Available for sale - - Held for trading 788,385 654,693 Short term deposit 11,475 10,575 Investment in commodity 2,071 2,128
801,931 667,396
872,846 757,696
11.1 The Group’s share of losses on equity accounted investment in Shakarganj Mills Limited has been allocated to the preference shares and dividend receivable thereon in accordance with the requirements of IAS 28, ‘Investments in Associates’ (see note 6.2).
11.2 Investments having an aggregate market value of Rs. 921.746 million (30 June 2014: Rs. 802.024 million) have been pledged with financial institutions as security against financing facilities (see note 14.4) out of which Rs. 625.400 million (30 June 2014: Rs. 570.280 million) relates to long term investments.
12. LONG TERM LOAN
During the period, long term loan arrangement was entered with Allied Bank Limited for an amount of Rs. 315 million by the Holding Company out of which Rs. 119 million have been disbursed till date. The term of the loan is 5 years from the date of disbursement with a grace period of 1 year, repayable in 16 equal quarterly installments starting from 15th month from disbursement. Markup is payable at the rate of 3 months KIBOR plus 1.5% per annum prevailing on the last day of previous quarter. The facility is secured against first pari passu hypothecation / equitable mortgage on plant, machinery and property of the Holding Company.
NOTES TO THE CONDENSED INTERIM CONSOLIDATED FINANCIAL INFORMATION (UNAUDITED)For the first quarter ended 30 September 2014
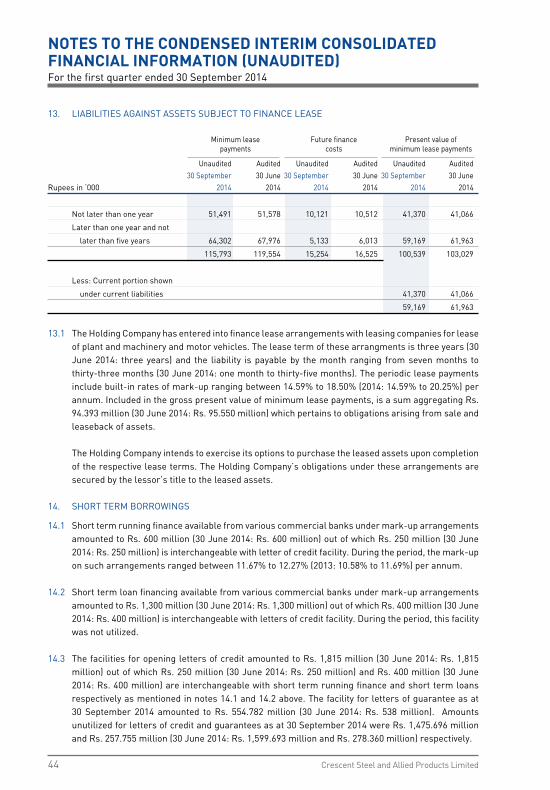
Crescent Steel and Allied Products Limited44
13. LIABILITIES AGAINST ASSETS SUBJECT TO FINANCE LEASE
Minimum lease Future finance Present value of payments costs minimum lease payments
Unaudited Audited Unaudited Audited Unaudited Audited 30 September 30 June 30 September 30 June 30 September 30 JuneRupees in ‘000 2014 2014 2014 2014 2014 2014
Not later than one year 51,491 51,578 10,121 10,512 41,370 41,066
Later than one year and not
later than five years 64,302 67,976 5,133 6,013 59,169 61,963
115,793 119,554 15,254 16,525 100,539 103,029
Less: Current portion shown
under current liabilities 41,370 41,066
59,169 61,963
13.1 The Holding Company has entered into finance lease arrangements with leasing companies for lease of plant and machinery and motor vehicles. The lease term of these arrangments is three years (30 June 2014: three years) and the liability is payable by the month ranging from seven months to thirty-three months (30 June 2014: one month to thirty-five months). The periodic lease payments include built-in rates of mark-up ranging between 14.59% to 18.50% (2014: 14.59% to 20.25%) per annum. Included in the gross present value of minimum lease payments, is a sum aggregating Rs. 94.393 million (30 June 2014: Rs. 95.550 million) which pertains to obligations arising from sale and leaseback of assets.
The Holding Company intends to exercise its options to purchase the leased assets upon completion of the respective lease terms. The Holding Company’s obligations under these arrangements are secured by the lessor’s title to the leased assets.
14. SHORT TERM BORROWINGS
14.1 Short term running finance available from various commercial banks under mark-up arrangements amounted to Rs. 600 million (30 June 2014: Rs. 600 million) out of which Rs. 250 million (30 June 2014: Rs. 250 million) is interchangeable with letter of credit facility. During the period, the mark-up on such arrangements ranged between 11.67% to 12.27% (2013: 10.58% to 11.69%) per annum.
14.2 Short term loan financing available from various commercial banks under mark-up arrangements amounted to Rs. 1,300 million (30 June 2014: Rs. 1,300 million) out of which Rs. 400 million (30 June 2014: Rs. 400 million) is interchangeable with letters of credit facility. During the period, this facility was not utilized.
14.3 The facilities for opening letters of credit amounted to Rs. 1,815 million (30 June 2014: Rs. 1,815
million) out of which Rs. 250 million (30 June 2014: Rs. 250 million) and Rs. 400 million (30 June 2014: Rs. 400 million) are interchangeable with short term running finance and short term loans respectively as mentioned in notes 14.1 and 14.2 above. The facility for letters of guarantee as at 30 September 2014 amounted to Rs. 554.782 million (30 June 2014: Rs. 538 million). Amounts unutilized for letters of credit and guarantees as at 30 September 2014 were Rs. 1,475.696 million and Rs. 257.755 million (30 June 2014: Rs. 1,599.693 million and Rs. 278.360 million) respectively.
NOTES TO THE CONDENSED INTERIM CONSOLIDATED FINANCIAL INFORMATION (UNAUDITED)For the first quarter ended 30 September 2014
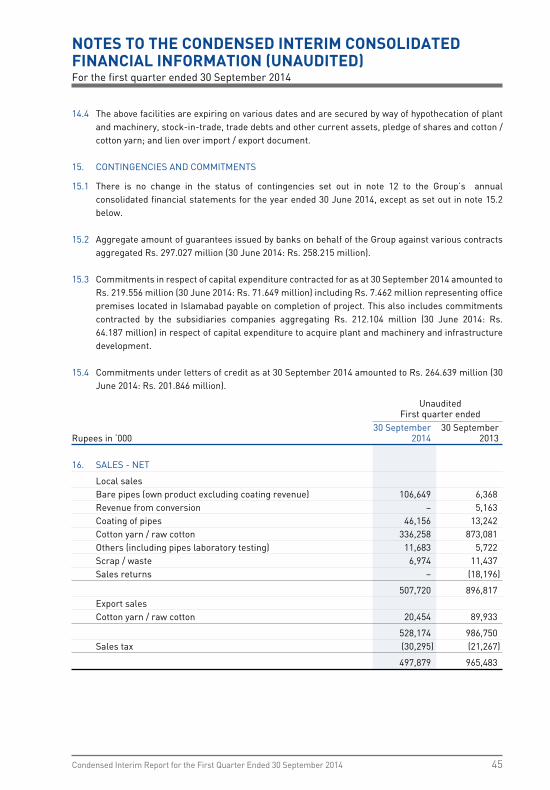
Condensed Interim Report for the First Quarter Ended 30 September 2014 45
14.4 The above facilities are expiring on various dates and are secured by way of hypothecation of plant and machinery, stock-in-trade, trade debts and other current assets, pledge of shares and cotton / cotton yarn; and lien over import / export document.
15. CONTINGENCIES AND COMMITMENTS
15.1 There is no change in the status of contingencies set out in note 12 to the Group’s annual consolidated financial statements for the year ended 30 June 2014, except as set out in note 15.2 below.
15.2 Aggregate amount of guarantees issued by banks on behalf of the Group against various contracts
aggregated Rs. 297.027 million (30 June 2014: Rs. 258.215 million). 15.3 Commitments in respect of capital expenditure contracted for as at 30 September 2014 amounted to
Rs. 219.556 million (30 June 2014: Rs. 71.649 million) including Rs. 7.462 million representing office premises located in Islamabad payable on completion of project. This also includes commitments contracted by the subsidiaries companies aggregating Rs. 212.104 million (30 June 2014: Rs. 64.187 million) in respect of capital expenditure to acquire plant and machinery and infrastructure development.
15.4 Commitments under letters of credit as at 30 September 2014 amounted to Rs. 264.639 million (30
June 2014: Rs. 201.846 million).
Unaudited First quarter ended 30 September 30 SeptemberRupees in ‘000 2014 2013
16. SALES - NET
Local sales Bare pipes (own product excluding coating revenue) 106,649 6,368 Revenue from conversion – 5,163 Coating of pipes 46,156 13,242 Cotton yarn / raw cotton 336,258 873,081 Others (including pipes laboratory testing) 11,683 5,722 Scrap / waste 6,974 11,437 Sales returns – (18,196)
507,720 896,817 Export sales Cotton yarn / raw cotton 20,454 89,933
528,174 986,750 Sales tax (30,295) (21,267)
497,879 965,483
NOTES TO THE CONDENSED INTERIM CONSOLIDATED FINANCIAL INFORMATION (UNAUDITED)For the first quarter ended 30 September 2014
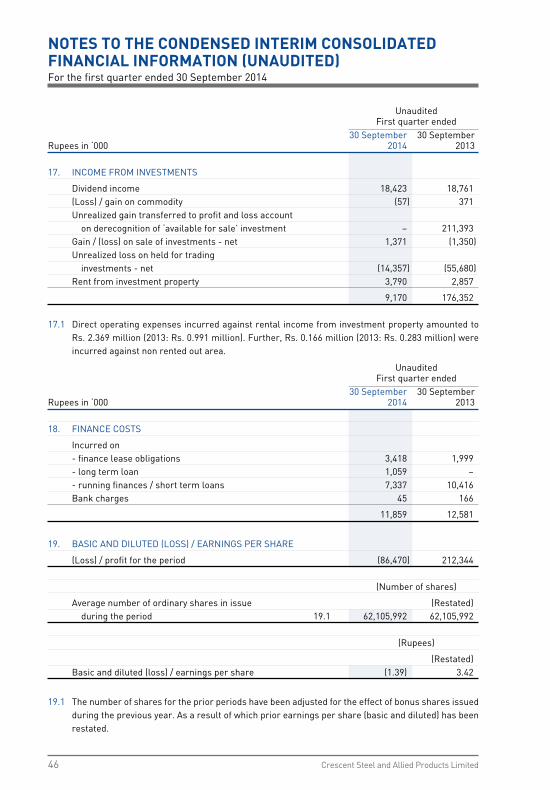
Crescent Steel and Allied Products Limited46
Unaudited First quarter ended 30 September 30 SeptemberRupees in ‘000 2014 2013
17. INCOME FROM INVESTMENTS
Dividend income 18,423 18,761 (Loss) / gain on commodity (57) 371 Unrealized gain transferred to profit and loss account on derecognition of ‘available for sale’ investment – 211,393 Gain / (loss) on sale of investments - net 1,371 (1,350) Unrealized loss on held for trading investments - net (14,357) (55,680) Rent from investment property 3,790 2,857
9,170 176,352 17.1 Direct operating expenses incurred against rental income from investment property amounted to
Rs. 2.369 million (2013: Rs. 0.991 million). Further, Rs. 0.166 million (2013: Rs. 0.283 million) were incurred against non rented out area.
Unaudited First quarter ended 30 September 30 SeptemberRupees in ‘000 2014 2013 18. FINANCE COSTS
Incurred on - finance lease obligations 3,418 1,999 - long term loan 1,059 – - running finances / short term loans 7,337 10,416 Bank charges 45 166
11,859 12,581
19. BASIC AND DILUTED (LOSS) / EARNINGS PER SHARE
(Loss) / profit for the period (86,470) 212,344 (Number of shares)
Average number of ordinary shares in issue (Restated) during the period 19.1 62,105,992 62,105,992 (Rupees)
(Restated) Basic and diluted (loss) / earnings per share (1.39) 3.42
19.1 The number of shares for the prior periods have been adjusted for the effect of bonus shares issued
during the previous year. As a result of which prior earnings per share (basic and diluted) has been restated.
NOTES TO THE CONDENSED INTERIM CONSOLIDATED FINANCIAL INFORMATION (UNAUDITED)For the first quarter ended 30 September 2014
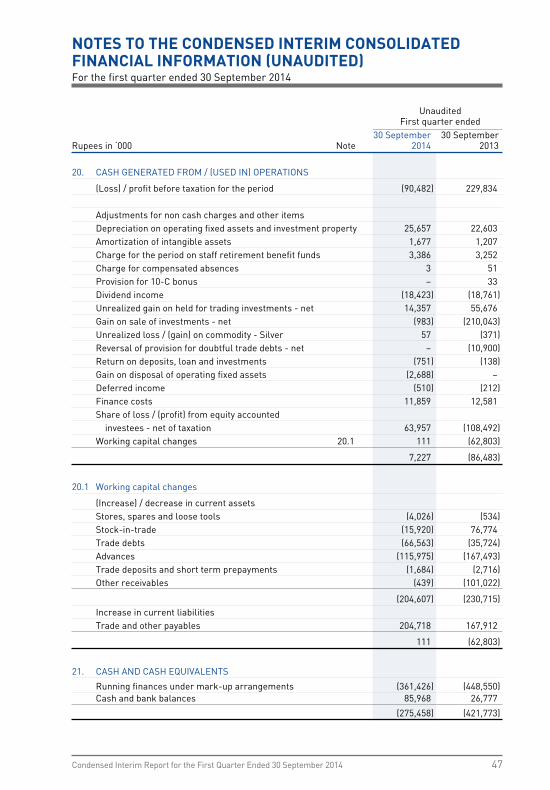
Condensed Interim Report for the First Quarter Ended 30 September 2014 47
Unaudited First quarter ended 30 September 30 SeptemberRupees in ‘000 Note 2014 2013
20. CASH GENERATED FROM / (USED IN) OPERATIONS
(Loss) / profit before taxation for the period (90,482) 229,834 Adjustments for non cash charges and other items Depreciation on operating fixed assets and investment property 25,657 22,603 Amortization of intangible assets 1,677 1,207 Charge for the period on staff retirement benefit funds 3,386 3,252 Charge for compensated absences 3 51 Provision for 10-C bonus – 33 Dividend income (18,423) (18,761) Unrealized gain on held for trading investments - net 14,357 55,676 Gain on sale of investments - net (983) (210,043) Unrealized loss / (gain) on commodity - Silver 57 (371) Reversal of provision for doubtful trade debts - net – (10,900) Return on deposits, loan and investments (751) (138) Gain on disposal of operating fixed assets (2,688) – Deferred income (510) (212) Finance costs 11,859 12,581 Share of loss / (profit) from equity accounted investees - net of taxation 63,957 (108,492) Working capital changes 20.1 111 (62,803)
7,227 (86,483)
20.1 Working capital changes
(Increase) / decrease in current assets Stores, spares and loose tools (4,026) (534) Stock-in-trade (15,920) 76,774 Trade debts (66,563) (35,724) Advances (115,975) (167,493) Trade deposits and short term prepayments (1,684) (2,716) Other receivables (439) (101,022)
(204,607) (230,715) Increase in current liabilities Trade and other payables 204,718 167,912
111 (62,803)
21. CASH AND CASH EQUIVALENTS
Running finances under mark-up arrangements (361,426) (448,550) Cash and bank balances 85,968 26,777
(275,458) (421,773)
NOTES TO THE CONDENSED INTERIM CONSOLIDATED FINANCIAL INFORMATION (UNAUDITED)For the first quarter ended 30 September 2014
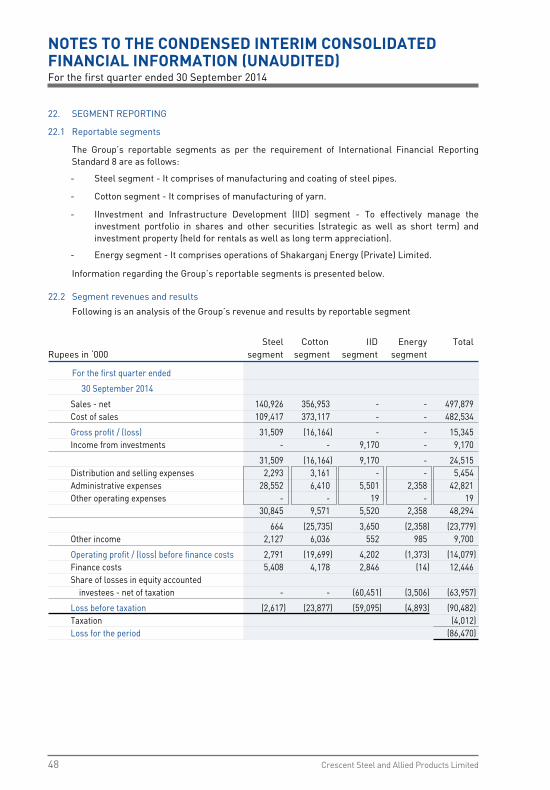
Crescent Steel and Allied Products Limited48
22. SEGMENT REPORTING
22.1 Reportable segments
The Group’s reportable segments as per the requirement of International Financial Reporting Standard 8 are as follows:
- Steel segment - It comprises of manufacturing and coating of steel pipes.
- Cotton segment - It comprises of manufacturing of yarn.
- IInvestment and Infrastructure Development (IID) segment - To effectively manage the investment portfolio in shares and other securities (strategic as well as short term) and investment property (held for rentals as well as long term appreciation).
- Energy segment - It comprises operations of Shakarganj Energy (Private) Limited.
Information regarding the Group’s reportable segments is presented below.
22.2 Segment revenues and results
Following is an analysis of the Group’s revenue and results by reportable segment
Steel Cotton IID Energy TotalRupees in ‘000 segment segment segment segment
For the first quarter ended
30 September 2014
Sales - net 140,926 356,953 - - 497,879 Cost of sales 109,417 373,117 - - 482,534
Gross profit / (loss) 31,509 (16,164) - - 15,345 Income from investments - - 9,170 - 9,170
31,509 (16,164) 9,170 - 24,515 Distribution and selling expenses 2,293 3,161 - - 5,454 Administrative expenses 28,552 6,410 5,501 2,358 42,821 Other operating expenses - - 19 - 19 30,845 9,571 5,520 2,358 48,294
664 (25,735) 3,650 (2,358) (23,779) Other income 2,127 6,036 552 985 9,700
Operating profit / (loss) before finance costs 2,791 (19,699) 4,202 (1,373) (14,079) Finance costs 5,408 4,178 2,846 (14) 12,446 Share of losses in equity accounted investees - net of taxation - - (60,451) (3,506) (63,957)
Loss before taxation (2,617) (23,877) (59,095) (4,893) (90,482) Taxation (4,012) Loss for the period (86,470)
NOTES TO THE CONDENSED INTERIM CONSOLIDATED FINANCIAL INFORMATION (UNAUDITED)For the first quarter ended 30 September 2014
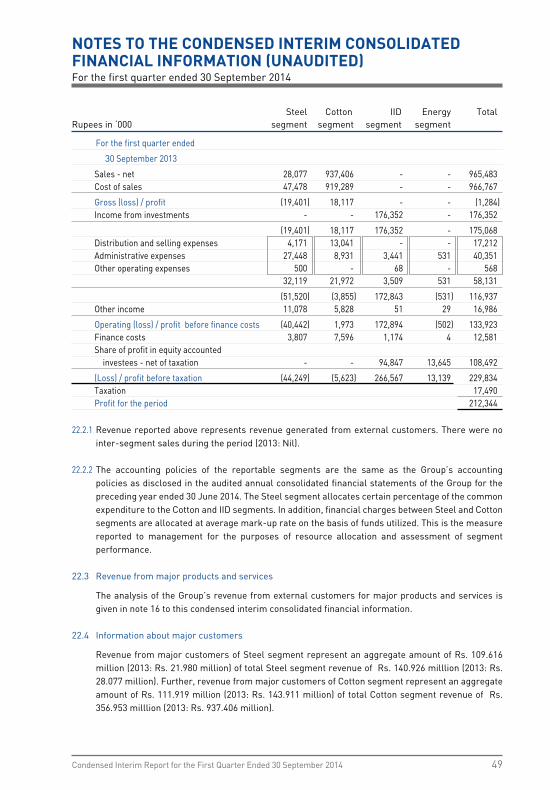
Condensed Interim Report for the First Quarter Ended 30 September 2014 49
Steel Cotton IID Energy TotalRupees in ‘000 segment segment segment segment
For the first quarter ended
30 September 2013
Sales - net 28,077 937,406 - - 965,483 Cost of sales 47,478 919,289 - - 966,767
Gross (loss) / profit (19,401) 18,117 - - (1,284) Income from investments - - 176,352 - 176,352
(19,401) 18,117 176,352 - 175,068 Distribution and selling expenses 4,171 13,041 - - 17,212 Administrative expenses 27,448 8,931 3,441 531 40,351 Other operating expenses 500 - 68 - 568 32,119 21,972 3,509 531 58,131
(51,520) (3,855) 172,843 (531) 116,937 Other income 11,078 5,828 51 29 16,986
Operating (loss) / profit before finance costs (40,442) 1,973 172,894 (502) 133,923 Finance costs 3,807 7,596 1,174 4 12,581 Share of profit in equity accounted investees - net of taxation - - 94,847 13,645 108,492
(Loss) / profit before taxation (44,249) (5,623) 266,567 13,139 229,834 Taxation 17,490 Profit for the period 212,344
22.2.1 Revenue reported above represents revenue generated from external customers. There were no inter-segment sales during the period (2013: Nil).
22.2.2 The accounting policies of the reportable segments are the same as the Group’s accounting
policies as disclosed in the audited annual consolidated financial statements of the Group for the preceding year ended 30 June 2014. The Steel segment allocates certain percentage of the common expenditure to the Cotton and IID segments. In addition, financial charges between Steel and Cotton segments are allocated at average mark-up rate on the basis of funds utilized. This is the measure reported to management for the purposes of resource allocation and assessment of segment performance.
22.3 Revenue from major products and services
The analysis of the Group’s revenue from external customers for major products and services is given in note 16 to this condensed interim consolidated financial information.
22.4 Information about major customers
Revenue from major customers of Steel segment represent an aggregate amount of Rs. 109.616 million (2013: Rs. 21.980 million) of total Steel segment revenue of Rs. 140.926 milllion (2013: Rs. 28.077 million). Further, revenue from major customers of Cotton segment represent an aggregate amount of Rs. 111.919 million (2013: Rs. 143.911 million) of total Cotton segment revenue of Rs. 356.953 milllion (2013: Rs. 937.406 million).
NOTES TO THE CONDENSED INTERIM CONSOLIDATED FINANCIAL INFORMATION (UNAUDITED)For the first quarter ended 30 September 2014
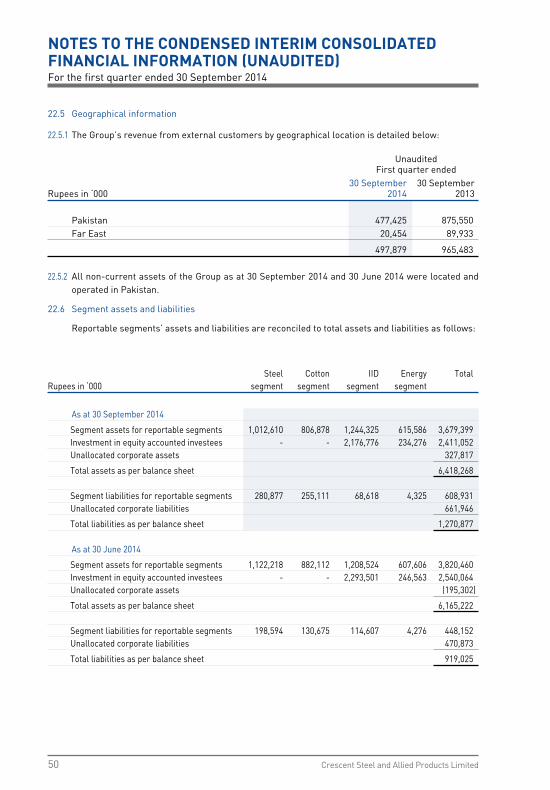
Crescent Steel and Allied Products Limited50
22.5 Geographical information 22.5.1 The Group’s revenue from external customers by geographical location is detailed below:
Unaudited First quarter ended 30 September 30 SeptemberRupees in ‘000 2014 2013
Pakistan 477,425 875,550 Far East 20,454 89,933
497,879 965,483
22.5.2 All non-current assets of the Group as at 30 September 2014 and 30 June 2014 were located and operated in Pakistan.
22.6 Segment assets and liabilities
Reportable segments’ assets and liabilities are reconciled to total assets and liabilities as follows:
Steel Cotton IID Energy TotalRupees in ‘000 segment segment segment segment
As at 30 September 2014
Segment assets for reportable segments 1,012,610 806,878 1,244,325 615,586 3,679,399 Investment in equity accounted investees - - 2,176,776 234,276 2,411,052 Unallocated corporate assets 327,817
Total assets as per balance sheet 6,418,268 Segment liabilities for reportable segments 280,877 255,111 68,618 4,325 608,931 Unallocated corporate liabilities 661,946
Total liabilities as per balance sheet 1,270,877 As at 30 June 2014
Segment assets for reportable segments 1,122,218 882,112 1,208,524 607,606 3,820,460 Investment in equity accounted investees - - 2,293,501 246,563 2,540,064 Unallocated corporate assets (195,302)
Total assets as per balance sheet 6,165,222 Segment liabilities for reportable segments 198,594 130,675 114,607 4,276 448,152 Unallocated corporate liabilities 470,873
Total liabilities as per balance sheet 919,025
NOTES TO THE CONDENSED INTERIM CONSOLIDATED FINANCIAL INFORMATION (UNAUDITED)For the first quarter ended 30 September 2014
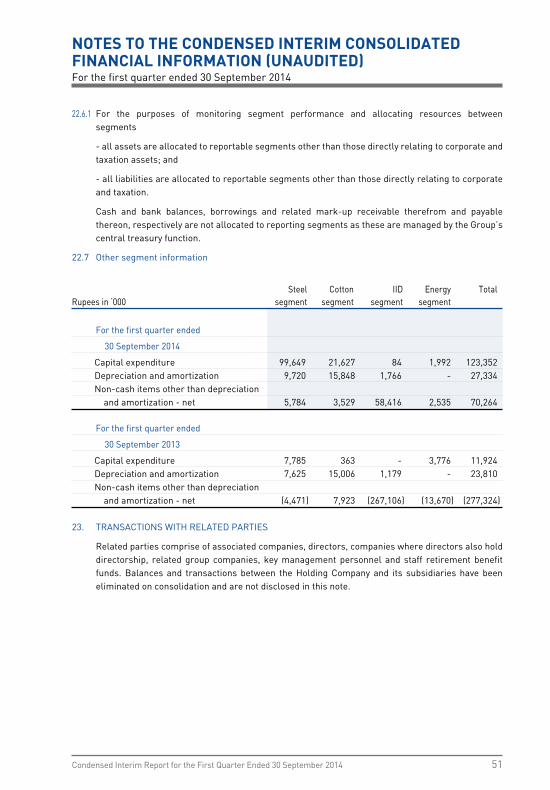
Condensed Interim Report for the First Quarter Ended 30 September 2014 51
22.6.1 For the purposes of monitoring segment performance and allocating resources between segments
- all assets are allocated to reportable segments other than those directly relating to corporate and taxation assets; and
- all liabilities are allocated to reportable segments other than those directly relating to corporate and taxation.
Cash and bank balances, borrowings and related mark-up receivable therefrom and payable thereon, respectively are not allocated to reporting segments as these are managed by the Group’s central treasury function.
22.7 Other segment information
Steel Cotton IID Energy TotalRupees in ‘000 segment segment segment segment
For the first quarter ended
30 September 2014
Capital expenditure 99,649 21,627 84 1,992 123,352 Depreciation and amortization 9,720 15,848 1,766 - 27,334 Non-cash items other than depreciation and amortization - net 5,784 3,529 58,416 2,535 70,264 For the first quarter ended
30 September 2013
Capital expenditure 7,785 363 - 3,776 11,924 Depreciation and amortization 7,625 15,006 1,179 - 23,810 Non-cash items other than depreciation and amortization - net (4,471) 7,923 (267,106) (13,670) (277,324)
23. TRANSACTIONS WITH RELATED PARTIES
Related parties comprise of associated companies, directors, companies where directors also hold directorship, related group companies, key management personnel and staff retirement benefit funds. Balances and transactions between the Holding Company and its subsidiaries have been eliminated on consolidation and are not disclosed in this note.
NOTES TO THE CONDENSED INTERIM CONSOLIDATED FINANCIAL INFORMATION (UNAUDITED)For the first quarter ended 30 September 2014

Crescent Steel and Allied Products Limited52
Transactions with related parties of the Group other than those disclosed elsewhere are as follows Rupees in ‘000 Unaudited First quarter ended Name of entity Nature of Nature of 30 September 30 September
relationship transaction 2014 2013
Shakarganj Mills Limited Associated company Dividend paid - 2,448
Sales of finished goods 486 3,145
Services received 619 487
Reimbursable expenses 392 2,490
Crescent Jute Products Limited Related party Services received 37 -
Reimbursable expenses 211 -
CSAP Foundation * Related party Donation given 569 -
Muhammad Amin Muhammad Bashir Limited * Related party Dividend paid - 1
Premier Insurance Company * Related party Insurance premium 2,460 2,255
The Citizens’ Foundation * Related party Donation given 42 -
The Crescent Textile Mills Limited * Related party Dividend paid - 5,589
Crescent Cotton Products - Staff Provident Fund Retirement benefit fund Contribution made 414 429
Dividend paid - 4
Crescent Steel and Allied Products Limited - Gratuity Fund Retirement benefit fund Contribution made 969 930
Dividend paid - 1,070
NOTES TO THE CONDENSED INTERIM CONSOLIDATED FINANCIAL INFORMATION (UNAUDITED)For the first quarter ended 30 September 2014
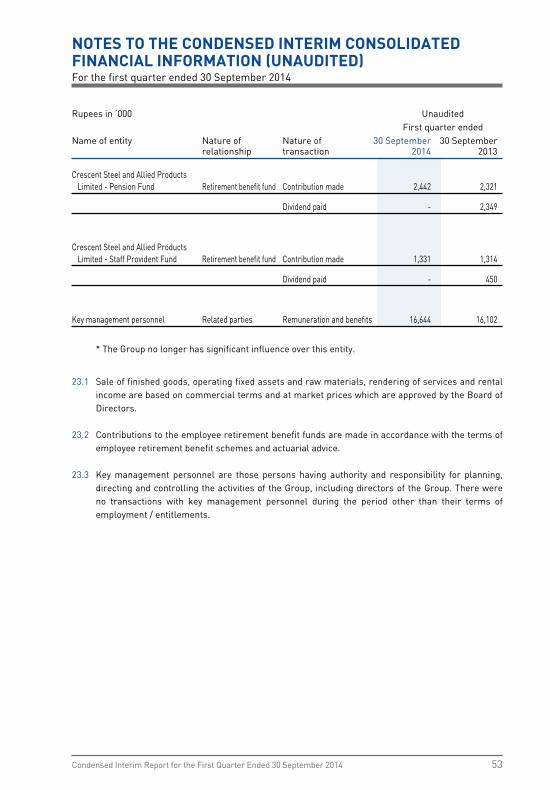
Condensed Interim Report for the First Quarter Ended 30 September 2014 53
Rupees in ‘000 Unaudited First quarter ended Name of entity Nature of Nature of 30 September 30 September
relationship transaction 2014 2013
Crescent Steel and Allied Products Limited - Pension Fund Retirement benefit fund Contribution made 2,442 2,321
Dividend paid - 2,349
Crescent Steel and Allied Products Limited - Staff Provident Fund Retirement benefit fund Contribution made 1,331 1,314
Dividend paid - 450
Key management personnel Related parties Remuneration and benefits 16,644 16,102
* The Group no longer has significant influence over this entity.
23.1 Sale of finished goods, operating fixed assets and raw materials, rendering of services and rental income are based on commercial terms and at market prices which are approved by the Board of Directors.
23.2 Contributions to the employee retirement benefit funds are made in accordance with the terms of employee retirement benefit schemes and actuarial advice.
23.3 Key management personnel are those persons having authority and responsibility for planning, directing and controlling the activities of the Group, including directors of the Group. There were no transactions with key management personnel during the period other than their terms of employment / entitlements.
NOTES TO THE CONDENSED INTERIM CONSOLIDATED FINANCIAL INFORMATION (UNAUDITED)For the first quarter ended 30 September 2014
Crescent Steel and Allied Products Limited54
24. FINANCIAL RISK MANAGEMENT
The Group’s financial risk management objectives and policies are consistent with those disclosed in the annual consolidated financial statements of the Group as at and for the year ended 30 June 2014.
25. DATE OF AUTHORIZATION FOR ISSUE
This condensed interim consolidated financial information was authorized for issue in the Board of Directors meeting held on 28 October 2014.
NOTES TO THE CONDENSED INTERIM CONSOLIDATED FINANCIAL INFORMATION (UNAUDITED)For the first quarter ended 30 September 2014
Chief Executive Director Chief Financial Officer