Embed Size (px)
Citation preview

0
Stock Code: 2324
Compal Electronics, Inc.
2015 Annual Report
Notice to readers
This English-version annual report is a summary translation of the Chinese version
and is not an official document approved in a shareholders’ meeting in accordance
with Taiwanese laws. Should any discrepancy arise between the English and
Chinese versions, the Chinese version shall prevail.
Taiwan Stock Exchange Market Observation Post System:
http://newmops.twse.com.tw
Company Annual Report is available at: http://www.compal.com
Printed on May 11, 2016

1
I. Spokesperson
Spokesperson: Gary Lu / Vice President
Deputy Spokesperson: Jack Wang / Director of Accounting Dept.
Tel: 886-2-8797-8588
E-mail: [email protected]
II. Headquarters, Branches and Plant
Headquarters
Address: No.581, Ruiguang Rd., Neihu District, Taipei, Taiwan
Tel: 886-2- 8797-8588
Manufacturing Site
Address: No. 8, South East Rd., Pingzhen City, Taoyuan County
Tel: 886-3-439-1707
III. Share Administration Agency
Chinatrust Transfer Agent
Address: 5F, No. 83, Sec 1, Chung Ching Nan Road, Taipei, Taiwan
Tel: 886-2-6636-5566
Website: https://www.ctbcbank.com
IV. Auditors
CPA Firm: KPMG
Auditors: Kuo, Kuan Ying and Lo, Jui Lan
Address: 68F, No. 7, Sec. 5, Xinyi Road, Taipei, Taiwan
Tel.: 886-2-8101-6666
Website: http://www.kpmg.com.tw
V. Overseas Securities Exchange
Luxembourg Stock Exchange: http://www.bourse.lu
London Stock Exchange http://www.londonstockexchange.com
VI. Corporate Website
http://www.compal.com

1
Table of Contents
3 I. Letter to Shareholders
II. Company Profile 6 2.1 Date of Incorporation
6 2.2 Company History
III. Corporate Governance Report
8 3.1 Organization
10 3.2 Directors, Supervisors and Management Team
33 3.3 Implementation of Corporate Governance
61 3.4 Information Regarding the Company’s Audit Fee and Independence
62 3.5 Changes in Shareholding of Directors, Supervisors, Managers and Major Shareholders
64 3.6 Relationship among the Top Ten Shareholders
66 3.7 Ownership of shares in Affiliated Enterprises
IV. Capital Overview
68 4.1 Capital and Shares
73 4.2 Bonds
73 4.3 Global Depository Receipts
74 4.4 Employee Warrants
74 4.5 Subscription of New Shares by Employees and Restricted Shares
76 4.6 New Share Issuance in Connection with Mergers and Acquisitions
76 4.7 Financing Plans and Implementation
V. Operational Highlights 77 5.1 Business Activities
81 5.2 Market and Sales Overview
84 5.3 Human Resources
84 5.4 Environmental Protection Expenditure
85 5.5 Labor Relations
88 5.6 Important Contracts
VI. Financial Information 89 6.1 Five-Year Financial Summary
97 6.2 Five-Year Financial Analysis
101 6.3 Audit Committee’s Report in the Most Recent Year
102 6.4 Consolidated Financial Statements and Independent Auditors’ Report
102 6.5 Parent-Company-Only Financial Statements and Independent Auditors’ Report

2
VII. Review of Financial Position, Operating Results, and Risk Management
103 7.1 Analysis of Financial Status
104 7.2 Analysis of Operation Results
105 7.3 Analysis of Cash Flow
106 7.4 Major Capital Expenditures
106 7.5 Investment Policy in Last Year, Main Causes for Profits or Losses, Improvement Plans and Investment Plans for the Coming Year
108 7.6 Analysis of Risk Management
VIII. Special Disclosure
112 8.1 Summary of Affiliated Companies
113 8.2 Private Placement of Securities in the Most Recent Year
113 8.3 Subsidiaries’ Holding of the Company’s Shares in the Most Recent Year
113 8.4 Events with Significant Impacts

3
I. Letter to Shareholders
Dear Shareholders:
Thank you all for your support of Compal Electronics, Inc. (hereafter referred to as “Compal”) over the past
year! The year of 2015 was a dramatic year in a way resembling the “chameleon” as a period of time when
the global economic change was indeed beyond everyone’s expectation significantly. Despite the impact of
economic recession and weak market demands, with the endeavors and efforts of the entire staff of Compal,
the annual sales of the company was well maintained and the net profit also showed a growth over the
previous fiscal year. Looking ahead of this year, the global economy is likely to be still in recession.
However, we believe that corporations should continue to strive for research and developments and
vigorously expand new businesses to be ready for the future challenges ahead without using the excuse of
the economic recession. Here, with respect to the operational performance of last year and the operation
outlook of this year, we summarize the following for you:
2015 Financial Performance
The consolidated sales of Compal in 2015 was NT$847,306 million dollars, slightly up by 0.2%
year-on-year, in which the business contribution of non-notebook computer products continued to increase
from 23% to 28%. The consolidated operating profit was NT$11,312 million dollars, down 3% year-on-year.
Nevertheless, with significant improvement in the non-operating segment and reduction of non-operating
loss, the net profit attributed to the parent company was NT$ 8,685 million dollars, up 24% year-on-year.
The earning per share (EPS) of the company was NT$ 2.01.
2015 Business Development
The total shipment of computer products of the Computer Business Group (PCBG) in 2015 was down by
10% less than the previous year, and it was mainly affected by the weaker demands of the overall market
and the global recession. Nevertheless, with the change of the usage habit of the consumers, various types of
demands emerged, such as the demands for ultra-slim notebooks, high-end gaming notebooks and
two-in-one notebooks, of which the products required more precise market segmentation and positioning. In
the fields of slim type material technology, power-saving technology and heat dissipation technology etc.,
the Company will continue to develop state-of-the art innovative and quality products in cooperation with
our clients in order to satisfy the market demands.
The total shipment of the products of the Smart Device Business Group (SDBG) in 2015 was up by 30%
over the previous year. Such rapid growth benefited from the development of the tablet business and the
continuous investment in the development of the new technology of LTE smartphone as well as the
cooperation with our new prospective clients. For tablets, Compal constantly develops new usage models
and integrates with the application of the Internet-of-Things (IoT). For smartphones, the company also
vigorously develops image technology and new designs of software services in order to create unique
products. Accordingly, Compal continues to maintain its leading position in the industry.

4
Corporate Governance & Social Responsibility
During the development of the business, Compal is also committed to invest in the corporate sustainability
for business operations in a long term. With regard to the corporate governance, Compal has established the
Auditing Committee in 2015 and received the award for top 5% ranking in the “First-Term Corporate
Governance Evaluation” by the Taiwan Stock Exchange Corporation (TWSE). With regard to the green
environment, in addition to the promotion on the green and halogen-free products, the company has also
been included in the Climate Disclosure Leadership Index (CDLI) for the first time with recognition by
international institutes. In terms of social welfare, Compal continues to fulfill the corporate social
responsibility and engages in the promotion of the rural children digital learning program. In 2015, the
Commonweath Magazine ranked the company No. 16 in the “CSR Corporate Citizen Awards” for large
corporations, and the commitment of Compal in the corporate sustainability was recognized by society once
again.
2016 New business Development
With years of experience in the technology platform and research and development in the information
technology and communication industry, Compal has been able to rapidly and effectively enter various new
business fields, including the fields of Server, Auto Electronics, Smart Home, IoT Vertical Solution, Smart
Medical and Healthcare and Smart Wearable Devices etc. For the development of new businesses, Compal
develops customized and competitive products according to the demands in each field such that the
company is not merely acting as a hardware supplier but further engages in the development of integrated
system service, and the goal is to establish a new service-oriented business model with sources of revenue.
Moreover, with the emerging trend of aging society and health management and the rise of sports fashion,
we are of the opinion that smart medical and healthcare will soon be an important area and topic for future
industrial development. Considering our solid experience in the information technology and communication
along with the advantages in integration and product developments, not to mention our active cross-industry
alliance, Compal is able to rapidly develop comprehensive and diverse products and services in light of
providing greater sources and developments for the industry of medical and healthcare industry in Taiwan in
the future.
Business Outlook
According to market research firms (IDC), the global market demands for notebook and tablet in 2016 will
be down year-over-year, and the annual growth of the smartphone demand will be reduced. Nevertheless, the
new application fields, such as server, auto electronics, IoT and smart wearable devices are expected to have
opportunities for significant growths and will become competitive areas for all companies. Despite the
global economy still being in its down time, with consideration to the global market condition and the
business development of the company, Compal expects the total shipment of 5C (Computing,
Communication, Consumer, Cloud, Connecting) related electronic products to continue to grow over the
previous year. The revenue contribution of the non-notebook business in 2016 is expected to head toward
the goal of exceeding 30% contribution in total.

5
In the long term, Compal will continue to advance in innovation, to enhance value-added products and
services, to increase the competitiveness of the company and to constantly sustain revenue and profit growth
at the same time as our most vital commitments to all of our shareholders. Once again, we sincerely
appreciate your support and advice for Compal and wish you a peaceful and prosperous year!
Sincerely yours,
Chairman: Sheng-Hsiun Hsu (Rock Hsu)
Chief Executive Officer (CEO): Jui-Tsung Chen (Ray Chen)
Chief Finance Officer (CFO): Ching-Hsiung Lu (Gary Lu)

6
II. Company Profile
2.1 Date of Incorporation: June 1, 1984
2.2 Company History
Company history in the past two years:
Year Milestones
2014 • Compal Communication Inc. was officially merged into Compal Electronics Inc. on February 27.
• The Company won 11 awards during the 2014 “iF Design Awards,” which made Compal and ASUS
the two Taiwanese companies with the highest number of awards.
• Compal ranked 22nd in the world for the number of iF awards won in the last 3 years.
• Ranked 1492nd in Forbes’ The World’s Biggest Public Companies 2014.
• Ranked 6th in CommonWealth Magazine’s “Top-2000 Manufacturers” and 46th in the “Cross-strait
Top-1000 Survey.”
• The Company was awarded a Bronze award by Taiwan Institute for Sustainable Energy during its
“Taiwan Corporate Sustainability Report Award.”
• The Company was ranked 36th by CSR Asia Summit during the 2014 “Channel News Asia
Sustainability Ranking.”
• The Company’s share capital reached NTD 44.2 billion by the end of 2014.
• The Company earned NTD 845.7 billion in consolidated revenues in 2014.
2015 • Won 6 awards of 2015 “iF design” and ranked 18th on Global Innovation.
• Ranked 423rd on the Fortune Global 500.
• Ranked 1412nd on the Fobes Global 2000.
• Ranked 6th in CommonWealth Magazine’s “Top-2000 Manufacturers” and 44th in the “Cross-strait
Top-1000 Survey.”
• Top 5% TWSE –listed companies of the “First Round of Corporate Governance Evaluation”
conducted by TWSE.
• Ranked 16th on CommonWealth magazine’s Top 50 CSR in Corporate Citizen Awards.
• Ranked 34th on The 100 most sustainable companies in Asia by CSR Asia Summit.
• 4th National Industrial Innovation Award of Ministry of Economic Affairs, R.O.C for Innovative
Trailblazer Award.
• Received Taiwan Corporate Sustainability Report Awards in “2015 Taiwan Corporate Sustainability
Awards.”
IT & IC Manufacturing - The Bronze Medal.
• Adopt Taipei Neihu Zhouzi Park No.2 and received 2015 Excellence in Sponsorship of Clean Air
Zones in Taipei.
• First-time being included in the 2015 Climate Disclosure Leadership Index (CDLI) by Carbon
Disclosure Project CDP (CDP).
• First-time completion of the inspections and verifications of the emissions produced by staff business
flights of GHG Protocol Scope 3.

7
• The Company’s share capital reached NTD 44.7 billion by the end of 2015.
• The Company earned NTD 847.3 billion in consolidated revenues in 2015.
2016 • Won 10 awards of 2016 “iF design” and ranked 15th on Global Innovation.
• Top 6%-20% TWSE-listed companies of the “Second Round of Corporate Governance Evaluation” by
TWSE.
• Ranked 4th in CommonWealth Magazine’s “Top-2000 Manufacturers.”

8
Shareholder’s Meeting
Board of Directors
President’s Office
Top Management
Committee
Personnel Evaluation Committee
Auditing Office
Green Sustainability
Office
HR & Administration
Corporate Social
Responsibility Office
PC BG
Remuneration
Committee
Legal Affairs Office
Insider Trading Prevention
Office
Investment Planning and
Management Office
Audit
Committee
Accounting Group
III. Corporate Governance Report
3.1 Organization
3.1.1 Organizational Chart (As of Mar 1, 2016)
Smart Device BG
9
3.1.2 Major Corporate Functions
Department Functions
President’s Office Responsible for the Company’s operation
Investment Planning and
Management Office
Responsible for investment-related activities, operational analyses, policy making,
resource allocation, and budgeting for the entire company
Auditing Office Conducts internal audits
Legal Affairs Office Handles the Company’s legal affairs
Green Sustainability Office Executes “Green Life” projects
Insider Trading Prevention
Office Implements preventive measures against insider trading
Corporate Social
Responsibility Office Promotes and executes CSR-related affairs
PC BG Responsible for the R&D, production, quality control and sale of PC products
Smart Device BG Responsible for the R&D, production, quality control and sale of smart devices
Accounting Group Handles accounting, share administration, and funding affairs
HR & Administration Group Responsible for human resource, training, education, employee relations,
procurement and building management

10
3.2 Directors, Supervisors and Management Team
3.2.1 Directors and Supervisors April 26, 2016
Title Name/Nation
ality (Note 1)
Elected Date Term
First Elected Date
(Note 3)
Shareholding as of elected date
Current shareholding Shares held by spouse and underage children
Shares held by proxy
Major career (academic) achievements
Selected Current Positions held
concurrently in the company and/or
any other companyitions
Spouse or relatives of second degree or closer acting as Directors, Supervisors, or department heads
Shares
Shareholding
Percentage
(%)
Shares
Shareholding
Percentage
(%)
Shares
Shareholding
Percentage
(%)
Shares
Shareholding
Percentage
(%)
Title Name Relationship
Chairman Sheng-Hsiun
Hsu 2015.6.26
3 year (s)
1984.04.16 17,775,401 0.40% 17,775,401 0.40% 30,107,025 0.67% 0 0.00%
Honorary Doctorate, National Taiwan Normal University Chairman of Kinpo and Compal Electronics Inc.
(Note 4) Director Director
Sheng-Chieh Hsu Shyh-Yong Shen
Brothers Father and son in law
Director
Jui-Tsung Chen
2015.6.26 3 year
(s) 1992.04.30 50,782,587 1.14% 50,782,587 1.14% 2,092,405 0.05% 0 0.00%
Department of Electrical Engineering, National Cheng Kung University Chairman of Compal Communication Inc. & Arcadyan Technology Corp.
(Note 4) N/A N/A N/A
Director Wen-Being Hsu
2015.6.26 3 year
(s) 1984.04.16 4,000,000 0.09% 4,000,000 0.09% 0 0.00% (Note 3) (Note 3)
National Tao-Yuan Sr. Vocational Agricultural & Industrial School Director of BAOTEK, Inc.
(Note 4) N/A N/A N/A
Director
Kinpo Electronics
Inc. 2015.6.26
3 year (s)
1990.06.22 151,628,692 3.39% 151,628,692 3.39% - - 0 0.00% M.B.A., University of Southern California; PhD, Whittier Law SchoolMBA WHITTIER Director and President of Kinpo Electronics Inc.
(Note 4) Chairman Sheng-Hsiun Hsu Father and son in law Representative:
Shyh-Yong Shen
2012.03.14 0 0.00% 0 0.00% 0 0.00% 0 0.00%
Director Charng-Chyi Ko (Note 2)
2015.6.26 3 year
(s) 1984.04.16 7,896,867 0.18% 7,896,867 0.18% 10,645 0.00% 0 0.00%
National Taiwan University College of Management Chairman and President of Taiwan Biotech Co., Ltd.
(Note 4) N/A N/A N/A
Director Sheng-Chieh Hsu (Note 2)
2015.6.26 3 year
(s) 1997.05.29 9,119,297 0.20% 9,119,297 0.20% 8,834,928 0.20% (Note 3) (Note 3)
Department of Architecture, Tam-Kang University Managing Director of Kinpo Electronics Inc.
(Note 4) Chairman Sheng-Hsiun Hsu Brothers
Director Yen-Chia Chou
(Note 2) 2015.6.26
3 year (s)
1987.06.13 8,022,874 0.18% 8,022,874 0.18% 2,502,768 0.06% 0 0.00%
Department of Geosciences, National Taiwan University Supervisor of Kinpo Electronics Inc.
(Note 4) N/A N/A N/A
Director Wen-Chung
Shen 2015.6.26
3 year (s)
1988.04.08 11,935,968 0.27% 11,935,968 0.27% 101,931 0.00% 0 0.00%
Department of Electrical Engineering, National Taiwan University Director of Arcadyan Technology Corp.
(Note 4) N/A N/A N/A

11
Title Name/Nation
ality (Note 1)
Elected Date Term
First Elected Date
(Note 3)
Shareholding as of elected date
Current shareholding Shares held by spouse and underage children
Shares held by proxy
Major career (academic) achievements
Selected Current Positions held
concurrently in the company and/or
any other companyitions
Spouse or relatives of second degree or closer acting as Directors, Supervisors, or department heads
Shares
Shareholding
Percentage
(%)
Shares
Shareholding
Percentage
(%)
Shares
Shareholding
Percentage
(%)
Shares
Shareholding
Percentage
(%)
Title Name Relationship
Director Yung-Ching
Chang 2015.6.26
3 year (s)
2000.03.30 3,898,587 0.09% 3,727,587 0.08% 7,259 0.00% 0 0.00%
Master’s Defree in Graduate school of Management, Yuan Ze University Chairman of Allied Circuit Co., Ltd.
(Note 4) N/A N/A N/A
Director Chung-Pin
Wong 2015.6.26
3 year (s)
2007.06.15 4,833,618 0.11% 4,833,618 0.11% 1,398 0.00% 0 0.00%
Graduate Institute of Management Science, National Chiao Tung University Chairman of Rayonnant Technology Co., Ltd.
(Note 4) N/A N/A N/A
Director Chiung-Chi
Hsu 2015.6.26
3 year (s)
1994.04.23 2,000,731 0.04% 2,000,731 0.04% 30,000 0.00% 0 0.00%
Master’s Degree, Golden Gate University, San Francisco, USA Director of Eb-Bow-Bearing Co., Ltd.
(Note 4) N/A N/A N/A
Director Chao-Cheng
Chen 2015.6.26
1 year (s)
2014.6.20 4,850,000 0.11% 3,000,000 0.07% 1,428 0.00% 0 0.00%
Graduate Institute of Electrical
Engineering, National Taiwan
University President of Compal Communication Inc.
(Note 4) N/A N/A N/A
Independent Director
Min Chih
Hsuan 2015.6.26
3 year (s)
2012.6.22 0 0.00% 0 0.00% 0 0.00% 0 0.00%
Honorary Doctorate, National Chiao Tung University Chairman of United Microelectronics Corp. & Faraday Technology Corp.
(Note 4) N/A N/A N/A
Independent Director Duei Tsai 2015.6.26
3 year (s)
2012.6.22 0 0.00% 0 0.00% 0 0.00% 0 0.00%
PhD, Graduate Institute of Electrical Engineering, National Taiwan University Minister of Transportation and Communications R.O.C.
(Note 4) N/A N/A N/A
Independent Director Duh Kung Tsai 2015.6.26
3 year (s)
2012.6.22 0 0.00% 0 0.00% 0 0.00% 0 0.00%
Department of Industrial Engineering, National Taipei Institute of Technology Chairman of Powertech Technology Inc.
(Note 4) N/A N/A N/A
Note: 1. All directors are Republic oof China nationals. 2. The previous supervisors: Charng-Chyi Ko, Sheng-Chieh Hsu, and Yen-Chia Chou resigned as of June 26, 2015, and were elected as directors in 2015 shareholders meeting. The directors Medica, John Kevin, and Sean
Martin Maloney were resigned as of June 26, 2015. The terms of service of Supervisor Sheng-Chieh Hsu was temporarily discontinued between June 22, 1990 and April 22, 1994. 3. Director Wen-Being Hsu held 5,000,000 shares (0.11%) through proxies, while Supervisor Sheng-Chieh Hsu held 3,500,000 shares (0.08%) through proxies. 4. Selected Current Positions as below:
12
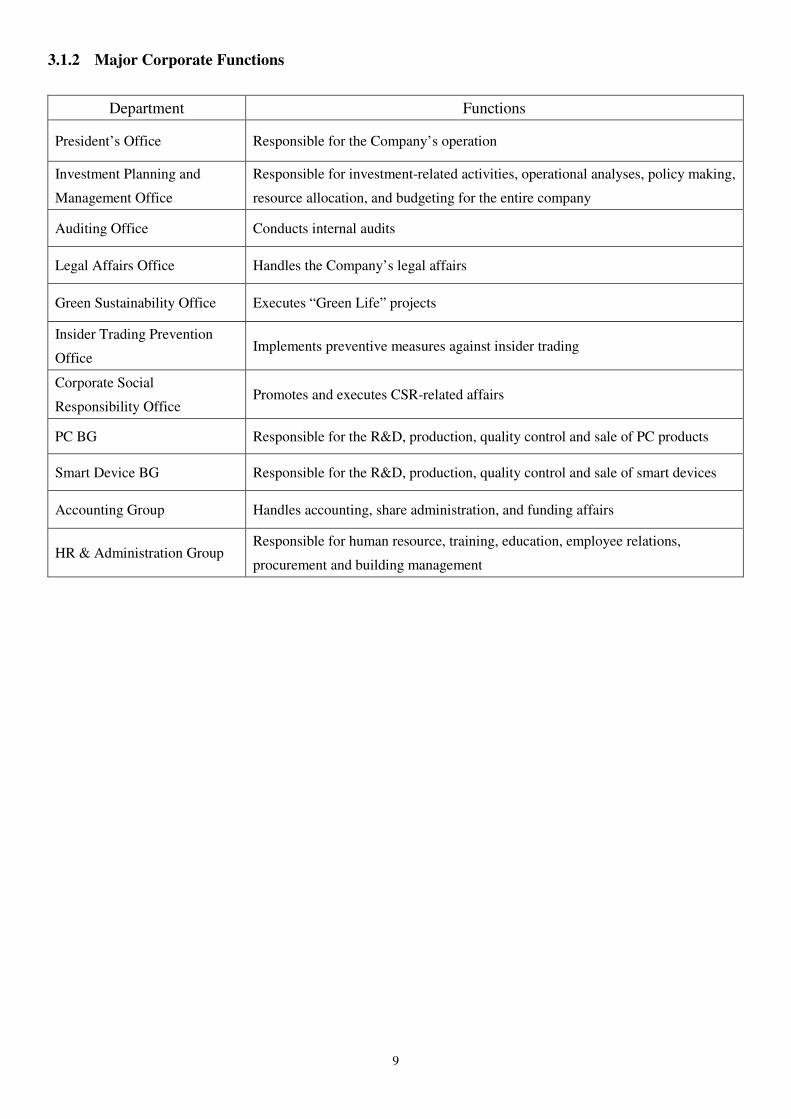
Title Name Selected Current Positions
Chairman Sheng-Hsiun Hsu
Chairman: Kinpo Electronics Inc., AcBel Polytech Inc., Cal-Comp Electronics (Thailand) Public Company Limited, Cal-Comp Electronics And communications Co., Ltd., Teleport Access Services, Inc.,
Compal Electronics Technology (Kunshan) Co., Ltd., Compal Information (Kunshan) Co., Ltd., Compal Information Technology (Kunshan) Co., Ltd., Compal Information Research &
Development (Nanjing) Co., Ltd., Kunshan Botai Electronics Co., Ltd., Compal Digital Technology (Kunshan) Co., Ltd., Compal Electronics (Chengdu) Co., Ltd., Compal Electronics
(Chongqing) Co., Ltd., Compal Electronics (China) Co., Ltd., Compal Optoelectronics (Kunshan) Co., Ltd., Compal Display Electronics (Kunshan) Co., Ltd., Compal Investment (Sichuan)
Co., Ltd., Compal Investment (Jiangsu) Co., Ltd., Compal Management (Chengdu) Co., Ltd., Gempal Technology Corp., Panpal Technology Corp., Kinpo Electronics (China) Co., Ltd., Hong Ji
Capital Co., Ltd., Hong Jin Investment Co., Ltd., Zhaopal Investment Co., Ltd., Yongpal Investment Co., Ltd., Kaipal Investment Co., Ltd., Jipo Investment Inc., Kinpo Group Management
Consultant Company, Breeze Integrated Development Co., Ltd. and China Productivity Center
Vice Chairman: Straits Exchange Foundation and SINOCON Industrial Standards Foundation
Managing Director: Baotek Industrial Materials Ltd., Taiwan Biotech Co., Ltd. and Taiwan Design Center
Director: Compal System Trading (Kunshan) Co., Ltd., Cal-Comp Optical Electronics (Suzhou) Co., Ltd., Cal-Comp Technology (Suzhou) Co., Ltd., Cal-Comp Electronics and Communications (Suzhou)
Co., Ltd., Crownpo Technology Inc., Cdib & Partners Investment Holding Corp., Acbel Polytech Holdings Inc.、Acbel Polytech (Singapore) Pte. Ltd.、Ascendant Private Equity Investment
Ltd.、Billion Sea Holdings Limited、Big Chance International Co., Ltd.、Center Mind International Co., Ltd.、Compal Display Holding (HK) Limited、Compal Electronics (Holding) Ltd.、
Compal Electronics International Ltd.、Compal International Ltd、Compal Ineternational Holding (HK) Limited.、Compal International Holding Co., Ltd.、Compal Rayonnant Holding
Ltd.、Core Profit Holdings Limited、Flight Global Holding Inc.、Forward International Ltd. 、Fortune Way Technology Corp.、Global Strategic Investment Inc.、Goal Reach Enterprises
Ltd.、HengHao Holding A Co., Ltd.、HengHao Holding B Co., Ltd.、HengHao Trading Co., Ltd.、High Shine Industrial Corp.、Intelligent Universal Enterprise Ltd.、Jenpal International
Ltd.、Just International Ltd.、Kingbolt International (Singapore) Pte. Ltd.、Kinpo International Ltd.、Lipo Holding Co., Ltd.、Prospect Fortune Group Ltd.、Prisco International Co., Ltd.、
Ranashe International Ltd.、Smart International Trading Ltd. and Management Institute in Taipei
Honorary Chairman: Importers and Exporters Association of Taipei
Chairman: Chinese National Federation of Industries (CNFI)
Policy Advisers: Taiwan Electrical and Electronic Manufacturers’ Association (TEEMA)
President: Kinpo Group Management Consultant Company
Director Jui-Tsung Chen
Chairman: Arcadyan Technology Corp., Ripal Optoelectronics Co., Ltd., Henghao Technology Co., Ltd., Infinno Technology Corp., Huang Feng Communication Co., Ltd., Mactech Co., Ltd., Unicom
Globak, Inc., Compal System Trading (Kunshan) Co., Ltd., General life Biotechnology Co., Ltd., Amexcom Electronics, Inc.
Director: Kinpo Electronics Inc., Compal Electronics Technology (Kunshan) Co., Ltd., Compal Information (Kunshan) Co., Ltd., Compal Information Technology (Kunshan) Co., Ltd., Compal
Information Research & Development (Nanjing) Co., Ltd., Kunshan Botai Electronics Co., Ltd., Compal Digital Technology (Kunshan) Co., Ltd., Compal Electronics (Chengdu) Co., Ltd.,
Compal Electronics (Chongqing) Co., Ltd., Compal Electronics (China) Co., Ltd., Compal Optoelectronics (Kunshan) Co., Ltd., Compal Display Electronics (Kunshan) Co., Ltd., Compal
Networking (Kunshan) Co., Ltd., Compal (Vietnam) Co., Ltd., Compal Investment (Sichuan) Co., Ltd., Compal Investment (Jiangsu) Co., Ltd., Compal Management (Chengdu) Co., Ltd.,
Compal Development & Management (Vietnam) Co., Ltd., Gempal Technology Corp., Panpal Technology Corp., Compal Broadband Networks, Inc., Hong Ji Capital Co., Ltd., Hong Jin
Investment Co., Ltd., Zhaopal Investment Co., Ltd., Yongpal Investment Co., Ltd., Kaipal Investment Co., Ltd., Kinpo Group Management Consultant Company, Ascendant Private Equity
Investment Ltd., Arcadyan Technology N.A. Corporation, Arcadyan Holding (BVI) Corp., Arch Holding (BVI) Corp., Billion Sea Holdings Limited, Big Chance International Co., Ltd., Bizcom
Electronics, Inc., Center Mind International Co., Ltd., Compal Display Holding (HK) Limited, Compal Electronics International Ltd., Compal Electronics (Holding) Ltd., Compal Electronics
Europe Sp. z o.o., Compal International Ltd., Compal International Holding Co., Ltd., Compal International Holding (HK) Limited, Compal Rayonnant Holding Ltd., Compalead Electronics
B.V., Core Profit Holdings Limited, Etrade Management Co., Ltd., Flight Global Holding Inc., Forever Young Technology Inc., Fortune Way Technology Corp., Giant Rank Trading Ltd., Goal
Reach Enterprises Ltd., HengHao Holding A Co., Ltd., HengHao Holding B Co., Ltd., HengHao Trading Co., Ltd., High Shine Industrial Corp., Intelligent Universal Enterprise Ltd., Jenpal
International Ltd., Just International Ltd., Prospect Forture Group Ltd., Prisco International Co., Ltd., Smart International Trading Ltd., Sinoprime Global Inc., Wah Yuen Technology Holding
Ltd. and Webtek Technology Co., Ltd.
President: Compal Electronics Inc., Gempal Technology Corp., Panpal Technology Corp., Hong Ji Capital Co., Ltd., Hong Jin Investment Co., Ltd., Zhaopal Investment Co., Ltd., Yongpal Investment Co.,
Ltd., Kaipal Investment Co., Ltd.
Director Wen-Being Hsu Director: Baotek Industrial Materials Ltd.x`

13
Title Name Selected Current Positions
Director
Kinpo Electronics
Inc.
Representative:
Shyh-Yong Shen
Chairman: Cal-Comp biotech Co., Ltd., Castlenet Technology Incorporation, XYZPrinting, Inc., Tung-WAN Kai-Bao Co., Ltd., Cal-Comp Optical Electronics (Suzhou) Co., Ltd., Cal-Comp Technology
(Suzhou) Co., Ltd., Cal-Comp Electronics and Communications (Suzhou) Co., Ltd., Cal-Comp Precision (Wujiang) Co., Ltd., Cal-Comp Precision (Dongguan) Co., Ltd., Avaplas Precision
Plastics (Shanghai) Co., Ltd., XYZprinting (Suzhou), Co., Ltd., Cal Comp (Malaysia) SDN. BHD., Cal-Comp Technology (Philippines), INC., Cal-Comp Electronics de Mexico Co. SA de CV,
Cal-Comp Precision (Singapore) Ltd., Kinpo Electronics (Philippines) Inc., XYZprinting Japan, Inc.
Vice Chairman: Cal-Comp Electronics (Thailand) Public Company Limited and PChome (Thailand) Co., Ltd.
Director: Kinpo Electronics Inc., AcBel Polytech Inc., Cal-Comp Electronics And communications Co., Ltd, Kinpo Electronics (China) Co., Ltd., Dawning Leading Technology Inc., Jipo Investment Inc.,
Kinpo Group Management Consultant Company, Ascendant Private Equity Investment Ltd., Cal-Comp Precision (Malaysia) Sdn. Bhd., Cal-Comp Precision (Thailand) Ltd. , Cal-Comp
Electronics (USA) Co., Ltd.、Cal-Comp Holding (Brasil) S.A., Cal-Comp Industria De Semicondutores S.A. , Cal-Comp USA (San Diego) Co., Ltd., Kinbolt International (Singapore) Pte. Ltd.,
Kinpo International Ltd., Power Station Holdings Ltd., XYZprinting, Inc. (U.S.A), XYZprinting, Inc. (Samoa) and XYZprinting (Thailand) Co. Ltd.
Ascendant Private Equity Investment Ltd., Cal-Comp Precision (Malaysia) Sdn. Bhd., Cal-Comp Precision (Thailand) Ltd., Cal-Comp Electronics (USA) Co., Ltd., Cal-Comp Holding (Brasil) S.A.,
Cal-Comp Industria De Semicondutores S.A., Cal-Comp USA (San Diego) Co., Ltd., Kinbolt International (Singapore) Pte. Ltd., Kinpo International Ltd., Power Station Holdings Ltd.,
XYZprinting, Inc.〈U.S.A〉, XYZprinting, Inc.〈Samoa〉, XYZprinting (Thailand) Co. Ltd.
President: Kinpo Electronics Inc., Cal-Comp Electronics And communications Co., Ltd, Kinpo Electronics (China) Co., Ltd., Cal-Comp Optical Electronics (Suzhou) Co., Ltd., Cal-Comp Technology (Suzhou) Co., Ltd., Cal-Comp Electronics and Communications (Suzhou) Co., Ltd., Avaplas Precision Plastics (Shanghai) Co., Ltd., XYZprinting (Suzhou), Co., Ltd.,Cal-Comp Electronics
(USA) Co., Ltd., Cal-Comp USA (Indiana) Co., Ltd., Cal-Comp USA (San Diego) Co., Ltd., XYZprinting, Inc.〈U.S.A〉
Director Charng-Chyi Ko
Chairman: Baotek Industrial Materials Ltd., Taiwan Biotech Co., Ltd., Chang Yao Technology Inc., Evergene Biotech Industrial Co., Ltd., Wecktech Biotech Co., Ltd., Global Biopharma, Inc., Genhealth
Pharma Co., Ltd., Taiwan Veterans Pharmaceutical Co., Ltd., Twin Luck Global Co., Ltd., Young & Health Care Resorts Inc., Yu Yuen Co., Ltd., Taiwan Venture Capital Co., Ltd., Taiwan
Venture Capital Co., Ltd., Siltek International Ltd., Taiwan Chariston Amc Co., Ltd. and Twin Luck Global Co., Ltd.
Director: All Information Co., Ltd., Sintong Animal Pharmaceutical Co., Ltd., Omnihealth Group, Inc., AIM Co., Ltd., Chipgene International Enterprise Co., Ltd., Minsheng Asset Management Co., Ltd.,
Missioncare Co., Ltd., Global Strategic Investment Inc. (Samoa), Gold Precision Ltd., KKXC Intergrated Management Holding (CYPRUS) Ltd., Medinox Inc., Optics Lab Inc. and Syn Pharm
Inc.
Supervisor: Kinpo Electronics Inc., Teleport Access Services, Inc., Cal-Comp Electronics & Communications Company Limited, Gempal Technology Corp., Panpal Technology Corp., Formosan Union
Chemical Corporation, Sunny Special Dyeing & Finishing Co., Ltd., Kenly Precision Industrial Co., Ltd., Hong Ji Capital Co., Ltd., Hong Jin Investment Co., Ltd., Zhaopal Investment Co.,
Ltd., Yongpal Investment Co., Ltd., Kaipal Investment Co., Ltd., Jipo Investment Inc., Commonwealth Magazine Co., Ltd.
President: Baotek Industrial Materials Ltd., Taiwan Biotech Co., Ltd., Siltek International Ltd.
Director Sheng-Chieh Hsu
Chairman: Integrate Investment Corp.
Director: Kinpo Electronics, Inc., Cal-Comp Electronics(Thailand) Public Company Limited, Cal-Comp Electronics And communications Co., Ltd., Cal-Comp Electronics (Suzhou) Co., Ltd., Kinpo
Electronics (China) Co., Ltd., Tung-WAN Kai-Bao Co., Ltd., Jipo Investment Inc., Kinpo International Ltd.
Director Yen-Chia Chou
Chairman: Sceptre Industry Co., Ltd.
Director: Micro Metal Electronics Co., Ltd.
Supervisor: Kinpo Electronics, Inc., Full Power Investment Co., Ltd
President: Sceptre Industry Co.,Ltd.
Director Wen-Chung Shen
Director: Arcadyan Technology Corp., Henghao Technology Co., Ltd., Compal Electronics Technology (Kunshan) Co., Ltd., Compal Optoelectronics (Kunshan) Co., Ltd., Kunshan Botai Electronics Co.,
Ltd., Arcadyan Technology (Shanghai) Corp., Gempal Technology Corp., Panpal Technology Corp., Zhibao Technology Co., Ltd., Maxima Ventures I, Inc., Hong Ji Capital Co., Ltd., Hong Jin
Investment Co., Ltd., Zhaopal Investment Co., Ltd., Yongpal Investment Co., Ltd., Kaipal Investment Co., Ltd., Amexcom Electronics, Inc., Bizcom Electronics, Inc., Compal Electronics
Europe Sp. z o.o., Compalead Electronics B.V., CENA Electromex S.A. de C.V., LC Future Center Ltd., Mexcom Electronics, LLC Mexcom Technologies, LLC
Executive Vice President: Compal Electronics Inc.
Director Yung-Ching
Chang
Chairman: Allied Circuit Co., Ltd., Kunshan Botai Electronic Services Co., Ltd.
Director: Mactech Co., Ltd., Compal Information (Kunshan) Co., Ltd., Compal Information Technology (Kunshan) Co., Ltd., Compal Digital Technology (Kunshan) Co., Ltd., Compal Electronics
(Chengdu) Co., Ltd., Compal Electronics (Chongqing) Co., Ltd., Compal Electronics (China) Co., Ltd., Compal Display Electronics (Kunshan) Co., Ltd., Compal System Trading (Kunshan)
Co., Ltd., Compal Investment (Sichuan) Co., Ltd., Compal Investment (Jiangsu) Co., Ltd., Compal Management (Chengdu) Co., Ltd., Kunshan Allied Circuit Trading Co., Ltd., Utmost Power
Holding Inc., Ubrty Capital Management Corp.,Amexcom Electronics, Inc., LC Future Center Ltd.

14
Title Name Selected Current Positions
President: Compal Electronics Technology (Kunshan) Co., Ltd., Compal Digital Technology (Kunshan) Co., Ltd., Compal Electronics (Chengdu) Co., Ltd., Compal Electronics (Chongqing) Co., Ltd.,
Compal Display Electronics (Kunshan) Co., Ltd., Compal System Trading (Kunshan) Co., Ltd., Compal Information Technology (Kunshan) Co., Ltd., Kunshan Botai Electronics Co., Ltd.,
Compal Investment (Sichuan) Co., Ltd., Compal Investment (Jiangsu) Co., Ltd., Compal Management (Chengdu) Co., Ltd.
Executive Vice President: Compal Electronics Inc.
Director Chung-Pin Wong
Chairman: Rayonnant Technology Co., Ltd., Auscom Engineering Inc., Wah Yuen Technology Holding Ltd.
Director: Arcadyan Technology Corp., Allied Circuit Co., Ltd., Henghao Technology Co., Ltd., Lead-Honor Optronics Co., Ltd., Mactech Co., Ltd., Unicom Globak, Inc., ShengBao Precision Electronics
(Taicang) Ltd., Compal Electronic Technology (Chongqing) Co., Ltd., Ripal Optoelectronics Co., Ltd., General life Biotechnology Co., Ltd., Allied Power Holding Corp., Bizcom Electronics,
Inc., Compal Connector Manufacture Ltd., Compal Europe (Poland) Sp. z o.o., Motion Computing, Inc., Primetek Enterprises Ltd., Sirqul Inc.
Supervisor: Hong Ya Technology Corporation, Kunshan Botai Electronic Services Co., Ltd.
Executive Vice President: Compal Electronics Inc.
Director Chiung-Chi Hsu Chairman: Fubao Investment Co., Ltd.
Director: Plank Optoelectronics Inc., I PAO Bearing Co., Ltd.
Director Chao-Cheng Chen
Chairman: Compal Broadband Networks Inc., Keppel Communication Pte Ltd (Nanjing) Co., Ltd., Compal Digital Communications (Nanjing) Co., Ltd., HANHELT Communications (Nanjing) Co., Ltd.,
Compal Communication (Nanjing) Inc.
Director: Ripal Optoelectronics Co., Ltd., Huang Feng Communication Co., Ltd., Mactech Co., Ltd., General life Biotechnology Co., Ltd., Kinpo Group Management Consultant Company, Speedlink
Tradings Ltd.
Executive Vice President: Compal Electronics Inc.
Independent
Director Min Chih Hsuan
Chairman: D-LINK Corporation, Taiwan Memory Corporation, Meridigen Biotech Co., Ltd., Maxima Ventures I, Inc., Maxima Ventures II, Inc.
Director: General Biologicals Corporation, SIPP Technology Corporation, Clientron Corp., Pacgen Biopharmaceuticals Corporation (Canada)
Independent Director: Wistron Corporation, Siliconware Precision Industries Co., Ltd.
Remunerate Committee members: Compal Electronics, Inc., Wistron Corporation, Siliconware Precision Industries Co., Ltd.
Audit Committee members: Compal Electronics, Inc., Wistron Corporation
Independent
Director Duei Tsai
Independent Director: TaiwanTaxi Corp.
Remunerate Committee members: Compal Electronics, Inc., Getac Technology Corporation, National Aerospace Fasteners Corp., TaiwanTaxi Corp.
Audit Committee members: Compal Electronics, Inc.
Independent
Director Duh Kung Tsai
Chairman: Powertech Technology Inc., Greatek Electronics Inc.
Director: Powertech Technology (Suzhou) Ltd., Powertech Holding (B.V.I.) Inc., Powertech Technology (Singapore) Pte., PTI Technology (Singapore) Pte. Ltd.
Independent Director: Wistron Corporation, Chicony Power Technology Co., Ltd.
Remunerate Committee members: Compal Electronics, Inc., Wistron Corporation, Chicony Power Technology Co., Ltd.
Audit Committee member: Compal Electronics, Inc., Wistron Corporation

15
Major shareholders of the Company’s corporate shareholders
Name of corporate shareholder Major shareholders of the corporate shareholder (Note)
Kinpo Electronics, Inc.
Compal Electronics, Inc. (8.51%), Jipo Investment Inc. (3.17%), Nan Shan Life Insurance Company Ltd. (2.89%), Li-Chu Tsai (2.86%), Lai-Chun Shen
Tsai (2.84%), Kun-Chao Shen (2.07%), Sheng-Hsiun Hsu (1.86%), Panpal Technology Corporation (1.59%), Hebao Investment Co., Ltd. (1.52%), KGI
Capital Asia, Standard Chartered in custody of CITIC Hong Kong accounts (1.44%)
Note: If the major shareholder is also a corporate entity, please refer to the following table.
Major shareholders of the Company’s major corporate shareholders
Name of corporate shareholder Major shareholders of corporate shareholders
Jipo Investment Inc. Kinpo Electronics Inc. (100%)
Nan Shan Life Insurance
Company Ltd.
First Commercial Bank in its Capacity as Trustee of Ruen Chen Investment Holding (76.46%), Ruen Chen Investment Holding (14.16%), Yong-Zong
Tu (3.25%), Ruen Hua Dyeing & Weaving Co., Ltd. (0.28%), Ruentex Leasing Co., Ltd. (0.15%), Jipin Investment Co., Ltd. (0.11%), Wen-De Kuo
(0.11%), Taishin Bank in its Capacity as Trustee of Nanshan Life Insurance - Equity Trust Account (0.06%), Bao Chi Investment Co., Ltd.(0.05%), Bao
Yi Investment Co., Ltd. (0.05%), Bao Hui Investment Co., Ltd. (0.05%), Bao Huang Investment Co., Ltd. (0.05%)
Panpal Technology Corporation Compal Electronics Inc. (100%)
Hebao Investment Co., Ltd. Chieh-Li Hsu (41.52%), Li-Chu Tsai (27.83%), Yong-Hsu Hsu (12.50%), Chun-Chi Hsu (12.50%), Huang-Hsin Hsu (2.83%), Yue-Hsia Huang Hsu
(1.41%), Yue-Chen Hsu (1.41%)

16
Professional qualifications and independence analysis of directors and supervisors
Note: Tick the corresponding boxes that apply to the directors or supervisors during the two years prior to being elected or during the term of office.
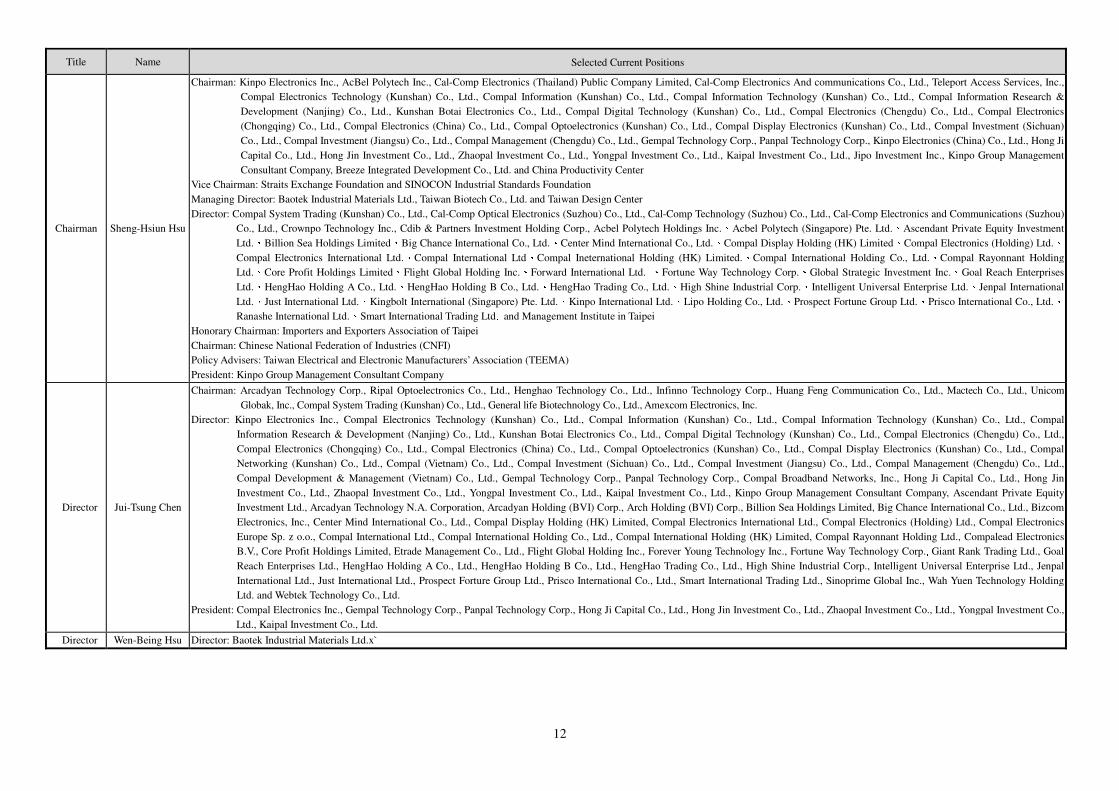
1. Not an employee of the Company or any of its affiliates.
2. Not a director or supervisor of the Company or any of its affiliates. Not applicable in cases where the person is an independent director of the Company, its
Criteria Name
Having Met One of the Following Professional Qualifications, Together with at Least Five Years Work Experience
Independence Criteria (Note)
Number of Other Public Companies
in Which the Individual is Concurrently Serving as an Independent
Director
An Instructor or Higher Position in a Department of Commerce, Law, Finance, Accounting, or Other Academic Department Related to the Business Needs of the Company in a Public or Private Junior College, College or University
A Judge, Public Prosecutor, Attorney, Certified Public Accountant, or Other Professional or Technical Specialist Who has Passed a National Examination and been Awarded a Certificate in a Profession Necessary for the Business of the Company
Having Work Experience in the Areas of Commerce, Law, Finance, or Accounting, or Otherwise Necessary for the Business of the Company
1 2 3 4 5 6 7 8 9 10
Sheng-Hsiun Hsu � � � � � 0
Jui-Tsung Chen � � � � � � 0
Wen-Being Hsu � � � � � � � � � � 0
Kinpo Electronics
Inc.
Representative:
Shyh-Yong Shen
� � � � 0
Charng-Chyi Ko � � � � � � � � � 0
Sheng-Chieh Hsu � � � � � � 0
Yen-Chia Chou � � � � � � � � 0
Wen-Chung Shen � � � � � � � � 0
Yung-Ching Chang � � � � � � � � 0
Chung-Pin Wong � � � � � � � � 0
Chiung-Chi Hsu � � � � � � � � � � 0
Chao-Cheng Chen � � � � � � � � 0
Min Chih Hsuan � � � � � � � � � � � 2
Duei Tsai � � � � � � � � � � � � 1
Duh Kung Tsai � � � � � � � � � � � 2
17
parent company, or any subsidiary in which the Company holds, directly or indirectly, more than 50% of the voting shares.
3. Not a natural-person shareholder who holds shares, together with those held by the person’s spouse, minor children, or held by the person under others’
names, in an aggregate amount of 1% or more of the total number of outstanding shares of the Company or ranking in the top 10 in holdings.
4. Not a spouse, relative within the second degree of kinship, or lineal relative within the third degree of kinship, of any of the persons in the preceding three
subparagraphs.
5. Not a director, supervisor, or employee of a corporate shareholder who directly holds 5% or more of the total number of outstanding shares of the
Company or who holds shares ranking in the top five holdings.
6. Not a director, supervisor, officer, or shareholder holding 5% or more of the shares, of a specified company or institution which has a financial or business
relationship with the Company.
7. Not a professional individual who is an owner, partner, director, supervisor, or officer of a sole proprietorship, partnership, company, or institution that
provides commercial, legal, financial, accounting services or consultation to the Company or to any affiliate of the Company, or a spouse thereof.
8. Not having a marital relationship, or a relative within the second degree of kinship to any other director of the Company.
9. Not a person of any conditions defined in Article 30 of the Company Act.
10. Not a governmental, juridical person or its representative as defined in Article 27 of the Company Act.

18
3.2.2 Management Team
April 26, 2016
Title
Name/Nation
ality
(Note 1)
Date
elected/
appointed
Shares held Shares held by spouse and
underage children Shares held by proxy
Major career (academic) achievements
Selected Current
Positions held
concurrently in the
company and/or
any other
companyitions
Spouse or relatives of second degree or closer
acting as managers
Shares
Shareholdi
ng
Percentage
(%)
Shares
Shareholdi
ng
Percentage
(%)
Shares
Shareholdin
g Percentage
(%)
Title Name Relationship
President Jui-Tsung
Chen 1989.06.01 50,782,587 1.14% 2,092,405 0.05% 0 0.00%
Department of Electrical Engineering, National Cheng
Kung University
Chairman of Compal Communication Inc. & Arcadyan
Technology Corp.
Refer to Page
12-14 Vice President
Bo-Tang
Wang
Relative by
affinity
Executive Vice
President
Wen-Chung
Shen 2002.01.01 11,935,968 0.27% 101,931 0.00% 0 0.00%
Department of Electrical Engineering, National
Taiwan University
Director of Arcadyan Technology Corp.
Refer to Page
12-14 N/A N/A N/A
Executive Vice
President
Yung-Ching
Chang 2003.01.01 3,727,587 0.08% 7,259 0.00% 0 0.00%
Master’s Defree in Graduate school of
Management, Yuan Ze University
Director and President of Toppoly Optoelectronics Corp.
Refer to Page
12-14 N/A N/A N/A
Executive Vice
President
Chung-Pin
Wong 2007.04.01 4,833,618 0.11% 1,398 0.00% 0 0.00%
Graduate Institute of Management Science, National
Chiao Tung University
Chairman of Rayonnant Technology Co., Ltd.
Refer to Page
12-14 N/A N/A N/A
Executive Vice
President
Chen-Chang
Hsu 2011.08.31 0 0.00% 0 0.00% 0 0.00%
National Chiao Tung University EMBA
Executive Vice President of WINTEK Corporation (Note 3) N/A N/A N/A
Executive Vice
President
Chao-Cheng
Chen 2014.02.27 3,000,000 0.07% 1,428 0.00% 0 0.00%
Graduate Institute of Electrical Engineering, National
Taiwan University
President of Compal Communication Inc.
Refer to Page
12-14 N/A N/A N/A
Senior Vice
President
Chun-De
Shen 2007.01.01 2,218,700 0.05% 900,000 0.02% 0 0.00%
Graduate Institute of Electrical Engineering, National
Taiwan University
Director of Kinpo Electronics Inc.
(Note 3) N/A N/A N/A
Senior Vice
President
Kuo-Chuan
Chen 2007.01.01 955,823 0.02% 82,924 0.00% 0 0.00%
Department of Physics, Chung Yuan Christian
University
Senior Vice President of Compal Communication Inc.
N/A N/A N/A N/A
Senior Vice
President
Pei-Yuan
Chen 2009.10.06 4,487,698 0.10% 1,045,585 0.02% 0 0.00%
Department of International Trade, Hsingwu
College
Director of Kinpo Electronics Inc.
(Note 3) N/A N/A N/A
Senior Vice
President Chiu-Rui Wei 2010.03.18 113,764 0.00% 142,966 0.00% 0 0.00%
Master of Business Administration, University of
Washington, USA
Senior Vice President of Toppoly Optoelectronics
Corp.
(Note 3) N/A N/A N/A
Senior Vice
President Ying Chang 2011.2.24 0 0.00% 0 0.00% 0 0.00%
MBA, University Of Georgia
President of Swenc Technology Co., Ltd. N/A N/A N/A N/A

19
Title
Name/Nation
ality
(Note 1)
Date
elected/
appointed
Shares held Shares held by spouse and
underage children Shares held by proxy
Major career (academic) achievements
Selected Current
Positions held
concurrently in the
company and/or
any other
companyitions
Spouse or relatives of second degree or closer
acting as managers
Shares
Shareholdi
ng
Percentage
(%)
Shares
Shareholdi
ng
Percentage
(%)
Shares
Shareholdin
g Percentage
(%)
Title Name Relationship
Senior Vice
President
Ming-Hsing
Hsu 2011.8.01 558,392 0.01% 0 0.00% 0 0.00%
Department of Engineering, Chung Yuan Christian
University
President of Compal Information (Kunshan) Co., Ltd.
(Note 3) N/A N/A N/A
Senior Vice
President
Sheng-Hua
Peng 2014.02.27 100,000 0.00% 0 0.00% 0 0.00%
Graduate Institute of Electrical Engineering, National
Taiwan University
Senior Vice President of Compal Communication Inc.
(Note 3) N/A N/A N/A
Senior Vice
President Wen-Da Hsu 2014.02.27 773,000 0.02% 0 0.00% 0 0.00%
Department of Media Administration, Shih Hsin
University
Senior Vice President of Compal Communication Inc.
(Note 3) N/A N/A N/A
Senior Vice
President
Wei-Cheng
Chen 2004.04.01 390,656 0.01% 0 0.00% 0 0.00%
Department of Electronic Engineering, Taipei College
of Maritime Technology
Vice President of Cheong Tat Technology
N/A N/A N/A N/A
Senior Vice
President
Ming-Chih
Chang 2016.02.24 1,919,489 0.04% 0 0.00% 0 0.00%
Department of Electrical Engineering, Ming Chi
University of Technology
LCFC (Hong Kong) Co., Ltd.
President
N/A N/A N/A N/A
Vice President Chih-Chuan
Cheng 2003.01.01 1,683,786 0.04% 51,194 0.00% 0 0.00%
Department of Electronic Engineering, Lunghwa
University of Science and Technology
Deputy Manager of Research and Development, Top
Information Technologies Co., Ltd.
N/A N/A N/A N/A
Vice President
and head of
finance
Ching-Hsiun
g Lu 2003.01.01 8,642,007 0.19% 0 0.00% 0 0.00%
Department of Accounting, Feng Chia University
Director Compal Communication Inc. (Note 3) N/A N/A N/A
Vice President Shih-Tung
Wang 2003.01.01 10,197 0.00% 0 0.00% 0 0.00%
Graduate Institute of Electrical Engineering, San Jose
State University
Vice President of KC Technology Inc.
N/A N/A N/A N/A
Vice President Bo-Hsiung
Chang 2006.02.21 0 0.00% 270 0.00% 0 0.00%
Department of Electrical Engineering, National Taipei
Institute of Technology (Note 3) N/A N/A N/A
Vice President Tian-Yuan
Tsai 2006.06.28 712,715 0.02% 0 0.00% 0 0.00%
Graduate Institute of Public Finance, National
Chengchi University
Accountant of KPMG
(Note 3) N/A N/A N/A
Vice President Bo-Tang
Wang 2007.07.10 239,548 0.01% 486 0.00% 0 0.00%
Department of Computer Science and Information
Engineering, National Taiwan University
President of Vibo Telecom Inc.
N/A President Jui-Tsung
Chen Relative by affinity

20
Title
Name/Nation
ality
(Note 1)
Date
elected/
appointed
Shares held Shares held by spouse and
underage children Shares held by proxy
Major career (academic) achievements
Selected Current
Positions held
concurrently in the
company and/or
any other
companyitions
Spouse or relatives of second degree or closer
acting as managers
Shares
Shareholdi
ng
Percentage
(%)
Shares
Shareholdi
ng
Percentage
(%)
Shares
Shareholdin
g Percentage
(%)
Title Name Relationship
Vice President Hsi-Kuan
Chen 2009.05.01 0 0.00% 0 0.00% 0 0.00%
Master of Industrial Design, Cranbrook Academy of
Art
Director of Design and Customer Affairs, Philips
(Hong Kong)
(Note 3) N/A N/A N/A
Vice President Zong-Ming
Wang 2009.07.16 148,184 0.00% 0 0.00% 0 0.00%
National Taipei Institute of Technology
Head of Research and Development, CLEVO
Company
N/A N/A N/A N/A
Vice President Fu-Chuan
Chang 2009.07.16 134,662 0.00% 0 0.00% 0 0.00%
National Chin-Yi University of Technology
Production Manager, ADI Corp (Note 3) N/A N/A N/A
Vice President Chi-Hsiang
Ma 2011.01.01 52,624 0.00% 0 0.00% 0 0.00%
Department of Business Administration, Fu Jen
Catholic University
Product Manager, MiTAC International Corporation
N/A N/A N/A N/A
Vice President Yung-Nan
Chang 2011.01.01 0 0.00% 0 0.00% 0 0.00%
MBA, Pacific Western University
Factory Manager, Delta Electronics Inc. N/A N/A N/A N/A
Vice President Sheng-Hung
Li 2011.07.01 84,574 0.00% 0 0.00% 0 0.00%
Department of Electronics, National Taipei University
of Science & Technology N/A N/A N/A N/A
Vice President Yung-He Su 2011.07.01 120,401 0.00% 0 0.00% 0 0.00%
Department of Electrical Engineering, National Taipei
Institute of Technology
Vice President of Arima Photovoltaic & Optical Corp.
N/A N/A N/A N/A
Vice President Ming-Hsiang
Kan 2011.08.31 0 0.00% 0 0.00% 0 0.00%
University of Leicester (U.K.) MBA
Vice President of NB R&D, Flextronics International
(Taiwan) Ltd.
N/A N/A N/A N/A
Vice President Chih-Hsien
Liang 2011.10.31 0 0.00% 0 0.00% 0 0.00%
University of Colorado
Postgraduate Institute of Digital Communication/Vice
President of Wireless Communication, Altek
Corporation
N/A N/A N/A N/A
Vice President Lung-Hua
Shen 2012.08.29 0 0.00% 0 0.00% 0 0.00%
Department of Civil Engineering, Tamkang
University
Vice President of Procurement, ASUS Ltd.
N/A N/A N/A N/A
Vice President Ming-Dong
Weng 2013.01.31 63,786 0.00% 0 0.00% 0 0.00%
Master of Business Administration, University of
Washington, USA
Deputy Manager of Sales, Kapok Computer
Company
N/A N/A N/A N/A
Vice President Yue-Chun Li 2014.02.17 0 0.00% 0 0.00% 0 0.00% Department of Electronic Engineering, Lee-Ming
Institute of Technology N/A N/A N/A N/A

21
Title
Name/Nation
ality
(Note 1)
Date
elected/
appointed
Shares held Shares held by spouse and
underage children Shares held by proxy
Major career (academic) achievements
Selected Current
Positions held
concurrently in the
company and/or
any other
companyitions
Spouse or relatives of second degree or closer
acting as managers
Shares
Shareholdi
ng
Percentage
(%)
Shares
Shareholdi
ng
Percentage
(%)
Shares
Shareholdin
g Percentage
(%)
Title Name Relationship
Chairman’s Special Assistant, Mag Technology Co.,
Ltd.
Vice President Chiao-Lieh
Huang 2014.02.27 23,992 0.00% 0 0.00% 0 0.00%
Graduate Institute of Electrical Engineering, National
Taiwan University
Vice President of Compal Communication Inc.
(Note 3) N/A N/A N/A
Vice President Chung-Hsing
Tan 2014.02.27 120,529 0.00% 5,320 0.00% 0 0.00%
Department of Electrical Engineering, Tatung
University
Vice President of Compal Communication Inc.
N/A N/A N/A N/A
Vice President Yi-Yun
Chang 2014.08.13 110,246 0.00% 0 0.00% 0 0.00%
Graduate Institute of Electrical Engineering, National
Taiwan University
Senior Manager of Compal Communication Inc.
N/A N/A N/A N/A
Vice President Hsin-Kung
Mao 2014.11.13 714 0.00% 0 0.00% 0 0.00%
Master of Business Administration, University of
Lincoln
Head of Business, Display BU
(Note 3) N/A N/A N/A
Vice President Ling-Sheng
Wu 2015.1.22 265,000 0.01% 0 0.00% 0 0.00%
Graduate Institute of Electrical Engineering,
University of Southern California; Senior Manager of
Compal Communication Inc.
N/A N/A N/A N/A
Vice President Hsin-Hsiung
Huang 2015.1.22 139,001 0.00% 0 0.00% 0 0.00%
Department of Electronics, Chung Yuan Christian
University
Senior Manager of Compal Communication Inc.
N/A N/A N/A N/A
Vice President Shih-Hung
Huang 2016.02.24 0 0.00% 0 0.00% 0 0.00%
Master in Control Engineering, National Chiao Tung
University
Director - Coretronic Corporation
N/A N/A N/A N/A
Vice President Yi-Chiang
Chiu 2016.02.24 0 0.00% 0 0.00% 0 0.00% Master in Erath Sciences, National Central University N/A N/A N/A N/A
Vice President Ching-Fa Li 2016.02.24 40,690 0.00% 0 0.00% 0 0.00%
Information Engineering Ph.D., National Tsing Hua
University
Vice President – Eten Technology Inc.
N/A N/A N/A N/A
Vice President Bo-Heng
Chen 2016.02.24 10 0.00% 0 0.00% 0 0.00%
COLUMBIA UNIVERSITY
Master of Industrial Engineering and Operations
Management
N/A N/A N/A N/A
Vice President Jui-Chun Hsu 2016.5.11 0 0.00% 0 0.00% 0 0.00%
PhD, Graduate Institute of Electrical Engineering,
National Taiwan University
Photonics Industries International, Inc.
President
N/A N/A N/A N/A

22
Title
Name/Nation
ality
(Note 1)
Date
elected/
appointed
Shares held Shares held by spouse and
underage children Shares held by proxy
Major career (academic) achievements
Selected Current
Positions held
concurrently in the
company and/or
any other
companyitions
Spouse or relatives of second degree or closer
acting as managers
Shares
Shareholdi
ng
Percentage
(%)
Shares
Shareholdi
ng
Percentage
(%)
Shares
Shareholdin
g Percentage
(%)
Title Name Relationship
Head of Audit Bo-Wen
Hsieh 2010.10.27 0 0.00% 0 0.00% 0 0.00%
Department of Accounting, National Taiwan
University
Audit Manager, KGT Telecom
N/A N/A N/A N/A
Note: 1. All managers are ROC nationals. 2. Senior Advisor Medica, John Kevin, and Vice Presidents, Ming-Sung Lin, and Meng-Hsiung Nieh resigned in 2015. Chin-Wen Liao, Vice President resigned in 2016. 3. Concurrent positions in other companies
Title Name Concurrent duties in the company and in other companies
Executive Vice
President Chen-Chang Hsu
Chairman: Henghao Technology (Kunshan) Co., Ltd., Lucom Display Technology (Kunshan) Ltd.
Vice Chairman: Henghao Technology Co., Ltd.,Chenfeng Optronics Corporation
Director: Mactech Co., Ltd.
Vice Chairman: Henghao Technology Co., Ltd., Henghao Technology (Kunshan) Co., Ltd., Lucom Display Technology (Kunshan) Ltd.
Senior Vice
President Chun-De Shen
Director: Kinpo Electronics Inc., Arcadyan Technology Corp., Allied Circuit Co., Ltd., Compal Information Research & Development (Nanjing) Co., Ltd., Changchun Jing Yu Electronic Technology
Co., Ltd., Auscom Engineering Inc.
President: Compal Information Research & Development (Nanjing) Co., Ltd.
Senior Vice
President Pei-Yuan Chen Director: Kinpo Electronics Inc., Infinno Technology Corporation, Fubao Investment Co., Ltd.
Senior Vice
President Chiu-Rui Wei
Director: Chipbond Technology Corporation, Taiwan Star Telecom Corporation Limited, Rayonnant Technology (HK) Holdings Limited, Zhengying Electronics (Chongqing) Co., Ltd., Suyin
Optronics Corp., Compal Precision Module (Jiangsu) Co., Maxima Ventures I, INC., HWA VI Venture Capital Corp., Hwa Chi Venture Capital Corp., LC Future Center Ltd
Supervisor: Henghao Technology Co., Ltd., Infinno Technology Corporation, Rayonnant Technology Co., Ltd., Ripal Optoelectronics Co., Ltd., Mactech Co., Ltd., Unicom Globak, Inc., Rayonnant
Technology (Taicang) Co., Ltd., General life Biotechnology Co., Ltd,
Remunerate Committee member: Synergy Scientech Corp.
Senior Vice
President Ming-Hsing Hsu
Director: Kunshan Botai Electronic Services Co., Ltd.
President: Compal Information (Kunshan) Co., Ltd., Kunshan Botai Electronic Services Co., Ltd.
Senior Vice
President Sheng-Hua Peng
Director: Huang Feng Communication Co., Ltd., Keppel Communication Pte Ltd (Nanjing), Compal Digital Communications (Nanjing) Co., Ltd., HANHELT Communications (Nanjing) Co., Ltd.,
Compal Communication (Nanjing) Inc.
Senior Vice
President Wen-Da Hsu Director: HANHELT Communications (Nanjing) Co., Ltd.
Vice President
and head of
finance
Ching-Hsiung Lu
Director: Zhibao Technology Co., Ltd., Arcadyan Technology (Shanghai) Corp., Keppel Communication Pte Ltd (Nanjing), Compal Digital Communications (Nanjing) Co., Ltd., Compal
Communication (Nanjing) Co., Ltd., Kunshan Botai Electronic Services Co., Ltd., Great Arch Group Ltd., Leading Images Limited
Supervisor: Compal Broadband Networks Inc., Accesstek Inc., Compal Electronics Technology (Kunshan) Co., Ltd., Compal Information (Kunshan) Co., Ltd., Compal Information Technology
(Kunshan) Co. Ltd., Compal Electronics (China) Co., Ltd., Compal Digital Technology (Kunshan) Co., Ltd., Compal Electronics (Chengdu) Co., Ltd., Compal Electronics, (Chongqing)
Co., Ltd., Compal Optoelectronics (Kunshan) Co., Ltd., Compal Display Electronics (Kunshan) Co. Ltd., Compal Networking (Kunshan) Co., Ltd., Kunshan Botai Electronic Services
Co., Ltd., Compal Investment (Sichuan) Co., Ltd., Compal Investment (Jiangsu) Co., Ltd., Compal Business Management (Chengdu) Co., Ltd.

23
Title Name Concurrent duties in the company and in other companies
Vice President Bo-Hsiung Chang Director: Unicom Globak, Inc., Avalue Technology Inc.
Vice President Tian-Yuan Tsai
Chairman: Crownpo Technology Inc.
Managing Director: LIZ Electronics (Kunshan) Co., Ltd., LIZ Electronics (Nantong) Co., Ltd.
President: Crownpo Technology Inc.
Remunerate Committee member: Sanyang Motor Co., Ltd.
Vice President Hsi-Kuan Chen Director: Rayonnant Technology Holdings Ltd., Rayonnant Technology (Taicang) Co., Ltd.
Vice President Fu-Chuan Chang President: Compal Optoelectronics (Kunshan) Co., Ltd., Compal Electronics (China) Co., Ltd.
Vice President Chiao-Lieh Huang Supervisor: HANHELT Communications (Nanjing) Co., Ltd.
Vice President Hsin-Kung Mao President: Compal Electronics Europe Sp. z o.o.

24
3.2.3 Remuneration of Directors, Supervisors, President, and Vice Presidents
Remuneration of Directors Unit: NTD thousand; thousand shares; %
Title Name
Directors’ remuneration The sum of A, B, C and D as a percentage of after-tax
profit
Remuneration as an employee
The sum of A, B, C, D, E, F, and G as a percentage of after-tax profit
Remuneration from invested businesses
other than the subsidiaries (J)
Remuneration (A) Pension (B) Remuneration from
earnings appropriation (C)Fees for services
rendered (D) Salaries, bonuses, special
allowances etc (E) Pension (F) Share of profit as an employee (G)
Total shares exercisable through employee
warrants (H)
Number of new restricted shares acquired as an employee (I)
The Company
All companies included
in the financial
statements
The Company
All companies included in
the financial
statements
The Company
All companies included in
the financial statements
The Company
All companies included in
the financial
statements
The Company
All companies included in
the financial statements
The Company
All companies included in the financial statements
The Company
All companies included in
the financial statements
The Company All companies included in
the financial statements The
Company
All companies included in the financial statements
The Company
All companies included in the
financial statements
The Company
All companies included in the
financial statements Cash Stock Cash Stock
Chairman Sheng-Hsiun
Hsu
Director Jui-Tsung
Chen
Director Wen-Being
Hsu
Director
Representative
of Kinpo
Electronics
Inc.:
Shyh-Yong
Shen 4,320 4,320 0 0 50,234 50,234 2,699 3,359 0.66% 0.67% 154,474 155,006 651 651 19,902 0 19,902 0 0 0 7,650 7,650 2.67% 2.69% 66,785
Director Charng-Chyi
Ko
Director Sheng-Chieh
Hsu
Director Yen-Chia
Chou
Director Wen-Chung
Shen
Director Yung-Ching
Chang
Director Chung-Pin
Wong
Director Chiung-Chi
Hsu
Director Chao-Cheng
Chen
Independent
Director
Min Chih
Hsuan
Independent
Director Duei Tsai

25
Title Name
Directors’ remuneration The sum of A, B, C and D as a percentage of after-tax
profit
Remuneration as an employee
The sum of A, B, C, D, E, F, and G as a percentage of after-tax profit
Remuneration from invested businesses
other than the subsidiaries (J)
Remuneration (A) Pension (B) Remuneration from
earnings appropriation (C)Fees for services
rendered (D) Salaries, bonuses, special
allowances etc (E) Pension (F) Share of profit as an employee (G)
Total shares exercisable through employee
warrants (H)
Number of new restricted shares acquired as an employee (I)
The Company
All companies included
in the financial
statements
The Company
All companies included in
the financial
statements
The Company
All companies included in
the financial statements
The Company
All companies included in
the financial
statements
The Company
All companies included in
the financial statements
The Company
All companies included in the financial statements
The Company
All companies included in
the financial statements
The Company All companies included in
the financial statements The
Company
All companies included in the financial statements
The Company
All companies included in the
financial statements
The Company
All companies included in the
financial statements Cash Stock Cash Stock
Independent
Director
Duh Kung
Tsai
Vice
Chairman
Medica, John
Kevin
Director Sean Martin
Maloney
Note: 1. The previous supervisors, Charng-Chyi Ko, Sheng-Chieh Hsu, and Yen-Chia Chou resigned as of June 26, 2015 and were elected as directors in 2015 shareholders meeting. The directors, Medica, John Kevin and Sean Martin Maloney were resigned as of June 26, 2015.
2. In 2015, the Company made pension contributions totaling NTD 651,000 (including NTD 216,000 under the new system and NTD 435,000 under the old system) for directors who also assumed managerial roles as employees; meanwhile, all companies reported in the financial statements had made pension contributions totaling NTD 651,000 (including NTD 216,000 under the new system and NTD 435,000 under the old system) for directors who also assumed managerial roles as employees.
3. Directors’ compensation refers to the estimated directors’ compensation approved by Board of Directors meeting on March 30, 2016.
Range of Remuneration
Number of Directors
Total of (A+B+C+D) Total of (A+B+C+D+E+F+G+J)
The Company Companies in the
consolidated financial statements
The Company Companies in the
consolidated financial statements
Under NT$ 2,000,000 6 (Note 1) 6 (Note 4) 6 (Note 7) 5 (Note 12)
NT$2,000,000 ~ NT$5,000,000 8 (Note 2) 8 (Note 5) 4 (Note 8) 2 (Note 13)
NT$5,000,000 ~ NT$10,000,000 4 (Note 3) 4 (Note 6) 3 (Note 9) 4 (Note 14)
NT$10,000,000 ~ NT$15,000,000
NT$15,000,000 ~ NT$30,000,000 1 (Note 10) 1 (Note 15)
NT$30,000,000~ NT$50,000,000 4 (Note 11) 5 (Note 16)
NT$50,000,000 ~ NT$100,000,000 1 (Note 17)
Over NT$100,000,000
Total 18 18 18 18
Note: 1. Min Chih Hsuan, Duei Tsai, Duh Kung Tsai, Shyh-Yong Shen, Medica, John Kevin, Sean Martin Maloney 2. Sheng-Chieh Hsu, Yen-Chia Chou, Wen-Chung Shen, Yung-Ching Chang, Chung-Pin Wong, Chiung-Chi Hsu, Chao-Cheng Chen, Kinpo Electronics Inc. 3. Sheng-Hsiun Hsu, Jui-Tsung Chen, Wen-Being Hsu, Charng-Chyi Ko 4. Min Chih Hsuan, Duei Tsai, Duh Kung Tsai, Shyh-Yong Shen, Medica, John Kevin, Sean Martin Maloney 5. Sheng-Chieh Hsu, Yen-Chia Chou, Wen-Chung Shen, Yung-Ching Chang, Chung-Pin Wong, Chiung-Chi Hsu, Chao-Cheng Chen, Kinpo Electronics Inc.
26
6. Sheng-Hsiun Hsu, Jui-Tsung Chen, Wen-Being Hsu, Charng-Chyi Ko 7. Min Chih Hsuan, Duei Tsai, Duh Kung Tsai, Shyh-Yong Shen, Medica, John Kevin, Sean Martin Maloney 8. Sheng-Chieh Hsu, Yen-Chia Chou, Chiung-Chi Hsu, Kinpo Electronics Inc. 9. Sheng-Hsiun Hsu, Wen-Being Hsu, Charng-Chyi Ko 10. Wen-Chung Shen 11. Jui-Tsung Chen, Yung-Ching Chang, Chung-Pin Wong, Chao-Cheng Chen 12. Min Chih Hsuan, Duei Tsai, Duh Kung Tsai, Medica, John Kevin, Sean Martin Maloney 13. Chiung-Chi Hsu, Kinpo Electronics Inc. 14. Wen-Being Hsu, Charng-Chyi Ko, Sheng-Chieh Hsu, Yen-Chia Chou 15. Wen-Chung Shen 16. Sheng-Hsiun Hsu, Yung-Ching Chang, Chung-Pin Wong, Chao-Cheng Chen, Shyh-Yong Shen 17. Jui-Tsung Chen

27
Remuneration of Supervisors Unit: NTD thousand; thousand shares; %
Title Name
Supervisors’ remuneration Sum of A, B and C as a percentage of after-tax
profit (%)
Remuneration from invested businesses
other than the subsidiaries (D)
Remuneration (A) Share of profit (B) Fees for services rendered (C)
The
Company
All
companies
included in
the financial
statements
The
Company
All
companies
included in
the financial
statements
The
Company
All companies
included in the
financial
statements
The
Company
All companies
included in the
financial
statements
Supervisor Charng-Chyi
Ko
Supervisor Yen-Chia
Chou 0 0 0 0 238 238 0.00% 0.00% 0
Supervisor Sheng-Chieh
Hsu
Note: 1. The Company elected three independent directors and replace supervisors with an Audit Committee during 2015 shareholders’ meeting. The previous supervisors, Charng-Chyi Ko,
Sheng-Chieh Hsu, and Yen-Chia Chou resigned as of June 26, 2015.
2. There was no retirement pension paid or appropriated to supervisors in 2015.

28
Range of Remuneration
Number of Supervisors
Total of (A+B+C) Total of (A+B+C+D)
The Company Companies in the consolidated
financial statements
Under NT$ 2,000,000 3 (Note 1) 3 (Note 2)
NT$2,000,000 ~ NT$5,000,000
NT$5,000,000 ~ NT$10,000,000
NT$10,000,000 ~ NT$15,000,000
NT$15,000,000 ~ NT$30,000,000
NT$30,000,000 ~ NT$50,000,000
NT$50,000,000 ~ NT$100,000,000
Over NT$100,000,000
Total 3 3
Note: 1. Charng-Chyi Ko, Yen-Chia Chou, Sheng-Chieh Hsu
2. Charng-Chyi Ko, Yen-Chia Chou, Sheng-Chieh Hsu

29
Remuneration of the President and Vice Presidents Unit: NTD thousand; thousand shares; %
Title Name
Salary (A) Pension (B)
special allowances (C) Share of profit as an employee (D)
Sum of A, B, C and D as a percentage of after-tax
profit (%)
Employee warrants received
Number of new restricted shares acquired as an employee
Remuneration from invested
businesses other than the
subsidiaries (E) The
Company
All companies included
in the financial
statements
The Company
All companies included
in the financial
statements
The Company
All companies included
in the financial
statements
The Company
All companies included in the
financial statements
The Company
All companies included in
the financial statements
The Company
All companies included in
the financial statements
The Company
All companies included in the
financial statements
Cash Stock Cash Stock
49 employees
including
President
Jui-Tsung
Chen (Note
1)
115,722 119,992 5,510 5,510 443,964 444,389 76,125 0 76,125 0 7.38% 7.44% 0 0 26,500 26,500 4,871
Note: 1.Managers’ titles and names
‧President: Jui-Tsung Chen - 1 position
‧Executive Vice Presidents: Wen-Chung Shen, Yung-Ching Chang, Chung-Pin Wong, Chen-Chang Hsu, Chao-Cheng Chen - 5 position
‧Senior Vice Presidents: Chun-De Shen, Pei-Yuan Chen, Chiu-Rui Wei, Ying Chang, Ming-Hsing Hsu, Kuo-Chuan Chen, Sheng-Hua Peng, Wen-Da Hsu,
Wei-Cheng Chen, Ming-Chih Chang - 10 positions
‧Vice Presidents: Chih-Chuan Cheng, Ching-Hsiung Lu, Shih-Tung Wang, Bo-Hsiung Chang, Tian-Yuan Tsai, Bo-Tang Wang, Hsi-Kuan Chen, Zong-Ming Wang,
Fu-Chuan Chang, Chi-Hsiang Ma, Yung-Nan Chang, Sheng-Hung Li, Yung-He Su, Ming-Hsiang Kan, Chih-Hsien Liang, Lung-Hua Shen, Ming-Dong Weng, Yue-Chun Li, Chiao-Lieh Huang, Chung-Hsing Tan, Yi-Yun Chang, Hsin-Kung Mao, Ling-Sheng Wu, Hsin-Hsiung Huang, Shih-Hung Huang, Yi-Chiang Chiu, Ching-Fa Li, Bo-Heng Chen, Jui-Chun Hsu, Ming-Sung Lin, Meng-Hsiung Nieh, Chin-Wen Liao - 32 positions
‧Senior Advisor: Medica, John Kevin - 1 position
2. Senior Advisor, Medica, John Kevin, and Vice Presidents Ming-Sung Lin, Meng-Hsiung Nieh had resigned in 2015. In 2016, Ming-Chih Chang, Senior Vice President,
Shih-Hung Huang, Vice President, Yi-Chiang Chiu, Vice President, Ching-Fa Li, Vice President, and Bo-Heng Chen, Vice President were either transferred back or
promoted. Jui-Chun Hsu, Vice President, took office; while Chin-Wen Liao, Vice President resigened.
3. No pension benefit was paid in 2015. In the meantime, the Company made pension contributions totaling NTD 5,510,000 (including NTD 3,843,000 under the new system and NTD 1,667,000 under the old system), while all companies reported in the financial statements made pension contributions totaling NTD 5,510,000 (including NTD 3,843,000 under the new system and NTD 1,667,000 under the old system).
4. Employees’ compensation appropriation was approved by Board of Directors on meeting on March 30, 2016. The compensations of aforementioned managers were not
yet final and will be reviewed based on the list of the date of distribution.

30
Range of Remuneration
Number of President and Vice Presidents
Total of (A+B+C+D) Total of (A+B+C+D+E)
The Company Companies in the consolidated
financial statements
Under NT$ 2,000,000 3 (Note 1) 3 (Note 7)
NT$2,000,000 ~ NT$5,000,000 10 (Note 2) 7 (Note 8)
NT$5,000,000 ~ NT$10,000,000 7 (Note 3) 7 (Note 9)
NT$10,000,000 ~ NT$15,000,000 18 (Note 4) 20 (Note 10)
NT$15,000,000 ~ NT$30,000,000 7 (Note 5) 8 (Note 11)
NT$30,000,000 ~ NT$50,000,000 4 (Note 6) 4 (Note 12)
NT$50,000,000 ~ NT$100,000,000
Over NT$100,000,000
Total 49 49
Note: 1. Ming-Chih Chang, Jui-Chun Hsu, Medica, John Kevin - 3 positions 2. Pei-Yuan Chen, Tian-Yuan Tsai, Fu-Chuan Chang, Chi-Hsiang Ma, Shih-Hung Huang, Yi-Chiang Chiu, Ching-Fa Li, Bo-Heng Chen, Ming-Sung Lin, Meng-Hsiung
Nieh - 10 positions 3. Shih-Tung Wang, Yung-Nan Chang, Sheng-Hung Li, Ming-Hsiang Kan, Chih-Hsien Liang, Ling-Sheng Wu, Hsin-Hsiung Huang - 7 positions 4. Wen-Chung Shen, Chiu-Rui Wei, Ming-Hsing Hsu, Wei-Cheng Chen, Chih-Chuan Cheng, Gary Lu, Bo-Hsiung Chang, Bo-Tang Wang, Hsi-Kuan Chen, Zong-Ming
Wang, Yung-He Su, Lung-Hua Shen, Ming-Dong Weng, Yue-Chun Li, Chiao-Lieh Huang, Yi-Yun Chang, Hsin-Kung Mao, Chin-Wen Liao - 18 positions 5. Chen-Chang Hsu, Chun-De Shen, Ying Chang, Kuo-Chuan Chen, Sheng-Hua Peng, Wen-Da Hsu, Chung-Hsing Tan - 7 positions 6. Jui-Tsung Chen, Yung-Ching Chang, Chung-Pin Wong, Chao-Cheng Chen - 4 positions 7. Ming-Chih Chang, Jui-Chun Hsu, Midica, John Kevin - 3 positions 8. Chi-Hsiang Ma, Shih-Hung Huang, Yi-Chiang Chiu, Ching-Fa Li, Bo-Heng Chen, Ming-Sung Lin, Meng-Hsiung Nieh - 7 positions 9. Pei-Yuan Chen, Shih-Tung Wang, Tian-Yuan Tsai, Fu-Chuan Chang, Sheng-Hung Li, Ming-Hsiang Kan, Chih-Hsien Liang - 7 positions 10. Wen-Chung Shen, Chiu-Rui Wei, Wei-Cheng Chen, Chih-Chuan Cheng, Ching-Hsiung Lu, Bo-Hsiung Chang, Bo-Tang Wang, Hsi-Kuan Chen, Zong-Ming Wang,
Yung-Nan Chang, Yung-He Su, Lung-Hua Shen, Ming-Dong Weng, Yue-Chun Li, Chiao-Lieh Huang, Yi-Yun Chang, Hsin-Kung Mao, Ling-Sheng Wu, Hsin-Hsiung Huang, Chin-Wen Liao - 20 positions
11. Chen-Chang Hsu, Chun-De Shen, Ying Chang, Ming-Hsing Hsu, Kuo-Chuan Chen, Sheng-Hua Peng, Wen-Da Hsu, Chung-Hsing Tan - 8 positions 12. Jui-Tsung Chen, Yung-Ching Chang, Chung-Pin Wong, Chao-Cheng Chen - 4 positions

31
Employee profit sharing granted to the management team
Unit: NTD thousand
Title Name Stock dividends Cash dividends Total Total as a percentage to after-tax profit (%)
46 employees including President Jui-Tsung Chen (Note 1)
0 76,237 76,237 0.88%
Note: 1. Managers’ titles and names
‧President: Jui-Tsung Chen - 1 position
‧Executive Vice Presidents: Wen-Chung Shen, Yung-Ching Chang, Chung-Pin Wong, Chen-Chang Hsu, Chao-Cheng Chen - 5 positions
‧Senior Vice Presidents: Chun-De Shen, Pei-Yuan Chen, Chiu-Rui Wei, Ying Chang, Ming-Hsing Hsu, Kuo-Chuan Chen, Sheng-Hua Peng, Wen-Da Hsu,
Wei-Cheng Chen, Ming-Chih Chang - 10 positions
‧Vice Presidents: Chih-Chuan Cheng, Ching-Hsiung Lu, Shih-Tung Wang, Bo-Hsiung Chang, Tian-Yuan Tsai, Bo-Tang Wang, Hsi-Kuan Chen, Zong-Ming Wang,
Fu-Chuan Chang, Chi-Hsiang Ma, Yung-Nan Chang, Sheng-Hung Li, Yung-He Su, Ming-Hsiang Kan, Chih-Hsien Liang, Lung-Hua Shen, Ming-Dong Weng, Yue-Chun Li, Chiao-Lieh Huang, Chung-Hsing Tan, Yi-Yun Chang, Hsin-Kung Mao, Ling-Sheng Wu, Hsin-Hsiung Huang, Shih-Hung Huang, Yi-Chiang Chiu, Ching-Fa Li, Bo-Heng Chen, Jui-Chun Hsu - 29 positions
‧Head of Audit: Bo-Wen Hsieh - 1 position
2. Medica, John Kevin, Senior Advisor, Ming-Sung Lin, Vice Presidents, Meng-Hsiung Nieh, Vice President had resigned in 2015. In 2016, the following five:
Ming-Chih Chang, Senior Vice President, Shih-Hung Huang, Vice President, Yi-Chiang Chiu, Vice President, Ching-Fa Li, Vice President and Bo-Heng Chen, Vice
President were either transferred back or promoted. Jui-Chun Hsu, Vice President took office while Chin-Wen Liao, Vice President resigned.
3. Employees’ compensation appropriation was approved by the Board of Directors at the March 30, 2016 meeting. The compensations of the aforementioned managers
were not finalized and will be reviewed based on the list upon the date of distribution.
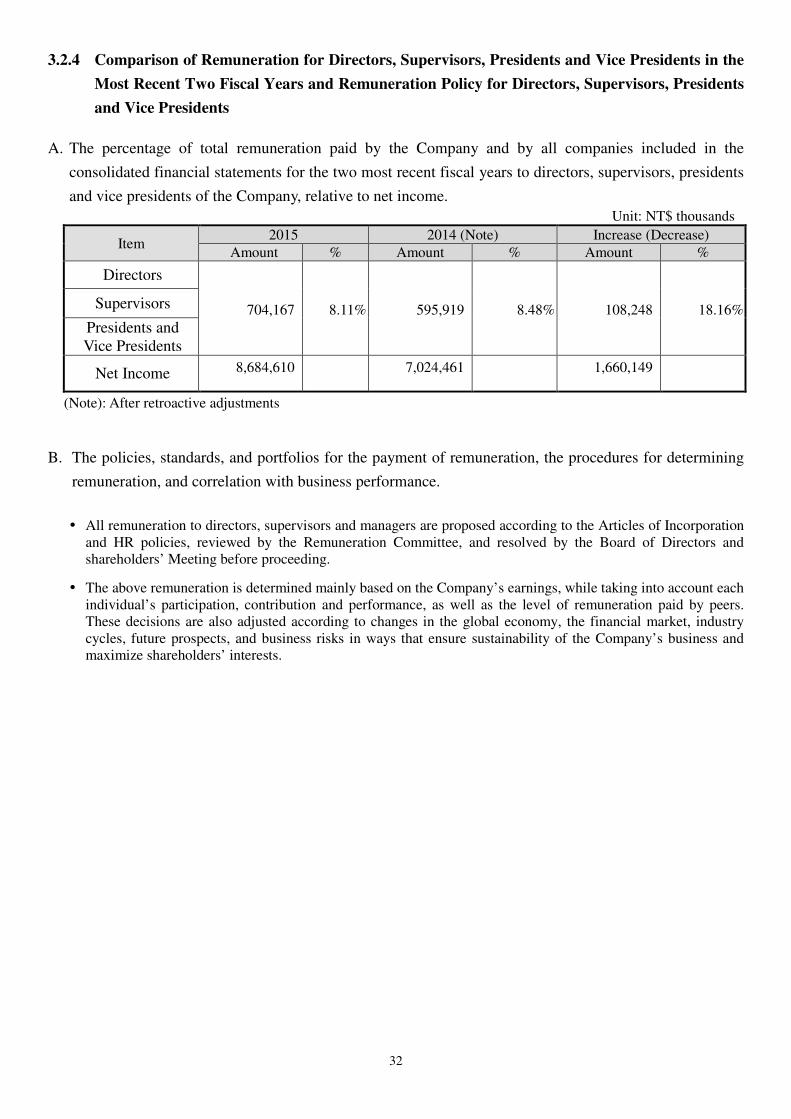
32
3.2.4 Comparison of Remuneration for Directors, Supervisors, Presidents and Vice Presidents in the
Most Recent Two Fiscal Years and Remuneration Policy for Directors, Supervisors, Presidents
and Vice Presidents
A. The percentage of total remuneration paid by the Company and by all companies included in the
consolidated financial statements for the two most recent fiscal years to directors, supervisors, presidents
and vice presidents of the Company, relative to net income.
Unit: NT$ thousands
Item 2015 2014 (Note) Increase (Decrease)
Amount % Amount % Amount %
Directors
704,167 8.11% 595,919 8.48% 108,248 18.16% Supervisors
Presidents and Vice Presidents
Net Income 8,684,610 7,024,461 1,660,149
(Note): After retroactive adjustments
B. The policies, standards, and portfolios for the payment of remuneration, the procedures for determining
remuneration, and correlation with business performance.
� All remuneration to directors, supervisors and managers are proposed according to the Articles of Incorporation and HR policies, reviewed by the Remuneration Committee, and resolved by the Board of Directors and shareholders’ Meeting before proceeding.
� The above remuneration is determined mainly based on the Company’s earnings, while taking into account each individual’s participation, contribution and performance, as well as the level of remuneration paid by peers. These decisions are also adjusted according to changes in the global economy, the financial market, industry cycles, future prospects, and business risks in ways that ensure sustainability of the Company’s business and maximize shareholders’ interests.

33
3.3 Implementation of Corporate Governance
3.3.1 Board of Directors
‧Previous directors term: June 22, 2012 to June 26, 2015.
‧Current directors term: June 26, 2015 to June 25, 2018.
‧There were seven Board meetings during 2015 (A). Director’s attendance records are as shown below:
Title Name Attendance in
Person (B) By Proxy
Attendance Rate
(%)[B/A] Remarks
Chairman Sheng-Hsiun Hsu 7 0 100% Re-elected on June 26,
2015
Director Jui-Tsung Chen 5 2 71%
Re-elected on June 26,
2015
Director Wen-Being Hsu 7 0 100%
Re-elected on June 26,
2015
Director
Kinpo Electronics, Inc.
Representative:
Shyh-Yong Shen
3 4 43% Re-elected on June 26,
2015
Director Charng-Chyi Ko 3 0 100% Inaugurated June 26, 2015
Director Sheng-Chieh Hsu 3 0 100% Inaugurated June 26, 2015
Director Yen-Chia Chou 3 0 100% Inaugurated June 26, 2015
Director Wen-Chung Shen 7 0 100% Re-elected on June 26,
2015
Director Yung-Ching Chang 5 2 71% Re-elected on June 26,
2015
Director Chung-Pin Wong 7 0 100% Re-elected on June 26,
2015
Director Chiung-Chi Hsu 7 0 100% Re-elected on June 26,
2015
Director Chao-Cheng Chen 5 2 71%
Re-elected on June 26,
2015
Independent
Director Min Chih Hsuan 6 1 86%
Re-elected on June 26,
2015
Independent
Director Duei Tsai 6 0 86%
Re-elected on June 26,
2015
Independent
Director Duh Kung Tsai 3 4 43%
Re-elected on June 26,
2015
Vice Chairman Medica, John Kevin 2 0 50% Resigned June 26, 2015
Director Sean Martin Maloney 0 0 0% Resigned June 26, 2015
Note: Vice Chairman Medica, John Kevin and Director Sean Martin Maloney reside in foreign countries and are unable to attend
every board meeting in person. However, the Company either informs them of the meeting agendas in advance, or arranges
to have them participate via teleconferencing so that they have full knowledge of meeting proceedings.
A. Enhance the valuation regarding the target achievement and execution by the Board of Directors in the current and
most recent year:
The Company established a “Remuneration Committee” since 2011. During the election of the 11th Board of
Directors and Supervisors in 2012 shareholders’ meeting, 3 independent directors were elected and appointed to be
the committee members of the Remuneration Committee. Supervisors were replaced with the Audit committee after the
12th Board of Directors was chosen in 2015 shareholders’ meeting.
B. Other notes:
Please refer to page 24-26 of the Chinese annual report.

34
3.3.2 Audit Committee (or Attendance of Supervisors at Board Meetings)
A. Audit Committee:
‧The Company’s Audit Committee has three members.
‧The term of the committee members is from June 26, 2015 to June 25, 2018.
‧There were three Audit Committee meetings during 2015 (A). The attendance records of the
Independent Directors are as follows:
Title Name Attendance in Person
(B) Attendance Rate (%)
[B/A] Remarks
Independent Director
Min Chih Hsuan 3 100% Inaugurated June 26, 2015
Independent Director
Duei Tsai 3 100% Inaugurated June 26, 2015
Independent Director
Duh Kung Tsai 1 33% Inaugurated June 26, 2015
Other notes:
1. The matter as listed in Article 14 of 5 the Security Act and other matters which were not approved by the Audit
Committee, but had the consent of more than two-thirds of all directors. The Company should record the date of the
Board of Directors’ meeting, the term, the discussion content, the result of the Audit Committee decision and the actions
the Company took in response to decisions made by the Audit Committee: None.
2. The actions of the independent directors with respect to the avoidance of conflict of interest should be disclosed
including the name of the independent director, the matter, the reasons for the avoidance and the voting and attendance
status: None.
3. Communication between the independent directors, internal audit supervisors and CPA.
� After the internal audit supervisor has submitted an audit report and follow-up report, he/she should provide the
completion of audit items to the independent directors for their review by the end of the following month. If the
independent directors need clarification of the audit and follow-up, they should contact the internal audit supervisor
at any time. The internal auditor shall report audit results to the Audit Committee on a regular basis and discuss
matters in person. The Company’s Audit Committee has a clear channel of communication with the internal audit
supervisor.
� The Audit Committee must communicate with the CPA on a regular basis regarding audit results and the financial
statement and any other requirements of the regulations. The Audit Committee shall also evaluate the selection, the
independence, and suitability of the CPA engaged by the Company.
B. Attendance of Supervisors at Board Meetings
‧The Company has three supervisors.
‧The term of the supervisors is from June 22, 2012, to June 26, 2015.
‧There were four meetings of the Board of Directors during the first half of 2015. The attendance
records are as follows:

35
Title Name Attendance in
Person (B) Attendance Rate (%)
[B/A] Remarks
Supervisor Charng-Chyi Ko 4 100% Resigned on June 26, 2015.
Supervisor Yen-Chia Chou 4 100% Resigned on June 26, 2015.
Supervisor Sheng-Chieh Hsu 4 100% Resigned on June 26, 2015.
Note: The Company elected three independent directors and replaced supervisors with an Audit Committee as
resolved in a 2015 shareholders’ meeting. The previous supervisors: Charng-Chyi Ko, Sheng-Chieh Hsu and
Yen-Chia Chou resigned as of June 26, 2015.
Other notes: 1. Composition and responsibilities of supervisors:
(1) Communications between supervisors and the Company’s employees and shareholders (e.g. the communication channels and methods used): Supervisors can directly engage and communicate with the Company’s employees and shareholders.
(2) Communications between supervisors and the Company’s chief internal auditor and CPA (e.g. topics of discussion, the methods used, results of financial or operational audits etc.): The Company’s supervisors are given open channels to communicate with internal and external auditors. Communication is established mainly through the following means: (A) Regular reports: the chief auditor is required to submit internal audit reports and worksheets to each
supervisor before the end of the month one month after an audit is completed. The chief auditor attends board meetings and reports progress of ongoing audit tasks. Meanwhile, the external auditor regularly reports to supervisors.
(B) Irregular reports: internal and external auditors are required to make written or verbal reports to supervisors whenever deemed necessary.
2. If a supervisor expresses an opinion during a meeting of the Board of Directors, the date of the meeting, session, the content of motion, the resolutions of the directors’ meetings and the company’s response to the supervisor’s opinion should be specified: None

36
3.3.3 Corporate Governance Implementation and Deviations from “the Corporate Governance Best-Practice Principles for TWSE/TPEX Listed
Companies”
Assessment criteria
Actual governance Deviation and causes of deviation from the Corporate
Governance Best-Practice Principles for TWSE/TPEX
Listed Companies
Yes No Summary description
I. Has the company established
and disclosed its corporate
governance principles based on
“Corporate Governance
Best-Practice Principles for
TWSE/TPEX Listed
Companies?”
Yes The Company’s corporate governance principles were approved by the Board of Directors
on August 11, 2015, and have been disclosed on its official website and MOPS.
No deviations were found
II. Shareholding structure and
shareholders’ interests
1. Has the company implemented
a set of internal procedures to
handle shareholders’
suggestions, queries, disputes
and litigations?
Yes The Company has a spokesperson and acting spokesperson who represents the interest of
the shareholders and a unit that specializes in addressing shareholders’ suggestions, queries,
disputes and litigation.
No deviations were found
2. Is the company constantly
informed of the identities of its
major shareholders and the
ultimate controller?
Yes The Company keeps track of the identity of its ultimate controller by monitoring insider
shareholding positions (including that of directors, supervisors, managers, and shareholders
with more than 10% ownership interest) the shareholder registry is held by the share
administration agency.
No deviations were found
3. Has the company established
and implemented risk
management practices and
firewalls for companies it is
affiliated with?
Yes The Company has established “Internal Control Policy - Non-trade Activities - Supervision
and Management of Subsidiaries”, “Internal Control Policy - Trade Activities – Invstment
Management,” and “Guidelines on Financial and Business Dealings Between Affiliated
Enterprises” to set up and execute firewalls and risk controls over related parties.
No deviations were found
4. Has the company established
internal policies that prevent
insiders from trading securities
against non-public
Yes To prevent insider trading, the “CO10 Insider Trading Prevention Management” and
“Insider Trading Prevention Procedures” have been included as part of internal control of
the company and details are published on the intranet and linked to the TWSE website to
which employees have access. Both policies have been included as part of the compulsory
No deviations were found

37
Assessment criteria
Actual governance Deviation and causes of deviation from the Corporate
Governance Best-Practice Principles for TWSE/TPEX
Listed Companies
Yes No Summary description
information? e-Learning courses for departmental heads, and eCSA questionnaires are issued on a yearly
basis to facilitate self-assessment. Insiders such as directors, supervisors and managers are
given a copy of the TWSE “Insider Share Trading Manual” when they come aboard to make
them aware of the company insider rules.
III. Assembly and obligations of
the board of directors
1. Has the board devised and
implemented policies to ensure
diversity of its members?
Yes The Company board is comprised of members from many different professional
backgrounds and work experience. They possess the collective knowledge, skill and
character needed to accomplish responsible board duties.
No deviations were found
2. Apart from the Remuneration
Committee and Audit
Committee, has the company
assembled other functional
committees at its own
discretion?
No Besides the Remuneration and Audit Committees, the Company also has a CSR Committee.
Wen-Chung Shen, executive VP, is the Chairman and he reports to the Board of Directors
regarding the operating status and results on a regular basis.
No deviations were found
3. Has the company established a
set of policies and assessment
tools to evaluate the board’s
performance? Is performance
evaluated regularly at least on
an annual basis?
No At present, the Company does not have policies or assessment tools in place to evaluate
performance of the Board.
Such policies and tools will be
created after careful
consideration.
4. Are external auditors’
independence assessed on a
regular basis?
Yes THE CPA issue an “Independent Auditor’s Report” on an annual basis and should avert the
engagement when they may have involved in any direct or material indirect interests. The
Company evaluates the independence and suitability of the CPA at (least once a year), in
accordance with Article 47 of the CPA Law and Bulletin 10 of the Norm of Ethics for
Certified Public Accountants. The CPA cannot be a director supervisor, or shareholder of the
company and may not be on the payroll. It must be confirmed that the CPA is not a related
party. The Company then submits the “CPA independence and suitability evaluation form”
along with the “Independent auditor’s report” to the Audit Committee for review, and before
it is submitted for examination and discussion by the Board of Directors. The same
No deviations were found

38
Assessment criteria
Actual governance Deviation and causes of deviation from the Corporate
Governance Best-Practice Principles for TWSE/TPEX
Listed Companies
Yes No Summary description
principles apply to whenever there is an internal rotation within the accounting firm.
IV. Has the company provided
proper communication
channels and created dedicated
sections on its website to
address corporate social
responsibility issues that are of
significant concern to
stakeholders?
Yes The Company has created a “Stakeholder Communication Area” on its website to address
stakeholder relations. Separate contact persons, phone numbers and email addresses have
been provided to each type of stakeholder relation to ensuring that queries are directed to the
relevant departments. A “Material Aspects” questionnaire has also been created, through
which stakeholders may identify issues that are of serious concern. The Company will
address stakeholders’ responses properly and take their suggestions as part of the
Company’s goals.
No deviations were found
V. Does the company engage a
share administration agency to
handle shareholder meeting
affairs?
Yes The Chinatrust Commercial Bank – Securities Trust has been appointed as the share
administration agency responsible for handling shareholder affairs and meetings and to
provide share administration services.
No deviations were found
VI. Information disclosure
1. Has the company established a
website that discloses financial,
business, and corporate
governance-related
information?
Yes The Company website (www.compal.com) is regularly updated with information such as
financial performance, corporate governance, and shareholder meetings.
No deviations were found
2. Has the company adopted other
means to disclose information
(e.g. English website,
assignment of specific
personnel to collect and
disclose corporate information,
implementation of a
spokesperson system,
broadcasting of investor
conferences via the company
website)?
Yes � The Company website has both Chinese and English pages. The information is gathered
and disclosed by a specialized company department.
� The Company has appointed a spokesperson and an acting spokesperson is also in
place.
� Investor conferences are held regularly and whenever deemed necessary. The
proceedings are posted on the Company’s website and also broadcast using the TWSE
platform (website: http://webpro.twse.com.tw/webportal/ vod/101/).
No deviations were found
VII. Does the company have other Yes � Employee welfare and care to employees No deviations were found

39
Assessment criteria
Actual governance Deviation and causes of deviation from the Corporate
Governance Best-Practice Principles for TWSE/TPEX
Listed Companies
Yes No Summary description
information that enables a
better understanding of the
company’s corporate
governance practices
(including but not limited to
employee rights, employee
care, investor relations,
supplier relations,
stakeholders’ interests,
continuing education of
directors/supervisors,
implementation of risk
management policies and risk
measurements, implementation
of customer policy, and
insuring against liabilities of
company directors and
supervisors)?
� Directors and Managers code of conduct; Employee code of conduct
� Investor relations
� Supplier relations and execution of customer policy
� Stakeholders’ interests
� Risk management execution and framework; risk analysis and evaluation
� Insuring against liabilities of company directors and supervisors
� Directors’, supervisors’ and managers’ ongoing education
� Qualification of personnel involved in financial transparency
VIII. Has the company prepared a
corporate governance
self-assessment report or
commissioned a professional
organization to compile a
corporate governance
assessment report? (If so,
please state the board of
directors’ opinions, the result
of the self/external assessment,
any major weaknesses or
suggestions raised, and
improvements made.)
Yes � In 2015, the Company had completed its second round corporate governance
self-assessment within the timeframe specified by TWSE. The assessment results were
published on April 12, 2016, in which the Company was ranked among the top
6%~20%.
� Details regarding the Company’s corporate governance practices are also accessible
from the Company’s website.
No deviations were found

40

41
3.3.4 Composition, Responsibilities and Operations of the Remuneration Committee
A. Professional Qualifications and Independence Analysis of Remuneration Committee Members
Note 1: Please fill in director, independent director, or other in the identification.
Note 2: Please check “�” in the box for a member, who during the two years before being elected or during the term
of office, any of the following applied:
(1) Not an employee of the company or any of its affiliates.
(2) Not a director or supervisor of the company or any of its affiliates. (The same does not apply, however, in
cases where the person is an independent director of the company, its parent company, or any subsidiary in
which the company holds, directly or indirectly, more than 50 percent of the voting shares.)
(3) Not a natural-person shareholder or holder of shares, together with those held by a spouse, minor children, or
held by the person under other names, in an aggregate amount of one percent or more of the total number of
issued shares of the company or ranking within the top 10 in holdings.
(4) Not a spouse, relative within a second degree of kinship, or lineal relative within the third degree of kinship,
or a person in compliance with any of the preceding three subparagraphs.
(5) Not a director, supervisor, or employee of a corporate shareholder that directly holds five percent or more of
the total number of issued shares of the company or that holds shares ranking within the top five in holdings.
(6) Not a director, supervisor, officer, or shareholder holding five percent or more of the shares, of a specified
company or institution that has a financial or business relationship with the company.
(7) Not a professional individual who, as an owner, partner, director, supervisor, or officer of a sole
proprietorship, partnership, company, or institution that, provides commercial, legal, financial, accounting
services or consultation to the company or to any affiliate of the company, or the spouse thereof.
(8) No matters as noted in Article 30 of Company Law.
Note 3: If the member is also a director, please describe whether he or she also meets the regulation requirement set in
accordance with Article 6-5 of the “Regulations Governing the Appointment and Exercise of Powers by the
Remuneration Committee of a Company Whose Stock is Listed on the Stock Exchange or Traded Over the
Counter”.
Title
(Note 1)
Criteria Name
Having Met One of the Following Professional Qualifications, Together with at Least Five Years Work
Experience
Independence Criteria (Note 2)
Number of Other Public Companies in
Which the Individual is Concurrently Serving as an Remuneration
Committee Member
Remarks (Note 3)
An instructor or higher position in a department of commerce, law, finance, accounting, or other academic department related to the business needs of the Company in a public or private junior college, college or university
A judge, public prosecutor, attorney, Certified Public Accountant, or other professional or technical specialist who has passed a national examination and been awarded a certificate in a profession necessary for the business of the Company
Having work experience in the areas of commerce, law, finance, or accounting, or otherwise necessary for the business of the Company
1 2 3 4 5 6 7 8
Independent Director
Min Chih Hsuan
� � � � � � � � � 2 Not applicable
Independent Director
Duei Tsai � � � � � � � � � � 3 Not applicable
Independent Director
Duh Kung Tsai
� � � � � � � � � 2 Not applicable

42
B. Attendance of Members at Remuneration Committee Meetings
‧The Company elected three members of the Remuneration Committee.
‧Prior committee member term: June 22, 2012 to June 26, 2015.
‧Current committee member term: July 9, 2015 to June 25, 2018.
‧There were six Remuneration Committee meetings during 2015 (A) and the committee member
qualifications and attendance records are as follows:
Title Name Attendance in
Person (B) By Proxy
Attendance Rate (%) [B/A]
Remarks
Convener Min Chih
Hsuan 5 1 83%
Re-elected on July 9, 2015
Committee Member
Duei Tsai 5 0 83% Re-elected on July 9, 2015
Committee Member
Duh Kung Tsai
3 3 50% Re-elected on July 9, 2015
Other notes:
1. If the board of directors declines to adopt or modifies a recommendation of the remuneration committee, it should
specify the date of the meeting, the session, the nature of motion, the resolution made by the board of directors,
and the Company’s response to the remuneration committee’s opinion (eg., if the amount of remuneration passed
by the Board of Directors exceeds the remuneration committee’s recommended amount, the circumstances and
cause for the difference shall be specified): None.
2. If resolutions of the remuneration committee are objected by members or become subject to a qualified opinion,
which have been recorded or declared in writing, then the date of the meeting, the session, the nature of the
motion, all members’ opinions and the response to members’ opinion should be specified: None.

43
3.3.5 Corporate Social Responsibility
Assessment criteria
Actual governance Deviation and causes
of deviation from
Corporate Social
Responsibility Best
Practice Principles for
TWSE/TPEX Listed
Companies
Yes No Summary description
I. Sound corporate governance
1. Does the company have a
corporate social responsibility
policy or system in place? Is
progress reviewed on a regular
basis?
Yes The Company’s corporate social responsibility policy was passed by the Board of Directors. CSR
progress is reported to and reviewed by the board on a regular basis.
No deviations were
found
2. Does the company organize
social responsibility training on
a regular basis?
Yes The Company organizes annual CSR training courses in accordance with its Employee Code of
Conduct and CSR-related policies. These training courses cover a broad variety of topics including
corporate policies, HR system, employee code of conduct, personal information protection act and
other areas as the law may require. All training courses are accessible online and have been made as
requisites for new employees. Existing employees may complete courses online at their own
discretion at any time. In 2015, 12,675 employees had completed their training for a total of 23,543
hours.
No deviations were
found
3. Does the company have a unit
that specializes (or is involved)
in CSR practices? Is the CSR
unit run by senior management
and reports its progress to the
board of directors?
Yes The Company has a CSR Office that specializes in CSR-related matters. The Board of Directors has
authorized its senior management to perform CSR-related tasks and to update the board on the overall
progress.
No deviations were
found
4. Has the company implemented
a reasonable remuneration
system that associates
employees’ performance
appraisals with CSR? Is the
remuneration system supported
by an effective
Yes Employees’ salary levels are set based upon those of similar responsibilities, with adjustments made
based on individual work performance. Different salary levels may be granted depending on
education, experience, job grade and the assigned duties, but are higher than the statutory minimum in
any case. Furthermore, employees are entitled to a portion of share of the Company’s current year
profits.
The Company has set clear guidelines to reward and penalize employees’ conducts and performance.
Rewards and penalties are decided to depend on the severity and impact of the event involved.
No deviations were
found

44
Assessment criteria
Actual governance Deviation and causes
of deviation from
Corporate Social
Responsibility Best
Practice Principles for
TWSE/TPEX Listed
Companies
Yes No Summary description
reward/discipline system?
II. Fostering a sustainable
environment
1. Is the company committed to
achieving efficient use of
resources, and using renewable
materials that produce less
impact on the environment?
Yes The R&D and production teams are well aware of how the design and production of more
environmentally friendly, green, low-carbon products contribute to mitigating climate changes and
impacts. They respond quickly to customers’ needs in terms of certifications such as Energy Star,
US EPEAT, US & WW EPEAT, China CECP & CEC and Taiwan Green Mark.
No deviations were
found
2. Has the company developed an
appropriate environmental
management system, given its
distinctive characteristics?
Yes The Company began its implementation of ISO 14001 Environment Management System in April
1997; quality and environmental safety policies were created in 2005 to guide the Company’s efforts
on employee workplace safety and corporate responsibilities. Operating procedures and
environmental/safety/health management systems have been established based on government
regulations and international standards such as ISO, OHSAS etc. The Company adopts proper
communication channels to convey its environmental and safety policies and goals to employees,
suppliers, contractors, surrounding neighbors and interest groups.
No deviations were
found
3. Is the company aware of how
climate changes affect its
business activities? Are there
any actions taken to measure
and reduce greenhouse gas
emission and energy use?
Yes The Company began greenhouse surveys (scopes 1 and 2) and carbon footprint assessments as early
as 2010. The scope of greenhouse gas survey has been progressively expanded to (scope 3) by 2014.
In 2015, Compal was included in the CDP Climate Disclosure Leadership Index (CDLI) for the first
time. The Company actively participates in the Carbon Disclosure Project (CDP) as a means to
improve its response to climate changes. The CDP achieves its purpose by assessing a company’s
carbon emission, reduction progress, compliance risks, and exposure to physical risks such as supply
disruption, shortage of resources, extreme weather, rising sea levels and diseases etc. Once identified,
risks can then be mitigated or even turned into opportunities to ensure a company’s sustainability.
No deviations were
found
III. Enforcement of public welfare
1. Has the company developed its
policies and procedures in
accordance with laws and
International Bill of Human
Rights?
Yes The Company places great emphasis on equal opportunities and business ethics. It has policies and
systems in place to ensure compliance with international conventions.
The Company and all its subsidiaries throughout the world have established employment guidelines
according to international human rights conventions and local labor regulations. All employment
terms have been assured to conform with the laws of the local country or region. Out of respect
No deviation was
found

45
Assessment criteria
Actual governance Deviation and causes
of deviation from
Corporate Social
Responsibility Best
Practice Principles for
TWSE/TPEX Listed
Companies
Yes No Summary description
towards labor rights, the Company changes its policies and rules in line with the latest regulations,
and announces them to the understanding of all its employees. For the purpose of maintaining
harmonic employer-employee relations, a communication platform has been created to enable
exchange of opinions and information between the Company and its employees.
2. Does the company have means
through which employees may
raise complaints? Are
employee complaints being
handled properly?
Yes The Company has set up email contacts through which employees may express their opinions and
offer suggestions. These opinions and suggestions are referred to appropriate units within the
Company; progress and outcomes are reported back to employees as they become available.
No deviations were
found
3. Does the company provide
employees with a safe and
healthy work environment? Are
employees trained regularly on
safety and health issues?
Yes The Company is well-aware of how significantly “workplace safety and health” affects a company, its
employees and stakeholders. This was the reason why the Company has enhanced its environmental,
safety and quality policies and obtained OHSAS 18001 certification since 2005, which requires all
departments to implement proper safety and health practices as well as regular training on matters
such as fire safety equipment, utility plans, waste disposal, emergency response procedures etc. The
Company organizes health and safety training for employees on a regular basis as a means to prevent
occupational hazards and ensure workplace safety. In 2015, 2,921 employees had completed their
training for a total of 6,348 hours.
No deviations were
found
4. Does the company have means
to communicate with
employees on a regular basis,
and inform them of operational
changes that may be of
significant impact?
Yes The Company is committed to creating communication platforms where employees may exchange
opinions and information. “Employee opinion boxes” have been made available at the headquarter
and at various plant sites to receive employees’ complaints; “Sunshine Group” and hotlines have been
set up in all plant sites and are run by compassionate people who promptly respond to employees’
opinions so that the Company can rectify its flaws and help solve employees’ problems immediately.
Townhall Meetings are organized regularly at the turn of the year. During which, the CEO will
personally address employees on the Company’s new business developments. Key points of this
meeting are also summarized and delivered to all employees via email.
No deviations were
found
5. Has the company implemented
an effective training program
that helps employees develop
skills over their career?
Yes Annual training programs are tailored to suit the needs of different employees, based on the
Company’s business strategies, policy guidelines, and career roadmaps. The Company constantly
aims to establish itself as a learning organization and coaching management.
No deviations were
found

46
Assessment criteria
Actual governance Deviation and causes
of deviation from
Corporate Social
Responsibility Best
Practice Principles for
TWSE/TPEX Listed
Companies
Yes No Summary description
6. Has the company implemented
consumer protection and
grievance policies with regards
to its research, development,
procurement, production,
operating and service
activities?
Yes The Company is an OEM/ODM manufacturer, manufacturing TV sets, notebooks, cell phones and
electronics for top brands. There is a dedicated unit responsible for every step in the production
process such as product development and design, shippings, and maintenance and service. Once
customers have launched their products, the Company will continue to support them with services and
parts until the product no longer requires after-sale responsibilities. Customers are given the option to
visit Compal’s website, click on Stakeholder Communication Area and leave messages using an
exclusive link; these messages will then be handled by the appropriate departments.
No deviations were
found
7. Has the company complied
with laws and international
standards with regards to the
marketing and labeling of
products and services?
Yes The Company is an OEM/ODM. It manufactures TV sets, notebooks, cell phones and electronics for
the world’s top brands. All products are printed with customers’ trademarks, names, and labeling that
conform with relevant laws and international guidelines; however, the Company does not print its
own logos or names on the products it produces.
No deviations were
found
8. Does the company evaluate
suppliers’ environmental and
social conducts before
commencing business
relationships?
Yes The Company requests all its suppliers to fulfill their responsibilities with respect to the environment,
labor, management, and ethics. Furthermore, the Company also demands its suppliers to sign and
comply with EICC® (Electronics Industry Supply Chain Code of Conduct) and evaluates suppliers’
performance by their contribution to corporate social responsibilities.
No deviations were
found
9. Is the company entitled to
terminate supply agreement at
any time with a major supplier,
if the supplier is found to have
violated its corporate social
responsibilities and caused
significant impacts against the
environment or the society?
Yes The Company requires all major suppliers to comply with local regulations and fulfill their duties to
the environment and the society. They are demanded to immediately rectify any violations found to
ensure the business relationship with the Company.
The Company’s standard procurement contract specifically requires suppliers to comply with EICC®
(Electronics Industry Supply Chain Code of Conduct) and environmental protection laws. The
contract empowers the Company to terminate procurement relationship with any supplier that is found
to have violated the above rules.
No deviations were
found
IV. Enhanced information
disclosure
1. Has the company disclosed
relevant and reliable CSR
Yes A “CSR” section is created on the Company’s website to disclose information in different categories.
A “News” section is also available on the home page where stakeholders are given access to the latest
No deviations were
found

47
Assessment criteria
Actual governance Deviation and causes
of deviation from
Corporate Social
Responsibility Best
Practice Principles for
TWSE/TPEX Listed
Companies
Yes No Summary description
information on its website and
at the Market Observation Post
System?
information. The Company prepares CSR reports on an annual basis to disclose how it has fulfilled its
social responsibilities. This report may be downloaded from the Company’s website and from Market
Observation Post System (MOPS).

48
5. If the company has established the corporate social responsibility principles based on “Corporate Social Responsibility Best-Practice Principles for TWSE/TPEX Listed Companies,” please describe any discrepancy between the Principles and their implementation:
■ The Company has established “Compal Corporate Social Responsibility Best Practices” based on “Corporate Social Responsibility Best-Practice Principles for
TWSE/TPEX Listed Companies.” A “CSR Office” has also been introduced specifically for the purpose of promoting social responsibilities, environmental
sustainability, public welfare, and information disclosure. The Company has adopted the principles of EICC by including corporate social responsibilities as part of its
overall business plan, thereby making sure that everything it does confirms with EICC. The CSR Office reports its progress regularly to the Board of Directors, and
publishes annual CSR reports to ensure proper disclosure of CSR information.
■ To contribute to the sustainability of our environment, the Company publishes green knowledge materials on a monthly basis and organizes regular environmental
training courses for the management and general employees. It adopts green product management starting from the design stage and covering all aspects of the supply
chain, which aims to: reduce resource and energy consumption, minimize discharge of pollutants and toxic waste, ensure proper waste disposal, enhance recyclability
and reusability of raw materials and products, maximize usage of available resources, extend product durability, and enhance product/service efficiency. The green
management also aims to prevent pollution to water, air and soil, and embodies a series of strategies to reduce the level of greenhouse gas and carbon emitted during
the Company’s operations. It is our hope to minimize adverse impacts on health and the environment by adopting the best and most feasible pollution controls
available.
6. Other important information to facilitate better understanding of the company’s corporate social responsibility practices:
There is a specific CSR section on the corporate website containing CSR policy, target and management procedures. Please refer to: http://www.compal.com

49
7. A clear statement shall be made below if the corporate social responsibility reports were verified by external certification institutions:
■ Criteria undertaken by institutions to certify the Company’s products:
The Company adopts the green concept right from the design and development stage for all products it manufactures. In addition to making sure that all manufactured
products conform with compulsory regulations and voluntary certifications in countries where they are distributed, the Company also takes the initiative in developing
talents and technologies in relation to energy-saving issues and thereby keeping up with world’s latest trends and challenges. Apart from knowing the latest news in
environmental regulations and certifications, Compal also possesses adequate R&D and execution capacity to quickly respond to customers’ needs for certification
such as IECQ QC 080000, Energy Star, US & EPEAT, US & WW EPEAT, China CECP & CEC, Taiwan Green Mark and Indoor Air Quality Testing & Certification.
■ Criteria undertaken by institutions to certify the Company’s CSR report:
The Company has been preparing annual CSR reports and disclosing them to stakeholders on its website since 2010. The CSR report was first certified by an external
institution in 2012, and later in 2015, the Company adopted Global Reporting Initiative’s G4 guidelines (GRI G4, published in 2013) to prepare its CSR report. The
2014 report was compiled based on stakeholders’ concerned issues and the Company’s key objectives. To ensure the credibility of reported contents, the Company
commissioned the SGS to provide independent assurance based on the criteria specified in AA 1000 AS and GRI G4. After their assurance, the report was certified to
meet AA1000 AS Assurance Standard Type 2, mid-level accountability, and GRI G4 application core requirements. The Company wasawarded a Bronze Award by
Taiwan Institute for Sustainable Energy in two consecutive years during its “Taiwan Corporate Sustainability Report Award.”

50
3.3.6 Ethical Corporate Management
Assessment criteria
Actual governance Deviation and causes
of deviation from
Integrity Best-Practice
Principles for
TWSE/TPEX Listed
Companies
Yes No Summary description
I. Establishment of integrity
policies and solutions
1. Has the company stated in
its Memorandum or
external correspondence
about the policies and
practices it has to maintain
business integrity? Are the
board of directors and the
management committed in
fulfilling this
commitment?
Yes The Company has clearly outlined the procedures for ethical management and guidelines for conduct in its
HR policies, social responsibility policies, the integrity principles and code of conduct for directors,
supervisors, managers, and the general code of conduct. The Board of Directors and the management have
committed themselves to business integrity. The Company’s “Board of Directors Meeting Guidelines”
contain a conflicting interest clause that requires directors to disassociate from all discussion and voting of
any agenda that poses a conflict of interest between the Company and themselves or the entities they
represent.
No deviations were
found
2. Does the company have
any measures against
dishonest conducts? Are
these measures supported
by proper procedures,
behavioral guidelines,
disciplinary actions and
complaint systems?
Yes The Company has established the “Ethical Corporate Management Best Practice Principles” and “Business
Integrity Procedures and Behaviors” (hereinafter, “Procedures and Behaviors”) as an incentive to insiders
and outsiders to report unethical or unseemly conduct. Any insider who makes a false report or a malicious
accusation shall be subject to disciplinary action and be removed from office if the circumstance
concerned have substance.
This Company has appointed a contact person, and has established a hotline and mailbox that can be used
either through the Intranet of the company website. Any person involved in unethical conduct will be
referred to an authorized department and processed according to the “Business Integrity Procedures and
Behaviors”.
No deviations were
found
3. Has the company taken
steps to prevent
occurrences listed in
Article 7, Paragraph 2 of
“Ethical Corporate
Management Best Practice
Yes The Company’s “Business Integrity Procedures and Behaviors” govern the following
‧ Prohibition against offering and acceptance of improper gains
‧ Prohibition against lobbying
‧ Prohibition against illegal political donations
‧ Prohibition against improper donations or sponsorships
‧ Prohibition against inappropriate gifts, treatments and illegitimate benefits
No deviations were
found

51
Assessment criteria
Actual governance Deviation and causes
of deviation from
Integrity Best-Practice
Principles for
TWSE/TPEX Listed
Companies
Yes No Summary description
Principles for
TWSE/TPEX-Listed
Companies” or business
conducts that are prone to
integrity risks?
‧ Prohibition against unfair competition
‧ Prohibition against leakage of commercial secrets and infringement of intellectual property rights
‧ Prohibition against insider trading and rules of confidentiality
Furthermore, the “Information Security Policy” has introduced measures to prevent violation of
commercial secrets.
II. Integrity actions
1. Does the company
evaluate the integrity of all
counterparties it has
business relationships
with? Are there any
integrity clauses in the
agreements it signs with
business partners?
Yes The Company requires all suppliers to sign commitments to EICC® (Electronic Industry Citizenship
Coalition), which binds them to local regulations on workers’, environment, safety, health, management,
and moral conducts, and prevents them against corruptive and unethical behaviors.
No deviations were
found
2. Does the company have a
unit that specializes (or is
involved) in business
integrity? Does this unit
report its progress to the
board of directors on a
regular basis?
Yes The Company has assigned Human Resources, Administrative management, the Business Investment
Management and Legal Groups as authorities to handle Company ethical matters. They set the guidelines
together and the audit group monitors and reports to the Board of Directors on a regular basis.
No deviations were
found
3. Does the company have
any policy that prevents
conflict of interest, and
channels that facilitate the
report of conflicting
interests?
Yes The Company has established the “Ethical Corporate Management Best Practice Principles” and “Business
Integrity Procedures and Behaviors” (hereinafter, “Procedures and Behaviors”); a Company director,
officer or other stakeholder attending, or present at a board meeting, or a juristic representative whose
presence infers a likelihood that company interests might be prejudiced, may not participate in a discussion
or vote on that proposal, shall recuse themselves from any discussion and voting, and may not exercise
voting rights as proxy on behalf of another director. The directors shall exercise discipline among
themselves, and may not support each other in any inappropriate manner. If, in the course of conducting
company business, an employee of this Corporation discovers that a potential conflict of interest exists
involving themselves or the juristic person that they represent, or that they or their spouse, parents,
No deviations were
found

52
Assessment criteria
Actual governance Deviation and causes
of deviation from
Integrity Best-Practice
Principles for
TWSE/TPEX Listed
Companies
Yes No Summary description
children, or a person with whom they have a relationship of interest is likely to obtain improper benefit,
the matter shall be reported to their immediate supervisor and the responsible unit, and the supervisor shall
provide the employee with the proper instructions.
No employee of this Corporation may use company resources for commercial activities other than those of
this Corporation, nor may his or her job performance be affected by involvement in commercial activities
other than those of this Corporation.
The Company’s HR policy and employee code of conduct have introduced rules to identify, supervise and
manage conflicts of interest for business activities that are more highly prone to dishonest behaviors. There
are channels in place for directors, supervisors, managers, stakeholders, and board meeting participants to
state their conflicting interests with the Company.
To prevent leakage of material non-public information, the Company has established “CO10 Insider
Trading Prevention Management” as part of its internal control and demanded strict compliance from
directors, supervisors, managers, employees, and any party that gains knowledge to the Company’s
material non-public information whether because of their identity, job responsibility or controlling
relationships.
4. Has the company
implemented effective
accounting and internal
control systems for the
purpose of maintaining
business integrity? Are
these systems reviewed by
internal or external
auditors on a regular
basis?
Yes The Company has set “Ethical Corporate Management Best Practice Principles” and focuses on creating
an effective accounting system and internal control system to avoid high-risk or unethical business
activities and the use of external or secret accounts. Self-evaluation is done on a regular basis to make sure
the design and execution of the system is effective. The Company’s internal audit unit oversees compliance of the system and prepares routine audit reports
for the Board of Directors.
No deviations were
found
5. Does the company
organize internal or
external training on a
regular basis to maintain
business integrity?
Yes The Company organizes training courses in accordance with “Regulations Governing Establishment of
Internal Control Systems by Public Companies” and the board-approved “Insider Trading Prevention
Principles.” Insider training prevention courses are organized for vice president-grade employees and
above, while general employees are subjected to training on ethical behaviors on a yearly basis.
No deviations were
found

53
Assessment criteria
Actual governance Deviation and causes
of deviation from
Integrity Best-Practice
Principles for
TWSE/TPEX Listed
Companies
Yes No Summary description
III. Implementation of
whistleblowing system
1. Does the company provide
incentives and means for
employees to report
malpractices? Does the
company assign dedicated
personnel to investigate
the reported malpractices?
Yes The Company has mailboxes in place to receive malpractice reports from within or outside the Company.
Once a report has been sent to the mailbox, it will be referred to the appropriate department and personnel
depending on the nature of the underlying issue. The identity of the informer and details of the report will
be kept confidential, and may involve internal auditors if the situation requires it.
No deviations were
found
2. Has the company
implemented any standard
procedures or
confidentiality measures
for handling reported
malpractices?
Yes The Company has specifically instructed case handlers to strictly follow procedures when building,
assigning and investigating cases, and to exercise discretion during the investigation process.
No deviations were
found
3. Does the company assure
malpractice reporters that
they will not be mistreated
for making such reports?
Yes The Company has confidentiality procedures built into its management policies and employee code of
conduct to protect informers and investigators from improper treatments or retaliation.
No deviations were
found
IV Enhanced information
disclosure
1. Has the company
disclosed its integrity
principles and progress
onto its website and
MOPS?
Yes The Company has disclosed corporate governance and business integrity matters and updated the progress
of such efforts in its annual reports, CSR reports and “Investor Relations-corporate governance” and
“CSR” sections of its website.
No deviations were
found
V If the company has established business integrity policies in accordance with “Ethical Corporate Management Best Practice Principles for TWSE/TPEX-Listed
Companies,” please describe its current practices and any deviations from the Best Practice Principles:
The Company’s “Business Integrity Principles” and “Business Integrity Procedures and Behaviors” have been passed by the Board of Directors and disclosed at the
Company’s website and MOPS. A specialized unit will be empowered to enforce these policies and ensure employees’ compliance.

54
Assessment criteria
Actual governance Deviation and causes
of deviation from
Integrity Best-Practice
Principles for
TWSE/TPEX Listed
Companies
Yes No Summary description
VI. Other information relevant to understanding the company’s business integrity (e.g. reviews over business integrity principles):
Courses have been introduced to the e-Learning system so that employees are made aware of the Company’s “Business Integrity Principles” and “Business Integrity
Procedures and Behaviors.”
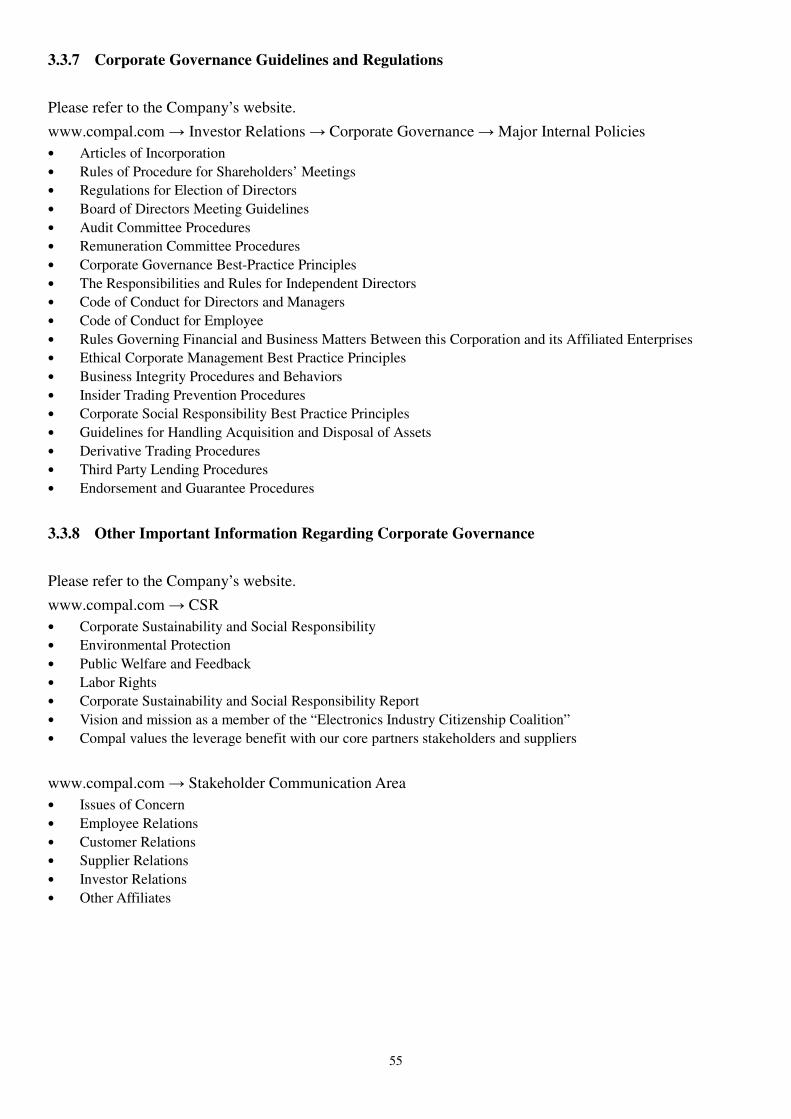
55
3.3.7 Corporate Governance Guidelines and Regulations
Please refer to the Company’s website.
www.compal.com → Investor Relations → Corporate Governance → Major Internal Policies
• Articles of Incorporation
• Rules of Procedure for Shareholders’ Meetings
• Regulations for Election of Directors
• Board of Directors Meeting Guidelines
• Audit Committee Procedures
• Remuneration Committee Procedures
• Corporate Governance Best-Practice Principles
• The Responsibilities and Rules for Independent Directors
• Code of Conduct for Directors and Managers
• Code of Conduct for Employee
• Rules Governing Financial and Business Matters Between this Corporation and its Affiliated Enterprises
• Ethical Corporate Management Best Practice Principles
• Business Integrity Procedures and Behaviors
• Insider Trading Prevention Procedures
• Corporate Social Responsibility Best Practice Principles
• Guidelines for Handling Acquisition and Disposal of Assets
• Derivative Trading Procedures
• Third Party Lending Procedures
• Endorsement and Guarantee Procedures
3.3.8 Other Important Information Regarding Corporate Governance
Please refer to the Company’s website.
www.compal.com → CSR
• Corporate Sustainability and Social Responsibility
• Environmental Protection
• Public Welfare and Feedback
• Labor Rights
• Corporate Sustainability and Social Responsibility Report
• Vision and mission as a member of the “Electronics Industry Citizenship Coalition”
• Compal values the leverage benefit with our core partners stakeholders and suppliers
www.compal.com → Stakeholder Communication Area
• Issues of Concern
• Employee Relations
• Customer Relations
• Supplier Relations
• Investor Relations
• Other Affiliates

56
3.3.9 Internal Control Systems
Compal Electronics, Inc.
Statement of the Internal Control System
Date: February 24 2016
Based on the findings of a self-assessment, the Company states the following with regard to its internal control system
for the year of 2015:
1. The Company is fully aware that the establishment, operation, and maintenance of an internal control system is
the responsibility of the Board of Directors and management. The Company has established such a system. It is
aimed at providing reasonable assurance regarding the achievement of objectives in the effectiveness and
efficiency of operations (including profitability, performance, and the safeguard of assets); Reliability, timeliness,
transparency, and regulatory compliance of reporting, and compliance with all the applicable laws and
regulations.
2. An internal control system has inherent limitations. No matter how perfectly designed, it can only provide some
reasonable assurance of the accomplishment of the three objectives mentioned above. Moreover, the effectiveness
of an internal control system may be subject to changes of environment or circumstances. Nevertheless, the
internal control system of the Company contains self-monitoring mechanisms, and corrective action is taken
whenever a deficiency is identified.
3. The Company evaluates the design and operating effectiveness of its internal control system based on the criteria
provided in the “Regulations Governing the Establishment of Internal Control System by Public Companies”
(herein below, the “Regulations”). The criteria adopted by the Regulations identify five components of internal
control based on the process of management control: (1) control environment, (2) risk assessment, (3) control
activities, (4) information and communication, and (5) monitoring. Each component further contains several
items. Please refer to the Regulations for details.
4. The Company has evaluated the design and operating effectiveness of its internal control system according to the
aforementioned criteria.
5. Based on the findings of the evaluation mentioned in the preceding paragraph, the Company believes that, on
December 31 2015, its internal control system (including the supervision and management of subsidiaries), as
well as internal controls to monitor the effectiveness of its own objectives concerning operational effectiveness
and efficiency, reliability, timeliness, transparency, and regulatory compliance in reporting, and compliance with
applicable laws and regulations, were effective in design and operation, and provided reasonable assurance that
the above-stated objectives would be achieved.
6. This Statement will be an integral part of the Company’s Annual Report and Prospectus, and will be made public.
Any falsehood, concealment, or other illegality of content made public will entail legal liability under Articles 20,
32, 171, and 174 of the Securities and Exchange Law.
7. This Statement has been passed by the Board of Directors at a meeting held on February 24, 2016, with 0 of the
15 attending directors expressing dissenting opinions, the remainder all affirmed the content of this Statement.
Compal Electronics, Inc.
Chairman:
President:

57
3.3.10 Penalties imposed against the company and its staff, or penalties imposed by the company
against its staff for violations of internal control or regulations; state any corrective actions
taken in the most recent years up till the date of the annual report: None.
3.3.11 Major Resolutions Made in Shareholders’ Meeting and Board Meetings
1. Shareholders’ meeting
▓ Time: 9 am, June 26, 2015 (Friday)
Venue: B1, No. 581, Ruiguang Road, Neihu District, Taipei City
▓ Major resolutions:
(1) Ratified the Financial Statement for the year 2014.
(2) Ratified the Distribution of Earnings for the year 2014.
(3) Approved the proposal of cash distribution from capital surplus.
(4) Approved amendments to the Company’s Articles of Incorporation.
(5) Approved the proposal to partially amend the Election of Directors and Supervisors.
(6) Election of 12th Board of Directors.
� Elected directors include 12 members as follows: Sheng-Hsiun Hsu, Jui-Tsung Chen, Wen-Being
Hsu, Kinpo Electronics Inc., Charng-Chyi Ko, Sheng-Chieh Hsu, Yen-Chia Chou, Wen-Chung
Shen, Yung-Ching Chang, Chung-Pin Wong, Chiung-Chi Hsu, and Chao-Cheng Chen.
� Elected independent directors include three members as follows: Min Chih Hsuan, Duei Tsai and
Duh Kung Tsai.
(7) Resolved to remove non-competition for directors.
(8) Approved the proposal to partially amend the Guidelines for Handling Acquisition and Disposal of
Assets.
(9) Approved the proposal to partially amend the “Procedures for the Handling of Derivatives Trading”.
(10) Approved the proposal to partially amend the “Endorsement and Guarantee Procedures”.
(11) Approved the proposal to partially amend the “Third Party Lending Procedures”. ▓ Post-meeting execution:
(1) The Articles of Incorporation and election of 12th Board of Directors were approved and registered
on file by the Ministry of Economic Affairs on July 17, 2015.
(2) The 2015 distribution of cash dividend and capital reserve are summarized as followed:
� The adjustment of the dividend ratio and the ratio of cash distributed from capital reserve results
from cancellation of new restricted employee shares because the criteria were not met by the
intended employees and the impact on outstanding shares is as follows:
� Cash dividend: Initial 1 per share, adjusted to $1.00002258 per share.
� Cash distributed from capital reserve: Original $0.5/share, adjusted to $0.50001129/share.
˙Ex-dividend date: August 12, 2015.
˙Declaration date: September 3, 2015.

58
2. Board meetings
Date Major resolutions
2015.1.22
1. Approve of management changes.
2. Approved new share issue through the employee warrant.
3. Approved the issuance of new shares of the first 2014 restricted employee shares.
4. Approved the financing of Compal subsidiaries through the issue of a Company Letter of Support.
5. Approved of the Company’s financing authorization from the financial institute.
2015.2.26
1. Resolved to amend 2014 appropriation rate and amount of director and supervisor compensation.
2. Approved to the distribution of the first 2015 mid-year bonus (Dragon Boat Festival).
3. Approved of 2015 compensation adjustments.
4. Approved of 2014 consolidated and individual financial statements.
5. Approved of 2014 operation report.
6. Approved of 2015 operation plan.
7. Approved for 2014 distribution of earnings.
8. Approved of cash distributed from capital reserve.
9. Approved of the evaluation of the independence and suitability of the Company’s CPA.
10. Approved of 2014 Statement of Internal Control System.
11. Approved of the call of 2015 shareholders’ meeting.
12. Approved Company financial authorization from the financial institute.
2015.4.7
1. Approved of the election of 12th Board of Directors.
2. Approved of the nomination of the 12th Board of Directors candidates and their qualifications.
3. Approved for the loan to Henghao Technology Co., Ltd.
4. Approved the financing of Compal subsidiaries through the issue of a Company Letter of Support.
5. Approved of the Company’s financing authorization from the financial institute.
2015.5.11
1. Approved of the proposal to partially amend the Articles of Incorporation.
2. Approved the proposal to partially amend the Guidelines for Handling Acquisition and Disposal
of Assets.
3. Approved the proposal to partially amend the Procedures for the Handling of Derivatives Trading.
4. Approved of the proposal to partially amend the Endorsement and Guarantee Procedures.
5. Approved of the proposal to partially amend the Third Party Lending Procedures.
6. Approved the proposal to partially amend the Election of Directors and Supervisors.
7. Approved of the qualifications of the candidates of the 12th Board of Directors.
8. Resolved to remove the non-competition on directors and managers.
9. Resolved to establish CSR policy.
10. Resolved to establish Procedures for Business Integrity Procedures and Behavior.
11. Resolved to appropriate 2015 employee bonus ratio and directors and supervisors compensation.
12. Investment in Rayonnant Technology Co Ltd.
13. Approvedthe Guidance of the second “2014 restricted employee warrant shares”.
14. Approved of the Company’s financing authorization from the financial institute.
2015.7.9
1. Approved the appointment of the general manager.
2. Approved the change of managers.
3. Approved the appointment of members of the Remuneration Committee.
4. Approved the proposal to partially amend the Audit Committee Procedures.
5. Approved the proposal to partially amend the Remuneration Committee Procedures.
6. Approved the proposal to partially amend the Board of Directors Meeting Guidelines.
7. Approved the proposal of the 2015 audit plan.
8. Approved the distribution of 2015 cash dividend and capital reserve in cash to shareholders.
9. Approved the financing of re-investment companies through the issue of a Company Letter of
Support.
10. Approved the increase of the intermediate term loan limit from the financial institute.
11. Approved the Company’s financing authorization from the financial institute.
2015.8.11 1. Approved the appointment of the Chief Accountant.

59
Date Major resolutions
2. Approved the appointment of the Audit Manager.
3. Approved 2014 director and supervisor compensation.
4. Approved the distribution of the second 2014 mid-year bonus (Mid-Autumn Festival).
5. Approved the cancellation of restricted warrant shares to employees who had not met the required
conditions.
6. Approved the loan to Henghao Technology Co., Ltd.
7. Approved the proposal to partially amend the Procedures for the Handling of Derivatives Trading.
8. Approved the proposal to partially amend the Internal Control System.
9. Approved the proposal to partially amend the Procedures for the Internal Control Self-Evaluation
System.
10. Approved the proposal to partially amend Guidance for the Internal Audit.
11. Approved the proposal to partially amend the Corporate Governance Best-Practice Principles.
12. Approved the proposal to partially amend the Code of Conduct for Directors, Supervisors and
Officers.
13. Approved the proposal to partially amend the Code of Conduct.
14. Approved the proposal to partially amend the Ethical Corporate Management Best Practice
Principles.
15. Approved the proposal to partially amend the Business Integrity Procedures and Behaviors.
16. Approved the financing of the re-investment company through the issue of a Company Letter of
Support.
17. Approved the Company financing authorization from the financial institute.
2015.11.12
1. Approve of management changes.
2. Approved the 2014 employee bonus.
3. Approved the 2015 year-end bonus (estimated).
4. Approved the cancellation of restricted employee warrant shares where conditions had not been
met by the intended employee.
5. Approved the proposal to partially amend the Board of Directors Meeting Guidelines.
6. Approved the proposal to partially amend the Procedures of Application to Suspend and Resume
Trading.
7. Approved the proposal of the 2016 audit plan.
8. Approved for the financing of re-investment company through the issuance of the Company’s
Letter of Support.
9. Approved the Company financing authorization from the financial institute.
2016.2.24
1. Approve of management changes.
2. Approved the proposal to partially amend the Articles of Incorporation.
3. Approved the proposal to partially amend the 2015 Statement of the Internal Control System.
4. Approved the cancellation of restricted employee warrant shares where conditions had not been
met by the intended employee.
5. Approved Company financing authorization from the financial institute.
2016.3.30
1. Approved the 2015 employee, director, and supervisor compensation.
2. Approved the distribution of the first 2016 mid-year bonus (Dragon Boat Festival).
3. Approved salary adjustment.
4. Approved the 2015 consolidated and individual financial statements.
5. Approved the evaluation of the independence and suitability of the Company CPA.
6. Approved the call for the 2016 shareholder’s meeting.
7. Approved the 2016 CSR goal.
8. Approved Company financing authorization from the financial institute.
2016.5.11
1. Approved the appointment of the manager.
2. Approved the change of CPA.
3. Approved the evaluation of the independence and suitability of the Company CPA.
4. Approved the 2015 operation report.
5. Approved the 2016 operation plan.

60
Date Major resolutions
6. Approved the 2015 distribution of earnings.
7. Approved capital surplus to shareholders.
8. Approved the proposal to partially amend the Articles of Incorporation.
9. Resolved to remove non-competition for directors and managers.
10. Approved the 2016 appropriation of directors and employees compensation ratio.
11. Approved the cancellation of restricted employee warrant shares where conditions had not been
met by the intended employee.
12. Approved and authorized the re-investment company to name after Compal.
13. Approved Company financing authorization from the financial institute.
3.3.12 Major Issues of Record or Written Statements Made by Any Director or Supervisor Dissenting
to Important Resolutions Passed by the Board of Directors: None.
3.3.13 Resignation or Dismissal of the Company’s Key Individuals, Including the Chairman, CEO,
and Heads of Accounting, Finance, Internal Audit and R&D: None.
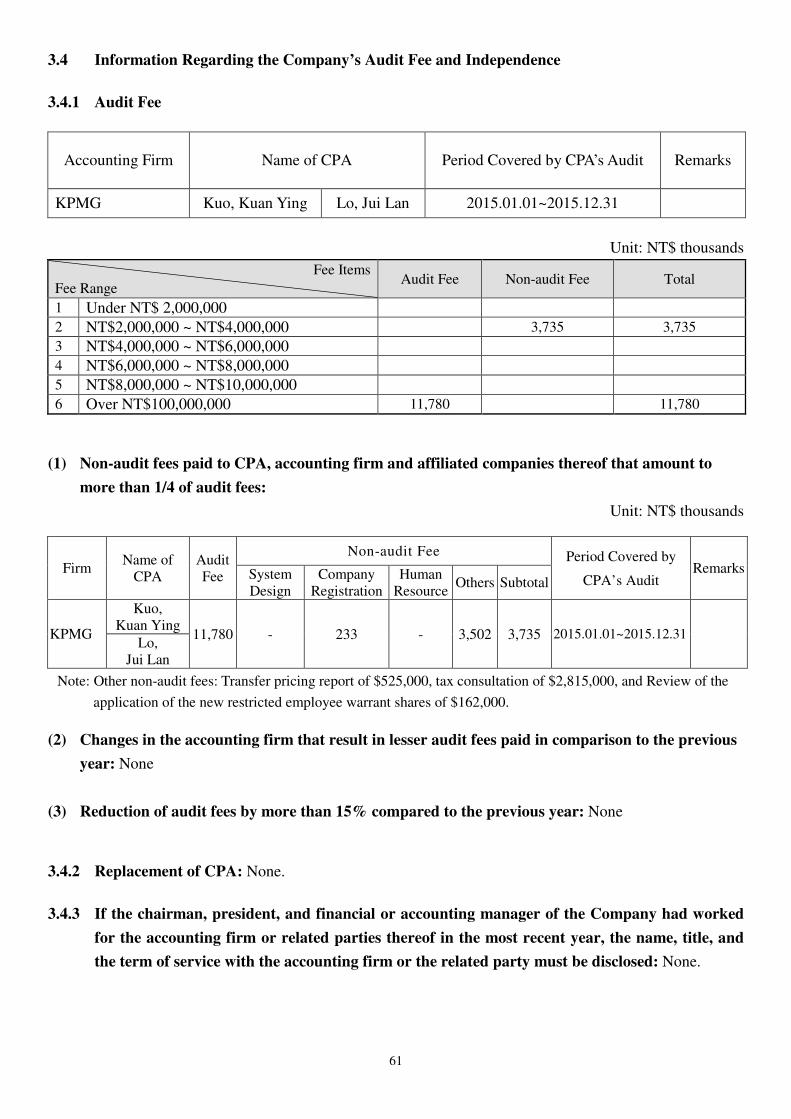
61
3.4 Information Regarding the Company’s Audit Fee and Independence
3.4.1 Audit Fee
Unit: NT$ thousands
Fee Items
Fee Range Audit Fee Non-audit Fee Total
1 Under NT$ 2,000,000
2 NT$2,000,000 ~ NT$4,000,000 3,735 3,735
3 NT$4,000,000 ~ NT$6,000,000
4 NT$6,000,000 ~ NT$8,000,000
5 NT$8,000,000 ~ NT$10,000,000
6 Over NT$100,000,000 11,780 11,780
(1) Non-audit fees paid to CPA, accounting firm and affiliated companies thereof that amount to
more than 1/4 of audit fees:
Unit: NT$ thousands
Note: Other non-audit fees: Transfer pricing report of $525,000, tax consultation of $2,815,000, and Review of the
application of the new restricted employee warrant shares of $162,000.
(2) Changes in the accounting firm that result in lesser audit fees paid in comparison to the previous
year: None
(3) Reduction of audit fees by more than 15% compared to the previous year: None
3.4.2 Replacement of CPA: None.
3.4.3 If the chairman, president, and financial or accounting manager of the Company had worked
for the accounting firm or related parties thereof in the most recent year, the name, title, and
the term of service with the accounting firm or the related party must be disclosed: None.
Accounting Firm Name of CPA Period Covered by CPA’s Audit Remarks
KPMG Kuo, Kuan Ying Lo, Jui Lan 2015.01.01~2015.12.31
Firm Name of
CPA Audit Fee
Non-audit Fee Period Covered by
CPA’s Audit Remarks System
Design Company
Registration Human
Resource Others Subtotal
KPMG
Kuo, Kuan Ying
11,780 - 233 - 3,502 3,735 2015.01.01~2015.12.31 Lo,
Jui Lan

62
3.5 Changes in Shareholding of Directors, Supervisors, Managers and Major Shareholders
Unit: shares
Title Name
2015 Up till April 26, 2016
Shares held
Increase (Decrease)
Shares pledged
Increase (Decrease)
Shares held
Increase (Decrease)
Shares pledged
Increase (Decrease)
Chairman Sheng-Hsiun Hsu 0 0 0 0
Director and President
Jui-Tsung Chen 0 0 0 0
Director Wen-Being Hsu 0 0 0 0
Director Kinpo Electronics , Inc.
0 0 0 0
Director
Representative: Shyh-Yong Shen
0 0 0 0
Charng-Chyi Ko 0 0 0 0
Director Sheng-Chieh Hsu 0 650,000 0 0
Director Yen-Chia Chou 0 2,224,000 0 0
Director and Executive Vice
President Wen-Chung Shen (800,000) 0 0 0
Director and Executive Vice
President Yung-Ching Chang (540,000) 0 (99,000) 0
Director and Executive Vice
President Chung-Pin Wong 0 0 0 0
Director Chiung-Chi Hsu 0 0 0 0
Director and Executive Vice
President Chao-Cheng Chen (3,000,000) 0 0 0
Independent Director Min Chih Hsuan 0 0 0 0
Independent Director Duei Tsai 0 0 0 0
Independent Director Duh Kung Tsai 0 0 0 0
Vice Chairman and Senior Advisor
Medica, John Kevin (1,530,000) 0 - -
Director Sean Martin Maloney 0 0 - -
Executive Vice President
Chen-Chang Hsu 0 0 0 0
Senior Vice President Chun-De Shen 0 0 0 0
Senior Vice President Kuo-Chuan Chen 0 0 0 0
Senior Vice President Pei-Yuan Chen 0 0 0 0
Senior Vice President Chiu-Rui Wei (220,000) 0 (20,000) 0
Senior Vice President Ying Chang 0 0 0 0
Senior Vice President Ming-Hsing Hsu 0 0 0 0
Senior Vice President Sheng-Hua Peng 0 0 0 0
Senior Vice President Wen-Da Hsu (27,000) 0 0 0
Senior Vice President Wei-Cheng Chen (10,000) 0 0 0
Senior Vice President Ming-Chih Chang - - 1,900,000 0
Vice President Chih-Chuan Cheng 0 0 0 0
Vice President and head of finance
Ching-Hsiung Lu (19,000) 0 0 0
Vice President Shih-Tung Wang 0 0 0 0
Vice President Bo-Hsiung Chang 0 0 0 0
Vice President Tian-Yuan Tsai 0 0 0 0

63
Title Name
2015 Up till April 26, 2016
Shares held Increase
(Decrease)
Shares pledged Increase
(Decrease)
Shares held Increase
(Decrease)
Shares pledged Increase
(Decrease)
Vice President Bo-Tang Wang 0 0 0 0
Vice President Hsi-Kuan Chen 0 0 0 0
Vice President Zong-Ming Wang (20,000) 0 (10,000) 0
Vice President Fu-Chuan Chang (10,000) 0 0 0
Vice President Chi-Hsiang Ma (20,000) 0 (30,000) 0
Vice President Yung-Nan Chang 0 0 0 0
Vice President Sheng-Hung Li (36,000) 0 0 0
Vice President Yung-He Su 0 0 0 0
Vice President Ming-Hsiang Kan 0 0 0 0
Vice President Chih-Hsien Liang 0 0 0 0
Vice President Lung-Hua Shen 0 0 0 0
Vice President Ming-Dong Weng 0 0 0 0
Vice President Yue-Chun Li 0 0 0 0
Vice President Chiao-Lieh Huang (380,000) 0 0 0
Vice President Chung-Hsing Tan (280,000) 0 0 0
Vice President Yi-Yun Chang (190,000) 0 0 0
Vice President Hsin-Kung Mao 0 0 0 0
Vice President Ling-Sheng Wu (15,000) 0 0 0
Vice President Hsin-Hsiung Huang 0 0 0 0
Senior Vice President Shih-Hung Huang - - 0 0
Senior Vice President Yi-Chiang Chiu - - 0 0
Vice President Ching-Fa Li - - 0 0
Vice President Bo-Heng Chen - - 0 0
Vice President Jui-Chun Hsu - - - -
Head of Audit Bo-Wen Hsieh 0 0 0 0
Vice President Ming-Sung Lin 0 0 - -
Vice President Meng-Hsiung Nieh 0 0 - -
Vice President Chin-Wen Liao 0 0 0 0
Note: 1.The Company elected three independent directors and replaced the supervisors with an Audit Committee after the 2015
shareholders’ meeting resolution. The original supervisors: Charng-Chyi Ko, Sheng-Chieh Hsu, Yen-Chia Chou, and directors
Medica, John Kevin, and Sean Martin Maloney resigned in June 26, 2015.
2. In 2015, the following three persons Medica, John Kevin, Senior Advisor, Ming-Sung Lin, Vice President and Meng-Hsiung
Nieh, Vice President, left the Company. In 2016, the following five, Ming-Chih Chang, Senior Vice President; Shih-Hung
Huang, Vice President; Yi-Chiang Chiu, Vice President; Ching-Fa Li, Vice President and Bo-Heng Chen, Vice President,
were called back or promoted. Jui-Chun Hsu, Vice President took office and Chin-Wen Liao, Vice President resigned.
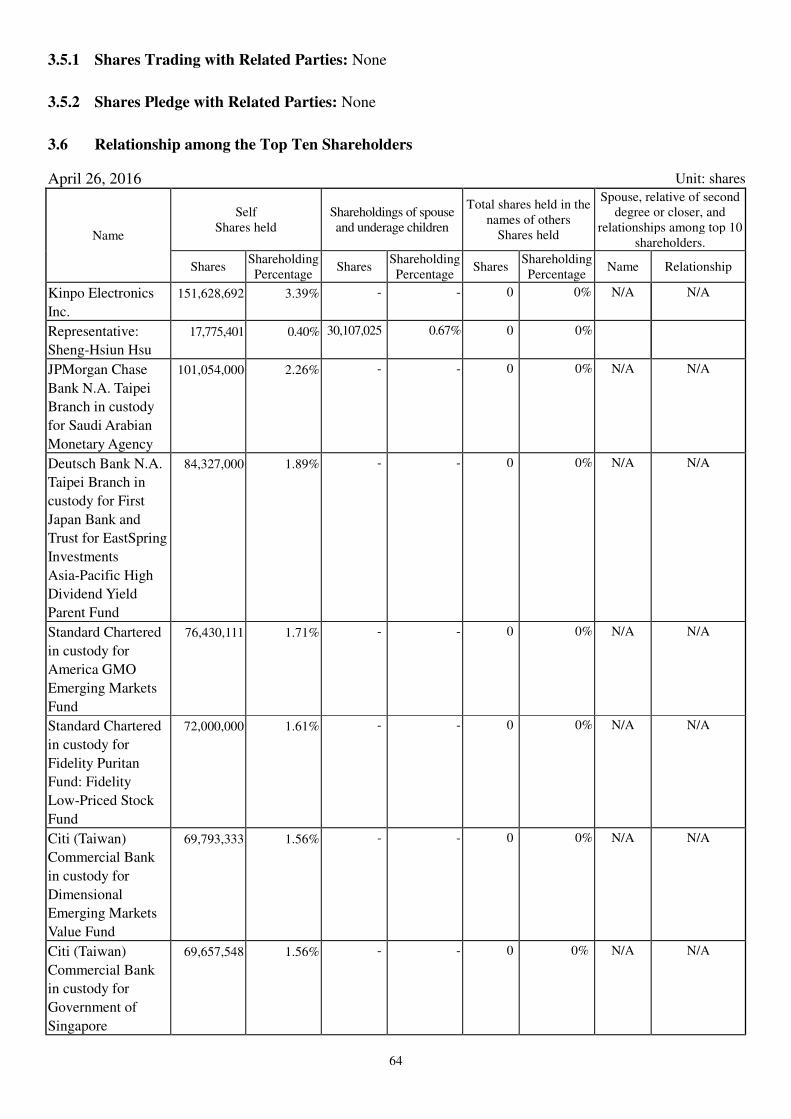
64
3.5.1 Shares Trading with Related Parties: None
3.5.2 Shares Pledge with Related Parties: None
3.6 Relationship among the Top Ten Shareholders
April 26, 2016 Unit: shares
Name
Self Shares held
Shareholdings of spouse and underage children
Total shares held in the names of others
Shares held
Spouse, relative of second degree or closer, and
relationships among top 10 shareholders.
Shares Shareholding Percentage
Shares Shareholding Percentage
Shares Shareholding Percentage
Name Relationship
Kinpo Electronics
Inc.
151,628,692
3.39%
-
-
0
0%
N/A N/A
Representative:
Sheng-Hsiun Hsu
17,775,401 0.40% 30,107,025 0.67% 0 0%
JPMorgan Chase
Bank N.A. Taipei
Branch in custody
for Saudi Arabian
Monetary Agency
101,054,000 2.26% - - 0 0% N/A N/A
Deutsch Bank N.A.
Taipei Branch in
custody for First
Japan Bank and
Trust for EastSpring
Investments
Asia-Pacific High
Dividend Yield
Parent Fund
84,327,000 1.89% - - 0 0% N/A N/A
Standard Chartered
in custody for
America GMO
Emerging Markets
Fund
76,430,111 1.71% - - 0 0% N/A N/A
Standard Chartered
in custody for
Fidelity Puritan
Fund: Fidelity
Low-Priced Stock
Fund
72,000,000 1.61% - - 0 0% N/A N/A
Citi (Taiwan)
Commercial Bank
in custody for
Dimensional
Emerging Markets
Value Fund
69,793,333 1.56% - - 0 0% N/A N/A
Citi (Taiwan)
Commercial Bank
in custody for
Government of
Singapore
69,657,548 1.56% - - 0 0% N/A N/A

65
Name
Self Shares held
Shareholdings of spouse and underage children
Total shares held in the names of others
Shares held
Spouse, relative of second degree or closer, and
relationships among top 10 shareholders.
Shares Shareholding Percentage
Shares Shareholding Percentage
Shares Shareholding Percentage
Name Relationship
Standard Chartered
in custody for
Vanguard Stock
Index Fund
67,174,629 1.50% - - 0 0% N/A N/A
FuBon Insurance 64,200,991 1.44% - - 0 0% N/A N/A
Representative:
Ben-Yuan Zhang
0 0% 0 0% 0 0%
HSBC in custody
for Puxin insurance
Co.
61,109,000 1.37% - - 0 0% N/A N/A

66
3.7 Ownership of Shares in Affiliated Enterprises
December 31, 2015 Unit: shares; %
Investees (Note 1)
Invested by the Company
Held by directors,
supervisors, managers, and
directly/indirectly
controlled entities
Aggregate investment
Shares Shareholding
percentage Shares
Shareholding
percentage Shares
Shareholding
percentage
Arcadyan Technology Corp. 41,304,504 21.84 27,260,648 14.41 68,565,152 36.25
Panpal Technology Corp. 500,000,000 100.00 - - 500,000,000 100.00
Henghao Technology Co., Ltd. 317,310,462 96.98 - - 317,310,462 96.98
Zhaopal Investment Co., Ltd. 200,100,000 100.00 - - 200,100,000 100.00
Yongpal Investment Co., Ltd. 175,100,000 100.00 - - 175,100,000 100.00
Hong Ji Capital Co., Ltd. 100,000,000 100.00 - - 100,000,000 100.00
Gempal Technology Corp. 90,000,000 100.00 - - 90,000,000 100.00
Kaipal Investment Co., Ltd. 75,100,000 100.00 - - 75,100,000 100.00
Hong Jin Investment Co., Ltd. 29,500,000 100.00 - - 29,500,000 100.00
Rayonnant Technology Holdings
Limited 29,500,000 100.00 - - 29,500,000 100.00
Compal Broadband Networks, Inc. 16,953,810 51.37 15,649,670 47.42 32,603,810 98.79
Crownpo Technology Inc. 3,738,668 33.23 6,243,790 55.49 9,982,458 88.72
Kinpo Group Management
Consultant Company 300,000 37.50 300,000 37.50 600,000 75.00
Allied Circuit Co., Ltd. 10,157,730 20.42 8,197,152 16.47 18,354,882 36.89
Infinno Technology Corp. 10,983,719 41.03 - - 10,983,719 41.03
Lead-Honor Optronics Co., Ltd. 2,772,000 42.00 - - 2,772,000 42.00
Accesstek Inc. 899,160 27.78 319,707 9.88 1,218,867 37.66
Maxima Ventures I, Inc. 126,000 22.55 1,080 0.46 127,080 23.01
Ripal Optoelectronics Co., Ltd. 6,000,000 100.00 - - 6,000,000 100.00
Core Profit Holdings Ltd. 147,000,000 100.00 - - 147,000,000 100.00
Flight Global Holding Inc. 89,755,495 100.00 - - 89,755,495 100.00
Just International Ltd. 48,010,000 100.00 - - 48,010,000 100.00
High Shine Industrial Corp. 42,700,000 100.00 - - 42,700,000 100.00
Compal International Holding Co.,
Ltd. 46,901,000 100.00 - - 46,901,000 100.00
Big Chance International Co., Ltd. 90,820,000 100.00 - - 90,820,000 100.00
Compal Rayonnant Holdings
Limited 12,500,000 100.00 - - 12,500,000 100.00
Auscom Engineering Inc. 3,000,000 100.00 - - 3,000,000 100.00
Lipo Holding Co., Ltd. 98,000 49.00 102,000 51.00 200,000 100.00

67
Investees (Note 1)
Invested by the Company
Held by directors,
supervisors, managers, and
directly/indirectly
controlled entities
Aggregate investment
Shares Shareholding
percentage Shares
Shareholding
percentage Shares
Shareholding
percentage
Compal Europe (Poland) Sp. z o.o. 136,080 100.00 - - 136,080 100.00
Bizcom Electronics, Inc. 100,000 100.00 - - 100,000 100.00
Compal Electronics (Holding) Ltd. 1,000 100.00 - - 1,000 100.00
Ascendant Private Equity
Investment Ltd. 31,253,125 34.72 37,250,000 41.39 68,503,125 76.11
Gallery Management Ltd. 3,828,577 41.12 - - 3,828,577 41.12
Compalead Electronics B.V. 6,426,516 100.00 - - 5,030,000 100.00
Etrade Management Co., Ltd. 46,900,000 100.00 - - 46,900,000 100.00
Webtek Technology Co., Ltd. 100,000 100.00 - - 100,000 100.00
Forever Young Technology Inc. 50,000 100.00 - - 50,000 100.00
Unicom Global, Inc. 10,000,000 100.00 - - 10,000,000 100.00
Huang Feng Communication Co.,
Ltd. 10,000,000 100.00 - - 10,000,000 100.00
Avalue Technology Inc. 14,560,070 21.31 701,000 1.03 15,261,070 22.34
Mactech Co., Ltd. 21,756,192 52.88 274,954 0.67 22,031,146 53.55
General life Biotechnology Co.,
Ltd. 15,000,000 50.00 - - 15,000,000 50.00
Note: The above investments have been accounted using the equity method.

68
IV. Capital Overview
4.1 Capital and Shares
4.1.1 Source of Capital
May 11, 2016
Year Month Issuance
Price
Authorized capital Paid-up capital Remarks
Shares Amount (NTD) Shares Amount (NTD) Source of capital Paid in properties
other than cash Others
2013 9 10 6,000,000,000 60,000,000,000 4,412,791,725 44,127,917,250 Exercise of employee warrants totaling NTD 1,391,000 N/A Change of capital approved by the Ministry of Economic Affairs on October 21, 2013
2013 11 10 6,000,000,000 60,000,000,000 4,413,154,825 44,131,548,250 Exercise of employee warrants totaling NTD 3,631,000 N/A Change of capital approved by the Ministry of Economic Affairs on December 17, 2013
2014 2 10 6,000,000,000 60,000,000,000 4,413,624,425 44,136,244,250 Exercise of employee warrants totaling NTD 4,696,000 N/A Change of capital approved by the Ministry of Economic Affairs on March 5, 2014
2014 5 10 6,000,000,000 60,000,000,000 4,413,851,825 44,138,518,250 Exercise of employee warrants totaling NTD 2,274,000 N/A Change of capital approved by the Ministry of Economic Affairs on May 26, 2014
2014 8 10 6,000,000,000 60,000,000,000 4,416,128,625 44,161,286,250 Exercise of employee warrants totaling NTD 22,768,000 N/A Change of capital approved by the Ministry of Economic Affairs on August 29, 2014
2014 11 10 6,000,000,000 60,000,000,000 4,421,210,025 44,212,100,250 Exercise of employee warrants totaling NTD 50,814,000 N/A Change of capital approved by the Ministry of Economic Affairs on December 8, 2014
2015 1 10 6,000,000,000 60,000,000,000 4,423,236,625 44,232,366,250 Exercise of employee warrants totaling NTD 20,266,000 N/A Change of capital approved by the Ministry of Economic Affairs on February 10, 2015
2015 2 10 6,000,000,000 60,000,000,000 4,472,596,625 44,725,966,250 Issuance of employees’ restricted shares NTD493,600,000 N/A Change of capital approved by the Ministry of Economic Affairs on March 23, 2015
2015 8 10 6,000,000,000 60,000,000,000 4,472,196,625 44,721,966,250 Cancellation of Restricted Employee Shares of $4,000,000 N/A Change of capital approved by the Ministry of Economic Affairs on September 2, 2015
2015 9 10 6,000,000,000 60,000,000,000 4,471,126,625 44,711,266,250 Cancellation of Restricted Employee Shares of $10,700,000 N/A Change of capital approved by the Ministry of Economic Affairs on December 11, 2015
105 2 10 6,000,000,000 60,000,000,000 4,470,636,625 44,706,366,250 Cancellation of Restricted Employee Shares of $4,900,000 N/A Change of capital approved by the Ministry of Economic Affairs on March 14, 2016
Share
Type
Authorized capital Remarks
Outstanding shares (public listed) Unissued shares Total
Ordinary
shares 4,470,636,625(Note) 1,529,363,375 6,000,000,000
Approved to include 100,000,000 shares of employees shares and corporate bonds with warrant in capital.
Note: Unconcealed restricted employee shares (RSA) are150, 000 shares.
■Shelf registration system information: None

69
4.1.2 Status of Shareholders
As of 4/26/2016
4.1.3 Share Ownership Distribution
As of 4/26/2016
4.1.4 List of Major Shareholders
As of 4/26/2016
Shares Shareholder’s name
Number Percentage (%)
Kinpo Electronics Inc. 151,628,692 3.39%
JPMorgan Chase Bank N.A. Taipei Branch in custody for Saudi Arabian Monetary Agency
101,054,000 2.26%
Deutsch Bank N.A. Taipei Branch in custody for First Japan Bank and Trust for EastSpring Investments Asia-Pacific High Dividend Yield Parent Fund
84,327,000 1.89%
Standard Chartered in custody for America GMO Emerging Markets Fund 76,430,111 1.71%
Standard Chartered in custody for Fidelity Puritan Fund: Fidelity Low-Priced Stock Fund
72,000,000 1.61%
Citi (Taiwan) Commercial Bank in custody for Dimensional Emerging Markets Value Fund
69,793,333 1.56%
Citi (Taiwan) Commercial Bank in custody for Government of Singapore 69,657,548 1.56%
Standard Chartered in custody for Vanguard Stock Index Fund 67,174,629 1.50%
FuBon Insurance 64,200,991 1.44%
HSBC in custody for Puxin insurance Co. 61,109,000 1.37%
Item Government
Agencies Financial
Institutions Other
Institutions
Foreign Institutions &
Natural Persons
Domestic Natural Persons
Treasury stocks
Total
Number of Shareholders
3 52 251 1,003 162,408 1 163,718
Shareholding (shares)
8 302,805,115 350,914,612 2,356,919,232 1,416,031,658 43,966,000 4,470,636,625
Percentage 0.00% 6.77% 7.85% 52.73% 31.67% 0.98% 100.00%
Range of Shareholding (Unit: Shares)
Number of Shareholders
Shareholding (Shares) Percentage
1 ~ 999 51,812 10,239,882 0.23%
1,000 ~ 5,000 72,495 165,127,083 3.69%
5,001 ~ 10,000 19,442 139,601,274 3.12%
10,001 ~ 15,000 6,894 82,684,054 1.85%
15,001 ~ 20,000 3,492 62,704,249 1.40%
20,001 ~ 30,000 3,384 83,427,922 1.87%
30,001 ~ 40,000 1,543 54,172,077 1.21%
40,001 ~ 50,000 940 42,989,105 0.96%
50,001 ~ 100,000 1,778 124,592,375 2.79%
100,001 ~ 200,000 854 118,701,365 2.66%
200,001 ~ 400,000 407 113,883,268 2.55%
400,001 ~ 600,000 156 76,766,032 1.72%
600,001 ~ 800,000 88 61,783,918 1.38%
800,001 ~ 1,000,000 55 49,188,160 1.10%
1,000,001 and over 378 3,284,775,861 73.47%
Total 163,718 4,470,636,625 100.00%

70
4.1.5 Market Price, Net Worth, Earnings, and Dividends per Share
Year
Measurement 2014 2015
Year-to-date
March 31, 2016
Per-share
market
price
High 30.00 29.30 21.50
Low 19.40 15.10 16.55
Average 23.03 22.23 19.21
Per-share
net worth
(Note 2)
Before dividend 23.42 23.71 23.92
After dividend 21.88 22.49 -
Earnings
per share
Before
adjustment
Weighted
average
outstanding
shares
4,312,853,801 4,329,403,194 4,329,403,194
Earnings per
share 1.63 2.01 0.37
After
adjustment
Weighted
average
outstanding
shares
4,312,853,801 4,329,403,194 -
Earnings per
share 1.63 2.01 -
Per-share
dividend
Cash dividends 1.50 1.20 -
Stock
dividends
From
earnings - - -
From capital
reserves - - -
Cumulative unpaid
dividends - - -
Analysis
of
investment
returns
P/E ratio 14.13 11.06 -
Price to dividends ratio 15.35 18.53 -
Cash dividend yield 6.51% 5.40% -
Note: 1. The 2015 distribution of earning was resolved at the May 11, 2016, Board of Directors’ meeting and will be
submitted to the 2016 shareholders’ meeting for final approval.
2. Starting January 1, 2015, the Company adopted the 2013 version of the International Financial Reporting
Standards endorsed by the Financial Supervisory Commission of the ROC. The consolidated financial
statement is presented with retrospective adjustments effective as of January 1, 2014.

71
4.1.6 Dividend Policy and Implementation Status
(1) Dividend Policy
When the Company makes a profit during the year, 10% of annual net income after appropriating income tax
expense, offsetting any prior deficit, is to be set aside as legal reserve and a special reserve is set aside or reserved in
accordance with the laws and regulations, and an amount less than 2% of the balance is appropriated as remuneration
for the directors and supervisors, and more than 2% as an employee bonus. The balance of earning available for
distribution is composed of the remainder of the said profit and the retained earnings from prior years. The earnings
appropriation, distribution of dividends and bonuses shall be proposed by the Board of Directors and approved at a
Shareholders’ Meeting. The rest of the unappropriated retained earning shall be reserved.
The company is in a growth period of its life cycle. Therefore, for the consideration of future capital needs and to
meet cash flow needs of its shareholders, the Company’s distribution of cash dividend, after closing and has
distribution of earning, shall not be less than 10% of the total of cash and stock dividends.
Although a dividend ratio has not been set in the Company articles of incorporation, the Company shall not
appropriate less than 30% of its income after tax for dividends, after taking into account factors such as the Company
capital needs, the capital budget, long term financial plans, domestic and international competition and the interests of
the shareholders. The board of directors proposed the distribution of earnings and submitted them to the shareholders’
meeting for approval.
As amended by Company Law in May 2015, the employee bonus and directors compensation are no longer part
of the distribution of earnings items. The Company will amend the articles of incorporation prior to the deadline as set
down by the regulations.
(2) Proposed Distribution of Dividend
� The proposed 2015 distribution of earning of shareholders’ dividend in the amount of NTD $4,426,670,625 will
be discussed at the 2016 shareholders’ meeting. The aforementioned amount is set to be distributed as an all cash
dividend of $1 per share and incurred capital surplus generated from the excess of the issuance price over the par
value of the capital stock in the amount of NTD $885,334,125, or NTD $0.2 per share. The total cash distribution
amounts to NTD $5,312,004,750.
� Should the Company decide to buy back/recover outstanding shares, transfer treasury stock to employees, reduce
share capital or in any other way alter the number of outstanding shares sometime later, the Board of Directors
shall be authorized to adjust the payment rate of cash dividends and cash capital surplus as deemed necessary at
its discretion.

72
(3) Impact to 2015 Business Performance and EPS resulting from Stock Dividend Distribution:
Not Applicable
4.1.7 Employees’ and Directors’ Compensation
(1) Employees’ directors’ compensation policies as stated in the Articles of Incorporation
The Company has approved the amendment to “Article of Incorporation” by Borad of Directors, and will submit
to discuss in 2016 shareholders’ meeting. According to the amended Articles of Incorporation of the Company, if
there is any profit in a fiscal year, the Company’s pre-tax profits in such fiscal year, prior to deduction of
compensation to employees and directors, shall be distributed to employees as compensation in an amount of
not less than two percent (2%) thereof and to directors as compensation in an amount of not more than two
percent (2%) of such profits. In the event that the Company has accumulated losses, the Company shall reserve
an amount to offset accumulated losses. The compensation to employees as mentioned above may be distributed
in the form of stock or cash. Employees entitled to receive the said stock or cash may include the employees of
the Company’s subordinate companies pursuant to the Company Act.
(2) Basis for estimating employees’ and directors’ compensation and stock dividends, and accounting treatments for
any discrepancies between the amounts estimated and the amounts paid.
� Compensation to directors and employees, as denoted in the Articles of Incorporations, shall be estimated
based on income before tax prior to the subtraction of directors and employees compensation during the
current year and multiplied by the ratio as denoted in the Article of Incorporation (shall not be more than
2% or less than 2% of the remainder, respectively.)
� If the compensation approved for distribution to employees is to be in the form of common shares, the
number of shares is determined by dividing the amount of the compensation by the closing price of the
shares on the day preceding the Board of Directors’ meeting.
� If the actual amounts differ from the amounts estimated, the differences are recorded as gains/losses in the
subsequent year as a change in accounting estimate.
(3) 2015 employees compensation proposal passed by the board of directors
� Accrued directors and employees compensation amount to NTD $50,233,972 and NTD $949,980,218,
respectively.
� If the estimated distribution amount differs from the amounts estimated in accrued expense, the variance,
reason and resolution should be disclosed: No variance.
� The proposed distribution of employee stock compensation, and the size of such an amount as a percentage
of the sum of the after-tax net income stated in the individual financial reports for the current period and
total employee compensation: Not applicable (no employee stock compensation).
(4) Actual distribution of 2014 employee bonus and directors’/supervisors’ remuneration:
� The directors and supervisors compensation is NTD $49,379,245 and the employee bonus is NTD
$895,790,158.
� The 2014 actual distribution of employee bonus and directors and supervisors compensation was approved
at the 2015 shareholders’ meeting and remained as proposed by the board of directors.

73
4.1.8 Buyback of Treasury Stock
May 11, 2016
Time of buyback 6th
Purpose of buyback Transfer of shares to employees
Buyback period From March 26, 2013
until May 25, 2013
Buyback price range NTD 18.27 ~ NTD 31.04 (Note 1)
Types and numbers of shares bought back 58,516,000 ordinary shares
Value of shares bought back NTD 1,126,478,345
Number of shares retired and transferred 14,700,000 shares
Cumulative holding of own shares 43,816,000 shares
Cumulative holding of own shares as a percentage to total
outstanding shares (%) 0.98% (Note 2)
Note: 1. The Company will continue buying back shares even if the share price falls below the specified minimum. 2. Calculations were based on share capital registered with the Ministry of Economic Affairs as at May 11, 2016.
4.2 Bonds: None
4.3 Global Depository Receipts
Date of issue:
Details November 9, 1999 May 21, 2001
Issuance and trading location Luxembourg Luxembourg
Total sum issued USD 122,160,000 USD 174,816,000
Issuance price per unit USD 15.27 USD 6.07
Number of units issued 8,000,000 units 28,800,000 units
Source of represented securities Participating shareholder(s):
Kinpo Electronics, Inc.
1. Participating shareholder(s):
44,000,000 shares contributed by
(1) Kinpo Electronics, Inc.
(2) Panpal Technology Corporation
(3) Gempal Technology Corporation
2. New cash issue of Compal shares:
1,000,000,000 shares
Quantity of represented
securities
40,000,000 ordinary shares of Compal
Electronics
144,000,000 ordinary shares of Compal
Electronics
GDR holders’
rights and obligations
1. Voting rights:
According to the terms of the depository agreement and the laws of the
Republic of China, the beneficiary certificate holder is entitled to the voting
rights of shares represented under the beneficiary certificate.
2. Rights to dividend distribution, share subscription and other rights:
Unless otherwise specified in the agreement, the GDR carries identical rights as
do ordinary shares
Trustee N/A N/A
Depository bank The Bank of New York The Bank of New York
Custodian Mega International Commercial Bank Mega International Commercial Bank
Unredeemed balance 3,753,553 units (May 11, 2016)

74
Date of issue:
Details November 9, 1999 May 21, 2001
Allocation of expenses incurred
at issuance and over the duration Borne by participating shareholder(s)
Allocated proportionally between the
Company and participating shareholders
Key terms of the depository and
custodian agreements See descriptions below
Per
Unit
Market
Price
2015
High USD $4.63
Low USD $2.33
Average USD $3.52
Year-to-date
May 11, 2016
High USD $3.27
Low USD $2.53
Average USD $2.92
4.4 Employee Warrants: None
4.5 Subscription of New Shares by Employees and Restricted Shares
4.5.1 Issuance of Restricted Employee Shares
May 11, 2016
Type of restricted employee shares 2014 1st issue
New restricted employee shares Effective date of application October 30, 2014 Date of issue: February 25, 2015 Number of new restricted employee shares issued
49,360,000 shares
Issue price NTD 0 (issued without subscription) New restricted shares issued as a percentage to total outstanding shares
1.10% (Note)
Criteria of entitlement to restricted employee shares
1. Employees may receive the following percentages of the restricted shares they have been allocated, if they remain employed by the Company after the duration specified below and satisfy their target performance appraisals (i.e. a performance grade of B or higher in the latest year before the duration is due). However, the actual percentage of shares entitled to employees will be subject to the Company’s performance criteria, as calculated in Subparagraph 2 of this Paragraph. After 2 years: 40% After 3 years: 30% After 4 years: 30%
2. The Company’s performance criteria is calculated based on the weighted score of net income and ROE taken from the latest full-year consolidated financial statements before the duration is due. The following performance criteria applies: A. Net Income: increase by 10% or more compared to the Company’s
3-year average B. Return on equity (ROE): surpass the Company’s 3-year average
Net income is defined as: “current net profit attributable to parent company shareholders” as shown in audited financial statements; whereas ROE is defined as: “current net profit attributable to parent company shareholders” divided by “equity attributable to parent company shareholders” as shown in audited financial statements.
To align the interests of employees who have participated in this program and the interests of shareholders, the two performance indicators above are each assigned a 50% weight. If indicators A and B are both achieved, employees will be entitled to receive the full percentage mentioned in Subparagraph 1 of this Paragraph. If only A or

75
Type of restricted employee shares 2014 1st issue
New restricted employee shares B is achieved, employees will be entitled to receive half the percentage mentioned in Subparagraph 1 of this Paragraph.
Restricted rights to restricted employee shares
1. Employees may not sell, pledge, transfer, gift, charge or in any way dispose the restricted shares for the duration of entitlement.
2. For citizens of the Republic of China, any restricted employee shares received must be placed immediately under the custody of a custodian appointed by the Company. Employees may not request to collect restricted shares for any reason or through any means. For employees of all other nationalities, any restricted employee shares received will be placed under the custody of a custodian bank.
3. Restricted employee shares may be allocated cash and stock dividends for the duration of entitlement. Any cash or stock dividends allocated on restricted shares will be transferred from the custodian account to employees’ personal accounts on the date of distribution.
Custody of restricted employee shares
Held in trust
If the criteria of entitlement is not met after employees are allocated or have subscribed to restricted shares
1. Once employees have been allocated restricted shares, the Company may recover and retire restricted shares that have yet to satisfy their criteria of entitlement, or from employees who have committed severe mistakes or violations against their employment contracts or work rules, or from those who have willingly surrendered entitlement of restricted employee shares in writing.
2. The Company may recover allocated but unreceived shares from employees who resign, retire, or are dismissed, made redundant, or decease for causes unrelated to occupational hazards within 4 years after the date of distribution.
3. The Company will recover (without compensation) allocated shares from employees who violate the terms of issuance before the criteria of entitlement is met.
4. The Company will recover (without compensation) allocated shares that fail to meet the required criteria over the duration of entitlement. In which case, the Company shall instruct the custodian institution or custodian bank to complete book-entry transfers at least 15 business days before the book closure date of any stock dividend/cash dividend/cash issue.
Number of restricted employee shares recovered
2,110,000 shares
Number of restricted shares with restrictions removed
0 shares
Number of restricted shares with restrictions intact
47,250,000 shares
Number of restricted shares with restrictions remaining as a percentage to total outstanding shares (%)
1.06% (Note)
Impacts on shareholders’ equity
Possible expenses: A total of 49,360,000 restricted shares have been issued; the issuance price per share is NTD 0. The fair value of shares is measured on the day they are distributed; expenses shall be recognized over the duration of entitlement. If all criteria is met, total expenses of this restricted share scheme should approximate to NTD 1,112,430,000; of which NTD 400,262,000 is recognized in 2015, NTD 411,069,000 in 2016, NTD 206,852,000 in 2017, NTD 89,546,000 in 2018, and NTD 4,701,000 in 2019. Dilution of EPS and other impacts on shareholders' equity: Based on the 4,470,636,625 shares outstanding as at May 11, 2016, the restricted share scheme, once expensed, should dilute earnings per share by NTD 0.09 in 2015, NTD 0.09 in 2016, NTD 0.05 in 2017, NTD 0.02 in 2018, and NTD 0.00 in 2019. This issue produced limited dilutive effects on the Company's EPS, and hence should not cause any significant impacts on shareholders' equity.
Note: Calculations were based on share capital registered with the Ministry of Economic Affairs as at May 11, 2016

76
4.5.2 Information on Name of Managers and Top 10 Employees obtaining Restricted Employee Shares
May 11, 2016
Title Name
Number of
new restricted
shares
acquired as an
employee
(shares)
New restricted
shares acquired
as a percentage to
total outstanding
shares
(Note 1)
Restrictions removed Restrictions intact
Number of
restricted
shares with
restrictions
removed
(shares)
Issuance
Price
(NTD)
Issuance
Amount
(NTD)
Number of
restricted shares
with restrictions
removed as a
percentage of total
outstanding shares
(Note 1)
Number of
restricted
shares with
restrictions
intact
(shares)
Issuance
Price
(NTD)
Issuance
Amount
(NTD)
Number of
restricted shares
with restrictions
intact as a
percentage of total
outstanding shares
(Note 1)
Managers
33 persons (Note 2) 26,500,000 0.59% 0 0 0 0 26,500,000 0 0 0.59%
Employees with
top-10 holding
13 persons (Note 3)
3,400,000 0.08% 0 0 0 0 3,400,000 0 0 0.08%
Note: 1. Calculations were based on share capital registered with the Ministry of Economic Affairs as at May 11, 2016.
2. Managers’ titles and names
• Executive Vice Presidents: Yung-Ching Chang, Chung-Pin Wong, Chao-Cheng Chen - 3 persons • Senior Vice Presidents: Chun-De Shen, Chiu-Rui Wei, Ying Chang, Ming-Hsing Hsu, Kuo-Chuan Chen, Sheng-Hua Peng, Wen-Da Hsu, and Wei-Cheng Chen - 8
positions • Vice Presidents: Chih-Chuan Cheng, Ching-Hsiung Lu, Bo-Hsiung Chang, Bo-Tang Wang, Zong-Ming Wang, Yung-Nan Chang, Sheng-Hung Li, Yung-He Su,
Chih-Hsien Liang, Lung-Hua Shen, Ming-Dong Weng, Yue-Chun Li, Chiao-Lieh Huang, Chung-Hsing Tan, Yi-Yun Chang, Hsin-Kung Mao, Ling-Sheng Wu, Hsin-Hsiung Huang, Yi-Chiang Chiu, Shih-Hung Huang, Ching-Fa Li, Bo-Heng Chen - 22 persons.
3. Titles and names of employees with top-10 holding
• Department heads: Jen-Liang Lin, Hsin-Chih Huang, Yao-Chung Tsai, Cheng-Chiang Wang, Yung-Ching Tien - 5 persons. • Deputy department heads: Nai-Ping Chen, Hsin-Shu Wang, Chi-Bin Li, Bo-An Lin, Ji-Nan Chou, Chang-Wen Lin, Chao-Bin Huang, De-Chih Hsia - 8 persons.
4.6 Status of New Shares Issuance in Connection with Mergers and Acquisitions: None
4.7 Financing Plans and Implementation: None
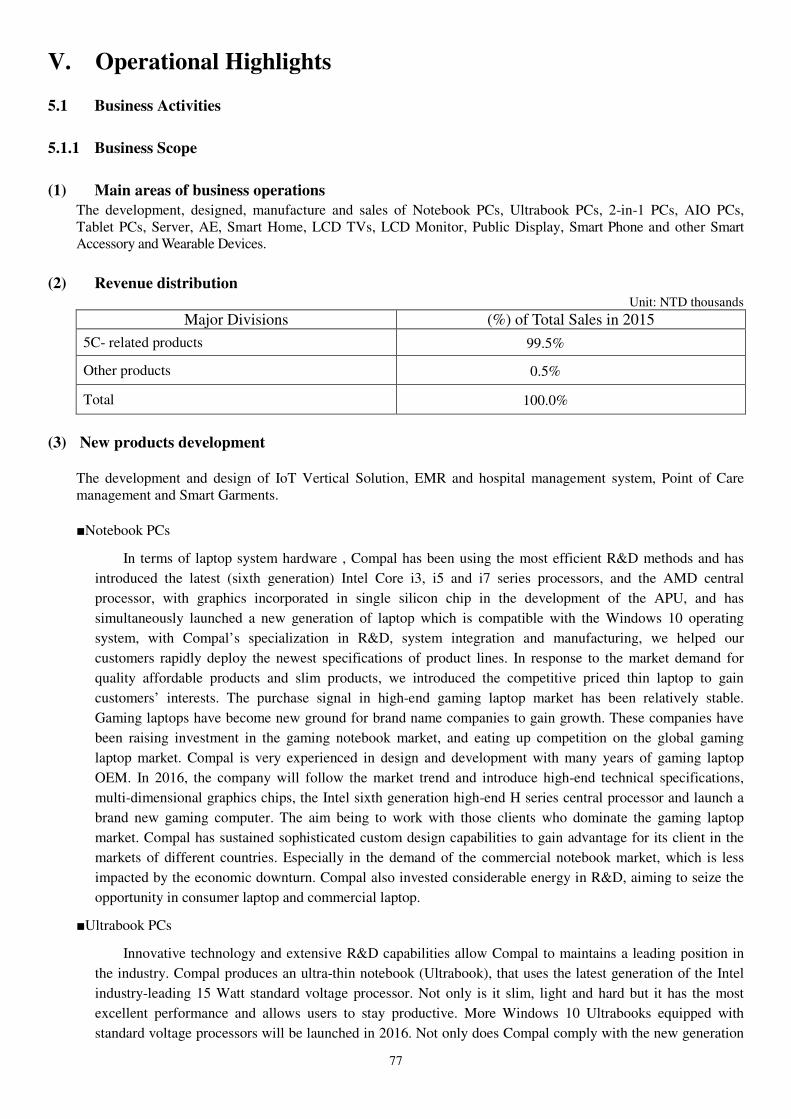
77
V. Operational Highlights
5.1 Business Activities
5.1.1 Business Scope
(1) Main areas of business operations
The development, designed, manufacture and sales of Notebook PCs, Ultrabook PCs, 2-in-1 PCs, AIO PCs, Tablet PCs, Server, AE, Smart Home, LCD TVs, LCD Monitor, Public Display, Smart Phone and other Smart Accessory and Wearable Devices.
(2) Revenue distribution Unit: NTD thousands
(3) New products development
The development and design of IoT Vertical Solution, EMR and hospital management system, Point of Care management and Smart Garments.
■Notebook PCs
In terms of laptop system hardware , Compal has been using the most efficient R&D methods and has
introduced the latest (sixth generation) Intel Core i3, i5 and i7 series processors, and the AMD central
processor, with graphics incorporated in single silicon chip in the development of the APU, and has
simultaneously launched a new generation of laptop which is compatible with the Windows 10 operating
system, with Compal’s specialization in R&D, system integration and manufacturing, we helped our
customers rapidly deploy the newest specifications of product lines. In response to the market demand for
quality affordable products and slim products, we introduced the competitive priced thin laptop to gain
customers’ interests. The purchase signal in high-end gaming laptop market has been relatively stable.
Gaming laptops have become new ground for brand name companies to gain growth. These companies have
been raising investment in the gaming notebook market, and eating up competition on the global gaming
laptop market. Compal is very experienced in design and development with many years of gaming laptop
OEM. In 2016, the company will follow the market trend and introduce high-end technical specifications,
multi-dimensional graphics chips, the Intel sixth generation high-end H series central processor and launch a
brand new gaming computer. The aim being to work with those clients who dominate the gaming laptop
market. Compal has sustained sophisticated custom design capabilities to gain advantage for its client in the
markets of different countries. Especially in the demand of the commercial notebook market, which is less
impacted by the economic downturn. Compal also invested considerable energy in R&D, aiming to seize the
opportunity in consumer laptop and commercial laptop.
■Ultrabook PCs
Innovative technology and extensive R&D capabilities allow Compal to maintains a leading position in
the industry. Compal produces an ultra-thin notebook (Ultrabook), that uses the latest generation of the Intel
industry-leading 15 Watt standard voltage processor. Not only is it slim, light and hard but it has the most
excellent performance and allows users to stay productive. More Windows 10 Ultrabooks equipped with
standard voltage processors will be launched in 2016. Not only does Compal comply with the new generation
Major Divisions (%) of Total Sales in 2015
5C- related products 99.5%
Other products 0.5%
Total 100.0%

78
of Intel design specifications, but the Company has also introduced a slimmer design with a lower price to
meet the market demand. It maintains the stylish and elegant body but is a more powerful high-performance
computer. Compal will also continue to develop newer and more competitive technologies so not only
consumers can enjoy the world of Compal’s Innovation and variety products, the client can also enter this
market quickly.
■2-in-1 PCs
The 2-in-1 laptop is a new concept product with a variety of patterns for Transformers. There is a
standard laptop keyboard, but it also has Tablet PC touch flexibility. The screen of the PC is a touch sensing
module and in addition the Microsoft Windows 10 operating system is built in. The aim being to attract both
regular laptop and tablet consumers. Compal utilizes its rich experience in R&D to put forward a variety of
innovative concepts. The 2-in-1 notebooks with a variety of different designs and different sizes, equipped
with Compal’s exclusive combination of innovative technologies, materials, and fanless design, can create
new market demand and unanimous praises from customers and consumers.
■AIO PCs
AIO has been on the market for years. It is an elegant combination of screen and computer with a thin,
special shape, and elegant design. The product has replaced the desktop in many households and corporations.
Compal has also enhanced the design to allow the AIO to lie flat and also be portable (Portable AIO). Compal
possesses the basic NB technology used in the AIO and can rapidly create AIO product lines which have been
very well received by clients. We expect to create several more remarkable products following generational
changes in the desktop products market.
■Tablet PCs
Compal has long cultivated Desktop PC technology for industrial, commercial and consumer users. We
will start to manufacture a series of Desktops both low-priced and at high level as well as 3G/LTB enabled
devices to satisfy the needs of our clients and customer support and recognition. We will also extend our
product lines to eBooks and provide more competitive solutions for our name brand clients.
■Server
Cloud application has been a growing market. Partial data storage and calculation analytics have shifted
to the cloud server in the back-end. In order to meet the demand from both Enterprises and Data Centers,
Compal has mastered the R&D of High-density computing power and precision performance management and
is able to design and manufacture a high CP value server.
■AE
Car PC consists of the in-car communication system (Telematics) and in-car AV entertainment system.
The Telematics has special regulations which involve safety and communication control regulations and we
have been long calibrated with car makers to make sure the process in sync. The in-car AV entertainment
system framework is very similar to a computer and has been the first step into the car PC market. With years
of hard work in the field, Compal has been adopted by several major car makers in the world.
■Smart Home
Smart Home has been developed for many years and has focused on media sharing application. With the
era of Internet of Things (IoT), a smart home central control platform will become the key feature in all
industries. Compal has entered into the R&D of Home Gateway by using our production design capacity of
mobile computers and mobile devices. We’ve also developed new products and new business lines by
cultivating on wireless technology and sensor network technology, integrating background cloud computing
services, and focusing on smart energy saving, smart safety, and smart home care. In the future, Compal will
also depend on various areas of the internet, using our core technical and gradually expanding the depth and
breadth of products, to look for a relatively niche market and expand product coverages.

79
■IoT Vertical Solution
Vertical Solution has been one of the key demands in the development of the IoT. A wide range of
applications, both software and hardware, coupled with customized design services based on client demand
satisfy the needs of smart cities, industry 4.0, smarter buildings, smart retail and smart medicine. B2B
customer demand accounts for a high proportion of current IoT and also brings Compal a more immediate
profit. Compal has competitive products for the primary needs of development in many different fields, not
only as a hardware manufacturer, but as a full-Service Provider.
■Smart Medical and Healthcare
The aging population, China’s new two-child policy, the flourishing health care industry, and the rise of
sports fashion, especially the popularity of convenience smart devices, have all contributed to smart healthcare
becoming a focus of attention. It has also become a major matter of cross industry cooperation. Compal has
responded to market demand and the rapid advent of the IoT era by actively cutting into the major hospitals
and Point of Care (POC) market through our integration advantages and rich experience in product
development through strong ICT. This is coupled with cross-industry alliance strategy for such things as
long-term care centers, confinement centers… etc. The designs, which include science, technology, and
humanity help caregivers to provide higher quality services and also give hope of a better quality of life and
personal dignity to those who need healthcare.
■LTD TVs
As consumers change their viewing habits, the interaction experience between users of Smart TVs (or
smart phones) is also redefined by seamless extension of the content on the devices, such as simplification of
TV network setup. This improves user convenience to meet new expectations from such devices as smart TVs.
■LCD Monitor
The UHD products base has advanced to the HDMI 2.0 specification and now supports up to a 4K2K
60Hz input signal, which responds to the needs of the professional graphics design and the B2B business
markets.
■Smartphone
Compal continues to strengthen the operational efficiency of R&D, develop core communications
technologies, and continue the development of innovative technologies to maintain an industry-leading
position. In 2016, we will continue to develop high-end multi-core, no frame, multi-camera image integration,
and special feature cameras. We will also increase the speed for TDD-LTE / FDD-LTE carrier aggregation
smart mobile devices. In addition to continuing to strengthen the competitiveness of low-priced introductory
devices, we will also actively develop cost-effective, good looking, high value products to cope with the rapid
growth and customer needs in emerging markets.
■Smart Accessory and Wearable Devices
Compal has excellent wireless technology and cross-platform integration ability and can rapidly cut into
the product design and manufacturing of smart accessories to cope with the explosion of the smart wearable
accessories market. We have developed a range of intelligent RTOS, Android, and Android Wear system
smart watches which are expected to ship in 2016. We expect to continue this trend in the development of
technology throughout 2016, and hope to expand our client base and develop thinner and lighter power saving
smart accessories and wearable devices.
5.1.2 Industry Overview
Please refer to page 72-79 of the Chinese annual report.

80
5.1.3 Research and Development
Research and Development Expenses in the past year:
Unit: NTD thousands; %
Year R&D expenses Operating revenues R&D expenses as a percentage
to operating revenues
2015 12,249,660 847,305,698 1.45%
2016 first quarter 2,579,300 176,649,808 1.46%
5.1.4 Long-term and Short-term Development
(1) Short-term Development
• We will adapt to market changes, follow current trends, strengthen new design concepts, maintain the focus on product difference, and launch ahead of our competitors.
• We will enhance operation efficiency, to further increase our product competitiveness and push the sales growth rate higher than the market average.
• We will improve logistics management and flexibility to shorten delivery time. • We will elaborate different market strategies for different product markets. Bundle the new technology and
modular features in the mainstream products to enhance value-added products and variety. Use a forward-looking approach, based on the uniqueness of the products, to develop the design concept of the new products and become the market focus. In low-priced products, other than pricing competitiveness, the demand of user functions is also an important consideration.
• Production bases will be diversified to spread the risk of a single production, reduce the cost of manufacturing and improve product competitiveness.
• We will pay closer attention to market trends and evolution in smart devices and develop product concepts suitable for OEM customers and the market. We will help customers create differentiated products with feasible designs.
• Product development times will be further shortened to optimize supply chain management, maintain persistent high quality, and provide customers with more competitive products.
• More effort will be made to maintain existing customer relations. Continue to increase the volume in product cooperation. In addition to maintaining a high degree of customer satisfaction. We also seek other opportunities for cooperation with new customers, aiming to have a better than the market average business growth rate in the Company’s smart device products.
• We will improve product profitability to achieve the maximum utilization of capacity and enhance overall operational efficiency and profitability.
• We will tap our accumulated communications industry R&D energy resources to quickly and efficiently cut into the high-growth networking market.
• A number of different industry alliance strategies will be used for the rapid development of a diversified product line that will strengthen customer relationships in the shortest possible time.
(2) Long-term Development • A spirit of innovation will strengthen the value-added Company products and improve long-term core
competitiveness. • Cooperation with our customers will be improved to allow better product planning, development and
manufacture as well as comprehensive after-sales service. • Horizontal and vertical integration of all parts and products of the Group’s affiliates will be strengthened
strategically and aligned with customers, to give them more convenient and complete services. • We will continue to strengthen the core R & D capabilities and technical service capabilities for smart devices. • Optimization of the quality of sophisticated products will be enhanced by new development and cost structures
and strategic alliances with main parts providers in the supply chain to give customers better and more competitive products and services.
• Closer horizontal and vertical integration will be made with affiliates in the Group to create and improve the loyalty of long-term customers.
• Our ability to innovate will be further cultivated, aiming to be able to more accurately predict market trends, before the client does, and provide them with products and services and high value-added solutions to improve long-term core competitiveness.

81
• The Company has established a service-oriented business model and new revenue sources through careful long-term upstream and downstream integration and cooperation.
• We are strengthening the breadth of learning of our team in preparation for future new business and product development through cross-industry alliances.
• We are cultivating the ability to control key technology, strategize high-end product lines, and gain cooperation opportunities with big manufacturers around the world.
5.2 Market and Sales Overview
5.2.1 2015 Sales (Service) by Regions
Area Percentage
Americas 37.1%
Europe 26.6%
Asia (Including Taiwan) 33.2%
Other Area 3.1%
Total 100.0%
5.2.2 Major Products and Their Main Uses
■ Notebook PCs
Analog-digital application hardware platform combined with the use of specific development software, which
has many applications such as data editing processing, clerical editing, layout, graphics applications, web
browsing, communication, digital audio-visual entertainment and gaming applications.
■ Ultrabook PCs
Emphasize laptop that is thin and light-weighted and take into account the performance of the battery
performance to meet the consumer’s needs of portable and productivity.
■ 2-in-1 PCs
The device uses the Windows 10 operating system, has an optional stylus, and satisfies the growing consumer
demand for mobile computing. In addition to multiple operating modes, the laptop has a touch screen which
enables it to be used as a tablet.
■ AIO PCs
Beautiful shape and suitable for household. Emphasizing the touchscreen input interface and software
application with strong computing power.
■ Tablet PCs
Portable touchscreen multimedia tablet and online information application.
■ Servers
Stores and analyzes large data and is compatible with various cloud applications.
■ AE
� Touchscreen car multimedia player.
� Voice controlled natural sound navigation.
� Bluetooth wireless phone to answer calls.
� WiFi smartphone which allows two-way communications.
� Accident alarm

82
� Integrated peripherals safety warning systems such as wireless tire pressure and collision avoidance
radar.
■ Smart Home
Smart appliances control and sensor which provides users with diversified smart living services.
■ IoT Vertical Solution
We provide our clients with complete solutions and services through flexible hardware design and a range of
customized software applications including cloud and big data analysis.
■ Smart Medical and Healthcare
The penetration of households and point-of-care areas using technology, including that of the IoT, and gradual
integration with our own peripheral software products to provide comprehensive solutions, and give
convenient and instant smart health care that will enhance dependence on the products as well as user brand
loyalty.
■ Displays
Graphics and audio display and output
■ Smartphone
Personal communications and Internet use
5.2.3 Supply Status of Main Materials
Main materials include CPU/Chipset, HDD, Memory, ODD, Battery, LCD Panel, and Touch Panel Module. Regarding their supply status, please refer to page 93-94 of the Chinese annual report.

83
5.2.4 Major Suppliers and Clients (1) Major Suppliers in the Last Two Calendar Years
Unit: NTD thousand
Party
2014 2015 2016 first quarter
Name Amount
As a
percentage to
2014 net
purchases
(%)
Relationship
with the issuer Name Amount
As a
percentage
to 2015 net
purchases
(%)
Relationship
with the issuer Name Amount
As a
percentage to
2016 first
quarter net
purchases (%)
Relationship
with the issuer
1 Company E 196,641,921 24.18 N/A Company E 223,294,338 27.43 N/A Company E 52,843,154 31.24 N/A
2 Company B 94,213,359 11.58 N/A Company B 112,207,244 13.79 N/A Company B 24,024,222 14.20 N/A
Others 522,480,810 64.24 Others 478,425,759 58.78 Others 92,300,386 54.56
Net Purchase 813,336,090 100.00 Net Purchase 813,927,341 100.00 Net Purchase 169,167,762 100.00
(2) Major Clients in the Last Two Calendar Years
Unit: NTD thousand
Party
2014 2015 2016 first quarter
Name Amount
As a
percentage to
2014 net
sales (%)
Relationship
with the issuer
Name Amount
As a
percentage to
2015 net sales
(%)
Relationship
with the
issuer
Name Amount
As a
percentage to
2016 first
quarter net
sales (%)
Relationship
with the issuer
1 Company a 113,261,171 13.39 N/A Company a 133,830,636 15.79 N/A Company a 27,473,419 15.55 N/A
2 Company c 102,730,381 12.15 N/A Company c 37,423,624 4.42 N/A Company c 1,774,696 1.00 N/A
3 Company d 254,615,227 30.11 N/A Company d 288,523,817 34.05 N/A Company d 70,533,654 39.93 N/A
4 Company e 130,230,357 15.40 N/A Company e 103,644,690 12.23 N/A Company e 18,219,198 10.31 N/A
5 Company f 27,993,009 3.31 N/A Company f 97,984,283 11.57 N/A Company f 25,609,459 14.50 N/A
Others 216,870,607 25.64 Others 185,898,648 21.94 Others 33,039,382 18.71
Net sales 845,700,752 100.00 Net sales 847,305,698 100.00 Net sales 176,649,808 100.00

84
5.2.5 Production in the Last Two Years
Unit: devices; NTD thousands
Year
Production
volume/
value
Main products
2014 2015
Production
capacity
Production
volume
Production
value
Production
capacity
Production
volume
Production
value
5C electronics 113,708,339 93,904,896 820,180,660 111,129,349 98,758,313 829,209,071
5.2.6 Shipments and Sales in the Last Two Years
Unit: devices; NTD thousands
Year
Sales volume
Main products
2014 2015
Domestic sales Export sales Domestic sales Export sales
Volume Value Volume Value Volume Value Volume Value
5C electronics 256,798 1,526,790 92,957,355 844,173,962 650,577 3,481,047 96,981,278 843,824,651
5.3 Human Resources
Year December 31, 2014 December 31, 2015 March 31, 2016
Number of employees 79,639 72,796 69,035
Average age 26.66 26.63 27.22
Average years of service 1.65 1.94 1.92
Academic qualifications
Doctoral Degree 0.07% 0.07% 0.08%
Master Degree 3.45% 3.78% 4.04%
University 19.07% 19.75% 20.48%
High school 56.22% 53.86% 54.04%
Below high school/others
21.19% 22.54% 21.36%
5.4 Environmental Protection Expenditure
(1) The Company is an assembler of electronic products, and produces no significant pollution:
To protect the environment and fulfill our social responsibility as well as reduce carbon emissions and the impact
on global warming. The Taiwan and Mainland China plants together incurred expenses of NT$11,130 thousand
on repairs (excluding regular maintenance and green R&D) in 2015. We are keeping the promises we made as an
earth citizen, hoping to make substantial contribution to protection of the global environment. We will continue
our commitment to efforts in this respect.
(2) Compliance with EU RoHS directives:
� All Compal products are 100% compliant with EU RoHS Directives. There have been no cases of any
returns for non-compliance with RoHS standards. In addition, Compal has begun demanding that suppliers

85
make timely adjustments for any RoHS exclusions that are scheduled for the near future and restrict the use
of substances such as DEHP, BBP, DBP and DIBP, the ban on these comes into effect in 2019.
� In order to manufacture environmentally friendly green products and meet the requirements of both
international environmental laws and client demand, the Company has implemented “Management
Standards for the Control of Environment-Related Substances in Parts and Materials” that covers all
hazardous substances currently prohibited by law and banned by customers. We have implemented efficient
and effective methods of inspection for hazardous substances using recognized component classification
and risk control to establish a plant monitoring mechanism for oversight and verification. All the products
manufactured by the Company comply with the validation IECQ QC 080000 Electrical and Electronic
Components and Products Hazardous Substance Process Management System Requirements.
(3) Responsive strategies and possible expenses:
� In the future, the Company will continue to implement its environmental responsibilities including the
boosting of staff knowledge of environmental matters, the advocation of updated green living knowledge,
Company response to government policy with respect to green consumption, and the regular priority
assessment of green product content in procurement as well as continuous improvement in the energy
efficiency of our plants. This includes scrutiny for all kinds of possible violations of environmental
regulations in the operations management system, and the mandate to make timely response to all
environmental laws.
5.5 Labor Relations (1) Availability and execution of employee welfare, education, training and retirement policies. Elaborate on
the agreements between employers and employees, and protection of employees’ rights
■ Employee welfare:
In addition to all their statutory labor rights and to help employees find a balance between work and
personal life, both physical and mental, and to improve their vitality in the workplace, the Company has
established an Employee Benefits Committee, a Life Committee, and other groups responsible for
promoting worker welfare. The employee health benefits and activities include a fitness center, a medical
facility, periodic health checks, recreational team competitions, family activities, travel, the arts, and
leisure and all kinds. Group Life Insurance is covered by the Company that includes accident, medical,
and cancer. The employees dependants may also join the scheme at a discounted rate, but at their own
expense. We also have benefits such as scholarships for employees and their children.
The Company actively supports the government in resolving the low birth rate crisis and childcare
policy in Taiwan. Since 2011, we have provided generous maternity grants for employees and their
spouses and children. By the end of 2015, the Company had provided NT$ 91.34 million in maternity
allowances and bonuses. There were 53 counts of employees who took parenting leave, with the right to
return, in 2015.
■ Education and training:
The Company set training credits and outlined the credit system according to the needs of each level.
The Company also integrate all training records in online learning platform to further assist the competent
staff in keeping abreast of the learning progress.
In 2015, a total of 1,808 training sessions (both internal and external) were organized; these courses

86
delivered 122,188 hours of training and 36,992 persons enrolled. The total training expenses were NT$
8,817 thousand. The training courses included:
Orientation: Organized new hire seminars and corporate culture experience camp to help the new hires
better understand the Company’s culture, the current status of the industry, and the Company
strategy and visions.
Language training: Basic to advance English and Japanese courses which train the employees’ ability to
respond to customers and equip them with a global vision through workspace
situational training.
Managerial skills Training: To establish a comprehensive blueprint of development level, strengthen the
core competency at all levels in such aspects as teamwork, problem analysis,
innovative thinking... and so on, and also to conduct planning for Company
talent training in various stages.
Professional training: Categorized new professional knowledge lectures, courses, and experiences
heritage job training to enhance employees’ expertise and technology. Also to
enhance the Company’s core competitiveness through systematic management.
E-learning: Offers related courses in new hire requisites, IT, 6 sigma, language, management, CSR and
occupational safety. The Company uses Internet learning and resource sharing to offer
real-time learning, maximizing the effect with a complete learning and training mechanism
that utilizes a comprehensive knowledge management system.
■ Retirement system
The Company has developed its retirement system in accordance with the Labor Standards Act and
the Labor Pension Act. For employees who are transferred to affiliated companies, pension benefits are
paid according to employees’ years of service in their respective departments, and out of pension fund
accounts that each department has contributed over the course of employees’ service.
■ Employer-employee communications and enforcement of workers’ rights
The Company has always valued employer-employee relations, and has communication channels
available to facilitate two-way communication between the two parties, thereby allowing the Company to
respond to employees’ thoughts and opinions in a prompt manner. The Company not only has policies in
place to protect employees’ rights, but also makes decisions in the best interests of its employees.
(2) Personnel management
The Company has clear policies in place to manage human resources and to guide employees’
behaviors. There are specific levels of approval authority and detailed rules to guide decisions concerning
employees’ recruitment, promotion, appraisal, assignment, leave of absence, resignation, confidentiality
agreement, reward and discipline. These policies and rules exist to eliminate subjective judgments and to
create a fair, open, and systematic corporate culture.
(3) Work environment
• Buildings are subjected to annual fire safety inspections and reports.
• Buildings, plants and equipment are inspected daily and maintained on a regular basis.
• The Company hires regular cleaning services to ensure the cleanliness of its work environment.
(4) Employees’ safety
• Personnel entry and exit are controlled by security system.
• Security personnel are stationed 24 hours a day to patrol plant premise and monitor the surveillance
system.
• Lectures and rehearsals are organized annually to demonstrate the proper responses in case of an

87
emergency.
(5) Actual or estimated losses arising as a result of employment disputes in the recent year up till the
publication date of this annual report, and any responsive measures taken:
• The Company did not suffer any losses due to employment dispute in the recent year, and nor does it
expect any occurrence in the coming year.
• Responsive strategies and possible expenses: none.

88
5.6 Important Contracts
Agreement Counterparty Period Major Contents Restrictions
Patent
licensing
agreement
Phoenix Technologies Ltd.
Since
2010.1.1
Auto-renewed
upon expiry
1. Tool Licenses
2. Source Code licenses
3. Maintenance
N/A
Trading and
manufacturing
agreement
Dell Products L.P.
Since
1997.06.26
Auto-renewed
upon expiry
Under this agreement, the buyer will
procure computer products developed
and manufactured by the seller, while the
seller will give the buyer proper licenses
to use the products and provide after-sale
technical services thereafter.
N/A
Trading
agreement Toshiba Co.
Since
1999.09.09
Yearly
Auto-renewed
upon expiry
Under this agreement, the buyer will
procure computer products developed
and manufactured by the seller, along
with after-sale technical services
provided by the seller.
N/A
Trading and
manufacturing
agreement
Acer Inc.
Since
2001.10.01
Yearly
Auto-renewed
upon expiry
Under this agreement, the buyer will
procure computer products developed
and manufactured by the seller, along
with after-sale technical services
provided by the seller.
N/A
Shareholder
agreement Tatung Co.
Since
2009.07.21
︱
until completion
of the
underlying
purpose
This agreement is related to the private
placement of shares of Chunghwa
Picture Tubes Ltd. (CPT); the terms
enable the subscriber to request for a
buyback of privately placed shares from
the counterparty.
N/A

89
VI. Financial Information
6.1 Five-Year Financial Summary
6.1.1 Condensed Balance Sheet and Statement of Comprehensive Income – Based on IFRS
(1) Consolidated Condensed Balance Sheet – Based on IFRS Unit: NT$ thousands
Year
Item
Financial Summary for The Last Five Years (Note 1) As of March 31, 2016
2011 2012 2013 2014 2015
Current assets
N/A
259,133,608 287,380,820 324,845,249 277,783,476 248,360,406
Property, plant, and
equipment 20,772,790 21,209,228 24,472,732 24,308,631 23,449,956
Intangible assets 1,451,181 1,293,643 1,035,162 1,194,193 1,316,847
Other assets 30,431,001 26,219,123 28,397,575 24,639,275 24,962,750
Total assets 311,788,580 336,102,814 378,750,718 327,925,575 298,089,959
Current
liabilities
Prior to
distribution 195,000,133 220,597,261 250,264,267 202,757,075 171,251,778
After
distribution 199,333,956 224,902,606 256,832,412 (Note 2) -
Non-current assets 1,995,177 15,314,137 22,266,514 15,570,384 16,214,659
Total liabilities
Prior to
distribution 196,995,310 235,911,398 272,530,781 218,327,459 187,466,437
After
distribution 201,329,133 240,216,743 279,098,926 (Note 2) -
Equity attributable to
owners of parent 106,039,633 95,102,289 101,386,923 103,775,795 104,679,277
Ordinary shares 44,126,526 44,134,467 44,232,366 44,711,266 44,704,866
Capital surplus 16,122,810 16,193,087 14,296,445 12,838,638 12,830,309
Retained
earnings
Prior to
distribution 55,053,941 44,489,978 47,721,872 51,877,511 53,479,391
After
distribution 50,669,755 42,312,310 43,293,091 (Note 2) -
Other equity interests (8,382,397) (7,707,518) (3,139,021) (3,926,881) (4,610,550)
Treasury shares (881,247) (2,007,725) (1,724,739) (1,724,739) (1,724,739)
Non-controlling interests 8,753,637 5,089,127 4,833,014 5,822,321 5,944,245
Total equity Prior to
distribution 114,793,270 100,191,416 106,219,937 109,598,116 110,623,522
After
distribution 110,459,447 95,886,071 99,651,792 (Note 2) -
Note: 1. Financial information is audited and certified by the CPA every year. The financial information as of March 31, 2016,
has not yet been audited by the CPA.
2. 2015 annual financial statements have not been approved at a shareholders’ meeting. Therefore, the amount after
allocation is not listed.
3. The Company has retroactively adjusted previous amounts in the financial statements effective January 1, 2014, due to
the adoption of the 2013 International Accounting Standards endorsed by the Financial Supervisory Commission of the
ROC as of January 1, 2015.

90
(2) Consolidated Condensed Statement of Comprehensive Income – Based on IFRS
Unit: NT$ thousands
Year
Item
Financial Summary for The Last Five Years (Note 1) As of March 31, 2016
2011 2012 2013 2014 2015
Net sales revenue
N/A
683,913,713 692,748,293 845,700,752 847,305,698 176,649,808
Gross profit 28,749,803 28,110,391 32,364,662 33,378,357 7,482,046
Net operating income 10,054,894 9,234,044 11,664,922 11,312,452 2,776,408
Non-operating income and
expense (631,049) (4,873,662) (1,937,570) 479,641 (477,627)
Net income before tax 9,423,845 4,360,382 9,727,352 11,792,093 2,298,781
Net income from continuing
operations 7,240,147 2,903,732 7,545,381 9,007,147 1,746,263
Net loss from discounting
operations - - - - -
Net income (loss) 7,240,147 2,903,732 7,545,381 9,007,147 1,746,263
Other comprehensive income
(loss)
(net of tax)
(59,127) 711,298 4,555,499 (101,970) (822,277)
Net income 7,181,020 3,615,030 12,100,880 8,905,177 923,986
Net income attributes to
shareholders of the Parent 6,399,958 2,467,211 7,024,461 8,684,610 1,601,242
Net income attributes to
non-controlling interests 840,189 436,521 520,920 322,537 145,021
Comprehensive income
attributed to owners of parent 6,406,588 3,160,663 11,548,480 8,552,926 803,759
Comprehensive income
attributed to non-controlling
interests
774,432 454,367 552,400 352,251 120,227
Earning per share (unit: dollar) 1.47 0.57 1.63 2.01 0.37
Note: 1. Financial information is audited and certified by the CPA every year. The financial information as of March 31, 2016, has not yet been audited by the CPA.
2. The 2015 annual financial statement for the current year has not yet been approved at a shareholders’ meeting 3. The Company has retroactively adjusted previous amounts in the financial statements effective January 1, 2014, due to
the adoption of the 2013 International Accounting Standards endorsed by the Financial Supervisory Commission of the ROC as of January 1, 2015.

91
(3) Parent-Company-Only Condensed Balance Sheet – Based on IFRS
Unit: NT$ thousands
Year Item
Financial Summary for The Last Five Years (Note 1) As of March
31, 2016 2011 2012 2013 2014 2015
Current assets
N/A
194,403,691 210,646,593 255,609,554 207,496,808
N/A
Property, plant, and equipment
2,295,444 2,218,316 2,230,023 2,181,737
Intangible assets 724,106 617,739 412,185 378,454
Other assets 76,775,902 82,728,525 85,179,353 86,182,040
Total assets 274,199,143 296,211,173 343,431,115 296,239,039
Current liabilities
Prior to distribution
167,275,463 187,574,634 220,791,532 177,664,877
After distribution
171,659,649 191,929,970 227,434,703 (Note 2)
Non-current assets 884,047 13,534,250 21,252,660 14,798,367
Total liabilities
Prior to distribution
168,159,510 201,108,884 242,044,192 192,463,244
After distribution
172,543,696 205,464,220 248,687,363 (Note 2)
Equity attributable to owners of parent
- - - -
Ordinary shares 44,126,526 44,134,467 44,232,366 44,711,266
Capital surplus 16,122,810 16,193,087 14,296,445 12,838,638
Retained earnings
Prior to distribution
55,053,941 44,489,978 47,721,872 51,877,511
After distribution
50,669,755 42,312,310 43,293,091 (Note 2)
Other equity interests (8,382,397) (7,707,518) (3,139,021) (3,926,881)
Treasury shares (881,247) (2,007,725) (1,724,739) (1,724,739)
Non-controlling interests - - - -
Total equity
Prior to distribution
106,039,633 95,102,289 101,386,923 103,775,795
After distribution
101,705,810 90,796,944 94,818,778 (Note 2)
Note: 1. The financial information is audited and reviewed by the CPA every year. 2. The 2015 annual financial statements have not been approved at a shareholders’ meeting. Therefore, the amount after
allocation is not listed. 3. The Company retroactively adjusted previous amounts in the financial statements effective January 1, 2014, due to the
adoption of the 2013 International Accounting Standards endorsed by the Financial Supervisory Commission of the ROC as of January 1, 2015.

92
(4) Parent-Company-Only Condensed Statement of Comprehensive Income – Based on IFRS
Unit: NT$ thousands
Year Item
Financial Summary for The Last Five Years (Note 1) As of March 31, 2016
2011 2012 2013 2014 2015
Net sales revenue
N/A
608,702,320 632,622,772 803,504,061 802,994,930
N/A
Gross profit 15,258,012 16,359,240 21,288,913 22,737,590
Net operating income 4,877,292 5,505,654 7,291,756 7,305,278
Non-operating income and expense
2,288,536 (2,503,176) 286,853 2,857,612
Net income before tax 7,165,828 3,002,478 7,578,609 10,162,890
Net income from continuing operations
6,399,958 2,467,211 7,024,461 8,684,610
Net loss from discounting operations
- - - -
Net income (loss) 6,399,958 2,467,211 7,024,461 8,684,610
Income (loss) from other comprehensive income (net after tax)
6,630 693,452 4,524,019 (131,684)
Net income 6,406,588 3,160,663 11,548,480 8,552,926
Net income attributes to shareholders of the Parent
- - - -
Net income attributes to non-controlling interests
- - - -
Comprehensive income attributed to owners of parent
- - - -
Comprehensive income attributed to non-controlling interests
- - - -
Earning per share (unit: dollar) 1.47 0.57 1.63 2.01
Note: 1. The financial information is audited and reviewed by the CPA every year. 2. The 2015 financial statement has not yet approved by the shareholders’ meeting. 3. The Company retroactively adjusted previous amounts in the financial statements effective January 1, 2014, due to the
adoption of the 2013 International Accounting Standards endorsed by the Financial Supervisory Commission of the ROC as of January 1, 2015.

93
6.1.2 Condensed Balance Sheet and Statement of Comprehensive Income – Based on ROC GAAP
(1) Consolidated Condensed balance sheet – Based on ROC GAAP
Unit: NT$ thousands
Year
Item
Financial Summary for The Last Five Years As of March 31, 2016
2011 2012 2013 2014 2015
Current assets 236,063,264 257,852,167
N/A N/A N/A N/A
Funds and investments 23,908,349 28,044,206
Fixed assets 16,951,183 21,386,512
Intangible assets and other assets 1,923,503 2,000,627
Total assets 278,846,299 309,283,512
Current
liabilities
Prior to distribution 164,527,553 192,909,628
After distribution 170,632,894 197,243,451
Long-term and other liabilities 221,146 1,005,337
Total
liabilities
Prior to distribution 164,748,699 193,914,965
After distribution 170,854,040 198,248,788
Ordinary shares 44,002,554 44,126,526
Capital surplus 15,512,401 15,776,692
Retained
earnings
Prior to distribution 56,139,782 56,373,219
After distribution 49,964,431 51,989,033
Currency exchange rate adjustment (1,234,071) (3,134,299)
Net loss not recognized as pension cost - (165,627)
Unrealized gains and losses of financial
instruments (7,478,947) (5,518,799)
Treasury shares (881,247) (881,247)
Minority interest 8,037,128 8,792,082
Total
Shareholder’s
equity
Prior to distribution 114,097,600 115,368,547
After distribution 107,992,259 111,034,724
Note: all yearly financial information has been audited.

94
(2) Consolidated Condensed Statement of Income – Based on ROC GAAP
Unit: NT$ thousands
Year
Item
Financial Summary for The Last Five Years As of March 31,
2016 2011 2012 2013 2014 2015
Net sales revenue 693,126,573 682,891,359
N/A N/A N/A N/A
Gross profit 33,587,365 29,812,097
Net operating income 13,461,681 10,067,934
Non-operating income and
gains 2,696,593 2,261,926
Non-operating expense and
losses 2,934,003 2,890,453
Income from continuing
operations before income
tax
13,224,271 9,439,407
Income from continuing
operations p 11,096,306 7,255,485
Consolidated total income 11,096,306 7,255,485
Net income attributed to
owners of parent 11,014,680 6,411,027
Earning per share retroactive
adjustment
(Unit: dollars)
2.53 1.47
Note: all yearly financial information has been audited.

95
(3) Parent-Company-Only Condensed balance sheet – Based on ROC GAAP
Unit: NT$ thousands
Year Item
Financial Summary for The Last Five Years As of March 31, 2016
2011 2012 2013 2014 2015
Current assets 165,602,004 193,064,991
N/A N/A N/A N/A
Funds and long term investments 67,921,249 76,151,586
Fixed assets 2,183,514 2,160,328
Intangible assets 743,568 724,106
Other assets 507,276 189,276
Total assets 236,957,611 272,290,287
Current liabilities
Prior to distribution
130,872,137 165,490,729
After distribution
137,047,488 169,874,915
Long-term liabilities - -
Other liabilities 25,002 223,093
Total liabilities
Prior to distribution
130,897,139 165,713,822
After distribution
137,072,490 170,098,008
Ordinary shares 44,002,554 44,126,526
Capital surplus 15,512,401 15,776,692
Retained earnings
Prior to distribution
56,139,782 56,373,219
After distribution
49,964,431 51,989,033
Unrealized gains and losses of financial instruments
(7,478,947) (5,518,799)
cumulative exchange rate adjustments (1,234,071) (3,134,299)
Net loss not recognized as pension cost - (165,627)
Total shareholder’s equity
Prior to distribution
106,060,472 106,576,465
After distribution
99,955,131 102,242,642
Note: all yearly financial information has been audited.

96
(4) Parent-Company-Only Condensed Statement of Income – Based on ROC GAAP
Unit: NT$ thousands
Year Item
Financial Summary for The Last Five Years As of March 31,
2016
2011 2012 2013 2014 2015
Net sales revenue 649,477,507 607,679,574
N/A N/A N/A N/A
Gross profit 20,573,404 16,228,493
Net operating income 7,758,932 4,869,926
Non-operating 5,177,859 2,620,408
Income and gains
Non-operating 834,458 315,184
Expense and losses
Continuing operations 12,102,333 7,175,150 Net income (loss)
before tax
Continuing operations 11,014,680 6,411,027
Income (loss)
Income (loss) from discontinued operations
- -
Income (loss) from extraordinary items
- -
Cumulative Effect of Changes - -
in Accounting Principle
Net income 11,014,680 6,411,027
Retroactively adjusted earnings per share (Unit: Dollar)
$2.53 $1.47
Note: all yearly financial information has been audited.
6.1.3 Auditors’ Opinions from 2011 to 2015
Note: 1. Brief disclosures of Company disposal of the equity investment of VIBO Telecom Inc and a record of the
impairment of equity investment in Chunghwa Picture Tubes, Ltd.
2. Impact of retroactive adjustments to the 2014 financial statement due to adoption of the 2013 version of the International Financial Reporting Standards (IFRS) endorsed by the Financial Supervisory Commission (FSC) of the ROC.
Year Accounting Firm CPA Audit Opinion
2011 KPMG Kuo, Kuan Ying; Lo, Jui Lan Unqualified opinion
2012 KPMG Kuo, Kuan Ying; Lo, Jui Lan Unqualified opinion
2013 KPMG Kuo, Kuan Ying; Lo, Jui Lan Modified unqualified opinion (Note 1)
2014 KPMG Kuo, Kuan Ying; Lo, Jui Lan Modified unqualified opinion (Note 1)
2015 KPMG Kuo, Kuan Ying; Lo, Jui Lan Modified unqualified opinion (Note 2)

97
6.2 Five-Year Financial Analysis
A. Consolidated Financial Analysis – Based on IFRS
Year
Item
Financial Analysis for the Last Five Years As of
March 31,
2016 2011 2012 2013 2014 2015
Capital Structure (%)
Debt ratio
N/A
63.18 70.19 71.96 66.58 62.89
Long term fund to property, plant and
equipment ratio 562.22 544.60 525.02 514.91 540.89
Liquidity analysis
Current ratio 132.89 130.27 129.80 137.00 145.03
Quick ratio 105.61 106.85 102.70 113.71 118.98
Interest coverage 23.88 9.83 10.54 14.11 11.88
Operating
Performance
Analysis
Account receivable turnover (times) 4.61 4.02 4.66 4.93 4.76
Average collection turnover 79.18 90.76 78.25 74.03 76.72
Inventory turnover (times) 13.29 12.91 13.73 14.31 14.99
Account payable turnover (times) 4.82 4.67 5.13 5.42 5.73
Average inventory turnover days 27.47 28.26 26.59 25.50 24.36
Fixed assets turnover (times) 37.81 33.00 37.03 34.74 29.59
Total assets turnover(times) 2.31 2.14 2.37 2.40 2.26
Profitability
Analysis
Return on total assets (%) 2.55 1.00 2.33 2.74 0.61
Return on equity (%) 6.34 2.70 7.31 8.35 1.59
Operating income to paid-in capital ratio (%) 21.36 9.88 21.99 26.37 5.14
Net margin (%) 1.06 0.42 0.89 1.06 0.99
Earning per share (dollar) 1.47 0.57 1.63 2.01 0.37
Cash flow
Cash flow ratio (%) (Note 1) 0.25 13.51 4.70 -
Cash flow adequacy ratio (%) (Note 2) (Note 2) (Note 2) (Note 2) -
Cash reinvestment ratio (%) (Note 1) (Note 1) 19.59 1.95 -
Leverage Operating leverage 1.58 1.66 1.57 1.58 -
Financial leverage 1.04 1.06 1.10 1.09 -
Note: 1. The ratio is negative.
2. Not applicable as the financial information, for more than five years, in accordance with IFSR has not yet
been disclosed.
3. The financial ratio has changed by up to 20% in the past two years:
� Interest coverage (times): is higher than in the last period mainly due to income before tax being higher.
� EPS: is higher than in last period mainly due to income after tax in the current period.
� Cash flow ratio: the decrease is mainly due to the net inflow from operating activities during this period
being less than in earlier periods.
� Cash flow reinvestment ratio: the decrease is mainly due to the net inflow from operating activities in this period being lower than in prior periods.
4. The financial information is audited and certified by the CPA every year. The financial information as of
March 31, 2016, has not yet audited by the CPA.
5. The Company made retroactive adjustment to previous amounts in the financial statements effective January
1, 2014, due to the adoption of the 2013 International Accounting Standards endorsed by the Financial
Supervisory Commission of the ROC as of January 1, 2015.
6. The 2015 financial statement has not yet been approved at a shareholders’ meeting.

98
Formula: 1. Financial Structure (1) Debt Ratio = Total liabilities / Total assets (2) Ratio of long-term capital to property, plant and equipment = (Net shareholders’ equity + Long-term liability) /
Net property, plant and equipment 2. Solvency (1) Current ratio = Current Assets / Current liability (2) Quick ratio = (Current assets - Inventory - Prepaid expenses) / Current liability (3) Interest coverage ratio = Net income before income tax and interest expense / Interest expense 3. Operating Efficiency (1) Account receivable (including account receivable and notes receivable from business activities) turnover
= Net sales / Average account receivable balance (including account receivable and notes receivable from business activities)
(2) A/R turnover days = 365 / account receivable turnover (3) Inventory turnover = Cost of Goods Sold / Average inventory balance (4) Account payable (including account payable and notes payable from business activities) turnover = Cost of goods
sold / Average account payable balance (including account payable and notes payable from business activities) (5) Inventory turnover days = 365 / Inventory turnover (6) Property, plant and equipment turnover = Net sales / Average Net property, plant and equipment (7) Total assets turnover = Net sales / Average Total assets 4. Profitability (1) Return on assets = [PAT + Interest expense × (1 - interest rate)] / average asset balance (2) Return on equity = PAT / average net equity (3) Pre-tax income to paid-in capital = Net income before tax / Issued capital stock (4) Net profit ratio = PAT / Net sates (5) EPS = (PAT - preferred stock dividends) / weighted average outstanding shares 5. Cash Flow (1) Cash flow ratio = Cash flow from operating activities / Current liability (2) Cash flow adequacy ratio = Most recent 5-year Cash flow from operating activities / Most recent
5-year (Capital expenditure + increases in inventory + cash dividend) (3) Cash reinvestment ratio = (Cash flow from operating activities - cash dividend) / (Gross fixed assets + long-term
investment + other assets + working capital) 6. Leverage (1) Operating leverage = (Nest revenue - variable cost of goods sold and operating expense) / operating income (2) Financial leverage = Operating income / (Operating income - interest expenses)

99
B. Consolidated Financial Analysis – Based on ROC GAAP
Year
Item
Financial Analysis for the Last Five Years As of March
31, 2016 2011 2012 2013 2014 2015
Capital Structure
(%)
Debt ratio 59.08 62.70
N/A N/A N/A N/A
Long-term capital to fixed assets ratio 673.24 542.02
Liquidity analysis
Current ratio 143.48 133.66
Quick ratio 114.10 106.09
Interest coverage 29.82 23.98
Operating
Performance
Analysis
Account receivable turnover (times) 4.50 4.66
Average collection turnover 81.15 78.31
Inventory turnover (times) 14.27 13.24
Account payable turnover (times) 4.63 4.81
Average inventory turnover days 25.57 27.56
Fixed assets turnover (times) 43.41 35.63
Total assets turnover(times) 2.26 2.32
Profitability
Analysis
Return on total assets (%) 3.75 2.57
Return on shareholder’s equity (%) 9.43 6.32
to paid-in capital ratio
%
Operating
income 30.59 22.82
Income before
tax 30.05 21.39
Net margin (%) 1.60 1.06
Retroactively adjusted earning per share
(dollar) 2.53 1.47
Cash flow
Cash flow ratio (%) 20.94 (Note 1)
Cash flow adequacy ratio (%) 73.27 46.44
Cash reinvestment ratio (%) 17.34 (Note 1)
Leverage Operating leverage 1.45 1.62
Financial leverage 1.04 1.04
Note: 1. The ratio is negative.
2. The financial ratio has changed by up to 20% over the past two years: Not applicable.
3. The financial information is audited and reviewed by the CPA every year.

100
Formula: 1. Financial Structure (1) Debt Ratio = Total liabilities / Total assets (2) Long-term debts to fixed assets = (Net equity + Long-term debts) / Net fixed assets 2. Solvency (1) Current ratio = Current Assets / Current liability (2) Quick ratio = (Current assets - Inventory - Prepaid expenses) / Current liability (3) Interest coverage ratio = Net income before income tax and interest expense / Interest expense 3. Operating Efficiency (1) Account receivable (including account receivable and notes receivable from business activities) turnover
= Net sales / Average account receivable balance (including account receivable and notes receivable from business activities)
(2) A/R turnover days = 365 / account receivable turnover (3) Inventory turnover = Cost of Goods Sold / Average inventory balance (4) Account payable (including account payable and notes payable from business activities) turnover = Cost of goods
sold / Average account payable balance (including account payable and notes payable from business activities) (5) Inventory turnover days = 365 / Inventory turnover (6) Fixed assets turnover = Net sales / Average Net Fixed Assets (7) Total assets turnover = Net sales / Average Total assets 4. Profitability (1) Return on assets = [PAT + Interest expense × (1 - interest rate)] / average asset balance (2) Return on equity = PAT / average net equity (3) Net profit ratio = PAT / Net sates (4) EPS = (PAT - preferred stock dividends) / weighted average outstanding shares 5. Cash Flow (1) Cash flow ratio = Cash flow from operating activities / Current liability (2) Cash flow adequacy ratio = Most recent 5-year Cash flow from operating activities / Most recent
5-year (Capital expenditure + increases in inventory + cash dividend) (3) Cash reinvestment ratio = (Cash flow from operating activities - cash dividend) / (Gross fixed assets + long-term
investment + other assets + working capital) 6. Leverage (1) Operating leverage = (Nest revenue - variable cost of goods sold and operating expense) / operating income (2) Financial leverage = Operating income / (Operating income - interest expenses)

101
6.3 Audit Committee’s Report for the Most Recent Year
Report of the Audit Committee.
The 2015 Financial Statement of Compal Electronics, Inc and Subsidiaries (the “Company”) has
been approved by the Audit Committee and the Board of Directors and has been audited and certified by Gun-Yin Guo, CPA, and Rui-Lan Liu, CPA, of KPMG LLP and an audit report relating to the Financial Statements has been issued. The Board of Directors has prepared the Company’s 2015 Business Report and a proposal for the allocation of profits has been reviewed by the Audit Committee which determined the aforementioned reports are in accordance with Company Law and the related regulations. According to Article 14-4 of the Securities and Exchange Act and Article 219 of the Company Law, we hereby submit this report.
Sincerely
The Company 2016 shareholders’ meeting
Compal Electronics, Inc and Subsidiaries
Audit Committee Chair:
May 11, 2016

102
6.4 Consolidated Financial Statements and Independent Auditors’ Report
Please refer to Attachment I. 6.5 Parent-Company-Only Financial Statements and Independent Auditors’ Report
Please refer to Attachment II.

103
VII. Review of Financial Conditions, Financial Performance, and Risk Management
7.1 Analysis of Financial Status
Unit: NT$ thousands
� Effect of changes on the company’s financial position: There have been no significant changes to the
Company’s financial position.
� Future response actions: Not applicable
Year
Analysis 2015 2014
Difference
Amount %
Current Assets 277,783,476 324,845,249 (47,061,773) (14.49)
Funds & Investments 11,788,042 11,694,855 93,187 0.80
Property, plant and equipment 24,308,631 24,472,732 (164,101) (0.67)
Other Assets 14,045,426 17,737,882 (3,692,456) (20.82)
Total Assets 327,925,575 378,750,718 (50,825,143) (13.42)
Current Liabilities 202,757,075 250,264,267 (47,507,192) (18.98)
Other Liabilities 15,570,384 22,266,514 (6,696,130) (30.07)
Total Liabilities 218,327,459 272,530,781 (54,203,322) (19.89)
Share capital 44,711,266 44,232,366 478,900 1.08
Capital reserves 12,838,638 14,296,445 (1,457,807) (10.20)
Retained Earnings 51,877,511 47,721,872 4,155,639 8.71
Other Adjustments (3,926,881) (3,139,021) (787,860) 25.10
Treasury stock (1,724,739) (1,724,739) - -
Non-controlling Equity 5,822,321 4,833,014 989,307 20.47
Total Shareholders’ Equity 109,598,116 106,219,937 3,378,179 3.18
Note: Analysis of variations exceeding 20% and amounting to more than NTD10 million:
� The decrease in other assets: are mainly due to the increase of the unrealized valuation loss of
available-for-sale financial assets (non-current) and the disposal of available-for-sale financial assets
(non-current).
� The decrease in non-current liability: is mainly due to the decrease of long-term debt.
� The decrease of other equity: is mainly due to the increase of the unrealized loss of available-for-sale financial
assets, the increase of exchange differences arising from the translation of the financial statements of foreign
operations, and the increase of unearned employee benefits and other increases.
� The increase of non-controlling interests: is mainly due to the addition of Company subsidiaries.
� The Company retroactively adjusted previous amounts in the financial statements effective January 1, 2014, due to the adoption of the 2013 International Accounting Standards endorsed by the Financial Supervisory Commission in the Republic of China as of January 1, 2015.
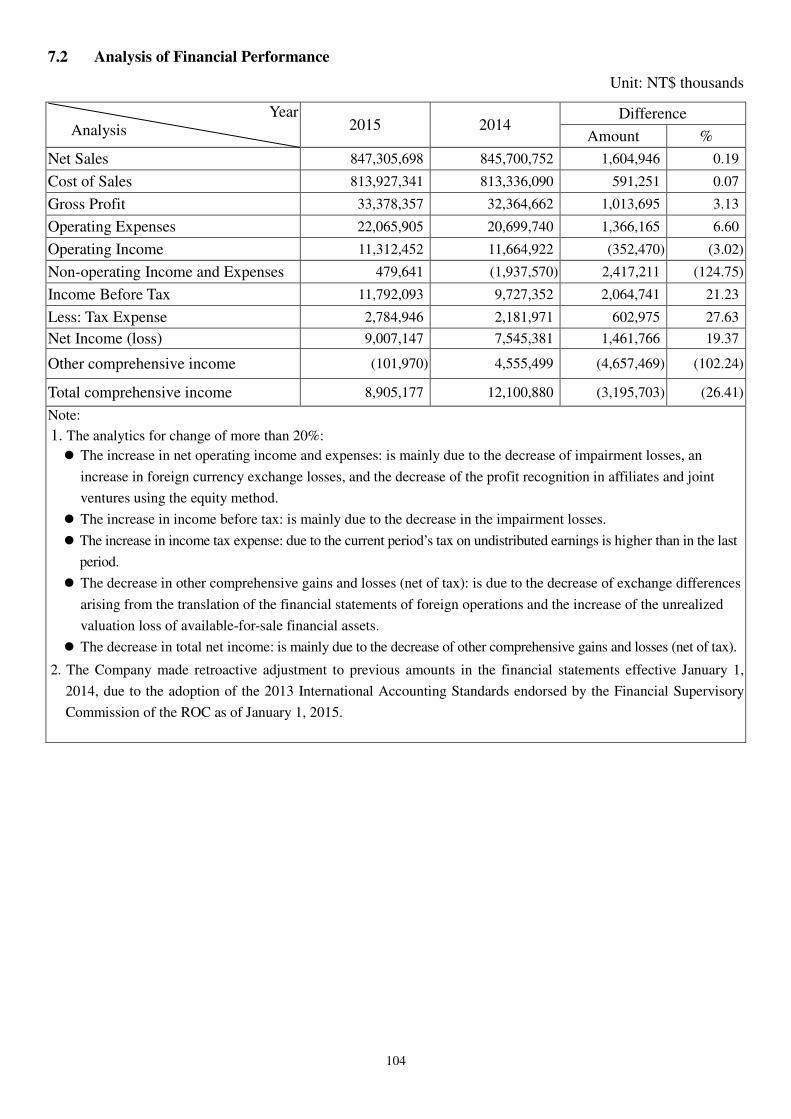
104
7.2 Analysis of Financial Performance
Unit: NT$ thousands
Year Analysis 2015 2014
Difference
Amount %
Net Sales 847,305,698 845,700,752 1,604,946 0.19
Cost of Sales 813,927,341 813,336,090 591,251 0.07
Gross Profit 33,378,357 32,364,662 1,013,695 3.13
Operating Expenses 22,065,905 20,699,740 1,366,165 6.60
Operating Income 11,312,452 11,664,922 (352,470) (3.02)
Non-operating Income and Expenses 479,641 (1,937,570) 2,417,211 (124.75)
Income Before Tax 11,792,093 9,727,352 2,064,741 21.23
Less: Tax Expense 2,784,946 2,181,971 602,975 27.63
Net Income (loss) 9,007,147 7,545,381 1,461,766 19.37
Other comprehensive income (101,970) 4,555,499 (4,657,469) (102.24)
Total comprehensive income 8,905,177 12,100,880 (3,195,703) (26.41)
Note:
1. The analytics for change of more than 20%:
� The increase in net operating income and expenses: is mainly due to the decrease of impairment losses, an
increase in foreign currency exchange losses, and the decrease of the profit recognition in affiliates and joint
ventures using the equity method.
� The increase in income before tax: is mainly due to the decrease in the impairment losses.
� The increase in income tax expense: due to the current period’s tax on undistributed earnings is higher than in the last
period.
� The decrease in other comprehensive gains and losses (net of tax): is due to the decrease of exchange differences
arising from the translation of the financial statements of foreign operations and the increase of the unrealized
valuation loss of available-for-sale financial assets.
� The decrease in total net income: is mainly due to the decrease of other comprehensive gains and losses (net of tax).
2. The Company made retroactive adjustment to previous amounts in the financial statements effective January 1,
2014, due to the adoption of the 2013 International Accounting Standards endorsed by the Financial Supervisory
Commission of the ROC as of January 1, 2015.

105
7.3 Analysis of Cash Flow
7.3.1 Cash Flow Analysis for the Current Year
Unit: NT$ thousands
7.3.2 Cash Flow Analysis for the Coming Year
Unit: NT$ thousands
Cash and Cash Equivalents,
Beginning of Year (1)
Net Cash Flow from Operating
Activities (2)
Cash Outflow
(3)
Cash Surplus (Deficit)
(1)+(2)-(3)
Financing of Cash Deficit
Investment Plans Financing Plans
74,708,130 9,534,256 21,490,844 62,751,542 - -
Note: 1. Analysis of the change of 2015 cash flow changes:
� Net cash inflow in operating activities of $9,534,256 thousand: mainly due to a decrease in profit from
operating and net changes of assets and liabilities from operating activities.
� Net cash outflow investing activities of $3,821,735 thousand: mainly due to the purchase of property, plant,
and equipment, disposal of investments using the equity method, and the purchase of available-for-sale
financial assets.
� The net outflow of financing activities of $19,232,562 thousand: mainly due to the repayment of debt and
cash dividends.
2. The remedy for cash shortfall: Not applicable.
3. Liquidity analysis: current assets to current liability ratio is $137% and liquidity is healthy.
Estimated Cash and Cash Equivalents, Beginning of
Year (1)
Estimated Net Cash Flow from
Operating Activities
(2)
Estimated Cash Outflow (Inflow)
(3)
Cash Surplus (Deficit)
(1)+(2)-(3)
Financing of Cash Surplus (Deficit)
Investment Plans Financing Plans
62,751,542 7,677,479 7,460,567 62,968,454 - -
Note: 1. Analysis of the 2016 cash flow changes:
� Net cash inflow in operating activities of $7,677,479 thousand: expect sales growth and profit from the
operation.
� Net cash outflow in investing activities of $6,691,011 thousand: expect to increase investment expenditures
next year.
� Net cash outflow in financing activities of $769,556 thousand: expect to distribute cash dividend and
increase/decrease in long-term and short-term debt next year.
2. Remedy for cash shortfall: Not applicable.
3. Liquidity analysis: the Company expects the cash at the beginning of the year plus expected net cash inflow
from operating activities to be sufficient to handle cash needs from investing and financing activities. The
liquidity is healthy.

106
7.4 Major Capital Expenditures
7.4.1 Major Capital Expenditures and Sources of Capital
Unit: NT$ thousands
Project Actual or Planned
Source of Capital
Actual or Planned
Date of Completion Total Capital
Actual or Expected Capital
Expenditure
2015
Investment in Avalue
Technology Inc. Private capital 2015 25,096 25,096
Investment in Lipo
Holding Private capital 2015 48,231 48,231
Note: APE: Ascendant Private Equity Investment Ltd.
7.4.2 Expected Benefits
1. Investment in Avalue Technology Inc: With this strategic investment Compal can extend product
applications into the industrial computer field, cut into the future business opportunities for health care and
IoT, adapt to a future industry development trend, and expand the depth and width of Company operation.
2. Investment in Lipo Holding: The Company invested in Liz Electronics (NanTong) Co. Ltd through Lipo
Holding Co Ltd, Liz Electronics (NanTong) Co Ltd produces electronic parts such as resistors and diodes
and this investment is intended to enhance the productivity and competitiveness of Liz Electronics
(NanTong) Co Ltd.
7.5 Investment Policy in the Last Year, Main Causes for Profits or Losses, Improvement Plans and
Investment Plans for the Coming Year
(1) Investment policy
1. Competition in the industry has accelerated and Compal is in full thrust integration mode. “Enlightened
Living and Computing with a Green Connection” is the Compal vision. Our long-term investment
strategies are to focus on products that relate to our core business, to provide the best quality in
computing, communications, consumer, cloud and connection, to provide full solutions in cost and
technology, and to put emphasis on our partner’s compliance with labor regulations, and the avoidance of
human trafficking and slavery. To strengthen the core resources through vertical integration,
diversification, and strategic investments or acquisitions as well as integration and horizontal
competition.
2. Improve post investment performance, strengthen the integration of Group resources and strategic
partnerships with investment businesses, facilitate the cooperation between the Company and invested
business, and require their full compliance with labor regulations and those against human trafficking and
slavery. Connect related customers to an information network, and form strategic alliances with other
industries. Sustain the performance of operating output in social, economic and environmental aspects
using a high standard of specification. This includes increasing the efficiency and productivity, improving
the rights of the workers, proper economic development, and environmentally friendly production in a
clean operating base. The Company fully supports investment companies with good performance to plan
for IPO to accelerate the realization of good return on investment.
(2) Main causes of profits or losses incurred on investments, and any corrective actions planned

107
The 2015 consolidated profits from investment using the equity method was NT$ 367 million, coming
mainly from the operation of Avalue Technology Inc, Compal Precision Module Co Ltd, and Allied Circuit
Co Ltd. We also consolidated and integrated similar operations between Synchro-Seiki and MacTech Co Ltd
(surviving company), both Company subsidiaries, to improve the efficiency of operation management.
(3) 2016 investment plans
The long-term investment plan next year will be based on the Company’s operating policy to position
ourselves as the pioneer provider of the mobile device solution and provide products, through the integration
of R&D resources and clients, of an all-in-one computer, TV, AE and enterprise servers. The Company
follows the principle of steady operation and always focuses on our core businesses. We expand on the
foundation of our existing businesses, make some vertical integrations where appropriate and expand
horizontally into related activities, while continuing to grow our core business.
In the vertical integration of upstream and downstream businesses, not involved in hardware production,
we also expand the size of our developers and the proportion of software and firmware, to increase the value
of their tangible assets and bring in value from additional sales.
We expect horizontal mergers and expansions to provide full IoT solutions for our clients which include
applications in cross-industry automation, industrial computers, security control, the healthcare industry, cars,
smart cities, smart buildings, restaurants and retail outlets, with the primary aim of providing new
investment opportunities and challenges.
In practice, apart from achieving internal growth under the existing business framework, we also accept
the possibility of mergers, acquisitions, joint ventures, technical calibrations and investment activities
through bilateral or multi-lateral collaboration between business entities.
The Company and its affiliates will proceed with the aforementioned expansion based on the
consideration of whether the expansion can strengthen the Group’s advantage and assessment of reasonable
risks. In terms of reinvestments, we follow the above mentioned principles and set basic principles in the
following three directions:
1. The vertical integration of upstream and downstream businesses to increase the proportion of self-made
parts and improve overall competitiveness.
2. Horizontal mergers and expansion of related products and services as well as other industries that provide
prominent synergy or growth.
3. Develop technology which is beneficial to the Company or its affiliates, or invest in assets that provide
synergy or growth.

108
7.6 Analysis of Risk Management
7.6.1 Effects of Changes in Interest Rates, Foreign Exchange Rates and Inflation on Corporate
Finance, and Future Response Measures
Unit: NTD thousand; %
Aspects 2015
Net interest revenue and expense (299,938)
Net gain on exchange (including valuation of financial instruments) (306,681)
Net revenues 847,305,698
Pre-tax income (Note) 11,792,093
Net interest revenue/expense to net revenues (0.035%)
Net interest revenue/expense to pre-tax income (2.544%)
Net exchange gains to net revenues (0.036%)
Net exchange gains to pre-tax income (2.601%)
1. Interest rate changes:
The most recent US Fed meeting statement showed the US economy is experiencing a moderate growth.
However, the international financial market is still volatile and the United States continues to face global economic
uncertainty. Therefore, the Fed revised the full-year economic growth rate downward to 2.2%, and reduced the rate
hike from four to two. The current federal funds rate is from 0.25 to 0.5%. The Central Bank of Taiwan has cut interest
rates three times since September 2015, lowering the rate by half a base point each time, to maintain stability of the
domestic financial environment and boost the economy. This down- wards revision is a response to the downwards
trend of the global economy, and the domestic economic recovery is still slow, as is the expansion of any quantitative
easing of monetary policy in major countries. The cash balance of the Company, as of the end of 2015, is about
$62.752 billion. The long and short-term bank borrowings are about $58.054 billion and the net interest expense for
the year was $299,938 thousand. These account for 0.035% and 2.544% of net sales and income before tax,
respectively. As of December 31, 2015, all other factors remain unchanged, the increase of 0.25% in interest will cause
an increase in income before tax of $7,629 thousand. The company will watch the change of interest closely and
respond in a timely manner if necessary.
2. Exchange rate changes:
The company is export –oriented. Therefore, the change and movement of exchange rate have a considerable
impact on the annual profit and loss. To minimize the impact on the Company's operating profit or loss, the Company
mainly utilizes hedging such as forward foreign exchange contracts and swaps to minimize the risks of exchange rate
movements. The full year net exchange gains and losses, including the valuation of financial assets, was $(306,681)
thousand, accounting for (0.036%) and (2.601%) of net revenue and net profit before tax, respectively, and this had
some impact on Company operations and profitability. As of December 31, 2015, all other factors remain unchanged,
a 5% appreciation of USD/TWD will increase the income before tax by $2,462,325 thousand. We will take all
necessary actions based on the fluctuation of the exchange rate in the future.
3. Inflation:
According to the Central Bank, the impact of the record low prices of international crude oil and raw material
will widen gap in negative domestic export. The Directorate-General of the Budget, Accounting and Statistics,
forecasts an annual CPI growth rate of 0.69%. While the CP outlook for this year remains stable, we will continue to
watch for potential impact on prices.
7.6.2 Policies, Main Causes of Gain or Loss and Future Response Measures with Respect to High-risk, High-leveraged Investments, Lending or Endorsement Guarantees, and Derivatives
109
Transactions
1. The Company does not make high-risk, high-leveraged investments.
2. The Company only offers financing to its related parties, mainly providing short-term financing for their
operating needs.
3. The Company is engaged in endorsement and guarantee activities which are only negotiated between
subsidiaries and the parent company. The arrangements are covered by proper Endorsement and Guarantee
Procedures.
4. The Company uses hedging strategy for the assets and liabilities valued using foreign currencies. The
hedging, which is done through forward foreign exchange contracts and swap trading, covers the amount of
net assets and liabilities. At the end of 2015, the Company position in open forward foreign exchange
contracts amounted to USD 20,000 thousand, EUR 59,140 thousand, and GBP 1,000 thousand and swap
contracts of USD 44,000 thousand. We will continue to pay close attention to changes in exchange rates
and execute timely hedging in the future.
5. In addition to prudent evaluation and control of the execution of related policies, the Company also relies
on regulations such as “Guidelines for Handling Acquisition and Disposal of Assets”, “Endorsement and
Guarantee Procedures”, “Third Party Lending Procedures” and “Procedures for the Handling of Derivatives
Trading”.
7.6.3 Future Research & Development Projects and Corresponding Budget
Other than the Company’s efforts in innovation and improvement of computers, TVs, and other peripheral
products, the Company also deems innovative research and development works as the niche for the Company’s
sustainable growth. Various R&D programs are developed and proposed by R&D team based on their forecast of new
technologies, understand of market trends, and intergration of add-on function. They also team with clients to meet
their market planning and detail product developments.
In general, the Company’s usually has less than one year product development cycle and aim to shorten the R&D
cycle year after year. The IT industry is highly competitive, and the timing of product development is of vital
importance. The rapid growth of sales has made the quality, experience and capacity of R&D a decisive factor that
will become the key as to whether the Company can achieve its sales target in 2016 and whether the existing clients
will renew their contracts. The 2016 R&D expense is expected to be more than NT$ 120 billion.
7.6.4 Effects of and Response to Changes in Policies and Regulations Relating to Corporate Finance
and Sales
The Company’s management team is paying close attention to any policies or regulations that may impact the
Company’s operation. In 2015, the Company made all the necessary responses to significant change in international
and domestic policies and regulations, without significant impact on Company operation.
7.6.5 Effects of and Response to Changes in Technology and the Industry Relating to Corporate
Finance and Sales
Tech products are always being updated and this changes user habits. The demand for different types of application is mushrooming. The presence of ARM and Android has also had an impact on Wintel, which used to have a market monopoly. To cope with these changes, the Company has expanded new business to its existing product lines to embrace the industry trends. As a result, the Company has established teams for innovative products, technology and design to strengthen Company research on consumer behavior, and provide more accurate market segregation and product positioning to satisfy user need. We are also focusing on innovative technology capability and plans for future product and market opportunities.

110
7.6.6 The Impact of Changes in Corporate Image on Corporate Risk Management, and the Company’s Response Measures
Compal has concentrated on the IT and Communications industry for many years and has firmly adhered to our
business philosophy of transcendence, sincerity, and harmony in a culture of ethics and honesty. We aim to be the best
in world-class professional design, manufacture and services. As we pursue business growth, we always remember our
obligations as a corporate citizen. We have strengthened Company governance, fulfilled our social responsibility, and
have established a good corporate image. In recent years, Company business has expanded, the number of employees
has increased and our global production branches have increased in number. We have become acutely aware of the
need for periodic checks of the external environment, a self-management system and operational strategies for the
early detection of potential corporate crises and the need for concrete and positive response plans and corrective
measures.
In 2015, Compal was again placed amongst the top 500 and top 2000 businesses by Fortune and Forbes Magazine, respectively. The Company also received the top 5% TWSE-listed Companies award in the first round of “Cooperate Governance Evaluation”, and was ranked as 16th in CSR Corporate Citizenship by CommonWealth magazine. Our corporate imaging has once again been publically affirmed. There were no Company crises in 2015 nor was there any significant event that affected the company image in any way.
7.6.7 Expected Benefits from, Risks Relating to and Response to Merger and Acquisition Plans
In addition to continued cultivation of the existing IT and IC operations and enhancement of the core profit base,
we are actively seeking out upcoming industries for merger, acquisition, joint venture, technical collaboration and
other patterns. The aim being to move into industrial computing, medical networking, IoT networking, vehicle
networking and the medical equipment market. We will maintain stable development of existing business and also
move ahead of the curve in other areas which have high growth momentum.
The Company will integrate resources to increase R&D capacity, improve operational efficiency, and increase
competitiveness. We expect to benefit from synergy, have positive impact on future shareholder equity, and maintain
adequate control of organizational integration matters and financial risks.
7.6.8 Expected Benefits from, Risks Relating to and Response to Factory Expansion Plans: None
7.6.9 Risks Relating to and Response to Excessive Concentration of Purchasing Sources and
Excessive Customer Concentration: None
7.6.10 Effects of, Risks Relating to and Response to Large Share Transfers or Changes in
Shareholdings by Directors, Supervisors, or Shareholders with Shareholdings of over 10%: None

111
7.6.11 Effects of, Risks Relating to and Response to the Changes in Management: None 7.6.12 Litigation or Non-litigation Matters
The Company and the Company’s subsidiaries, Zhaopal Investment Co., Ltd, Yongpal Investment Co., Ltd, and
Kaipal Investment Co. Ltd. (The Company and its subsidiaries) purchased newly issued shares of Chunghwa Picture
Tubes, Ltd. (“CPT”) through private placement in 2009. The Company and its subsidiaries purchased newly issued
common stocks via the private placement at the cost of NTD $2.5 dollars per share, amount to a total of NTD $7
billion. The Company signed an agreement with Tatung Company (“Tatung”) on such matter. In accordance with the
agreement, the Company has the right to request Tatung to purchase all the CPT shares obtained via the private
placement within certain agreed periods at the price the Company and its subsidiaires originally paid for the CPT
shares plus interest. Despite many requests sent from the Company, Tatung has not fulfilled its obligation in
accordance with the contract. The Company filed an arbitration based on the agreement on March 29, 2013, requesting
Tatung to perform its obligations. The Company received the verdict on May 12, 2014. According to the verdict,
Tatung should pay NTD $2,118,607 thousand to the Company and its subsidiaries for the purchase of all the CPT
shares held by the Company and its subsidiaries. Also, Tatung should pay the interest which is calculated at an annual
rate of 5% for the period from April 3, 2013 to the actual date of payment. Also, Tatung is responsible for one-third of
the legal expenses. With respect to the part which is not favorable to the Company, a civil complaint was lodged with
the Taiwan Taipei District Court on June 13, 2014, to revoke the arbitration award. This was rejected by the Taiwan
Taipei District Court on May 15, 2015. The Company then filed an appeal to the Taiwan High Court on June 12, 2015,
which was rejected on March 29, 2016. The Company appealed to the Taiwan Supreme Court on April 27, 2016.
7.6.13 Other Major Risks
International conglomerates faces many risks such as regulatory compliance, business competition, localization, and globalization. It is the responsibility of each Company employee to turn such challenges into future opportunity. Ex ante risk identification, weekly risk assessment and prevention, and post-crisis management, have all been added to the Company target management cycle (PDCA), key performance indicators (KPI), and control system for internal use. Such processes allow the dedicated units responsible for these specific risks to establish rigorous and rapid means for response and a problem-solving culture. By working through regular and irregular reviews and combining education, training and a performance risk appraisal system, they can cope with significantly different kinds of risk management based on local conditions. The company was not faced by any significant risk in 2015.

112
VIII. Special Disclosure
8.1 Summary of Affiliated Companies (As of Dec 31, 2015)
Compal Electronics
Technology
(Kunshan) Co.,
Ltd.
Compal Information
(Kunshan) Co., Ltd.
Compal Information
Technology
(Kunshan) Co., Ltd.
Compal Information
Research &
Development (Nanjing)
Co., Ltd.
Compal Digital Technology
(Kunshan) Co., Ltd.
Kunshan Botai Electronic Services
Co., Ltd.
Kunshan Botai Electronics Co.,
Ltd.
Compal Display Electronics
(Kunshan) Co., Ltd.
Compal Investment (Jiangsu) Co., Ltd.
Compal Electronics (China) Co.,
Ltd.
Compal Optoelectronics (Kunshan) Co.,
Ltd.
Compal System Trading
(Kunshan) Co., Ltd.
Compal Investment
(Sichuan) Co., Ltd.
Compal Electronics
(Chengdu) Co.,
Ltd.
Compal
Management
(Chengdu) Co., Ltd. Compal Electronics
(ChongQing) Co., Ltd.
Compal (Vietnam) Co., Ltd.
Compal Development & Management (Vietnam)
Co., Ltd.
Keppel Communication Pte Ltd (Nanjing) Co.,
Ltd.
Compal Digital Communications
(Nanjing) Co., Ltd.
Compal Communication (Nanjing) Inc.
Compal Broadband Networks, Inc.
98.79%
Rayonnant Technology Co.,
Ltd.
Ripal Optoelectronics Co., Ltd.
General life Biotechnology Co.,
Ltd.
Henghao Technology
Co., Ltd.
Mactech Co., Ltd.
Arcadyan Technology Corp.
36.04%
HANHELT Communications Co., Ltd.
UNICOM GLOBAL,
INC.
Huang Feng Communication Co., Ltd.
Kaipal Investment Co.,
Ltd.
Yongpal Investment Co.,
Ltd.
Zhaopal Investment Co.,
Ltd.
Hong Jin Investment Co.,
Ltd.
Hong Ji Capital Co., Ltd.
Gempal Technology Corp.
Panpal Technology Corp.
Accesstek Inc. 37.66%
Co
mp
al
Ele
ctro
nic
s, I
nc.

113
8.2 Private Placement of Securities in the Most Recent Year: None
8.3 Company Shares Held or Disposed by Subsidiaries in the Most Recent Year:
Unit: NT$ thousands; Shares; %
Name of Subsidiary
Share Capital Acquired
Funding Source
Percentage of Shares
Held by the Company
Date of Acquisition
or Disposition
Shares and Amount Acquired
Shares and Amount Disposed
Investment Gain (Loss)
Shareholdings and Amount as of March
31, 2016
Collateralized
Amount of Endorsements Made for the Subsidiary
Amount Loaned to
the Subsidiar
y
Panpal Technology Corporation
NTD 5,000,000,000 Proprietary capital
100% - - - - 31,648,082 shares NTD 559,812,000
N/A - -
Gempal Technology Co., Ltd.
NTD 900,000,000 Proprietary capital
100% - - - - 18,369,349 shares NTD 321,435,000
N/A - -
Note: Impacts on the Company’s financial performance and position: none of the subsidiaries had acquired or disposed the Company’s shares in the current year up till the publication date of this annual report, hence there were no impacts.
8.4 Any Events in 2015 and as of the Date of this Annual Report that had Significant Impacts on Shareholders’ Interests or Security Prices as
Stated in Item 2 Paragraph 2 of Article 36 of Securities and Exchange Law of Taiwan: None

1
Attachment I
Independent Auditors’ Report
To Compal Electronics, Inc.: We have audited the accompanying consolidated balance sheets of Compal Electronics, Inc. and subsidiaries as of December 31, 2015, and 2014 (retrospectively adjusted), the consolidated statements of comprehensive income for the years ended December 31, 2015 and 2014 (retrospectively adjusted), and changes in stockholders’ equity and cash flows for the years ended December 31, 2015 and 2014 (retrospectively adjusted). These consolidated financial statements are the responsibility of the Company’s management. Our responsibility is to express an opinion on these consolidated financial reports based on our audits.
We conducted our audits in accordance with the “Regulations Governing Auditing and Attestation of Financial Statements by Certified Public Accountants” and the generally accepted auditing standards in the Republic of China. Those standards and regulations require that we plan and perform the audit to obtain reasonable assurance about whether the consolidated financial reports are free of material misstatement. An audit includes examining, on a test basis, evidence supporting the amounts and disclosures in the consolidated financial reports. An audit also includes assessing the accounting principles used and significant estimates made by management, as well as evaluating the overall presentation of the consolidated financial reports. We believe that our audits provide a reasonable basis for our opinion. In our opinion, the consolidated financial reports referred to above present fairly, in all material respects, the consolidated financial position of Compal Electronics, Inc. as of December 31, 2015 and 2014 (retrospectively adjusted), and the results of their consolidated operations and their consolidated cash flows for the years then ended, in conformity with the Guidelines Governing the Preparation of Financial Reports by Securities Issuers, and International Financial Reporting Standards, International Accounting Standards, IFRIC Interpretations and SIC Interpretations endorsed by the Financial Supervisory Commission of the Republic of China.

Note to Readers The accompanying financial statements are intended only to present the consolidated financial position, results of operations, and cash flows in accordance with International Financial Reporting Standards, International Accounting Standards and interpretations endorsed by the Financial Supervisory Commissions in the Republic of China and not those of any other jurisdictions. The standards, procedures and practices to audit such consolidated financial statements are those generally accepted and applied in the Republic of China. The auditors’ report and the accompanying consolidated financial statements are the English translation of the Chinese version prepared and used in the Republic of China. If there is any conflict between, or any difference in the interpretation of, the English and Chinese language versions of the auditors’ report and consolidated financial statements, the Chinese version shall prevail.
As stated in note (6)(d) of the consolidated financial statements, Compal Electronics, Inc. and its subsidiaries recognized an impairment loss of NT$4,730,000 thousand on the equity investment in Chunghwa Picture Tubes, Ltd. for the three months ended March 31, 2014.
As stated in note (3)(a) of the consolidated financial reports, effective January 1, 2015, the consolidated financial reports of Compal Electronics, Inc. and its subsidiaries are prepared in conformity with International Financial Reporting Standards (2013), International Accounting Standards (2013), IFRIC Interpretations (2013) and SIC Interpretations (not including International Financial Reporting Standards 9) endorsed by the Financial Supervisory Commissions of the Republic of China, are retrospectively adjusted accordingly the consolidated financial statements for the year ended December 31, 2014. The adjustment did not have any significant impact to the consolidated financial reports. Compal Electronics Inc. has prepared the annual parent company only financial reports as of and for the years ended December 31, 2015 and 2014, on which we have issued a modified unqualified opinion. Taipei, Taiwan (the Republic of China) March 30, 2016

See accompanying notes to the consolidated financial statements.
(English Translation of Financial Report Originally Issued in Chinese) COMPAL ELECTRONICS, INC. AND SUBSIDIARIES
Consolidated Balance Sheets
December 31, 2015 and 2014
(expressed in thousands of New Taiwan dollars)
December 31, 2015 December 31, 2014 (retrospectively adjusted)
Assets Amount % Amount % Current assets:
Cash and cash equivalents $ 62,751,542 19.1 74,708,130 19.7 Current financial assets at fair value through profit or loss
25,412
-
184,093
-
Current available-for-sale financial assets 29,738 - 44,538 - Current derivative financial assets used for hedging 21,360 - - - Current bond investment without active market 350,000 0.1 350,000 0.1 Notes and accounts receivable, net 164,799,743 50.3 178,552,207 47.2 Notes and accounts receivable due from related parties, net
62,245
-
343,030
0.1
Other receivables 824,160 0.3 788,334 0.2 Inventories, net 46,520,021 14.2 67,270,875 17.8 Other current assets 2,399,255 0.7 2,604,042 0.7
277,783,476 84.7 324,845,249 85.8 Non-current assets:
Investments accounted for using equity method 11,788,042 3.6 11,694,855 3.1 Non-current available-for-sale financial assets 9,063,101 2.8 12,402,009 3.3 Non-current financial assets carried at cost 103,867 - 83,202 - Non-current bond investment without active market
1,050,000
0.3
1,400,000
0.4
Property, plant and equipment 24,308,631 7.4 24,472,732 6.4 Intangible assets 1,194,193 0.4 1,035,162 0.3 Deferred tax assets 1,377,465 0.4 1,653,141 0.4 Long-term prepaid rents 747,066 0.2 735,246 0.2 Other non-current assets 509,734 0.2 429,122 0.1
50,142,099 15.3 53,905,469 14.2
Total assets $ 327,925,575 100.0 378,750,718 100.0
December 31, 2015 December 31, 2014 (retrospectively adjusted)
Liabilities and equity Amount % Amount % Current liabilities:
Short-term borrowings $ 29,481,176 9.0 46,692,373 12.3 Current financial liabilities at fair value through profit or loss
29,215
-
39,310
-
Notes and accounts payable 127,152,784 38.8 170,739,133 45.1 Notes and accounts payable to related parties 1,473,760 0.4 1,167,152 0.3 Other payables 18,141,188 5.5 18,216,304 4.8 Current tax liabilities 4,196,978 1.3 2,180,985 0.6 Current provisions 2,388,710 0.7 2,066,581 0.5 Other current liabilities 3,929,073 1.2 3,233,431 0.9 Unearned revenue 1,747,574 0.5 2,294,765 0.6 Long-term borrowings, current portion 14,216,617 4.3 3,634,233 1.0
202,757,075 61.7 250,264,267 66.1 Non-current liabilities:
Long-term borrowings 14,356,563 4.4 20,504,301 5.4 Deferred tax liabilities 481,497 0.2 1,136,411 0.3 Net defined benefit liabilities 545,460 0.2 462,009 0.1 Non-current liabilities 186,864 0.1 163,793 -
15,570,384 4.9 22,266,514 5.8 Total liabilities 218,327,459 66.6 272,530,781 71.9
Equity attributable to owners of parent:
Ordinary shares 44,711,266 13.6 44,232,366 11.7 Capital surplus 12,838,638 3.9 14,296,445 3.8 Retained earnings 51,877,511 15.8 47,721,872 12.6 Other equity interest (3,926,881) (1.2) (3,139,021) (0.8) Treasury shares (1,724,739) (0.5) (1,724,739) (0.5)
103,775,795 31.6 101,386,923 26.8 Non-controlling interests 5,822,321 1.8 4,833,014 1.3
Total equity 109,598,116 33.4 106,219,937 28.1 Total liabilities and equity $ 327,925,575 100.0 378,750,718 100.0

See accompanying notes to the consolidated financial statements.
(English Translation of Financial Report Originally Issued in Chinese)
COMPAL ELECTRONICS, INC. AND SUBSIDIARIES
Consolidated Statements of Comprehensive Income
For the years ended December 31, 2015 and 2014 (expressed in thousands of New Taiwan Dollars, except net income per share)
2015
2014
(Retrospectively adjusted) Amount % Amount % Net sales revenue $ 847,305,698 100.0 845,700,752 100.0 Cost of sales 813,927,341 96.1 813,336,090 96.2 Gross profit 33,378,357 3.9 32,364,662 3.8 Operating expenses :
Selling expenses 5,011,950 0.6 3,746,315 0.4 Administrative expenses 4,804,295 0.6 4,842,391 0.6 Research and development expenses 12,249,660 1.4 12,111,034 1.4
22,065,905 2.6 20,699,740 2.4 Net operating income 11,312,452 1.3 11,664,922 1.4
Non-operating income and expenses: Other gains and losses (323,839) - 1,119,338 0.1 Finance costs (899,702) (0.1) (1,019,504) (0.1) Other income 1,495,156 0.2 1,800,129 0.2 Miscellaneous disbursements (37,562) - (37,566) - Impairment loss (121,574) - (4,777,920) (0.5) Share of gain of associates and joint ventures accounted for using equity method
367,162
-
977,953
0.1
Total non-operating income and expenses 479,641 0.1 (1,937,570) (0.2) Profit before tax 11,792,093 1.4 9,727,352 1.2 Less: tax expense 2,784,946 0.3 2,181,971 0.3
Profit 9,007,147 1.1 7,545,381 0.9 Other comprehensive income:
Items that will not be reclassified subsequently to profit or loss Other comprehensive income, before tax, remeasurement of defined benefit obligation
(93,596) - (42,088) -
Share of other comprehensive income of associates and joint ventures accounted for using equity method that will not be reclassified subsequently to profit or loss
(794) - (743) -
Less: income tax relating to items that will not be reclassified (15,911) - (6,010) -
subsequently to profit or loss (78,479) - (36,821) - Items that may be reclassified subsequently to profit or loss Other comprehensive income, before tax, exchange differences on translation of foreign financial statements
1,766,330 0.2 2,882,064 0.3
Other comprehensive income, before tax, available-for-sale financial assets (1,629,927) (0.2) 1,667,628 0.2 Loss on effective portion of cash flow hedges 21,360 - - - Share of other comprehensive income of associates and joint ventures accounted for using equity method that may be reclassified subsequently to profit or loss
(146,939) - 81,735 -
Less: income tax relating to items that may be reclassified 34,315 - 39,107 -
subsequently to profit or loss (23,491) - 4,592,320 0.5 Other comprehensive income, net of tax (101,970) - 4,555,499 0.5 Total comprehensive income $ 8,905,177 1.1 12,100,880 1.4 Profit, attributable to:
Profit, attributable to owners of parent $ 8,684,610 1.1 7,024,461 0.8 Profit, attributable to non-controlling interests 322,537 - 520,920 0.1
$ 9,007,147 1.1 7,545,381 0.9 Comprehensive income attributable to:
Comprehensive income, attributable to owners of parent $ 8,552,926 1.0 11,548,480 1.4 Comprehensive income, attributable to non-controlling interests 352,251 - 552,400 - $ 8,905,177 1.0 12,100,880 1.4
Earnings per share: Basic net income per share $ 2.01 1.63 Diluted net income per share $ 1.97 1.61

See accompanying notes to the consolidated financial statements.
(English Translation of Financial Report Originally Issued in Chinese) COMPAL ELECTRONICS, INC. AND SUBSIDIARIES
Consolidated Statements of Changes in Equity For the Years Ended December 31, 2015 and 2014
(expressed in thousands of New Taiwan dollars)
Equity attributable to owners of parent Retained earnings Other equity interest
Total
Exchange differences
on translation of
Unrealized gains
(losses)on
Unearned employee
Total equity
Non-
Ordinary Capital Legal Special Unappropriated retained foreign financial available-for-sale benefit Total other Treasury attributable to controlling shares surplus reserve reserve retained earnings earnings statements financial assets and others equity interest shares owners of parent interests Total equity Balance on January 1, 2014 $ 44,134,467 16,193,087 15,621,182 8,818,725 19,820,927 44,260,834 (1,846,674) (5,860,844) - (7,707,518) (2,007,725) 94,873,145 5,089,127 99,962,272
The effect of retroactively adjusted and retrospectively application
-
-
-
-
229,144
229,144
-
-
-
-
-
229,144
-
229,144
Balance on January 1, 2014 (retrospectively adjusted) 44,134,467 16,193,087 15,621,182 8,818,725 20,050,071 44,489,978 (1,846,674) (5,860,844) - (7,707,518) (2,007,725) 95,102,289 5,089,127 100,191,416
Profit for the year ended December 31, 2014 (retrospectively adjusted)
- - - - 7,024,461 7,024,461 - - - - - 7,024,461 520,920 7,545,381
Other comprehensive income - - - - (37,628) (37,628) 3,018,218 1,543,429 - 4,561,647 - 4,524,019 31,480 4,555,499
Comprehensive income (retrospectively adjusted) - - - - 6,986,833 6,986,833 3,018,218 1,543,429 - 4,561,647 - 11,548,480 552,400 12,100,880
Appropriation and distribution of retained earnings:
Legal reserve appropriated - - 246,721 - (246,721) - - - - - - - - -
Reversal of special reserve - - - (1,111,207) 1,111,207 - - - - - - - - -
Cash dividends of ordinary share - - - - (2,177,668) (2,177,668) - - - - - (2,177,668) - (2,177,668)
Cash dividends from capital surplus - (2,177,668) - - - - - - - - - (2,177,668) - (2,177,668)
Difference between consideration and carrying amount of subsidiaries acquired or disposed
-
3,492
-
-
(1,575,776)
(1,575,776)
6,763
87
-
6,850
-
(1,565,434)
(630,432)
(2,195,866)
Changes in ownership interests in subsidiaries - (3,720) - - (1,495) (1,495) - - - - - (5,215) - (5,215)
Changes in equity of associates and joint ventures accounted for using equity method
-
24,056
-
-
-
-
-
-
-
-
-
24,056
-
24,056
Issuance of shares for employee share options exercised 97,899 97,818 - - - - - - - - - 195,717 - 195,717
Share-based payment transaction - 109,389 - - - - - - - - 282,986 392,375 - 392,375
Adjustment to capital surplus for the company’s cash dividends received by subsidiaries
-
49,991
-
-
-
-
-
-
-
-
-
49,991
-
49,991
Changes in non-controlling interests - - - - - - - - - - - - (178,081) (178,081)
Balance on December 31, 2014 (retrospectively adjusted) 44,232,366 14,296,445 15,867,903 7,707,518 24,146,451 47,721,872 1,178,307 (4,317,328) - (3,139,021) (1,724,739) 101,386,923 4,833,014 106,219,937
Profit for the year ended December 31, 2015 - - - - 8,684,610 8,684,610 - - - - - 8,684,610 322,537 9,007,147
Other comprehensive income - - - - (71,032) (71,032) 1,624,754 (1,693,104) 7,698 (60,652) - (131,684) 29,714 (101,970)
Comprehensive income - - - - 8,613,578 8,613,578 1,624,754 (1,693,104) 7,698 (60,652) - 8,552,926 352,251 8,905,177
Appropriation and distribution of retained earnings:
Legal reserve appropriated - - 703,408 - (703,408) - - - - - - - - -
Reversal of special reserve - - - (4,568,497) 4,568,497 - - - - - - - - -
Cash dividends of ordinary share - - - - (4,428,781) (4,428,781) - - - - - (4,428,781) - (4,428,781)
Cash dividends from capital surplus - (2,214,390) - - - - - - - - - (2,214,390) - (2,214,390)
Difference between consideration and carring amount of subsidiaries acquired or disposed
-
258
-
-
-
-
-
-
-
-
-
258
-
258
Changes in ownership interests in subsidiaries - 28,275 - - (14,572) (14,572) - - - - - 13,703 - 13,703
Changes in equity of associates and joint ventures accounted for using equity method
-
5,824
-
-
(15,956)
(15,956)
-
-
-
-
-
(10,132)
-
(10,132)
Share-based payment transaction 478,900 647,200 - - 1,370 1,370 - - (727,208) (727,208) - 400,262 - 400,262
Adjustment to capital surplus for the company’s cash dividends received by subsidiaries
-
75,026
-
-
-
-
-
-
-
-
-
75,026
-
75,026
Changes in non-controlling interests - - - - - - - - - - - - 637,056 637,056
Balance on December 31, 2015 $ 44,711,266 12,838,638 16,571,311 3,139,021 32,167,179 51,877,511 2,803,061 (6,010,432) (719,510) (3,926,881) (1,724,739) 103,775,795 5,822,321 109,598,116
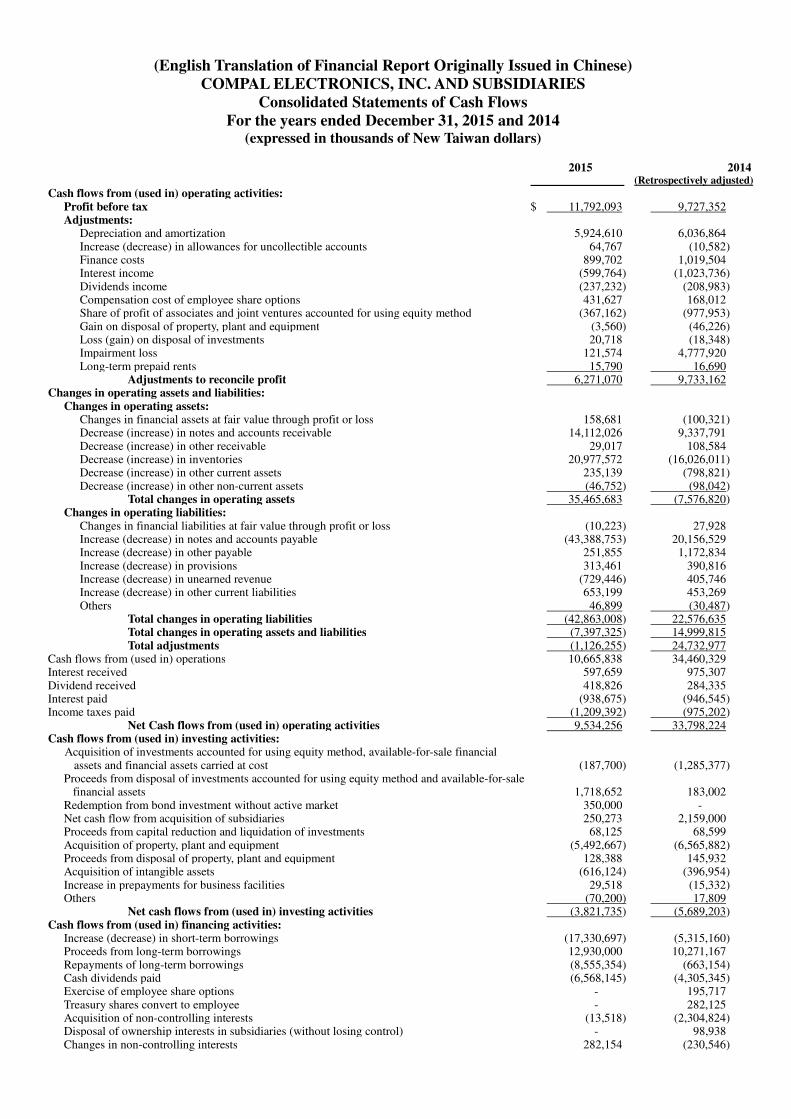
(English Translation of Financial Report Originally Issued in Chinese) COMPAL ELECTRONICS, INC. AND SUBSIDIARIES
Consolidated Statements of Cash Flows
For the years ended December 31, 2015 and 2014 (expressed in thousands of New Taiwan dollars)
2015
2014 (Retrospectively adjusted)
Cash flows from (used in) operating activities: Profit before tax $ 11,792,093 9,727,352 Adjustments:
Depreciation and amortization 5,924,610 6,036,864 Increase (decrease) in allowances for uncollectible accounts 64,767 (10,582) Finance costs 899,702 1,019,504 Interest income (599,764) (1,023,736) Dividends income (237,232) (208,983) Compensation cost of employee share options 431,627 168,012 Share of profit of associates and joint ventures accounted for using equity method (367,162) (977,953) Gain on disposal of property, plant and equipment (3,560) (46,226) Loss (gain) on disposal of investments 20,718 (18,348) Impairment loss 121,574 4,777,920 Long-term prepaid rents 15,790 16,690
Adjustments to reconcile profit 6,271,070 9,733,162 Changes in operating assets and liabilities:
Changes in operating assets: Changes in financial assets at fair value through profit or loss 158,681 (100,321) Decrease (increase) in notes and accounts receivable 14,112,026 9,337,791 Decrease (increase) in other receivable 29,017 108,584 Decrease (increase) in inventories 20,977,572 (16,026,011) Decrease (increase) in other current assets 235,139 (798,821) Decrease (increase) in other non-current assets (46,752) (98,042)
Total changes in operating assets 35,465,683 (7,576,820) Changes in operating liabilities:
Changes in financial liabilities at fair value through profit or loss (10,223) 27,928 Increase (decrease) in notes and accounts payable (43,388,753) 20,156,529 Increase (decrease) in other payable 251,855 1,172,834 Increase (decrease) in provisions 313,461 390,816 Increase (decrease) in unearned revenue (729,446) 405,746 Increase (decrease) in other current liabilities 653,199 453,269 Others 46,899 (30,487)
Total changes in operating liabilities (42,863,008) 22,576,635 Total changes in operating assets and liabilities (7,397,325) 14,999,815 Total adjustments (1,126,255) 24,732,977
Cash flows from (used in) operations 10,665,838 34,460,329 Interest received 597,659 975,307 Dividend received 418,826 284,335 Interest paid (938,675) (946,545) Income taxes paid (1,209,392) (975,202)
Net Cash flows from (used in) operating activities 9,534,256 33,798,224 Cash flows from (used in) investing activities:
Acquisition of investments accounted for using equity method, available-for-sale financial assets and financial assets carried at cost
(187,700)
(1,285,377)
Proceeds from disposal of investments accounted for using equity method and available-for-sale financial assets
1,718,652
183,002
Redemption from bond investment without active market 350,000 - Net cash flow from acquisition of subsidiaries 250,273 2,159,000 Proceeds from capital reduction and liquidation of investments 68,125 68,599 Acquisition of property, plant and equipment (5,492,667) (6,565,882) Proceeds from disposal of property, plant and equipment 128,388 145,932 Acquisition of intangible assets (616,124) (396,954) Increase in prepayments for business facilities 29,518 (15,332) Others (70,200) 17,809
Net cash flows from (used in) investing activities (3,821,735) (5,689,203) Cash flows from (used in) financing activities:
Increase (decrease) in short-term borrowings (17,330,697) (5,315,160) Proceeds from long-term borrowings 12,930,000 10,271,167 Repayments of long-term borrowings (8,555,354) (663,154) Cash dividends paid (6,568,145) (4,305,345) Exercise of employee share options - 195,717 Treasury shares convert to employee - 282,125 Acquisition of non-controlling interests (13,518) (2,304,824) Disposal of ownership interests in subsidiaries (without losing control) - 98,938 Changes in non-controlling interests 282,154 (230,546)

Others 22,998 58,941 Net cash flows from (used in) financing activities (19,232,562) (1,912,141)
Effect of exchange rate changes on cash and cash equivalents 1,563,453 1,545,398 Net increase (decrease) in cash and cash equivalents (11,956,588) 27,742,278 Cash and cash equivalents at beginning of period 74,708,130 46,965,852 Cash and cash equivalents at end of period $ 62,751,542 74,708,130

Attachment II
Independent Auditors’ Report
To Compal Electronics, Inc.:
We have audited the accompanying balance sheets of Compal Electronics, Inc. as of December 31, 2015 and 2014 (retrospectively adjusted), and the statements of comprehensive income, and changes in equity and cash flows for the years ended December 31, 2015 and 2014 (retrospectively adjusted). These annual parent company only financial reports are the responsibility of the Company’s management. Our responsibility is to express an opinion on these annual parent company only financial reports based on our audits. We conducted our audits in accordance with the “Regulations Governing Auditing and Attestation of Financial Statements by Certified Public Accountants” and the generally accepted auditing standards in the Republic of China. Those standards and regulations require that we plan and perform the audit to obtain reasonable assurance about whether the annual parent company only financial reports are free of material misstatement. An audit includes examining, on a test basis, evidence supporting the amounts and disclosures in the annual parent company only financial reports. An audit also includes assessing the accounting principles used and significant estimates made by management, as well as evaluating the overall presentation of the annual parent company only financial reports. We believe that our audits provide a reasonable basis for our opinion. In our opinion, the annual parent company only financial reports referred to above present fairly, in all material respects, the financial position of Compal Electronics, Inc. as of December 31, 2015 and 2014 (retrospectively adjusted), and the results of its operations and its cash flows for the years ended December 31, 2015 and 2014 (retrospectively adjusted), in conformity with the Guidelines Governing the Preparation of Financial Reports by Securities Issuers. As stated in note (6)(c) of the annual parent company only financial reports, Compal Electronics, Inc. recognized both the impairment loss of $1,689,000,000 on the equity investment in Chunghwa Picture Tubes, Ltd. and the related share of loss of associates and joint ventures accounted for using equity method of 3,041,000,000 for the three months ended March 31, 2014.

Note to Readers The accompanying financial reports are intended only to present the financial position, results of operations, and cash flows in accordance with the Guidelines Governing the Preparation of Financial Reports by Securities Issuers and not those of any other jurisdictions. The standards, procedures and practices to audit such financial reports are those generally accepted and applied in the Republic of China. The auditors’ report and the accompanying financial reports are the English translation of the Chinese version prepared and used in the Republic of China. If there is any conflict between, or any difference in the interpretation of, the English and Chinese language versions of the auditors’ report and financial reports, the Chinese version shall prevail.
As stated in note (3)(a) of the annual parent company only financial reports, effective January 1, 2015, the annual parent company only financial reports of Compal Electronics, Inc. are prepared in conformity with International Financial Reporting Standards (2013), International Accounting Standards (2013), IFRIC Interpretations (2013) and SIC Interpretations (not including International Financial Reporting Standards 9) endorsed by the Financial Supervisory Commissions R.O.C., and the annual parent company only financial reports for the year ended December 31, 2014 are retrospectively adjusted accordingly. The adjustment did not have any significant impact to the annual parent company only financial reports. March 30, 2016

COMPAL ELECTRONICS, INC.
Balance Sheets
December 31, 2015 and 2014 (expressed in thousands of New Taiwan dollars)
December 31, 2015 December 31, 2014 (retrospectively adjusted)
Assets Amount % Amount % Current assets:
Cash and cash equivalents $ 30,797,312 10.4 43,095,497 12.5 Current financial assets at fair value through profit or loss
-
-
114,111
-
Current available-for-sale financial assets 29,738 - 44,538 - Current bond investment without active market
350,000
0.1
350,000
0.1
Notes and accounts receivable, net 148,844,537 50.2 166,442,177 48.5 Notes and accounts receivable due from related parties, net
973,946
0.3
3,085,099
0.9
Other receivables 553,185 0.3 427,096 0.1 Inventories 25,344,975 8.6 41,528,853 12.1 Other current assets 603,115 0.2 522,183 0.2 207,496,808 70.1 255,609,554 74.4
Non-current assets:
Investments accounted for using equity method
78,006,762
26.3
73,585,998
21.4
Non-current available-for-sale financial assets
5,970,903
2.0
8,735,528
2.6
Non-current financial assets at cost 6,588 - 6,588 - Non-current bond investment without active market
1,050,000
0.4
1,400,000
0.4
Property, plant and equipment 2,181,737 0.7 2,230,023 0.7 Intangible assets 378,454 0.1 412,185 0.1 Deferred tax assets 1,042,365 0.4 1,336,919 0.4 Other non-current assets 105,422 - 114,320 -
88,742,231 29.9 87,821,561 25.6 Total assets $ 296,239,039 100.0 343,431,115 100.0
December 31, 2015 December 31, 2014
(retrospectively adjusted)
Liabilities and equity Amount % Amount % Current liabilities:
Short-term borrowings $ 22,087,200 7.5 28,667,700 8.3 Notes and accounts payable 63,996,915 21.6 101,637,875 29.6 Notes and accounts payable to related parties
62,361,931
21.1
74,153,547
21.6
Other payables 8,957,625 3.0 8,133,574 2.4 Current tax liabilities 2,200,353 0.7 583,444 0.2 Current provisions 2,034,677 0.7 1,676,185 0.5 Other current liabilities 428,602 0.1 645,522 0.2 Unearned revenue 1,747,574 0.6 2,293,685 0.6 Long-term borrowings, current portion 13,850,000 4.7 3,000,000 0.9
177,664,877 60.0 220,791,532 64.3 Non-current liabilities:
Long-term borrowings 13,740,000 4.6 19,660,000 5.7 Deferred tax liabilities 448,762 0.2 1,117,063 0.3 Non-current net defined benefit liabilities 469,846 0.2 399,130 0.1 Other non-current liabilities 139,759 - 76,467 -
14,798,367 5.0 21,252,660 6.1 Total liabilities 192,463,244 65.0 242,044,192 70.4
Equity attributable to owners of parent:
Ordinary shares 44,711,266 15.1 44,232,366 12.9 Capital surplus 12,838,638 4.3 14,296,445 4.2 Retained earnings 51,877,511 17.5 47,721,872 13.9 Other equity interest (3,926,881) (1.3) (3,139,021) (0.9) Treasury shares (1,724,739) (0.6) (1,724,739) (0.5)
Total equity 103,775,795 35.0 101,386,923 29.6
Total liabilities and equity $ 296,239,039 100.0 343,431,115 100.0

COMPAL ELECTRONICS, INC.
Statements of Comprehensive Income
For the years ended December 31, 2015 and 2014 (expressed in thousands of New Taiwan dollars, except net income per share amounts)
2015 2014 (retrospectively adjusted) Amount % Amount % Net sales revenue $ 802,994,930 100.0 803,504,061 100.0 Cost of sales 780,260,207 97.2 782,209,491 97.4 Gross profit 22,734,723 2.8 21,294,570 2.6 Less: Unrealized profit from sales (2,867) - 5,657 -
Gross profit 22,737,590 2.8 21,288,913 2.6 Operating expenses:
Selling expenses 3,798,280 0.5 2,260,919 0.3 Administrative expenses 2,581,758 0.3 2,563,289 0.3 Research and development expenses 9,052,274 1.1 9,172,949 1.1
15,432,312 1.9 13,997,157 1.7 Net operating income 7,305,278 0.9 7,291,756 0.9
Non-operating income and expenses: Other gains and losses 293,589 - 951,688 0.1 Finance costs (604,735) - (515,563) (0.1) Other income 786,958 0.1 751,602 0.1 Share of profit of subsidiaries, associates and joint ventures accounted for using equity method
2,413,800
0.3
790,247
0.1
Impairment loss (32,000) - (1,691,121) (0.2) Total non-operating income and expenses 2,857,612 0.4 286,853 -
Profit before tax 10,162,890 1.3 7,578,609 0.9
Less: tax expense 1,478,280 0.2 554,148 - Profit 8,684,610 1.1 7,024,461 0.9
Other comprehensive income: Items that may not be reclassified subsequently to profit or loss
Other comprehensive income, before tax, remeasurement of defined benefit plans
(79,571)
-
(43,607)
-
Share of other comprehensive income of subsidiaries, associates and joint ventures accounted for using equity method that may not be reclassified subsequently to profit or loss
(4,988)
-
(289)
-
Less: income tax relating to items that may not be reclassified (13,527) - (6,268) - Items that may not be reclassified subsequently to profit or loss (71,032) - (37,628) -
Items that may be reclassified subsequently to profit or loss Other comprehensive income, before tax, exchange differences on translation 2,011,139 0.2 2,903,749 0.3 Other comprehensive income, before tax, available-for-sale financial assets (1,695,723) (0.2) 1,391,202 0.2 Share of other comprehensive income of subsidiaries, associates and joint ventures accounted for using equity method that may be reclassified subsequently to profit or loss
(357,582)
-
269,533
-
Less: income tax relating to items that may be reclassified 18,486 - 2,837 - Items that may be reclassified subsequently to profit or loss (60,652) - 4,561,647 0.5
Other comprehensive income, net of tax (131,684) - 4,524,019 0.5 Total comprehensive income $ 8,552,926 1.1 11,548,480 1.4
Earnings per share:
Basic net income per share $ 2.01 1.63
Diluted net income per share $ 1.97 1.61

COMPAL ELECTRONICS, INC.
Statements of Changes in Equity For the years ended December 31, 2015 and 2014
(expressed in thousands of New Taiwan dollars)
Retained earnings Other equity interest
Total
Exchange differences
on translation
Unrealized gains
(losses) on
Unearned employee
Ordinary Capital Legal Special Unappropriated retained of foreign financial available-for-sale benefit Total other Treasury shares surplus reserve reserve retained earnings earnings statements financial assets and others equity interest shares Total equity Balance on January 1, 2014 $ 44,134,467 16,193,087 15,621,182 8,818,725 19,820,927 44,260,834 (1,846,674) (5,860,844) - (7,707,518) (2,007,725) 94,873,145
The effect of retroactive adjustment and retrospective application - - - - 229,144 229,144 - - - - - 229,145
Balance on January 1, 2014 (retrospectively adjusted) 44,134,467 16,193,087 15,621,182 8,818,725 20,050,071 44,489,978 (1,846,674)) (5,860,844) - (7,707,518) (2,007,725) 95,102,289
Profit for the year ended December 31, 2014 (retrospectively adjusted) - - - - 7,024,461 7,024,461 - - - - - 7,024,461
Other comprehensive income - - - - (37,628) (37,628) 3,018,218 1,543,429 - 4,516,647 - 4,524,019
Total comprehensive income (retrospectively adjusted) - - - - 6,986,833 6,986,833 3,018,218 1,543,429 - 4,516,647 - 11,548,480
Appropriation and distribution of retained earnings (note 1):
Legal reserve appropriated - - 246,721 - (246,721) - - - - - - -
Reversal of special reserve - - - (1,111,207) 1,111,207 - - - - - - -
Cash dividends of ordinary share - - - - (2,177,668) (2,177,668) - - - - - (2,177,668)
Cash dividends from capital surplus - (2,177,668) - - - - - - - - - (2,177,668)
Difference between consideration and carrying amount arising from acquisition or disposal of subsidiaries
-
3,492
-
-
(1,575,776)
(1,575,776)
6,763
87
-
6,850
-
(1,565,434)
Changes in ownership interests in subsidiaries - (3,720) - - (1,495) (1,495) - - - - - (5,215)
Changes in equity of associates and joint ventures accounted for using equity method
-
24,056
-
-
-
-
-
-
- -
-
24,056
Issuance of shares for employee share options exercised 97,899 97,818 - - - - - - - - - 195,717
Share-based payment transaction - 109,389 - - - - - - - - 282,986 392,375
Adjustments of capital surplus for the Company’s cash dividends received by subsidiaries
-
49,991
-
-
-
-
-
-
-
-
-
49,991
Balance on December 31, 2014 (retrospectively adjusted) 44,232,366 14,296,445 15,867,903 7,707,518 24,146,451 47,721,872 1,178,307 (4,317,328) - (3,139,021) (1,724,739) 101,386,923
Profit for the year ended December 31, 2015 - - - - 8,684,610 8,684,610 - - - - - 8,684,610
Other comprehensive income - - - - (71,032) (71,032) 1,624,754 (1,693,104) 7,698 (60,652) - (131,684)
Total comprehensive income - - - - 8,613,578 8,613,578 1,624,754 (1,693,104) 7,698 (60,652) - 8,552,926
Appropriation and distribution of retained earnings (note 2):
Legal reserve appropriated - - 703,408 - (703,408) - - - - - - -
Reversal of special reserve - - - (4,568,497) 4,568,497 - - - - - - -
Cash dividends of ordinary share - - - - (4,428,781) (4,428,781) - - - - - (4,428,781)
Cash dividends from capital surplus - (2,214,390) - - - - - - - - - (2,214,390)
Difference between consideration and carrying amount arising from acquisition or disposal of subsidiaries
-
258
-
-
-
-
-
-
-
-
-
258
Changes in ownership interests in subsidiaries - 28,275 - - (14,572) (14,572) - - - - - 13,703
Changes in equity of associates and joint ventures accounted for using equity method
-
5,824
-
-
(15,956)
(15,956)
-
-
-
-
-
(10,132)
Share-based payment transaction 478,900 647,200 - - 1,370 1,370 - - (727,208) (727,208) - 400,262
Adjustments of capital surplus for the Company’s cash dividends received by subsidiaries
-
75,026
-
-
-
-
-
-
-
-
-
75,026
Balance on December 31, 2015 $ 44,711,266 12,838,638 16,571,311 3,139,021 32,167,179 51,877,511 2,803,061 (6,010,432) (719,510) (3,926,881) (1,724,739) 103,775,795
Note 1: Directors’ and supervisors’ remuneration amounting to $21,761 and employee bonuses amounting to $314,199 were recognized in the 2013 statement of comprehensive income. Note 2: Directors’ and supervisors’ remuneration amounting to $49,379 and employee bonuses amounting to $895,790 were recognized in the 2014 statement of comprehensive income.

COMPAL ELECTRONICS, INC.
Statements of Cash Flows
For the years ended December 31, 2015 and 2014
(expressed in thousands of New Taiwan dollars)
2015 2014
(retrospectively
adjusted) Cash flows from (used in) operating activities:
Profit before tax $ 10,162,890 7,578,609 Adjustments:
Depreciation and amortization 698,496 855,418 Increase in allowances for uncollectible accounts 27,627 7,381 Interest expense 604,735 515,563 Interest income (153,268) (158,627) Dividends income (170,537) (147,794) Compensation cost arising from share-based payment transaction 400,262 110,250 Share of profit of subsidiaries, associates and joint ventures accounted for using
equity method (2,413,800) (790,247)
Loss (gain) on disposal of investments (405,885) 46,381 Impairment loss on financial assets 32,000 1,691,121
Adjustments to reconcile profit (1,380,370) 2,129,446 Changes in operating assets and liabilities:
Changes in operating assets: Changes in financial assets at fair value through profit or loss 114,111 (40,193) Decrease (increase) in notes and accounts receivable 19,681,148 10,794,135 Decrease (increase) in inventories 16,183,878 (11,096,332) Decrease (increase) in other current assets (80,932) (124,932) Decrease (increase) in other receivable (150,363) 506,306
Total changes in operating assets 35,747,842 38,984 Changes in operating liabilities:
Increase (decrease) in notes and accounts payable (49,432,576) 23,378,885 Increase (decrease) in other payables 807,475 (926,097) Increase (decrease) in provisions 358,492 271,965 Increase (decrease) in unearned revenue (546,111) 410,956 Increase (decrease) in other current liabilities (216,920) 231,895 Other (26,483) 48,003
Total changes in operating liabilities (49,056,123) 23,415,607 Total changes in operating assets and liabilities (13,308,281) 23,454,591
Total adjustments (14,688,651) 25,584,037 Cash flows from (used in) operations (4,525,761) 33,162,646 Interest received 160,900 168,543 Dividends received 900,359 750,407 Interest paid (588,159) (489,520) Income taxes paid (240,077) (184,371)
Net cash flows from (used in) operating activities (4,292,738) 33,407,705 Cash flows from (used in) investing activities:
Acquisition of investments accounted for using equity method, available-for-sale financial assets and bond investment without active market
(1,023,451)
(1,421,025)
Proceeds from disposal of investments accounted for using equity method and available-for sale financing assets
1,489,852
195,597
Redemption from bond investment without active market 350,000 - Net cash outflows resulted from business combination - (534,954) Proceeds from capital reduction and liquidation of investments 51,520 65,776 Acquisition of property, plant and equipment (153,958) (110,730) Decrease (increase) in other receivable due from related parties 27,733 373,037

Acquisition of intangible assets (470,768) (307,808) Other 17,144 16,407
Net cash flows from (used in) investing activities 288,072 (1,723,700) Cash flows from (used in) financing activities:
Increase (decrease) in short-term borrowings (6,580,500) (4,736,756) Proceeds from long-term borrowings 12,770,000 10,100,000 Repayments of long-term borrowings (7,840,000) (240,000) Cash dividends paid (6,643,171) (4,355,336) Exercise of employee share options - 195,717 Treasury shares convert to employee - 282,125 Other 152 3
Net cash flows from (used in) financing activities (8,293,519) 1,245,753 Net increase (decrease) in cash and cash equivalents (12,298,185) 32,929,758 Cash and cash equivalents at beginning of period 43,095,497 10,165,739 Cash and cash equivalents at end of period $ 30,797,312 43,095,497

Compal Electronics, Inc.
Chairman: Sheng-Hsiun Hsu (Rock Hsu)
Chief Executive Officer (CEO): Jui-Tsung Chen (Ray Chen)