Embed Size (px)
Citation preview
DOE/EM-0548
Compact HighResolution
Spectrometer
Characterization, Monitoring, and SensorTechnology Crosscutting Program
Prepared forU.S. Department of Energy
Office of Environmental ManagementOffice of Science and Technology
September 2000
Compact HighResolution Spectrometer
OST/TMS ID 1564
Characterization, Monitoring, and SensorTechnology Crosscutting Program
Demonstrated atAmes Laboratory
Ames, IowaDiagnostic Instrumentation and Analysis Laboratory
Mississippi State UniversityStarkville, Mississippi
iii
Purpose of this document
Innovative Technology Summary Reports are designed to provide potential users with theinformation they need to quickly determine whether a technology would apply to a particularenvironmental management problem. They are also designed for readers who mayrecommend that a technology be considered by prospective users.
Each report describes a technology, system, or process that has been developed and testedwith funding from DOE’s Office of Science and Technology (OST). A report presents the fullrange of problems that a technology, system, or process will address and its advantages to theDOE cleanup in terms of system performance, cost, and cleanup effectiveness. Most reportsinclude comparisons to baseline technologies as well as other competing technologies.Information about commercial availability and technology readiness for implementation is alsoincluded. Innovative Technology Summary Reports are intended to provide summaryinformation. References for more detailed information are provided in an appendix.
Efforts have been made to provide key data describing the performance, cost, and regulatoryacceptance of the technology. If this information was not available at the time of publication,the omission is noted.
All published Innovative Technology Summary Reports are available on the OST Web site athttp://ost.em.doe.gov under “Publications.”
TABLE OF CONTENTS
1. SUMMARY page 1
2. TECHNOLOGY DESCRIPTION page 5
3. PERFORMANCE page 8
4. TECHNOLOGY APPLICABILITY AND ALTERNATIVES page 16
5. COST page 21
6. REGULATORY AND POLICY ISSUES page 27
7. LESSONS LEARNED page 29
APPENDICES
A. REFERENCES page A-1
B. ACRONYMS AND ABBREVIATIONS page B-1
C. LIMITS OF DETECTION page C-1
U. S. Department of Energy 1
SECTION 1
Technology Summary
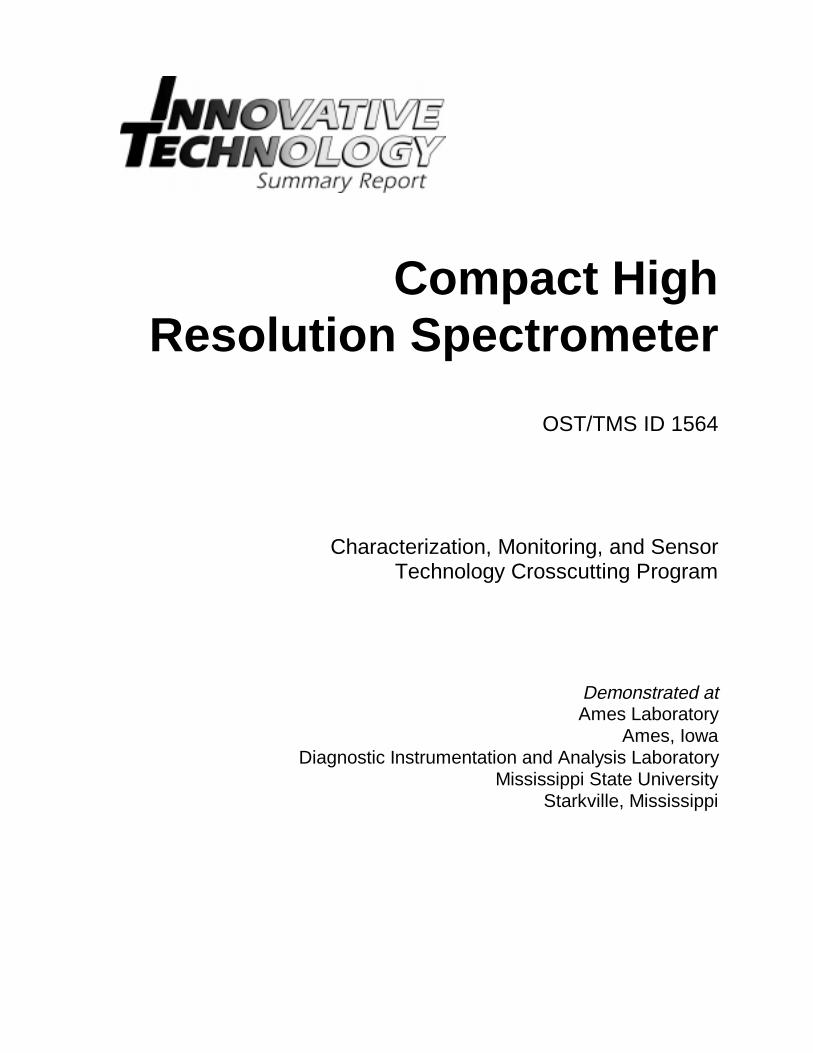
This report describes the cost, performance, and other key characteristics of an innovative technologycomponent, the Compact High Resolution Spectrometer (CHRS) (OST Reference Number 1564).
Figure 1. Photograph of the CHRS on an optical bench. It is 36 inches long by 12.5 inches wide by 5.5inches high and weighs only 46 pounds — less than one-tenth the size and weight of aconventional spectrometer with comparable resolution.
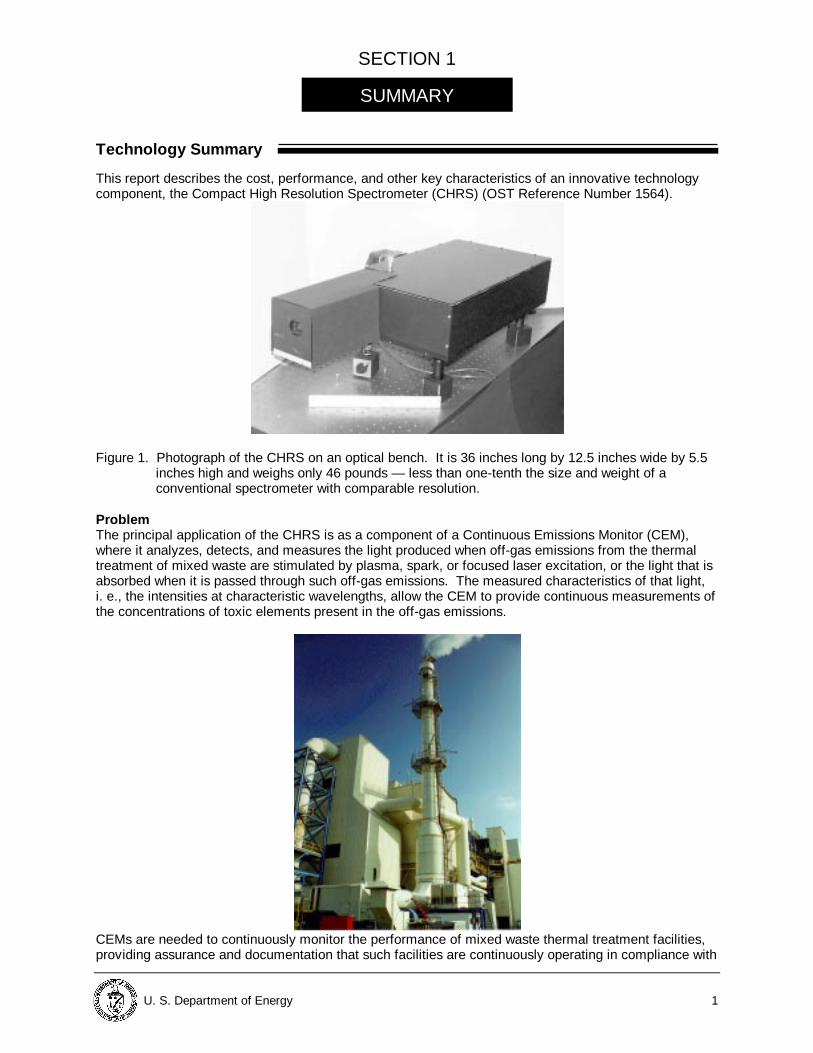
ProblemThe principal application of the CHRS is as a component of a Continuous Emissions Monitor (CEM),where it analyzes, detects, and measures the light produced when off-gas emissions from the thermaltreatment of mixed waste are stimulated by plasma, spark, or focused laser excitation, or the light that isabsorbed when it is passed through such off-gas emissions. The measured characteristics of that light,i. e., the intensities at characteristic wavelengths, allow the CEM to provide continuous measurements ofthe concentrations of toxic elements present in the off-gas emissions.
CEMs are needed to continuously monitor the performance of mixed waste thermal treatment facilities,providing assurance and documentation that such facilities are continuously operating in compliance with
SUMMARY
2 U.S. Department of Energy
regulatory emissions standards. The principal target application area for the CHRS is as a component ofa multi-metals CEM capable of monitoring the volatile metal, mercury (Hg), two semi-volatile metals,cadmium (Cd) and lead (Pb), and three low-volatile metals, arsenic (As), beryllium (Be), and chromium(Cr). The U. S. Environmental Protection Agency (EPA) has classified these metals as hazardous airpollutants (HAPs) and has proposed and promulgated new regulations limiting their emission fromhazardous waste combustors (HWCs) (EPA 1996, EPA 1999). The new regulations promulgate revisedemission standards and clearly establish CEMs as the preferred1 method for compliance monitoring.The new regulations are commonly referred to as the MACT rule because the emission limits are basedon what the agency has determined is the current Maximum Achievable Control Technology (MACT).
The MACT rule includes provisions for the optional use of CEMs for the 6 toxic elements listed above.Furthermore, to provide an incentive for the use of CEMs, the rule does not require waste feedcharacterization requirements for these elements when CEMs are used. The final MACT ruleencourages the use of CEMs to secure the increased assurance of compliance with emissions standardsafforded by continuous monitoring systems (EPA 1999).
Currently, there are no commercial CEM technologies that have been demonstrated to be capable ofmeeting all the performance requirements and data quality objectives proposed by EPA.
The DOE has several incinerator facilities that will be subject to the proposed regulation, when it comesinto effect:
• Consolidated Incineration Facility (CIF) at the Savannah River Site (SRS),
• Waste Experimental Reduction Facility (WERF) at the Idaho National Environmental andEngineering Laboratory (INEEL),
• Toxic Substances Control Act Incinerator (TSCAI) at the Oak Ridge Reservation (ORR), and
• Idaho Nuclear Technology Engineering Center (INTEC) at the INEEL.
Local site treatment plans and the Accelerating Cleanup: Paths to Closure plan (DOE 1998) requirecontinued operation of these facilities.
DOE incinerators that treat mixed waste also have to monitor any emissions of alpha-emitting materials,including isotopes of actinide elements, e. g., uranium (U) and plutonium (Pu). Currently, DOE usesHEPA filters or other state-of-the-art air pollution control equipment2 to control actinide emissions anduses high volume air samplers and laboratory analysis of the filters from those samplers to monitor thesame. However, in accord with the EPA compliance monitoring hierarchy, it would clearly beadvantageous if a single CEM could monitor both the MACT elements and the actinides.
The conventional technology for measuring elemental emissions in stack gases is EPA Method 29 (EPA1996b). However, Method 29 is not a continuous monitoring technique. It is a protocol for determinationof metals emissions by collection of samples from a gas stream and for laboratory analysis of thosesamples. Method 29 is used during test burns to verify compliance for a specific range of combustionconditions and feed stream conditions. Method 29 typically requires sampling times of one to four hours,involves long analysis turnaround times, is fairly labor intensive, requires skilled laboratory staff foranalyses, and provides little assurance to stakeholders that catastrophic releases do not occur,particularly during those more common times when Method 29 sampling is not being conducted. Inaddition, the costs for trial burns and the necessary analyses of the waste feed stream are high.
Implementation of CEMs that meet EPA performance requirements will minimize the need for trial burnsand extensive feed characterization. CEMs will also give continuous, rapidly updated information ontreatment operation, providing operator feedback and assuring compliance with emissions limits.
1 The top tier of the compliance monitoring hierarchy is the use of a continuous emissions monitor for that HAP orstandard. In the absence of a CEM, the second tier is the use of a CEM for a surrogate of that HAP or standardand, when necessary, setting some operating limits to account for the limitations of using surrogates. Lacking aCEMS for either, EPA sets appropriate feed and operating parameter limits to ensure compliance and requiresperiodic testing of the source (EPA 1996, p. 17417).2 At the DOE TSCA incinerator, for example, the air pollution control equipment includes a quench chamber, venturiscrubber, packed bed scrubber, two ionizing wet scrubbers in series, an induced draft fan, and the exhaust stack.
U. S. Department of Energy 3
Demonstration Summary
This demonstration summary covers the period March 1997 through September 1999. The capabilities of the CHRS were documented in a number of separate demonstrations described inSection 3 of this report. Because the CHRS is a technology component, it was appropriate that most ofthe demonstrations were in a laboratory environment, culminating in pilot-scale field demonstrations ofthe CHRS as part of a complete multi-element CEM system. The laboratory demonstrations documented the basic performance characteristics of the CHRS. Theyshowed the CHRS performance was comparable to that provided by conventional instruments with muchgreater size, weight, and cost. The first field demonstration was performed in September 1997 at the EPA rotary kiln incineratorsimulator at Research Triangle Park, North Carolina. That demonstration tested a first generation UVspectrometer as part of the air ICPAES CEM demonstrated by researchers from the DiagnosticInstrumentation and Analysis Laboratory (DIAL), Mississippi State University. The spectrometer wasbased on the high resolution interferometric spectrometer (HiRIS) developed earlier for actinidemeasurements using ICPAES. Although the actinide monitor had performed extremely well, the UVversion exhibited a number of limitations as a detection system for a multi-element CEM. First, it hadinsufficient resolution for monitoring light emitted from the air-ICP. Secondly, it utilized a photomultipliertube detector, and that limited the speed at which data could be accumulated for multi-elementmonitoring. Thirdly, the optical coating used in the interferometer portion of the HiRIS limited its usefulrange to only a few nanometers in the UV, significantly limiting the resolution and sensitivity for thedetection of a number of the target elements. The limitations identified during this test lead to thedevelopment of the CHRS in the following fiscal year. The CHRS addresses all these shortcomings andhas since replaced the 1 m spectrometer that the DIAL team had used as the standard spectrometer inthe air ICPAES system. The second field demonstration was performed at the DIAL facility in September 1999 (Baldwin et al.1999). There, the CHRS was demonstrated as part of a CEM that employed a continuous sampling air-ICP system. The demonstration included monitoring toxic metals in stack gas from the combustion offuel oil and air in the DIAL combustion test stand while exhaust samples were simultaneously collectedusing EPA Reference Method 29. The CEM results were available continuously during the monitoring.However, because the RM-29 samples required analysis at an off-site analytical laboratory, the resultsfrom those samples were not available until several weeks later. For the metals and metal levelsobserved at DIAL, the CEM results compared favorably with those obtained by the reference method(See Section 3 of this report).
Contacts
Technical David P. Baldwin, Principal Investigator Ames Laboratory 9 Spedding Hall Iowa State University Ames, IA 50011-3020 Phone: 515-294-2069 Email address: [email protected]
4 U.S. Department of Energy
George P. Miller, Collaborator Diagnostic Instrumentation and Analysis Laboratory Mississippi State University P.O. Drawer MM Mississippi State, MS 39762-4932 Phone: 662-325-7631 Email address: [email protected]
Management John B. Jones, CMST-CP Field Program Manager, U. S. DOE, Nevada Operations Office Phone: 702-295-0532 Email address: [email protected]
Patent and Licensing Info rmation David Baldwin (contact information provided above)
Other
All published Innovative Technology Summary Reports are available on the OST Web site athttp://em-50.em.doe.gov under “Publications.” The Technology Management System, alsoavailable through the OST Web site, provides information about OST programs, technologies,and problems. The Compact High Resolution Spectrometer is identified by OST ReferenceNumber 1564.
U. S. Department of Energy 5
SECTION 2
Overall Process Definition
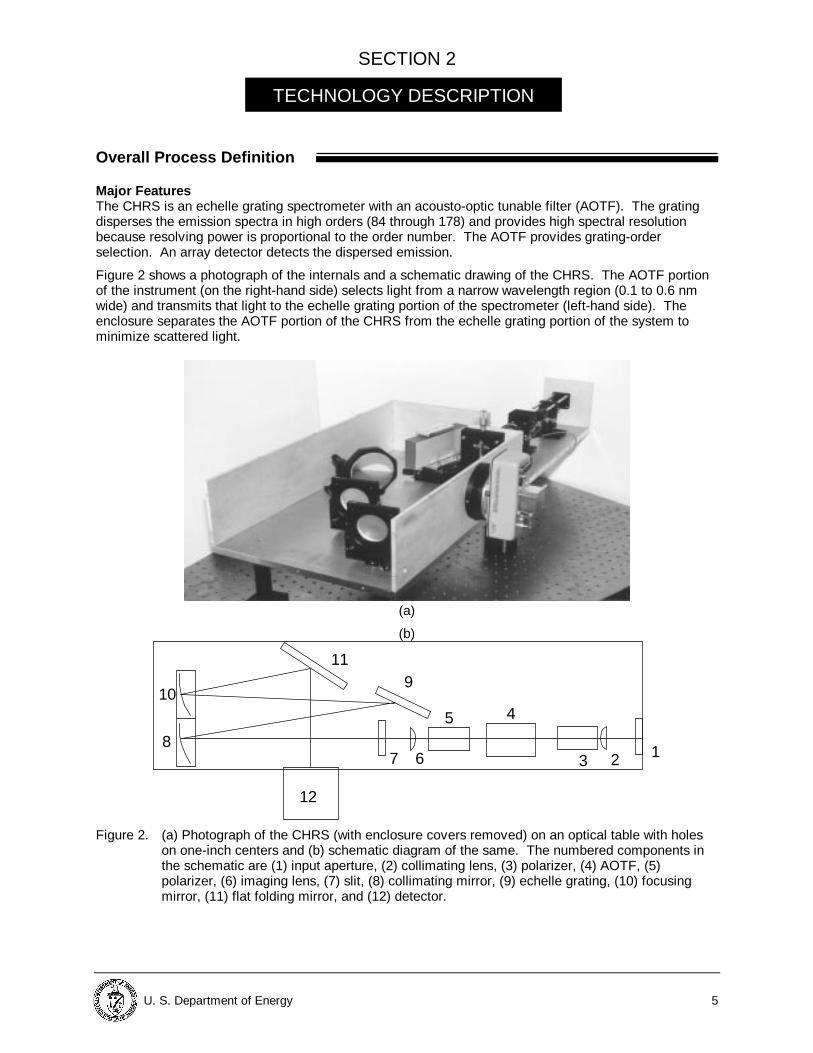
Major FeaturesThe CHRS is an echelle grating spectrometer with an acousto-optic tunable filter (AOTF). The gratingdisperses the emission spectra in high orders (84 through 178) and provides high spectral resolutionbecause resolving power is proportional to the order number. The AOTF provides grating-orderselection. An array detector detects the dispersed emission.
Figure 2 shows a photograph of the internals and a schematic drawing of the CHRS. The AOTF portionof the instrument (on the right-hand side) selects light from a narrow wavelength region (0.1 to 0.6 nmwide) and transmits that light to the echelle grating portion of the spectrometer (left-hand side). Theenclosure separates the AOTF portion of the CHRS from the echelle grating portion of the system tominimize scattered light.
(a)
(b)
Figure 2. (a) Photograph of the CHRS (with enclosure covers removed) on an optical table with holeson one-inch centers and (b) schematic diagram of the same. The numbered components inthe schematic are (1) input aperture, (2) collimating lens, (3) polarizer, (4) AOTF, (5)polarizer, (6) imaging lens, (7) slit, (8) collimating mirror, (9) echelle grating, (10) focusingmirror, (11) flat folding mirror, and (12) detector.
TECHNOLOGY DESCRIPTION
123
45
67
11
8
109
12
6 U.S. Department of Energy
AOTFThe AOTF is a quartz crystal device that selects a narrow wavelength region of emitted light and rotatesits polarization by 90 degrees (Tran 1992). Placed between two crossed polarizers and tuned bychanging an applied radio frequency, the AOTF transmits only a selected wavelength region to theechelle grating. The AOTF is operated using a 12 W rf driver that is tunable from 250 to 90 MHz. Thistuning range results in an AOTF wavelength range of 200 to 425 nm. The drive frequency is controlledthrough a parallel port connection to a personal computer. The wavelength tuning of the AOTF iscalibrated using 20 to 50 emission lines from an argon ICP over the entire wavelength range. Theobserved wavelength and frequency pairs yield a wavelength calibration with an accuracy ofapproximately 0.05 nm. The AOTF is water-cooled, using a thermostatically controlled loop. Thebandwidth of the light transmitted through the second polarizer varies from 0.1 nm at 200 nm to 0.6 nmat 425 nm. This bandwidth is much less than the width of an order of the echelle grating. Therefore, theAOTF serves as an order-selecting device for the echelle grating. It allows extremely rapid(milliseconds) sequential or simultaneous selection of wavelengths with no moving parts.
Echelle Grating SpectrometerThe adjustable entrance slit for the echelle portion of the spectrometer is employed with a width of 15 or25 micrometers and a height of approximately 3 mm. The light transmitted through the slit is collimatedby the first mirror and reflected onto the echelle grating. The grating used in the CHRS operates inorders 84 through 178 order and all these orders are spatially superimposed. However, as previouslydescribed, the AOTF portion of the spectrometer transmits only light from a narrow wavelength region(less than the width of one order) and therefore functions as an order-sorter. The reflected beam isfocused at the detector using another spherical mirror. To simplify the mounting of the detector on arectangular enclosure, a flat folding mirror is located between the imaging mirror and the detector (SeeFigure 21).
DetectorMost of the data in this report were obtained using a Spectrum One CCD-2000 detection system fromInstruments SA, Inc., Edison, NJ. The detector is a back-thinned, 2000 by 800 pixel array, cooled to -35°C with an integral dual-stage thermoelectric cooler. Some initial data were taken using a Model 1453PDA from EG&G Instruments, Princeton Applied Research, Oak Ridge, TN. The Model 1453 PDA is alinear array of 1024 diodes, each 25 by 2500 micrometers in size. The PDA was cooled to -10 °C with asingle-stage thermoelectric cooler. The CCD is significantly more sensitive than the PDA, due tosignificantly higher quantum efficiency and lower readout background. In both cases, the detector wasmounted on an adjustable flange on the side of the spectrometer enclosure, so that the position androtation of the detector array could be adjusted for optimum resolution.
Software and ControlThe spectrometer is controlled and data are accumulated and analyzed using a custom softwarepackage that was developed using LabWindows/CVI (National Instruments, Inc., Austin, TX). Thesoftware package allows the operator to calibrate and tune the wavelength of the AOTF and toaccumulate data using either the CCD or PDA detection system. The software package also includessupport for real-time spectral monitoring, accumulation of spectra with background subtraction,monitoring the time evolution of individual peak intensities, calibration and determination ofconcentrations for multiple analytical lines in a rapid sequential manner, determination of concentrationsusing the method of standard additions, and unattended continuous monitoring of multiple analyticallines.
System Operation
• CHRS operation, data collection and reporting are performed automatically, under computersoftware control.
• The CHRS is easy to operate, and can be operated by a technician familiar with the use of personalcomputers. Training can be completed during a single one-day session.
• A trained technician is needed to perform periodic maintenance tasks such as an annual wavelengthcalibration.
• Electrical energy is the only expendable used in operation of the CHRS. The maximum total powerrequirement (for CCD, AOTF, and laptop computer) is 235 Watts, 110 VAC.
U. S. Department of Energy 7
• The quartz AOTF requires water-cooling; if there is no "building supply" then a small recirculator isrequired.
• The CHRS generates no secondary waste.
8 U.S. Department of Energy
SECTION 3
Demonstration Plan
The capabilities of the CHRS were documented in a number of separate demonstrations described inTable 1, below. Because the CHRS is a technology component, it was appropriate that most of thedemonstrations were performed in a laboratory environment, culminating in pilot-scale fielddemonstrations of the CHRS as part of a complete multi-element CEM system. Table 1. CHRS demonstrat ions
Demonstration Location Date Spectral resolution Ames Laboratory June 1998
Imaging quality Ames Laboratory August 1998
Method detection limits Ames Laboratory August 1998
Mercury CEM capabilities Ames Laboratory February 1999
CEM capabilities with DIAL air ICPAES EPA Research Triangle Park September 1997
CEM capabilities with DIAL air ICPAES DIAL September 1999
Results
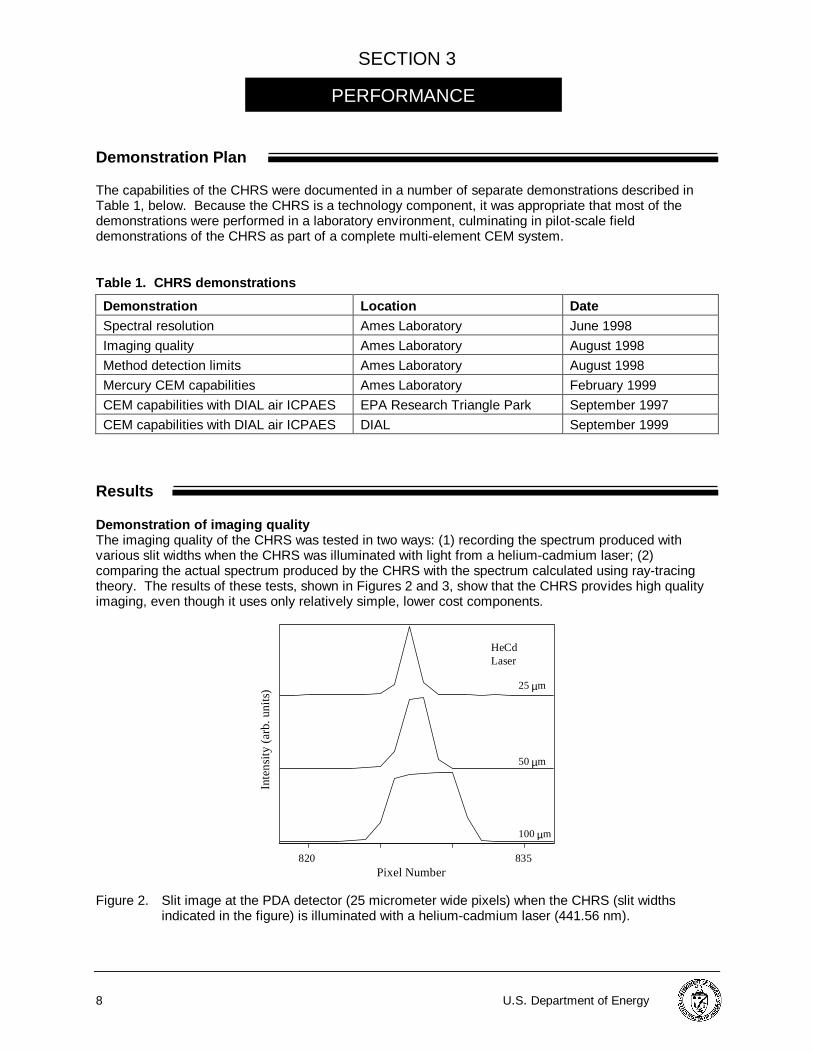
Demonstration of imaging qualityThe imaging quality of the CHRS was tested in two ways: (1) recording the spectrum produced withvarious slit widths when the CHRS was illuminated with light from a helium-cadmium laser; (2)comparing the actual spectrum produced by the CHRS with the spectrum calculated using ray-tracingtheory. The results of these tests, shown in Figures 2 and 3, show that the CHRS provides high qualityimaging, even though it uses only relatively simple, lower cost components.
Pixel Number
Inte
nsi
ty (
arb
. un
its)
820 835
HeCd Laser
25 µm
50 µm
100 µm
Figure 2. Slit image at the PDA detector (25 micrometer wide pixels) when the CHRS (slit widthsindicated in the figure) is illuminated with a helium-cadmium laser (441.56 nm).
PERFORMANCE
U. S. Department of Energy 9
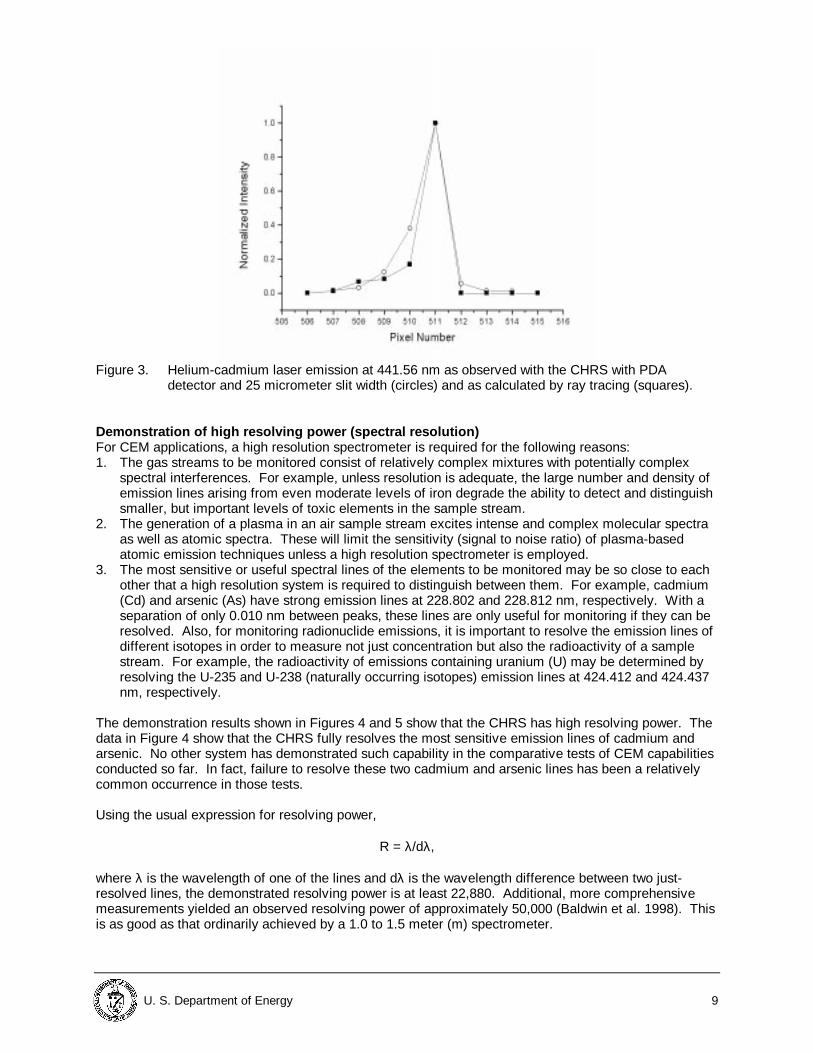
Figure 3. Helium-cadmium laser emission at 441.56 nm as observed with the CHRS with PDA
detector and 25 micrometer slit width (circles) and as calculated by ray tracing (squares).
Demonstration of high resolving power (spectral resolution)For CEM applications, a high resolution spectrometer is required for the following reasons:1. The gas streams to be monitored consist of relatively complex mixtures with potentially complex
spectral interferences. For example, unless resolution is adequate, the large number and density ofemission lines arising from even moderate levels of iron degrade the ability to detect and distinguishsmaller, but important levels of toxic elements in the sample stream.
2. The generation of a plasma in an air sample stream excites intense and complex molecular spectraas well as atomic spectra. These will limit the sensitivity (signal to noise ratio) of plasma-basedatomic emission techniques unless a high resolution spectrometer is employed.
3. The most sensitive or useful spectral lines of the elements to be monitored may be so close to eachother that a high resolution system is required to distinguish between them. For example, cadmium(Cd) and arsenic (As) have strong emission lines at 228.802 and 228.812 nm, respectively. With aseparation of only 0.010 nm between peaks, these lines are only useful for monitoring if they can beresolved. Also, for monitoring radionuclide emissions, it is important to resolve the emission lines ofdifferent isotopes in order to measure not just concentration but also the radioactivity of a samplestream. For example, the radioactivity of emissions containing uranium (U) may be determined byresolving the U-235 and U-238 (naturally occurring isotopes) emission lines at 424.412 and 424.437nm, respectively.
The demonstration results shown in Figures 4 and 5 show that the CHRS has high resolving power. Thedata in Figure 4 show that the CHRS fully resolves the most sensitive emission lines of cadmium andarsenic. No other system has demonstrated such capability in the comparative tests of CEM capabilitiesconducted so far. In fact, failure to resolve these two cadmium and arsenic lines has been a relativelycommon occurrence in those tests.
Using the usual expression for resolving power,
R = λ/dλ,
where λ is the wavelength of one of the lines and dλ is the wavelength difference between two just-resolved lines, the demonstrated resolving power is at least 22,880. Additional, more comprehensivemeasurements yielded an observed resolving power of approximately 50,000 (Baldwin et al. 1998). Thisis as good as that ordinarily achieved by a 1.0 to 1.5 meter (m) spectrometer.
10 U.S. Department of Energy
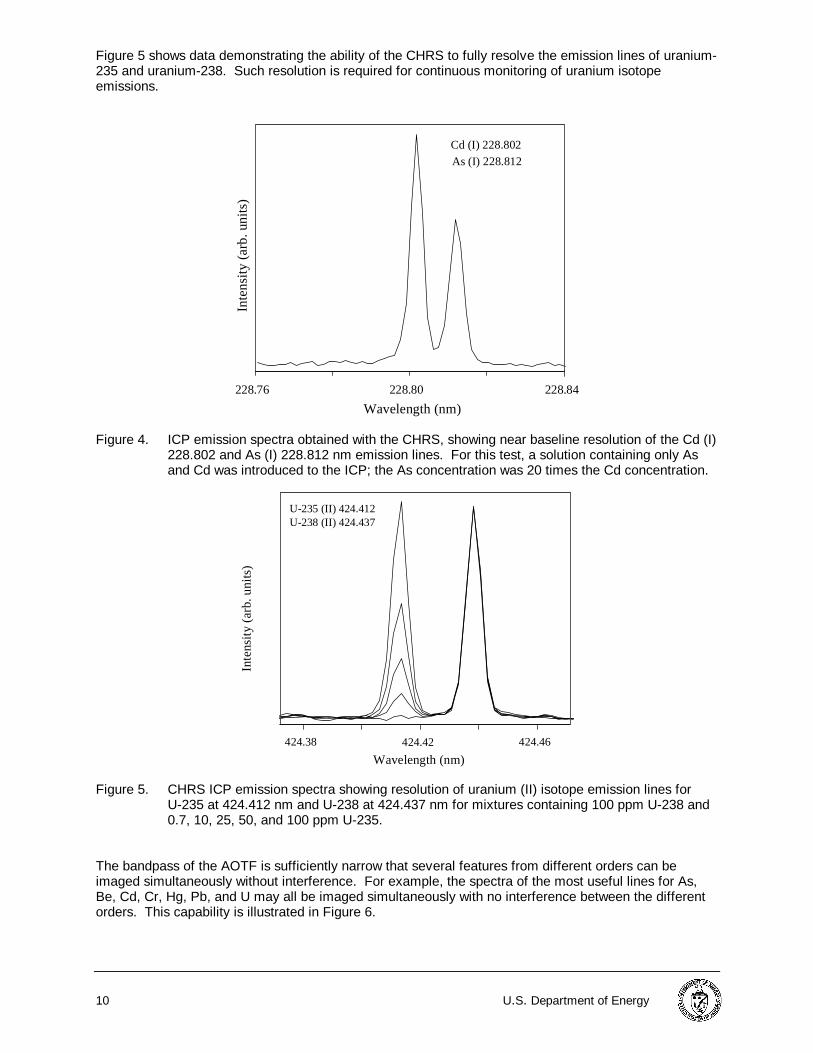
Figure 5 shows data demonstrating the ability of the CHRS to fully resolve the emission lines of uranium-235 and uranium-238. Such resolution is required for continuous monitoring of uranium isotopeemissions.
228.76 228.80 228.84
Wavelength (nm)
Inte
nsi
ty (
arb
. un
its)
Cd (I) 228.802
As (I) 228.812
Figure 4. ICP emission spectra obtained with the CHRS, showing near baseline resolution of the Cd (I)228.802 and As (I) 228.812 nm emission lines. For this test, a solution containing only Asand Cd was introduced to the ICP; the As concentration was 20 times the Cd concentration.
424.38 424.42 424.46
Wavelength (nm)
Inte
nsity
(a
rb. u
nits
)
U-235 (II) 424.412U-238 (II) 424.437
Figure 5. CHRS ICP emission spectra showing resolution of uranium (II) isotope emission lines forU-235 at 424.412 nm and U-238 at 424.437 nm for mixtures containing 100 ppm U-238 and0.7, 10, 25, 50, and 100 ppm U-235.
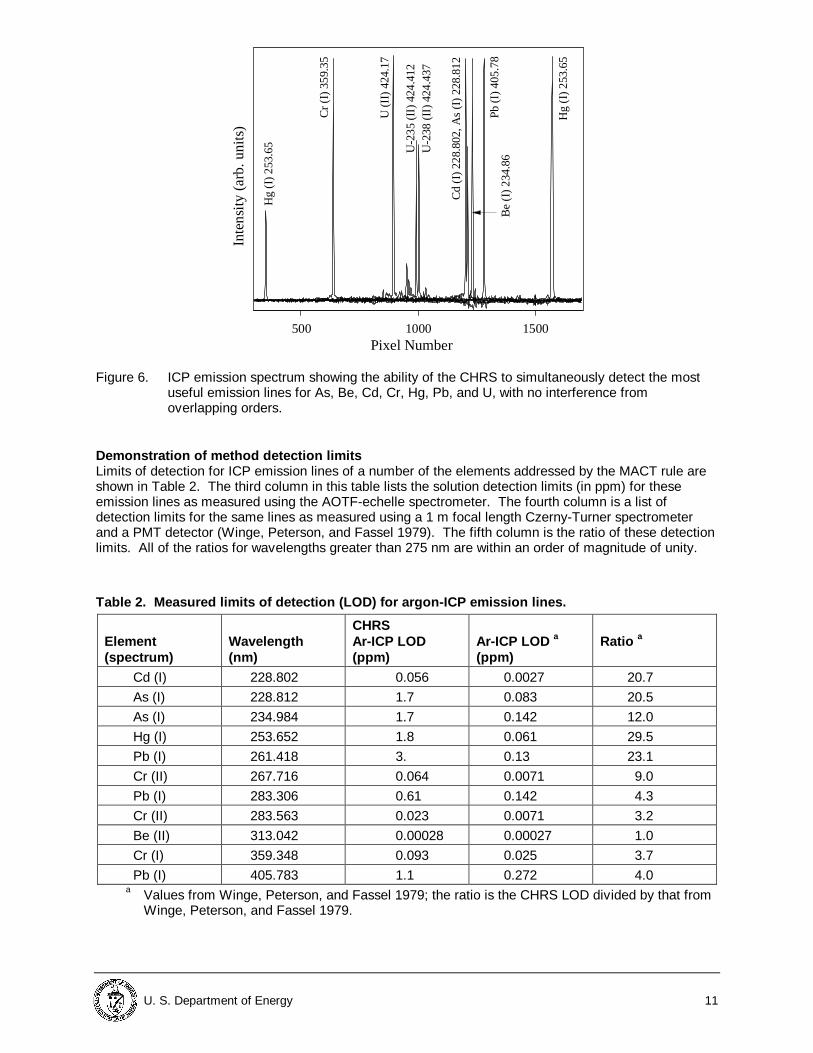
The bandpass of the AOTF is sufficiently narrow that several features from different orders can beimaged simultaneously without interference. For example, the spectra of the most useful lines for As,Be, Cd, Cr, Hg, Pb, and U may all be imaged simultaneously with no interference between the differentorders. This capability is illustrated in Figure 6.
U. S. Department of Energy 11
Pixel Number
Inte
nsi
ty (
arb
. u
nits
)
500 1000 1500
Hg
(I)
253
.65
Cr
(I)
359.
35
Hg
(I)
253
.65
Cd
(I)
228.
802,
As
(I)
228.
812
Pb
(I)
405
.78
Be
(I)
234
.86
U (
II)
424.
17
U-2
35
(II)
424
.412
U-2
38 (
II)
424
.437
Figure 6. ICP emission spectrum showing the ability of the CHRS to simultaneously detect the mostuseful emission lines for As, Be, Cd, Cr, Hg, Pb, and U, with no interference fromoverlapping orders.
Demonstration of method detection limitsLimits of detection for ICP emission lines of a number of the elements addressed by the MACT rule areshown in Table 2. The third column in this table lists the solution detection limits (in ppm) for theseemission lines as measured using the AOTF-echelle spectrometer. The fourth column is a list ofdetection limits for the same lines as measured using a 1 m focal length Czerny-Turner spectrometerand a PMT detector (Winge, Peterson, and Fassel 1979). The fifth column is the ratio of these detectionlimits. All of the ratios for wavelengths greater than 275 nm are within an order of magnitude of unity.
Table 2. Measured limits of detect ion (LOD) for argon-ICP emission lines.
Element(spectrum)
Wavelength(nm)
CHRSAr-ICP LOD(ppm)
Ar-ICP LOD a
(ppm)Ratio a
Cd (I) 228.802 0.056 0.0027 20.7
As (I) 228.812 1.7 0.083 20.5
As (I) 234.984 1.7 0.142 12.0
Hg (I) 253.652 1.8 0.061 29.5
Pb (I) 261.418 3. 0.13 23.1
Cr (II) 267.716 0.064 0.0071 9.0
Pb (I) 283.306 0.61 0.142 4.3
Cr (II) 283.563 0.023 0.0071 3.2
Be (II) 313.042 0.00028 0.00027 1.0
Cr (I) 359.348 0.093 0.025 3.7
Pb (I) 405.783 1.1 0.272 4.0a Values from Winge, Peterson, and Fassel 1979; the ratio is the CHRS LOD divided by that from
Winge, Peterson, and Fassel 1979.
12 U.S. Department of Energy
Below 275 nm, the detection limits reported by Winge et al. are significantly better (smaller) than thosedetermined using the CHRS. The former were limited by the noise associated with the ICP continuumbackground. Also, because they were determined using a sequentially scanned spectrometer, the noisewas estimated as 1% of the background intensity at wavelengths near the selected spectral lines, ratherthan on actual measured noise levels. This is a reasonable estimate of noise for ICP measurementsusing a PMT detector and an integration time of several seconds. The detection limits for the CHRS arelimited by the shot noise in the dark current from the CCD array detector. This shot noise is constant andindependent of the selected wavelength. Improvements in detection limits for the CHRS could berealized by utilizing a lower-noise detector (lower temperature) or by increasing integration times. Forconvenience, the numbers reported here for the CHRS are based on 1 second integration times.However, integration times of a minute or more are possible (depending on line intensity) and would yieldsmaller detection limits (i. e., divided by the square root of the integration time in seconds).
In summary, the demonstration results show that the CHRS provides the resolution and sensitivity of aconventional 1.0 to 1.5 meter spectrometer in a package that is less than one-tenth the size and weightof a conventional spectrometer with the same resolution. In fact, based on this performance, the CHRShas replaced the 1 m grating spectrometer previously used as part of the DIAL air-ICPAES CEM system.
Demonstration of CHRS capabilities as a mercury CEM The principal target application for the CHRS is as a component of a multi-element CEM. However, italso has potential application as part of a mercury CEM. The first CHRS experiments with mercury measured how much light (at wavelengths characteristic oftransitions between the energy levels of mercury atoms) was absorbed when various concentrations ofmercury vapor were present between a light source and the CHRS. When the light source is a mercuryhollow cathode or electrodeless discharge lamp, this is an atomic absorption spectrometry (AAS)measurement. In fact, since no heat is required or used to vaporize the mercury, it is a CVAAS (coldvapor atomic absorption spectrometry) measurement.
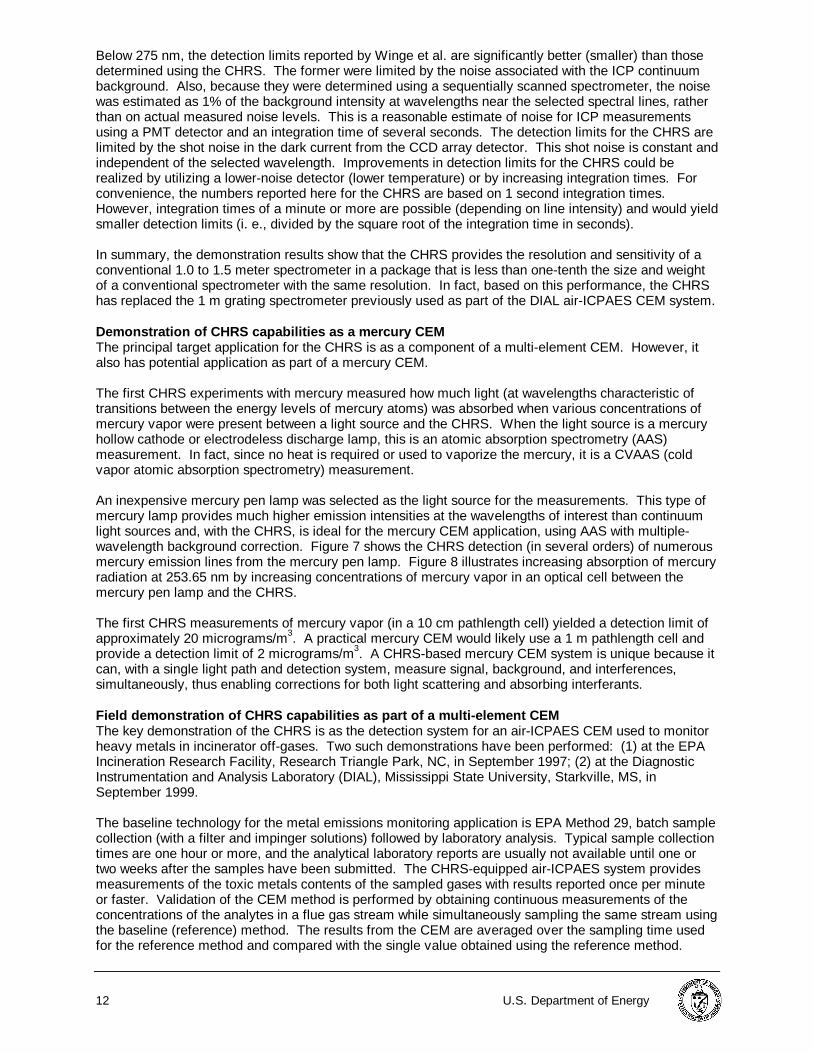
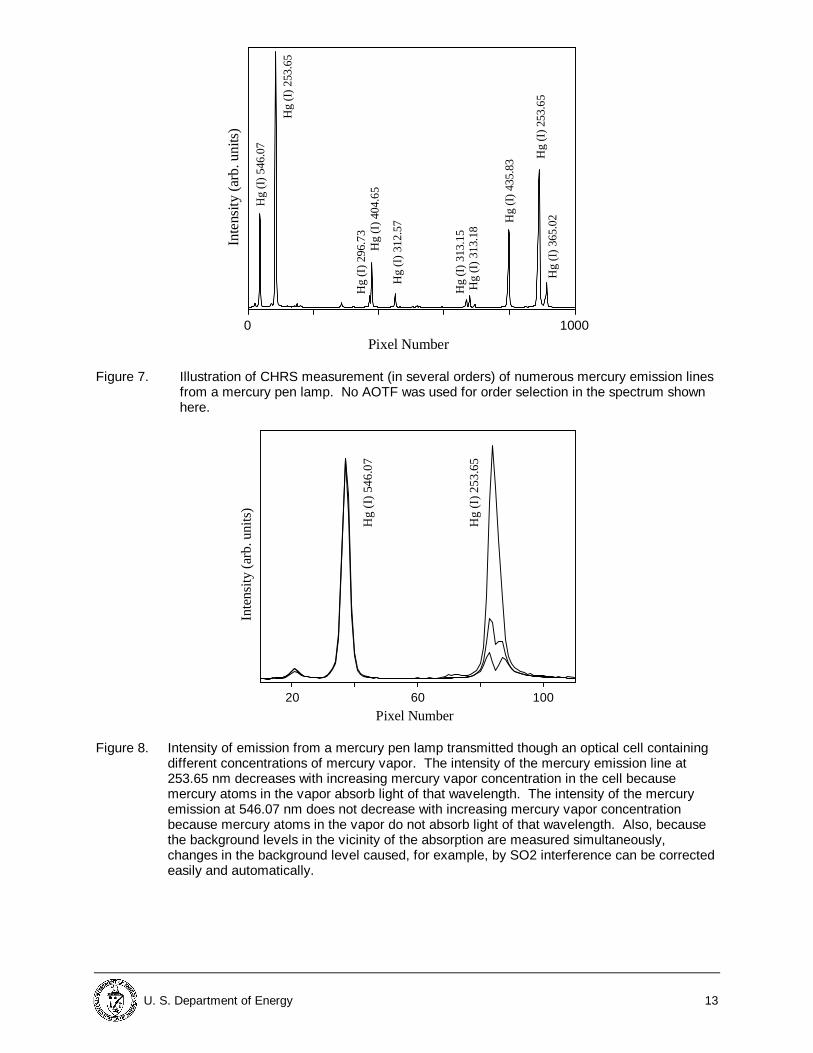
An inexpensive mercury pen lamp was selected as the light source for the measurements. This type ofmercury lamp provides much higher emission intensities at the wavelengths of interest than continuumlight sources and, with the CHRS, is ideal for the mercury CEM application, using AAS with multiple-wavelength background correction. Figure 7 shows the CHRS detection (in several orders) of numerousmercury emission lines from the mercury pen lamp. Figure 8 illustrates increasing absorption of mercuryradiation at 253.65 nm by increasing concentrations of mercury vapor in an optical cell between themercury pen lamp and the CHRS. The first CHRS measurements of mercury vapor (in a 10 cm pathlength cell) yielded a detection limit ofapproximately 20 micrograms/m3. A practical mercury CEM would likely use a 1 m pathlength cell andprovide a detection limit of 2 micrograms/m3. A CHRS-based mercury CEM system is unique because itcan, with a single light path and detection system, measure signal, background, and interferences,simultaneously, thus enabling corrections for both light scattering and absorbing interferants. Field demonstration of CHRS capabilities as part of a multi-el ement CEM The key demonstration of the CHRS is as the detection system for an air-ICPAES CEM used to monitorheavy metals in incinerator off-gases. Two such demonstrations have been performed: (1) at the EPAIncineration Research Facility, Research Triangle Park, NC, in September 1997; (2) at the DiagnosticInstrumentation and Analysis Laboratory (DIAL), Mississippi State University, Starkville, MS, inSeptember 1999. The baseline technology for the metal emissions monitoring application is EPA Method 29, batch samplecollection (with a filter and impinger solutions) followed by laboratory analysis. Typical sample collectiontimes are one hour or more, and the analytical laboratory reports are usually not available until one ortwo weeks after the samples have been submitted. The CHRS-equipped air-ICPAES system providesmeasurements of the toxic metals contents of the sampled gases with results reported once per minuteor faster. Validation of the CEM method is performed by obtaining continuous measurements of theconcentrations of the analytes in a flue gas stream while simultaneously sampling the same stream usingthe baseline (reference) method. The results from the CEM are averaged over the sampling time usedfor the reference method and compared with the single value obtained using the reference method.
U. S. Department of Energy 13
Pixel Number
Inte
nsity
(ar
b. u
nits
)
0 1000
Hg
(I)
546.
07
Hg
(I)
253.
65
Hg
(I)
296.
73
Hg
(I)
404.
65
Hg
(I)
312.
57
Hg
(I)
313.
15
Hg
(I)
435.
83
Hg
(I)
253.
65
Hg
(I)
365.
02
Hg
(I)
313.
18
Figure 7. Illustration of CHRS measurement (in several orders) of numerous mercury emission lines
from a mercury pen lamp. No AOTF was used for order selection in the spectrum shownhere.
Pixel Number
Inte
nsity
(ar
b. u
nits
)
20 10060
Hg
(I)
54
6.0
7
Hg
(I)
25
3.6
5
Figure 8. Intensity of emission from a mercury pen lamp transmitted though an optical cell containing
different concentrations of mercury vapor. The intensity of the mercury emission line at253.65 nm decreases with increasing mercury vapor concentration in the cell becausemercury atoms in the vapor absorb light of that wavelength. The intensity of the mercuryemission at 546.07 nm does not decrease with increasing mercury vapor concentrationbecause mercury atoms in the vapor do not absorb light of that wavelength. Also, becausethe background levels in the vicinity of the absorption are measured simultaneously,changes in the background level caused, for example, by SO2 interference can be correctedeasily and automatically.
14 U.S. Department of Energy
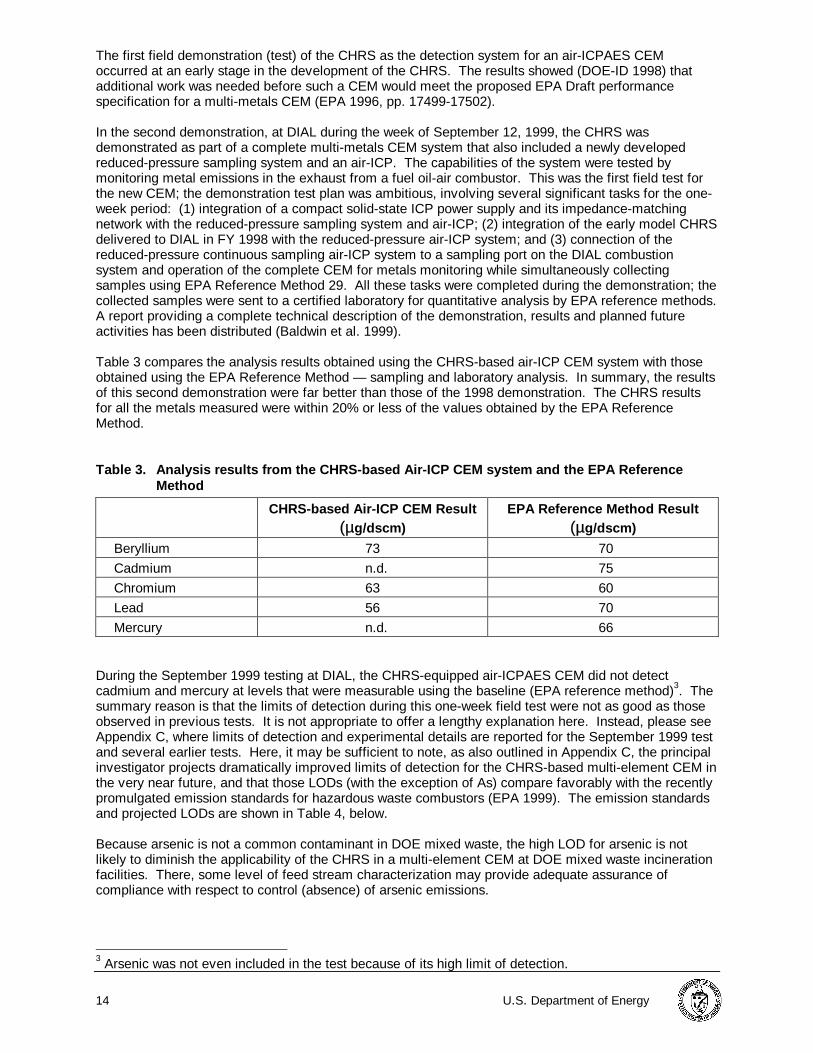
The first field demonstration (test) of the CHRS as the detection system for an air-ICPAES CEMoccurred at an early stage in the development of the CHRS. The results showed (DOE-ID 1998) thatadditional work was needed before such a CEM would meet the proposed EPA Draft performancespecification for a multi-metals CEM (EPA 1996, pp. 17499-17502). In the second demonstration, at DIAL during the week of September 12, 1999, the CHRS wasdemonstrated as part of a complete multi-metals CEM system that also included a newly developedreduced-pressure sampling system and an air-ICP. The capabilities of the system were tested bymonitoring metal emissions in the exhaust from a fuel oil-air combustor. This was the first field test forthe new CEM; the demonstration test plan was ambitious, involving several significant tasks for the one-week period: (1) integration of a compact solid-state ICP power supply and its impedance-matchingnetwork with the reduced-pressure sampling system and air-ICP; (2) integration of the early model CHRSdelivered to DIAL in FY 1998 with the reduced-pressure air-ICP system; and (3) connection of thereduced-pressure continuous sampling air-ICP system to a sampling port on the DIAL combustionsystem and operation of the complete CEM for metals monitoring while simultaneously collectingsamples using EPA Reference Method 29. All these tasks were completed during the demonstration; thecollected samples were sent to a certified laboratory for quantitative analysis by EPA reference methods.A report providing a complete technical description of the demonstration, results and planned futureactivities has been distributed (Baldwin et al. 1999). Table 3 compares the analysis results obtained using the CHRS-based air-ICP CEM system with thoseobtained using the EPA Reference Method — sampling and laboratory analysis. In summary, the resultsof this second demonstration were far better than those of the 1998 demonstration. The CHRS resultsfor all the metals measured were within 20% or less of the values obtained by the EPA ReferenceMethod. Table 3. Analysis results from the CHRS-based Air-ICP CEM system and the EPA Reference
Method
CHRS-based Air-ICP CEM Result(µg/dscm)
EPA Reference Met hod Result(µg/dscm)
Beryllium 73 70
Cadmium n.d. 75
Chromium 63 60
Lead 56 70
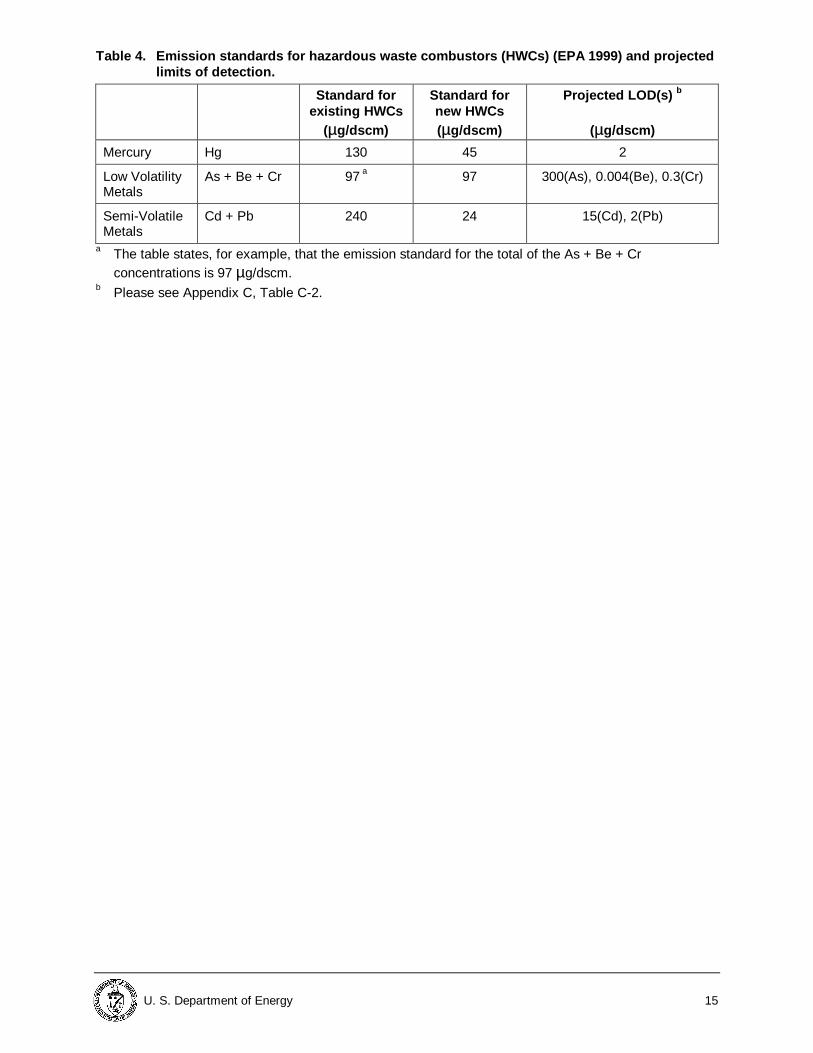
Mercury n.d. 66 During the September 1999 testing at DIAL, the CHRS-equipped air-ICPAES CEM did not detectcadmium and mercury at levels that were measurable using the baseline (EPA reference method)3. Thesummary reason is that the limits of detection during this one-week field test were not as good as thoseobserved in previous tests. It is not appropriate to offer a lengthy explanation here. Instead, please seeAppendix C, where limits of detection and experimental details are reported for the September 1999 testand several earlier tests. Here, it may be sufficient to note, as also outlined in Appendix C, the principalinvestigator projects dramatically improved limits of detection for the CHRS-based multi-element CEM inthe very near future, and that those LODs (with the exception of As) compare favorably with the recentlypromulgated emission standards for hazardous waste combustors (EPA 1999). The emission standardsand projected LODs are shown in Table 4, below. Because arsenic is not a common contaminant in DOE mixed waste, the high LOD for arsenic is notlikely to diminish the applicability of the CHRS in a multi-element CEM at DOE mixed waste incinerationfacilities. There, some level of feed stream characterization may provide adequate assurance ofcompliance with respect to control (absence) of arsenic emissions.
3 Arsenic was not even included in the test because of its high limit of detection.
U. S. Department of Energy 15
Table 4. Emission standards for hazardous waste combustors (HWCs) (EPA 1999) and projectedlimits of detection.
Standard forexisting HWCs
(µg/dscm)
Standard fornew HWCs(µg/dscm)
Projected LOD(s) b
(µg/dscm)
Mercury Hg 130 45 2
Low VolatilityMetals
As + Be + Cr 97 a 97 300(As), 0.004(Be), 0.3(Cr)
Semi-VolatileMetals
Cd + Pb 240 24 15(Cd), 2(Pb)
a The table states, for example, that the emission standard for the total of the As + Be + Crconcentrations is 97 µg/dscm.
b Please see Appendix C, Table C-2.
16 U.S. Department of Energy
SECTION 4
The target problem for the CHRS is the continuous monitoring of toxic elements in off-gas emissionsfrom mixed waste incinerators. Other envisioned DOE applications include hot-cell analyses of isotopicabundances for materials containing or contaminated with U or Pu, on-line monitoring in process ducts,and other field applications requiring high resolution optical measurements.
Competing Technologies
• Baseline – The baseline technologies for optical spectrometry with sufficient resolution for use as a CEM are– Tunable grating spectrometers with 1.0 to 1.5 m focal length;– Polychromators with 0.75 to 1 m focal length.
EPA Method 29 is the baseline method for measurement of toxic elemental emissions fromhazardous waste combustors. This involves collection of samples from the off-gas stream,packaging and documentation of the samples according to EPA sample handling and chain-of-custody requirements, and shipping them to an off-site laboratory for analysis. The analyses areperformed using one or more of the methods described in Test Methods for Evaluating Solid Waste:Physical/Chemical Methods, SW-846 Update III (EPA 1995). The laboratory analysis methodsemployed as part of Method 29 may include ICAP, ICAP-MS, AAS, CVAAS, and or GFAAS. Thebaseline method does not provide real-time results because the sampling time is typically one to fourhours per sample and the elapsed time between the collection of samples and the availability of theanalysis results is typically measured in weeks.
• Other competing technologies –
For optical spectrometry, other competing technologies include the following.– Echelle spectrometers with orthogonal dispersion for order-sorting (Barnard et al. 1993,
Scheeline et al. 1991, Pilon et al. 1990).These systems employ cross-dispersion, using a low-order, low-dispersion grating, or a prism, tospatially separate the spectral orders in a direction orthogonal to the echelle dispersion. Theycan detect emission from a number of individual orders of the echelle simultaneously orsequentially, using multiple, movable, or two-dimensional array detectors. Most providewavelength coverage from approximately 180 to 800 nm, but complex optical configurations arerequired and some reduction in resolution is tolerated to achieve broad wavelength coverage.
– Fabry-Perot interferometer (FPI) with tunable monochromator for order-selection.– FPI with AOTF for order-selection.
When applied with an air-ICPAES for continuous emissions monitoring, the CHRS competes with thefollowing other technologies:– The commercially available Thermo Jarrell Ash TraceAir, an air+argon ICP AES system with a
0.75 m vacuum or argon-purged polychromator;– Microwave-induced plasma AES with various spectrometer-detector systems;– Laser-induced breakdown AES with various spectrometer-detector systems; and– Spark-induced breakdown AES with various detector systems.
• CHRS advantages and disadvantages as compared to the base line for optical spectrometry –– The CHRS is approximately one-tenth the size and weight of baseline instruments that provide
comparable resolution.– The cost of the CHRS is in the lowest quartile of the cost range for baseline instruments with
comparable resolution and is approximately one-half the cost of the most costly baselineinstrument. Details are provided in Section 5 of this report.
TECHNOLOGY APPLICABILITY ANDALTERNATIVES
U. S. Department of Energy 17
– Because the CHRS is considerably smaller and lighter than the baseline instruments providingcomparable resolution, its space and cost-of-space requirements are less than those of thebaseline instruments.
– The CHRS switches wavelengths very rapidly as compared to the tunable grating spectrometer.That’s because the CHRS uses electronic tuning, whereas the tunable grating spectrometers usemechanical tuning (moving parts). The rapid tuning ability makes the CHRS ideal for continuousmonitoring of multiple emission features at widely spaced wavelengths.
– The CHRS is more flexible than polychromators, which require moving the detector componentsto change the selection of lines.
– The CHRS is easier to align than a polychromator because it has fewer adjustable parts.– The sensitivity of the CHRS is limited by the transmission efficiency of the AOTF. The crossed
polarizers only transmit one polarization, and the AOTF transmission efficiency varies from 20 to50% over its wavelength range. Hence, overall transmission efficiency is only 10 to 25%.Despite this limitation, the detection limits are good, probably because the increased resolutionprovided by the CHRS tends to improve the signal to noise ratio.
– The f/8 design aperture of the AOTF limits the light throughput of the CHRS. Faster collectionoptics have more leakage through the crossed polarizers. However, the background (andleakage) are typically recorded with the spectrum of interest, and are then subtracted todetermine signal levels. Thus, despite the moderate f-number and leakage, the detection limitsachieved with the CHRS compare favorably to those of larger conventional spectrometers.
– The CHRS limits of detection are slightly poorer overall than those of the baseline instruments.– The current model of the CHRS only monitors one small wavelength region at a time (like a
grating spectrometer) but a polychromator can monitor several. Future CHRS models will beable to monitor several wavelength regions simultaneously.
• CHRS advantages and disadvantages as compared to other compet ing technologies foroptical spectrometry –– Compared to conventional echelle grating spectrometers that utilize cross-dispersion gratings or
prisms, and which provide comparable resolution, the CHRS provides advantages in reducedsize, weight, and cost, reduced size and complexity of optical components, and reduced off-axisaberrations and light losses. In addition, optical alignment of the system is easy and little or nosubsequent adjustment is required.
– The CHRS has less complex spectrum detection and interpretation requirements than theechelle with orthogonal dispersion. Consequently, it can also function with a lower cost detector.
– The CHRS exposes the detector to less stray light than the echelle spectrometer with orthogonaldispersion. This minimizes light-induced deterioration of optical components, which is importantfor ICPAES applications.
– The current CHRS is a very rapid sequential spectrometer rather than a simultaneous instrumentlike some echelle spectrometers with orthogonal dispersion. However, a multi-band AOTFdevice with multi-bandpass capability has already been demonstrated in the laboratory. Thesemulti-band devices will support simultaneous detection of multiple emission lines in future CHRSsystems.
– The performance of Fabry-Perot interferometers (FPIs) depends on the performance of mirrors;the reflective properties of the mirrors depend on wavelength. FPIs work well and provideexcellent resolution for wavelengths greater than 400 nm, however, at lower wavelengths, wheremost of the emission lines for the elements of interest here occur, the useful bandwidth becomesso narrow that a specific FPI performs well for only one or two emission lines (elements).
– The CHRS can tune much more rapidly than an FPI with a tunable monochromator for order-selection.
– The CHRS supports simultaneous measurement of several emission lines (toxic elements),whereas an FPI generally measures only one at a time.
– Wavelength calibration for the CHRS, because it is based on observation of several emissionlines simultaneously, is much easier than it is for a FPI, where the analyte line of interest isessentially the only available wavelength standard. Because of this, the CHRS is well suited formonitoring concentrations near the limit of detection, whereas systems that use an FPI arepoorly suited for such work.
• CHRS advantages and disadvantages as compared to the base line when applied with an air-ICPAES for continuous emissions monitoring –
18 U.S. Department of Energy
– The CHRS CEM can provide continuous real-time measurements of the emissions of toxicelements; the baseline technology cannot.
– With collection and laboratory analysis of three samples per day, the baseline method could onlyroughly approximate the continuous monitoring provided by a CEM. However, as shown inSection 5 of this report, the cost would be approximately 2.5 times the cost of monitoring using aCHRS CEM.
– When a CEM is used, EPA imposes less demanding feed characterization requirements thanwhen the baseline technology is used. Feed stream characterization is not required forhazardous air pollutants that are monitored with a CEM. This can reduce characterization costsand increase waste throughput (and corresponding revenue for commercial treatment facilities).
– When a CEM is used, it must cut off the waste feed automatically when emission limits areexceeded. This is a health and environmental advantage as compared to the baseline.
• CHRS advantages and disadvantages as compared to other compet ing technologies whenapplied with an air-ICPAES for continuous emissions monitoring –– The bandpass of the AOTF is sufficiently narrow (0.2 to 0.6 nm depending on the wavelength)
that the CHRS can rapidly measure several features from different orders on a linear arraywithout interference. For example, as illustrated in Figure 6, above, the spectra of the mostuseful lines of the toxic elements of interest, As, Be, Cd, Cr, Hg, Pb, and U, may all betransmitted to the detector without interference of the different spectral regions selected by theAOTF.
– The CHRS is approximately one-half the cost and one-tenth the size of the polychromator-basedargon/air-ICPAES system.
– The CHRS with reduced pressure sampling system is capable of continuous sampling andcontinuous monitoring of offgas from hazardous waste combustors. The TJA polychromator-based argon/air-ICPAES system alternates sampling and analysis periods so it only monitors halftime.
– The polychromator-based argon/air-ICPAES system achieves a better (lower) limit of detectionfor arsenic than the CHRS does. The former uses an argon-purged spectrometer and hence canmonitor the arsenic line 189.0 nm. That line has more intense emission than the arsenic 228.80nm line monitored by the CHRS.
– The CHRS monitors all emission lines full time whereas the present microwave plasma systemsonly monitor a few lines at a time.
– The CHRS with reduced pressure sampling monitors the entire sampled stream whereas thelaser-induced breakdown and spark-induced breakdown systems monitor only a tiny (volumetric)fraction of the sample stream.
Technology Applicability
The CHRS may be used in any application that requires sensitive and high resolution detection ofspectral features. As compared to the baseline technology, the CHRS advantages in size, weight, cost,and simplicity make it attractive for field applications and process monitoring applications that requirehigh resolution.
Many of the methods being investigated now for CEMs would benefit from inclusion of the CHRS. Thoseinclude, for example, ICPAES, microwave-induced plasma, laser-induced breakdown spectroscopy(LIBS), and spark spectroscopy. The CHRS has already replaced the conventional spectrometerpreviously used in the air-ICPAES CEM developed at DIAL. It is also a promising candidate forreplacing multiple spectrometers currently used in the microwave-induced plasma CEM systemdeveloped by Dr. Paul Woskov at MIT. The CHRS will provide superior resolution and wavelengthagility in a significantly smaller package than the present system.
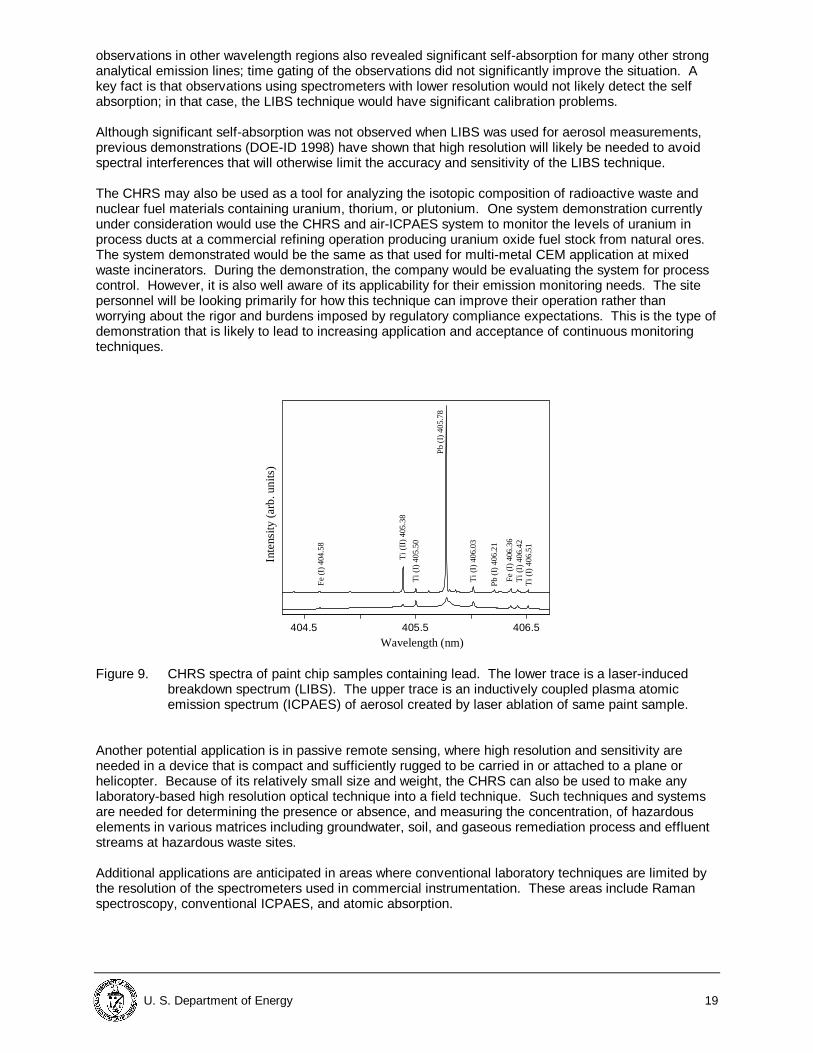
Similarly, the CHRS may be used with LIBS, spark, and other plasma sources to improve the resolution,speed, and portability of those methods. For example, the principal investigator has used the CHRS forLIBS analyses of aerosols and solids and has compared the results to ICP analyses using aerosol andlaser-ablation sample introduction. Figure 9 shows two spectra: (1) LIBS of paint chip samples and (2)ICPAES of aerosol created by laser ablation of the same samples. Comparison of the two CHRS spectrashows that, in the LIBS case, self-absorption is a problem for the lead line at 405.78 nm. Similar
U. S. Department of Energy 19
observations in other wavelength regions also revealed significant self-absorption for many other stronganalytical emission lines; time gating of the observations did not significantly improve the situation. Akey fact is that observations using spectrometers with lower resolution would not likely detect the selfabsorption; in that case, the LIBS technique would have significant calibration problems.
Although significant self-absorption was not observed when LIBS was used for aerosol measurements,previous demonstrations (DOE-ID 1998) have shown that high resolution will likely be needed to avoidspectral interferences that will otherwise limit the accuracy and sensitivity of the LIBS technique.
The CHRS may also be used as a tool for analyzing the isotopic composition of radioactive waste andnuclear fuel materials containing uranium, thorium, or plutonium. One system demonstration currentlyunder consideration would use the CHRS and air-ICPAES system to monitor the levels of uranium inprocess ducts at a commercial refining operation producing uranium oxide fuel stock from natural ores.The system demonstrated would be the same as that used for multi-metal CEM application at mixedwaste incinerators. During the demonstration, the company would be evaluating the system for processcontrol. However, it is also well aware of its applicability for their emission monitoring needs. The sitepersonnel will be looking primarily for how this technique can improve their operation rather thanworrying about the rigor and burdens imposed by regulatory compliance expectations. This is the type ofdemonstration that is likely to lead to increasing application and acceptance of continuous monitoringtechniques.
Wavelength (nm)
Inte
nsity
(a
rb. u
nits
)
404.5
Fe
(I)
404.
58
Ti (
II) 4
05.3
8
405.5 406.5
Ti (
I) 4
05.5
0
Ti (
I) 4
06.0
3
Ti (
I) 4
06.5
1T
i (I)
406
.42
Fe
(I)
406.
36
Pb
(I)
406.
21
Pb
(I)
405.
78
Figure 9. CHRS spectra of paint chip samples containing lead. The lower trace is a laser-induced
breakdown spectrum (LIBS). The upper trace is an inductively coupled plasma atomicemission spectrum (ICPAES) of aerosol created by laser ablation of same paint sample.
Another potential application is in passive remote sensing, where high resolution and sensitivity areneeded in a device that is compact and sufficiently rugged to be carried in or attached to a plane orhelicopter. Because of its relatively small size and weight, the CHRS can also be used to make anylaboratory-based high resolution optical technique into a field technique. Such techniques and systemsare needed for determining the presence or absence, and measuring the concentration, of hazardouselements in various matrices including groundwater, soil, and gaseous remediation process and effluentstreams at hazardous waste sites.
Additional applications are anticipated in areas where conventional laboratory techniques are limited bythe resolution of the spectrometers used in commercial instrumentation. These areas include Ramanspectroscopy, conventional ICPAES, and atomic absorption.
20 U.S. Department of Energy
Patents/Commercialization/Sponsor
Iowa State University has offered the CHRS for licensing and Mississippi State University has offered theair-ICPAES CEM. Although several prominent analytical instrument manufacturers have expressedinterest in both technologies, so far, no commercial entity has committed to produce and market either. The principal investigator has communicated with potential users concerning the production of CHRSsystems for individual applications within DOE, such as hot-cell analysis of wastes. Ames Laboratoryintends to pursue such production under approved Work-for-Others arrangements.
U. S. Department of Energy 21
SECTION 5
Introduction
The main challenge in performing cost-savings analysis for application of the CHRS versus the baselineis the determination of costs for application of the two in one or more realistic application scenarios. Thisis especially difficult for the principal envisioned application of the CHRS, namely, as a key componentin a mercury- or multi-element CEM. In that application, the CEM (if it fulfills performance requirements)provides emissions data which are entirely different from (and much better than) that provided by thebaseline approach.
As described elsewhere (French, Priebe, and Haas 1999), the baseline (EPA) approach for limiting theemissions of hazardous air pollutants from hazardous waste combustors (HWCs) uses feed ratelimitations and control of facility operating conditions. Facility operators are required to measure andlimit the rate of mercury (and other hazardous element) feed and to operate the facility within a range ofconditions known to adequately limit the concentrations of the hazardous elements in the stack gas. Inthis baseline approach, the range of the waste feed rate and the other facility operating conditions underwhich the facility can perform with acceptably low emissions is established during an EPA trial burn orcomprehensive test. The performance of the facility and its associated air pollution control equipment ismeasured during those tests, which typically last one or two weeks. The regulations require periodic trialburns (every three to five years, depending on the size and type of facility) to verify that the facilitycontinues to meet emissions standards.
The baseline approach (feed and facility characterization and control) uses standard EPA SW-846laboratory analysis methods for measuring HAPs in the feed. During the trial burn or comprehensiveperformance tests, EPA method 29 is typically employed for sampling the stack gas and measuring theHAP emissions.
The baseline approach is useful, but it only provides emissions data during relatively short, widelyspaced test periods. The emissions are presumed to be under control during the three to five yearsbetween tests, but data to confirm this are not available. Clearly this regulatory approach does notprovide continuous assurance of compliance with emissions standards. On the other hand, CEMsprovide continuous real-time emissions data and, therefore, continuous assurance of compliance. That’swhy EPA prefers and encourages the use of CEMs.
Methodology
Application ScenariosThe cost analysis considers two application scenarios:
Scenario 1. The CHRS is employed in place of baseline technology for optical spectrometry.For this scenario, the cost analysis simply compares the cost of the CHRS to the cost ofseveral commercially available baseline spectrometers with comparable resolution.
Scenario 2. The CHRS is employed as a component of a multi-element CEM monitoring As, Be, Cd,Cr, Hg, and Pb during operation of a hazardous waste combustor treating DOE mixedwaste in compliance with the EPA MACT Rule.For this scenario, the cost analysis compares costs for three cases:1. No CEM is used; standard baseline sampling and off-site analytical laboratory analysis
methods are employed.2. A CHRS-based CEM is employed for continuous monitoring.3. No CEM is employed, however, standard baseline sampling and off-site analytical
laboratory analysis methods are employed in a multiple samples per day manner that
COST
22 U.S. Department of Energy
attempts to provide near continuous monitoring that roughly approximates thatprovided by a CEM.
General Cost Analysis Assumpt ionsTo facilitate understanding and comparison with costs at other sites, all overhead and general andadministrative (G&A) costs are omitted from this analysis, both for the innovative technology and for thebaseline.
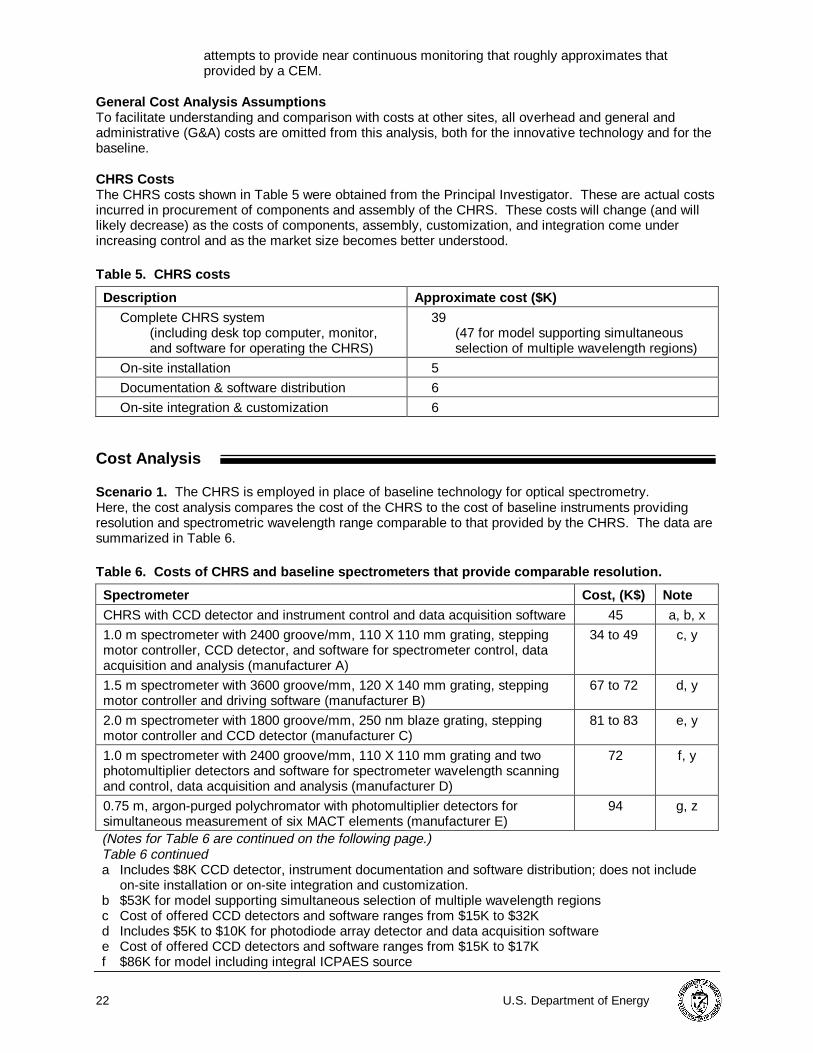
CHRS CostsThe CHRS costs shown in Table 5 were obtained from the Principal Investigator. These are actual costsincurred in procurement of components and assembly of the CHRS. These costs will change (and willlikely decrease) as the costs of components, assembly, customization, and integration come underincreasing control and as the market size becomes better understood.
Table 5. CHRS costs
Description Approximate cost ($K)
Complete CHRS system(including desk top computer, monitor,and software for operating the CHRS)
39(47 for model supporting simultaneousselection of multiple wavelength regions)
On-site installation 5
Documentation & software distribution 6
On-site integration & customization 6
Cost Analysis
Scenario 1. The CHRS is employed in place of baseline technology for optical spectrometry.Here, the cost analysis compares the cost of the CHRS to the cost of baseline instruments providingresolution and spectrometric wavelength range comparable to that provided by the CHRS. The data aresummarized in Table 6.
Table 6. Costs of CHRS and base line spectromet ers that provide comparable res olution.
Spectrometer Cost, (K$) Note
CHRS with CCD detector and instrument control and data acquisition software 45 a, b, x
1.0 m spectrometer with 2400 groove/mm, 110 X 110 mm grating, steppingmotor controller, CCD detector, and software for spectrometer control, dataacquisition and analysis (manufacturer A)
34 to 49 c, y
1.5 m spectrometer with 3600 groove/mm, 120 X 140 mm grating, steppingmotor controller and driving software (manufacturer B)
67 to 72 d, y
2.0 m spectrometer with 1800 groove/mm, 250 nm blaze grating, steppingmotor controller and CCD detector (manufacturer C)
81 to 83 e, y
1.0 m spectrometer with 2400 groove/mm, 110 X 110 mm grating and twophotomultiplier detectors and software for spectrometer wavelength scanningand control, data acquisition and analysis (manufacturer D)
72 f, y
0.75 m, argon-purged polychromator with photomultiplier detectors forsimultaneous measurement of six MACT elements (manufacturer E)
94 g, z
(Notes for Table 6 are continued on the following page.)Table 6 continueda Includes $8K CCD detector, instrument documentation and software distribution; does not include
on-site installation or on-site integration and customization.b $53K for model supporting simultaneous selection of multiple wavelength regionsc Cost of offered CCD detectors and software ranges from $15K to $32Kd Includes $5K to $10K for photodiode array detector and data acquisition softwaree Cost of offered CCD detectors and software ranges from $15K to $17Kf $86K for model including integral ICPAES source
U. S. Department of Energy 23
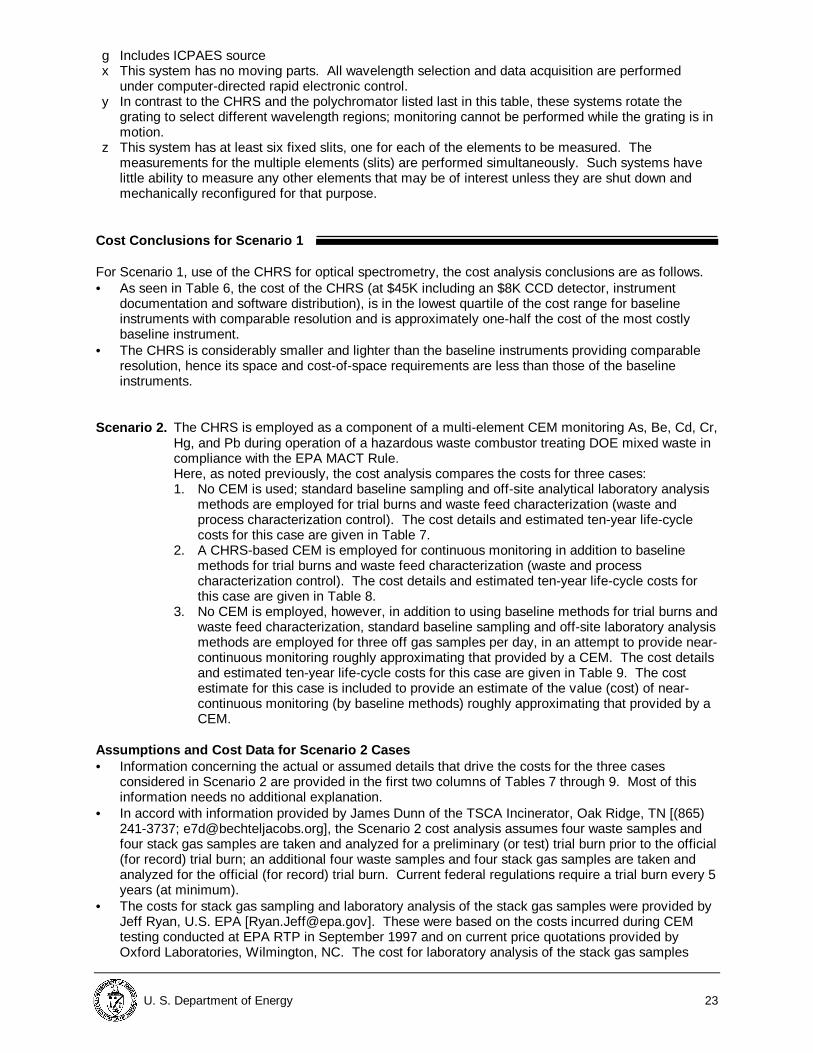
g Includes ICPAES sourcex This system has no moving parts. All wavelength selection and data acquisition are performed
under computer-directed rapid electronic control.y In contrast to the CHRS and the polychromator listed last in this table, these systems rotate the
grating to select different wavelength regions; monitoring cannot be performed while the grating is inmotion.
z This system has at least six fixed slits, one for each of the elements to be measured. Themeasurements for the multiple elements (slits) are performed simultaneously. Such systems havelittle ability to measure any other elements that may be of interest unless they are shut down andmechanically reconfigured for that purpose.
Cost Conclusions for Scenario 1
For Scenario 1, use of the CHRS for optical spectrometry, the cost analysis conclusions are as follows.• As seen in Table 6, the cost of the CHRS (at $45K including an $8K CCD detector, instrument
documentation and software distribution), is in the lowest quartile of the cost range for baselineinstruments with comparable resolution and is approximately one-half the cost of the most costlybaseline instrument.
• The CHRS is considerably smaller and lighter than the baseline instruments providing comparableresolution, hence its space and cost-of-space requirements are less than those of the baselineinstruments.
Scenario 2. The CHRS is employed as a component of a multi-element CEM monitoring As, Be, Cd, Cr,Hg, and Pb during operation of a hazardous waste combustor treating DOE mixed waste incompliance with the EPA MACT Rule.Here, as noted previously, the cost analysis compares the costs for three cases:1. No CEM is used; standard baseline sampling and off-site analytical laboratory analysis
methods are employed for trial burns and waste feed characterization (waste andprocess characterization control). The cost details and estimated ten-year life-cyclecosts for this case are given in Table 7.
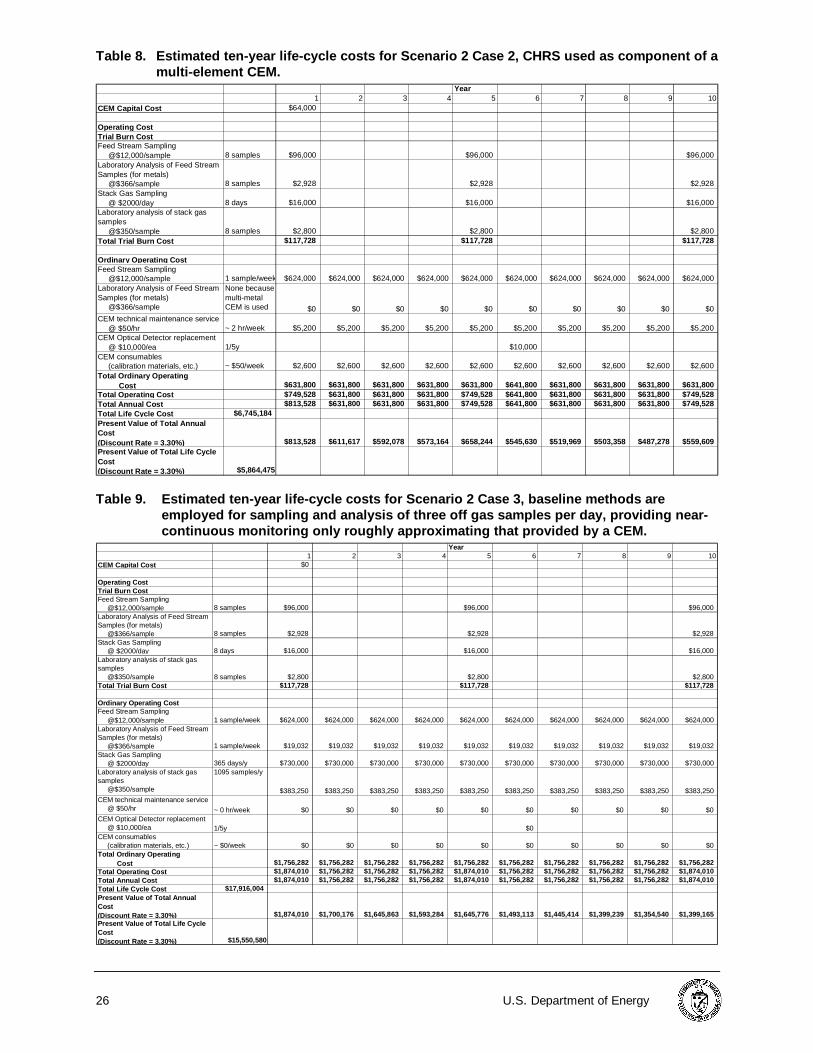
2. A CHRS-based CEM is employed for continuous monitoring in addition to baselinemethods for trial burns and waste feed characterization (waste and processcharacterization control). The cost details and estimated ten-year life-cycle costs forthis case are given in Table 8.
3. No CEM is employed, however, in addition to using baseline methods for trial burns andwaste feed characterization, standard baseline sampling and off-site laboratory analysismethods are employed for three off gas samples per day, in an attempt to provide near-continuous monitoring roughly approximating that provided by a CEM. The cost detailsand estimated ten-year life-cycle costs for this case are given in Table 9. The costestimate for this case is included to provide an estimate of the value (cost) of near-continuous monitoring (by baseline methods) roughly approximating that provided by aCEM.
Assumptions and Cost Data for Scenario 2 Cases• Information concerning the actual or assumed details that drive the costs for the three cases
considered in Scenario 2 are provided in the first two columns of Tables 7 through 9. Most of thisinformation needs no additional explanation.
• In accord with information provided by James Dunn of the TSCA Incinerator, Oak Ridge, TN [(865)241-3737; [email protected]], the Scenario 2 cost analysis assumes four waste samples andfour stack gas samples are taken and analyzed for a preliminary (or test) trial burn prior to the official(for record) trial burn; an additional four waste samples and four stack gas samples are taken andanalyzed for the official (for record) trial burn. Current federal regulations require a trial burn every 5years (at minimum).
• The costs for stack gas sampling and laboratory analysis of the stack gas samples were provided byJeff Ryan, U.S. EPA [[email protected]]. These were based on the costs incurred during CEMtesting conducted at EPA RTP in September 1997 and on current price quotations provided byOxford Laboratories, Wilmington, NC. The cost for laboratory analysis of the stack gas samples
24 U.S. Department of Energy
includes the cost of routine quality assurance testing. The cost for stack gas sampling ports is notincluded in this cost analysis because it is considered a plant cost. In any case, it would be the samefor the three CEM and baseline approaches considered in the Scenario 2 cost analysis.
• The costs for sampling of the mixed waste feed stream and laboratory analysis of feed streamsamples were taken from Mixed Waste Characterizat ion Document (INEEL/EXT-97-01009),September 1997; it was assumed that analysis of one feed stream sample per week would besufficient to adequately characterize the toxic metals content of the feed stream, as required bycurrent regulations.
• The cost analysis assumes the services of a CEM technician are required at the level of two hoursper week – to cover weekly routine CEM maintenance and calibration activities. As the CEMtechnologies mature, this would likely decrease to one hour per week or less.
• The cost analysis assumes the optical detector for the CEM would need replacement every fiveyears (on average).
• The cost analysis assumes CEM consumables, principally calibration materials, would costapproximately $50/week.
• The stated CEM capital cost ($64K) includes a complete CHRS-based CEM for As, Be, Cd, Cr, Pb,and Hg. The cost indicated is for a complete CHRS system supporting simultaneous selection ofmultiple wavelength regions, desk top computer and monitor, CCD detector, software for instrumentcontrol and data acquisition, CHRS documentation, on-site installation, and on-site integration andcustomization (per Table 5, above).
Cost Conclusions for Scenario 2
• The CHRS-based CEM (Case 2) provides continuous monitoring of multi-metals emissions at lesscost than the baseline method (Case 1), which measures emissions only once every five years. Theestimated ten-year life-cycle cost is $5.864 for the CHRS-based CEM versus $5.889 million for thebaseline method.
• The CHRS-based CEM (Case 2) provides better monitoring (continuous versus near continuous)than application of baseline sample collection and laboratory analysis methods that only roughlyapproximates continuous monitoring (Case 3) and does so at lower cost (estimated ten-year life-cycle cost of $5.864 million versus $15.551 million).
• The difference between the estimated ten-year life-cycle costs for Case 1 ($5.889 million) and Case3 ($15.551 million) provides one estimate of the value of the near-continuous emissions monitoringthat can be provided when baseline methods are applied in a way that only roughly approximatesthat provided by the multi-metals CEM. The estimated ten-year value of such near-continuousmonitoring, if provided by baseline methods, is $9.687 million.
• The cost of taking feed stream samples – for characterization of the hazardous constituents content– is the principal operating cost for all three Scenario 2 cases. This cost is high because the waste isassumed to contain TRU radionuclides. Hence, all sampling operations must be performed in waysthat protect the sampling personnel from those radionuclides as well as the hazardous chemicalconstituents. This requires the use of engineered barriers such as glove boxes and painstakingattention to safety, hence the high cost.
• EPA does not require feed stream characterization for those hazardous constituents for which a CEMis employed. According to EPA, this is an incentive to encourage the use of CEMs. This is not alarge cost incentive for the Scenario 2 CEM application because the estimated ten-year life-cycle(present value) cost for Scenario 2 Case 2 is only reduced by 2.8 percent (from $6.030 million to$5.864 million) when feed stream analysis for hazardous metals is eliminated. The incentive is largeenough, however to make the estimated ten-year life-cycle cost for use of the CHRS-based multi-metals CEM $25K (0.4 percent) less than that of the baseline. Reduction or elimination of feedstream sampling costs as well would have a much larger impact, reducing the estimated ten-yearlife-cycle cost to $0.449 million. However, the regulatory requirement to characterize the feedstream for hazardous materials other than those monitored by a multi-element CEM still has to besatisfied; this means that samples still have to be taken.
Other Conclusions
The key fact concerning use of the CHRS as a CEM component (as in scenario 2) is that it is enablingtechnology. The characteristics and capabilities of the CHRS enable the creation of CEMs with theperformance capabilities needed for compliance monitoring of hazardous emissions. CEMs with those
U. S. Department of Energy 25
capabilities, by providing far more timely and complete information concerning emissions, enable bettercontrol of the waste treatment process and the emissions therefrom and, consequently, better protectionof human health and the environment. This is the driver for the use of CEMs, not cost or cost avoidance.
• Because the application of CEMs is not driven by cost but by regulations and other non-costconsiderations such as protection of human health and the environment, and securing or protecting a“right to operate” granted by the facility neighbors, the comparisons of cost for the Scenario 2 casescan only be said to be interesting, not compelling.
• As additional demonstrations are completed using the CHRS, additional cost data will be generatedand more comprehensive cost analyses will become possible.
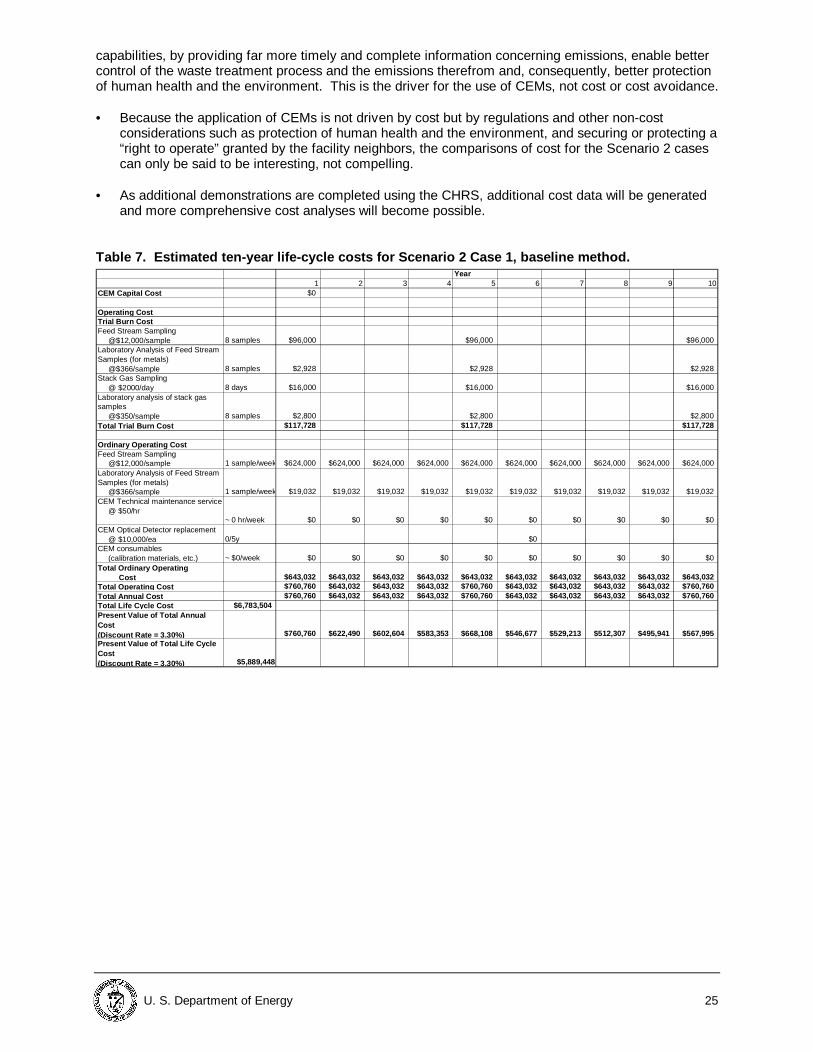
Table 7. Estimated ten-year life-cycle costs for Scenario 2 Case 1, base line method.Year
1 2 3 4 5 6 7 8 9 10CEM Capital Cost $0
Operatin g CostTrial Burn CostFeed Stream Sampling @$12,000/sample 8 samples $96,000 $96,000 $96,000Laboratory Analysis of Feed Stream Samples (for metals) @$366/sample 8 samples $2,928 $2,928 $2,928Stack Gas Sampling @ $2000/day 8 days $16,000 $16,000 $16,000Laboratory analysis of stack gas samples @$350/sample 8 samples $2,800 $2,800 $2,800Total Trial Burn Cost $117,728 $117,728 $117,728
Ordinar y Operatin g CostFeed Stream Sampling @$12,000/sample 1 sample/week $624,000 $624,000 $624,000 $624,000 $624,000 $624,000 $624,000 $624,000 $624,000 $624,000Laboratory Analysis of Feed Stream Samples (for metals) @$366/sample 1 sample/week $19,032 $19,032 $19,032 $19,032 $19,032 $19,032 $19,032 $19,032 $19,032 $19,032CEM Technical maintenance service @ $50/hr
~ 0 hr/week $0 $0 $0 $0 $0 $0 $0 $0 $0 $0CEM Optical Detector replacement @ $10,000/ea 0/5y $0CEM consumables (calibration materials, etc.) ~ $0/week $0 $0 $0 $0 $0 $0 $0 $0 $0 $0Total Ordinary Operating Cost $643,032 $643,032 $643,032 $643,032 $643,032 $643,032 $643,032 $643,032 $643,032 $643,032Total O peratin g Cost $760,760 $643,032 $643,032 $643,032 $760,760 $643,032 $643,032 $643,032 $643,032 $760,760Total Annual Cost $760,760 $643,032 $643,032 $643,032 $760,760 $643,032 $643,032 $643,032 $643,032 $760,760Total Life C ycle Cost $6,783,504Present Value of Total Annual Cost(Discount Rate = 3.30% ) $760,760 $622,490 $602,604 $583,353 $668,108 $546,677 $529,213 $512,307 $495,941 $567,995Present Value of Total Life Cycle Cost(Discount Rate = 3.30% ) $5,889,448
26 U.S. Department of Energy
Table 8. Estimated ten-year life-cycle costs for Scenario 2 Case 2, CHRS used as com ponent of amulti-element CEM.
Year1 2 3 4 5 6 7 8 9 10
CEM Capital Cost $64,000
Operatin g CostTrial Burn CostFeed Stream Sampling @$12,000/sample 8 samples $96,000 $96,000 $96,000Laboratory Analysis of Feed Stream Samples (for metals) @$366/sample 8 samples $2,928 $2,928 $2,928Stack Gas Sampling @ $2000/day 8 days $16,000 $16,000 $16,000Laboratory analysis of stack gas samples @$350/sample 8 samples $2,800 $2,800 $2,800Total Trial Burn Cost $117,728 $117,728 $117,728
Ordinar y Operatin g CostFeed Stream Sampling @$12,000/sample 1 sample/week $624,000 $624,000 $624,000 $624,000 $624,000 $624,000 $624,000 $624,000 $624,000 $624,000Laboratory Analysis of Feed Stream Samples (for metals) @$366/sample
None because multi-metal CEM is used $0 $0 $0 $0 $0 $0 $0 $0 $0 $0
CEM technical maintenance service @ $50/hr ~ 2 hr/week $5,200 $5,200 $5,200 $5,200 $5,200 $5,200 $5,200 $5,200 $5,200 $5,200CEM Optical Detector replacement @ $10,000/ea 1/5y $10,000CEM consumables (calibration materials, etc.) ~ $50/week $2,600 $2,600 $2,600 $2,600 $2,600 $2,600 $2,600 $2,600 $2,600 $2,600Total Ordinary Operating Cost $631,800 $631,800 $631,800 $631,800 $631,800 $641,800 $631,800 $631,800 $631,800 $631,800Total O peratin g Cost $749,528 $631,800 $631,800 $631,800 $749,528 $641,800 $631,800 $631,800 $631,800 $749,528Total Annual Cost $813,528 $631,800 $631,800 $631,800 $749,528 $641,800 $631,800 $631,800 $631,800 $749,528Total Life C ycle Cost $6,745,184Present Value of Total Annual Cost(Discount Rate = 3.30% ) $813,528 $611,617 $592,078 $573,164 $658,244 $545,630 $519,969 $503,358 $487,278 $559,609Present Value of Total Life Cycle Cost(Discount Rate = 3.30% ) $5,864,475
Table 9. Estimated ten-year life-cycle costs for Scenario 2 Case 3, base line methods areemployed for sampling and analysis of th ree off gas samples per day, prov iding n ear-continuous monitoring only roughly approximating that provided by a CEM.
Year1 2 3 4 5 6 7 8 9 10
CEM Capital Cost $0
Operatin g CostTrial Burn CostFeed Stream Sampling @$12,000/sample 8 samples $96,000 $96,000 $96,000Laboratory Analysis of Feed Stream Samples (for metals) @$366/sample 8 samples $2,928 $2,928 $2,928Stack Gas Sampling @ $2000/day 8 days $16,000 $16,000 $16,000Laboratory analysis of stack gas samples @$350/sample 8 samples $2,800 $2,800 $2,800Total Trial Burn Cost $117,728 $117,728 $117,728
Ordinary Operating CostFeed Stream Sampling @$12,000/sample 1 sample/week $624,000 $624,000 $624,000 $624,000 $624,000 $624,000 $624,000 $624,000 $624,000 $624,000Laboratory Analysis of Feed Stream Samples (for metals) @$366/sample 1 sample/week $19,032 $19,032 $19,032 $19,032 $19,032 $19,032 $19,032 $19,032 $19,032 $19,032Stack Gas Sampling @ $2000/day 365 days/y $730,000 $730,000 $730,000 $730,000 $730,000 $730,000 $730,000 $730,000 $730,000 $730,000Laboratory analysis of stack gas samples @$350/sample
1095 samples/y
$383,250 $383,250 $383,250 $383,250 $383,250 $383,250 $383,250 $383,250 $383,250 $383,250CEM technical maintenance service @ $50/hr ~ 0 hr/week $0 $0 $0 $0 $0 $0 $0 $0 $0 $0CEM Optical Detector replacement @ $10,000/ea 1/5y $0CEM consumables (calibration materials, etc.) ~ $0/week $0 $0 $0 $0 $0 $0 $0 $0 $0 $0Total Ordinary Operating Cost $1,756,282 $1,756,282 $1,756,282 $1,756,282 $1,756,282 $1,756,282 $1,756,282 $1,756,282 $1,756,282 $1,756,282Total O peratin g Cost $1,874,010 $1,756,282 $1,756,282 $1,756,282 $1,874,010 $1,756,282 $1,756,282 $1,756,282 $1,756,282 $1,874,010Total Annual Cost $1,874,010 $1,756,282 $1,756,282 $1,756,282 $1,874,010 $1,756,282 $1,756,282 $1,756,282 $1,756,282 $1,874,010Total Life C ycle Cost $17,916,004Present Value of Total Annual Cost(Discount Rate = 3.30% ) $1,874,010 $1,700,176 $1,645,863 $1,593,284 $1,645,776 $1,493,113 $1,445,414 $1,399,239 $1,354,540 $1,399,165Present Value of Total Life Cycle Cost(Discount Rate = 3.30% ) $15,550,580
U. S. Department of Energy 27
SECTION 6
Regulatory Considerations
There are no regulatory or permitting issues specific to application of the CHRS. When a CHRS-equipped multi-metal CEM is used, the regulatory requirements that pertain to all multi-metal CEMsapply. Initially, those requirements were detailed in the draft performance specification published byEPA (EPA 1996, pp. 17499-17502). When the final rule was promulgated, however, EPA replaced thedraft performance specification with performance guidelines that are somewhat less specific andpresumably more achievable.
Likewise, there are no worker safety issues specific to CHRS application. When a CHRS-equippedmulti-metal CEM is used, the worker safety issues are no different than if the CEM were equipped with abaseline spectrometer. Actually, as compared to the baseline, a CHRS-equipped CEM will likely requireless frequent operator attention for maintenance because the CHRS has no moving parts.
As noted earlier, regulatory requirements and costs for trial burns and waste feed characterization arereduced (compared to the baseline) when CEMs are used (regardless of whether the CEMs include aCHRS).
Secondary waste stream regulatory considerations are not affected by CHRS application.
Evaluation of CHRS with Respect to CERCLA Criteria
1. Overall protection of human health and the environment. The implementation of continuousemissions monitoring, enabled by the inclusion of the CHRS in new CEMs, is expected to providebetter and continuous control of emissions from thermal treatment of hazardous and mixed waste.Inclusion of the CHRS in new CEMs capable of satisfying EPA performance specifications and theapplication of those CEMs at mixed waste thermal treatment facilities will permit reduction of feedstream characterization requirements, thus reducing the potential for exposure of samplers andanalysts to hazardous and radioactive waste materials.
2. Compliance with ARARs (Applicable or Relevant and Appropriate Requirements). Not applicable.3. Long term effectiveness and permanence. The improved and more economical characterization and
monitoring enabled by use of CHRS-equipped CEMs is expected to provide better knowledge andcontrol of waste treatment processes. This is expected to provide consistently more effective andpermanent waste forms.
4. Reduction of toxicity, mobility, or volume through treatment. See item 3, above.5. Short term effectiveness. The improved and more economical characterization and monitoring of
thermal treatment processes enabled by use of CHRS-equipped CEMs is expected to reduce thetime (and impacts on human health and the environment) until treatment objectives are achieved.
6. Implementability. The numerous demonstrations and applications of mercury and multi-metal CEMsconducted so far show there is no particular technical difficulty or uncertainty associated with the useof these instruments. Prior to implementation, the performance of CEMs is expected to be verifiedthrough the EPA-sponsored Environmental Technology Verification program.
7. Cost. Cost considerations for the CHRS are addressed in Section 5 of this report.8. State (support agency) acceptance. Technical and administrative issues and concerns the State
(support agency) may have are addressed in the preceding subsection of this report.9. Community acceptance. Positive community reaction is expected because in CEM applications the
CHRS provides better and more economical emissions monitoring, thus enabling better control of thewaste treatment facilities and complete documentation of operation with respect to emissions.
REGULATORY AND POLICY ISSUES

28 U.S. Department of Energy
Safety, Risks, Benefits, and Community Reaction
As noted above, there are no regulatory or permitting issues specific to application of the CHRS. Theissues addressed below are those pertaining to the use of CHRS-equipped CEMs.
Worker Safety• Use of CEMs will minimize worker exposure and hazards associated with the baseline method of
providing compliance assurance — trial burn operations and EPA Method 29 sampling and analysisoperations.
• As compared to the baseline, use of CEMs will reduce worker exposure associated with feed streamsampling and analysis.
Community Safety and Potential Environmental Impacts• Use of CEMs will facilitate the control of emissions, thus minimizing the risk of catastrophic releases.• Compared to baseline operations, implementation of CEMs — and the associated waste feed cutoff
provisions — at mixed waste thermal treatment facilities will decrease the likelihood of emissionsexceedances and their environmental impacts.
Liability Risk• CEMs will reduce liability risk by providing continuous data on stack gas emissions at thermal waste
treatment facilities. The data can provide proof that the treatment facilities are being operated safelyat all times, in full compliance with regulatory requirements.
Potential Socioeconomic Impacts and Community Reaction• Community reaction is expected to be positive because application of the CHRS in CEMs at thermal
waste treatment facilities will provide comprehensive information on stack gas emissions. Thebaseline approach, stack gas sampling plus off-site laboratory analysis, typically only providesinformation on emissions during a few hourly periods per year.
Comparison with Base line and Competing Technologies• CEM methods will likely be validated through long time use with the reference methods used for
compliance monitoring. A record of acceptable performance in this mode of operation will lead toregulatory acceptance.
• Use of CEMs will be perceived as an important improvement over incinerator and HWC validationtests.
• Some stakeholders demand the implementation of CEMs to guarantee operation is within safety andregulatory limits.
U. S. Department of Energy 29
SECTION 7
Implementation Considerations
The CHRS should be considered in any situation for which high resolution, multi-element sensingcapability, and small instrument size/weight are important. Such applications include mercury and multi-element CEM applications.
Technology Limitations and Needs for Future Development
• Sequential bandpass selection. The AOTF bandpass selection is fast and does not involve anymoving parts. The currently employed AOTF passes only one wavelength region at a time.Therefore, when monitoring constituents that require m separate AOTF frequency selections, theCHRS is only able to monitor any constituent 1/m th of the time. Higher signal to noise ratios couldbe achieved if a number of AOTF selection frequencies could be employed simultaneously and eachconstituent could be monitored for a greater time fraction. Using multiple simultaneous rf driverfrequencies, late model AOTFs support simultaneous selection of three separate wavelengthregions.
• Wavelength coverage. The AOTF design is optimized for the 200 to 425 nm region. However, thisregion includes most of the analytical lines of interest for hazardous emissions monitoring.
• Optical quality. Current versions of the CHRS use ordinary spherical optics, so highest qualityoptical imaging and resolution are not achieved. Higher quality imaging could be achieved if moresophisticated (costly) aspherical optical components were employed.
• Automation. The procedure employed for wavelength calibration of the CHRS could be automated.In that case, the CHRS could be operated entirely under computer control, not even requiringoperator intervention for annual wavelength calibration.
Technology Selection Considerations
• Selection of the CHRS is indicated when the advantages unique to it are desired. These includehigh resolution capability (to avoid interference and/or to achieve increased signal to noise) withextremely fast, non-mechanical wavelength tunability providing multiple analyte measurementcapability and real-time background measurement and correction capability. These advantages areneeded for the mercury and multi-element CEM applications.
• Site-specific job requirements (specific elements of concern) will influence the technology selection.In particular, the elements of concern will dictate the wavelength regions of concern. One or more ofthese may fall outside the optimum CHRS performance area.
LESSONS LEARNED
U. S. Department of Energy A-1
APPENDIX A
Baldwin, D. P. and D. S. Zamzow. 1997. Limits of detection for an AOTF-FFP spectrometer in ICPatomic emission spectroscopy. Talanta 45: 229-235.
Baldwin, D. P., D. S. Zamzow, and A. P. D’Silva. 1996. High resolution spectroscopy using an acousto-
optic tunable filter and fiber-optic Fabry-Perot interferometer. Appl. Spectrosc. 50: 498-503. Baldwin, D. P., D. S. Zamzow, and A. P. D’Silva. 1998. Detection limits for hazardous and radioactive
elements in airborne aerosols using inductively coupled air plasma-atomic emissionspectrometry. J. Air & Waste Management Assoc. 45: 789-791.
Baldwin, D. P., D. S. Zamzow, D. E. Eckels, and G. P. Miller. 1998. AOTF-echelle spectrometer for air-
ICPAES continuous emission monitoring of heavy metals and actinides. SPIE Proceedings:International Symposium on Industrial and Environmental Monitors and Biosensors 3534: 478-486.
Baldwin, D. P., D. S. Zamzow, and G. P. Miller. 1998. A high resolution interferometric spectrometer for
continuous emission monitoring. Symposium on Analytical Applications of AOTF, at theAmerican Chemical Society National Meeting in Dallas, TX.
Baldwin, D. P., D. S. Zamzow, D. E. Eckels, G. P. Miller, R. Wiser, and S. Tao. 1999. Testing of a
Continuous Sampling Air-ICP System as a Continuous Emission Monitor at the DiagnosticInstrumentation and Analysis Laboratory, September 12-17, 1999. U. S. Department of EnergyR&D Report IS-5138, October 5, 1999. Ames Laboratory USDOE, Ames, Iowa.
Baldwin, D. P., D. S. Zamzow, D. E. Eckels, and G. P. Miller. 1999. A Continuous Sampling Air-ICP for
Metals Emission Monitoring. Proceedings of SPIE Vol. 3853, pp. 213-220, 1999. Barnard, T. W., M. I. Crockett, J. C. Ivaldi, and P. L. Lundberg. 1993. Design and Evaluation of an
Echelle Grating Optical System for ICP-OES. Analytical Chemistry 1993, 65: 1225-1230. DOE (U. S. Department of Energy). 1998. Accelerating Cleanup: Paths to Closure. DOE/EM-0362.
June 1998. DOE-ID (U. S. Department of Energy, Idaho Operations Office). 1998. 1997 Performance Testing of
Multi-Metal Continuous Emissions Monitors. Document Number DOE/ID-10665. September1998.
EPA (U. S. Environmental Protection Agency). 1995. Test Methods for Evaluating Solid Waste:
Physical/Chemical Methods, SW-846 Update III. U. S. EPA, Washington, DC. EPA (U. S. Environmental Protection Agency). 1996. Hazardous Waste Combustors: Revised
Standards; Proposed Rule. 61 Federal Register 17358-17536 (April 19, 1996). EPA (U. S. Environmental Protection Agency). 1996b. Standards of Performance for New Stationary
Sources National Emissions Standards for Hazardous Air Pollutants, Addition of Method 29 toAppendix A of Part 60 and Amendments to Method 101A of Appendix B of Part 61. 61 FederalRegister 18260-18280 (April 25, 1996).
EPA (U. S. Environmental Protection Agency). 1999. NESHAPS: Final Standards for Hazardous Air
Pollutants for Hazardous Waste Combustors; Final Rule. 64 Federal Register 52828-53077(September 30, 1999).
French, N. B., S. J. Priebe, and W. J. Haas, Jr. 1999. State-of-the-Art Mercury CEMs. Analytical
Chemistry News & Features 1999, 71, 470A-475A.
REFERENCES
A-2 U.S. Department of Energy
Palmer, C., and E. Loewen. 1996. Diffraction Grating Handbook, 3rd edition, Richardson Grating
Laboratory, New York, 1996. Pilon, M. J., M. B. Denton, R. G. Schleichere, P. M. Moran, and S. B. Smith, Jr. 1990. Evaluation of a
New Array Detector Atomic Emission Spectrometer for Inductively Coupled Plasma AtomicEmission Spectroscopy. Applied Spectroscopy 1990, 44, 1613-1620.
Scheeline, A., C. A. Bye, D. L. Miller, S. W. Rynders, and R. C. Owen, Jr. 1991. Design and
Characterization of an Echelle Spectrometer for Fundamental and Applied EmissionSpectrochemical Analysis. Applied Spectroscopy 1991, 45, 334-346.
Tran, C. D. 1992. Acousto-Optic Devices: Optical Elements for Spectroscopy. Analytical Chemistry
1992, 64, 971A-981A. Winge, R. K., V. J. Peterson, and V. A. Fassel. 1979. Inductively Coupled Plasma – Atomic Emission
Spectroscopy: Prominent Lines. Applied Spectroscopy 1979, 33, 206-219.

U. S. Department of Energy B-1
APPENDIX B
AAS Atomic Absorption SpectrometryAES Atomic Emission SpectrometryAOTF Acousto-Optic Tunable FilterARARs Applicable or Relevant and Appropriate Requirementsarb. arbitraryAs ArsenicBe BerylliumCCD Charge Coupled DeviceCd CadmiumCEM Continuous Emissions MonitorCEMS Continuous Emissions Monitor SystemCHRS Compact High Resolution SpectrometerCr ChromiumCVAAS Cold Vapor Atomic Absorption SpectrometryDIAL Diagnostic Instrumentation and Analysis LaboratoryDOE U. S. Department of EnergyEM U. S. Department of Energy Office of Environmental ManagementEPA U. S. Environmental Protection AgencyFPI Fabry-Perot InterferometerGFAAS Graphite Furnace Atomic Absorption SpectrometryHAP Hazardous Air PollutantHg MercuryHiRIS High Resolution Interferometric SpectrometerICAP Inductively Coupled Argon PlasmaICAP-MS Inductively Coupled Argon Plasma – Mass SpectrometryICP Inductively Coupled PlasmaICPAES Inductively Coupled Plasma Atomic Emission SpectrometryLOD Limit of Detectionm meterMACT Maximum Achievable Control TechnologyMDL Method Detection LimitMHz megahertzµm micrometern.d. not detectedn.m. not measurednm nanometerOST Office of Science and TechnologyPb LeadPDA Photodiode ArrayPMT Photomultiplier TubePu Plutoniumrf radiofrequencys secondU UraniumUV UltravioletW Watt
ACRONYMS AND ABBREVIATIONS
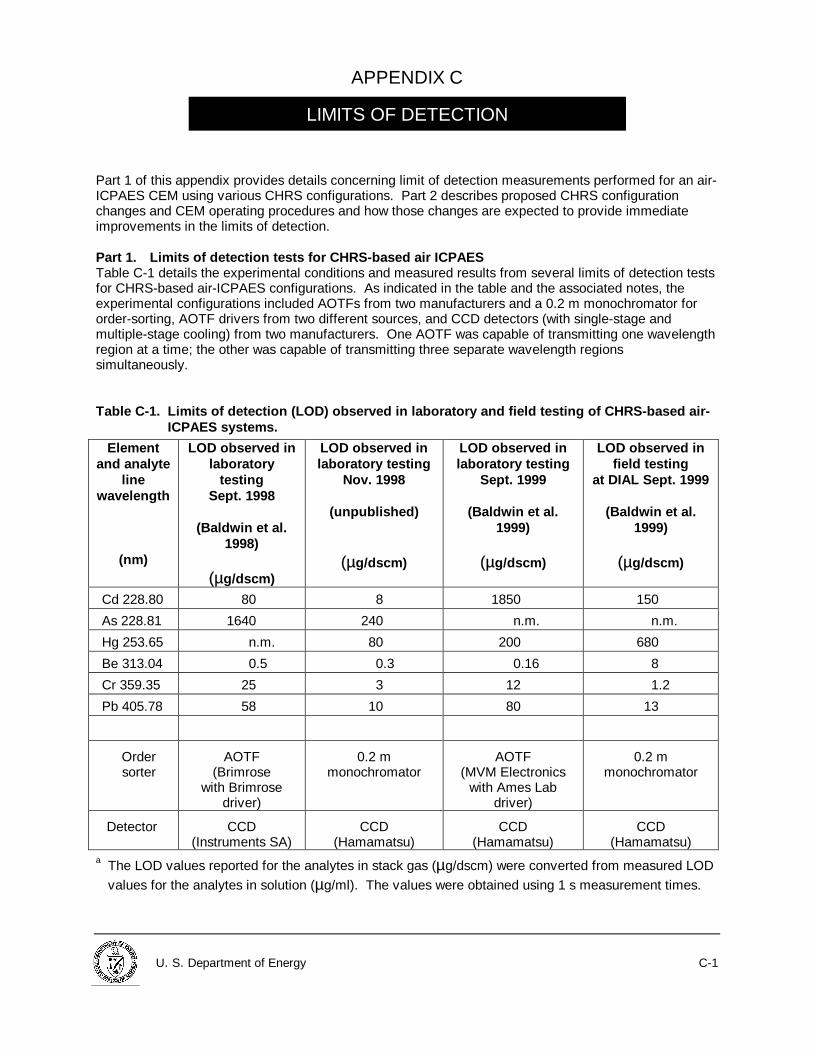
U. S. Department of Energy C-1
APPENDIX C
Part 1 of this appendix provides details concerning limit of detection measurements performed for an air-ICPAES CEM using various CHRS configurations. Part 2 describes proposed CHRS configurationchanges and CEM operating procedures and how those changes are expected to provide immediateimprovements in the limits of detection.
Part 1. Limits of detection tests for CHRS-based air ICPAES Table C-1 details the experimental conditions and measured results from several limits of detection testsfor CHRS-based air-ICPAES configurations. As indicated in the table and the associated notes, theexperimental configurations included AOTFs from two manufacturers and a 0.2 m monochromator fororder-sorting, AOTF drivers from two different sources, and CCD detectors (with single-stage andmultiple-stage cooling) from two manufacturers. One AOTF was capable of transmitting one wavelengthregion at a time; the other was capable of transmitting three separate wavelength regionssimultaneously. Table C-1. Limits of detection (LOD) ob served in laboratory and field test ing of CHRS-based air-
ICPAES systems.
Elementand analyte
linewavelength
(nm)
LOD observed inlaboratory
testing Sept. 1998
(Baldwin et al.
1998)
(µg/dscm)
LOD observed inlaboratory testing
Nov. 1998
(unpublished)
(µg/dscm)
LOD observed inlaboratory testing
Sept. 1999
(Baldwin et al.1999)
(µg/dscm)
LOD observed in field testing
at DIAL Sept. 1999
(Baldwin et al.1999)
(µg/dscm)
Cd 228.80 80 8 1850 150
As 228.81 1640 240 n.m. n.m.
Hg 253.65 n.m. 80 200 680
Be 313.04 0.5 0.3 0.16 8
Cr 359.35 25 3 12 1.2
Pb 405.78 58 10 80 13
Ordersorter
AOTF(Brimrose
with Brimrosedriver)
0.2 mmonochromator
AOTF(MVM Electronics
with Ames Labdriver)
0.2 mmonochromator
Detector CCD(Instruments SA)
CCD(Hamamatsu)
CCD(Hamamatsu)
CCD(Hamamatsu)
a The LOD values reported for the analytes in stack gas (µg/dscm) were converted from measured LOD
values for the analytes in solution (µg/ml). The values were obtained using 1 s measurement times.
LIMITS OF DETECTION
C-2 U.S. Department of Energy
The configuration for Column 2 of Table C-1 included an echelle spectrometer with a CCD detector(Instruments SA, Inc., Edison, NJ) and an AOTF (Brimrose Corporation of America, Baltimore, MD) witha Brimrose-supplied RF driver. This AOTF system transmits one wavelength region at a time. The configuration for Column 3 included an echelle spectrometer with a CCD detector (Hamamatsu,Corp., Bridgewater, NJ) and a 0.2 m monochromator for order sorting. The configuration for Column 4 included an echelle spectrometer with a CCD detector (HamamatsuCorp.) and an AOTF (MVM Electronics, Inc., Melbourne, FL) with an Ames Laboratory RF driver. TheRF driver had relatively low output power for radio frequencies corresponding to wavelengths less than235 nm. For those lower wavelengths, the output power was only one-third or less the power output atthe other wavelengths. With a proper power supply, LODs for cadmium and arsenic would be expectedto improve (decrease) by a factor of at least three. This AOTF can transmit as many as threewavelength regions simultaneously. The configuration for Column 5 included an echelle spectrometer with a CCD detector (HamamatsuCorp., Bridgewater, NJ) and a 0.2 m monochromator instead of an AOTF for order sorting. The AOTFcrystal scheduled for use in this test did not function properly so the demonstration team used a 0.2 mmonochromator in its place. The one week field demonstration schedule did not allow sufficient time foroptimization of the optical alignment of the monochromator – echelle combination, however, and the lessthan optimum performance for cadmium and mercury is attributed to less than optimum opticalalignment for the lowest wavelengths. The sample stream was not connected to the DIAL offgas stackand, therefore, was not affected by its pressure variations. The Hamamatsu CCD detector has single-stage cooling; the ISA CCD detector has multiple stagecooling (lower operating temperature, lower dark current, and lower dark current noise). Part 2. Limits of detection impro vementsOf all the CHRS configurations detailed in Table C-1, the one described in column 4 is most like thetarget configuration. Its order sorter is based on an AOTF with the ability to transmit multiple wavelengthregions so it is capable of providing monitoring that is more continuous than configurations that use anAOTF with single-band transmission and much more continuous than configurations that use amonochromator. As noted earlier, the LODs for Hg, As, and Cd are expected to improve (decrease) by afactor of at least three when the AOTF is operated with an appropriate RF driver. Additionalimprovements in LODs are expected from a number of other changes:1. Changing integration time from 1 s to 100 s will improve (decrease) LODs by a factor of 10, i. e., the
square root of 100/1.2. Ray-tracing calculations indicate improvement (decrease) by a factor of two will be achieved by
using an off-axis parabolic mirror in place of the present spherical collimating mirror.3. Use of a CCD detector with multiple stage cooling is expected to reduce dark current and dark
current noise and thus yield LOD improvement (decrease) by a factor of two.
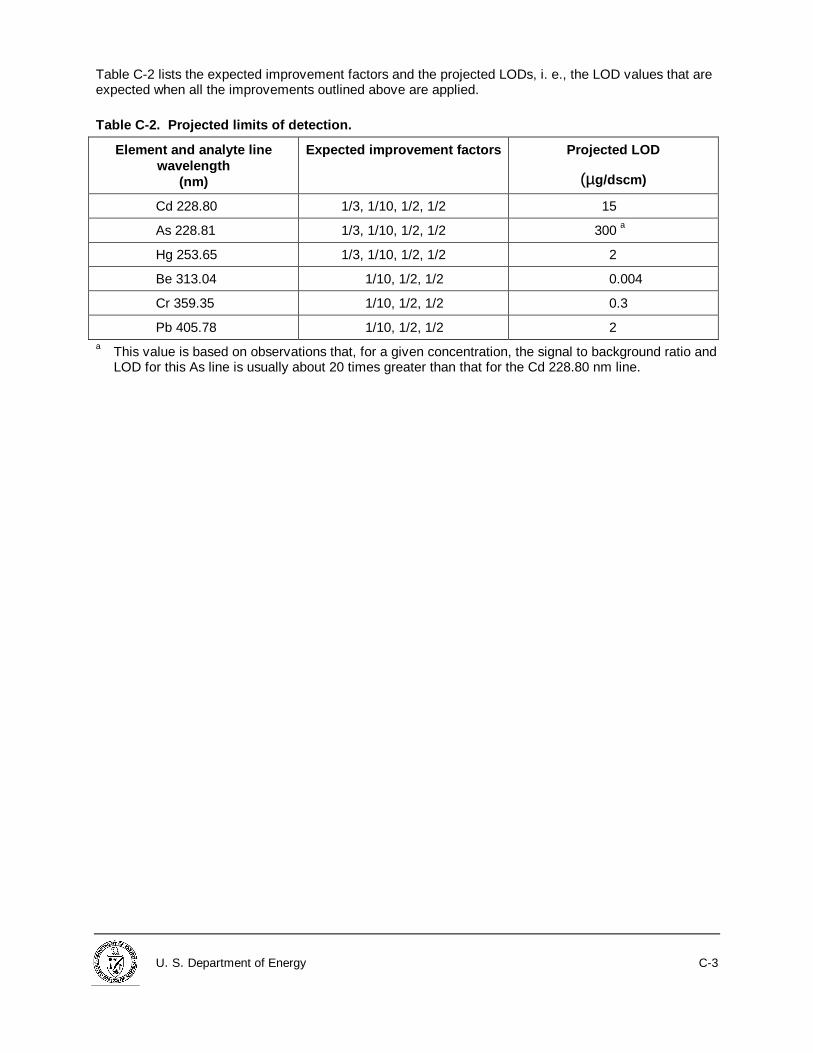
U. S. Department of Energy C-3
Table C-2 lists the expected improvement factors and the projected LODs, i. e., the LOD values that areexpected when all the improvements outlined above are applied.
Table C-2. Projected limits of detection.
Element and analyte linewavelength
(nm)
Expected improvement factors Projected LOD
(µg/dscm)
Cd 228.80 1/3, 1/10, 1/2, 1/2 15
As 228.81 1/3, 1/10, 1/2, 1/2 300 a
Hg 253.65 1/3, 1/10, 1/2, 1/2 2
Be 313.04 1/10, 1/2, 1/2 0.004
Cr 359.35 1/10, 1/2, 1/2 0.3
Pb 405.78 1/10, 1/2, 1/2 2a This value is based on observations that, for a given concentration, the signal to background ratio and
LOD for this As line is usually about 20 times greater than that for the Cd 228.80 nm line.