Embed Size (px)
Citation preview

COMP 6703 Project
A GUI Interface to the Gene Microarray Data Analysis
Program SigMotif.
Student: Ye Luo (u3972395)Clients: Professor Susan Wilson and Dr Kristine HardySupervisor: Dr Peter StrazdinsTime: 2006 Semester One
Background
• 1. Microarray experiments generate huge data sets
Microarray is an orderly arrangement of gene samples.
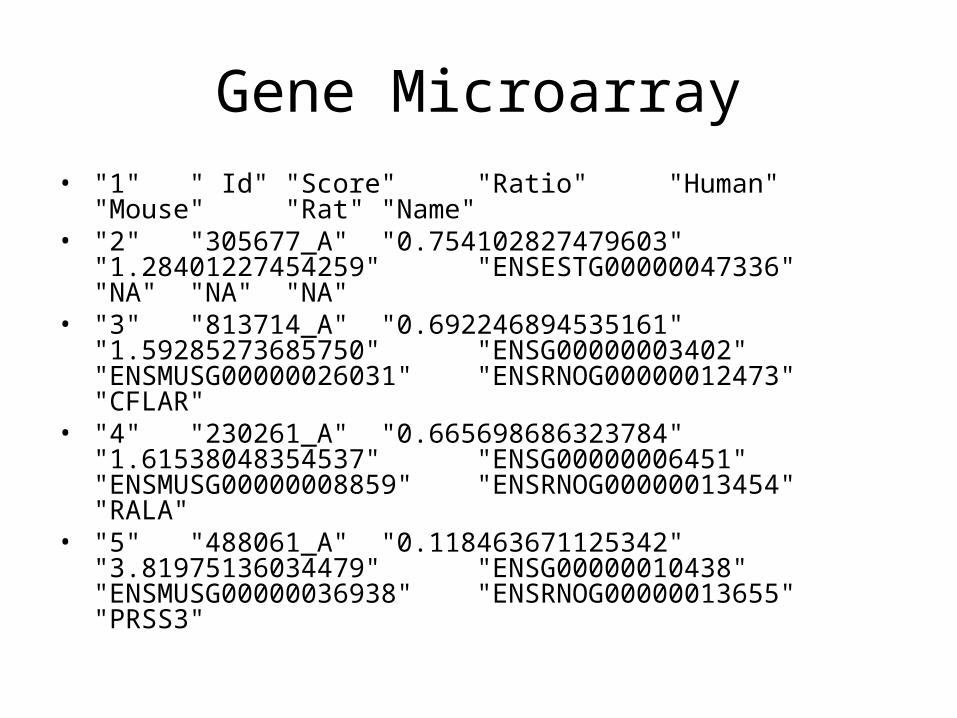
Gene Microarray• "1" " Id" "Score" "Ratio" "Human" "Mouse"
"Rat" "Name"• "2" "305677_A" "0.754102827479603"
"1.28401227454259" "ENSESTG00000047336" "NA""NA" "NA"
• "3" "813714_A" "0.692246894535161""1.59285273685750" "ENSG00000003402""ENSMUSG00000026031" "ENSRNOG00000012473""CFLAR"
• "4" "230261_A" "0.665698686323784""1.61538048354537" "ENSG00000006451""ENSMUSG00000008859" "ENSRNOG00000013454""RALA"
• "5" "488061_A" "0.118463671125342""3.81975136034479" "ENSG00000010438""ENSMUSG00000036938" "ENSRNOG00000013655""PRSS3"
• 2. No available software that combines the visualization and analysis of microarray data with that of biochemical networks (regulatory, interaction, metabolic).
SigMotif Description
A gene microarray data analysis program is developed by
an escience student Kristine Hardy last year.
It is built on the best of open-source analysis software R.
why use R ? R is an open source statistical computing environment
controlled by an interpreted programming language.
R provides good method and functions for easy
manipulation of statistical tests and graphs.
Some extension packages such as widgetTools provide
GUI interface to R program
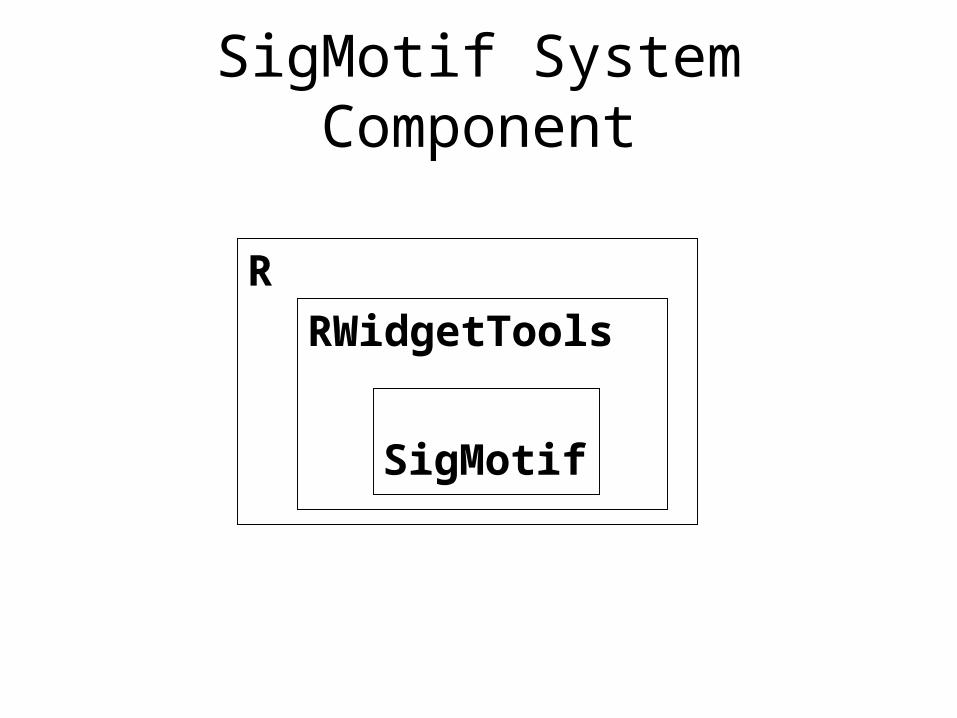
SigMotif System Component
R
RWidgetTools
SigMotif
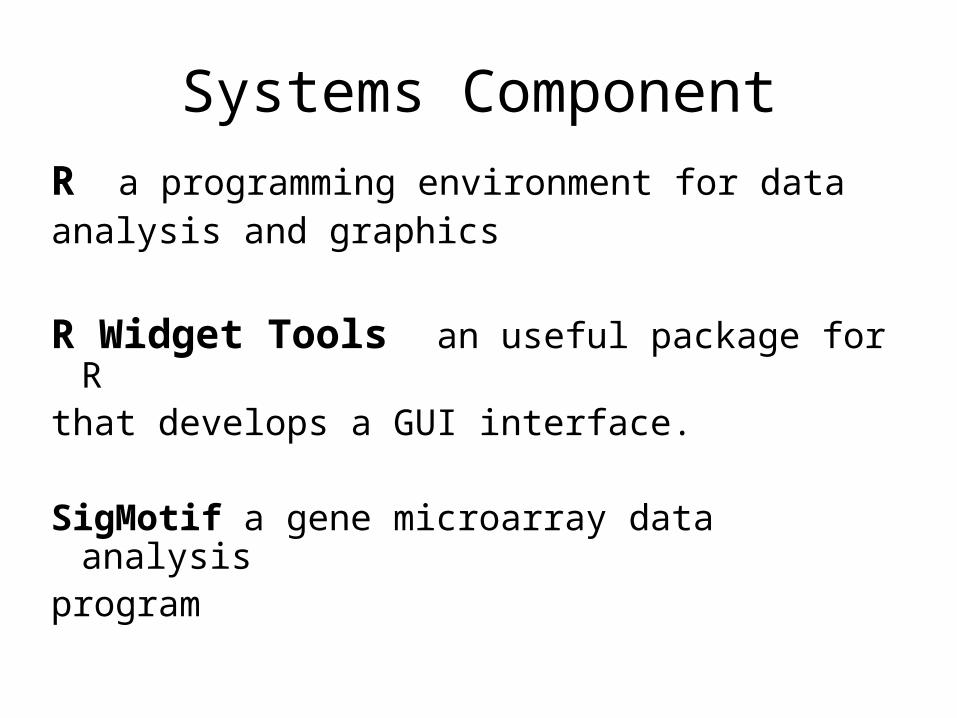
Systems Component
R a programming environment for dataanalysis and graphics
R Widget Tools an useful package for Rthat develops a GUI interface.
SigMotif a gene microarray data analysisprogram
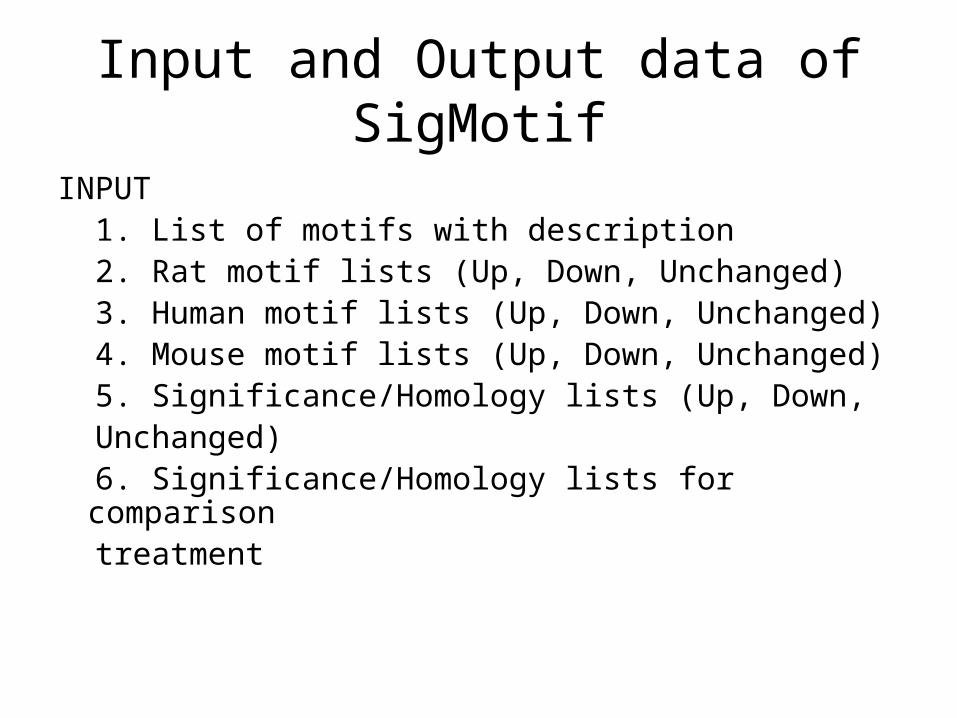
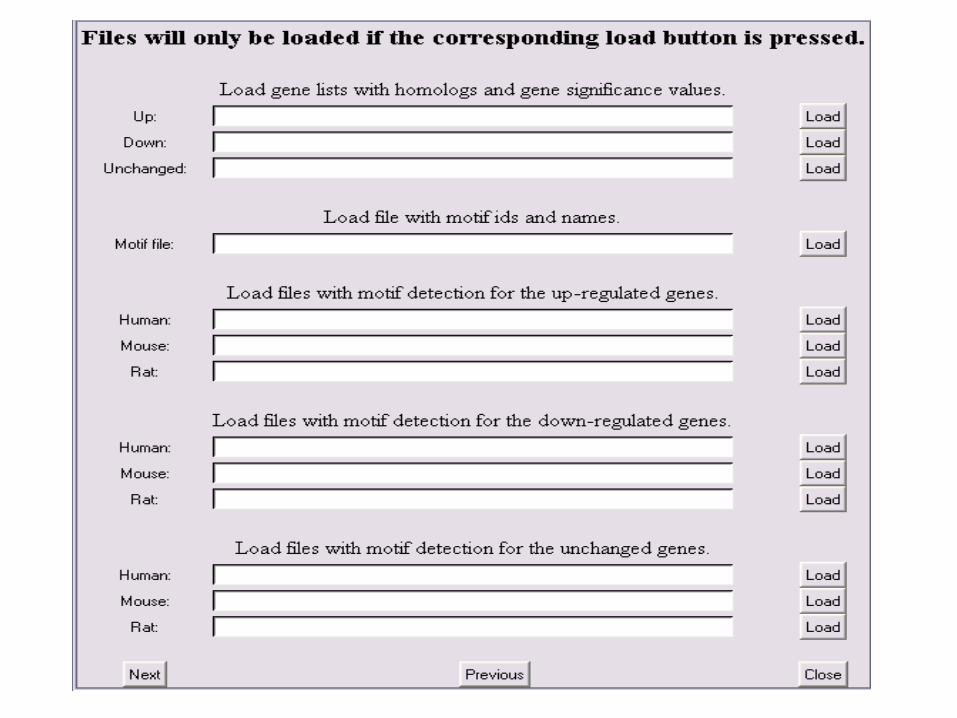
Input and Output data of SigMotif
INPUT 1. List of motifs with description 2. Rat motif lists (Up, Down, Unchanged) 3. Human motif lists (Up, Down, Unchanged) 4. Mouse motif lists (Up, Down, Unchanged) 5. Significance/Homology lists (Up, Down, Unchanged) 6. Significance/Homology lists for comparison treatment
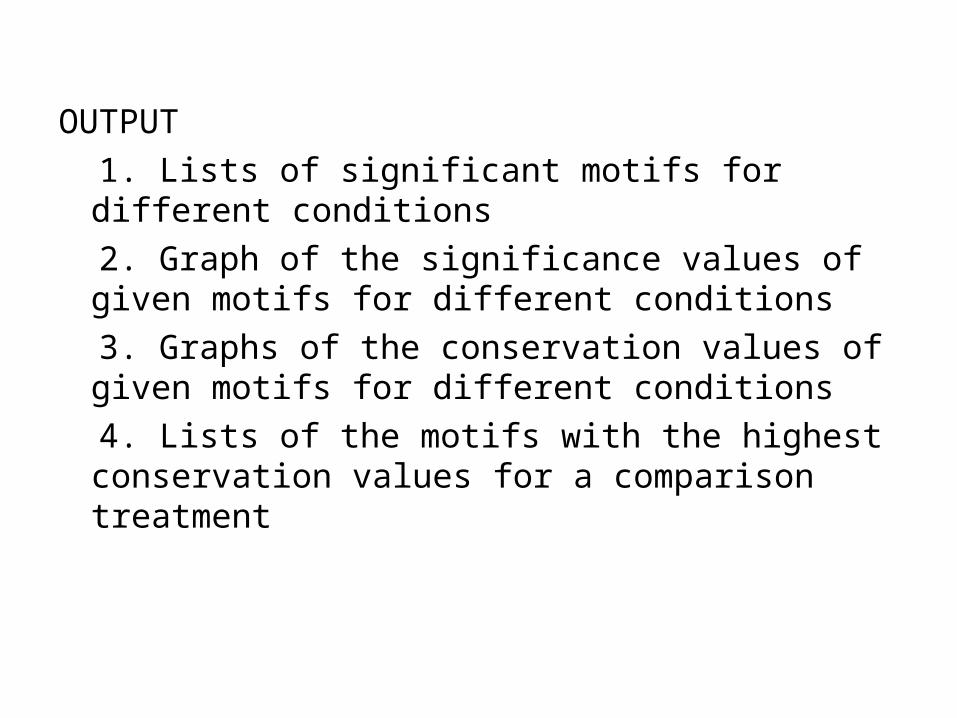
OUTPUT
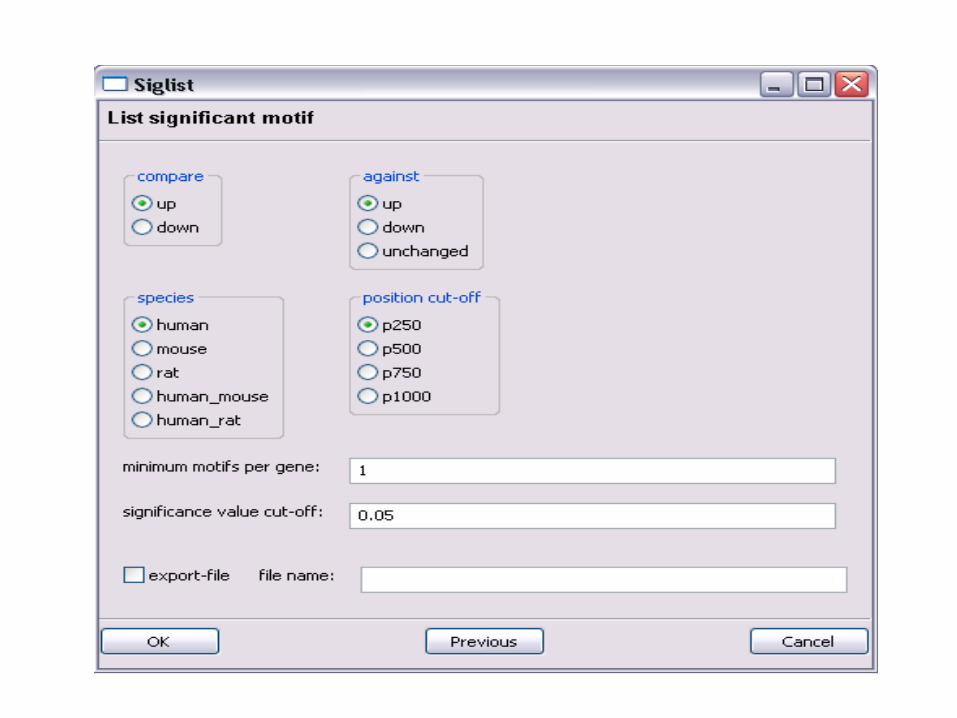
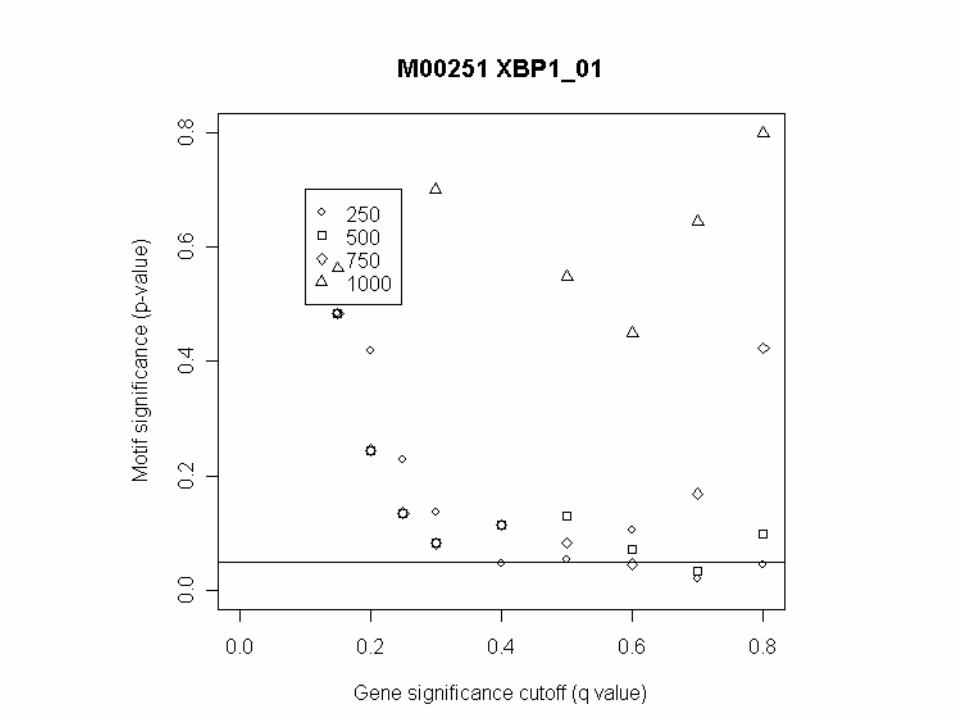
1. Lists of significant motifs for different conditions
2. Graph of the significance values of given motifs for different conditions
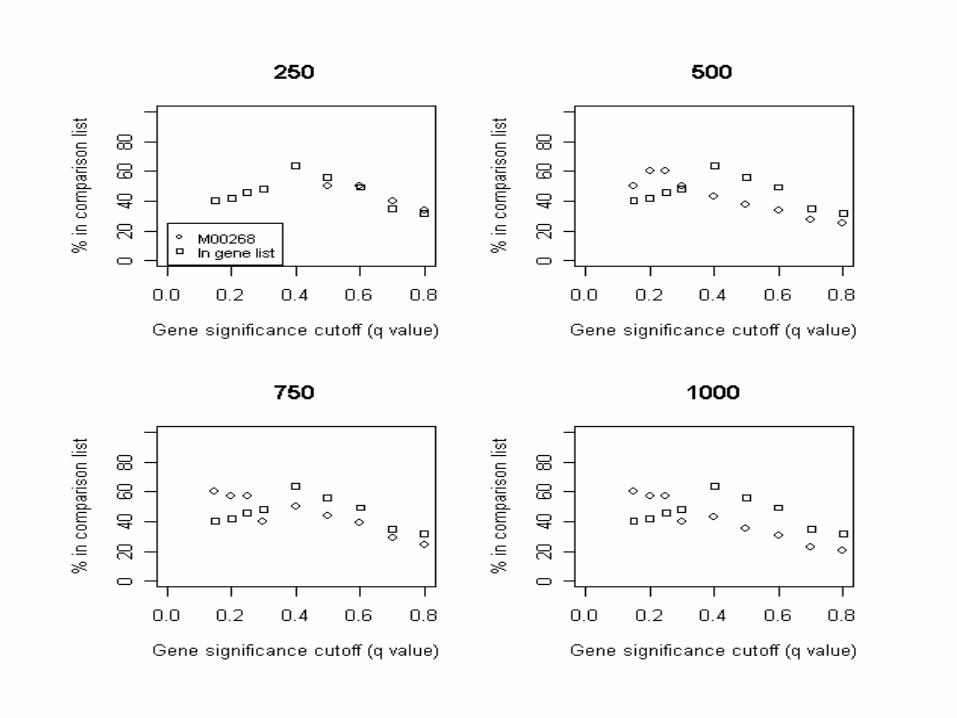
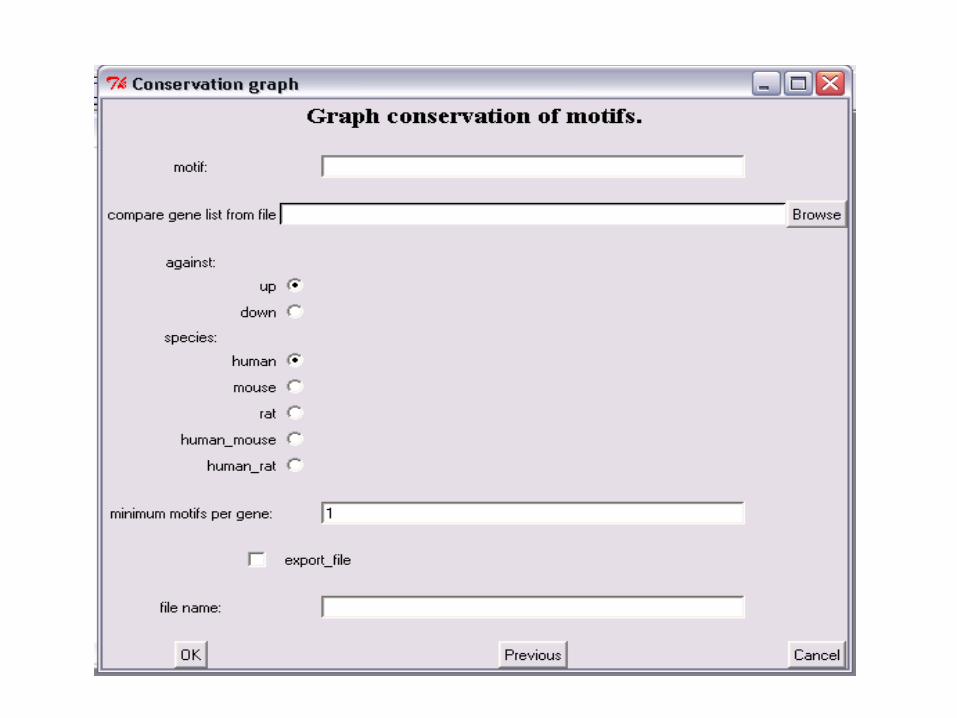
3. Graphs of the conservation values of given motifs for different conditions
4. Lists of the motifs with the highest conservation values for a comparison treatment
Drawbacks in SigMotif GUI Interface
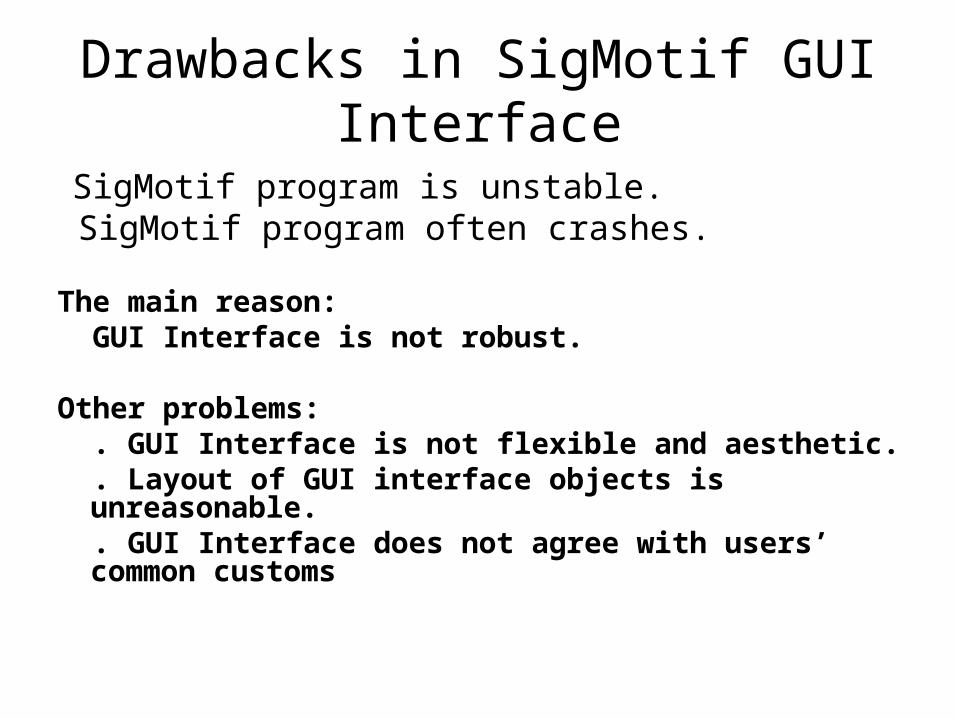
SigMotif program is unstable. SigMotif program often crashes. The main reason: GUI Interface is not robust. Other problems: . GUI Interface is not flexible and aesthetic. . Layout of GUI interface objects is unreasonable. . GUI Interface does not agree with users’ common
customs
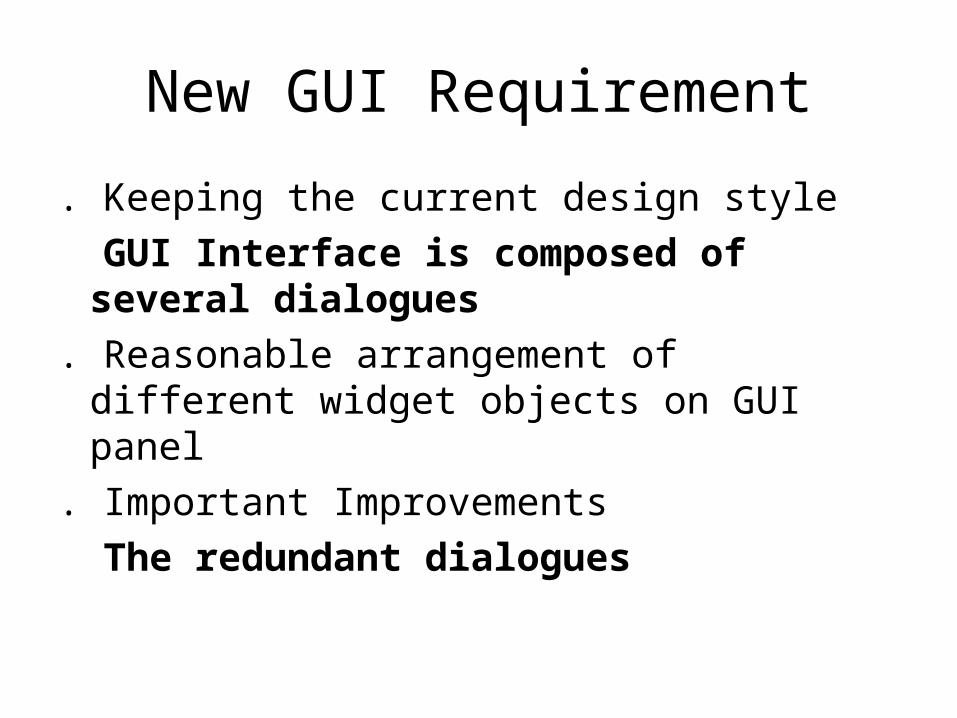
New GUI Requirement
. Keeping the current design style
GUI Interface is composed of several dialogues
. Reasonable arrangement of different widget objects on GUI panel
. Important Improvements
The redundant dialogues
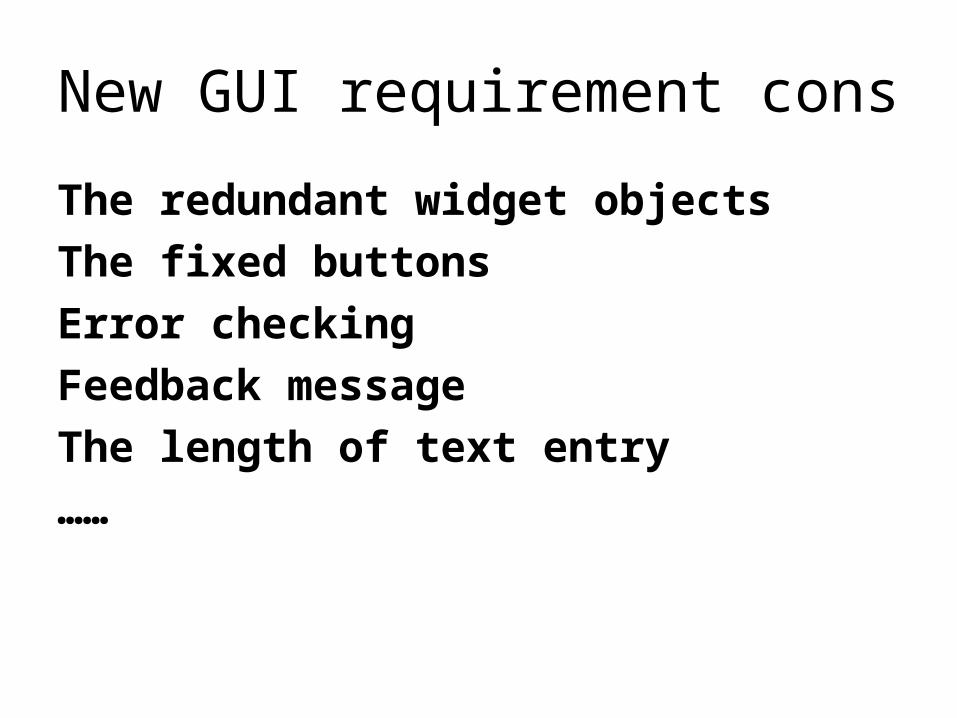
New GUI requirement cons
The redundant widget objects
The fixed buttons
Error checking
Feedback message
The length of text entry
……
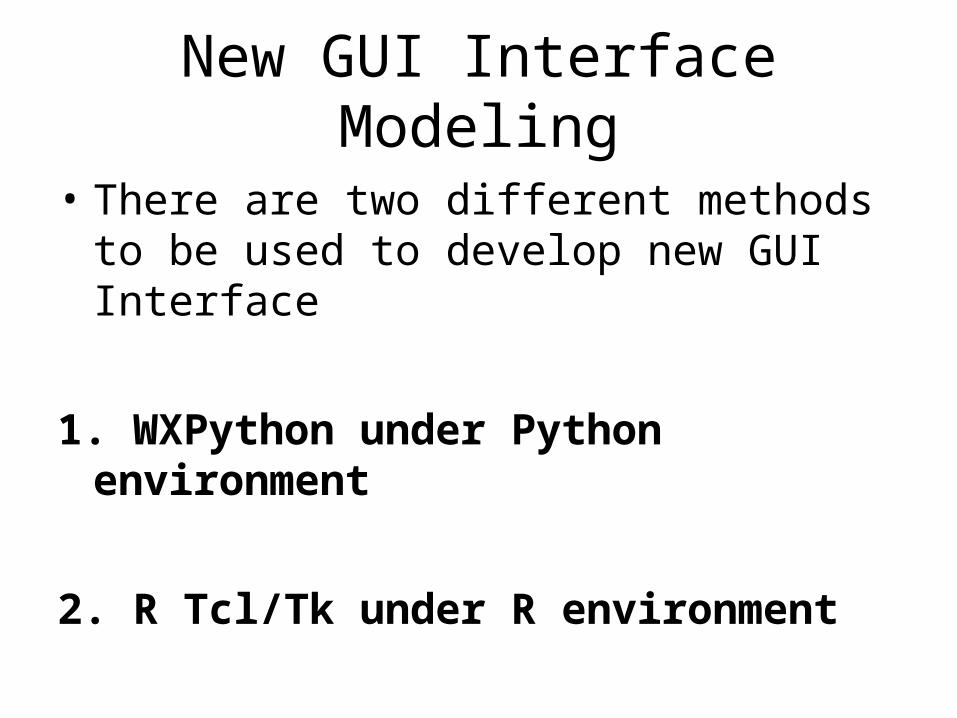
New GUI Interface Modeling
• There are two different methods to be used to develop new GUI Interface
1. WXPython under Python environment
2. R Tcl/Tk under R environment
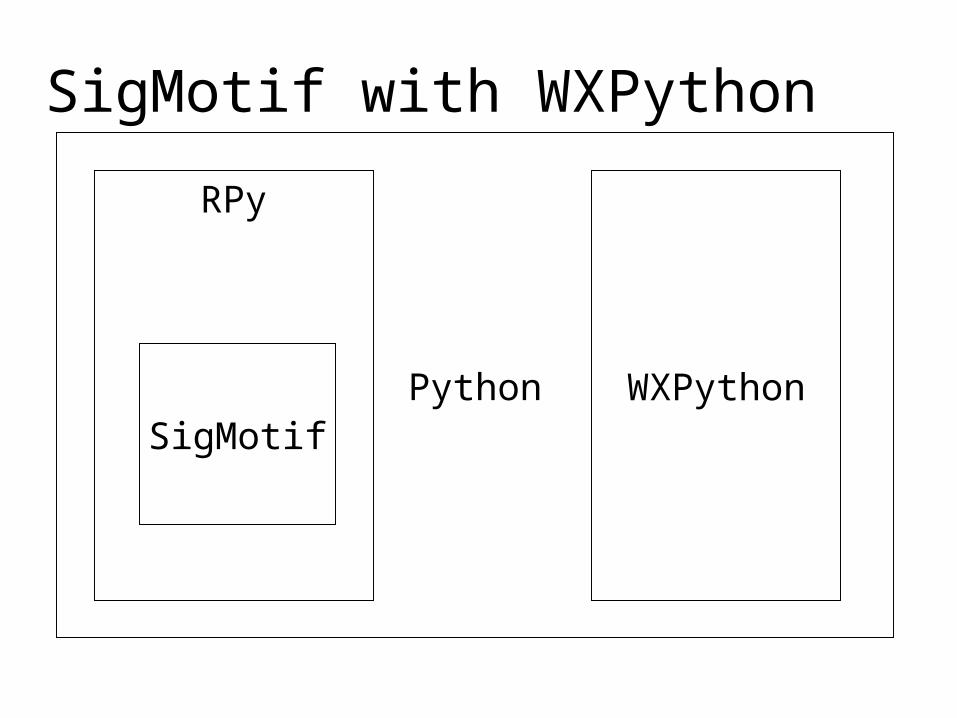
SigMotif with WXPython
Python WXPython
RPy
SigMotif
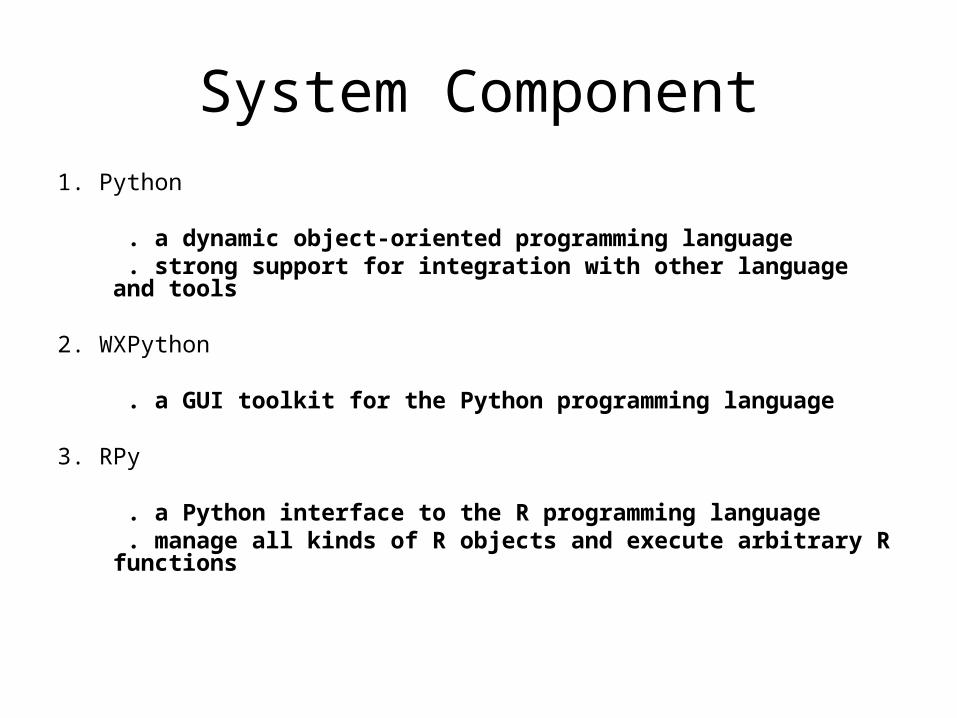
System Component1. Python . a dynamic object-oriented programming language . strong support for integration with other language and tools
2. WXPython . a GUI toolkit for the Python programming language
3. RPy . a Python interface to the R programming language . manage all kinds of R objects and execute arbitrary R functions
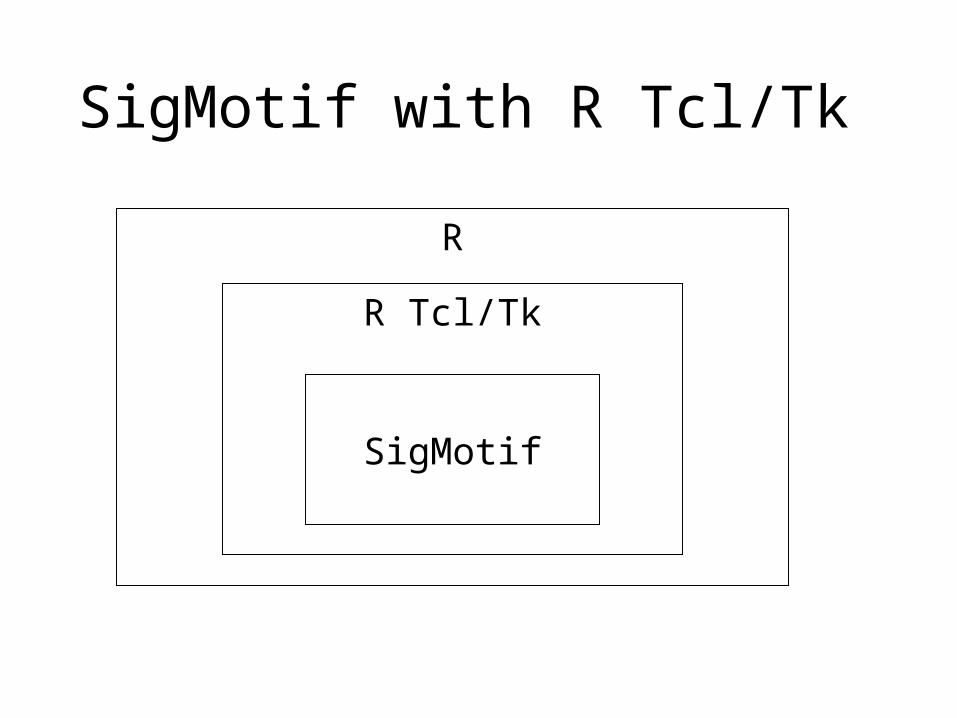
SigMotif with R Tcl/Tk
R
R Tcl/Tk
SigMotif
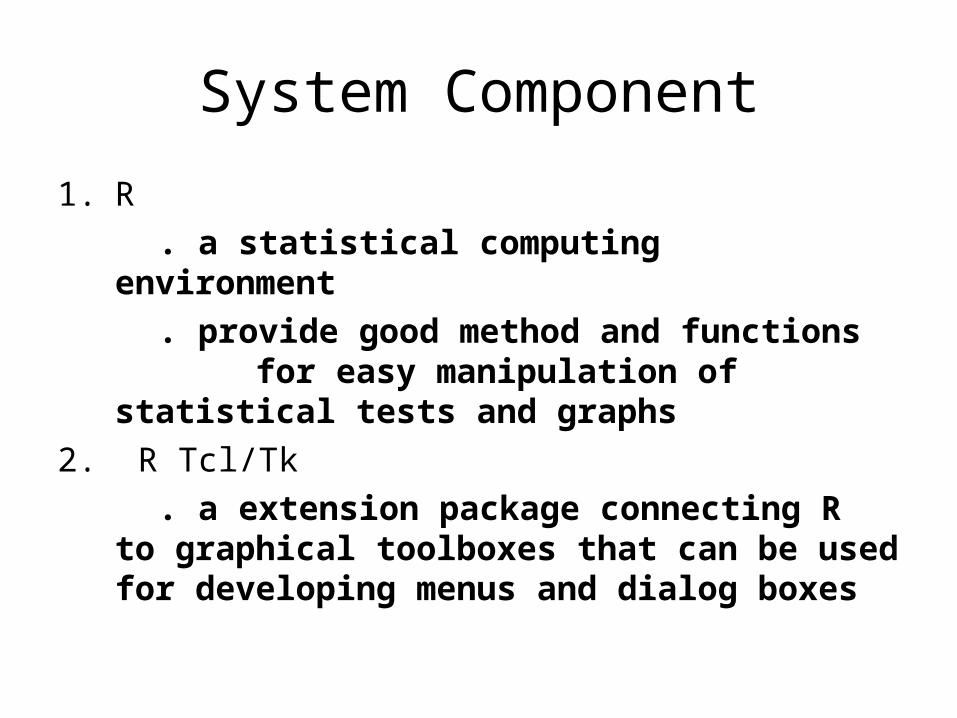
System Component
1. R
. a statistical computing environment
. provide good method and functions for easy manipulation of statistical tests and graphs
2. R Tcl/Tk
. a extension package connecting R to graphical toolboxes that can be used for developing menus and dialog boxes
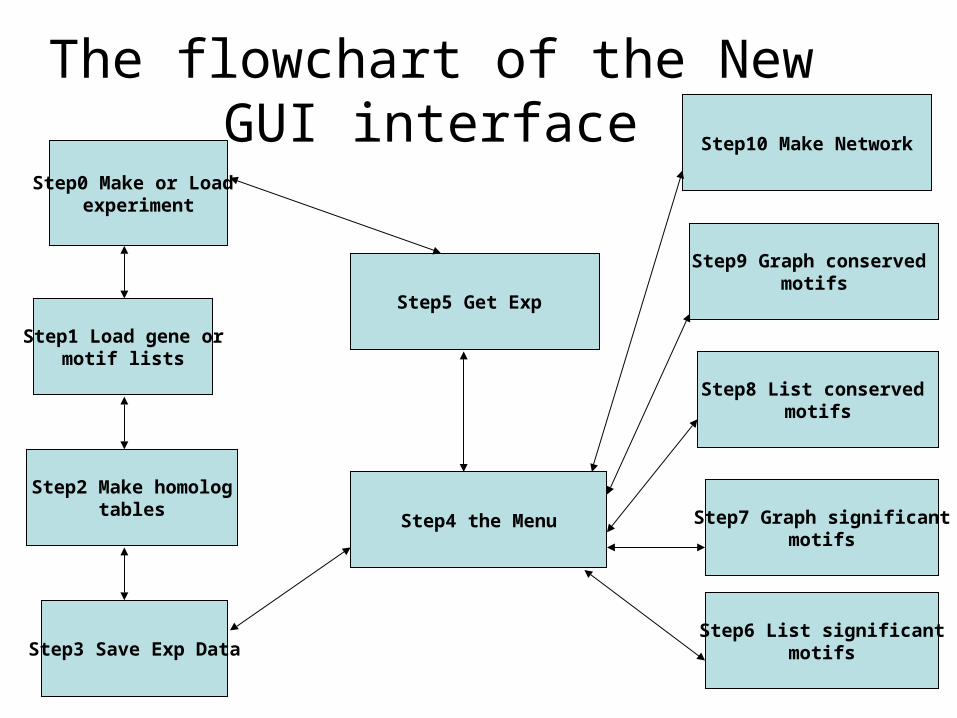
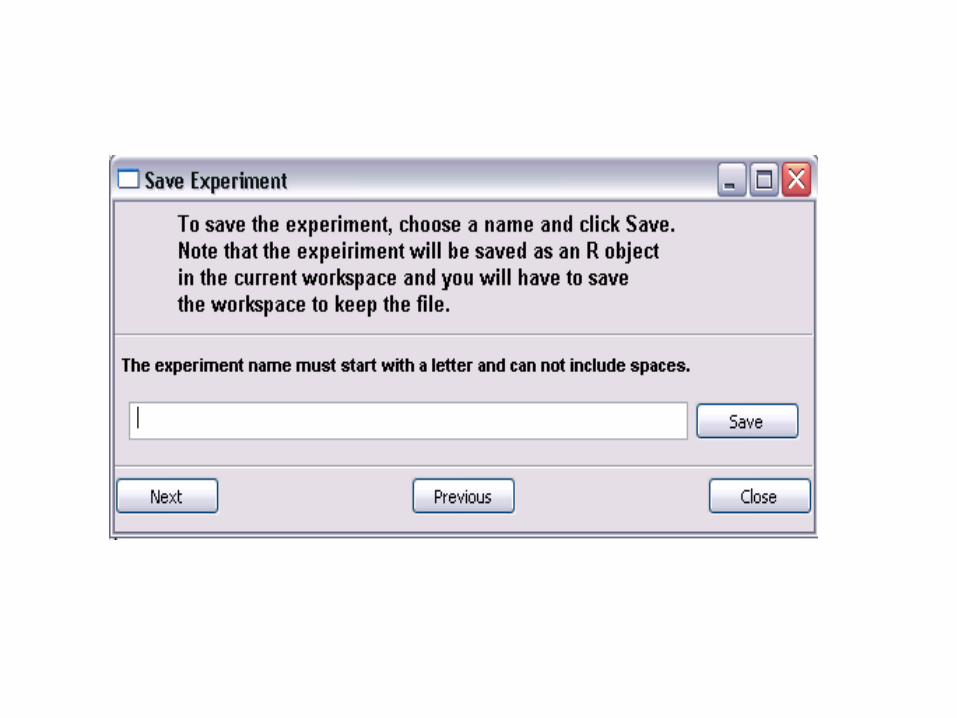
The flowchart of the New GUI interface
Step0 Make or Load experiment
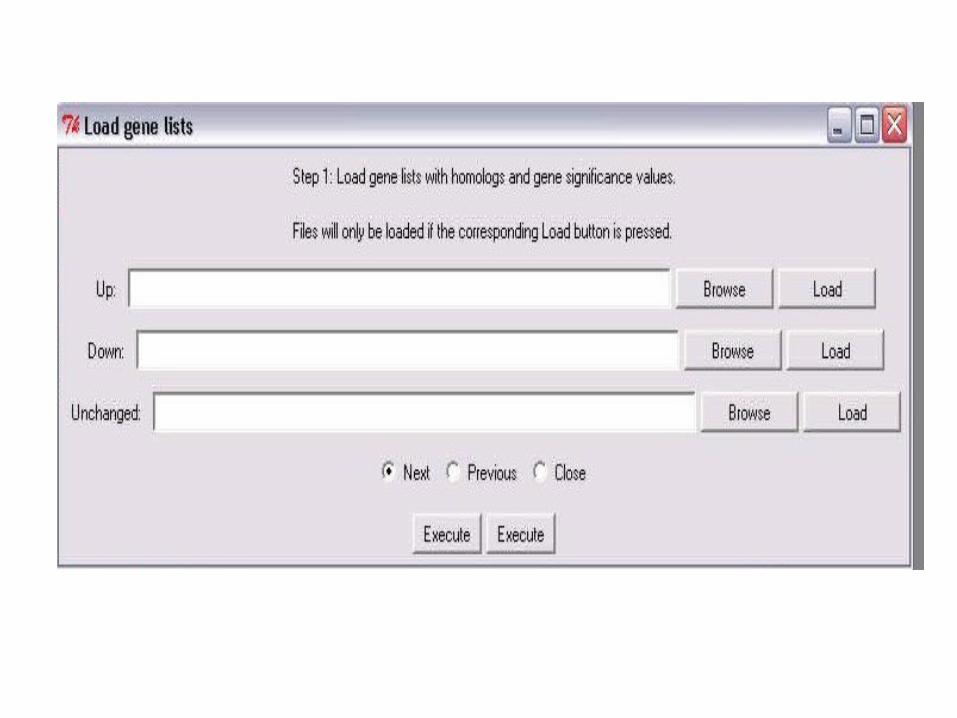
Step1 Load gene ormotif lists
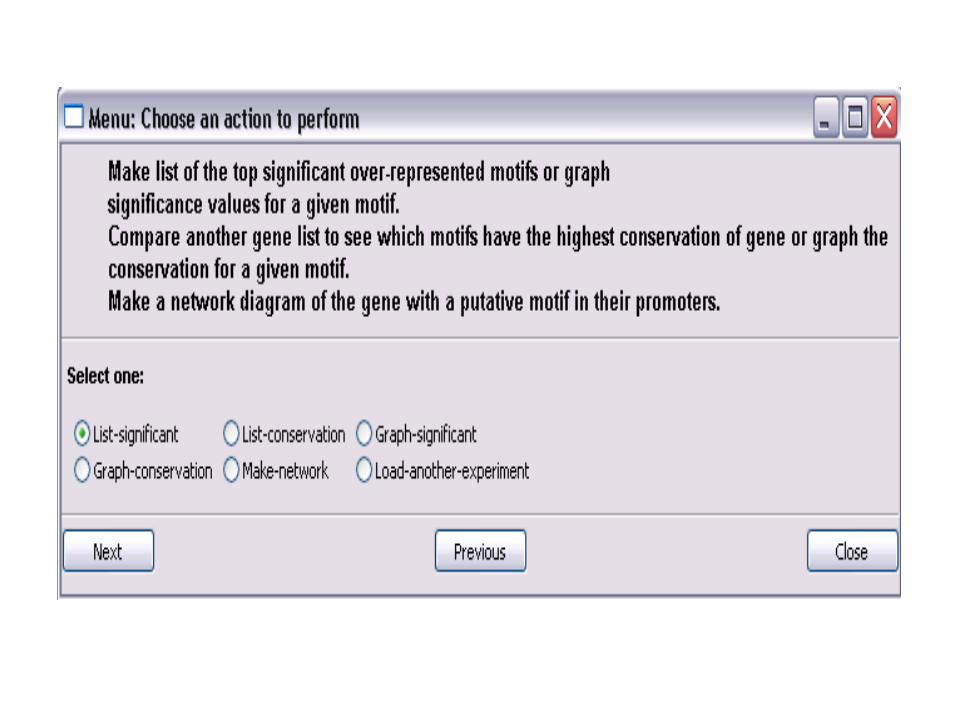
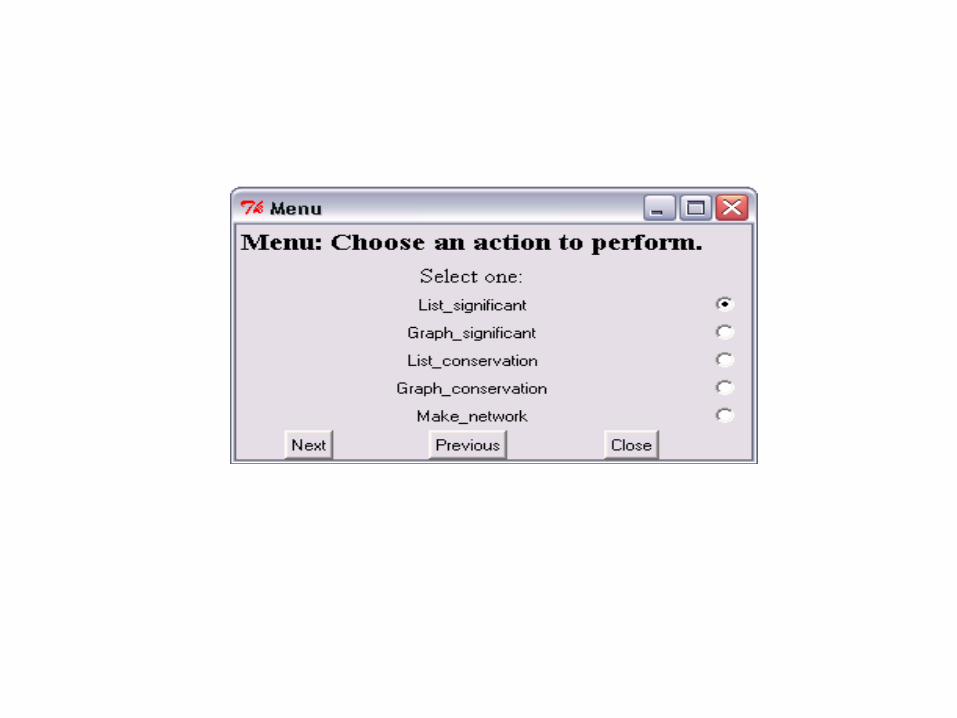
Step4 the Menu
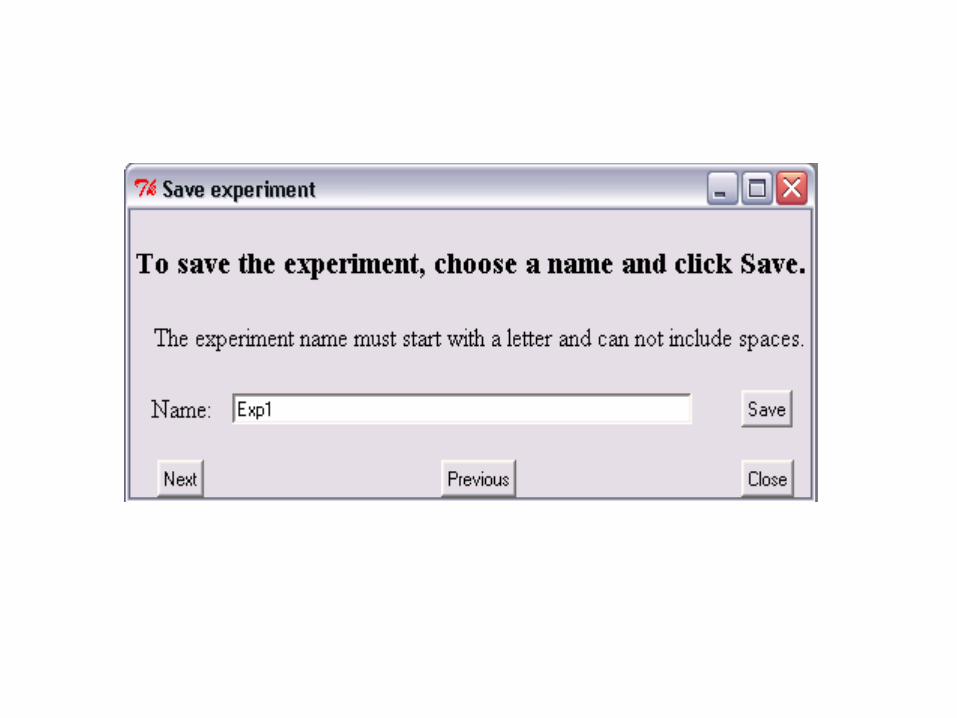
Step3 Save Exp Data
Step5 Get Exp
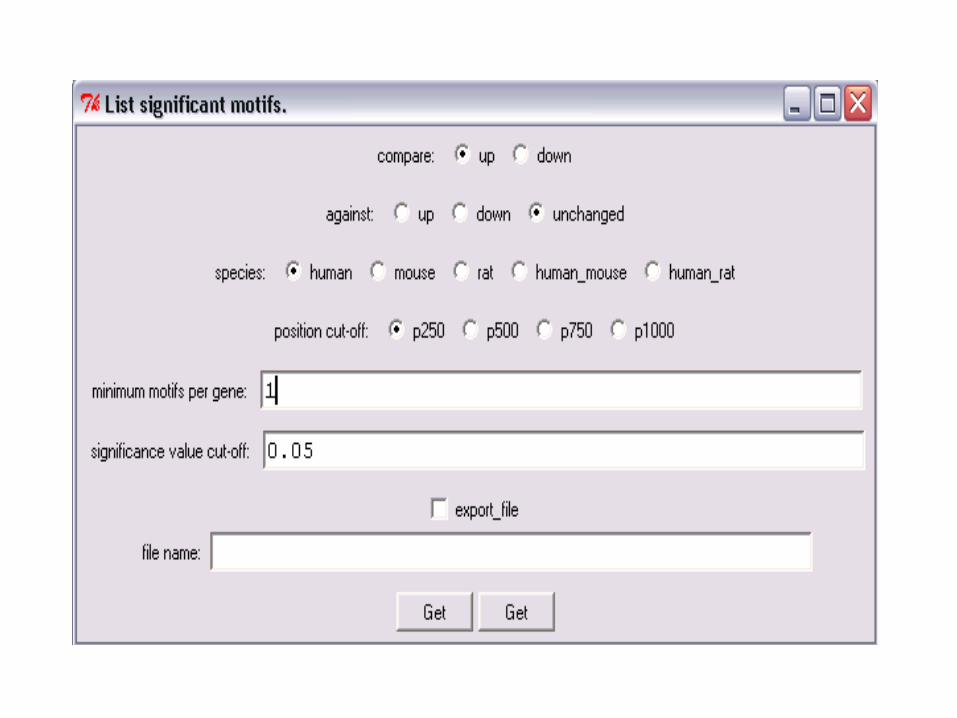
Step6 List significantmotifs
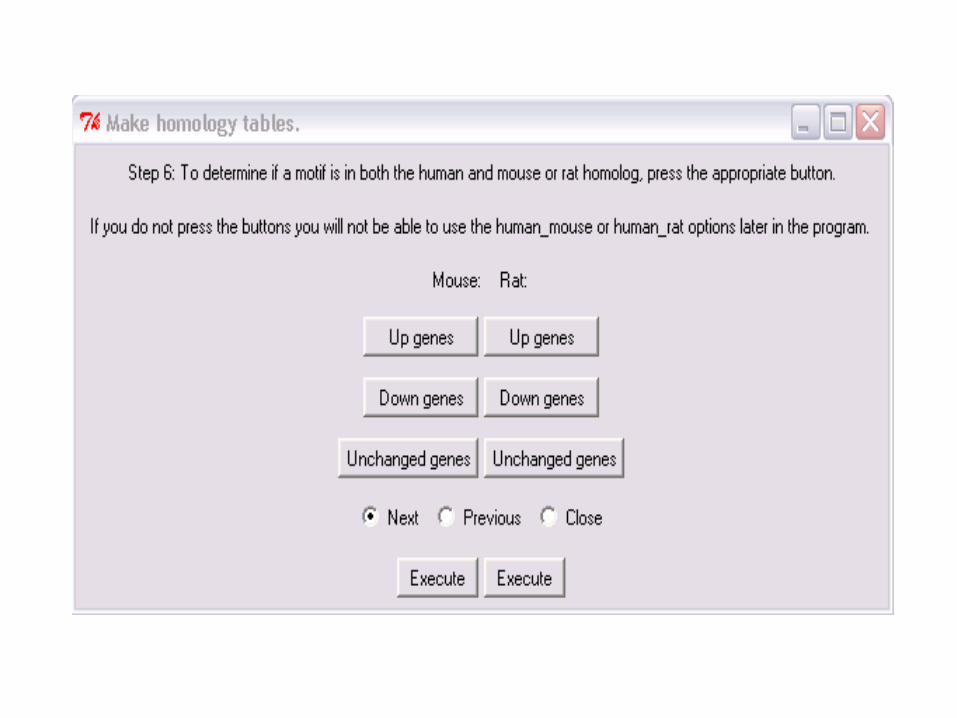
Step2 Make homologtables
Step10 Make Network
Step7 Graph significantmotifs
Step8 List conserved motifs
Step9 Graph conserved motifs
Program Implementation
• wxPython under Python environment Software Packages Installation
. Python . wxPython . R . RPy . Extensions including NumPy and Mark
Hommand’s
Important the software version number matching
Program Implementation
• R Tcl/Tk under R environment
Software packages installation . R . R Tcl/Tk
The R Tcl/Tk can be built under the R library directory
Basic steps of building a GUI dialogue
• 1. Load the R Tcl/Tk package under R environment
• 2. Define an R environment object for saving all intermediate data files and final output data files
• 3. Create a new top-level window• 4. Define widget objects• 5. Use command tkgrid to specify the layout• 6. Bind events to functions and generate events
Implementation Problems
New program version with wxPython1. The appearance is beautiful2. calling complicated R functions from
python is difficult.3. the program is unstable different input data files stop and even crash!4. RPy object conversion
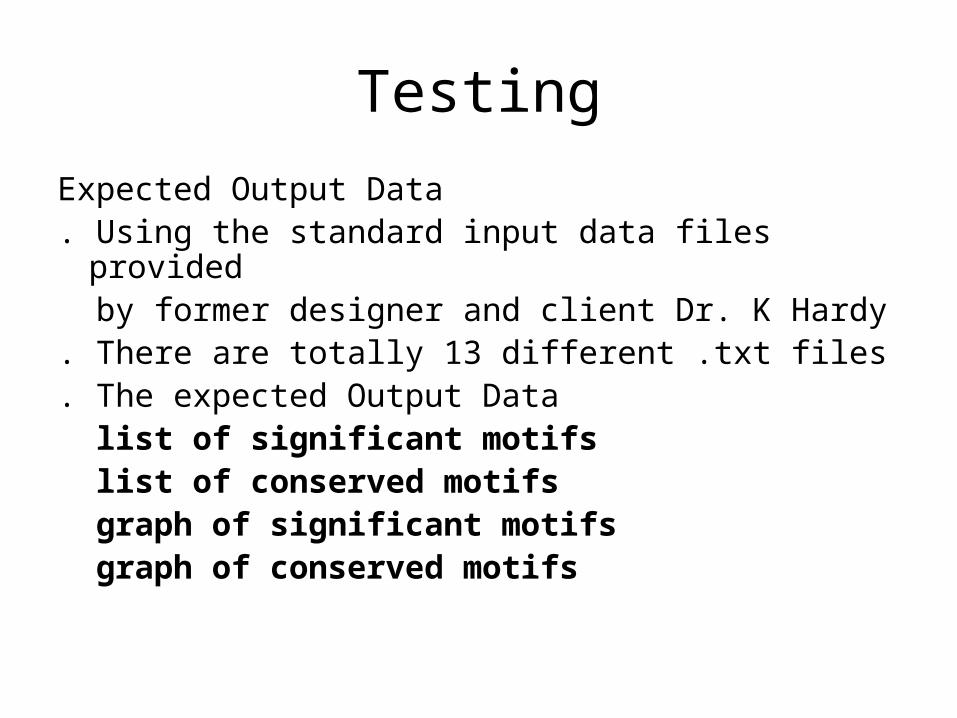
Testing
Expected Output Data. Using the standard input data files provided by former designer and client Dr. K Hardy. There are totally 13 different .txt files. The expected Output Data list of significant motifs list of conserved motifs graph of significant motifs graph of conserved motifs
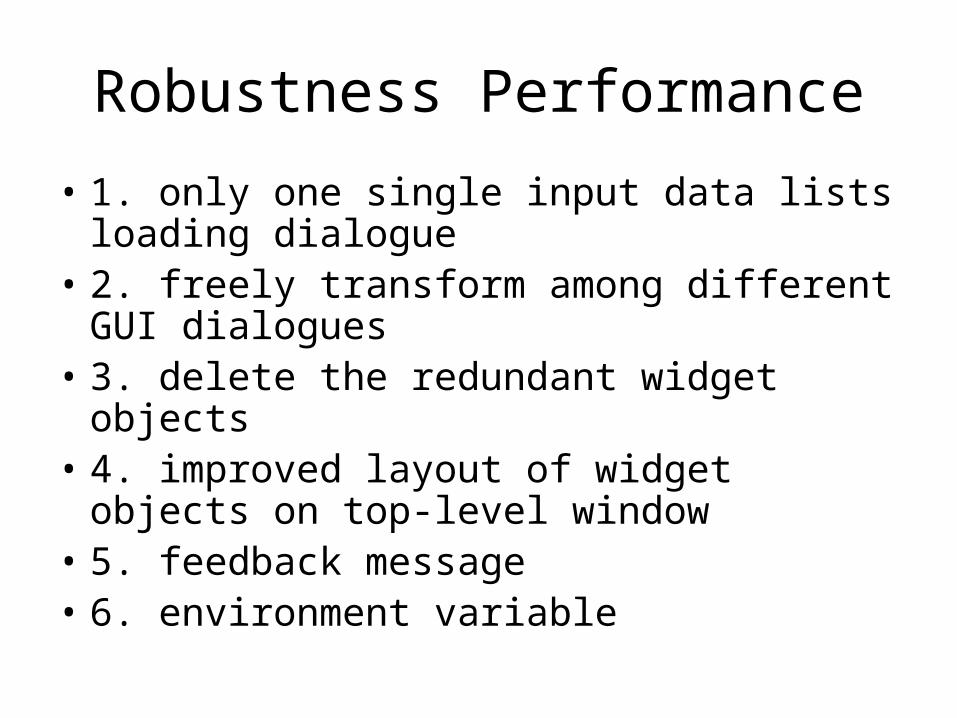
Robustness Performance
• 1. only one single input data lists loading dialogue
• 2. freely transform among different GUI dialogues
• 3. delete the redundant widget objects• 4. improved layout of widget objects on
top-level window• 5. feedback message• 6. environment variable
Conclusion and Future Work
1. wxPython is a good toolkit for developing GUI interface 2. How to resolve the interaction between R and Python? RPy???3. R Tcl/Tk is good. But a huge multi-line R program the layout method4. Requirement analysis Step10 GUI is too complicated too many widget objects text label of the widget objects