Embed Size (px)
Citation preview

Commutability of certified reference materials at the nano-scale
Dr. Ilya Kuselman
The National Physical Laboratory of Israel (INPL) Danciger “A” Bldg, Givat Ram, Jerusalem

2
Commutability of a reference material (RM)
VIM 3 (ISO Guide 99:2007): property of a RM, demonstra-ted by the closeness of agreement between the relation among the measurement results for a stated quantity in this material, obtained according to two given measurement procedures, and the relation obtained among the measure-ment results for other specified materials.
Note 1: The RM in question is usually a calibrator and the other specified materials are usually routine samples.
Note 2: The measurement procedures are the one preceding and the one following the RM in a calibration hierarchy.
Note 3: The stability of RMs is monitoring regularly.

3
To select a necessary RM, a lab developing an IHRM or analysing a sample compares expected composition and physico-chemical parameters of the sample (or the IHRM)and those of RMs of the same nature, available in the market.
One can say intuitively that 100% commutability is achieved when all the sample and the RM characteristics coincide entirely. In the other extreme case, the commutability is totally absent (0%) when the sample and the RM are different substances or materials and/or when the analyte is absent in the RM.
Background for commutability evaluation

4
In non-extreme cases, a lab considers a RM to be more commutable/adequate if the RM composition and properties are as close as possible to the ones expected for the sample.Such understanding of the commutability/adequacy can be reflected in the following score:
A =100 [(min(ci,s, ci,RM)/(max(ci,s, ci,RM)]ai , %,
where ai is the sensitivity coefficient: for analytes ai = 1, for not interfering matrix components or parameters ai = 0, for others ai should be defined in the range of 0 < ai 1 based on the knowledge of the analytical process, i = 1, …, n.
Score
5
It is not important here if ci,s is the smallest and ci,RM - the largest, or vice versa. If only one component (analyte) is considered, n = 1, a1 = 1 and the score is equal to R1= min(c1,s, c1,RM)/max(c1,s, c1,RM) in %, i.e. A = 100R1.
Since the component concentrations ci in a routine sample and RM should not differ by more than a factor of two, the acceptable values of the score in this case is A (100/2) = 50%.
I.Kuselman et al. Accred. Qual. Assur. (2007) 12:563I.Kuselman & A.Fajgelj. Pure Appl.Chem. (2010) 82/5:1099
The score values

6
At the nano-scale
When RMs are applied for characterization of nano-dimensional objects, adequacy of their surface compositions, rather than of their matrixes, may contribute to the measurement uncertainty.
Moreover, the surface match at the nano-scale can allow even use of inadequate RMs, i.e., RMs with another matrixthan of the object under characterization.
As a case study, nanospheres containing a crystalline silicon core covered with thin silica shell were prepared by super high-frequency plasmochemical technique and characterized in aqueous solutions by capillary zone electrophoresis (CZE).
7
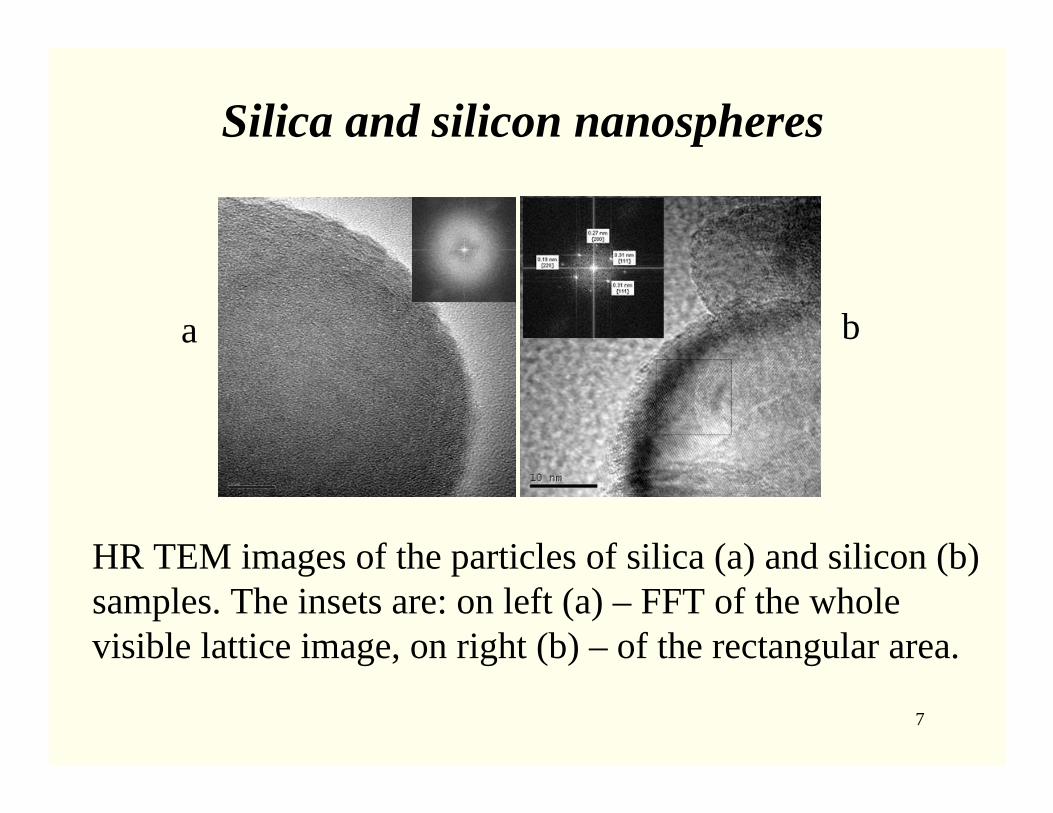
Silica and silicon nanospheres
b
HR TEM images of the particles of silica (a) and silicon (b) samples. The insets are: on left (a) – FFT of the whole visible lattice image, on right (b) – of the rectangular area.
a

8
A crystalline silicon nanosphere
b
d
EELS spectra acquired at the center of a 35 nm particle (a-b) and at its periphery (c-d). To the left are STEM images, to the right - EELS spectra.
a
c

Crystalline silicon nanosphere - details
Structural defects (arrowed) and thickness variations (black & white bands) across the particle in DF TEM image.
On larger particles a silica shell reaches 2–3 nm, while on smaller particles the layer is hardly seen even using HR TEM imaging (Slide 7b) and does not exceed several Å.
A.Belogorokhov et al. J. Adv. Mater. (2009) 41/2:64.

10
The particles in phosphate buffer solutions
SEM image and radius distribution of the particles freshly dispersed by ultrasonication (120 min) in the phosphate buffer solution with pH 8.5, after drying, magnification of 60,000.
0
10
20
30
40
50
Par
ticle
con
tent
, %
23-26 26-28 28-30 30-32 33-35 35-38
Particle radius, nm

11
Electropherogram of a fresh suspension
Peak 1 belongs to the EOF marker, and peak 2 - to the studied nanoparticles. The carrier electrolyte was the phosphate buffer with pH 8.5; the wavelength - 254 nm; the electric field strength - 420 V/cm.

12
The lowest electrolyte concentration is required to prevent nanoparticle aggregation and to reduce the analysis time. On the other hand, the concentration must be high enough to provide sufficient buffer capacity to maintain the pH during the electrophoretic runs. The value of 2.5 mM was chosen as a compromise.
The studied particles migrated in the direction opposite to that of EOF, when voltage is applied. Thus, the nanoparticles were negatively charged.
Charge of the particles

1 - freshly dispersed suspension; 2 – after 150 h storage; 3 -RM silica particles with av. radius of 25 nm; 4 – the RM particles with av. radius of 50 nm; 5 – the studied particles with the av. radius of 23 nm. Other conditions - as in Slide 11.
Absorbance vs absolute electrophoretic mobility

14
The electrophoretic mobility was calculated as ep= eo- app, where eo is the electroosmotic mobility and app is the apparent mobility.
Zeta potential of 58 mV was obtained for studied particles dispersed in the buffer solutions with pH 8.5. The same was also for the RMs with average particle radii of 25 and 50 nm (Polysciences Inc., USA) in the same buffer: 59 and 60 mV, respectively.
The similarity of zeta potential values points out the similari-ty of the surface properties of the RMs and the studied particles.
The electrophoretic mobility and z-potential

15
Effect of pH for the studied particles
Curve 1 is for pH 5.9; curve 2 – for pH 8.5. Other conditions - as in Slide 11.

16
Comparison of the curves indicates a shift of the peak towards the smaller ep when pH value is decreased. Such a difference is caused by z-potential decreasing with reduction of the dissociation degree of acidic functional groups on the particle surface. That confirms indirectly the presence of silanolic groups on the surface of the particles.
The peak height reduced with decreasing pH. This alteration probably occurred due to deterioration of the suspension stability caused by decreasing the particle zeta potential. The same was observed also when ultrasonic pretreatment was more than 120 min.
Comparison

17
Dependence of the absolute electrophoreticmobility on the particle radius

Summary: a possibility to evaluate the particle size in solutions using CZE
The dependence of electrophoretic mobility on the particle radius can be approximated by a linear regression equation with a satisfactory correlation coefficient, since the surface of both silica and silicon particles is very similar, z-potential values are practically the same, etc.
More reference nanomaterials are necessary for a reliable approximation, especially when an average radius of the particles under study is less than 25 nm.
N.Vanifatova et al. Int. J. Nanoparticles (2010) 3/1:65.

19
Acknowledgements
My co-authors of the cited papers: Prof. Yu.Karpov, Prof. A.Belogorokhov & Prof. Yu.Parhomenko, GIREDMET; Prof. B.Spivakov & Dr. N.Vanifatova, GEOKHI; Dr. L.Belo-gorokhova, Moscow State University, Moscow, Russia
Dr. I.Popov, Dr. V.Gutkin & Dr. V.Uvarov, The Hebrew University Nano-center, Jerusalem, Israel
Dr. A.Fajgelj, IAEA, Seibersdorf, Austria
Foundations: Ministry of Science of Israel & Russian Foundation for Basic Research (joint research project 3-3547 in Israel & 06-02-08226 in Russia) and Russian Academy of Sciences, Program 20.

20