Embed Size (px)
Citation preview
Census Demographics
Housing andCommunityDevelopment
Childrenand Family Health
Crime and Safety
Workforce andEconomic Development
Educationand Youth
Arts and Culture
Sustainability
S P R I N G 2 0 1 7
15Measuring Progress Toward a Better Quality of Life in Every Neighborhood
2
Vital Signs 14 is made possible
by the generous support of:
Vital Signs 14 is made possible
by the generous support of:
BNIA-JFI would also like to thank the following: The University of Baltimore, The Jacob France Institute, The Merrick School of Business, Baltimore Corps, and BNIA-JFI Steering Committee Members and organizations who generously provided Data Stories.
BNIA-JFI Staff who contributed to Vital Signs 14:
Seema Iyer, PhD, Associate Director Jacob France Institute
Cheryl Knott, GIS Analyst
Nancy Jones, Data Manager
Christine Hwang, Baltimore Corps Fellow
Brandon Nida, PhD, Research Associate
Evan Mahone, Statistician
Alange’ Jacobs, Student Assistant
Cynthia Green, Student Assistant
David Carpenter, Web Developer
Report design by Zak Bickel
2
BNIA-JFI would like to thank the following: University of Baltimore, Jacob France Institute, Merrick School of Business, Baltimore Corps, and BNIA-JFI Steering Committee Members and organizations who generously provided Data Stories.
BNIA-JFI Staff who contributed to Vital Signs 14:
Seema Iyer, PhD, Associate Director, Jacob France Institute
Brandon Nida, PhD, Research Associate
Cheryl Knott, GIS Analyst
Nancy Jones, Data Manager
Christine Hwang, Baltimore Corps Fellow
Evan Mahone, Statistician
Alange’ Jacobs, Student Assistant
Cynthia Green, Student Assistant
David Carpenter, Web Developer
Report design by Zak Bickel
Vital Signs 14 is made possible
by the generous support of:
Vital Signs 14 is also supported by:
2
BNIA-JFI would like to thank the following: University of Baltimore, Jacob France Institute, Merrick School of Business, and BNIA-JFI Steering Committee Members and organizations who generously provided Data Stories.
BNIA-JFI Staff who contributed to Vital Signs 15: Seema Iyer, PhD, Associate Director, Jacob France InstituteAmanda Davis, PhD, Research AssociateCheryl Knott, GIS AnalystNancy Jones, Data ManagerAlison Howland, Research AssistantChristine Hwang, Research AssistantCarlos Kaparti, DeveloperAlange’ Jacobs, Student AssistantWilliam Pierre, Student AssistantDavid Carpenter, Web Developer
Design assistance by Zak BickelInfographics by Smile Indias
V I TA L S I G N S 1 5 I S M A D E P O S S I B L E B Y T H E G E N E R O U S S U P P O R T O F :V I TA L S I G N S 1 5 I S M A D E P O S S I B L E B Y T H E G E N E R O U S S U P P O R T O F :
V I TA L S I G N S 1 5 I S A L S O S U P P O R T E D B Y:
Photos courtesy of baltophoto.org and pixabay.com Licensed under Creative Commons Zero (CC0)
VITAL SIGNS 14Housing and Community Development 3
BN
IAJ
FI.
OR
G/
VIT
AL
_S
IGN
S
Sean Capperis, Ingrid Gould Ellen & Brian Karfunkle (2015), “Renting In America’s Largest Cities” NYU Furman Center/Capital OneHolupka, C.Scott and Sandra Newman (2011). “The Housing and Neighborhood Conditions of America’s Children: Patterns and Trends over Four Decades,” Housing Policy Debate, Vol. 21, No. 2, pp. 215-246.For more information on Project C.O.R.E (Creating Opportunities for Renewal and Enterprise), visit the Maryland Department of Housing and Community Development website http://dhcd.maryland.gov/ProjectCORE/Alan Mallach, “Depopulation, Market Collapse and Property Abandonment” in Rebuilding America’s Legacy Cities, Alan Mallach editor, 2012. The American Assembly
12
3
4
Several indicators in Vital Signs 15 measure the
quality of the housing particularly whether the
housing is vacant and abandoned which has
slowly been increasing in Baltimore. In 2015,
Maryland Governor Hogan announced funding
for Project C.O.R.E.3 to support the City’s
ability to demolish buildings deemed unsafe.
The rate of demolition in 2015 has significantly
increased in neighborhoods with high vacancy.
Although the Vital Signs reports have been tracking
housing-related indicators in Baltimore since
2000, recent housing market conditions due to
the national economic recession that began in
2007 combined with other factors of neighbor-
hood change in an urban setting required the
development of a more robust set of indicators to
truly assist neighborhoods preparing for ongoing
change. The indicators in this chapter aim to
help neighborhoods track the following issues:
Following the national trend in other metropol-
itan areas,1 the percentage of renter households
is increasing in Baltimore. The number of rental
housing units has also increased to meet the
demand. However, rent affordability is impacting
more than 50% of Baltimore renter households,
and several middle-income neighborhoods are
experiencing low affordability overall. Of partic-
ular concern is housing for Baltimore’s house-
holds with children; according to analysis of
the American Housing Survey from the past 40
years, the fraction of children living in unafford-
able housing has doubled2 since the 1970’s.
VITAL SIGNS 15Housing and Community Development 3
T he housing stock within neighborhoods represents the majority of real estate for most communities in Baltimore City, including areas that had traditionally been central business
districts. Therefore, understanding localized housing markets is critical for individual property owners as well as community-based organizations to maintain stability in terms of sales prices and occupancy. Some communities in Baltimore are also engaged in proactively demolishing obsolete building stock and bringing in new housing. The housing market in Baltimore has been slowly recovering from the national economic recession that began in 2007. Vital Signs 15 shows that the median sales prices and occupancy rates have increased for most neighborhoods.
• Nature of Sales: Mortgage-based sales generally suggest that the housing unit will be owner occupied. Cash-based sales suggest investment transactions that may not be occupied by the buyer, or possibly not occupied at all.4 Bank-owned (REO) sales occur after a property owner has been foreclosed upon, which typi-cally means that displacement has occurred.
• Housing Affordability & Choice: Housing costs can be a burden for households on a fixed- or low-income, those have experi-enced job loss or displacement, or where housing values are increasing rapidly. Federal housing choice vouchers assist households by subsidizing rent for units in the private market, but some neighborhoods have rents too high for landlords to accept vouchers.
• Unoccupied vs. Vacant: Vacant and aban-doned housing is relatively easy to identify with boarded up windows and/or an offi-cial condemnation notice. Homes that are
VITAL SIGNS 15Housing and Community Development 4
BN
IAJ
FI.
OR
G/
VIT
AL
_S
IGN
S
VITAL SIGNS 15Housing and Community Development 4
BN
IAJ
FI.
OR
G/
VIT
AL
_S
IGN
S
5 CSAs are groups of census tracks that correspond to neighborhoods. See Vital Signs 15 Introduction
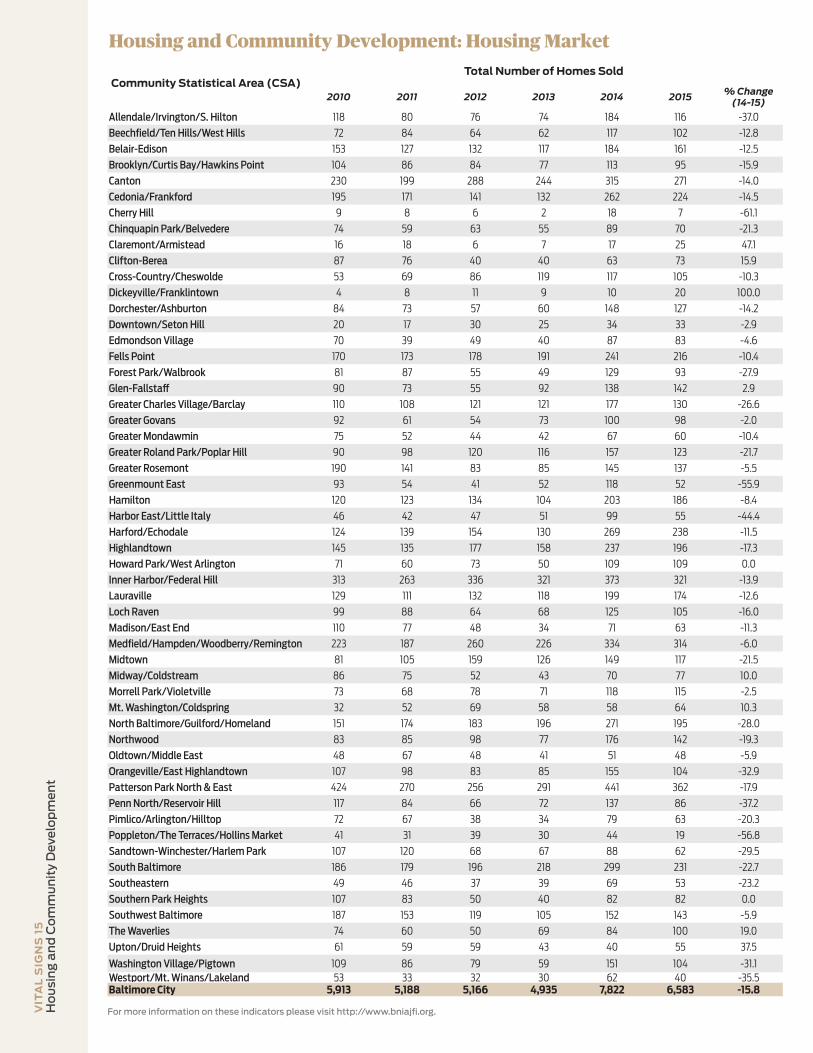
Cherry Hill (7), Poppleton/The Terraces/Hollins Market (19), and Dickeyville/Franklintown (20).
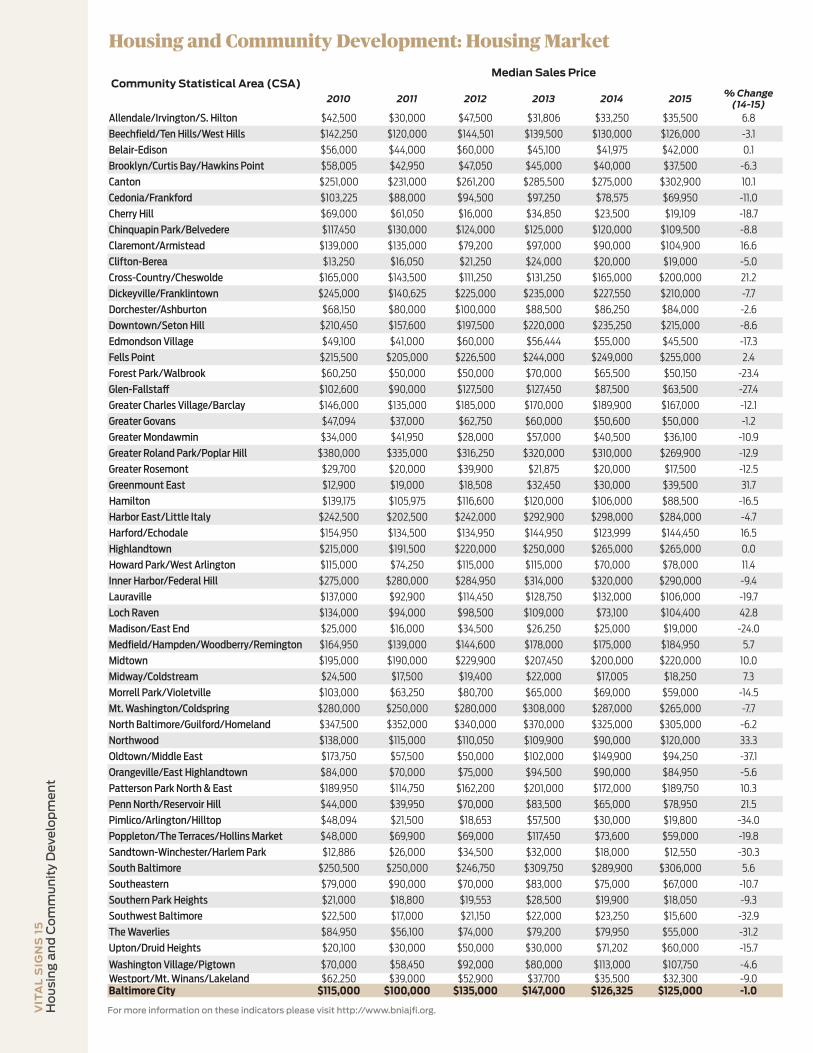
• Between 2014 and 2015, the median sales price of homes sold decreased by -1.1% from $126,325 to $125,000. The CSAs with the highest median home sales in 2014 include South Baltimore ($306,000) North Baltimore/Guilford/Homeland ($305,000), and Canton ($302,900). The CSAs with the lowest median home sales include Sandtown-Winchester/Harlem Park ($12,550), Southwest Baltimore ($15,600), and Greater Rosemont ($17,500).
• The largest percentage increases in median home sales prices between 2014 and 2015 were experienced in Loch Raven, Northwood, and Greenmount East. The greatest per-centage decreases in median sales price occurred in Oldtown/Middle East, Pimlico/Arlington/Hilltop, and Southwest Baltimore.
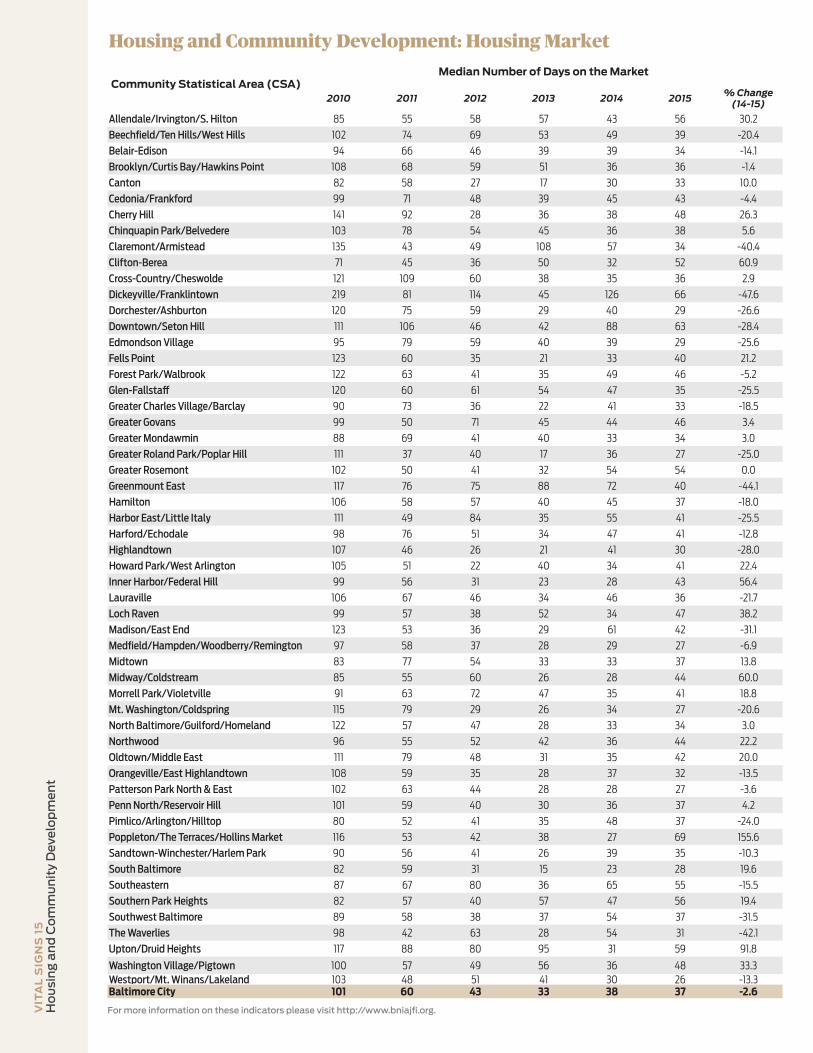
• Between 2014 and 2015, the median number of days that a house was listed on the market in Baltimore City decreased slightly from 38 to 37. The CSAs where it took the least amount of time to sell a home in 2015 included Westport/Mt. Winans/Lakeland (26.0 days) and Greater Roland Park/Poplar Hill, Medfield/Hampden/Woodberry/Remington, Mt. Washington/Coldspring, and Patterson Park North & East (27.0 days). The CSAs with the longest median days on the market in 2015 were Poppleton/The Terraces/Hollins Market (69.0 days) and Dickeyville/Franklintown (66.0 days).
• Federal sources: United States Postal Service, Bureau of the Census, American Community Survey, Department of Housing and Urban Development
• Proprietary sources: First American Real Estate Solutions, RBIntel
When possible, indicators are created by
normalizing data by the number of residential
properties to establish rates that allow for com-
parison across neighborhoods and over time.
Housing Market
Nine housing market indicators for Baltimore’s
neighborhoods are included in Vital Signs 15:
median price of homes sold; total number of homes
sold; median number of days on market; percent of
homes sold in foreclosure; percent of homes sold for
cash; percent of properties under mortgage foreclo-
sure; percentage of properties that are owner-oc-
cupied; and percent of residential properties that
do not receive mail. A new indicator in Vital Signs
15 is the percentage of residential tax lien sales.
• Between 2014 and 2015, the total number of homes sold in Baltimore City decreased by -11.3% from 7,822 to 6,583. The highest number of homes were sold in Patterson Park North & East (362), Inner Harbor/Federal Hill (321), and Medfield/Hampden/Woodberry/Remington (314). The lowest number of homes sold were in
unoccupied and do not have anyone living in them are less obvious from appearance alone, but are a growing concern for many neighborhoods. Homes that the United States Postal Service no longer delivers mail to can be considered unoccupied.
• Tax relief: Although Baltimore City has one of the highest property tax rates in the State of Maryland, many residents avail themselves to tax credit programs based on ownership status, income eligibility and/or rehabilitation of historic properties.
Vital Signs 15 tracks 21 indicators for Community
Statistical Areas (CSAs)5 designed to follow the
city’s housing market and community develop-
ment processes over time. These indicators are
grouped into the following categories: housing
market, affordability, tax credits, permits and code
enforcement, and total residential properties.
Data
Data for Vital Signs 15 housing indica-
tors comes from sources that can be
grouped into the following categories:
• City sources: Baltimore City Department of Housing, Baltimore City Circuit Court, Baltimore City Department of Finance, BidBaltimore
• State sources: Maryland Department of Planning
VITAL SIGNS 15Housing and Community Development 5
BN
IAJ
FI.
OR
G/
VIT
AL
_S
IGN
S
VITAL SIGNS 15Housing and Community Development 5
BN
IAJ
FI.
OR
G/
VIT
AL
_S
IGN
S
6 Sources for Housing Affordability indicators are the American Community Survey (ACS) and the Picture of Subsidized Housing (US Department of Housing and Urban Development).
Housing Affordability6
Housing costs are a burden for households on a
fixed or low income, those have experienced job
loss or displacement, or where housing values are
increasing rapidly. Vital Signs 15 tracks the percent-
age of households paying 30% or more of their
total household income on either mortgage or rent
as well as the number of housing vouchers per
1,000 rental units being used in a neighborhood.
• Between 2006-2010 and 2011-2015, the per-centage of households with mortgages paying more than 30% of their total house-hold income on home-related expenses decreased by -2.7% from 40.0% to 37.6%. During 2011-2015, the CSAs with low mort-gage affordability, or the highest percentage of homeowners spending more than 30% of their total income on housing, includ-ed Clifton-Berea (56.8%), Southeastern (53.6%), and Greater Rosemont (49.0%).
• Between 2006-2010 and 2011-2015, the per-centage of households paying more than 30% of their total household income on rent decreased slightly from 52.7% to 51.6%. During 2011-2015, the CSAs with low rent affordability, where the greatest percentage of renters paid in excess of 30% of their income on housing included Belair-Edison (69.9%), Washington Village/Pigtown (67.2%), and Madison/East End (66.3%). The CSAs with the least per-centage of renters who paid more than 30% of their total household income on rent were Canton (30.3%) and Fells Point (32.3%).
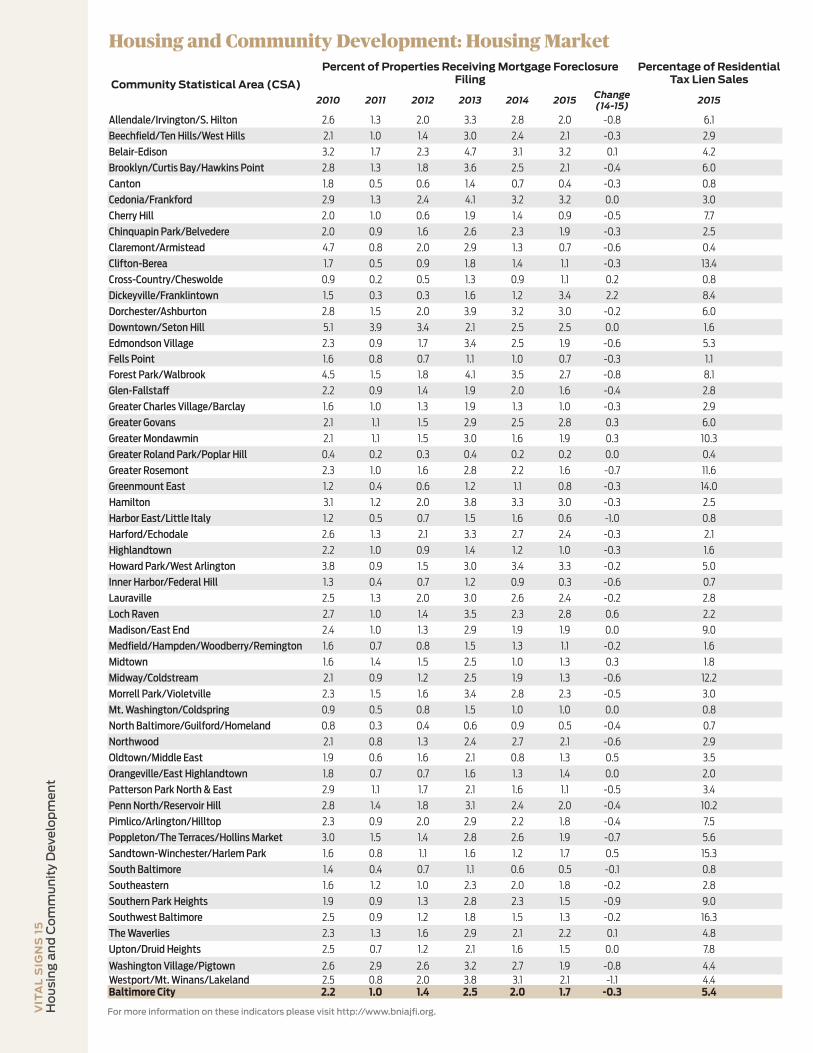
in Greater Roland Park/Poplar Hill (0.2%) and Inner Harbor/Federal Hill (0.3%).
• Between 2014 and 2015, the percent of residen-tial addresses that did not receive mail from the U.S. Postal Service identified as unoccupied for more than 90 days declined from 8.4% to 7.5%. The CSAs with the highest percentages of addresses not receiving mail were Penn North/Reservoir Hill (21.8%), Greater Mondawmin (17.6%), and Sandtown-Winchester/Harlem Park (17.4%). The lowest percentages occurred in Cross-Country/Cheswolde (0.6%) and Downtown/Seton Hill (1.0%).
• From 2014 to 2015, the CSAs with the great-est increase in the percentage of address-es not receiving mail were Chinquapin Park/Belvedere (+2.6%) and Penn North/Reservoir Hill (+2.5%). The CSAs with the greatest decrease in the percentage of homes not receiving mail were Madison/East End (-2.9%) and Belair-Edison (-2.8%).
The percentage of residential properties with city
liens sold as tax certificates at the annual tax lien
certificate sale held in May is a new indicator in
Vital Signs 15 (See Data Story).
• In 2015, 5.4% of residential properties has tax liens for sale. The CSAs with the highest percentage of tax lien sales were Southwest Baltimore (16.3%), Sandtown-Winchester/Harlem Park (15.3%), and Greenmount East (14.0%). The CSAs with the lowest percentage of tax lien sales were Greater Roland Park/Poplar Hill and Claremont/Armistead (0.4%).
• Baltimore City’s owner-occupancy rate was 56.1% in 2015. The CSAs with the highest percentage of owner-occupied properties Claremont/Armistead (85.1%), Cross-Country/Cheswolde (82.3%), and Mt. Washington/Coldspring (82.0%). The CSAs with the lowest percentage of own-er-occupied properties Madison/East End (24.3%) and Southwest Baltimore (25.0%).
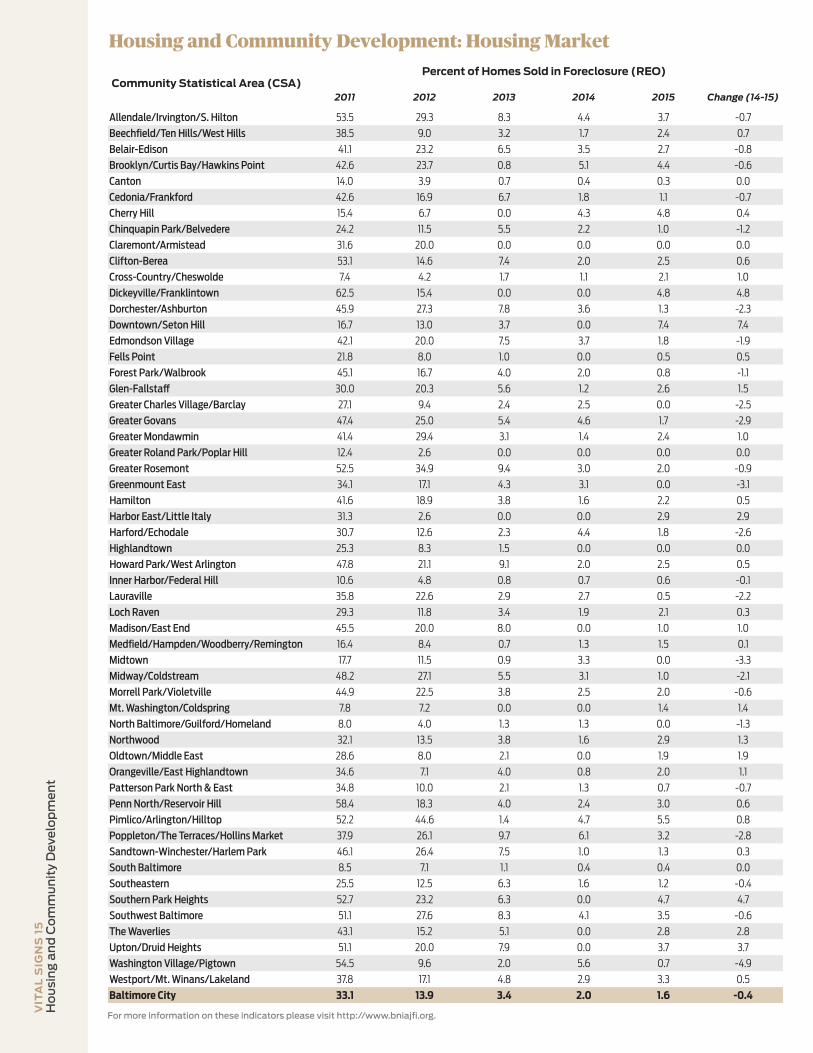
• Between 2014 and 2015, the percentage of homes sold under foreclosure or as a real estate owned (REO) sale declined from 2.0% in 2014 to 1.6% in 2015. The CSAs with the highest percentage of homes sold under foreclosure in 2015 were Downtown/Seton Hill (7.4%) and Pimlico/Arlington/Hilltop (5.4%). Seven CSAs had zero homes sold in foreclosure.
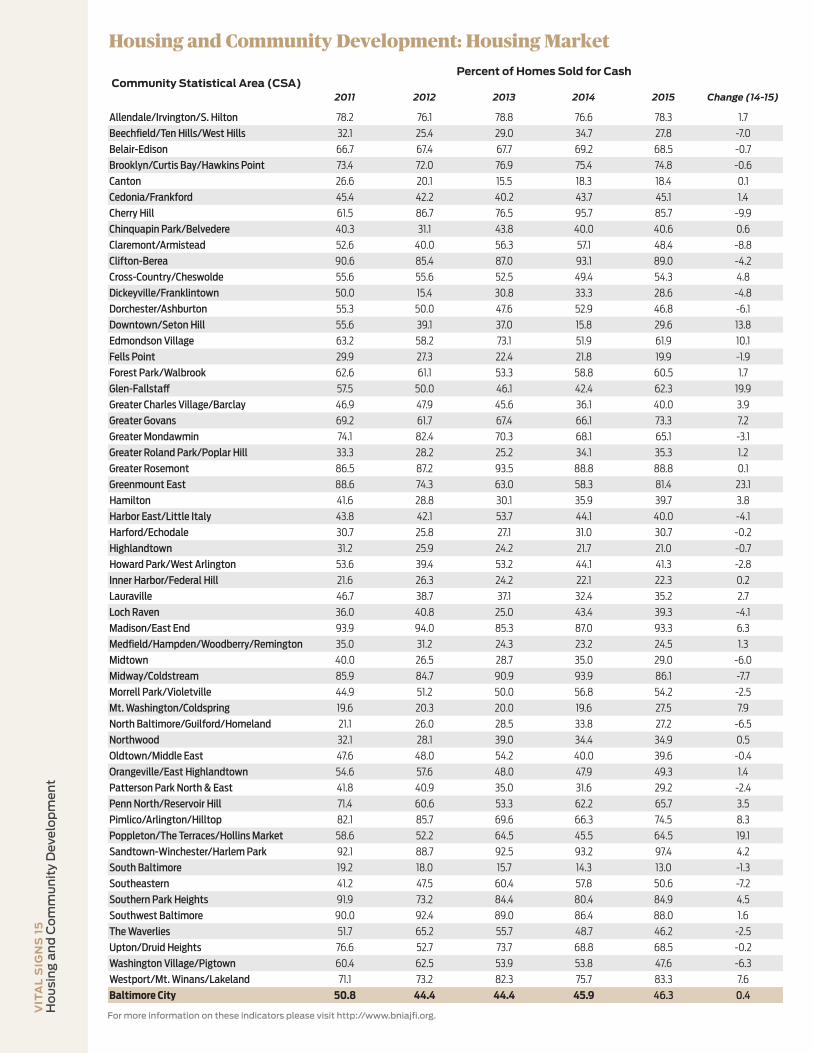
• Between 2014 and 2015, the percentage of all homes sold in Baltimore purchased in cash increased from 45.9% in 2014 to 46.3% in 2015. For two CSAs, over 90% of the homes sold were cash-based purchas-es: Sandtown-Winchester/Harlem Park and Madison/East End. Conversely, in 2015, there were three CSAs where less than 20% of the homes sold were purchased with cash: South Baltimore, Canton, and Fells Point.
• The percentage of homes in Baltimore City receiving notice of a mortgage foreclosure filing decreased from 2.0% in 2014 to 1.7% in 2015. The highest foreclosure rates occurred in Dickeyville/Franklintown (3.4%), Cedonia/Frankford and Belair-Edison (3.2%). The lowest foreclosure filing rates occurred
Data Story: Percent of Children Living in PovertyFrom the 2014 Community Needs Assessment for Baltimore City
The findings throughout this report
demonstrate significant, measurable
progress towards improving the lives of
families and children in Baltimore over
the past decade. However, underlying,
and potentially even undermining, that
progress is the compounding nega-
tive effects of poverty on families and
children. In this year of reflection on the
nation’s 50th anniversary of the War
on Poverty, it’s important to reflect on
the scale of poverty in Baltimore City.
VITAL SIGNS 14Census Demographics: Data Story 6
BY
TH
E B
AL
TIM
OR
E N
EIG
HB
OR
HO
OD
IN
DIC
AT
OR
S A
LL
IAN
CE
—J
AC
OB
FR
AN
CE
IN
ST
ITU
TE
.
FO
R M
OR
E I
NF
OR
MA
TIO
N,
VIS
IT W
WW
.BN
IAJ
FI.
OR
G/
CU
RR
EN
TP
RO
JE
CT
S
Data Story: Tax Liens and Vacancy
Every spring, Baltimore City conducts
an auction of any delinquent tax, water,
and other liens, selling these liens as
tax sale certificates to private purchas-
ers. The certificate purchasers pay off
the outstanding debt to the City, and in
turn acquire the right to collect the debt
directly from the property owner – along
with interest rates of 12% and additional
fees. If the property owner does not pay
the debt, fees, and interest, the purchaser
can initiate a process to foreclose on the
property, becoming the new owner of
the property for the amount of the taxes
due – which can be as little as $750.
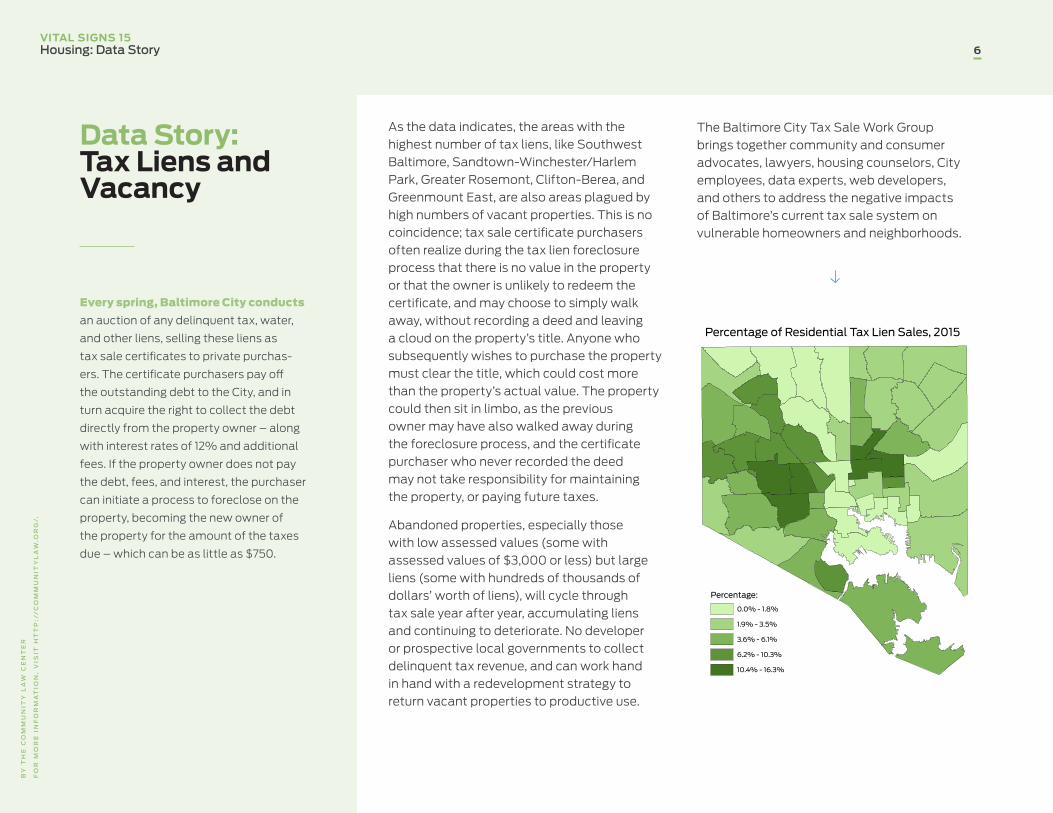
As the data indicates, the areas with the highest number of tax liens, like Southwest Baltimore, Sandtown-Winchester/Harlem Park, Greater Rosemont, Clifton-Berea, and Greenmount East, are also areas plagued by high numbers of vacant properties. This is no coincidence; tax sale certificate purchasers often realize during the tax lien foreclosure process that there is no value in the property or that the owner is unlikely to redeem the certificate, and may choose to simply walk away, without recording a deed and leaving a cloud on the property’s title. Anyone who subsequently wishes to purchase the property must clear the title, which could cost more than the property’s actual value. The property could then sit in limbo, as the previous owner may have also walked away during the foreclosure process, and the certificate purchaser who never recorded the deed may not take responsibility for maintaining the property, or paying future taxes.
Abandoned properties, especially those with low assessed values (some with assessed values of $3,000 or less) but large liens (some with hundreds of thousands of dollars’ worth of liens), will cycle through tax sale year after year, accumulating liens and continuing to deteriorate. No developer or prospective local governments to collect delinquent tax revenue, and can work hand in hand with a redevelopment strategy to return vacant properties to productive use.
VITAL SIGNS 15Housing: Data Story 6
BY
TH
E C
OM
MU
NIT
Y L
AW
CE
NT
ER
FO
R M
OR
E I
NF
OR
MA
TIO
N,
VIS
IT H
TT
P:/
/C
OM
MU
NIT
YL
AW
.OR
G/.
The Baltimore City Tax Sale Work Group brings together community and consumer advocates, lawyers, housing counselors, City employees, data experts, web developers, and others to address the negative impacts of Baltimore’s current tax sale system on vulnerable homeowners and neighborhoods.
Percentage of Residential Tax Lien Sales, 2015
Percentage:
0.0% - 1.8%
1.9% - 3.5%
3.6% - 6.1%
6.2% - 10.3%
10.4% - 16.3%
Data Story: Percent of Children Living in PovertyFrom the 2014 Community Needs Assessment for Baltimore City
The findings throughout this report
demonstrate significant, measurable
progress towards improving the lives of
families and children in Baltimore over
the past decade. However, underlying,
and potentially even undermining, that
progress is the compounding nega-
tive effects of poverty on families and
children. In this year of reflection on the
nation’s 50th anniversary of the War
on Poverty, it’s important to reflect on
the scale of poverty in Baltimore City.
VITAL SIGNS 14Census Demographics: Data Story 7
BY
TH
E B
AL
TIM
OR
E N
EIG
HB
OR
HO
OD
IN
DIC
AT
OR
S A
LL
IAN
CE
—J
AC
OB
FR
AN
CE
IN
ST
ITU
TE
.
FO
R M
OR
E I
NF
OR
MA
TIO
N,
VIS
IT W
WW
.BN
IAJ
FI.
OR
G/
CU
RR
EN
TP
RO
JE
CT
S
Data Story: Tax Liens and (continued)
VITAL SIGNS 15Housing: Data Story 7
BY
TH
E C
OM
MU
NIT
Y L
AW
CE
NT
ER
FO
R M
OR
E I
NF
OR
MA
TIO
N,
VIS
IT H
TT
P:/
/C
OM
MU
NIT
YL
AW
.OR
G/.
Work Group members work with homeowners at risk of having their properties go to tax sale, organizing clinics staffed by volunteer attorneys and housing counselors; educate homeowners about tax credits they may be eligible for, to lower their tax bills and help them stay in their homes; and advocate for tax
sale reform at the Baltimore City Council and the Maryland General Assembly, successfully lobbying to reduce the interest rate to redeem tax sale certificates, and increase the lien threshold at which properties go to tax sale.
Recently, the Center for Community Progress assessed Baltimore’s current tax sale system and provided recommendations to overhaul Baltimore City’s tax sale system to one that is more equitable, efficient, and effective . The Work Group continues to advocate in support of essential changes to the tax sale system, to protect vulnerable Baltimoreans from losing their homes, and eliminate tax sale a contributor to vacancy.
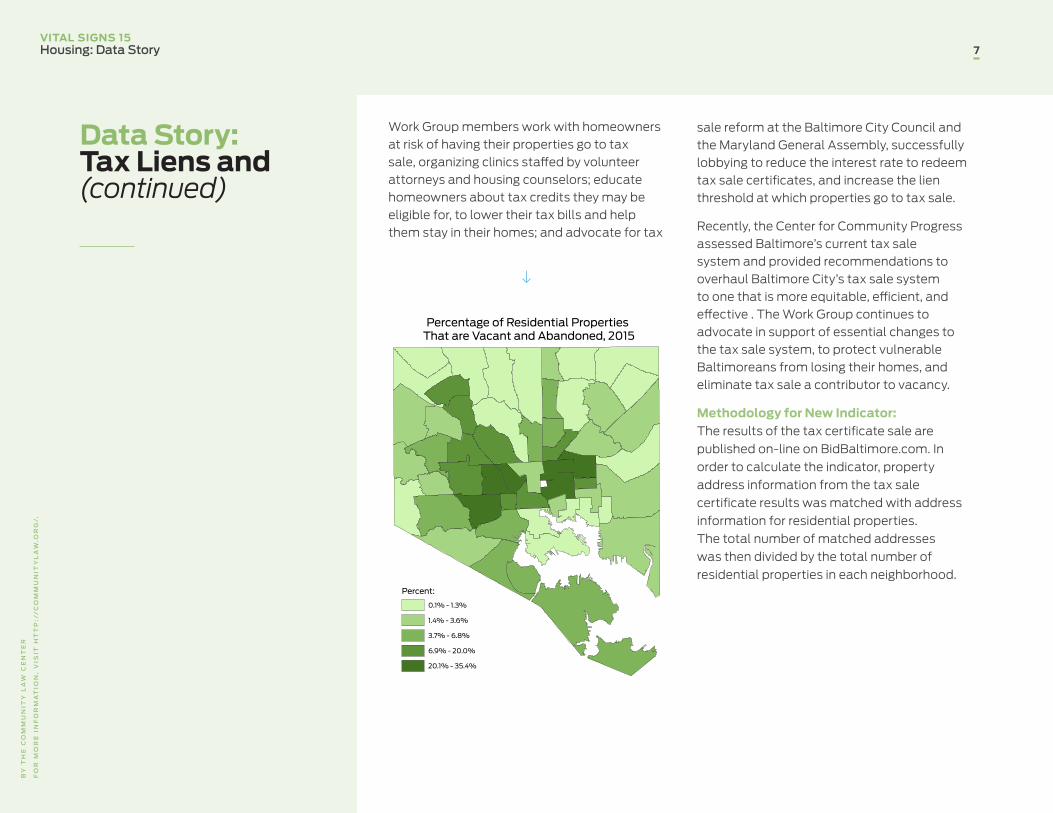
Methodology for New Indicator: The results of the tax certificate sale are published on-line on BidBaltimore.com. In order to calculate the indicator, property address information from the tax sale certificate results was matched with address information for residential properties. The total number of matched addresses was then divided by the total number of residential properties in each neighborhood.
Percentage of Residential Properties That are Vacant and Abandoned, 2015
Percent:
0.1% - 1.3%
1.4% - 3.6%
3.7% - 6.8%
6.9% - 20.0%
20.1% - 35.4%
VITAL SIGNS 15Housing and Community Development 8
BN
IAJ
FI.
OR
G/
VIT
AL
_S
IGN
S
VITAL SIGNS 15Housing and Community Development 8
BN
IAJ
FI.
OR
G/
VIT
AL
_S
IGN
S
7 Tax credit data has been provided by the Baltimore City Department of Finance
highest rates of Historic Tax credits were Midtown (72.1 per 1,000 residential proper-ties), Patterson Park North & East (59.8 per 1,000 residential properties), and Canton (57.5 per 1,000 residential properties). There were 28 CSAs that did not have any allo-cations of historic tax credits in 2015.
Housing Permits and Code Enforcement
Baltimore Housing, the city’s Department of
Housing and Community Development, is
responsible for issuing permits for rehabili-
tation, new construction, and demolition as
well as enforcing the building code and issuing
violations. Vital Signs 15 uses these datasets
to track both investment in and/or potential
neglect of a neighborhood’s housing stock.
• Between 2014 and 2015, the rate of new con-struction permits increased from 2.3 to 2.4 per 1,000 residential properties. The CSAs with the highest increase in the rate of new con-struction permits were South Baltimore (+9.5) and Dickeyville/Franklintown (+9.3) and). In 2015, the CSAs with the highest rate of new construction permits occurred in Orangeville/East Highlandtown (31.5 per 1,000 residential properties) and South Baltimore (31.3 per 1,000 residential properties). Sixteen CSAs experi-enced no new construction permits in 2015.
• Between 2014 and 2015, the percentage of
in Baltimore City declined from 272.7 per 1,000 residential properties to 258.5 per 1,000. The CSAs with the highest rates of residen-tial properties that received the Homestead Tax credit were located in Northwood (530.5 per 1,000 residential properties), Dorchester/Ashburton (458.5 per 1,000), and Edmondson Village (433.8 per 1,000). The CSAs with the lowest rates of residential properties that received the Homestead Tax credit were located in Greater Rosemont (42.3 per 1,000), Southern Park Heights (67.7 per 1,000), and Southwest Baltimore (70.2 per 1,000).
• From 2014 to 2015, the rate of residential properties that received the Homeowners Tax credit declined from 49.4 to 46.5 per 1,000 residential properties in Baltimore City. The rate decreased most in Greater Rosemont (-13.2 per 1,000) and Morrell Park/Violetville (-13.0 per 1,000). The rate increased most in Madison/East End (+4.6 per 1,000) and Northwood (+3.9 per 1,000).
• In 2015, the highest rates of Homeowners Tax credit were located in Edmondson Village (100.0 per 1,000), Northwood (98.4 per 1,000 residential units), and Glen-Fallstaff (87.4 per 1,000). In 2015, there was only one CSAs with less than 10 per 1,000 residential prop-erties receiving the Homeowners Tax credit: Downtown/Seton Hill CSA (7.3 per 1,000).
• Between 2014 and 2015, the rate of Historic Tax credits per 1,000 residential properties increased from 6.4 to 10.1 per 1,000 residen-tial properties. In 2015, the CSAs with the
• Between 2014 and 2015, the rate of housing vouchers used per 1,000 rental units in Baltimore City declined from 131.3 to 127.8; this is the result of a small reduction in the number of housing choice vouchers and a significant increase in the overall number of rental units. The CSAs with the highest rates of housing voucher use per 1,000 rental units were Belair-Edison (420.9), Madison/East End (300.1), and Washington Village (294.2). These are the same CSAs with the lowest rent affordability.
Housing Tax Credits7
Baltimore City residential property owners can
apply for two property tax credits in order for
owner-occupants to manage fluctuations in
assessed value (homestead tax credit) and to
ensure their tax bill does not exceed a percent-
age of household gross income (homeowner’s
tax credit). Property owners must apply for these
credits and many homeownership preservation
strategies are aimed at raising awareness about
how and when to apply. For property owners in
designated historic districts, Historic Tax credits
help incentivize renovation of buildings located
in these districts. Vital Signs 15 tracks the per-
centage of properties that receive each of these
credits to show the rate of uptake of these
potential credits in different parts of the City.
• From 2014 to 2015, the rate of residential properties receiving the Homestead Tax credit
VITAL SIGNS 15Housing and Community Development 9
BN
IAJ
FI.
OR
G/
VIT
AL
_S
IGN
S
VITAL SIGNS 15Housing and Community Development 9
BN
IAJ
FI.
OR
G/
VIT
AL
_S
IGN
S
8 For more information on the Vacants to Value program, visit www.vacantstovalue.org.
decreases in vacant and abandoned housing were Poppleton/The Terraces/Hollins Market (-1.2%) and Midway/Coldstream (-0.9%).
• In 2015, the CSAs with highest percentage of vacant and abandoned properties were Sandtown-Winchester/Harlem Park (35.4%), Upton/Druid Heights (34.0%), and Greenmount East (32.5%). In 2015, 14 CSAs had less than 1% vacant and abandoned properties.
• Between 2014 and 2015, the rate of demolition permits increased from 2.1 to 3.8 per 1,000 homes. In 2014, the greatest rate of demolition permits occurred in Upton/Druid Heights (40.2 per 1,000 properties) and Midway/Coldstream (35.9 per 1,000 properties).
From previous Vital Signs:
• In 2013, the CSAs with the largest percent-age of properties receiving a housing viola-tion included: Upton/Druid Heights (35.5%), Poppleton/The Terraces/Hollins Market (28.9%), and Greenmount East (27.1%). In 2013, there were five CSAs where less than 1% of the homes received a housing viola-tion. The CSAs with the lowest percentage of housing violations include Mt. Washington/Coldspring (0.5%), Cross-County/Cheswolde (0.5%), and South Baltimore (0.8%).
• The percentage of properties receiving housing violations (other than vacant and
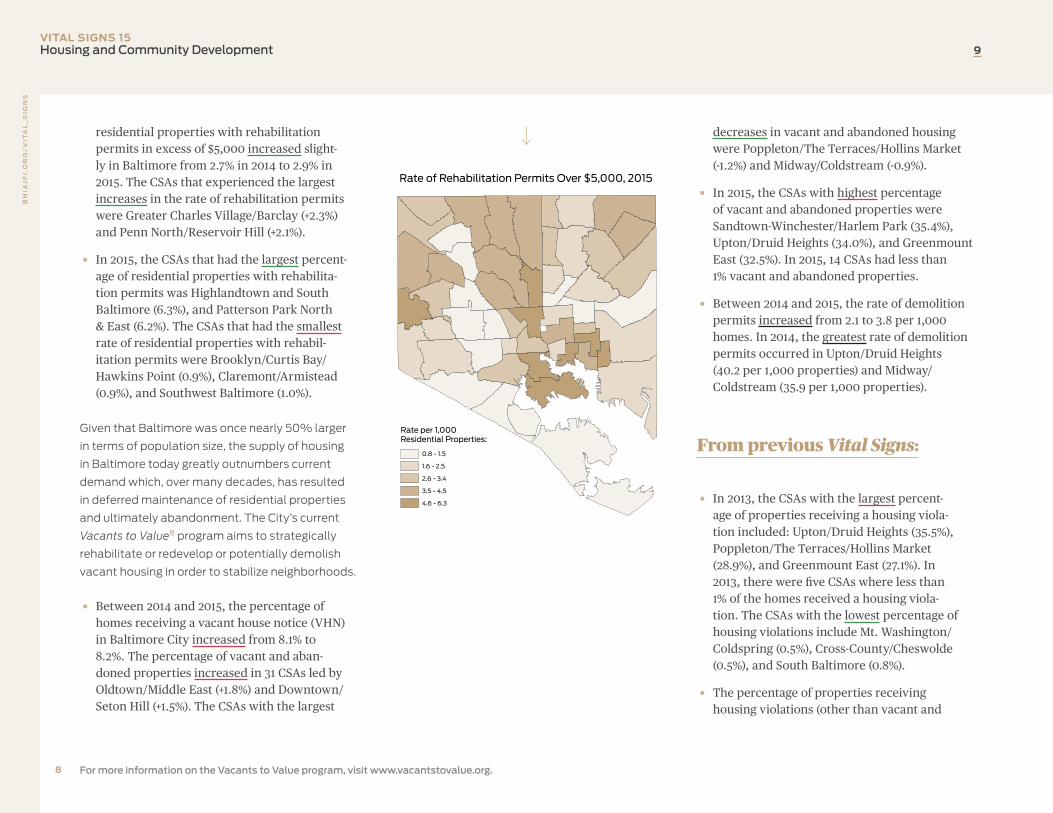
residential properties with rehabilitation permits in excess of $5,000 increased slight-ly in Baltimore from 2.7% in 2014 to 2.9% in 2015. The CSAs that experienced the largest increases in the rate of rehabilitation permits were Greater Charles Village/Barclay (+2.3%) and Penn North/Reservoir Hill (+2.1%).
• In 2015, the CSAs that had the largest percent-age of residential properties with rehabilita-tion permits was Highlandtown and South Baltimore (6.3%), and Patterson Park North & East (6.2%). The CSAs that had the smallest rate of residential properties with rehabil-itation permits were Brooklyn/Curtis Bay/Hawkins Point (0.9%), Claremont/Armistead (0.9%), and Southwest Baltimore (1.0%).
Given that Baltimore was once nearly 50% larger
in terms of population size, the supply of housing
in Baltimore today greatly outnumbers current
demand which, over many decades, has resulted
in deferred maintenance of residential properties
and ultimately abandonment. The City’s current
Vacants to Value8 program aims to strategically
rehabilitate or redevelop or potentially demolish
vacant housing in order to stabilize neighborhoods.
• Between 2014 and 2015, the percentage of homes receiving a vacant house notice (VHN) in Baltimore City increased from 8.1% to 8.2%. The percentage of vacant and aban-doned properties increased in 31 CSAs led by Oldtown/Middle East (+1.8%) and Downtown/Seton Hill (+1.5%). The CSAs with the largest
Rate of Rehabilitation Permits Over $5,000, 2015
Rate per 1,000Residential Properties:
0.8 - 1.5
1.6 - 2.5
2.6 - 3.4
3.5 - 4.5
4.6 - 6.3
VITAL SIGNS 15Housing and Community Development 10
BN
IAJ
FI.
OR
G/
VIT
AL
_S
IGN
S
VITAL SIGNS 15Housing and Community Development 10
BN
IAJ
FI.
OR
G/
VIT
AL
_S
IGN
S
abandoned) in Baltimore City increased from 4.7% in 2012 to 5.9% in 2013. From 2012 to 2013, 22 CSAs experienced an increase in the percentage of homes receiving a housing violation. The greatest increases occurred in Upton/Druid Heights (+16.4%), Poppleton/The Terraces/Hollins Market (+7.8%), and Oldtown/Middle East (+4.8%).
• In 2013, 15.2% of the vacant and abandoned properties were owned by the City, down from 18.6% in 2012. The CSAs with the great-est percentage of vacant and abandoned properties owned by the City in 2013 were in Oldtown/Middle East (58.5%), Downtown/Seton Hill (53.7%), and Upton/Druid Heights (41.7%). There were 33 CSAs where the percentage of vacant and abandoned prop-erties owned by the City declined, led by Greater Charles Village/Barclay (-28.3%) and Westport/Mt. Winans/Lakeland (-35.8%).

Housing and Community Development:Tables
VITAL SIGNS 14Housing and Community Development 12
BN
IAJ
FI.
OR
G/
VIT
AL
_S
IGN
S
12VITAL SIGNS 15Housing and Community Development: Indicator Definitions and Rankings
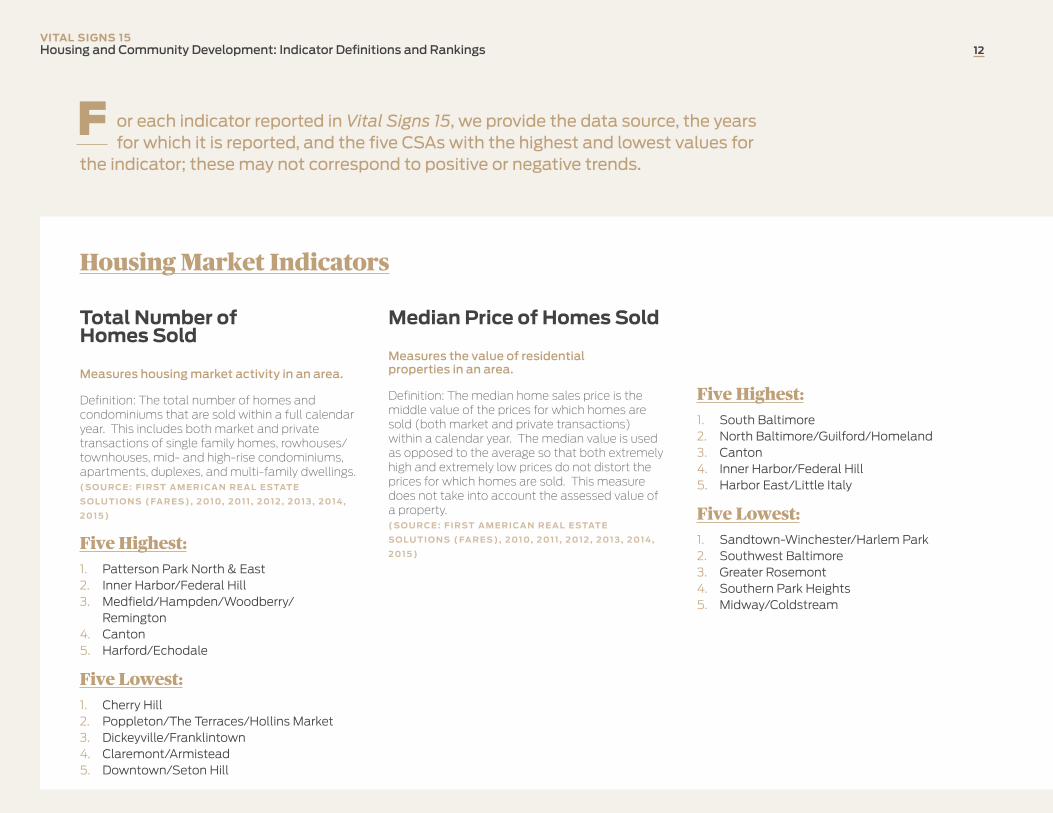
Total Number of Homes Sold
Measures housing market activity in an area.
Definition: The total number of homes and condominiums that are sold within a full calendar year. This includes both market and private transactions of single family homes, rowhouses/townhouses, mid- and high-rise condominiums, apartments, duplexes, and multi-family dwellings. ( SO U RC E : F I RST A M E R I CA N R E A L E STAT E
SO LU T I O N S ( FA R E S ) , 2 0 1 0, 2 0 1 1 , 2 0 1 2 , 2 0 1 3 , 2 0 1 4 ,
2 0 1 5 )
Five Highest:1. Patterson Park North & East2. Inner Harbor/Federal Hill3. Medfield/Hampden/Woodberry/
Remington4. Canton5. Harford/Echodale
Five Lowest:1. Cherry Hill2. Poppleton/The Terraces/Hollins Market3. Dickeyville/Franklintown4. Claremont/Armistead5. Downtown/Seton Hill
Median Price of Homes Sold
Measures the value of residential properties in an area.
Definition: The median home sales price is the middle value of the prices for which homes are sold (both market and private transactions) within a calendar year. The median value is used as opposed to the average so that both extremely high and extremely low prices do not distort the prices for which homes are sold. This measure does not take into account the assessed value of a property. ( SO U RC E : F I RST A M E R I CA N R E A L E STAT E
SO LU T I O N S ( FA R E S ) , 2 0 1 0, 2 0 1 1 , 2 0 1 2 , 2 0 1 3 , 2 0 1 4 ,
2 0 1 5 )
Housing Market Indicators
F or each indicator reported in Vital Signs 15, we provide the data source, the years for which it is reported, and the five CSAs with the highest and lowest values for
the indicator; these may not correspond to positive or negative trends.
Five Highest:1. South Baltimore2. North Baltimore/Guilford/Homeland3. Canton4. Inner Harbor/Federal Hill5. Harbor East/Little Italy
Five Lowest:1. Sandtown-Winchester/Harlem Park2. Southwest Baltimore3. Greater Rosemont4. Southern Park Heights5. Midway/Coldstream

VITAL SIGNS 14Housing and Community Development 13
BN
IAJ
FI.
OR
G/
VIT
AL
_S
IGN
SB
NIA
JF
I.O
RG
/V
ITA
L_
SIG
NS
VITAL SIGNS 15Housing and Community Development: Indicator Definitions and Rankings 13
Median Number of Days on the Market
Measures the demand for housing in an area.
Definition: The median number of days that homes listed for sale sits on the public market in a given area. This time period is from the date it is listed for sale till the day the contract of sale is signed. Private (non-listed) home sale transactions are not included in this indicator. The median days on market is used as opposed to the average so that both extremely high and extremely low days on the market do not distort the length of time for which homes are listed on the market. ( SO U RC E : R B I N T E L , 2 0 1 0, 2 0 1 1 , 2 0 1 2 , 2 0 1 3 , 2 0 1 4 ,
2 0 1 5 )
Five Highest:1. Poppleton/The Terraces/Hollins Market2. Dickeyville/Franklintown3. Downtown/Seton Hill4. Upton/Druid Heights5. Allendale/Irvington/S. Hilton
Five Lowest:1. Westport/Mount Winans/Lakeland2. Greater Roland Park/Poplar Hill2. Medfield/Hampden/Woodberry/
Remington2. Mount Washington/Coldspring2. Patterson Park North & East
Percent of Homes Sold in Foreclosure
Measures sales of homes by banks owning foreclosed properties
Definition: The portion of the homes and condominiums sold that were identified as being owned by the bank (REO) out of all residential properties sold in a calendar year. ( SO U RC E : R B I N T E L , 2 0 1 0, 2 0 1 1 , 2 0 1 2 , 2 0 1 3 , 2 0 1 4 ,
2 0 1 5 )
Five Highest:1. Downtown/Seton Hill2. Pimlico/Arlington/Hilltop3. Cherry Hill, Dickeyville/Franklintown4. Southern Park Heights5. Brooklyn/Curtis Bay/Hawkins Point
Five Lowest:Seven CSAs had zero homes sold in foreclosure.
Percent of Homes Sold for Cash
Measures the purchasing of homes in cash, without a mortgage.
Definition: The portion of homes and condominiums sold for cash out of all residential properties sold in a calendar year. These types of sales tend to signify investor-based purchases as homes purchased for cash either become rental properties or later sold again in an effort to generate a profit. ( SO U RC E : R B I N T E L , 2 0 1 0, 2 0 1 1 , 2 0 1 2 , 2 0 1 3 , 2 0 1 4 ,
2 0 1 5 )
Five Highest:1. Sandtown-Winchester/Harlem Park2. Madison/East End3. Clifton-Berea4. Greater Rosemont5. Southwest Baltimore
Five Lowest:1. South Baltimore2. Canton3. Fells Point4. Highlandtown5. Inner Harbor/Federal Hill
VITAL SIGNS 14Housing and Community Development 14
BN
IAJ
FI.
OR
G/
VIT
AL
_S
IGN
SB
NIA
JF
I.O
RG
/V
ITA
L_
SIG
NS
VITAL SIGNS 15Housing and Community Development: Indicator Definitions and Rankings 14
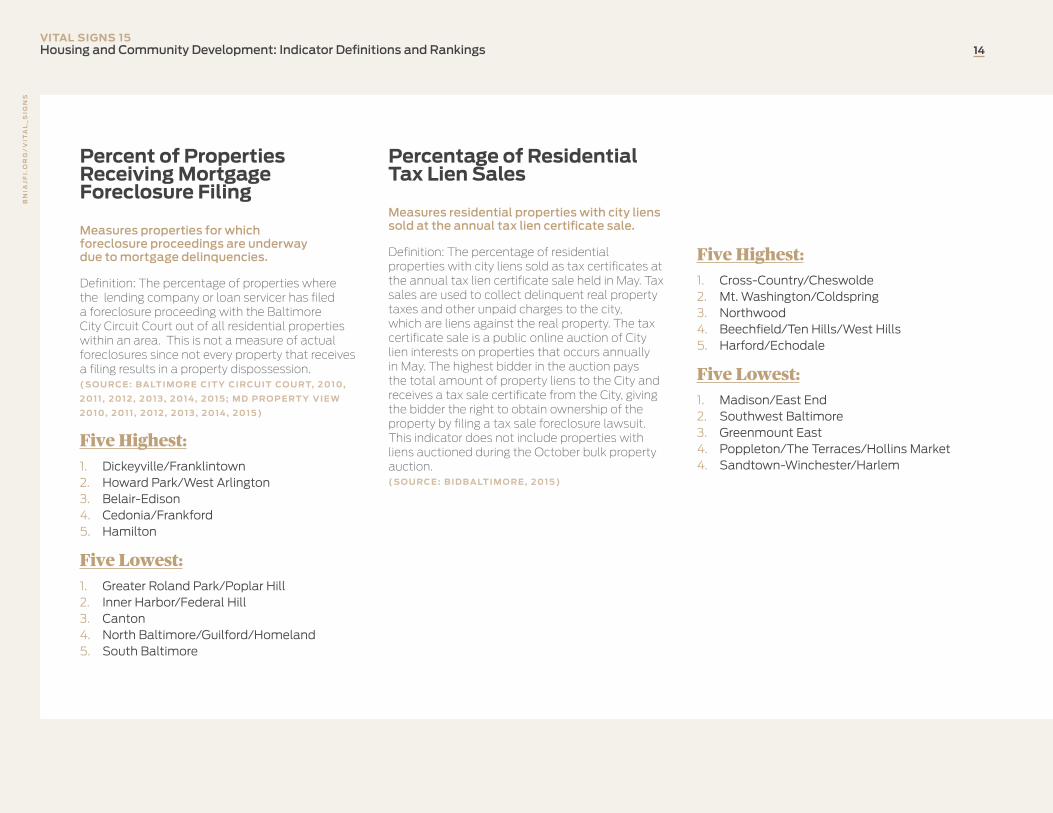
Percent of Properties Receiving Mortgage Foreclosure Filing
Measures properties for which foreclosure proceedings are underway due to mortgage delinquencies.
Definition: The percentage of properties where the lending company or loan servicer has filed a foreclosure proceeding with the Baltimore City Circuit Court out of all residential properties within an area. This is not a measure of actual foreclosures since not every property that receives a filing results in a property dispossession. ( SO U RC E : B A LT I M O R E C I T Y C I RC U I T CO U RT, 2 0 1 0,
2 0 1 1 , 2 0 1 2 , 2 0 1 3 , 2 0 1 4 , 2 0 1 5 ; M D P RO P E RT Y V I E W
2 0 1 0, 2 0 1 1 , 2 0 1 2 , 2 0 1 3 , 2 0 1 4 , 2 0 1 5 )
Five Highest:1. Dickeyville/Franklintown2. Howard Park/West Arlington3. Belair-Edison4. Cedonia/Frankford5. Hamilton
Five Lowest:1. Greater Roland Park/Poplar Hill2. Inner Harbor/Federal Hill3. Canton4. North Baltimore/Guilford/Homeland5. South Baltimore
Percentage of Residential Tax Lien Sales
Measures residential properties with city liens sold at the annual tax lien certificate sale.
Definition: The percentage of residential properties with city liens sold as tax certificates at the annual tax lien certificate sale held in May. Tax sales are used to collect delinquent real property taxes and other unpaid charges to the city, which are liens against the real property. The tax certificate sale is a public online auction of City lien interests on properties that occurs annually in May. The highest bidder in the auction pays the total amount of property liens to the City and receives a tax sale certificate from the City, giving the bidder the right to obtain ownership of the property by filing a tax sale foreclosure lawsuit. This indicator does not include properties with liens auctioned during the October bulk property auction. ( SO U RC E : B I D B A LT I M O R E , 2 0 1 5 )
Five Highest:1. Cross-Country/Cheswolde2. Mt. Washington/Coldspring3. Northwood4. Beechfield/Ten Hills/West Hills5. Harford/Echodale
Five Lowest:1. Madison/East End2. Southwest Baltimore3. Greenmount East4. Poppleton/The Terraces/Hollins Market4. Sandtown-Winchester/Harlem
VITAL SIGNS 14Housing and Community Development 15
BN
IAJ
FI.
OR
G/
VIT
AL
_S
IGN
SB
NIA
JF
I.O
RG
/V
ITA
L_
SIG
NS
VITAL SIGNS 15Housing and Community Development: Indicator Definitions and Rankings 15
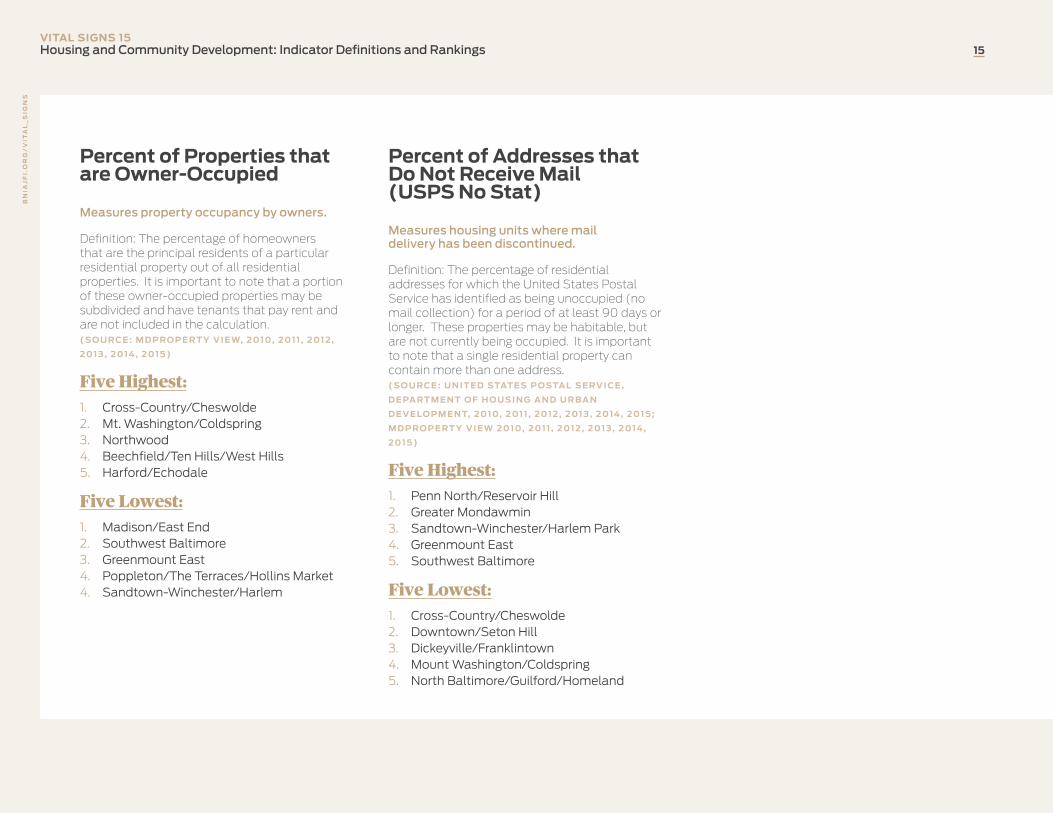
Percent of Properties that are Owner-Occupied
Measures property occupancy by owners.
Definition: The percentage of homeowners that are the principal residents of a particular residential property out of all residential properties. It is important to note that a portion of these owner-occupied properties may be subdivided and have tenants that pay rent and are not included in the calculation. ( SO U RC E : M D P RO P E RT Y V I E W, 2 0 1 0, 2 0 1 1 , 2 0 1 2 ,
2 0 1 3 , 2 0 1 4 , 2 0 1 5 )
Five Highest:1. Cross-Country/Cheswolde2. Mt. Washington/Coldspring3. Northwood4. Beechfield/Ten Hills/West Hills5. Harford/Echodale
Five Lowest:1. Madison/East End2. Southwest Baltimore3. Greenmount East4. Poppleton/The Terraces/Hollins Market4. Sandtown-Winchester/Harlem
Percent of Addresses that Do Not Receive Mail (USPS No Stat)
Measures housing units where mail delivery has been discontinued.
Definition: The percentage of residential addresses for which the United States Postal Service has identified as being unoccupied (no mail collection) for a period of at least 90 days or longer. These properties may be habitable, but are not currently being occupied. It is important to note that a single residential property can contain more than one address. ( SO U RC E : U N I T E D STAT E S P OSTA L S E RV I C E ,
D E PA RT M E N T O F H O U S I N G A N D U R B A N
D E V E LO P M E N T, 2 0 1 0, 2 0 1 1 , 2 0 1 2 , 2 0 1 3 , 2 0 1 4 , 2 0 1 5 ;
M D P RO P E RT Y V I E W 2 0 1 0, 2 0 1 1 , 2 0 1 2 , 2 0 1 3 , 2 0 1 4 ,
2 0 1 5 )
Five Highest:1. Penn North/Reservoir Hill2. Greater Mondawmin3. Sandtown-Winchester/Harlem Park4. Greenmount East5. Southwest Baltimore
Five Lowest:1. Cross-Country/Cheswolde2. Downtown/Seton Hill3. Dickeyville/Franklintown4. Mount Washington/Coldspring5. North Baltimore/Guilford/Homeland
VITAL SIGNS 14Housing and Community Development 16
BN
IAJ
FI.
OR
G/
VIT
AL
_S
IGN
S
16
BN
IAJ
FI.
OR
G/
VIT
AL
_S
IGN
S
VITAL SIGNS 15Housing and Community Development: Indicator Definitions and Rankings
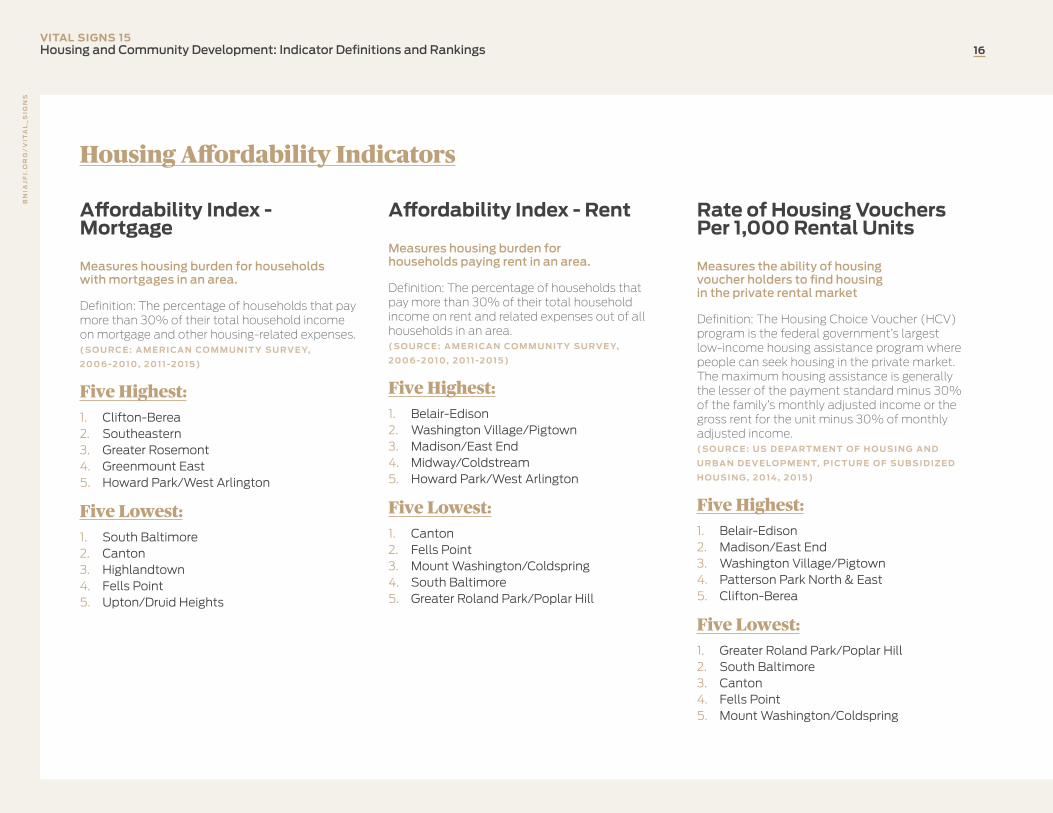
Housing Affordability Indicators
Affordability Index - Mortgage
Measures housing burden for households with mortgages in an area.
Definition: The percentage of households that pay more than 30% of their total household income on mortgage and other housing-related expenses. ( SO U RC E : A M E R I CA N CO M M U N I T Y S U RV E Y,
2 0 0 6 -2 0 1 0, 2 0 1 1 -2 0 1 5 )
Five Highest:1. Clifton-Berea2. Southeastern3. Greater Rosemont4. Greenmount East5. Howard Park/West Arlington
Five Lowest:1. South Baltimore2. Canton3. Highlandtown4. Fells Point5. Upton/Druid Heights
Affordability Index - Rent
Measures housing burden for households paying rent in an area.
Definition: The percentage of households that pay more than 30% of their total household income on rent and related expenses out of all households in an area. ( SO U RC E : A M E R I CA N CO M M U N I T Y S U RV E Y,
2 0 0 6 -2 0 1 0, 2 0 1 1 -2 0 1 5 )
Five Highest:1. Belair-Edison2. Washington Village/Pigtown3. Madison/East End4. Midway/Coldstream5. Howard Park/West Arlington
Five Lowest:1. Canton2. Fells Point3. Mount Washington/Coldspring4. South Baltimore5. Greater Roland Park/Poplar Hill
Rate of Housing Vouchers Per 1,000 Rental Units
Measures the ability of housing voucher holders to find housing in the private rental market
Definition: The Housing Choice Voucher (HCV) program is the federal government’s largest low-income housing assistance program where people can seek housing in the private market. The maximum housing assistance is generally the lesser of the payment standard minus 30% of the family’s monthly adjusted income or the gross rent for the unit minus 30% of monthly adjusted income. ( SO U RC E : U S D E PA RT M E N T O F H O U S I N G A N D
U R B A N D E V E LO P M E N T, P I C T U R E O F S U B S I D I Z E D
H O U S I N G, 2 0 1 4 , 2 0 1 5 )
Five Highest:1. Belair-Edison2. Madison/East End3. Washington Village/Pigtown4. Patterson Park North & East5. Clifton-Berea
Five Lowest:1. Greater Roland Park/Poplar Hill2. South Baltimore3. Canton4. Fells Point5. Mount Washington/Coldspring
VITAL SIGNS 14Housing and Community Development 17
BN
IAJ
FI.
OR
G/
VIT
AL
_S
IGN
S
17
BN
IAJ
FI.
OR
G/
VIT
AL
_S
IGN
S
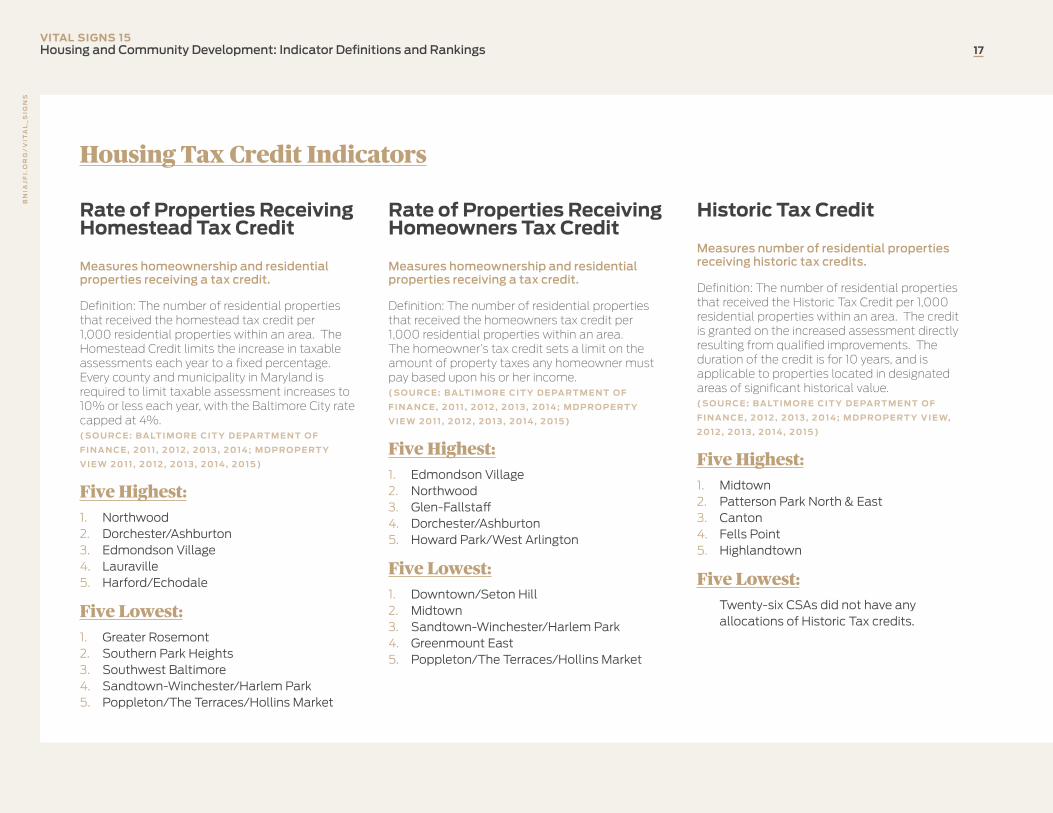
Housing Tax Credit Indicators
Rate of Properties Receiving Homestead Tax Credit
Measures homeownership and residential properties receiving a tax credit.
Definition: The number of residential properties that received the homestead tax credit per 1,000 residential properties within an area. The Homestead Credit limits the increase in taxable assessments each year to a fixed percentage. Every county and municipality in Maryland is required to limit taxable assessment increases to 10% or less each year, with the Baltimore City rate capped at 4%. ( SO U RC E : B A LT I M O R E C I T Y D E PA RT M E N T O F
F I N A N C E , 2 0 1 1 , 2 0 1 2 , 2 0 1 3 , 2 0 1 4 ; M D P RO P E RT Y
V I E W 2 0 1 1 , 2 0 1 2 , 2 0 1 3 , 2 0 1 4 , 2 0 1 5 )
Five Highest:1. Northwood2. Dorchester/Ashburton3. Edmondson Village4. Lauraville5. Harford/Echodale
Five Lowest:1. Greater Rosemont2. Southern Park Heights3. Southwest Baltimore4. Sandtown-Winchester/Harlem Park5. Poppleton/The Terraces/Hollins Market
Rate of Properties Receiving Homeowners Tax Credit
Measures homeownership and residential properties receiving a tax credit.
Definition: The number of residential properties that received the homeowners tax credit per 1,000 residential properties within an area. The homeowner’s tax credit sets a limit on the amount of property taxes any homeowner must pay based upon his or her income. ( SO U RC E : B A LT I M O R E C I T Y D E PA RT M E N T O F
F I N A N C E , 2 0 1 1 , 2 0 1 2 , 2 0 1 3 , 2 0 1 4 ; M D P RO P E RT Y
V I E W 2 0 1 1 , 2 0 1 2 , 2 0 1 3 , 2 0 1 4 , 2 0 1 5 )
Five Highest:1. Edmondson Village2. Northwood3. Glen-Fallstaff4. Dorchester/Ashburton5. Howard Park/West Arlington
Five Lowest:1. Downtown/Seton Hill2. Midtown3. Sandtown-Winchester/Harlem Park4. Greenmount East5. Poppleton/The Terraces/Hollins Market
Historic Tax Credit
Measures number of residential properties receiving historic tax credits.
Definition: The number of residential properties that received the Historic Tax Credit per 1,000 residential properties within an area. The credit is granted on the increased assessment directly resulting from qualified improvements. The duration of the credit is for 10 years, and is applicable to properties located in designated areas of significant historical value. ( SO U RC E : B A LT I M O R E C I T Y D E PA RT M E N T O F
F I N A N C E , 2 0 1 2 , 2 0 1 3 , 2 0 1 4 ; M D P RO P E RT Y V I E W,
2 0 1 2 , 2 0 1 3 , 2 0 1 4 , 2 0 1 5 )
Five Highest:1. Midtown2. Patterson Park North & East3. Canton4. Fells Point5. Highlandtown
Five Lowest:Twenty-six CSAs did not have any allocations of Historic Tax credits.
VITAL SIGNS 15Housing and Community Development: Indicator Definitions and Rankings
VITAL SIGNS 14Housing and Community Development 18
BN
IAJ
FI.
OR
G/
VIT
AL
_S
IGN
S
18
BN
IAJ
FI.
OR
G/
VIT
AL
_S
IGN
S
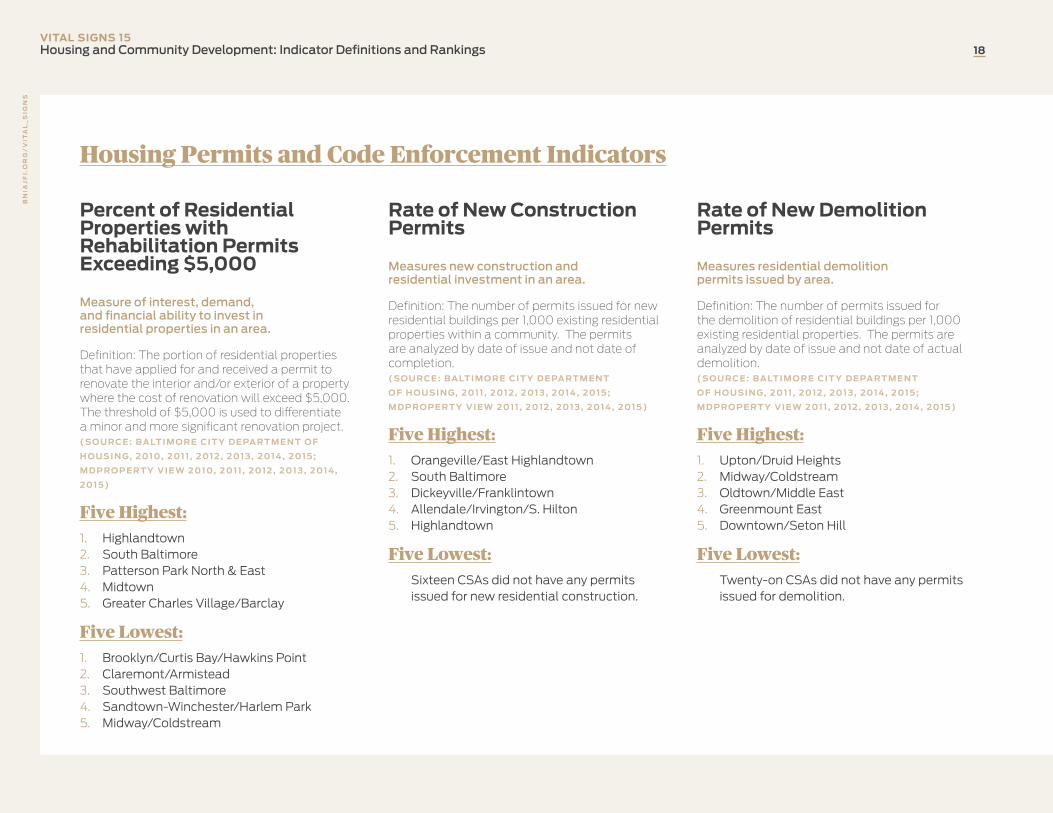
Housing Permits and Code Enforcement Indicators
Percent of Residential Properties with Rehabilitation Permits Exceeding $5,000
Measure of interest, demand, and financial ability to invest in residential properties in an area.
Definition: The portion of residential properties that have applied for and received a permit to renovate the interior and/or exterior of a property where the cost of renovation will exceed $5,000. The threshold of $5,000 is used to differentiate a minor and more significant renovation project.( SO U RC E : B A LT I M O R E C I T Y D E PA RT M E N T O F
H O U S I N G, 2 0 1 0, 2 0 1 1 , 2 0 1 2 , 2 0 1 3 , 2 0 1 4 , 2 0 1 5 ;
M D P RO P E RT Y V I E W 2 0 1 0, 2 0 1 1 , 2 0 1 2 , 2 0 1 3 , 2 0 1 4 ,
2 0 1 5 )
Five Highest:1. Highlandtown2. South Baltimore3. Patterson Park North & East4. Midtown5. Greater Charles Village/Barclay
Five Lowest:1. Brooklyn/Curtis Bay/Hawkins Point2. Claremont/Armistead3. Southwest Baltimore4. Sandtown-Winchester/Harlem Park5. Midway/Coldstream
Rate of New Construction Permits
Measures new construction and residential investment in an area.
Definition: The number of permits issued for new residential buildings per 1,000 existing residential properties within a community. The permits are analyzed by date of issue and not date of completion. ( SO U RC E : B A LT I M O R E C I T Y D E PA RT M E N T
O F H O U S I N G, 2 0 1 1 , 2 0 1 2 , 2 0 1 3 , 2 0 1 4 , 2 0 1 5 ;
M D P RO P E RT Y V I E W 2 0 1 1 , 2 0 1 2 , 2 0 1 3 , 2 0 1 4 , 2 0 1 5 )
Five Highest:1. Orangeville/East Highlandtown2. South Baltimore3. Dickeyville/Franklintown4. Allendale/Irvington/S. Hilton5. Highlandtown
Five Lowest:Sixteen CSAs did not have any permits issued for new residential construction.
Rate of New Demolition Permits
Measures residential demolition permits issued by area.
Definition: The number of permits issued for the demolition of residential buildings per 1,000 existing residential properties. The permits are analyzed by date of issue and not date of actual demolition. ( SO U RC E : B A LT I M O R E C I T Y D E PA RT M E N T
O F H O U S I N G, 2 0 1 1 , 2 0 1 2 , 2 0 1 3 , 2 0 1 4 , 2 0 1 5 ;
M D P RO P E RT Y V I E W 2 0 1 1 , 2 0 1 2 , 2 0 1 3 , 2 0 1 4 , 2 0 1 5 )
Five Highest:1. Upton/Druid Heights2. Midway/Coldstream3. Oldtown/Middle East4. Greenmount East5. Downtown/Seton Hill
Five Lowest:Twenty-on CSAs did not have any permits issued for demolition.
VITAL SIGNS 15Housing and Community Development: Indicator Definitions and Rankings
VITAL SIGNS 14Housing and Community Development 19
BN
IAJ
FI.
OR
G/
VIT
AL
_S
IGN
SB
NIA
JF
I.O
RG
/V
ITA
L_
SIG
NS
VITAL SIGNS 15Housing and Community Development: Indicator Definitions and Rankings 19
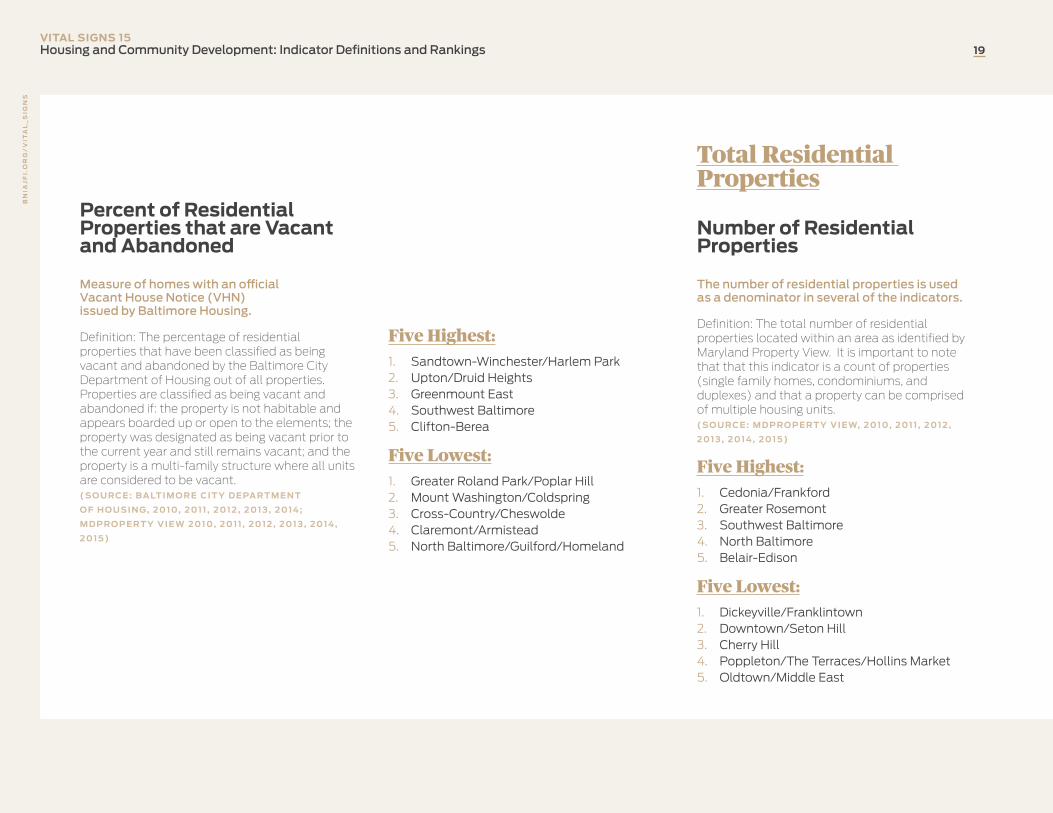
Percent of Residential Properties that are Vacant and Abandoned
Measure of homes with an official Vacant House Notice (VHN) issued by Baltimore Housing.
Definition: The percentage of residential properties that have been classified as being vacant and abandoned by the Baltimore City Department of Housing out of all properties. Properties are classified as being vacant and abandoned if: the property is not habitable and appears boarded up or open to the elements; the property was designated as being vacant prior to the current year and still remains vacant; and the property is a multi-family structure where all units are considered to be vacant. ( SO U RC E : B A LT I M O R E C I T Y D E PA RT M E N T
O F H O U S I N G, 2 0 1 0, 2 0 1 1 , 2 0 1 2 , 2 0 1 3 , 2 0 1 4 ;
M D P RO P E RT Y V I E W 2 0 1 0, 2 0 1 1 , 2 0 1 2 , 2 0 1 3 , 2 0 1 4 ,
2 0 1 5 )
Five Highest:1. Sandtown-Winchester/Harlem Park2. Upton/Druid Heights3. Greenmount East4. Southwest Baltimore5. Clifton-Berea
Five Lowest:1. Greater Roland Park/Poplar Hill2. Mount Washington/Coldspring3. Cross-Country/Cheswolde4. Claremont/Armistead5. North Baltimore/Guilford/Homeland
Total Residential Properties
Number of Residential Properties
The number of residential properties is used as a denominator in several of the indicators.
Definition: The total number of residential properties located within an area as identified by Maryland Property View. It is important to note that that this indicator is a count of properties (single family homes, condominiums, and duplexes) and that a property can be comprised of multiple housing units. ( SO U RC E : M D P RO P E RT Y V I E W, 2 0 1 0, 2 0 1 1 , 2 0 1 2 ,
2 0 1 3 , 2 0 1 4 , 2 0 1 5 )
Five Highest:1. Cedonia/Frankford2. Greater Rosemont3. Southwest Baltimore4. North Baltimore5. Belair-Edison
Five Lowest:1. Dickeyville/Franklintown2. Downtown/Seton Hill3. Cherry Hill4. Poppleton/The Terraces/Hollins Market 5. Oldtown/Middle East
VITAL SIGNS 14Housing and Community Development 20
BN
IAJ
FI.
OR
G/
VIT
AL
_S
IGN
S
20
BN
IAJ
FI.
OR
G/
VIT
AL
_S
IGN
S
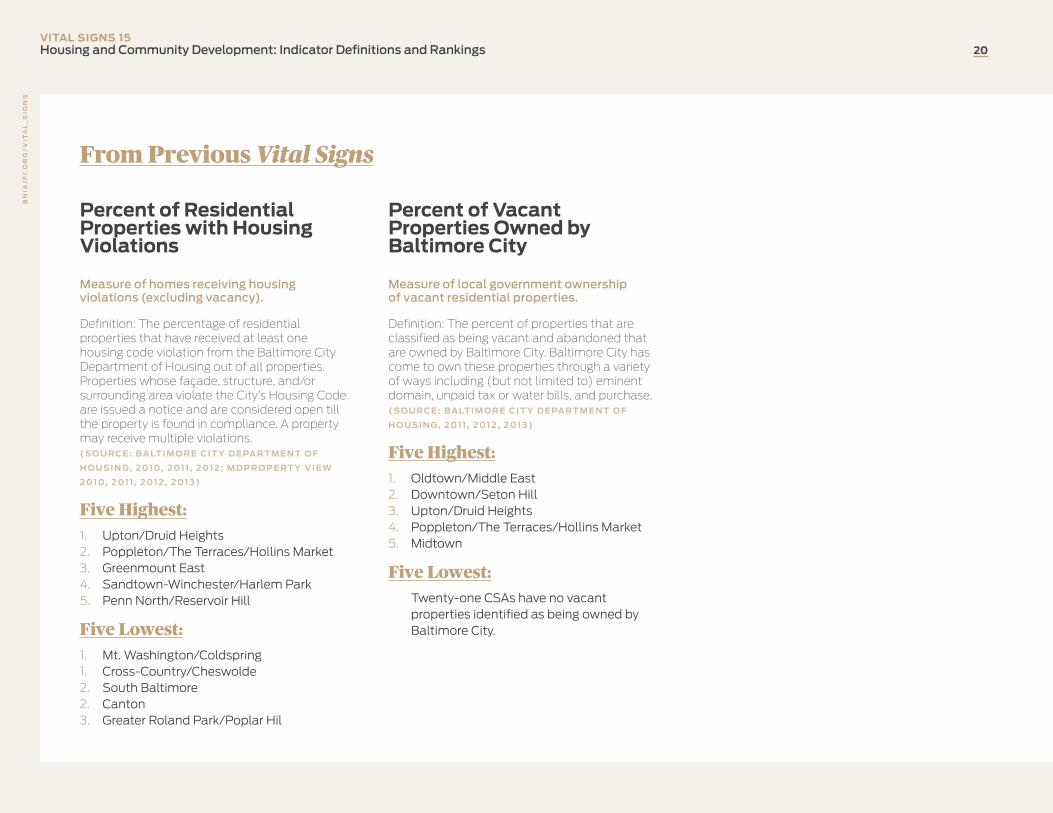
From Previous Vital Signs
Percent of Residential Properties with Housing Violations
Measure of homes receiving housing violations (excluding vacancy).
Definition: The percentage of residential properties that have received at least one housing code violation from the Baltimore City Department of Housing out of all properties. Properties whose façade, structure, and/or surrounding area violate the City’s Housing Code are issued a notice and are considered open till the property is found in compliance. A property may receive multiple violations. ( SO U RC E : B A LT I M O R E C I T Y D E PA RT M E N T O F
H O U S I N G, 2 0 1 0, 2 0 1 1 , 2 0 1 2 ; M D P RO P E RT Y V I E W
2 0 1 0, 2 0 1 1 , 2 0 1 2 , 2 0 1 3 )
Five Highest:1. Upton/Druid Heights2. Poppleton/The Terraces/Hollins Market3. Greenmount East4. Sandtown-Winchester/Harlem Park5. Penn North/Reservoir Hill
Five Lowest:1. Mt. Washington/Coldspring1. Cross-Country/Cheswolde2. South Baltimore2. Canton3. Greater Roland Park/Poplar Hil
Percent of Vacant Properties Owned by Baltimore City
Measure of local government ownership of vacant residential properties.
Definition: The percent of properties that are classified as being vacant and abandoned that are owned by Baltimore City. Baltimore City has come to own these properties through a variety of ways including (but not limited to) eminent domain, unpaid tax or water bills, and purchase. ( SO U RC E : B A LT I M O R E C I T Y D E PA RT M E N T O F
H O U S I N G, 2 0 1 1 , 2 0 1 2 , 2 0 1 3 )
Five Highest:1. Oldtown/Middle East2. Downtown/Seton Hill3. Upton/Druid Heights4. Poppleton/The Terraces/Hollins Market5. Midtown
Five Lowest:Twenty-one CSAs have no vacant properties identified as being owned by Baltimore City.
VITAL SIGNS 15Housing and Community Development: Indicator Definitions and Rankings
Housing and Community Development:Tables
VIT
AL
SIG
NS
15
Ho
usi
ng
an
d C
om
mu
nit
y D
eve
lop
me
nt
Community Statistical Area (CSA)Total Number of Homes Sold
2010 2011 2012 2013 2014 2015% Change
(14-15)
Allendale/Irvington/S. Hilton 118 80 76 74 184 116 -37.0Beechfield/Ten Hills/West Hills 72 84 64 62 117 102 -12.8Belair-Edison 153 127 132 117 184 161 -12.5Brooklyn/Curtis Bay/Hawkins Point 104 86 84 77 113 95 -15.9Canton 230 199 288 244 315 271 -14.0Cedonia/Frankford 195 171 141 132 262 224 -14.5Cherry Hill 9 8 6 2 18 7 -61.1Chinquapin Park/Belvedere 74 59 63 55 89 70 -21.3Claremont/Armistead 16 18 6 7 17 25 47.1Clifton-Berea 87 76 40 40 63 73 15.9Cross-Country/Cheswolde 53 69 86 119 117 105 -10.3Dickeyville/Franklintown 4 8 11 9 10 20 100.0Dorchester/Ashburton 84 73 57 60 148 127 -14.2Downtown/Seton Hill 20 17 30 25 34 33 -2.9Edmondson Village 70 39 49 40 87 83 -4.6Fells Point 170 173 178 191 241 216 -10.4Forest Park/Walbrook 81 87 55 49 129 93 -27.9Glen-Fallstaff 90 73 55 92 138 142 2.9Greater Charles Village/Barclay 110 108 121 121 177 130 -26.6Greater Govans 92 61 54 73 100 98 -2.0Greater Mondawmin 75 52 44 42 67 60 -10.4Greater Roland Park/Poplar Hill 90 98 120 116 157 123 -21.7Greater Rosemont 190 141 83 85 145 137 -5.5Greenmount East 93 54 41 52 118 52 -55.9Hamilton 120 123 134 104 203 186 -8.4Harbor East/Little Italy 46 42 47 51 99 55 -44.4Harford/Echodale 124 139 154 130 269 238 -11.5Highlandtown 145 135 177 158 237 196 -17.3Howard Park/West Arlington 71 60 73 50 109 109 0.0Inner Harbor/Federal Hill 313 263 336 321 373 321 -13.9Lauraville 129 111 132 118 199 174 -12.6Loch Raven 99 88 64 68 125 105 -16.0Madison/East End 110 77 48 34 71 63 -11.3Medfield/Hampden/Woodberry/Remington 223 187 260 226 334 314 -6.0Midtown 81 105 159 126 149 117 -21.5Midway/Coldstream 86 75 52 43 70 77 10.0Morrell Park/Violetville 73 68 78 71 118 115 -2.5Mt. Washington/Coldspring 32 52 69 58 58 64 10.3North Baltimore/Guilford/Homeland 151 174 183 196 271 195 -28.0Northwood 83 85 98 77 176 142 -19.3Oldtown/Middle East 48 67 48 41 51 48 -5.9Orangeville/East Highlandtown 107 98 83 85 155 104 -32.9Patterson Park North & East 424 270 256 291 441 362 -17.9Penn North/Reservoir Hill 117 84 66 72 137 86 -37.2Pimlico/Arlington/Hilltop 72 67 38 34 79 63 -20.3Poppleton/The Terraces/Hollins Market 41 31 39 30 44 19 -56.8Sandtown-Winchester/Harlem Park 107 120 68 67 88 62 -29.5South Baltimore 186 179 196 218 299 231 -22.7Southeastern 49 46 37 39 69 53 -23.2Southern Park Heights 107 83 50 40 82 82 0.0Southwest Baltimore 187 153 119 105 152 143 -5.9The Waverlies 74 60 50 69 84 100 19.0Upton/Druid Heights 61 59 59 43 40 55 37.5
Washington Village/Pigtown 109 86 79 59 151 104 -31.1Westport/Mt. Winans/Lakeland 53 33 32 30 62 40 -35.5Baltimore City 5,913 5,188 5,166 4,935 7,822 6,583 -15.8
For more information on these indicators please visit http://www.bniajfi.org.
Housing and Community Development: Housing Market
VIT
AL
SIG
NS
15
Ho
usi
ng
an
d C
om
mu
nit
y D
eve
lop
me
nt
Community Statistical Area (CSA)Median Sales Price
2010 2011 2012 2013 2014 2015 % Change(14-15)
Allendale/Irvington/S. Hilton $42,500 $30,000 $47,500 $31,806 $33,250 $35,500 6.8Beechfield/Ten Hills/West Hills $142,250 $120,000 $144,501 $139,500 $130,000 $126,000 -3.1Belair-Edison $56,000 $44,000 $60,000 $45,100 $41,975 $42,000 0.1Brooklyn/Curtis Bay/Hawkins Point $58,005 $42,950 $47,050 $45,000 $40,000 $37,500 -6.3Canton $251,000 $231,000 $261,200 $285,500 $275,000 $302,900 10.1Cedonia/Frankford $103,225 $88,000 $94,500 $97,250 $78,575 $69,950 -11.0Cherry Hill $69,000 $61,050 $16,000 $34,850 $23,500 $19,109 -18.7Chinquapin Park/Belvedere $117,450 $130,000 $124,000 $125,000 $120,000 $109,500 -8.8Claremont/Armistead $139,000 $135,000 $79,200 $97,000 $90,000 $104,900 16.6Clifton-Berea $13,250 $16,050 $21,250 $24,000 $20,000 $19,000 -5.0Cross-Country/Cheswolde $165,000 $143,500 $111,250 $131,250 $165,000 $200,000 21.2Dickeyville/Franklintown $245,000 $140,625 $225,000 $235,000 $227,550 $210,000 -7.7Dorchester/Ashburton $68,150 $80,000 $100,000 $88,500 $86,250 $84,000 -2.6Downtown/Seton Hill $210,450 $157,600 $197,500 $220,000 $235,250 $215,000 -8.6Edmondson Village $49,100 $41,000 $60,000 $56,444 $55,000 $45,500 -17.3Fells Point $215,500 $205,000 $226,500 $244,000 $249,000 $255,000 2.4
Forest Park/Walbrook $60,250 $50,000 $50,000 $70,000 $65,500 $50,150 -23.4
Glen-Fallstaff $102,600 $90,000 $127,500 $127,450 $87,500 $63,500 -27.4Greater Charles Village/Barclay $146,000 $135,000 $185,000 $170,000 $189,900 $167,000 -12.1Greater Govans $47,094 $37,000 $62,750 $60,000 $50,600 $50,000 -1.2Greater Mondawmin $34,000 $41,950 $28,000 $57,000 $40,500 $36,100 -10.9Greater Roland Park/Poplar Hill $380,000 $335,000 $316,250 $320,000 $310,000 $269,900 -12.9Greater Rosemont $29,700 $20,000 $39,900 $21,875 $20,000 $17,500 -12.5Greenmount East $12,900 $19,000 $18,508 $32,450 $30,000 $39,500 31.7Hamilton $139,175 $105,975 $116,600 $120,000 $106,000 $88,500 -16.5Harbor East/Little Italy $242,500 $202,500 $242,000 $292,900 $298,000 $284,000 -4.7Harford/Echodale $154,950 $134,500 $134,950 $144,950 $123,999 $144,450 16.5Highlandtown $215,000 $191,500 $220,000 $250,000 $265,000 $265,000 0.0Howard Park/West Arlington $115,000 $74,250 $115,000 $115,000 $70,000 $78,000 11.4Inner Harbor/Federal Hill $275,000 $280,000 $284,950 $314,000 $320,000 $290,000 -9.4Lauraville $137,000 $92,900 $114,450 $128,750 $132,000 $106,000 -19.7Loch Raven $134,000 $94,000 $98,500 $109,000 $73,100 $104,400 42.8Madison/East End $25,000 $16,000 $34,500 $26,250 $25,000 $19,000 -24.0Medfield/Hampden/Woodberry/Remington $164,950 $139,000 $144,600 $178,000 $175,000 $184,950 5.7Midtown $195,000 $190,000 $229,900 $207,450 $200,000 $220,000 10.0Midway/Coldstream $24,500 $17,500 $19,400 $22,000 $17,005 $18,250 7.3Morrell Park/Violetville $103,000 $63,250 $80,700 $65,000 $69,000 $59,000 -14.5Mt. Washington/Coldspring $280,000 $250,000 $280,000 $308,000 $287,000 $265,000 -7.7North Baltimore/Guilford/Homeland $347,500 $352,000 $340,000 $370,000 $325,000 $305,000 -6.2Northwood $138,000 $115,000 $110,050 $109,900 $90,000 $120,000 33.3Oldtown/Middle East $173,750 $57,500 $50,000 $102,000 $149,900 $94,250 -37.1Orangeville/East Highlandtown $84,000 $70,000 $75,000 $94,500 $90,000 $84,950 -5.6Patterson Park North & East $189,950 $114,750 $162,200 $201,000 $172,000 $189,750 10.3Penn North/Reservoir Hill $44,000 $39,950 $70,000 $83,500 $65,000 $78,950 21.5Pimlico/Arlington/Hilltop $48,094 $21,500 $18,653 $57,500 $30,000 $19,800 -34.0Poppleton/The Terraces/Hollins Market $48,000 $69,900 $69,000 $117,450 $73,600 $59,000 -19.8Sandtown-Winchester/Harlem Park $12,886 $26,000 $34,500 $32,000 $18,000 $12,550 -30.3South Baltimore $250,500 $250,000 $246,750 $309,750 $289,900 $306,000 5.6Southeastern $79,000 $90,000 $70,000 $83,000 $75,000 $67,000 -10.7Southern Park Heights $21,000 $18,800 $19,553 $28,500 $19,900 $18,050 -9.3Southwest Baltimore $22,500 $17,000 $21,150 $22,000 $23,250 $15,600 -32.9The Waverlies $84,950 $56,100 $74,000 $79,200 $79,950 $55,000 -31.2Upton/Druid Heights $20,100 $30,000 $50,000 $30,000 $71,202 $60,000 -15.7
Washington Village/Pigtown $70,000 $58,450 $92,000 $80,000 $113,000 $107,750 -4.6Westport/Mt. Winans/Lakeland $62,250 $39,000 $52,900 $37,700 $35,500 $32,300 -9.0Baltimore City $115,000 $100,000 $135,000 $147,000 $126,325 $125,000 -1.0
For more information on these indicators please visit http://www.bniajfi.org.
Housing and Community Development: Housing Market
VIT
AL
SIG
NS
15
Ho
usi
ng
an
d C
om
mu
nit
y D
eve
lop
me
nt
Community Statistical Area (CSA)Median Number of Days on the Market
2010 2011 2012 2013 2014 2015 % Change(14-15)
Allendale/Irvington/S. Hilton 85 55 58 57 43 56 30.2Beechfield/Ten Hills/West Hills 102 74 69 53 49 39 -20.4Belair-Edison 94 66 46 39 39 34 -14.1Brooklyn/Curtis Bay/Hawkins Point 108 68 59 51 36 36 -1.4Canton 82 58 27 17 30 33 10.0Cedonia/Frankford 99 71 48 39 45 43 -4.4Cherry Hill 141 92 28 36 38 48 26.3Chinquapin Park/Belvedere 103 78 54 45 36 38 5.6Claremont/Armistead 135 43 49 108 57 34 -40.4Clifton-Berea 71 45 36 50 32 52 60.9Cross-Country/Cheswolde 121 109 60 38 35 36 2.9Dickeyville/Franklintown 219 81 114 45 126 66 -47.6Dorchester/Ashburton 120 75 59 29 40 29 -26.6Downtown/Seton Hill 111 106 46 42 88 63 -28.4Edmondson Village 95 79 59 40 39 29 -25.6Fells Point 123 60 35 21 33 40 21.2Forest Park/Walbrook 122 63 41 35 49 46 -5.2Glen-Fallstaff 120 60 61 54 47 35 -25.5Greater Charles Village/Barclay 90 73 36 22 41 33 -18.5Greater Govans 99 50 71 45 44 46 3.4Greater Mondawmin 88 69 41 40 33 34 3.0Greater Roland Park/Poplar Hill 111 37 40 17 36 27 -25.0Greater Rosemont 102 50 41 32 54 54 0.0Greenmount East 117 76 75 88 72 40 -44.1Hamilton 106 58 57 40 45 37 -18.0Harbor East/Little Italy 111 49 84 35 55 41 -25.5Harford/Echodale 98 76 51 34 47 41 -12.8Highlandtown 107 46 26 21 41 30 -28.0Howard Park/West Arlington 105 51 22 40 34 41 22.4Inner Harbor/Federal Hill 99 56 31 23 28 43 56.4Lauraville 106 67 46 34 46 36 -21.7Loch Raven 99 57 38 52 34 47 38.2Madison/East End 123 53 36 29 61 42 -31.1Medfield/Hampden/Woodberry/Remington 97 58 37 28 29 27 -6.9Midtown 83 77 54 33 33 37 13.8Midway/Coldstream 85 55 60 26 28 44 60.0Morrell Park/Violetville 91 63 72 47 35 41 18.8Mt. Washington/Coldspring 115 79 29 26 34 27 -20.6North Baltimore/Guilford/Homeland 122 57 47 28 33 34 3.0Northwood 96 55 52 42 36 44 22.2Oldtown/Middle East 111 79 48 31 35 42 20.0Orangeville/East Highlandtown 108 59 35 28 37 32 -13.5Patterson Park North & East 102 63 44 28 28 27 -3.6Penn North/Reservoir Hill 101 59 40 30 36 37 4.2Pimlico/Arlington/Hilltop 80 52 41 35 48 37 -24.0Poppleton/The Terraces/Hollins Market 116 53 42 38 27 69 155.6Sandtown-Winchester/Harlem Park 90 56 41 26 39 35 -10.3South Baltimore 82 59 31 15 23 28 19.6Southeastern 87 67 80 36 65 55 -15.5Southern Park Heights 82 57 40 57 47 56 19.4Southwest Baltimore 89 58 38 37 54 37 -31.5The Waverlies 98 42 63 28 54 31 -42.1Upton/Druid Heights 117 88 80 95 31 59 91.8
Washington Village/Pigtown 100 57 49 56 36 48 33.3Westport/Mt. Winans/Lakeland 103 48 51 41 30 26 -13.3Baltimore City 101 60 43 33 38 37 -2.6
For more information on these indicators please visit http://www.bniajfi.org.
Housing and Community Development: Housing Market
VIT
AL
SIG
NS
15
Ho
usi
ng
an
d C
om
mu
nit
y D
eve
lop
me
nt
For more information on these indicators please visit http://www.bniajfi.org.
Housing and Community Development: Housing Market
Community Statistical Area (CSA)Percent of Homes Sold in Foreclosure (REO)
2011 2012 2013 2014 2015 Change (14-15)
Allendale/Irvington/S. Hilton 53.5 29.3 8.3 4.4 3.7 -0.7
Beechfield/Ten Hills/West Hills 38.5 9.0 3.2 1.7 2.4 0.7
Belair-Edison 41.1 23.2 6.5 3.5 2.7 -0.8
Brooklyn/Curtis Bay/Hawkins Point 42.6 23.7 0.8 5.1 4.4 -0.6
Canton 14.0 3.9 0.7 0.4 0.3 0.0
Cedonia/Frankford 42.6 16.9 6.7 1.8 1.1 -0.7
Cherry Hill 15.4 6.7 0.0 4.3 4.8 0.4
Chinquapin Park/Belvedere 24.2 11.5 5.5 2.2 1.0 -1.2
Claremont/Armistead 31.6 20.0 0.0 0.0 0.0 0.0
Clifton-Berea 53.1 14.6 7.4 2.0 2.5 0.6
Cross-Country/Cheswolde 7.4 4.2 1.7 1.1 2.1 1.0
Dickeyville/Franklintown 62.5 15.4 0.0 0.0 4.8 4.8
Dorchester/Ashburton 45.9 27.3 7.8 3.6 1.3 -2.3
Downtown/Seton Hill 16.7 13.0 3.7 0.0 7.4 7.4
Edmondson Village 42.1 20.0 7.5 3.7 1.8 -1.9
Fells Point 21.8 8.0 1.0 0.0 0.5 0.5
Forest Park/Walbrook 45.1 16.7 4.0 2.0 0.8 -1.1
Glen-Fallstaff 30.0 20.3 5.6 1.2 2.6 1.5
Greater Charles Village/Barclay 27.1 9.4 2.4 2.5 0.0 -2.5
Greater Govans 47.4 25.0 5.4 4.6 1.7 -2.9
Greater Mondawmin 41.4 29.4 3.1 1.4 2.4 1.0
Greater Roland Park/Poplar Hill 12.4 2.6 0.0 0.0 0.0 0.0
Greater Rosemont 52.5 34.9 9.4 3.0 2.0 -0.9
Greenmount East 34.1 17.1 4.3 3.1 0.0 -3.1
Hamilton 41.6 18.9 3.8 1.6 2.2 0.5
Harbor East/Little Italy 31.3 2.6 0.0 0.0 2.9 2.9
Harford/Echodale 30.7 12.6 2.3 4.4 1.8 -2.6
Highlandtown 25.3 8.3 1.5 0.0 0.0 0.0
Howard Park/West Arlington 47.8 21.1 9.1 2.0 2.5 0.5
Inner Harbor/Federal Hill 10.6 4.8 0.8 0.7 0.6 -0.1
Lauraville 35.8 22.6 2.9 2.7 0.5 -2.2
Loch Raven 29.3 11.8 3.4 1.9 2.1 0.3
Madison/East End 45.5 20.0 8.0 0.0 1.0 1.0
Medfield/Hampden/Woodberry/Remington 16.4 8.4 0.7 1.3 1.5 0.1
Midtown 17.7 11.5 0.9 3.3 0.0 -3.3
Midway/Coldstream 48.2 27.1 5.5 3.1 1.0 -2.1
Morrell Park/Violetville 44.9 22.5 3.8 2.5 2.0 -0.6
Mt. Washington/Coldspring 7.8 7.2 0.0 0.0 1.4 1.4
North Baltimore/Guilford/Homeland 8.0 4.0 1.3 1.3 0.0 -1.3
Northwood 32.1 13.5 3.8 1.6 2.9 1.3
Oldtown/Middle East 28.6 8.0 2.1 0.0 1.9 1.9
Orangeville/East Highlandtown 34.6 7.1 4.0 0.8 2.0 1.1
Patterson Park North & East 34.8 10.0 2.1 1.3 0.7 -0.7
Penn North/Reservoir Hill 58.4 18.3 4.0 2.4 3.0 0.6
Pimlico/Arlington/Hilltop 52.2 44.6 1.4 4.7 5.5 0.8
Poppleton/The Terraces/Hollins Market 37.9 26.1 9.7 6.1 3.2 -2.8
Sandtown-Winchester/Harlem Park 46.1 26.4 7.5 1.0 1.3 0.3
South Baltimore 8.5 7.1 1.1 0.4 0.4 0.0
Southeastern 25.5 12.5 6.3 1.6 1.2 -0.4
Southern Park Heights 52.7 23.2 6.3 0.0 4.7 4.7
Southwest Baltimore 51.1 27.6 8.3 4.1 3.5 -0.6
The Waverlies 43.1 15.2 5.1 0.0 2.8 2.8
Upton/Druid Heights 51.1 20.0 7.9 0.0 3.7 3.7
Washington Village/Pigtown 54.5 9.6 2.0 5.6 0.7 -4.9
Westport/Mt. Winans/Lakeland 37.8 17.1 4.8 2.9 3.3 0.5
Baltimore City 33.1 13.9 3.4 2.0 1.6 -0.4
VIT
AL
SIG
NS
15
Ho
usi
ng
an
d C
om
mu
nit
y D
eve
lop
me
nt
For more information on these indicators please visit http://www.bniajfi.org.
Housing and Community Development: Housing Market
Community Statistical Area (CSA)Percent of Homes Sold for Cash
2011 2012 2013 2014 2015 Change (14-15)
Allendale/Irvington/S. Hilton 78.2 76.1 78.8 76.6 78.3 1.7
Beechfield/Ten Hills/West Hills 32.1 25.4 29.0 34.7 27.8 -7.0
Belair-Edison 66.7 67.4 67.7 69.2 68.5 -0.7
Brooklyn/Curtis Bay/Hawkins Point 73.4 72.0 76.9 75.4 74.8 -0.6
Canton 26.6 20.1 15.5 18.3 18.4 0.1
Cedonia/Frankford 45.4 42.2 40.2 43.7 45.1 1.4
Cherry Hill 61.5 86.7 76.5 95.7 85.7 -9.9
Chinquapin Park/Belvedere 40.3 31.1 43.8 40.0 40.6 0.6
Claremont/Armistead 52.6 40.0 56.3 57.1 48.4 -8.8
Clifton-Berea 90.6 85.4 87.0 93.1 89.0 -4.2
Cross-Country/Cheswolde 55.6 55.6 52.5 49.4 54.3 4.8
Dickeyville/Franklintown 50.0 15.4 30.8 33.3 28.6 -4.8
Dorchester/Ashburton 55.3 50.0 47.6 52.9 46.8 -6.1
Downtown/Seton Hill 55.6 39.1 37.0 15.8 29.6 13.8
Edmondson Village 63.2 58.2 73.1 51.9 61.9 10.1
Fells Point 29.9 27.3 22.4 21.8 19.9 -1.9
Forest Park/Walbrook 62.6 61.1 53.3 58.8 60.5 1.7
Glen-Fallstaff 57.5 50.0 46.1 42.4 62.3 19.9
Greater Charles Village/Barclay 46.9 47.9 45.6 36.1 40.0 3.9
Greater Govans 69.2 61.7 67.4 66.1 73.3 7.2
Greater Mondawmin 74.1 82.4 70.3 68.1 65.1 -3.1
Greater Roland Park/Poplar Hill 33.3 28.2 25.2 34.1 35.3 1.2
Greater Rosemont 86.5 87.2 93.5 88.8 88.8 0.1
Greenmount East 88.6 74.3 63.0 58.3 81.4 23.1
Hamilton 41.6 28.8 30.1 35.9 39.7 3.8
Harbor East/Little Italy 43.8 42.1 53.7 44.1 40.0 -4.1
Harford/Echodale 30.7 25.8 27.1 31.0 30.7 -0.2
Highlandtown 31.2 25.9 24.2 21.7 21.0 -0.7
Howard Park/West Arlington 53.6 39.4 53.2 44.1 41.3 -2.8
Inner Harbor/Federal Hill 21.6 26.3 24.2 22.1 22.3 0.2
Lauraville 46.7 38.7 37.1 32.4 35.2 2.7
Loch Raven 36.0 40.8 25.0 43.4 39.3 -4.1
Madison/East End 93.9 94.0 85.3 87.0 93.3 6.3
Medfield/Hampden/Woodberry/Remington 35.0 31.2 24.3 23.2 24.5 1.3
Midtown 40.0 26.5 28.7 35.0 29.0 -6.0
Midway/Coldstream 85.9 84.7 90.9 93.9 86.1 -7.7
Morrell Park/Violetville 44.9 51.2 50.0 56.8 54.2 -2.5
Mt. Washington/Coldspring 19.6 20.3 20.0 19.6 27.5 7.9
North Baltimore/Guilford/Homeland 21.1 26.0 28.5 33.8 27.2 -6.5
Northwood 32.1 28.1 39.0 34.4 34.9 0.5
Oldtown/Middle East 47.6 48.0 54.2 40.0 39.6 -0.4
Orangeville/East Highlandtown 54.6 57.6 48.0 47.9 49.3 1.4
Patterson Park North & East 41.8 40.9 35.0 31.6 29.2 -2.4
Penn North/Reservoir Hill 71.4 60.6 53.3 62.2 65.7 3.5
Pimlico/Arlington/Hilltop 82.1 85.7 69.6 66.3 74.5 8.3
Poppleton/The Terraces/Hollins Market 58.6 52.2 64.5 45.5 64.5 19.1
Sandtown-Winchester/Harlem Park 92.1 88.7 92.5 93.2 97.4 4.2
South Baltimore 19.2 18.0 15.7 14.3 13.0 -1.3
Southeastern 41.2 47.5 60.4 57.8 50.6 -7.2
Southern Park Heights 91.9 73.2 84.4 80.4 84.9 4.5
Southwest Baltimore 90.0 92.4 89.0 86.4 88.0 1.6
The Waverlies 51.7 65.2 55.7 48.7 46.2 -2.5
Upton/Druid Heights 76.6 52.7 73.7 68.8 68.5 -0.2
Washington Village/Pigtown 60.4 62.5 53.9 53.8 47.6 -6.3
Westport/Mt. Winans/Lakeland 71.1 73.2 82.3 75.7 83.3 7.6
Baltimore City 50.8 44.4 44.4 45.9 46.3 0.4
VIT
AL
SIG
NS
15
Ho
usi
ng
an
d C
om
mu
nit
y D
eve
lop
me
nt
Community Statistical Area (CSA)
Percent of Properties Receiving Mortgage Foreclosure Filing
Percentage of Residential Tax Lien Sales
2010 2011 2012 2013 2014 2015 Change(14-15)
2015
Allendale/Irvington/S. Hilton 2.6 1.3 2.0 3.3 2.8 2.0 -0.8 6.1Beechfield/Ten Hills/West Hills 2.1 1.0 1.4 3.0 2.4 2.1 -0.3 2.9Belair-Edison 3.2 1.7 2.3 4.7 3.1 3.2 0.1 4.2Brooklyn/Curtis Bay/Hawkins Point 2.8 1.3 1.8 3.6 2.5 2.1 -0.4 6.0Canton 1.8 0.5 0.6 1.4 0.7 0.4 -0.3 0.8Cedonia/Frankford 2.9 1.3 2.4 4.1 3.2 3.2 0.0 3.0Cherry Hill 2.0 1.0 0.6 1.9 1.4 0.9 -0.5 7.7Chinquapin Park/Belvedere 2.0 0.9 1.6 2.6 2.3 1.9 -0.3 2.5Claremont/Armistead 4.7 0.8 2.0 2.9 1.3 0.7 -0.6 0.4Clifton-Berea 1.7 0.5 0.9 1.8 1.4 1.1 -0.3 13.4Cross-Country/Cheswolde 0.9 0.2 0.5 1.3 0.9 1.1 0.2 0.8Dickeyville/Franklintown 1.5 0.3 0.3 1.6 1.2 3.4 2.2 8.4Dorchester/Ashburton 2.8 1.5 2.0 3.9 3.2 3.0 -0.2 6.0Downtown/Seton Hill 5.1 3.9 3.4 2.1 2.5 2.5 0.0 1.6Edmondson Village 2.3 0.9 1.7 3.4 2.5 1.9 -0.6 5.3Fells Point 1.6 0.8 0.7 1.1 1.0 0.7 -0.3 1.1Forest Park/Walbrook 4.5 1.5 1.8 4.1 3.5 2.7 -0.8 8.1Glen-Fallstaff 2.2 0.9 1.4 1.9 2.0 1.6 -0.4 2.8Greater Charles Village/Barclay 1.6 1.0 1.3 1.9 1.3 1.0 -0.3 2.9Greater Govans 2.1 1.1 1.5 2.9 2.5 2.8 0.3 6.0Greater Mondawmin 2.1 1.1 1.5 3.0 1.6 1.9 0.3 10.3Greater Roland Park/Poplar Hill 0.4 0.2 0.3 0.4 0.2 0.2 0.0 0.4Greater Rosemont 2.3 1.0 1.6 2.8 2.2 1.6 -0.7 11.6Greenmount East 1.2 0.4 0.6 1.2 1.1 0.8 -0.3 14.0Hamilton 3.1 1.2 2.0 3.8 3.3 3.0 -0.3 2.5Harbor East/Little Italy 1.2 0.5 0.7 1.5 1.6 0.6 -1.0 0.8Harford/Echodale 2.6 1.3 2.1 3.3 2.7 2.4 -0.3 2.1Highlandtown 2.2 1.0 0.9 1.4 1.2 1.0 -0.3 1.6Howard Park/West Arlington 3.8 0.9 1.5 3.0 3.4 3.3 -0.2 5.0Inner Harbor/Federal Hill 1.3 0.4 0.7 1.2 0.9 0.3 -0.6 0.7Lauraville 2.5 1.3 2.0 3.0 2.6 2.4 -0.2 2.8Loch Raven 2.7 1.0 1.4 3.5 2.3 2.8 0.6 2.2Madison/East End 2.4 1.0 1.3 2.9 1.9 1.9 0.0 9.0Medfield/Hampden/Woodberry/Remington 1.6 0.7 0.8 1.5 1.3 1.1 -0.2 1.6Midtown 1.6 1.4 1.5 2.5 1.0 1.3 0.3 1.8Midway/Coldstream 2.1 0.9 1.2 2.5 1.9 1.3 -0.6 12.2Morrell Park/Violetville 2.3 1.5 1.6 3.4 2.8 2.3 -0.5 3.0Mt. Washington/Coldspring 0.9 0.5 0.8 1.5 1.0 1.0 0.0 0.8North Baltimore/Guilford/Homeland 0.8 0.3 0.4 0.6 0.9 0.5 -0.4 0.7Northwood 2.1 0.8 1.3 2.4 2.7 2.1 -0.6 2.9Oldtown/Middle East 1.9 0.6 1.6 2.1 0.8 1.3 0.5 3.5Orangeville/East Highlandtown 1.8 0.7 0.7 1.6 1.3 1.4 0.0 2.0Patterson Park North & East 2.9 1.1 1.7 2.1 1.6 1.1 -0.5 3.4Penn North/Reservoir Hill 2.8 1.4 1.8 3.1 2.4 2.0 -0.4 10.2Pimlico/Arlington/Hilltop 2.3 0.9 2.0 2.9 2.2 1.8 -0.4 7.5Poppleton/The Terraces/Hollins Market 3.0 1.5 1.4 2.8 2.6 1.9 -0.7 5.6Sandtown-Winchester/Harlem Park 1.6 0.8 1.1 1.6 1.2 1.7 0.5 15.3South Baltimore 1.4 0.4 0.7 1.1 0.6 0.5 -0.1 0.8Southeastern 1.6 1.2 1.0 2.3 2.0 1.8 -0.2 2.8Southern Park Heights 1.9 0.9 1.3 2.8 2.3 1.5 -0.9 9.0Southwest Baltimore 2.5 0.9 1.2 1.8 1.5 1.3 -0.2 16.3The Waverlies 2.3 1.3 1.6 2.9 2.1 2.2 0.1 4.8Upton/Druid Heights 2.5 0.7 1.2 2.1 1.6 1.5 0.0 7.8
Washington Village/Pigtown 2.6 2.9 2.6 3.2 2.7 1.9 -0.8 4.4Westport/Mt. Winans/Lakeland 2.5 0.8 2.0 3.8 3.1 2.1 -1.1 4.4Baltimore City 2.2 1.0 1.4 2.5 2.0 1.7 -0.3 5.4
For more information on these indicators please visit http://www.bniajfi.org.
Housing and Community Development: Housing Market
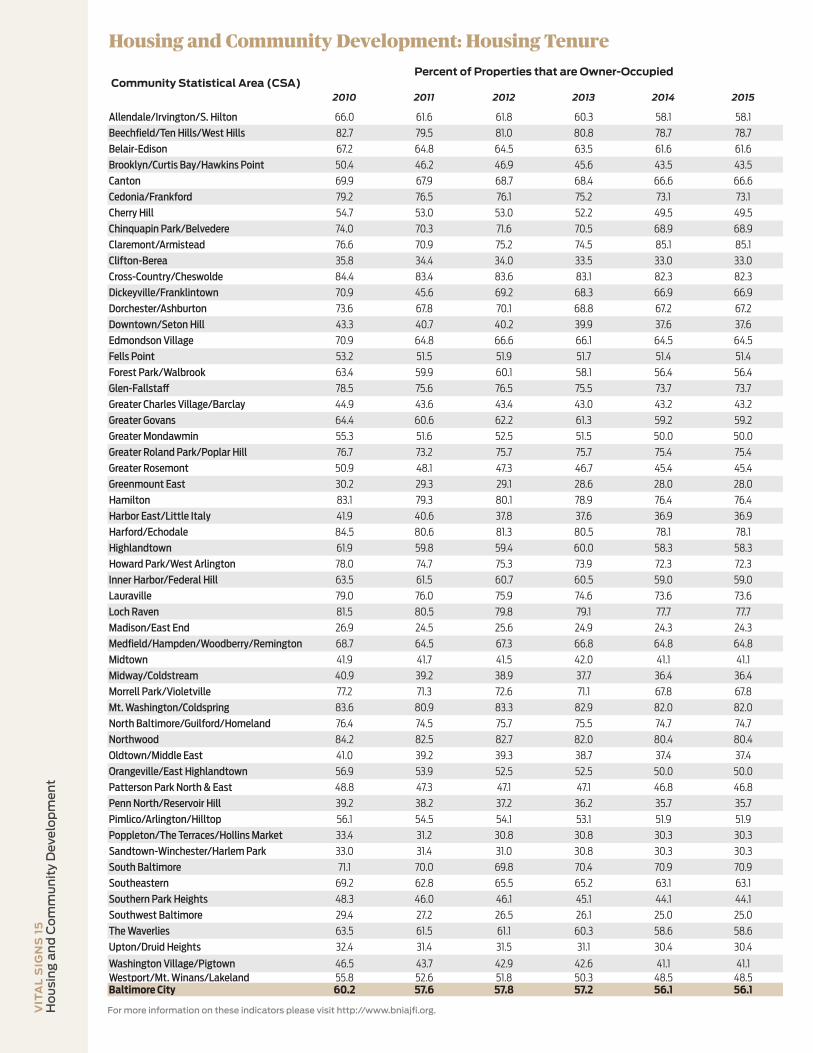
VIT
AL
SIG
NS
15
Ho
usi
ng
an
d C
om
mu
nit
y D
eve
lop
me
nt
Community Statistical Area (CSA)Percent of Properties that are Owner-Occupied
2010 2011 2012 2013 2014 2015
Allendale/Irvington/S. Hilton 66.0 61.6 61.8 60.3 58.1 58.1Beechfield/Ten Hills/West Hills 82.7 79.5 81.0 80.8 78.7 78.7Belair-Edison 67.2 64.8 64.5 63.5 61.6 61.6Brooklyn/Curtis Bay/Hawkins Point 50.4 46.2 46.9 45.6 43.5 43.5Canton 69.9 67.9 68.7 68.4 66.6 66.6Cedonia/Frankford 79.2 76.5 76.1 75.2 73.1 73.1Cherry Hill 54.7 53.0 53.0 52.2 49.5 49.5Chinquapin Park/Belvedere 74.0 70.3 71.6 70.5 68.9 68.9Claremont/Armistead 76.6 70.9 75.2 74.5 85.1 85.1Clifton-Berea 35.8 34.4 34.0 33.5 33.0 33.0Cross-Country/Cheswolde 84.4 83.4 83.6 83.1 82.3 82.3Dickeyville/Franklintown 70.9 45.6 69.2 68.3 66.9 66.9Dorchester/Ashburton 73.6 67.8 70.1 68.8 67.2 67.2Downtown/Seton Hill 43.3 40.7 40.2 39.9 37.6 37.6Edmondson Village 70.9 64.8 66.6 66.1 64.5 64.5Fells Point 53.2 51.5 51.9 51.7 51.4 51.4Forest Park/Walbrook 63.4 59.9 60.1 58.1 56.4 56.4Glen-Fallstaff 78.5 75.6 76.5 75.5 73.7 73.7Greater Charles Village/Barclay 44.9 43.6 43.4 43.0 43.2 43.2Greater Govans 64.4 60.6 62.2 61.3 59.2 59.2Greater Mondawmin 55.3 51.6 52.5 51.5 50.0 50.0Greater Roland Park/Poplar Hill 76.7 73.2 75.7 75.7 75.4 75.4Greater Rosemont 50.9 48.1 47.3 46.7 45.4 45.4Greenmount East 30.2 29.3 29.1 28.6 28.0 28.0Hamilton 83.1 79.3 80.1 78.9 76.4 76.4Harbor East/Little Italy 41.9 40.6 37.8 37.6 36.9 36.9Harford/Echodale 84.5 80.6 81.3 80.5 78.1 78.1Highlandtown 61.9 59.8 59.4 60.0 58.3 58.3Howard Park/West Arlington 78.0 74.7 75.3 73.9 72.3 72.3Inner Harbor/Federal Hill 63.5 61.5 60.7 60.5 59.0 59.0Lauraville 79.0 76.0 75.9 74.6 73.6 73.6Loch Raven 81.5 80.5 79.8 79.1 77.7 77.7Madison/East End 26.9 24.5 25.6 24.9 24.3 24.3Medfield/Hampden/Woodberry/Remington 68.7 64.5 67.3 66.8 64.8 64.8Midtown 41.9 41.7 41.5 42.0 41.1 41.1Midway/Coldstream 40.9 39.2 38.9 37.7 36.4 36.4Morrell Park/Violetville 77.2 71.3 72.6 71.1 67.8 67.8Mt. Washington/Coldspring 83.6 80.9 83.3 82.9 82.0 82.0North Baltimore/Guilford/Homeland 76.4 74.5 75.7 75.5 74.7 74.7Northwood 84.2 82.5 82.7 82.0 80.4 80.4Oldtown/Middle East 41.0 39.2 39.3 38.7 37.4 37.4Orangeville/East Highlandtown 56.9 53.9 52.5 52.5 50.0 50.0Patterson Park North & East 48.8 47.3 47.1 47.1 46.8 46.8Penn North/Reservoir Hill 39.2 38.2 37.2 36.2 35.7 35.7Pimlico/Arlington/Hilltop 56.1 54.5 54.1 53.1 51.9 51.9Poppleton/The Terraces/Hollins Market 33.4 31.2 30.8 30.8 30.3 30.3Sandtown-Winchester/Harlem Park 33.0 31.4 31.0 30.8 30.3 30.3South Baltimore 71.1 70.0 69.8 70.4 70.9 70.9Southeastern 69.2 62.8 65.5 65.2 63.1 63.1Southern Park Heights 48.3 46.0 46.1 45.1 44.1 44.1Southwest Baltimore 29.4 27.2 26.5 26.1 25.0 25.0The Waverlies 63.5 61.5 61.1 60.3 58.6 58.6Upton/Druid Heights 32.4 31.4 31.5 31.1 30.4 30.4
Washington Village/Pigtown 46.5 43.7 42.9 42.6 41.1 41.1Westport/Mt. Winans/Lakeland 55.8 52.6 51.8 50.3 48.5 48.5Baltimore City 60.2 57.6 57.8 57.2 56.1 56.1
For more information on these indicators please visit http://www.bniajfi.org.
Housing and Community Development: Housing Tenure
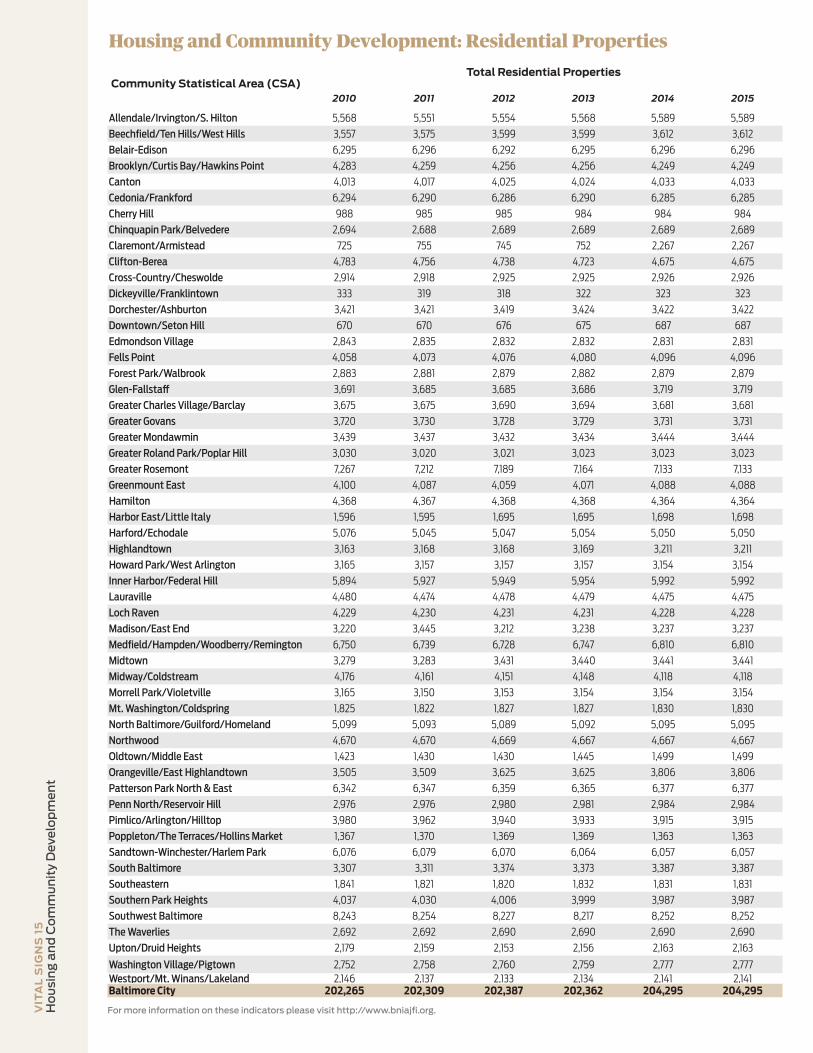
VIT
AL
SIG
NS
15
Ho
usi
ng
an
d C
om
mu
nit
y D
eve
lop
me
nt
Community Statistical Area (CSA)Total Residential Properties
2010 2011 2012 2013 2014 2015
Allendale/Irvington/S. Hilton 5,568 5,551 5,554 5,568 5,589 5,589Beechfield/Ten Hills/West Hills 3,557 3,575 3,599 3,599 3,612 3,612Belair-Edison 6,295 6,296 6,292 6,295 6,296 6,296Brooklyn/Curtis Bay/Hawkins Point 4,283 4,259 4,256 4,256 4,249 4,249Canton 4,013 4,017 4,025 4,024 4,033 4,033Cedonia/Frankford 6,294 6,290 6,286 6,290 6,285 6,285Cherry Hill 988 985 985 984 984 984Chinquapin Park/Belvedere 2,694 2,688 2,689 2,689 2,689 2,689Claremont/Armistead 725 755 745 752 2,267 2,267Clifton-Berea 4,783 4,756 4,738 4,723 4,675 4,675Cross-Country/Cheswolde 2,914 2,918 2,925 2,925 2,926 2,926Dickeyville/Franklintown 333 319 318 322 323 323Dorchester/Ashburton 3,421 3,421 3,419 3,424 3,422 3,422Downtown/Seton Hill 670 670 676 675 687 687Edmondson Village 2,843 2,835 2,832 2,832 2,831 2,831Fells Point 4,058 4,073 4,076 4,080 4,096 4,096
Forest Park/Walbrook 2,883 2,881 2,879 2,882 2,879 2,879
Glen-Fallstaff 3,691 3,685 3,685 3,686 3,719 3,719Greater Charles Village/Barclay 3,675 3,675 3,690 3,694 3,681 3,681Greater Govans 3,720 3,730 3,728 3,729 3,731 3,731Greater Mondawmin 3,439 3,437 3,432 3,434 3,444 3,444Greater Roland Park/Poplar Hill 3,030 3,020 3,021 3,023 3,023 3,023Greater Rosemont 7,267 7,212 7,189 7,164 7,133 7,133Greenmount East 4,100 4,087 4,059 4,071 4,088 4,088Hamilton 4,368 4,367 4,368 4,368 4,364 4,364Harbor East/Little Italy 1,596 1,595 1,695 1,695 1,698 1,698Harford/Echodale 5,076 5,045 5,047 5,054 5,050 5,050Highlandtown 3,163 3,168 3,168 3,169 3,211 3,211Howard Park/West Arlington 3,165 3,157 3,157 3,157 3,154 3,154Inner Harbor/Federal Hill 5,894 5,927 5,949 5,954 5,992 5,992Lauraville 4,480 4,474 4,478 4,479 4,475 4,475Loch Raven 4,229 4,230 4,231 4,231 4,228 4,228Madison/East End 3,220 3,445 3,212 3,238 3,237 3,237Medfield/Hampden/Woodberry/Remington 6,750 6,739 6,728 6,747 6,810 6,810Midtown 3,279 3,283 3,431 3,440 3,441 3,441Midway/Coldstream 4,176 4,161 4,151 4,148 4,118 4,118Morrell Park/Violetville 3,165 3,150 3,153 3,154 3,154 3,154Mt. Washington/Coldspring 1,825 1,822 1,827 1,827 1,830 1,830North Baltimore/Guilford/Homeland 5,099 5,093 5,089 5,092 5,095 5,095Northwood 4,670 4,670 4,669 4,667 4,667 4,667Oldtown/Middle East 1,423 1,430 1,430 1,445 1,499 1,499Orangeville/East Highlandtown 3,505 3,509 3,625 3,625 3,806 3,806Patterson Park North & East 6,342 6,347 6,359 6,365 6,377 6,377Penn North/Reservoir Hill 2,976 2,976 2,980 2,981 2,984 2,984Pimlico/Arlington/Hilltop 3,980 3,962 3,940 3,933 3,915 3,915Poppleton/The Terraces/Hollins Market 1,367 1,370 1,369 1,369 1,363 1,363Sandtown-Winchester/Harlem Park 6,076 6,079 6,070 6,064 6,057 6,057South Baltimore 3,307 3,311 3,374 3,373 3,387 3,387Southeastern 1,841 1,821 1,820 1,832 1,831 1,831Southern Park Heights 4,037 4,030 4,006 3,999 3,987 3,987Southwest Baltimore 8,243 8,254 8,227 8,217 8,252 8,252The Waverlies 2,692 2,692 2,690 2,690 2,690 2,690Upton/Druid Heights 2,179 2,159 2,153 2,156 2,163 2,163
Washington Village/Pigtown 2,752 2,758 2,760 2,759 2,777 2,777Westport/Mt. Winans/Lakeland 2,146 2,137 2,133 2,134 2,141 2,141Baltimore City 202,265 202,309 202,387 202,362 204,295 204,295
For more information on these indicators please visit http://www.bniajfi.org.
Housing and Community Development: Residential Properties
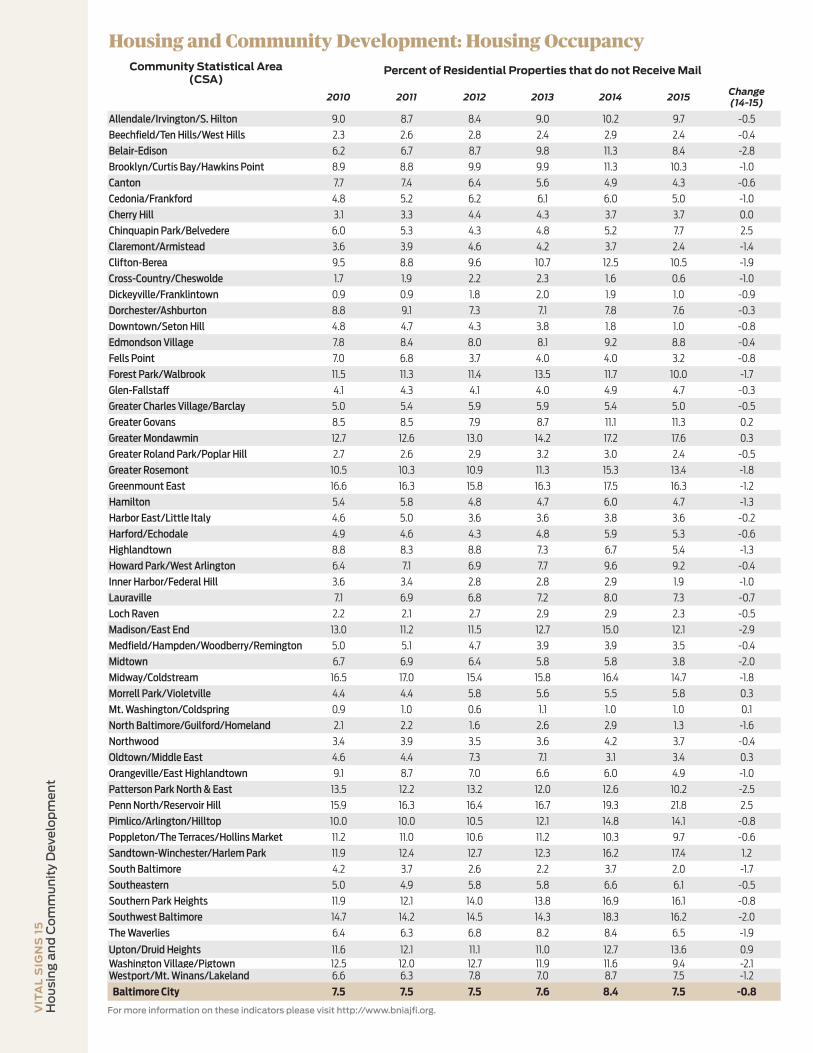
VIT
AL
SIG
NS
15
Ho
usi
ng
an
d C
om
mu
nit
y D
eve
lop
me
nt
Community Statistical Area (CSA)
Percent of Residential Properties that do not Receive Mail
2010 2011 2012 2013 2014 2015Change(14-15)
Allendale/Irvington/S. Hilton 9.0 8.7 8.4 9.0 10.2 9.7 -0.5Beechfield/Ten Hills/West Hills 2.3 2.6 2.8 2.4 2.9 2.4 -0.4Belair-Edison 6.2 6.7 8.7 9.8 11.3 8.4 -2.8Brooklyn/Curtis Bay/Hawkins Point 8.9 8.8 9.9 9.9 11.3 10.3 -1.0Canton 7.7 7.4 6.4 5.6 4.9 4.3 -0.6Cedonia/Frankford 4.8 5.2 6.2 6.1 6.0 5.0 -1.0Cherry Hill 3.1 3.3 4.4 4.3 3.7 3.7 0.0Chinquapin Park/Belvedere 6.0 5.3 4.3 4.8 5.2 7.7 2.5Claremont/Armistead 3.6 3.9 4.6 4.2 3.7 2.4 -1.4Clifton-Berea 9.5 8.8 9.6 10.7 12.5 10.5 -1.9Cross-Country/Cheswolde 1.7 1.9 2.2 2.3 1.6 0.6 -1.0Dickeyville/Franklintown 0.9 0.9 1.8 2.0 1.9 1.0 -0.9Dorchester/Ashburton 8.8 9.1 7.3 7.1 7.8 7.6 -0.3Downtown/Seton Hill 4.8 4.7 4.3 3.8 1.8 1.0 -0.8Edmondson Village 7.8 8.4 8.0 8.1 9.2 8.8 -0.4Fells Point 7.0 6.8 3.7 4.0 4.0 3.2 -0.8Forest Park/Walbrook 11.5 11.3 11.4 13.5 11.7 10.0 -1.7Glen-Fallstaff 4.1 4.3 4.1 4.0 4.9 4.7 -0.3Greater Charles Village/Barclay 5.0 5.4 5.9 5.9 5.4 5.0 -0.5Greater Govans 8.5 8.5 7.9 8.7 11.1 11.3 0.2Greater Mondawmin 12.7 12.6 13.0 14.2 17.2 17.6 0.3Greater Roland Park/Poplar Hill 2.7 2.6 2.9 3.2 3.0 2.4 -0.5Greater Rosemont 10.5 10.3 10.9 11.3 15.3 13.4 -1.8Greenmount East 16.6 16.3 15.8 16.3 17.5 16.3 -1.2Hamilton 5.4 5.8 4.8 4.7 6.0 4.7 -1.3Harbor East/Little Italy 4.6 5.0 3.6 3.6 3.8 3.6 -0.2Harford/Echodale 4.9 4.6 4.3 4.8 5.9 5.3 -0.6Highlandtown 8.8 8.3 8.8 7.3 6.7 5.4 -1.3Howard Park/West Arlington 6.4 7.1 6.9 7.7 9.6 9.2 -0.4Inner Harbor/Federal Hill 3.6 3.4 2.8 2.8 2.9 1.9 -1.0Lauraville 7.1 6.9 6.8 7.2 8.0 7.3 -0.7Loch Raven 2.2 2.1 2.7 2.9 2.9 2.3 -0.5Madison/East End 13.0 11.2 11.5 12.7 15.0 12.1 -2.9Medfield/Hampden/Woodberry/Remington 5.0 5.1 4.7 3.9 3.9 3.5 -0.4Midtown 6.7 6.9 6.4 5.8 5.8 3.8 -2.0Midway/Coldstream 16.5 17.0 15.4 15.8 16.4 14.7 -1.8Morrell Park/Violetville 4.4 4.4 5.8 5.6 5.5 5.8 0.3Mt. Washington/Coldspring 0.9 1.0 0.6 1.1 1.0 1.0 0.1North Baltimore/Guilford/Homeland 2.1 2.2 1.6 2.6 2.9 1.3 -1.6Northwood 3.4 3.9 3.5 3.6 4.2 3.7 -0.4Oldtown/Middle East 4.6 4.4 7.3 7.1 3.1 3.4 0.3Orangeville/East Highlandtown 9.1 8.7 7.0 6.6 6.0 4.9 -1.0Patterson Park North & East 13.5 12.2 13.2 12.0 12.6 10.2 -2.5Penn North/Reservoir Hill 15.9 16.3 16.4 16.7 19.3 21.8 2.5Pimlico/Arlington/Hilltop 10.0 10.0 10.5 12.1 14.8 14.1 -0.8Poppleton/The Terraces/Hollins Market 11.2 11.0 10.6 11.2 10.3 9.7 -0.6Sandtown-Winchester/Harlem Park 11.9 12.4 12.7 12.3 16.2 17.4 1.2South Baltimore 4.2 3.7 2.6 2.2 3.7 2.0 -1.7Southeastern 5.0 4.9 5.8 5.8 6.6 6.1 -0.5Southern Park Heights 11.9 12.1 14.0 13.8 16.9 16.1 -0.8Southwest Baltimore 14.7 14.2 14.5 14.3 18.3 16.2 -2.0The Waverlies 6.4 6.3 6.8 8.2 8.4 6.5 -1.9
Upton/Druid Heights 11.6 12.1 11.1 11.0 12.7 13.6 0.9Washington Village/Pigtown 12.5 12.0 12.7 11.9 11.6 9.4 -2.1Westport/Mt. Winans/Lakeland 6.6 6.3 7.8 7.0 8.7 7.5 -1.2
Baltimore City 7.5 7.5 7.5 7.6 8.4 7.5 -0.8
For more information on these indicators please visit http://www.bniajfi.org.
Housing and Community Development: Housing Occupancy
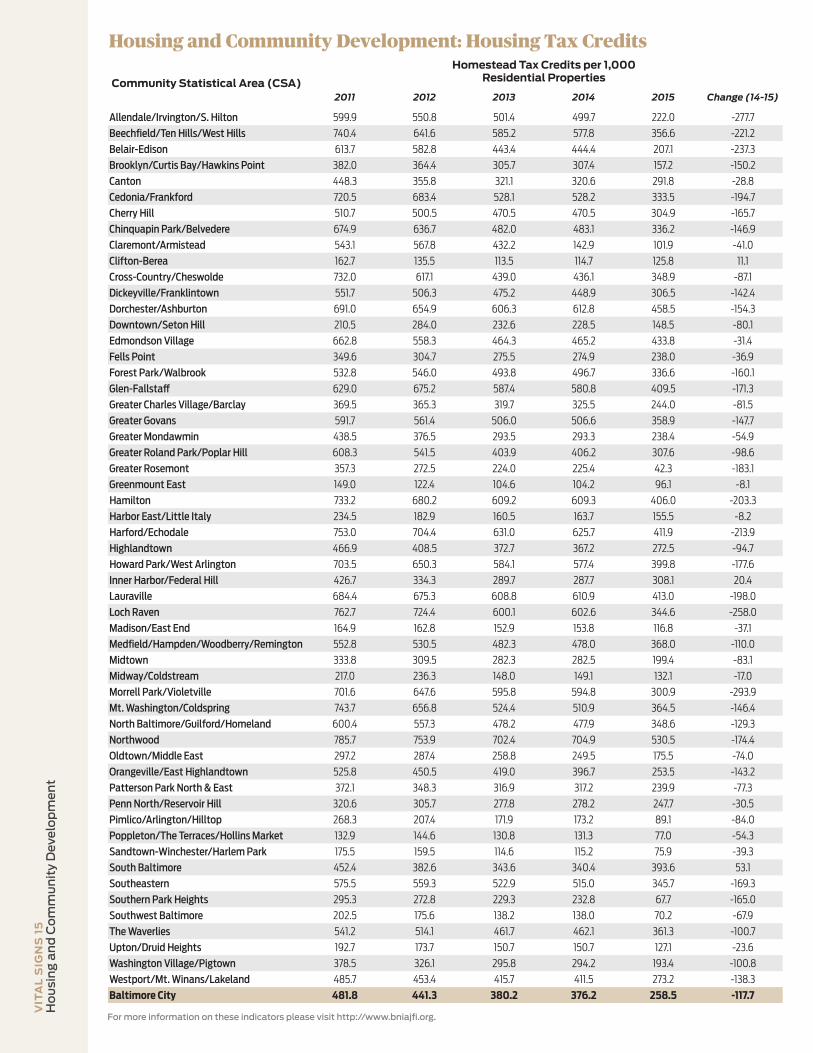
VIT
AL
SIG
NS
15
Ho
usi
ng
an
d C
om
mu
nit
y D
eve
lop
me
nt
For more information on these indicators please visit http://www.bniajfi.org.
Housing and Community Development: Housing Tax Credits
Community Statistical Area (CSA)
Homestead Tax Credits per 1,000Residential Properties
2011 2012 2013 2014 2015 Change (14-15)
Allendale/Irvington/S. Hilton 599.9 550.8 501.4 499.7 222.0 -277.7
Beechfield/Ten Hills/West Hills 740.4 641.6 585.2 577.8 356.6 -221.2
Belair-Edison 613.7 582.8 443.4 444.4 207.1 -237.3
Brooklyn/Curtis Bay/Hawkins Point 382.0 364.4 305.7 307.4 157.2 -150.2
Canton 448.3 355.8 321.1 320.6 291.8 -28.8
Cedonia/Frankford 720.5 683.4 528.1 528.2 333.5 -194.7
Cherry Hill 510.7 500.5 470.5 470.5 304.9 -165.7
Chinquapin Park/Belvedere 674.9 636.7 482.0 483.1 336.2 -146.9
Claremont/Armistead 543.1 567.8 432.2 142.9 101.9 -41.0
Clifton-Berea 162.7 135.5 113.5 114.7 125.8 11.1
Cross-Country/Cheswolde 732.0 617.1 439.0 436.1 348.9 -87.1
Dickeyville/Franklintown 551.7 506.3 475.2 448.9 306.5 -142.4
Dorchester/Ashburton 691.0 654.9 606.3 612.8 458.5 -154.3
Downtown/Seton Hill 210.5 284.0 232.6 228.5 148.5 -80.1
Edmondson Village 662.8 558.3 464.3 465.2 433.8 -31.4
Fells Point 349.6 304.7 275.5 274.9 238.0 -36.9
Forest Park/Walbrook 532.8 546.0 493.8 496.7 336.6 -160.1
Glen-Fallstaff 629.0 675.2 587.4 580.8 409.5 -171.3
Greater Charles Village/Barclay 369.5 365.3 319.7 325.5 244.0 -81.5
Greater Govans 591.7 561.4 506.0 506.6 358.9 -147.7
Greater Mondawmin 438.5 376.5 293.5 293.3 238.4 -54.9
Greater Roland Park/Poplar Hill 608.3 541.5 403.9 406.2 307.6 -98.6
Greater Rosemont 357.3 272.5 224.0 225.4 42.3 -183.1
Greenmount East 149.0 122.4 104.6 104.2 96.1 -8.1
Hamilton 733.2 680.2 609.2 609.3 406.0 -203.3
Harbor East/Little Italy 234.5 182.9 160.5 163.7 155.5 -8.2
Harford/Echodale 753.0 704.4 631.0 625.7 411.9 -213.9
Highlandtown 466.9 408.5 372.7 367.2 272.5 -94.7
Howard Park/West Arlington 703.5 650.3 584.1 577.4 399.8 -177.6
Inner Harbor/Federal Hill 426.7 334.3 289.7 287.7 308.1 20.4
Lauraville 684.4 675.3 608.8 610.9 413.0 -198.0
Loch Raven 762.7 724.4 600.1 602.6 344.6 -258.0
Madison/East End 164.9 162.8 152.9 153.8 116.8 -37.1
Medfield/Hampden/Woodberry/Remington 552.8 530.5 482.3 478.0 368.0 -110.0
Midtown 333.8 309.5 282.3 282.5 199.4 -83.1
Midway/Coldstream 217.0 236.3 148.0 149.1 132.1 -17.0
Morrell Park/Violetville 701.6 647.6 595.8 594.8 300.9 -293.9
Mt. Washington/Coldspring 743.7 656.8 524.4 510.9 364.5 -146.4
North Baltimore/Guilford/Homeland 600.4 557.3 478.2 477.9 348.6 -129.3
Northwood 785.7 753.9 702.4 704.9 530.5 -174.4
Oldtown/Middle East 297.2 287.4 258.8 249.5 175.5 -74.0
Orangeville/East Highlandtown 525.8 450.5 419.0 396.7 253.5 -143.2
Patterson Park North & East 372.1 348.3 316.9 317.2 239.9 -77.3
Penn North/Reservoir Hill 320.6 305.7 277.8 278.2 247.7 -30.5
Pimlico/Arlington/Hilltop 268.3 207.4 171.9 173.2 89.1 -84.0
Poppleton/The Terraces/Hollins Market 132.9 144.6 130.8 131.3 77.0 -54.3
Sandtown-Winchester/Harlem Park 175.5 159.5 114.6 115.2 75.9 -39.3
South Baltimore 452.4 382.6 343.6 340.4 393.6 53.1
Southeastern 575.5 559.3 522.9 515.0 345.7 -169.3
Southern Park Heights 295.3 272.8 229.3 232.8 67.7 -165.0
Southwest Baltimore 202.5 175.6 138.2 138.0 70.2 -67.9
The Waverlies 541.2 514.1 461.7 462.1 361.3 -100.7
Upton/Druid Heights 192.7 173.7 150.7 150.7 127.1 -23.6
Washington Village/Pigtown 378.5 326.1 295.8 294.2 193.4 -100.8
Westport/Mt. Winans/Lakeland 485.7 453.4 415.7 411.5 273.2 -138.3
Baltimore City 481.8 441.3 380.2 376.2 258.5 -117.7

VIT
AL
SIG
NS
15
Ho
usi
ng
an
d C
om
mu
nit
y D
eve
lop
me
nt
For more information on these indicators please visit http://www.bniajfi.org.
Housing and Community Development: Housing Tax Credits
Community Statistical Area (CSA)
Historic Tax Credits per 1,000Residential Properties
2012 2013 2014 2015 Change (14-15)
Allendale/Irvington/S. Hilton 0.0 0.0 0.0 0.0 0.0
Beechfield/Ten Hills/West Hills 0.6 0.6 0.6 0.8 0.3
Belair-Edison 0.0 0.0 0.0 0.2 0.2
Brooklyn/Curtis Bay/Hawkins Point 0.0 0.0 0.0 0.0 0.0
Canton 28.1 31.3 31.2 57.5 26.3
Cedonia/Frankford 0.0 0.0 0.0 0.0 0.0
Cherry Hill 0.0 0.0 0.0 0.0 0.0
Chinquapin Park/Belvedere 0.0 0.0 0.0 0.4 0.4
Claremont/Armistead 0.0 0.0 0.0 0.0 0.0
Clifton-Berea 0.2 0.0 0.0 0.4 0.4
Cross-Country/Cheswolde 0.3 0.3 0.3 0.3 0.0
Dickeyville/Franklintown 0.0 9.3 12.4 0.0 -12.4
Dorchester/Ashburton 0.0 0.0 0.0 0.3 0.3
Downtown/Seton Hill 59.2 50.4 50.9 49.5 -1.5
Edmondson Village 0.0 0.0 0.0 0.0 0.0
Fells Point 41.5 42.9 43.0 50.5 7.6
Forest Park/Walbrook 0.0 0.0 0.0 0.0 0.0
Glen-Fallstaff 0.0 0.0 0.0 0.0 0.0
Greater Charles Village/Barclay 12.7 16.5 16.6 19.6 3.0
Greater Govans 0.0 0.0 0.0 0.0 0.0
Greater Mondawmin 0.0 0.0 0.0 0.0 0.0
Greater Roland Park/Poplar Hill 7.6 6.9 7.3 6.3 -1.0
Greater Rosemont 0.0 0.0 0.0 0.0 0.0
Greenmount East 0.7 1.5 1.5 7.6 6.1
Hamilton 0.0 0.0 0.0 0.0 0.0
Harbor East/Little Italy 33.6 18.3 18.3 19.4 1.2
Harford/Echodale 0.0 0.0 0.0 0.0 0.0
Highlandtown 18.0 22.7 22.4 50.5 28.0
Howard Park/West Arlington 0.0 0.0 0.0 0.0 0.0
Inner Harbor/Federal Hill 14.3 16.1 16.4 21.7 5.3
Lauraville 0.4 0.4 0.4 0.7 0.2
Loch Raven 0.0 0.0 0.0 0.0 0.0
Madison/East End 2.5 4.9 4.9 9.0 4.0
Medfield/Hampden/Woodberry/Remington 1.6 1.8 1.9 8.2 6.3
Midtown 63.5 62.2 62.8 72.1 9.3
Midway/Coldstream 0.0 0.0 0.0 0.0 0.0
Morrell Park/Violetville 0.0 0.0 0.0 0.0 0.0
Mt. Washington/Coldspring 3.3 2.2 2.2 2.2 0.0
North Baltimore/Guilford/Homeland 2.9 3.3 3.3 3.3 0.0
Northwood 0.2 0.4 0.4 0.4 0.0
Oldtown/Middle East 9.8 11.1 11.3 44.7 33.4
Orangeville/East Highlandtown 1.1 1.1 1.1 1.1 0.0
Patterson Park North & East 25.8 29.7 29.6 59.7 30.1
Penn North/Reservoir Hill 20.8 21.1 21.1 21.4 0.3
Pimlico/Arlington/Hilltop 0.0 0.0 0.0 0.0 0.0
Poppleton/The Terraces/Hollins Market 28.5 29.9 30.1 36.7 6.6
Sandtown-Winchester/Harlem Park 0.2 0.5 0.5 0.7 0.2
South Baltimore 1.2 3.3 3.2 26.3 23.0
Southeastern 0.5 1.1 1.1 1.6 0.5
Southern Park Heights 0.0 0.3 0.3 0.5 0.3
Southwest Baltimore 4.0 3.9 3.9 5.6 1.7
The Waverlies 1.1 1.1 1.1 1.5 0.4
Upton/Druid Heights 0.0 5.6 6.0 10.2 4.2
Washington Village/Pigtown 4.0 11.2 11.9 13.0 1.1
Westport/Mt. Winans/Lakeland 12.2 0.0 0.0 0.0 0.0
Baltimore City 6.0 6.4 6.4 10.1 3.6
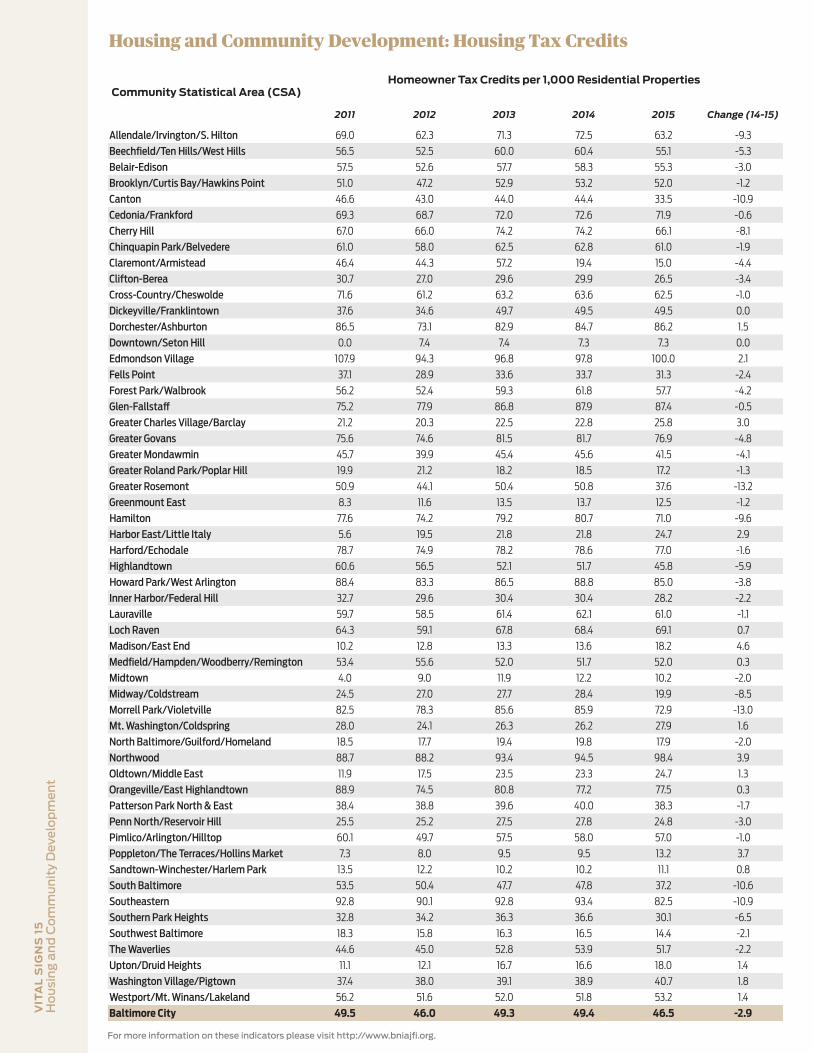
VIT
AL
SIG
NS
15
Ho
usi
ng
an
d C
om
mu
nit
y D
eve
lop
me
nt
For more information on these indicators please visit http://www.bniajfi.org.
Housing and Community Development: Housing Tax Credits
Community Statistical Area (CSA)Homeowner Tax Credits per 1,000 Residential Properties
2011 2012 2013 2014 2015 Change (14-15)
Allendale/Irvington/S. Hilton 69.0 62.3 71.3 72.5 63.2 -9.3
Beechfield/Ten Hills/West Hills 56.5 52.5 60.0 60.4 55.1 -5.3
Belair-Edison 57.5 52.6 57.7 58.3 55.3 -3.0
Brooklyn/Curtis Bay/Hawkins Point 51.0 47.2 52.9 53.2 52.0 -1.2
Canton 46.6 43.0 44.0 44.4 33.5 -10.9
Cedonia/Frankford 69.3 68.7 72.0 72.6 71.9 -0.6
Cherry Hill 67.0 66.0 74.2 74.2 66.1 -8.1
Chinquapin Park/Belvedere 61.0 58.0 62.5 62.8 61.0 -1.9
Claremont/Armistead 46.4 44.3 57.2 19.4 15.0 -4.4
Clifton-Berea 30.7 27.0 29.6 29.9 26.5 -3.4
Cross-Country/Cheswolde 71.6 61.2 63.2 63.6 62.5 -1.0
Dickeyville/Franklintown 37.6 34.6 49.7 49.5 49.5 0.0
Dorchester/Ashburton 86.5 73.1 82.9 84.7 86.2 1.5
Downtown/Seton Hill 0.0 7.4 7.4 7.3 7.3 0.0
Edmondson Village 107.9 94.3 96.8 97.8 100.0 2.1
Fells Point 37.1 28.9 33.6 33.7 31.3 -2.4
Forest Park/Walbrook 56.2 52.4 59.3 61.8 57.7 -4.2
Glen-Fallstaff 75.2 77.9 86.8 87.9 87.4 -0.5
Greater Charles Village/Barclay 21.2 20.3 22.5 22.8 25.8 3.0
Greater Govans 75.6 74.6 81.5 81.7 76.9 -4.8
Greater Mondawmin 45.7 39.9 45.4 45.6 41.5 -4.1
Greater Roland Park/Poplar Hill 19.9 21.2 18.2 18.5 17.2 -1.3
Greater Rosemont 50.9 44.1 50.4 50.8 37.6 -13.2
Greenmount East 8.3 11.6 13.5 13.7 12.5 -1.2
Hamilton 77.6 74.2 79.2 80.7 71.0 -9.6
Harbor East/Little Italy 5.6 19.5 21.8 21.8 24.7 2.9
Harford/Echodale 78.7 74.9 78.2 78.6 77.0 -1.6
Highlandtown 60.6 56.5 52.1 51.7 45.8 -5.9
Howard Park/West Arlington 88.4 83.3 86.5 88.8 85.0 -3.8
Inner Harbor/Federal Hill 32.7 29.6 30.4 30.4 28.2 -2.2
Lauraville 59.7 58.5 61.4 62.1 61.0 -1.1
Loch Raven 64.3 59.1 67.8 68.4 69.1 0.7
Madison/East End 10.2 12.8 13.3 13.6 18.2 4.6
Medfield/Hampden/Woodberry/Remington 53.4 55.6 52.0 51.7 52.0 0.3
Midtown 4.0 9.0 11.9 12.2 10.2 -2.0
Midway/Coldstream 24.5 27.0 27.7 28.4 19.9 -8.5
Morrell Park/Violetville 82.5 78.3 85.6 85.9 72.9 -13.0
Mt. Washington/Coldspring 28.0 24.1 26.3 26.2 27.9 1.6
North Baltimore/Guilford/Homeland 18.5 17.7 19.4 19.8 17.9 -2.0
Northwood 88.7 88.2 93.4 94.5 98.4 3.9
Oldtown/Middle East 11.9 17.5 23.5 23.3 24.7 1.3
Orangeville/East Highlandtown 88.9 74.5 80.8 77.2 77.5 0.3
Patterson Park North & East 38.4 38.8 39.6 40.0 38.3 -1.7
Penn North/Reservoir Hill 25.5 25.2 27.5 27.8 24.8 -3.0
Pimlico/Arlington/Hilltop 60.1 49.7 57.5 58.0 57.0 -1.0
Poppleton/The Terraces/Hollins Market 7.3 8.0 9.5 9.5 13.2 3.7
Sandtown-Winchester/Harlem Park 13.5 12.2 10.2 10.2 11.1 0.8
South Baltimore 53.5 50.4 47.7 47.8 37.2 -10.6
Southeastern 92.8 90.1 92.8 93.4 82.5 -10.9
Southern Park Heights 32.8 34.2 36.3 36.6 30.1 -6.5
Southwest Baltimore 18.3 15.8 16.3 16.5 14.4 -2.1
The Waverlies 44.6 45.0 52.8 53.9 51.7 -2.2
Upton/Druid Heights 11.1 12.1 16.7 16.6 18.0 1.4
Washington Village/Pigtown 37.4 38.0 39.1 38.9 40.7 1.8
Westport/Mt. Winans/Lakeland 56.2 51.6 52.0 51.8 53.2 1.4
Baltimore City 49.5 46.0 49.3 49.4 46.5 -2.9
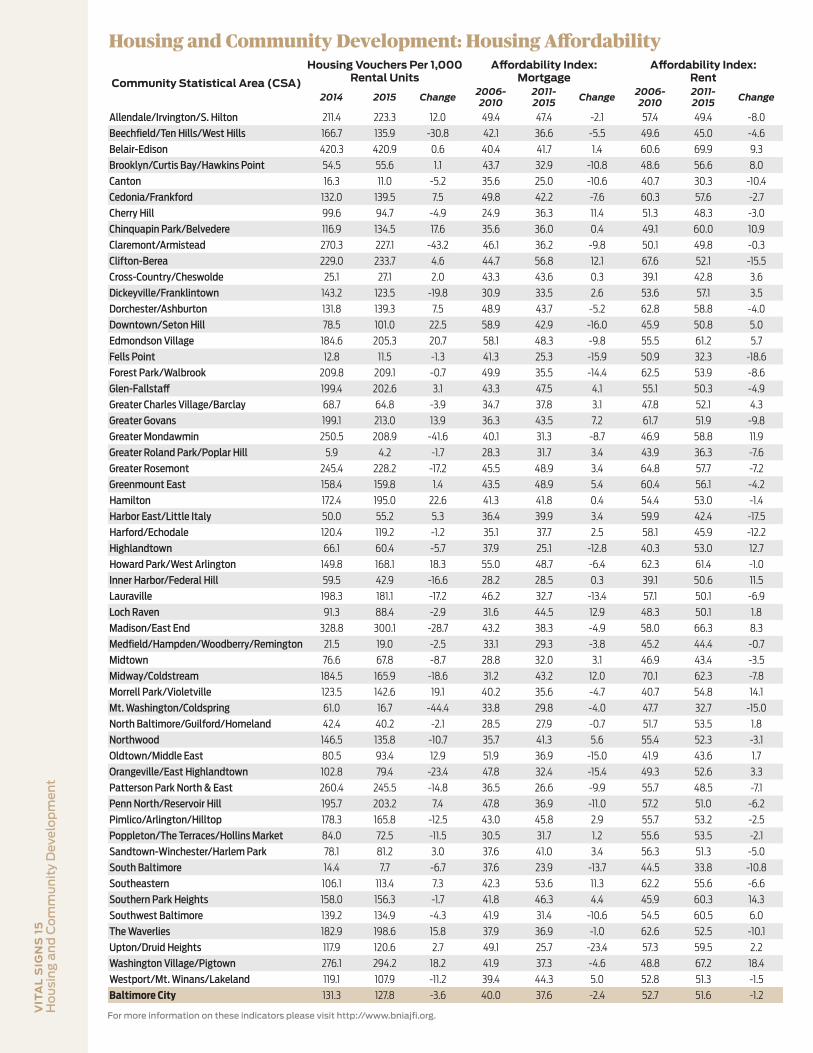
VIT
AL
SIG
NS
15
Ho
usi
ng
an
d C
om
mu
nit
y D
eve
lop
me
nt
For more information on these indicators please visit http://www.bniajfi.org.
Housing and Community Development: Housing Affordability
Community Statistical Area (CSA)
Housing Vouchers Per 1,000 Rental Units
Affordability Index:Mortgage
Affordability Index:Rent
2014 2015 Change2006-2010
2011-2015 Change
2006-2010
2011-2015 Change
Allendale/Irvington/S. Hilton 211.4 223.3 12.0 49.4 47.4 -2.1 57.4 49.4 -8.0
Beechfield/Ten Hills/West Hills 166.7 135.9 -30.8 42.1 36.6 -5.5 49.6 45.0 -4.6
Belair-Edison 420.3 420.9 0.6 40.4 41.7 1.4 60.6 69.9 9.3
Brooklyn/Curtis Bay/Hawkins Point 54.5 55.6 1.1 43.7 32.9 -10.8 48.6 56.6 8.0
Canton 16.3 11.0 -5.2 35.6 25.0 -10.6 40.7 30.3 -10.4
Cedonia/Frankford 132.0 139.5 7.5 49.8 42.2 -7.6 60.3 57.6 -2.7
Cherry Hill 99.6 94.7 -4.9 24.9 36.3 11.4 51.3 48.3 -3.0
Chinquapin Park/Belvedere 116.9 134.5 17.6 35.6 36.0 0.4 49.1 60.0 10.9
Claremont/Armistead 270.3 227.1 -43.2 46.1 36.2 -9.8 50.1 49.8 -0.3
Clifton-Berea 229.0 233.7 4.6 44.7 56.8 12.1 67.6 52.1 -15.5
Cross-Country/Cheswolde 25.1 27.1 2.0 43.3 43.6 0.3 39.1 42.8 3.6
Dickeyville/Franklintown 143.2 123.5 -19.8 30.9 33.5 2.6 53.6 57.1 3.5
Dorchester/Ashburton 131.8 139.3 7.5 48.9 43.7 -5.2 62.8 58.8 -4.0
Downtown/Seton Hill 78.5 101.0 22.5 58.9 42.9 -16.0 45.9 50.8 5.0
Edmondson Village 184.6 205.3 20.7 58.1 48.3 -9.8 55.5 61.2 5.7Fells Point 12.8 11.5 -1.3 41.3 25.3 -15.9 50.9 32.3 -18.6Forest Park/Walbrook 209.8 209.1 -0.7 49.9 35.5 -14.4 62.5 53.9 -8.6
Glen-Fallstaff 199.4 202.6 3.1 43.3 47.5 4.1 55.1 50.3 -4.9
Greater Charles Village/Barclay 68.7 64.8 -3.9 34.7 37.8 3.1 47.8 52.1 4.3
Greater Govans 199.1 213.0 13.9 36.3 43.5 7.2 61.7 51.9 -9.8
Greater Mondawmin 250.5 208.9 -41.6 40.1 31.3 -8.7 46.9 58.8 11.9
Greater Roland Park/Poplar Hill 5.9 4.2 -1.7 28.3 31.7 3.4 43.9 36.3 -7.6
Greater Rosemont 245.4 228.2 -17.2 45.5 48.9 3.4 64.8 57.7 -7.2
Greenmount East 158.4 159.8 1.4 43.5 48.9 5.4 60.4 56.1 -4.2
Hamilton 172.4 195.0 22.6 41.3 41.8 0.4 54.4 53.0 -1.4
Harbor East/Little Italy 50.0 55.2 5.3 36.4 39.9 3.4 59.9 42.4 -17.5
Harford/Echodale 120.4 119.2 -1.2 35.1 37.7 2.5 58.1 45.9 -12.2
Highlandtown 66.1 60.4 -5.7 37.9 25.1 -12.8 40.3 53.0 12.7
Howard Park/West Arlington 149.8 168.1 18.3 55.0 48.7 -6.4 62.3 61.4 -1.0
Inner Harbor/Federal Hill 59.5 42.9 -16.6 28.2 28.5 0.3 39.1 50.6 11.5
Lauraville 198.3 181.1 -17.2 46.2 32.7 -13.4 57.1 50.1 -6.9
Loch Raven 91.3 88.4 -2.9 31.6 44.5 12.9 48.3 50.1 1.8
Madison/East End 328.8 300.1 -28.7 43.2 38.3 -4.9 58.0 66.3 8.3
Medfield/Hampden/Woodberry/Remington 21.5 19.0 -2.5 33.1 29.3 -3.8 45.2 44.4 -0.7
Midtown 76.6 67.8 -8.7 28.8 32.0 3.1 46.9 43.4 -3.5
Midway/Coldstream 184.5 165.9 -18.6 31.2 43.2 12.0 70.1 62.3 -7.8
Morrell Park/Violetville 123.5 142.6 19.1 40.2 35.6 -4.7 40.7 54.8 14.1
Mt. Washington/Coldspring 61.0 16.7 -44.4 33.8 29.8 -4.0 47.7 32.7 -15.0
North Baltimore/Guilford/Homeland 42.4 40.2 -2.1 28.5 27.9 -0.7 51.7 53.5 1.8
Northwood 146.5 135.8 -10.7 35.7 41.3 5.6 55.4 52.3 -3.1
Oldtown/Middle East 80.5 93.4 12.9 51.9 36.9 -15.0 41.9 43.6 1.7
Orangeville/East Highlandtown 102.8 79.4 -23.4 47.8 32.4 -15.4 49.3 52.6 3.3
Patterson Park North & East 260.4 245.5 -14.8 36.5 26.6 -9.9 55.7 48.5 -7.1
Penn North/Reservoir Hill 195.7 203.2 7.4 47.8 36.9 -11.0 57.2 51.0 -6.2
Pimlico/Arlington/Hilltop 178.3 165.8 -12.5 43.0 45.8 2.9 55.7 53.2 -2.5
Poppleton/The Terraces/Hollins Market 84.0 72.5 -11.5 30.5 31.7 1.2 55.6 53.5 -2.1
Sandtown-Winchester/Harlem Park 78.1 81.2 3.0 37.6 41.0 3.4 56.3 51.3 -5.0
South Baltimore 14.4 7.7 -6.7 37.6 23.9 -13.7 44.5 33.8 -10.8
Southeastern 106.1 113.4 7.3 42.3 53.6 11.3 62.2 55.6 -6.6
Southern Park Heights 158.0 156.3 -1.7 41.8 46.3 4.4 45.9 60.3 14.3
Southwest Baltimore 139.2 134.9 -4.3 41.9 31.4 -10.6 54.5 60.5 6.0
The Waverlies 182.9 198.6 15.8 37.9 36.9 -1.0 62.6 52.5 -10.1
Upton/Druid Heights 117.9 120.6 2.7 49.1 25.7 -23.4 57.3 59.5 2.2
Washington Village/Pigtown 276.1 294.2 18.2 41.9 37.3 -4.6 48.8 67.2 18.4
Westport/Mt. Winans/Lakeland 119.1 107.9 -11.2 39.4 44.3 5.0 52.8 51.3 -1.5
Baltimore City 131.3 127.8 -3.6 40.0 37.6 -2.4 52.7 51.6 -1.2
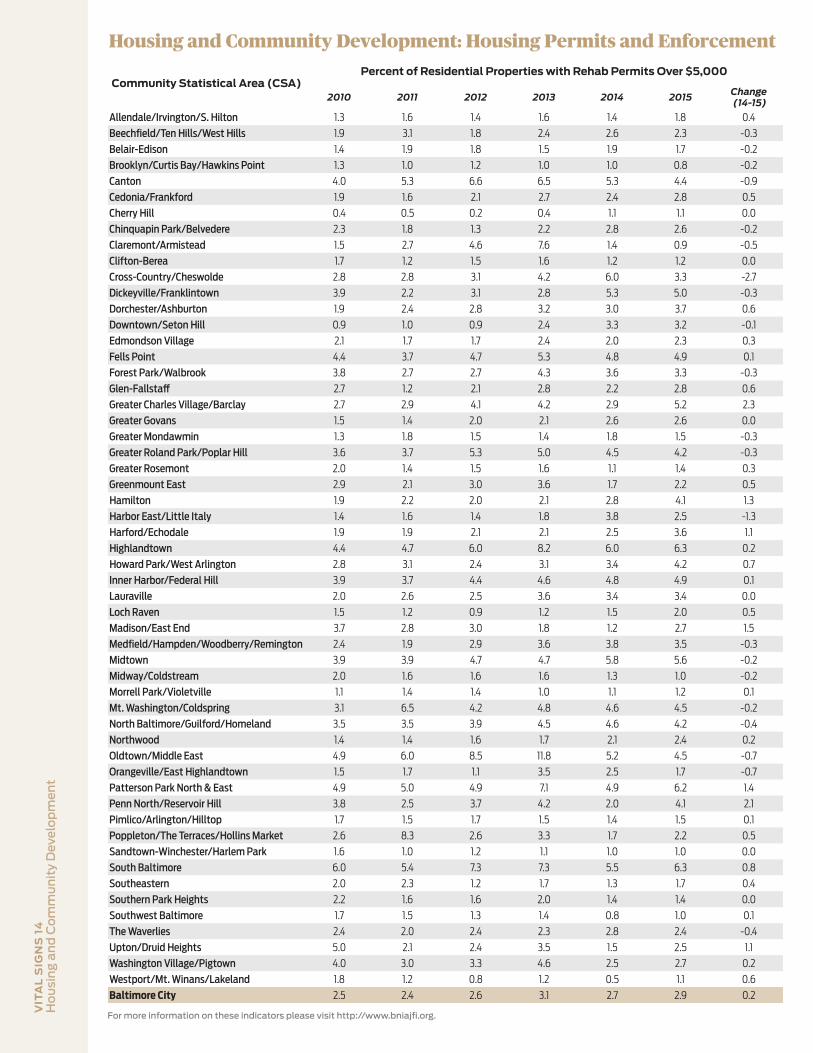
VIT
AL
SIG
NS
14
Ho
usi
ng
an
d C
om
mu
nit
y D
eve
lop
me
nt
For more information on these indicators please visit http://www.bniajfi.org.
Housing and Community Development: Housing Permits and Enforcement
Community Statistical Area (CSA)Percent of Residential Properties with Rehab Permits Over $5,000
2010 2011 2012 2013 2014 2015Change (14-15)
Allendale/Irvington/S. Hilton 1.3 1.6 1.4 1.6 1.4 1.8 0.4
Beechfield/Ten Hills/West Hills 1.9 3.1 1.8 2.4 2.6 2.3 -0.3
Belair-Edison 1.4 1.9 1.8 1.5 1.9 1.7 -0.2
Brooklyn/Curtis Bay/Hawkins Point 1.3 1.0 1.2 1.0 1.0 0.8 -0.2
Canton 4.0 5.3 6.6 6.5 5.3 4.4 -0.9
Cedonia/Frankford 1.9 1.6 2.1 2.7 2.4 2.8 0.5
Cherry Hill 0.4 0.5 0.2 0.4 1.1 1.1 0.0
Chinquapin Park/Belvedere 2.3 1.8 1.3 2.2 2.8 2.6 -0.2
Claremont/Armistead 1.5 2.7 4.6 7.6 1.4 0.9 -0.5
Clifton-Berea 1.7 1.2 1.5 1.6 1.2 1.2 0.0
Cross-Country/Cheswolde 2.8 2.8 3.1 4.2 6.0 3.3 -2.7
Dickeyville/Franklintown 3.9 2.2 3.1 2.8 5.3 5.0 -0.3
Dorchester/Ashburton 1.9 2.4 2.8 3.2 3.0 3.7 0.6
Downtown/Seton Hill 0.9 1.0 0.9 2.4 3.3 3.2 -0.1
Edmondson Village 2.1 1.7 1.7 2.4 2.0 2.3 0.3Fells Point 4.4 3.7 4.7 5.3 4.8 4.9 0.1Forest Park/Walbrook 3.8 2.7 2.7 4.3 3.6 3.3 -0.3
Glen-Fallstaff 2.7 1.2 2.1 2.8 2.2 2.8 0.6
Greater Charles Village/Barclay 2.7 2.9 4.1 4.2 2.9 5.2 2.3
Greater Govans 1.5 1.4 2.0 2.1 2.6 2.6 0.0
Greater Mondawmin 1.3 1.8 1.5 1.4 1.8 1.5 -0.3
Greater Roland Park/Poplar Hill 3.6 3.7 5.3 5.0 4.5 4.2 -0.3
Greater Rosemont 2.0 1.4 1.5 1.6 1.1 1.4 0.3
Greenmount East 2.9 2.1 3.0 3.6 1.7 2.2 0.5
Hamilton 1.9 2.2 2.0 2.1 2.8 4.1 1.3
Harbor East/Little Italy 1.4 1.6 1.4 1.8 3.8 2.5 -1.3
Harford/Echodale 1.9 1.9 2.1 2.1 2.5 3.6 1.1
Highlandtown 4.4 4.7 6.0 8.2 6.0 6.3 0.2
Howard Park/West Arlington 2.8 3.1 2.4 3.1 3.4 4.2 0.7
Inner Harbor/Federal Hill 3.9 3.7 4.4 4.6 4.8 4.9 0.1
Lauraville 2.0 2.6 2.5 3.6 3.4 3.4 0.0
Loch Raven 1.5 1.2 0.9 1.2 1.5 2.0 0.5
Madison/East End 3.7 2.8 3.0 1.8 1.2 2.7 1.5
Medfield/Hampden/Woodberry/Remington 2.4 1.9 2.9 3.6 3.8 3.5 -0.3
Midtown 3.9 3.9 4.7 4.7 5.8 5.6 -0.2
Midway/Coldstream 2.0 1.6 1.6 1.6 1.3 1.0 -0.2
Morrell Park/Violetville 1.1 1.4 1.4 1.0 1.1 1.2 0.1
Mt. Washington/Coldspring 3.1 6.5 4.2 4.8 4.6 4.5 -0.2
North Baltimore/Guilford/Homeland 3.5 3.5 3.9 4.5 4.6 4.2 -0.4
Northwood 1.4 1.4 1.6 1.7 2.1 2.4 0.2
Oldtown/Middle East 4.9 6.0 8.5 11.8 5.2 4.5 -0.7
Orangeville/East Highlandtown 1.5 1.7 1.1 3.5 2.5 1.7 -0.7
Patterson Park North & East 4.9 5.0 4.9 7.1 4.9 6.2 1.4
Penn North/Reservoir Hill 3.8 2.5 3.7 4.2 2.0 4.1 2.1
Pimlico/Arlington/Hilltop 1.7 1.5 1.7 1.5 1.4 1.5 0.1
Poppleton/The Terraces/Hollins Market 2.6 8.3 2.6 3.3 1.7 2.2 0.5
Sandtown-Winchester/Harlem Park 1.6 1.0 1.2 1.1 1.0 1.0 0.0
South Baltimore 6.0 5.4 7.3 7.3 5.5 6.3 0.8
Southeastern 2.0 2.3 1.2 1.7 1.3 1.7 0.4
Southern Park Heights 2.2 1.6 1.6 2.0 1.4 1.4 0.0
Southwest Baltimore 1.7 1.5 1.3 1.4 0.8 1.0 0.1
The Waverlies 2.4 2.0 2.4 2.3 2.8 2.4 -0.4
Upton/Druid Heights 5.0 2.1 2.4 3.5 1.5 2.5 1.1
Washington Village/Pigtown 4.0 3.0 3.3 4.6 2.5 2.7 0.2
Westport/Mt. Winans/Lakeland 1.8 1.2 0.8 1.2 0.5 1.1 0.6
Baltimore City 2.5 2.4 2.6 3.1 2.7 2.9 0.2
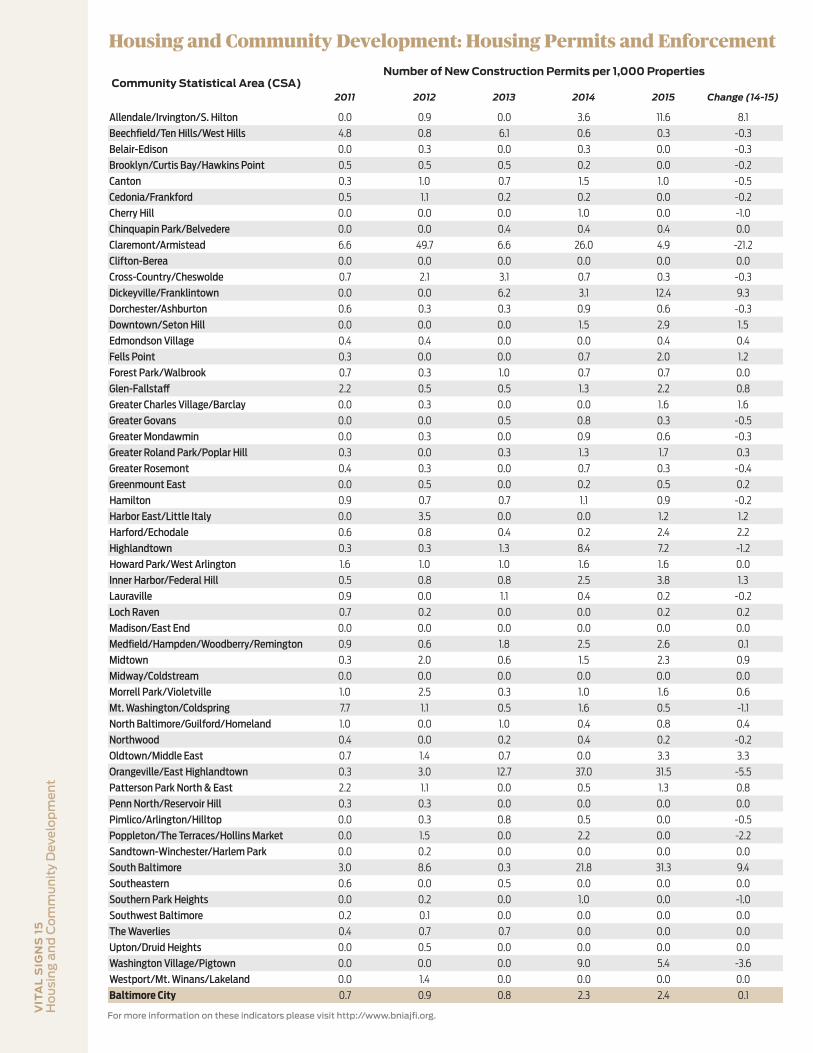
VIT
AL
SIG
NS
15
Ho
usi
ng
an
d C
om
mu
nit
y D
eve
lop
me
nt
For more information on these indicators please visit http://www.bniajfi.org.
Housing and Community Development: Housing Permits and Enforcement
Community Statistical Area (CSA)Number of New Construction Permits per 1,000 Properties
2011 2012 2013 2014 2015 Change (14-15)
Allendale/Irvington/S. Hilton 0.0 0.9 0.0 3.6 11.6 8.1
Beechfield/Ten Hills/West Hills 4.8 0.8 6.1 0.6 0.3 -0.3
Belair-Edison 0.0 0.3 0.0 0.3 0.0 -0.3
Brooklyn/Curtis Bay/Hawkins Point 0.5 0.5 0.5 0.2 0.0 -0.2
Canton 0.3 1.0 0.7 1.5 1.0 -0.5
Cedonia/Frankford 0.5 1.1 0.2 0.2 0.0 -0.2
Cherry Hill 0.0 0.0 0.0 1.0 0.0 -1.0
Chinquapin Park/Belvedere 0.0 0.0 0.4 0.4 0.4 0.0
Claremont/Armistead 6.6 49.7 6.6 26.0 4.9 -21.2
Clifton-Berea 0.0 0.0 0.0 0.0 0.0 0.0
Cross-Country/Cheswolde 0.7 2.1 3.1 0.7 0.3 -0.3
Dickeyville/Franklintown 0.0 0.0 6.2 3.1 12.4 9.3
Dorchester/Ashburton 0.6 0.3 0.3 0.9 0.6 -0.3
Downtown/Seton Hill 0.0 0.0 0.0 1.5 2.9 1.5
Edmondson Village 0.4 0.4 0.0 0.0 0.4 0.4Fells Point 0.3 0.0 0.0 0.7 2.0 1.2Forest Park/Walbrook 0.7 0.3 1.0 0.7 0.7 0.0
Glen-Fallstaff 2.2 0.5 0.5 1.3 2.2 0.8
Greater Charles Village/Barclay 0.0 0.3 0.0 0.0 1.6 1.6
Greater Govans 0.0 0.0 0.5 0.8 0.3 -0.5
Greater Mondawmin 0.0 0.3 0.0 0.9 0.6 -0.3
Greater Roland Park/Poplar Hill 0.3 0.0 0.3 1.3 1.7 0.3
Greater Rosemont 0.4 0.3 0.0 0.7 0.3 -0.4
Greenmount East 0.0 0.5 0.0 0.2 0.5 0.2
Hamilton 0.9 0.7 0.7 1.1 0.9 -0.2
Harbor East/Little Italy 0.0 3.5 0.0 0.0 1.2 1.2
Harford/Echodale 0.6 0.8 0.4 0.2 2.4 2.2
Highlandtown 0.3 0.3 1.3 8.4 7.2 -1.2
Howard Park/West Arlington 1.6 1.0 1.0 1.6 1.6 0.0
Inner Harbor/Federal Hill 0.5 0.8 0.8 2.5 3.8 1.3
Lauraville 0.9 0.0 1.1 0.4 0.2 -0.2
Loch Raven 0.7 0.2 0.0 0.0 0.2 0.2
Madison/East End 0.0 0.0 0.0 0.0 0.0 0.0
Medfield/Hampden/Woodberry/Remington 0.9 0.6 1.8 2.5 2.6 0.1
Midtown 0.3 2.0 0.6 1.5 2.3 0.9
Midway/Coldstream 0.0 0.0 0.0 0.0 0.0 0.0
Morrell Park/Violetville 1.0 2.5 0.3 1.0 1.6 0.6
Mt. Washington/Coldspring 7.7 1.1 0.5 1.6 0.5 -1.1
North Baltimore/Guilford/Homeland 1.0 0.0 1.0 0.4 0.8 0.4
Northwood 0.4 0.0 0.2 0.4 0.2 -0.2
Oldtown/Middle East 0.7 1.4 0.7 0.0 3.3 3.3
Orangeville/East Highlandtown 0.3 3.0 12.7 37.0 31.5 -5.5
Patterson Park North & East 2.2 1.1 0.0 0.5 1.3 0.8
Penn North/Reservoir Hill 0.3 0.3 0.0 0.0 0.0 0.0
Pimlico/Arlington/Hilltop 0.0 0.3 0.8 0.5 0.0 -0.5
Poppleton/The Terraces/Hollins Market 0.0 1.5 0.0 2.2 0.0 -2.2
Sandtown-Winchester/Harlem Park 0.0 0.2 0.0 0.0 0.0 0.0
South Baltimore 3.0 8.6 0.3 21.8 31.3 9.4
Southeastern 0.6 0.0 0.5 0.0 0.0 0.0
Southern Park Heights 0.0 0.2 0.0 1.0 0.0 -1.0
Southwest Baltimore 0.2 0.1 0.0 0.0 0.0 0.0
The Waverlies 0.4 0.7 0.7 0.0 0.0 0.0
Upton/Druid Heights 0.0 0.5 0.0 0.0 0.0 0.0
Washington Village/Pigtown 0.0 0.0 0.0 9.0 5.4 -3.6
Westport/Mt. Winans/Lakeland 0.0 1.4 0.0 0.0 0.0 0.0
Baltimore City 0.7 0.9 0.8 2.3 2.4 0.1
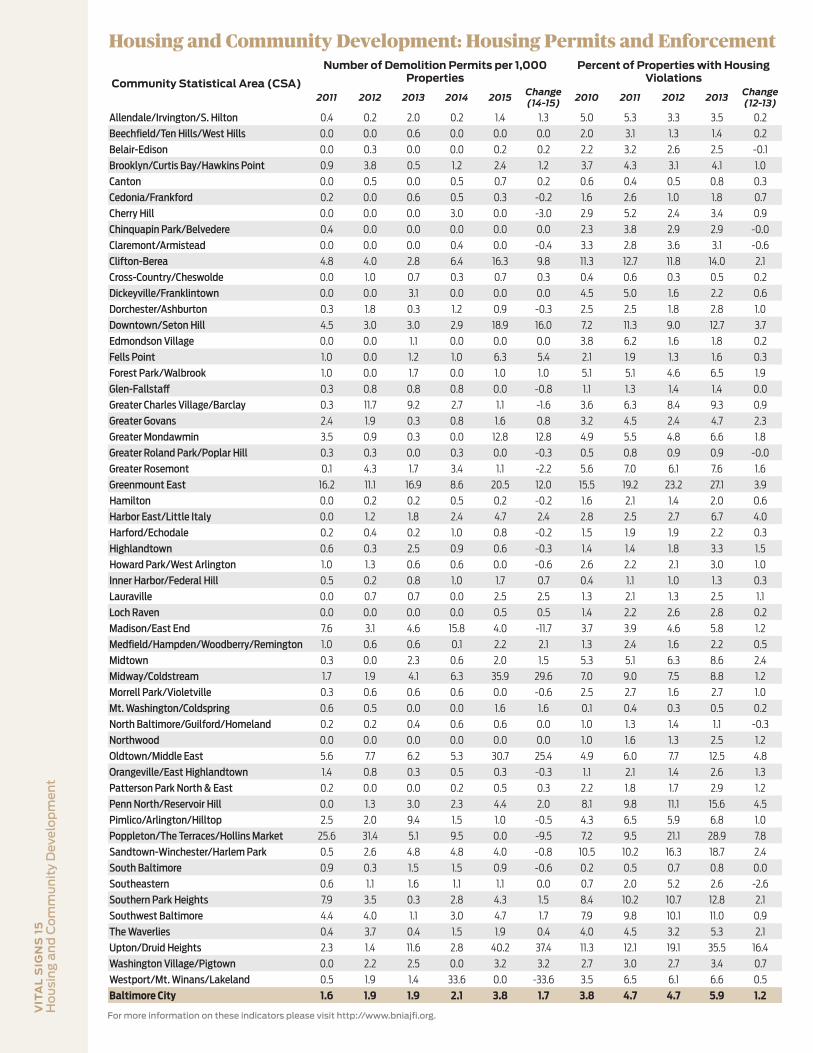
VIT
AL
SIG
NS
15
Ho
usi
ng
an
d C
om
mu
nit
y D
eve
lop
me
nt
For more information on these indicators please visit http://www.bniajfi.org.
Housing and Community Development: Housing Permits and Enforcement
Community Statistical Area (CSA)
Number of Demolition Permits per 1,000 Properties
Percent of Properties with HousingViolations
2011 2012 2013 2014 2015Change (14-15)
2010 2011 2012 2013Change (12-13)
Allendale/Irvington/S. Hilton 0.4 0.2 2.0 0.2 1.4 1.3 5.0 5.3 3.3 3.5 0.2
Beechfield/Ten Hills/West Hills 0.0 0.0 0.6 0.0 0.0 0.0 2.0 3.1 1.3 1.4 0.2
Belair-Edison 0.0 0.3 0.0 0.0 0.2 0.2 2.2 3.2 2.6 2.5 -0.1
Brooklyn/Curtis Bay/Hawkins Point 0.9 3.8 0.5 1.2 2.4 1.2 3.7 4.3 3.1 4.1 1.0
Canton 0.0 0.5 0.0 0.5 0.7 0.2 0.6 0.4 0.5 0.8 0.3
Cedonia/Frankford 0.2 0.0 0.6 0.5 0.3 -0.2 1.6 2.6 1.0 1.8 0.7
Cherry Hill 0.0 0.0 0.0 3.0 0.0 -3.0 2.9 5.2 2.4 3.4 0.9
Chinquapin Park/Belvedere 0.4 0.0 0.0 0.0 0.0 0.0 2.3 3.8 2.9 2.9 -0.0
Claremont/Armistead 0.0 0.0 0.0 0.4 0.0 -0.4 3.3 2.8 3.6 3.1 -0.6
Clifton-Berea 4.8 4.0 2.8 6.4 16.3 9.8 11.3 12.7 11.8 14.0 2.1
Cross-Country/Cheswolde 0.0 1.0 0.7 0.3 0.7 0.3 0.4 0.6 0.3 0.5 0.2
Dickeyville/Franklintown 0.0 0.0 3.1 0.0 0.0 0.0 4.5 5.0 1.6 2.2 0.6
Dorchester/Ashburton 0.3 1.8 0.3 1.2 0.9 -0.3 2.5 2.5 1.8 2.8 1.0
Downtown/Seton Hill 4.5 3.0 3.0 2.9 18.9 16.0 7.2 11.3 9.0 12.7 3.7
Edmondson Village 0.0 0.0 1.1 0.0 0.0 0.0 3.8 6.2 1.6 1.8 0.2
Fells Point 1.0 0.0 1.2 1.0 6.3 5.4 2.1 1.9 1.3 1.6 0.3
Forest Park/Walbrook 1.0 0.0 1.7 0.0 1.0 1.0 5.1 5.1 4.6 6.5 1.9
Glen-Fallstaff 0.3 0.8 0.8 0.8 0.0 -0.8 1.1 1.3 1.4 1.4 0.0
Greater Charles Village/Barclay 0.3 11.7 9.2 2.7 1.1 -1.6 3.6 6.3 8.4 9.3 0.9
Greater Govans 2.4 1.9 0.3 0.8 1.6 0.8 3.2 4.5 2.4 4.7 2.3
Greater Mondawmin 3.5 0.9 0.3 0.0 12.8 12.8 4.9 5.5 4.8 6.6 1.8
Greater Roland Park/Poplar Hill 0.3 0.3 0.0 0.3 0.0 -0.3 0.5 0.8 0.9 0.9 -0.0
Greater Rosemont 0.1 4.3 1.7 3.4 1.1 -2.2 5.6 7.0 6.1 7.6 1.6
Greenmount East 16.2 11.1 16.9 8.6 20.5 12.0 15.5 19.2 23.2 27.1 3.9
Hamilton 0.0 0.2 0.2 0.5 0.2 -0.2 1.6 2.1 1.4 2.0 0.6
Harbor East/Little Italy 0.0 1.2 1.8 2.4 4.7 2.4 2.8 2.5 2.7 6.7 4.0
Harford/Echodale 0.2 0.4 0.2 1.0 0.8 -0.2 1.5 1.9 1.9 2.2 0.3
Highlandtown 0.6 0.3 2.5 0.9 0.6 -0.3 1.4 1.4 1.8 3.3 1.5
Howard Park/West Arlington 1.0 1.3 0.6 0.6 0.0 -0.6 2.6 2.2 2.1 3.0 1.0
Inner Harbor/Federal Hill 0.5 0.2 0.8 1.0 1.7 0.7 0.4 1.1 1.0 1.3 0.3
Lauraville 0.0 0.7 0.7 0.0 2.5 2.5 1.3 2.1 1.3 2.5 1.1
Loch Raven 0.0 0.0 0.0 0.0 0.5 0.5 1.4 2.2 2.6 2.8 0.2
Madison/East End 7.6 3.1 4.6 15.8 4.0 -11.7 3.7 3.9 4.6 5.8 1.2
Medfield/Hampden/Woodberry/Remington 1.0 0.6 0.6 0.1 2.2 2.1 1.3 2.4 1.6 2.2 0.5
Midtown 0.3 0.0 2.3 0.6 2.0 1.5 5.3 5.1 6.3 8.6 2.4
Midway/Coldstream 1.7 1.9 4.1 6.3 35.9 29.6 7.0 9.0 7.5 8.8 1.2
Morrell Park/Violetville 0.3 0.6 0.6 0.6 0.0 -0.6 2.5 2.7 1.6 2.7 1.0
Mt. Washington/Coldspring 0.6 0.5 0.0 0.0 1.6 1.6 0.1 0.4 0.3 0.5 0.2
North Baltimore/Guilford/Homeland 0.2 0.2 0.4 0.6 0.6 0.0 1.0 1.3 1.4 1.1 -0.3
Northwood 0.0 0.0 0.0 0.0 0.0 0.0 1.0 1.6 1.3 2.5 1.2
Oldtown/Middle East 5.6 7.7 6.2 5.3 30.7 25.4 4.9 6.0 7.7 12.5 4.8
Orangeville/East Highlandtown 1.4 0.8 0.3 0.5 0.3 -0.3 1.1 2.1 1.4 2.6 1.3
Patterson Park North & East 0.2 0.0 0.0 0.2 0.5 0.3 2.2 1.8 1.7 2.9 1.2
Penn North/Reservoir Hill 0.0 1.3 3.0 2.3 4.4 2.0 8.1 9.8 11.1 15.6 4.5
Pimlico/Arlington/Hilltop 2.5 2.0 9.4 1.5 1.0 -0.5 4.3 6.5 5.9 6.8 1.0
Poppleton/The Terraces/Hollins Market 25.6 31.4 5.1 9.5 0.0 -9.5 7.2 9.5 21.1 28.9 7.8
Sandtown-Winchester/Harlem Park 0.5 2.6 4.8 4.8 4.0 -0.8 10.5 10.2 16.3 18.7 2.4
South Baltimore 0.9 0.3 1.5 1.5 0.9 -0.6 0.2 0.5 0.7 0.8 0.0
Southeastern 0.6 1.1 1.6 1.1 1.1 0.0 0.7 2.0 5.2 2.6 -2.6
Southern Park Heights 7.9 3.5 0.3 2.8 4.3 1.5 8.4 10.2 10.7 12.8 2.1
Southwest Baltimore 4.4 4.0 1.1 3.0 4.7 1.7 7.9 9.8 10.1 11.0 0.9
The Waverlies 0.4 3.7 0.4 1.5 1.9 0.4 4.0 4.5 3.2 5.3 2.1
Upton/Druid Heights 2.3 1.4 11.6 2.8 40.2 37.4 11.3 12.1 19.1 35.5 16.4
Washington Village/Pigtown 0.0 2.2 2.5 0.0 3.2 3.2 2.7 3.0 2.7 3.4 0.7
Westport/Mt. Winans/Lakeland 0.5 1.9 1.4 33.6 0.0 -33.6 3.5 6.5 6.1 6.6 0.5
Baltimore City 1.6 1.9 1.9 2.1 3.8 1.7 3.8 4.7 4.7 5.9 1.2
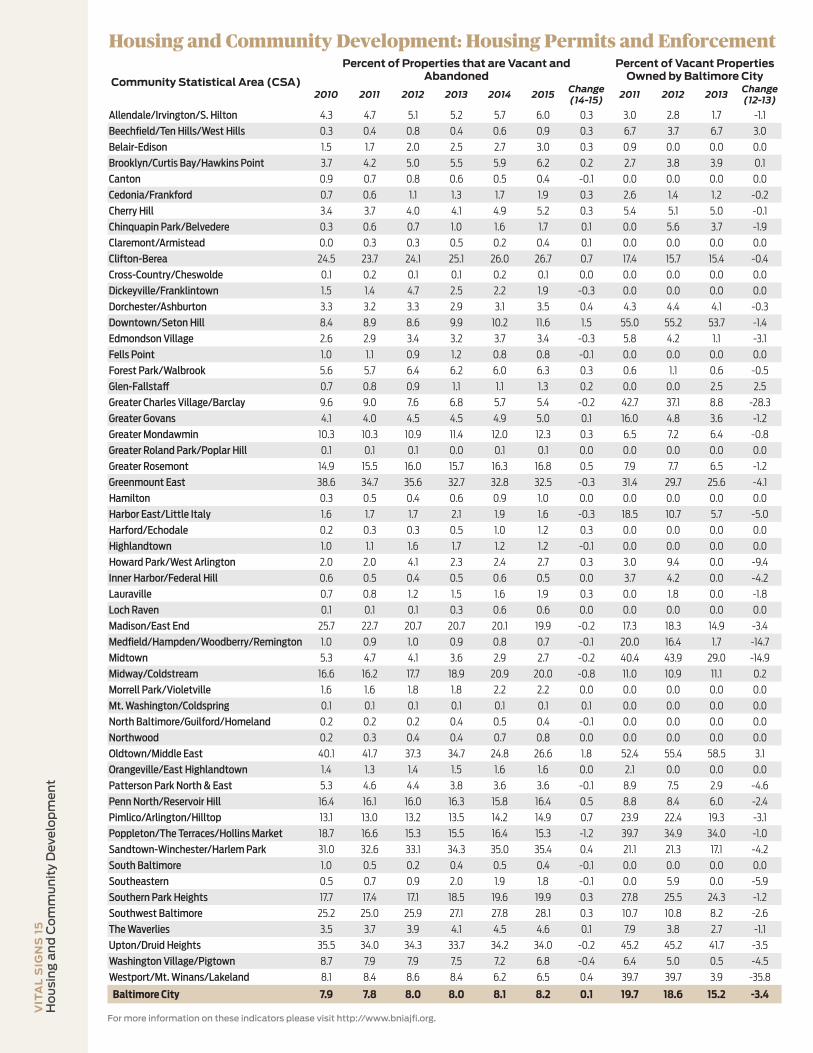
VIT
AL
SIG
NS
15
Ho
usi
ng
an
d C
om
mu
nit
y D
eve
lop
me
nt
Community Statistical Area (CSA)
Percent of Properties that are Vacant andAbandoned
Percent of Vacant Properties Owned by Baltimore City
2010 2011 2012 2013 2014 2015Change (14-15)
2011 2012 2013 Change (12-13)
Allendale/Irvington/S. Hilton 4.3 4.7 5.1 5.2 5.7 6.0 0.3 3.0 2.8 1.7 -1.1
Beechfield/Ten Hills/West Hills 0.3 0.4 0.8 0.4 0.6 0.9 0.3 6.7 3.7 6.7 3.0
Belair-Edison 1.5 1.7 2.0 2.5 2.7 3.0 0.3 0.9 0.0 0.0 0.0
Brooklyn/Curtis Bay/Hawkins Point 3.7 4.2 5.0 5.5 5.9 6.2 0.2 2.7 3.8 3.9 0.1
Canton 0.9 0.7 0.8 0.6 0.5 0.4 -0.1 0.0 0.0 0.0 0.0
Cedonia/Frankford 0.7 0.6 1.1 1.3 1.7 1.9 0.3 2.6 1.4 1.2 -0.2
Cherry Hill 3.4 3.7 4.0 4.1 4.9 5.2 0.3 5.4 5.1 5.0 -0.1
Chinquapin Park/Belvedere 0.3 0.6 0.7 1.0 1.6 1.7 0.1 0.0 5.6 3.7 -1.9
Claremont/Armistead 0.0 0.3 0.3 0.5 0.2 0.4 0.1 0.0 0.0 0.0 0.0
Clifton-Berea 24.5 23.7 24.1 25.1 26.0 26.7 0.7 17.4 15.7 15.4 -0.4
Cross-Country/Cheswolde 0.1 0.2 0.1 0.1 0.2 0.1 0.0 0.0 0.0 0.0 0.0
Dickeyville/Franklintown 1.5 1.4 4.7 2.5 2.2 1.9 -0.3 0.0 0.0 0.0 0.0
Dorchester/Ashburton 3.3 3.2 3.3 2.9 3.1 3.5 0.4 4.3 4.4 4.1 -0.3
Downtown/Seton Hill 8.4 8.9 8.6 9.9 10.2 11.6 1.5 55.0 55.2 53.7 -1.4
Edmondson Village 2.6 2.9 3.4 3.2 3.7 3.4 -0.3 5.8 4.2 1.1 -3.1
Fells Point 1.0 1.1 0.9 1.2 0.8 0.8 -0.1 0.0 0.0 0.0 0.0
Forest Park/Walbrook 5.6 5.7 6.4 6.2 6.0 6.3 0.3 0.6 1.1 0.6 -0.5
Glen-Fallstaff 0.7 0.8 0.9 1.1 1.1 1.3 0.2 0.0 0.0 2.5 2.5
Greater Charles Village/Barclay 9.6 9.0 7.6 6.8 5.7 5.4 -0.2 42.7 37.1 8.8 -28.3
Greater Govans 4.1 4.0 4.5 4.5 4.9 5.0 0.1 16.0 4.8 3.6 -1.2
Greater Mondawmin 10.3 10.3 10.9 11.4 12.0 12.3 0.3 6.5 7.2 6.4 -0.8
Greater Roland Park/Poplar Hill 0.1 0.1 0.1 0.0 0.1 0.1 0.0 0.0 0.0 0.0 0.0
Greater Rosemont 14.9 15.5 16.0 15.7 16.3 16.8 0.5 7.9 7.7 6.5 -1.2
Greenmount East 38.6 34.7 35.6 32.7 32.8 32.5 -0.3 31.4 29.7 25.6 -4.1
Hamilton 0.3 0.5 0.4 0.6 0.9 1.0 0.0 0.0 0.0 0.0 0.0
Harbor East/Little Italy 1.6 1.7 1.7 2.1 1.9 1.6 -0.3 18.5 10.7 5.7 -5.0
Harford/Echodale 0.2 0.3 0.3 0.5 1.0 1.2 0.3 0.0 0.0 0.0 0.0
Highlandtown 1.0 1.1 1.6 1.7 1.2 1.2 -0.1 0.0 0.0 0.0 0.0
Howard Park/West Arlington 2.0 2.0 4.1 2.3 2.4 2.7 0.3 3.0 9.4 0.0 -9.4
Inner Harbor/Federal Hill 0.6 0.5 0.4 0.5 0.6 0.5 0.0 3.7 4.2 0.0 -4.2
Lauraville 0.7 0.8 1.2 1.5 1.6 1.9 0.3 0.0 1.8 0.0 -1.8
Loch Raven 0.1 0.1 0.1 0.3 0.6 0.6 0.0 0.0 0.0 0.0 0.0
Madison/East End 25.7 22.7 20.7 20.7 20.1 19.9 -0.2 17.3 18.3 14.9 -3.4
Medfield/Hampden/Woodberry/Remington 1.0 0.9 1.0 0.9 0.8 0.7 -0.1 20.0 16.4 1.7 -14.7
Midtown 5.3 4.7 4.1 3.6 2.9 2.7 -0.2 40.4 43.9 29.0 -14.9
Midway/Coldstream 16.6 16.2 17.7 18.9 20.9 20.0 -0.8 11.0 10.9 11.1 0.2
Morrell Park/Violetville 1.6 1.6 1.8 1.8 2.2 2.2 0.0 0.0 0.0 0.0 0.0
Mt. Washington/Coldspring 0.1 0.1 0.1 0.1 0.1 0.1 0.1 0.0 0.0 0.0 0.0
North Baltimore/Guilford/Homeland 0.2 0.2 0.2 0.4 0.5 0.4 -0.1 0.0 0.0 0.0 0.0
Northwood 0.2 0.3 0.4 0.4 0.7 0.8 0.0 0.0 0.0 0.0 0.0
Oldtown/Middle East 40.1 41.7 37.3 34.7 24.8 26.6 1.8 52.4 55.4 58.5 3.1
Orangeville/East Highlandtown 1.4 1.3 1.4 1.5 1.6 1.6 0.0 2.1 0.0 0.0 0.0
Patterson Park North & East 5.3 4.6 4.4 3.8 3.6 3.6 -0.1 8.9 7.5 2.9 -4.6
Penn North/Reservoir Hill 16.4 16.1 16.0 16.3 15.8 16.4 0.5 8.8 8.4 6.0 -2.4
Pimlico/Arlington/Hilltop 13.1 13.0 13.2 13.5 14.2 14.9 0.7 23.9 22.4 19.3 -3.1
Poppleton/The Terraces/Hollins Market 18.7 16.6 15.3 15.5 16.4 15.3 -1.2 39.7 34.9 34.0 -1.0
Sandtown-Winchester/Harlem Park 31.0 32.6 33.1 34.3 35.0 35.4 0.4 21.1 21.3 17.1 -4.2
South Baltimore 1.0 0.5 0.2 0.4 0.5 0.4 -0.1 0.0 0.0 0.0 0.0
Southeastern 0.5 0.7 0.9 2.0 1.9 1.8 -0.1 0.0 5.9 0.0 -5.9
Southern Park Heights 17.7 17.4 17.1 18.5 19.6 19.9 0.3 27.8 25.5 24.3 -1.2
Southwest Baltimore 25.2 25.0 25.9 27.1 27.8 28.1 0.3 10.7 10.8 8.2 -2.6
The Waverlies 3.5 3.7 3.9 4.1 4.5 4.6 0.1 7.9 3.8 2.7 -1.1
Upton/Druid Heights 35.5 34.0 34.3 33.7 34.2 34.0 -0.2 45.2 45.2 41.7 -3.5
Washington Village/Pigtown 8.7 7.9 7.9 7.5 7.2 6.8 -0.4 6.4 5.0 0.5 -4.5
Westport/Mt. Winans/Lakeland 8.1 8.4 8.6 8.4 6.2 6.5 0.4 39.7 39.7 3.9 -35.8
Baltimore City 7.9 7.8 8.0 8.0 8.1 8.2 0.1 19.7 18.6 15.2 -3.4
For more information on these indicators please visit http://www.bniajfi.org.
Housing and Community Development: Housing Permits and Enforcement
Baltimore Neighborhood Indicator Alliance – Jacob France Institute University of Baltimore 1420 North Charles Street Baltimore, Maryland 21201
20
W E B :
E M A I L :
F A C E B O O K :
T W I T T E R :
bniajfi.org [email protected] facebook.com/bniajfi @bniajfi
Baltimore Neighborhood Indicator Alliance – Jacob France Institute University of Baltimore 1420 North Charles Street Baltimore, Maryland 21201
bniajfi.org [email protected] facebook.com/bniajfi @bniajfi
W E B :
E M A I L :
F A C E B O O K :
T W I T T E R :
SPRING 2017
15


![Chapter 246-215 WAC FOOD SERVICE RULE REVISION DRAFT …...WAC 246‐215 Rule Revision Draft for Comment [ 1 ] 12‐31‐19](https://img.pdfslide.us/doc/110x75/5e91ea25c5c6d758ac6cfecc/chapter-246-215-wac-food-service-rule-revision-draft-wac-246a215-rule-revision.jpg)