Embed Size (px)
Citation preview

COMMUNITY SAFETY AND SMALL ARMS IN SOMALILAND
About the Organisations
Danish Demining Group (DDG)
DDG is a Humanitarian Mine Action Unit in the Danish Refugee Council (DRC), a non-profit
organisation that works worldwide to help and protect refugees, internally displaced- and other
conflict-affected persons. DDG’s mission is to recreate an environment free from the threat of
landmines, unexploded ordnances, other remnants of war and small arms and light weapons; an
environment where people can live safely and have access to their land. DDG works to enable
post-conflict communities to (re)gain access to their assets and support the efforts of
governments, relief- and development organisations to enable recovery and community transition
into social and economic development. DDG’s work is based on the ethical standards and
humanitarian values of DRC; humanity, respect for human rights, neutrality and independence
towards the environments where we work, participation of those we help and transparency
towards all stakeholders.
Danish Demining Group
C/o Danish Refugee Council Borgergade 10, 3rd floor
DK-1300 Copenhagen K.
Denmark
Tel: +45 3373 5000
E-mail: [email protected]
Web site: www.drc.dk & www.danishdemininggroup.dk
The Small Arms Survey (SAS)
The Small Arms Survey is an independent research project located at the Graduate Institute of
International Studies in Geneva, Switzerland. It serves as the principal international source of
public information on all aspects of small arms and as a resource for governments, policy-makers,
researchers, and activists. The project has an international staff with expertise in security studies,
political science, international public policy, law, economics, development studies, conflict
resolution, and sociology. The staff works closely with a worldwide network of researchers and
partners. The Small Arms Survey is located at the Graduate Institute of International Studies,
Geneva, Switzerland. They can be reached at the following address:
Small Arms Survey
Avenue Blanc 47
1202 Geneva
Switzerland
Tel. + 41 22 908 5777
E-mail: [email protected]
Web site: www.smallarmssurvey.org
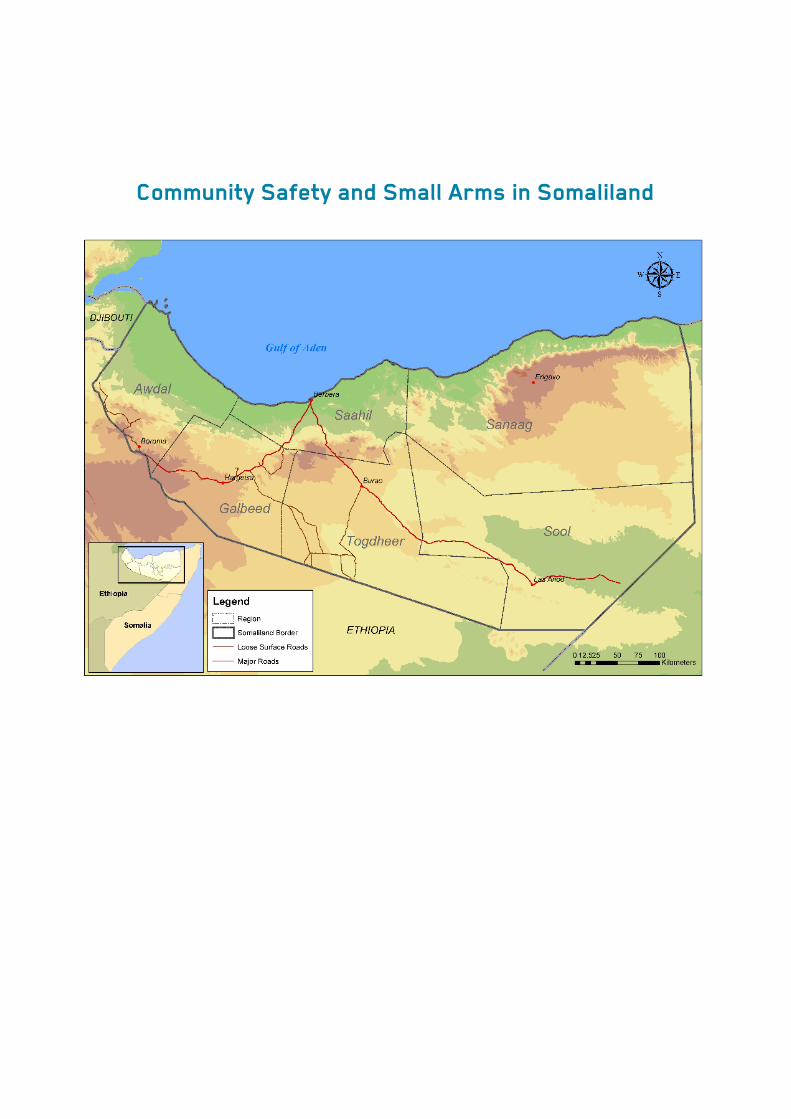
Community Safety and Small Arms in Somaliland

Acknowledgements
This report is based on field research undertaken by DDG’s Somaliland staff between August 2008
and August 2009.
Report writing and analysis: Ed Hughes, Survey and Data Advisor, DDG, and Karina Lynge,
Programme Manager, DDG
Statistical analysis: Ryan J. Murray, Statistical Analyst, Small Arms Survey
Editorial assistance: Bodil Jacobsen and Pi Tauber from DDG
Data collection: Ayan Mahamed, Ahmed, Idiris Abdi Hirsi, Hodan Mahamed and Nasir Awil Yusuf
from the DDG Somaliland survey team
Undertaking research in Somaliland is not without challenges and the survey could not have been
completed without the cooperation and support of the communities it involved, who must be thanked
for their openness and hospitality. The DDG ammunition disposal team also deserve mention for the
many months they spent in the field collecting questionnaires. The Ministry of Interior was kind
enough to facilitate interviews with police staff and provide central level interviews for the report. We
are also grateful to all the people who offered us their views and support during the course of this
project, including Mohammed Ali from Hornpeace and Mohamed Mohamud from UNDP for providing
comments for selected sections of the report, Nathaniel Williams from the HALO Trust for assisting
with compilation of maps and our DRC and DDG colleagues for their support. Along with many
others, these contributions were invaluable in shaping the final product.
The report has been produced with the financial assistance of Sida and the Netherlands’ Government
(NG). The views expressed in the report may not reflect the official opinion of Sida and NG.
While every effort has been made to objectively interpret the results from the survey, any errors of
fact or interpretation are the sole responsibility of the research team.

Table of Contents List of Tables; .............................................................................................................................................. I
List of Maps; ................................................................................................................................................ I
List of Figures; ............................................................................................................................................ II
List of Figures; ............................................................................................................................................ II
Glossary .................................................................................................................................................... III
Acronyms .................................................................................................................................................. III
Key Definitions .......................................................................................................................................... IV
Executive Summary .................................................................................................................................. VI
Chapter 1 Introduction ................................................................................................................................ 1
Chapter 2 Methodology .............................................................................................................................. 2
2.1 Sampling .......................................................................................................................................... 2
2.2 Data collection methods.................................................................................................................. 4
2.2.1 Household questionnaires .................................................................................................... 4
2.2.2 Incident reports ..................................................................................................................... 6
2.2.3 Traditional leaders grouped interviews ................................................................................. 7
2.2.4 Focus group interviews ......................................................................................................... 7
2.2.5 Key informant interviews ....................................................................................................... 8
2.3 Challenges and constraints encountered during the survey .......................................................... 8
Chapter 3 Somaliland Historical Context .................................................................................................... 9
3.1 The colonial era ............................................................................................................................... 9
3.2 The greater Somalia ........................................................................................................................ 9
3.3 Rebellion against central rule ........................................................................................................ 10
3.4 Civil conflict ................................................................................................................................... 10
Chapter 4 Perceptions of Safety and Security in Somaliland ................................................................... 12
4.1 How safe is Somaliland? ............................................................................................................... 12
4.2 Key security concerns ................................................................................................................... 14
4.3 Conclusions on perceptions of safety and security ...................................................................... 17
Chapter 5 Disputes and Crime in Somaliland ........................................................................................... 18
5.1 Disputes ......................................................................................................................................... 18
5.2 Crime in Somaliland ...................................................................................................................... 21
5.3 Conclusions on disputes and crimes ............................................................................................ 26
Chapter 6 Security Providers in Somaliland ............................................................................................. 27
6.1 Reporting Crime ............................................................................................................................ 27
6.2 Seeking support in disputes .......................................................................................................... 29
6.3 Who solves disputes and crimes? ................................................................................................ 31
6.4 Assessing the performance of security providers ......................................................................... 33
6.5 Trust in security providers (average satisfaction level 69%) ......................................................... 34
6.6 Efficiency of security providers (average satisfaction level 60%) ................................................. 36
6.7 Accessibility of security providers (average satisfaction level 60%) ............................................. 37
6.8 Familiarity with Security Providers (average satisfaction level 54.7%) ......................................... 39
6.9 Transparency of Security Providers (53.7%) ................................................................................. 40
6.10 Conclusions ................................................................................................................................. 41

Chapter 7 Legal and Policy Framework relating to SALW and ERW ........................................................ 43
7.1 SALW Ownership .......................................................................................................................... 43
7.2 Voluntary Licensing and Registration of SALW ............................................................................ 44
7.3 Trading, Manufacture and Conversion of Weapons ..................................................................... 44
7.4 Explosive Remnants of War Ownership ........................................................................................ 44
7.5 International Obligations................................................................................................................ 45
7.6 Conclusions on legal framework pertaining to SALW and ERW .................................................. 45
Chapter 8 Import and Export of Weapons ................................................................................................ 46
Chapter 9 ERW Ownership ....................................................................................................................... 48
9.1 Who owns ERW in Somaliland? .................................................................................................... 48
9.2 Where are ERW owners most prevalent? ..................................................................................... 49
9.3 Why do people own ERW? ........................................................................................................... 50
9.4 Conclusions on ERW ownership ................................................................................................... 52
Chapter 10 SALW Ownership ................................................................................................................... 53
10.1 Ownership Levels ........................................................................................................................ 53
10.2 Owner Profile ............................................................................................................................... 54
10.3 Reasons for owning / not owning small arms ............................................................................. 56
10.4 Registration of Small arms .......................................................................................................... 58
10.5 Conclusions on small arms ownership ....................................................................................... 59
Chapter 11 Perceptions, Acquisition and Impact of Small arms .............................................................. 60
11.1 Perceptions of small arms ........................................................................................................... 60
11.2 Acquisition of small arms ............................................................................................................ 62
11.3 The Impact of small arms on individuals and communities ........................................................ 64
11.4 Conclusions on perceptions, acquisition and impact of small arms .......................................... 65
Chapter 12 Conclusions ........................................................................................................................... 66
List of annexes; Annex A - Key Informant Interviews
Annex B - Data Collection Timeframe
Annex C - DDG Somaliland Community Household Questionnaire
Annex D - Crime Incident Report
Annex E - SALW Accident Report
Annex F - SALW Threat Report
Annex G - Interview guide for grouped interviews with traditional leaders on community level
Annex H - Interview guide for focus groups
I
List of Tables; Table 1 - Settlement size and suggested sample numbers .......................................................................... 3
Table 2 - Data collection methods, targets and collection rate .................................................................... 4
Table 3 - Sample characteristics ................................................................................................................... 6
Table 4 - Main security concerns of respondents ....................................................................................... 14
Table 5 - Primary security concerns by urban/rural location ...................................................................... 16
Table 6 - Most common disputes ............................................................................................................... 18
Table 7 - Most common disputes by setting .............................................................................................. 19
Table 8 - Most common disputes by region from household survey ......................................................... 20
Table 9 - Crimes occurring in 12 months in 130 communities cited by traditional leaders ....................... 22
Table 10 - Armed violence statistics from police interviews ....................................................................... 23
Table 11 - Who would you inform if you saw or experienced a crime (region)? ......................................... 29
Table 12 - Who would you go to for a solution if you saw or experienced a dispute? .............................. 30
Table 13 - Why do you own ERW? ............................................................................................................. 51
Table 14 - Reasons for owning ERW by region .......................................................................................... 51
Table 15 - Types of SALW in private ownership (from household survey) ................................................. 56
Table 16 - Reasons for small arms ownership ............................................................................................ 56
Table 17 - Reasons for small arms ownership – by clan affiliation and urban/rural ................................... 57
Table 18 - Knowledge of small arms voluntary licence and registration scheme ...................................... 59
Table 19 - Perceptions of small arms (by region)........................................................................................ 61
Table 20 - Are there too many small arms in your community? ................................................................. 62
Table 21 - Acquiring small arms .................................................................................................................. 62
Table 22 - Acquiring small arms (by region) ................................................................................................ 63
Table 23 - Proportions of owning households experiencing small arms thefts (by region) ........................ 64
List of Maps; Map 1 - Communities surveyed across Somaliland ..................................................................................... 3
Map 2 - Hotspots for disputes (districts)..................................................................................................... 21
Map 3 - Hotspots for crime (districts) ......................................................................................................... 25
Map 4 - ERW Ownership in Somaliland (household level) .......................................................................... 50
Map 5 - SALW Ownership in Somaliland (household level) ........................................................................ 54

II
List of Figures; Figure 1 - Assessing community safety and security situation ................................................................... 12
Figure 2 - Victims of crime and small arms threats..................................................................................... 24
Figure 3 - Who would you inform if you saw or experienced a crime? ...................................................... 28
Figure 4 - Who would you inform if you saw or experienced a crime (age)? .............................................. 28
Figure 5 - Who would you inform if you saw or experienced a crime (urban/rural)? .................................. 29
Figure 6 - Who would you go to for a solution to a dispute?...................................................................... 30
Figure 7 - Who would you go to for a solution to a dispute (urban/rural)? ................................................. 30
Figure 8 - How do you rate security providers on dealing with crime and disputes? ................................ 33
Figure 9 - Overall attitudes and perceptions of security providers ............................................................. 33
Figure 10 - Average trust in security providers by income ......................................................................... 35
Figure 11 - Average trust in security providers by region ........................................................................... 35
Figure 12 - Average efficiency rankings for security providers by age group ............................................ 36
Figure 13 - Security providers scores for efficiency by region ................................................................... 37
Figure 14 - Average accessibility rating for security providers by urban/rural setting .............................. 37
Figure 15 - Income and access to police services ...................................................................................... 38
Figure 16 - Accessibility of security providers by region ............................................................................ 39
Figure 17 - Familiarity of security providers by region ................................................................................ 40
Figure 18 - Transparency of security providers (by age) ............................................................................ 40
Figure 19 - Transparency of security providers by region .......................................................................... 41
Figure 20 - Small arms owners in Somaliland ............................................................................................. 54
Figure 21 - Income and SALW ownership .................................................................................................. 55
Figure 22 - Reasons for not owning small arms ......................................................................................... 58
Figure 23 - Perceptions of small arms ........................................................................................................ 60

III
Glossary Small differences in definition can dramatically alter the understanding of concepts in community safety.
For this reason, key definitions central to this report and the wider field of community safety have been
included along with the acronyms used to ensure all readers approach this report in the same way.
Acronyms AVR – Armed Violence Reduction
DDG – Danish Demining Group
DRC – Danish Refugee Council
EOD – Explosive Ordinance Disposal
ERW – Explosive Remnants of War
FCA – Finnish Church Aid
GPS – Global Positioning Satellite (for marking geographic locations)
MoI – Ministry of Interior
NGO – Non Governmental Organisation
NPHMA – National Policy for Humanitarian Mine Action
RPG – Rocket Propelled Grenade
SALW – Small Arms and Light Weapons
SNM – Somali National Movement
UNDP – United Nations Development Programme

IV
Key Definitions
Community is used in this report to denote the individual areas in which data was collected for the
household survey. Hence this could include a single ‘community’ in a rural area but also ‘communities’ in
a larger urban zone. In the data collection tools, the word ‘village’ was used to avoid possible ethnic or
clan connotations in the translation but for the purpose of this report, community is understood as a
more appropriate term in English but note that it is not used to denote any ethnic or clan background,
only geographic zones.
Community Safety is used in this report as a term to describe the security environment experienced by
one or more communities in relation to freedom from the fear of psychological or physical violence, more
specifically:
Threats from the state (political instability, oppression etc.)
Threats from other states (war, mass migrations etc.)
Threats from other groups of people (clan tension etc.)
Threats from gangs (crime, street violence etc.)
Threats from individuals (crime, street violence etc.)
Threats against women (rape, domestic violence, forced marriage etc.)
Threats against children based on their dependence and vulnerability (child abuse, baby
abandonment etc.)
Threats to self (or from others) (drugs, alcohol, khat etc)
Accident related threats (mines, ERW, traffic, small arms etc.)
Threats from nature (wild animals, natural disasters etc.)
In this context, safety is understood to be the personal feeling relating to the above threats, whilst
security refers to a more general level of security that the state is responsible for providing. In relation to
interventions, “community safety” may also be used as a catch-all term to describe a range of
programmatic activities designed to positively influence communities’ security environments.
Explosive Remnants of War are understood as all types of conventional munitions containing explosives,
excluding mines and booby-trapped devices that have remained in the public sphere after the cessation
of hostilities in a conflict area. They can include unexploded ordinance such as mortar bombs which
failed to detonate on impact but may also include abandoned ordinance like unused artillery shells left
behind by retreating government forces. This understanding does not however encompass landmines
unless abandoned in a safe state.
Crime refers to any illegal action carried out by individuals or groups towards someone else. This
includes, but is not limited to, assaults, beatings, sexual assaults, domestic violence, child abuse, theft,
killing, robbery, drugs distribution, looting public property etc.
Dispute refers to any quarrel about ownership or usage of various resources, criminal activity, amount
and payment of compensation etc. between individuals, groups or clans.
Light Weapons are understood in this report to include man-portable crew-operated weapon systems
such as grenade launchers, portable anti-tank guns, recoilless rifles and mortars of less than 100mm
calibre.

V
Violent encounter refers to an incident in which any physical or psychological force or power is used with
or without weapons between individuals, groups or clans. This also includes domestic violence.
Personal Safety and Security means freedom from the fear of experiencing psychological or physical
harm caused by the state, other states, clans, gangs, individuals, mines, ERWs, small arms, drugs and
natural threats. In this context, safety is understood to be the personal feeling relating to the above
threats, whilst security refers to a more general level of security that the state is responsible for providing.
Security Providers are state or non-state institutions that contribute directly to the safety and security of
the population by working with parts of Somaliland’s three existing judicial systems on immediate tasks
such as crime prevention, dispute mediation and conflict resolution. Formal and non-formal are used to
differentiate between police and other providers.
Small Arms are understood in this report to include weapons for individual use, including pistols and
revolvers, bolt-action rifles, semi automatic and automatic assault rifles and light machine guns. In the
data collection tools the term ‘firearm’ was used as a more recognised translation.
Significance is used as a term in this report to underline important and meaningful findings. Some of
these significant findings are also ‘statistically significant’, in that they identify findings that are unlikely to
have occurred by chance. Such statistical significances will only be explicitly identified as such if it adds
to the explanation or understanding of the related findings.
Urban was defined for the purposes of this survey as being the communities that made up the six
regional capitals and also the communities making up the town of Gabilay. Rural was defined by a
process of exclusion, as all the remaining communities sampled.

VI
Executive Summary Between August 2008 and August 2009, data was collected and analysed across Somaliland in order to
improve understanding of community safety and small arms and light weapons in Somaliland. Data has
been collected from 157 communities in 32 districts and the data set includes a total of 2846 household
questionnaires and 281 focus group and key informant interviews with key players in the field of
community safety, such as the police, civil society organisations, the UN and traditional and religious
leaders. The publication is a joint effort by DDG and the Small Arms Survey.
The findings of the survey are presented in this report along with contextual interpretations of the results
and information that may be of use to practitioners. For the purposes of this summary and because of
the representativeness of the data sample, the results from the household survey have been generalised
for the whole population and percentages have been rounded to the nearest whole number to facilitate
reading. Please note that the use of the word communities in this summary does not include any ethnic
or clan connotations.
Perceptions of Safety and Security in Somaliland
• 97% of people in Somaliland consider their communities safe. 53% of people think the security
situation has improved over the past year; only 2% believe the situation has deteriorated.
• As age increases, so too does peoples’ sense of safety; although this may be partially explained
by the most common age group for crime victims being 20-29 years old.
• Despite perceiving their communities as safe, 30% of the population fear they or a member of
their household may be the victim of a violent crime.
• 51 households admitted that one of their household members had been a victim of a violent
crime or encounter in the last year. Using an official population figure of 3.5 million and a UNDP
average household size of 5.79, it is possible to extrapolate this figure to estimate there may
have been 11,000 victims of violent crime within 12 months.
• The most serious security concern of the population is crime and street violence perpetrated by
gangs or individuals, followed by accidents involving ERW, SALW and traffic, clan conflict,
domestic and sexual violence and the self-harm caused by drugs, alcohol and khat.
• Urban populations are more concerned with internal state insecurity and self-harm from
drugs/alcohol/khat; rural communities are more concerned about clan conflict and accidents
caused by ERW/SALW/Traffic.
Disputes and Crime in Somaliland
• The population perceives disputes over compensation, criminal activity and farms as the most
common types occurring. Data suggests farm disputes (29% of total incidents cited in grouped
traditional leaders interviews in 130 communities) and land title disputes (28% of total incidents
in the same sample) are most common in reality, with emphasis in reported incidents on
resource-related disputes.
• Disputes over land titles and compensation are considered much more common by urban
populations. Rural communities see disputes over farms and grazing areas as more common.
• Armed robbery, assault and homicide accounted for 41% of crimes reported in 130 communities.
Rape, domestic abuse and child abuse together accounted for a further 36% of the crimes.
• No incidents of gang-related violence were reported with only 6 of 31 police stations interviewed
saying their districts had a gang problem, indicating this security concern may be more of a
perception rather than a reality.

VII
Security Providers in Somaliland
• 99% of people would inform someone if they saw or experienced a crime and 98% of people
would go to someone for a solution if they saw or experienced a dispute.
• 71% of people reporting a crime would go to the police, while 26% would go to traditional
leaders, with the remaining 3% accounted for by religious leaders, the military, family, etc.
• To seek a solution to a dispute, 55% of people would go to the police, 39% would go to
traditional leaders, with the remaining 6% accounted for by religious leaders, the military, family,
etc.
• Urban communities and richer people are more likely to turn to the police than poorer people and
rural populations, who prefer to use traditional leaders to deal with crime and disputes.
• Security providers were rated on a scale of 0 to 4, where 0 is 0% satisfaction and 4 is 100%
satisfaction on trust, efficiency, accessibility, familiarity and transparency. Traditional leaders
scored highest in all categories with an average score in percentage terms of 71% followed by
police in all categories (63%) and religious leaders (48%).
• Accessibility and efficiency have a significant influence on levels of trust in security providers;
improving accessibility and efficiency increases the level of trust the population has in them.
• Police are trusted by all sections of the population and are the primary security provider of
choice, although lack of geographical coverage sometimes leaves other actors to fill the gap.
• Traditional leaders are seen as the first security provider after the police, particularly in the area
of negotiation surrounding disputes and are sometimes left to deal with certain crimes by the
police.
• Religious leaders seem to be security enablers rather than security providers. They offer
educated and impartial religious council as well as arbitration services when both parties agree
to them, sometimes at the direction of the police or courts, but they do not engage directly in
solving crime or disputes. Their skills and competencies are complementary to those of the
traditional leaders and police.
Legal and Policy Framework relating to SALW and ERW
• Personal firearms are technically regulated under the old 1963 Public Order Law of the Republic
of Somalia until a new firearm registration bill currently under debate becomes law.
• The Ministry of Interior has started implementing a registration scheme based on the terms of the
draft bill. The scheme is voluntary and allows for all weapons of a similar calibre or smaller to that
of the AK47 assault rifle, including pistols, to be registered for private ownership, with one
magazine of ammunition.
• ERW are regulated by the 1963 Public Order Law as well as Law No 70/95 passed in 1995 by the
Somaliland government and are further restricted by articles in the draft small arms registration
bill. It is thus extremely unlikely individuals could legally own ERW.
• As an internationally unrecognised state, Somaliland is still considered legally part of the territory
of the Republic of Somalia and is hence covered by a UN arms embargo on the region, which
prevents the government importing or exporting any SALW.
Import and Export of Weapons
• According to Somaliland law, importers of SALW must be authorised by the Ministry of Interior.
In practice, private businessmen import weapons of all kinds discretely but more or less at will.
• Imported weapons are destined for Somaliland’s domestic market but also for transhipment to
other regions, including eastern Ethiopia and south central Somalia.
• There is evidence to suggest that in the event of heightened tensions, private businessmen can
upscale their supplies to meet rising demand, which could escalate any future conflict.
VIII
• The government is unable to easily re-equip its police and armed forces because of the UN arms
embargo. As a result, most policemen and soldiers enlist with their own weapons, store them at
home and take them away with them when their service ends.
ERW Ownership
• About 12% of households own ERW.
• Based on a government population figure of 3.5 million and a UNDP average household size in
Somalia of 5.79, 12% ERW ownership is equivalent to 70,000 households across Somaliland.
• The highest concentrations of private ERW owners are in Sool region, where 34% of households
admit to owning ERW. In Awdal region only 2% of households own ERW.
• 52% of the ERW owners claim to keep ERW with future violence in mind, whether it be (primarily)
for protection of their community, clan, family or property - or for potential future offensive use.
• The single biggest reason for ERW ownership is simply that the ERW are left over from the war
(41%).
• In general more ERW owners in Sanaag, Sool and Togdheer own ERW for reasons of protection
than in the other three regions of Awdal, Galbeed and Saahil.
Small arms Ownership
• 74% of households own small arms, with an average of 1.27 small arms per household.
• Based on a government population figure of 3.5 million and a UNDP estimate of household size
in Somalia of 5.79, the number of small arms in private ownership in Somaliland may be over
500,000.
• Small arms ownership is by far highest in Sool (89.5%) and lowest in Saahil region (41.1%).
• 73% of the small arms in private ownership in Somaliland are AK-47 automatic rifles, while 12%
are pistols/revolvers followed by 7% M16 automatic rifles.
• The typical small arms owner in Somaliland is male and above 20 years of age. He is also often
from a middle or high-income household and more likely from a majority clan than a minority
clan.
• People are most likely to own small arms for reasons of protection, with biggest emphasis on
protection from other persons (46%) followed by protection from wildlife (15%) and protection of
property (14%) while only 8% state that they own it for work (although protection from wildlife
may also be work-related for pastoralists).
• People are most likely not to own small arms because they don’t like guns (39%) or because they
can’t afford them (30%). Only 16% of non-owners said they don’t own small arms because they
are dangerous for their family or their community.
• 44% of small arms-owning households have heard of the Ministry of Interior’s voluntary licence
and registration scheme, with the lowest level of awareness in Awdal, Sanaag and Galbeed
regions.
• 70% of small arms owners say they would be willing to voluntarily register and licence their small
arms.
IX
Perceptions, Acquisition and Impact of Small arms
• 79% of the population perceive small arms as a threat to safety
• 19% of the population perceive small arms as normal and desirable with middle aged and older
men more likely to find small arms desirable than women or young people
• 1/3 of the population find that they can easily acquire small arms should they want to do so. The
most common way to acquire small arms is on the black market, often via brokers
• 16% of households experienced the theft of small arms in the last year; equivalent to nearly
100,000 small arms thefts a year – perhaps indicating another common way to acquire small
arms
• It is easiest to acquire small arms in Sool region and hardest in Saahil region
• The percentage of people who think that there are too many small arms in their community is
highest in Sool and Togdheer with around 80% and lowest in Saahil with around 34%
• 36 out of the 2846 questionnaire respondents had experienced a small arms related accident
within their household in the last 12 months; with a population of 3.5 million and an average
household size of 5.79 persons this is equivalent to around 7,500 accidents a year across
Somaliland
• Despite the high incidence of armed violence and the large number of SALW accidents, the
impact of SALW on communities is not well understood; traditional leaders in 89% of
communities surveyed said that SALW did not have any impact on people’s daily lives and
livelihoods
Conclusions
• The population is currently experiencing a satisfactory level of security but still have security
concerns surrounding issues such as gang and clan violence, accidents from ERW and SALW
and domestic violence. It can be concluded from incident data that armed violence, accidents
and domestic violence are regular occurrences in Somaliland, affecting large number of
individuals, households and communities and may be exacerbated by the large quantities of
SALW and ERW that are already in circulation or that are easily available.
• ERW held in private stockpiles and large numbers of SALW in private ownership represent one
threat to safety and security in Somaliland that cannot easily be removed, so it must be mitigated
through consensual interventions stressing awareness raising, advocacy and risk education,
conducted as part of an approach to community safety integrated with other development
agencies to provide full chain assistance to target populations.
• Communities may need sensitizing to the safety concerns they are facing, including those related
to SALW and ERW, before they will fully engage with holistic community safety interventions.
Armed violence reduction is one area where further sensitization, advocacy and awareness-
raising may be needed prior to interventions. There are however issues, for example domestic
abuse, where there appears to be recognition of the problem and willingness to engage which
suggests interventions in these areas could be immediately implemented successfully.
• Actors in the field of community safety could beneficially increase their support for improving the
inter-linkages between police, traditional leaders and religious leaders in these processes, while
still maintaining and developing cooperation with the police in areas such as community-based
policing.


1
ommunal
violence.
in Somaliland can have a positive effect not only in Somaliland but also for the rest of the Horn of Africa.
tervention and the appropriate partners to assist them to ensure the best possible chance of
success.
al
location and the findings have been triangulated between the different sources to ensure consistency.
Chapter 1 Introduction Somaliland
1 has emerged over the past decade as a small beacon of hope in the Horn of Africa. As
South Central Somalia has spiralled further into violence, the self-declared republic has quietly enjoyed a
period of peace, accompanied by modest economic growth. The population is largely positive about the
future for their country, but problems remain and challenges lie ahead. These challenges must be
addressed to avoid the risk, however slight, that Somaliland may once again experience c
One such challenge faced by the population in Somaliland is the continued prevalence of Small Arms and
Light Weapons (SALW) in the country. As peace reigns across most of Somaliland, the eyes of the
international community are firmly focused on piracy off the coast of Puntland and South Central Somalia
and the continuing struggles of the Transitional Federal Government to assert a modicum of authority
outside a few districts of Mogadishu. What should be noted, however, is the proven cost in terms of loss
of life that small arms are accountable for2. Steps to limit armed violence and improve community safety
Community safety in Somaliland is not threatened by armed individuals acting alone and without reason.
Armed violence in Somaliland is often related to specific events; of ongoing and emerging disputes. It is
also not the only threat to community safety, even if it is a major one. This report focuses on tracking
perceptions of safety and security across Somaliland and highlighting the key safety and security
concerns of different sections of the population, while identifying trends in what crimes and disputes
actually occur. This information, together with the population’s assessment of different aspects of formal
and non-formal security providers’ performance, will allow actors working in the field of community safety
to identify vulnerable groups and locations, determine what challenges they face and select the right
types of in
The report uses data collected from communities in rural and urban areas across Somaliland in the form
of household questionnaires, detailed incident reports, focus group interviews with traditional leaders,
women and youth groups, along with district level interviews with police and central level interviews with
prominent individuals familiar with community safety issues in Somaliland. The data has been analysed
according to a number of background variables such as age, clan-affiliation, income and geographic
1 For reasons of simplicity and brevity, this report refers to Somaliland as a country and the rest of Somalia as South
Central or South Central Somalia; it does not imply any recognition or denial of Somaliland’s declaration of
independence 2 740,000 die as a result of armed conflict each year, p21 Armed Violence Reduction: Enabling Development, OECD,
2009
2
Chapter 2 Methodology
2.1 Sampling The sampling frame for this survey consisted of in Somaliland, apart from non-permanent/ semi-nomadic
communities. It was put together based on information collected by DDG during the Landmine Impact
Survey carried out in 2003 and subsequent information collected by DDG during their community
clearance project.
In order to ensure a balanced representation of both urban and rural populations and a balanced
representation of the population as a whole across Somaliland, a method of stratified random sampling
was employed. Thus, the sampling frame was divided into strata and 1/3 of the communities from each
strata/district were then randomly selected. Due to security and access considerations, seven of
Somaliland’s 41 districts3 were immediately excluded from the sampling frame, leaving a frame of 34
districts with 502
communities4. Using a random selection method a total number of 166 communities
were selected for the survey.5 One exception was made from the random selection method by pre-
selecting the main district towns as part of the sample in order to ensure representation of the main town
in each district.6
Out of the 34 sampled districts and 166 sampled communities, two districts (eight communities in total)
ended up having to be excluded because of security problems at the time of scheduled data collection
and one community had to be excluded because the community refused to participate in the survey.
Thus, the final dataset consists of data from a total of 157 communities from 32 districts.
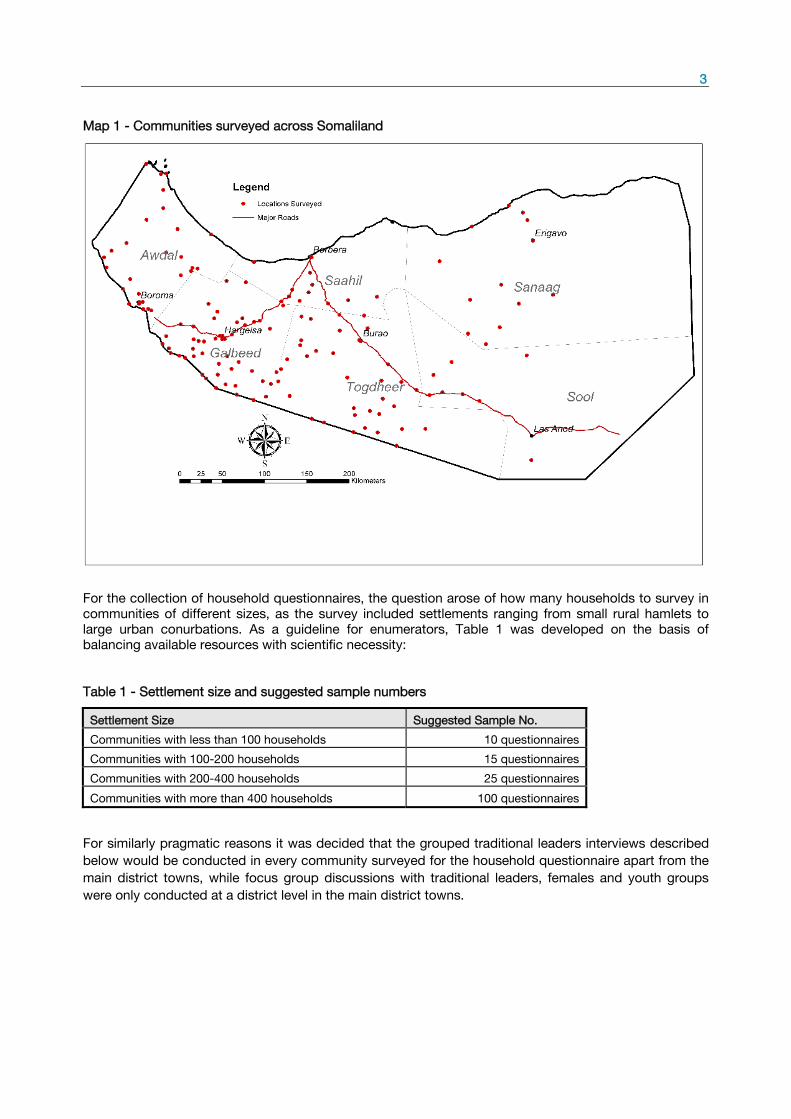
Map 1 below indicates the Global Positioning Satellite (GPS) locations of the various communities where
the household questionnaire was conducted, inside the district and regional boundaries of Somaliland.
3 Including the 5 sub-districts of Hargeisa, but excluding the 4 sub-districts of Burao which for simplicity reasons
were counted as communities instead 4 NB: This number of communities includes the “sub-“communities of the 5 districts of Hargeisa. Furthermore, the
three main district towns of Boroma, Berbera and Burao were dived into 4 sub-communities each (note the latter is
actually 4 sub-districts, but for the sake of simplicity they were counted as communities). Also note that in 2 of the
excluded districts (i.e. Hodun and Buuhodle) 1 community from each was sampled by mistake and has been
included in the data set
5 NB: 2 communities from 2 of the before mentioned 7 excluded districts (i.e. Hodun and Buuhodle) were sampled by
mistake and has been included in the data set 6 NB: All 4 sub-communities from each of the towns of Boroma, Berbera and Burao were thus automatically included
in the sample
3
Map 1 - Communities surveyed across Somaliland
For the collection of household questionnaires, the question arose of how many households to survey in
communities of different sizes, as the survey included settlements ranging from small rural hamlets to
large urban conurbations. As a guideline for enumerators, Table 1 was developed on the basis of
balancing available resources with scientific necessity:
Table 1 - Settlement size and suggested sample numbers
Settlement Size Suggested Sample No.
Communities with less than 100 households 10 questionnaires
Communities with 100-200 households 15 questionnaires
Communities with 200-400 households 25 questionnaires
Communities with more than 400 households 100 questionnaires
For similarly pragmatic reasons it was decided that the grouped traditional leaders interviews described
below would be conducted in every community surveyed for the household questionnaire apart from the
main district towns, while focus group discussions with traditional leaders, females and youth groups
were only conducted at a district level in the main district towns.

4
2.2 Data collection methods
In order to attain a complete picture of the situation in the region with regards to security, the following
combination of data collection methods was utilised to gather the widest possible range of data as
represented in Table 2 below.
Table 2 - Data collection methods, targets and collection rate
Data collection method Targets Collection rate
Household
questionnaires
Male and female respondents in selected
communities
2846 questionnaires
Incident reports
Crime victims
SALW Threat victim
SALW Accident victims
33 reports out of 52 incidents
29 reports out of 67 incidents
20 reports out of 36 incidents
Grouped community
interviews with
traditional leaders
Traditional leaders in all surveyed communities
130 out of the surveyed 157
communities7
Focus group interviews
Traditional leaders at district level
Female adults at district level
Youth8, male and female, at district level
31 interviews9
31 interviews
44 interviews10
Key informant
interviews
Police representatives at district level
Religious leaders
UNDP Community Safety/AVR Unit
Policy advisor, Ministry of Interior
Programme Coordinator, Hornpeace, LNGO
Founder, Haqsoor, LNGO
Abdirahman Yusuf Duale, Land Dispute Expert
31 interviews11
9 interviews
1 interview
1 interview
1 interview
1 interview
1 interview
2.2.1 Household questionnaires
The bulk of the data for this report comes from the 2846 household questionnaires collected between
August 2008 and August 2009. The original structured household questionnaire was developed on the
basis of a research matrix designed by DDG and the Small Arms Survey (SAS). Some minor additions
and revision were made to the questionnaire after data collection in the first of the six regions was
completed, which are detailed later in this section.
7 Only 130 interviews were conducted as most of the main district towns were not covered – see elaboration in the
section on grouped community interviews with traditional leaders Grouped Interviews later in this chapter for more
details 8 As respondents for the household survey had to be adults aged 15 years or older, youth were considered to be
those up to and including the age of 14 years old 9 District level focus group interviews with women and traditional leaders were conducted in 31 out of the 32
sampled districts. 1 district was excluded because the population number was extremely low and there were not
enough women and traditional leaders present at the time of data collection 10
District level focus group interviews with youth were conducted in 28 out of the 32 sample. 4 districts were
excluded because there were no youth present at the time of data collection. In the large district towns the youth
groups were divided into males and females, whereas in the smaller district towns joint interviews were conducted -
hence the higher number of interviews 11
District level police interviews were conducted in 29 out of the 32 sampled districts, with three interviews in Burao.
Two districts were excluded because there were no police stations while the last was excluded because the police
there did not wish to participate

5
The final questionnaire contains 50 questions split into the following sections:
• Background information on respondents
• Overall safety and security
• Disputes and crime
• Security providers
• ERW
• Small arms perceptions and incidents
• Small arms ownership
• Overall needs and priorities.
In addition to the questions in the household questionnaire, three separate incident reports were
developed to collect more detailed information from respondents who’s household members had been
victims of crime, been threatened with SALW, or experienced a SALW-related accident within the last
year.
The questionnaires and incident reports were translated into Somali by a team of four people, thus
ensuring that the translation was thoroughly discussed. Afterwards it was translated back into English by
a different team to ensure that the intended meaning of the questions had not been lost in translation.
Furthermore, the questionnaire was pre-tested on more than 100 respondents and adjusted according to
the findings from this test.
Please note that two additional questions on ranking of security providers on familiarity and transparency
were added after the data collection in Saahil region.
Enumerators were instructed to use a random systematic sampling technique to select every third
household in densely populated communities and every second household in sparsely populated
communities, starting from one or more central points of each community depending on its size. The
walking direction from the starting points was determined by virtue of a pen-toss. The enumerators were
instructed to ensure every second time they interviewed a woman in order to prevent gender bias in the
questionnaires collected. The majority of settlements in the survey are small enough to easily identify a
centre point, however where this was not the case, enumerators were instructed to conduct a community
mapping exercise to assess where the centre of each community lay and if necessary, to split the
community into several constituent parts and work outwards from these in turn to attain even coverage in
the collection of questionnaires.
Enumerators were instructed to seek to interview people from different age groups, but not to interview
anyone who was below the age of 15. If the necessary respondent (in terms of gender) were not available
when the enumerators approached a household they were to ask for an appointment later the same day
or the following day and to go back. If the necessary respondent were to refuse to participate the
enumerators were to politely thank the person, write “Refused” in the top right corner of the given
questionnaire report and select another household by using the systematic sampling method described
above. As it turns out, no-one refused to participate12
.
12
Apart from the entire community who refused to participate as mentioned previously
6
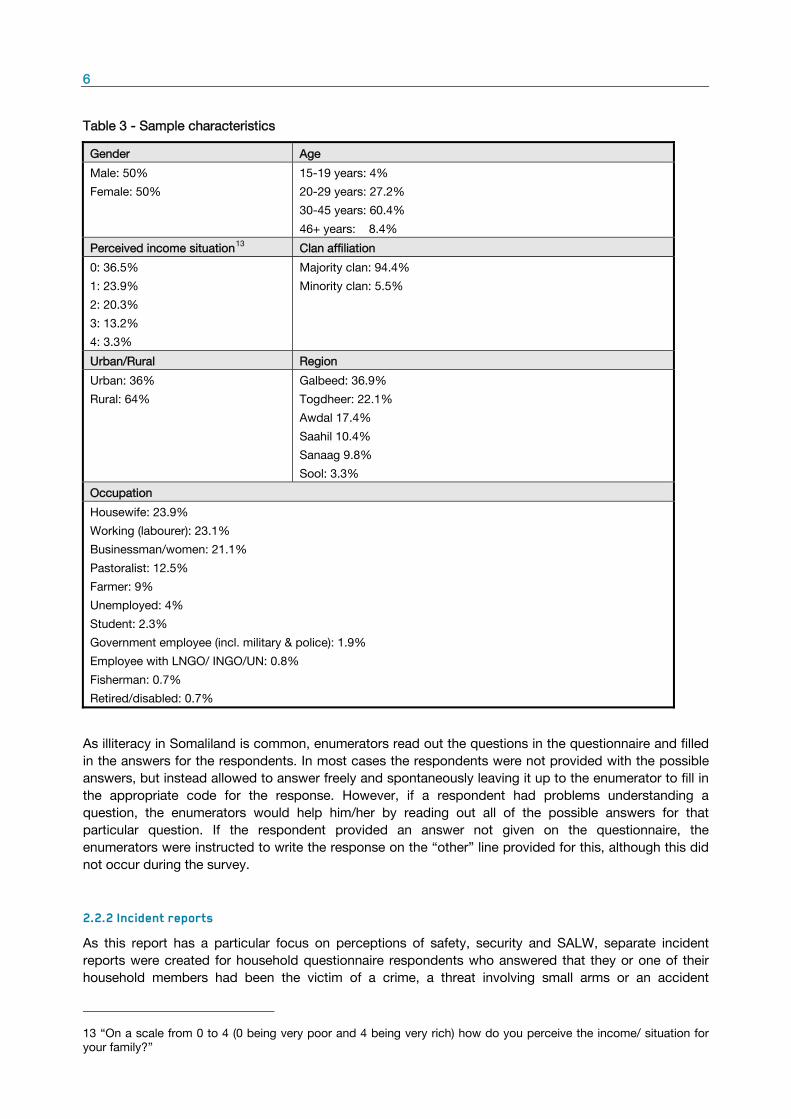
Table 3 - Sample characteristics
Gender Age
Male: 50%
Female: 50%
15-19 years: 4%
20-29 years: 27.2%
30-45 years: 60.4%
46+ years: 8.4%
Perceived income situation13
Clan affiliation
0: 36.5%
1: 23.9%
2: 20.3%
3: 13.2%
4: 3.3%
Majority clan: 94.4%
Minority clan: 5.5%
Urban/Rural Region
Urban: 36%
Rural: 64%
Galbeed: 36.9%
Togdheer: 22.1%
Awdal 17.4%
Saahil 10.4%
Sanaag 9.8%
Sool: 3.3%
Occupation
Housewife: 23.9%
Working (labourer): 23.1%
Businessman/women: 21.1%
Pastoralist: 12.5%
Farmer: 9%
Unemployed: 4%
Student: 2.3%
Government employee (incl. military & police): 1.9%
Employee with LNGO/ INGO/UN: 0.8%
Fisherman: 0.7%
Retired/disabled: 0.7%
As illiteracy in Somaliland is common, enumerators read out the questions in the questionnaire and filled
in the answers for the respondents. In most cases the respondents were not provided with the possible
answers, but instead allowed to answer freely and spontaneously leaving it up to the enumerator to fill in
the appropriate code for the response. However, if a respondent had problems understanding a
question, the enumerators would help him/her by reading out all of the possible answers for that
particular question. If the respondent provided an answer not given on the questionnaire, the
enumerators were instructed to write the response on the “other” line provided for this, although this did
not occur during the survey.
2.2.2 Incident reports
As this report has a particular focus on perceptions of safety, security and SALW, separate incident
reports were created for household questionnaire respondents who answered that they or one of their
household members had been the victim of a crime, a threat involving small arms or an accident
13 “On a scale from 0 to 4 (0 being very poor and 4 being very rich) how do you perceive the income/ situation for
your family?”

7
involving small arms. Enumerators were instructed to complete the household questionnaire first and
then complete the incident report(s) as necessary. Unfortunately, not all incidents recorded in the
household survey were followed up with separate incident reports due to operational inconsistencies and
some unwillingness from respondents to impart further details to the enumerators. The short incident
reports that were completed consisted of eleven, seven and eight questions respectively that allow the
report to further develop conclusions on these issues. The guidelines for completing these reports were
the same as used for the household questionnaire.
2.2.3 Traditional leaders grouped interviews
In addition to the household survey, a panel of approximately five traditional leaders was interviewed in
each of the communities visited to collect household questionnaires for the survey. The aim of these
interviews was to obtain community specific information about crime incidents and disputes as this is not
always collected on a district level as well as community specific information about small arms and
Explosive Remnants of War (ERW) ownership. The traditional leaders served as key informants based on
their extensive knowledge of their communities. They were asked to agree on collective answers to 46
questions specifically relating to the above mentioned issues.
Community level interviews with traditional leaders were conducted in all communities apart from the
main district towns, because the teams were conducting focus group interviews in these and because
the towns are usually too big for the traditional leaders to be able to have an overview of incidents etc.
The only exception to the latter was the before-mentioned “sub”-communities of Boroma, Berbera,
Burao and Hargeisa. It is important to be aware of the influence on the data that this lack of interviews
from the remaining 27 main district towns has – i.e. the results from this part of the data set will
necessarily be skewed towards rural settings.
2.2.4 Focus group interviews
In order to allow for more in-depth analysis and triangulation of the information from the household
survey, focus group discussions with separate groups of 10 to 12 traditional leaders, women and youth
in all of the sampled districts were planned.
A semi-structured interview guide was developed, containing 27 guiding questions focused on issues
relating to overall safety and security, small arms, ERW and security providers, allowing for more detailed
and nuanced answers than the household questionnaire with interviewees being able to explain the
reasoning behind their answers and probe each other’s reasons for holding certain views. Focus group
facilitators were trained to allow discussion to develop on each point and intervene only to refocus
discussion or speed up discussion to remain within the ninety-minute allocated timeframe. The
discussions were noted down and recorded in audio, with written reports of each focus group prepared
afterwards.
Because of low-density population in one of the 32 sampled districts focus group interviews with women
and traditional leaders were only conducted in 31 out of the 32 sampled districts. For similar reasons (no
youth present) focus group interviews with youth were only conducted in 28 of the sampled districts. In
the large district towns, the youth groups were divided into males and females in order to allow space for
nuances between the groups, whereas in the smaller district towns joint interviews were conducted. This
accounts for the higher number of youth group interviews.

8
2.2.5 Key informant interviews
Key informant interviews were conducted at a district level with police officers at the various police
stations across Somaliland14
. As the household questionnaire survey was conducted in the field, police
staff were interviewed using a modified version of the focus group guidelines, adapted to acquire more
information on what kind of incidents occur and how communities cooperate with police to resolve them.
The key informant guidelines consist of 22 questions under the headings of overall safety and security,
small arms, ERW and security providers. The interviews were recorded and reports written for each one
after the event.
In addition to the key informant interviews completed on a regional level, seven key informant interviews
and one focus group with seven religious leaders were also conducted at a central level. These included
officials from the Ministry of Interior responsible for security policy, the UNDP Community Safety/Armed
Violence Reduction (AVR) team, members of local NGOs working with peace building and conflict
resolution and prominent religious leaders working in the same field. These interviews used a more open
set of questions based on the areas covered in the household questionnaire in order to gain the widest
possible view that these key actors in the field of community safety could offer.
2.3 Challenges and constraints encountered during the survey
Collecting data on safety and security issues in Somaliland presents a challenge as many communities
are suspicious of discussing such issues with strangers. DDG overcame this to some extent by the trust
and goodwill the organisation has from the many years it has spent working in Somaliland, but it did still
impact the speed with which data could be collected overall, due to the length of time needed for
community entry and conducting individual questionnaires, interviews and focus groups. The speed of
data collection was further complicated by the logistical difficulties of completing a survey in more
inaccessible and remote locations. This challenge was partly met by using well trained and highly mobile
teams of enumerators and facilitators who stayed in the field for extended periods of time to complete
the data collection phase of the survey. However, the data collection still stretched over an extended
period of twelve months.
In terms of security, ongoing clan conflicts restricted the movement of survey enumerators to the extent
that data collection had to be cancelled in two districts encompassing 8 sampled communities.
Furthermore, one community refused to participate in the survey. However, because of the size of the
sample this did not affect the survey significantly.
Collecting precise data about incidents of crime, disputes and accidents is always a challenge in
societies with weakly developed data collection and recording systems. This challenge was partly met by
using various sources for collecting the information. However, the incident and accident related results
presented in the report are no doubt imprecise and most likely lower than the actual figures.
There was a particular challenge in collecting additional detailed information for the questionnaire survey
from individual incidents. It transpired that in some cases people who had been the victim of a crime,
armed threat or small arms accident were reluctant to give details of the event. This may be due to the
fear of being dragged into formal proceedings on the matter, or perhaps reigniting a dispute with the
other party. However, as this information is important in gauging the safety threats to communities, future
surveys covering these issues should consider ways of addressing this shortfall.
14
Note that one of the 32 districts did not have a police station, while police from 3 different police stations in Burao
were interviewed – hence the unequal number of interviews compared to the number of districts. As mentioned
earlier, police in one district declined to participate

9
Chapter 3 Somaliland Historical Context Somaliland is a self-declared republic, formerly part of Somalia, on the southern rim of the Gulf of Aden
established in 1991. Somalilanders, as the population of this territory are known, are just one group of
the ethnic Somalis that are scattered across the Horn of Africa, with significant other populations in what
are now Djibouti, the Ogaden region of eastern Ethiopia, northern Kenya, the semi-autonomous region of
Puntland and south central Somalia. This latter division came about as the region was arbitrarily carved
up in the late nineteenth century by the colonial powers during the ‘scramble for Africa’ and with the
general post-colonial consensus to leave borders unchanged, Somalis have remained as ethnic majority
and minority groups spread between a number of countries to this day. To fully understand the situation
and many of the problems now facing Somaliland and the Horn of Africa in general requires this period to
be examined more closely.
Somalilanders were traditionally nomadic cattle herders, often armed to protect their livestock. It was the
prospect of fresh meat for their strategic naval base across the gulf in Aden, rather than territorial
ambition, which had first attracted the British colonialists in the late nineteenth century. However, as
France and Italy began making their own claims in the Horn, Britain pressed its case for control of what it
termed the Somaliland Protectorate more vigorously. By the turn of the century this had been largely
established with the Anglo French Treaty and the Anglo Italian Protocol, although the arbitrary borders
the colonial powers created facts on the ground that made life difficult for many communities, such as
separating cattle herder from their grazing lands or water sources.
3.1 The colonial era
Britain’s efforts at development in Somaliland did not yield results similar to those in some of their other
east African colonies and for at least the first two decades of the twentieth century, Somaliland was
better known for violent uprisings and famine than economic progress. Things had improved somewhat
by the 1930s and a system of colonial district commissioners responsible to a central governor was
established, some structural elements of which survive in Somaliland’s government to this day.
Development continued at a slow pace albeit with a pause for the Second World War, until independence
in 1960. Somaliland was at best ill-prepared for self-rule; experience of western-style democracy and
legal process were largely non-existent outside of the small British-trained civil service, who were
reluctant to get involved in politics; those who were involved in politics were preoccupied by the
nationalist movement calling for the unification of ethnic Somalis across the Horn. In 1961, Somaliland
and Somalia were unified on the basis of a criticised referendum15
and on shaky legal grounds.
Somaliland gave up much in this agreement, including the relocation of the government to Mogadishu,
on the assumption that the other Somali territories would soon follow into the union and that it was for
the greater good of all Somalis.
3.2 The greater Somalia
The fledgling Somali Republic was soon in difficulty at home. After less than a decade of parliamentary
rule characterised by poor governance by an inexperienced cadre of politicians, General Siad Barre
seized power in a bloodless coup in 1969. Although few Somalis relished the prospect of military rule,
Barre's "Supreme Revolutionary Council" and the strong leadership it promised was widely received as a
welcome alternative to the disappointments of civilian rule. A mix of young idealists and academics
flocked to his banner of "Scientific Socialism” which included large-scale literacy campaigns and the
creation of the first Somali script. Barre built up the Somali military with the help of the Soviets into one of
the strongest in sub-Saharan Africa. In 1977 Somalia invaded Ethiopia in an attempt to unite with the
15
Less than half the population voted in favour of the proposed constitution. p33, Becoming Somaliland, Mark
Bradbury, 2008
10
Somalis of eastern Ethiopia’s Ogaden region by force. Unfortunately the Soviets, seeing a chance to lure
Ethiopia out of the USA’s sphere of influence, rapidly armed Ethiopia at the same time, leading to the
routing of their erstwhile Somali allies. This was the closest Somalia ever got to a pan-Somali state.
Displaced people from the war settled throughout Somalia, their arrival in the North creating considerable
tension. Most of the refugees were Ogaden Somalis, a group non-resident in the North, and whose
political leadership were closely associated with the Barre regime. Local inhabitants felt overwhelmed by
the sheer numbers of the arrivals, who overflowed from the designated camps and placed severe strain
on local resources, with grazing and wood for fuel all but disappearing16
. Aid earmarked to settle and
care for the refugees, without any obvious benefit to the local people, became a source of envy and
resentment. Many refugees, by virtue of their clan, were favoured by the regime for posts in local
government and in the military garrisons of the area. Over time, the refugees also received preferential
treatment in terms of business licenses, contracts and other commercial benefits. As the rift between the
refugees and their hosts widened, refugee militia were established and armed by the Barre government,
escalating the situation dangerously, while the rule of Somaliland by Mogadishu became increasingly
harsh.17
3.3 Rebellion against central rule
The relationship between the central government and Somaliland changed dramatically in 1981 with the
government's arrest of a group of prominent Hargeisa intellectuals. Consultations within the Isaaq clan,
the majority clan in Somaliland not found largely elsewhere in Somalia, both in Somaliland and among
the Diaspora communities led to the formation in London of the rebel Somali National Movement (SNM).
By 1982, the SNM had established bases in Ethiopia, from where it waged an armed struggle against the
regime's forces in the north, initially in the form of clandestine cross-border incursions and later also from
bases in the south. The resistance was met with increasingly brutal campaigns of collective punishment
by the regime. In May 1988, following the signing of a peace accord between Ethiopia and Somalia that
threatened to terminate the SNM campaign, the SNM launched an all-out offensive against government
forces in Hargeisa and Burao. Caught off-guard, the government responded with a brutal ground and
aerial bombardment followed by the planting of hundreds of thousands of landmines. Over 50,000
people are estimated to have died, and more than 500,000 fled across the border to Ethiopia. However,
the cracks were showing and in January 1991, as the civil war began to engulf Mogadishu, SNM forces
launched a lightning offensive in the North, recapturing the major towns and putting the government
troops to flight.
3.4 Civil conflict
The traditional council of traditional leaders known as the Guurti established a ceasefire in February 1991
and set a date for a Grand Conference of all clans for April of the same year, to be followed by an SNM
Central Committee meeting. The result of these two meetings was the declaration of the Republic of
Somaliland on the 18th
May 1991, with a two year transitional governmental term for the Isaaq-dominated
SNM with provision in government for other groups. As is often the case, once in power internal conflicts
within the SNM came to the surface and in 1992 various factions clashed across Somaliland. Once again
the Guurti stepped in and negotiated the transfer of power from the SNM to a community-based system
with a new civilian president and another interim term, but it was not enough to stop Somaliland slipping
further into civil conflict as violence spread wider across the nation/region. Finally, in February 1997, a
five month consultation successfully agreed a cessation of hostilities between all parties, elected a new
president and vice president and created a new constitutional document to regulate governance during a
16
p65, Lewis, Understanding Somalia and Somaliland, 2008 17
p68, ibid, 2008

11
further three year transitional presidential term that gave increasing representation and protection to
opposition and minority groups.
Since 1997, Somaliland has enjoyed over a decade of peace and some economic growth, despite the
absence of international recognition of its sovereign status. However, this peace remains fragile. A
presidential election due in April 2008 has been delayed three times despite protests from opposition
parties, some of whose activists have allegedly as a result been imprisoned without trial by extra-judicial
regional security committees beholden to the ruling party.18 Furthermore, Somaliland is still vulnerable to
external shocks. The continuing violence in south central Somalia has led to an influx of displaced people
that the country is ill-equipped to deal with and suicide bombings of UN, presidential and Ethiopian
facilities in October 2008 highlighted how Somaliland risk becoming victim of radicalisation and violence
as seen in south central Somalia and how quickly the aid it relies on could be choked by violence.
A product of Somaliland’s recent history is the pervasive nature of SALW and ERW ownership with its
society. Somalilanders have long had a culture which sees the bearing of arms as normal and a rite of
passage for men, particularly among pastoralist communities. However this culture has changed
significantly over the past thirty years. Whereas during the colonial era Somalilanders were permitted to
own only bolt-action rifles – more than sufficient for guarding of livestock, now the weapon of choice is
an AK47 automatic rifle capable of firing thirty rounds in a matter of seconds. While this may be as equal
a deterrent against cattle rustlers, it is also clearly a weapon that has the capacity to escalate conflicts far
quicker and is hence potentially a far greater threat to community safety. A culture of arms is ultimately
only a set of behavioural and social norms; it does not have to be negative and can change with time.
Effective approaches in this area to mitigate the risk inherent in such a culture would be a positive benefit
for Somaliland’s future and set an example for the rest of the region.
18
Human Rights Watch, Hostages to Peace: Threats to Human Rights and Democracy in Somaliland, 2009, p.18

12
Chapter 4 Perceptions of Safety and Security in Somaliland All perceptions of safety and security are relative. Somaliland endured more than two decades of
oppression and civil war before entering the period of peace it enjoys now. Given this recent collective
experience, it is little wonder then that when asked simply how safe they consider their community to be,
96.6% of the household respondents surveyed for this report answered that they considered it “safe”, as
in comparison to what came before, this is a period of stability in Somaliland’s recent history. However,
further examination of this data uncovers a more nuanced perception of safety and security among
different sections of the population and it is these differences that this report seeks to highlight. Only by
identifying such vulnerable groups and addressing their specific concerns can community safety
interventions have a long term and sustainable impact on overall safety in target communities.
4.1 How safe is Somaliland?
It is often the case that in the wake of turbulent political or military events, confidence in safety and
security among members of majority groups bounces back far quicker than confidence in other sub
groups. This difference in perception is often seen at its most negative among minority groups, who may
feel severely threatened by the surrounding majority. In Somaliland however, there was encouragingly no
significant difference in the responses towards safety of either the majority or minority clans, who were
as likely as one another to see the safety situation as positive during this survey.
Looking at other sub groups, the gender, income and urban or rural setting of respondents also did not
appear to have much influence on perceptions of safety and security. The age of the respondents,
however, did have a small but significant effect on perceptions of safety and security. As the age of the
respondent increased, so too did their sense of security, as shown in Figure 1 below. The most likely
explanation for this is the life experience of the different age groups; the older members of Somaliland
society have lived through good times in the past but also through the civil war, the oppression of the
previous regime and possibly even the shortages of the first half of the twentieth century. They have a
good idea of just how good and how bad things can get and see the current situation through that lens.
Younger respondents, however, have less life experience to draw on, with the violence and uncertainty of
the early 1990s often being one of their forming negative experiences, so they may find it harder to see
the current situation in Somaliland in such a positive light as older respondents. This interpretation
should however be considered in light of the fact that it was cited only two times among a total of 41
security concerns raised in youth focus groups .Another more plausible reason could be that people in
the age range 20-29 years are most likely to be the victims of crime19
.
Figure 1 - Assessing community safety and security situation
0102030405060708090
100
15‐19 yrs 20‐29 yrs 30‐39 yrs 40+ yrs
% of respo
ndents
Proportion of respondents inage category consideringvil lage to be safe
Proportion of respondents inage category consideringsecurity in their vil lage to bebetter than twelve monthsearlier
19
See chapter 5 on Disputes and Crime for further details

13
No understanding of safety and security in Somaliland would be complete without examining the
difference in such perceptions geographically. With continuing unrest in the Ogaden region of Ethiopia to
the south, ongoing clan conflicts in certain districts, a frozen conflict with Puntland over the eastern
border and the interminable chaos in south central Somalia, one would expect certain areas to have
more negative perceptions of security than others. Responses analysed by region did not however show
communities in any region as being significantly less safe than in others in the perception of respondents,
but this is probably in large part due to the rural and dispersed nature of the respondents. When
analysed by district again there was largely no significant variation, except in the case of Lasanood,
where 58.3% of respondents claimed to feel “neither safe nor unsafe” or “unsafe”. Lasanood has been
the scene of violent clashes in recent years during the border conflict between Somaliland and Puntland
and this result may reflect the concerns of a population who fear that the area may see violence in the
future. The poor perception of security in Lasanood could also perhaps be due to ongoing low level
disputes following the conflict that remain a concern for respondents.
In an effort to understand how the security environment is evolving in Somaliland, respondents in the
household survey were asked how they considered the security situation in comparison to the situation a
year earlier. 52.6% of respondents said the situation had improved, while a further 45.3% said it was
about the same. Only 2.1% said it had worsened. The gender, income and urban or rural setting of
respondents did not appear to have much impact on perceptions of how the security situation had
changed. However, as illustrated in Figure 1 above, age had a small but significant20
influence on
respondents’ answers, with older people more likely to consider the situation in their communities as
having improved on a year previously. Furthermore, respondents from minority clans were less likely to
say the security situation had improved, with only 37.8% answering accordingly, compared to 53.5% of
respondents from majority clans. However, the proportion of respondents in both clan groups claiming
the situation had deteriorated was extremely low, so while the result indicates some level of the
uncertainty alluded to earlier that can occur in minority groups, it does not currently appear to present a
serious divergence in perceptions of security between groups in Somaliland.
When responses to how the security environment was perceived to have changed in the last twelve
months were examined by region, the highest levels of improvement in the security environment were
seen in Galbeed and Awdal, where 59.5% and 65.9% of respondents respectively said the security
situation had improved. At the other end of the scale, the highest levels of respondents citing a
deteriorating security environment were seen in Sool and Sanaag, where 12.8% and 7.1% of
respondents respectively said the situation was worse than twelve months previously, demonstrating a
variation in answers by geographic location not seen in responses to the previous question on
perceptions of current safety. When the responses were broken down further by the districts of the
respondents, it was noted that rather than a small difference across the board in the results in Sool and
Sanaag regions, the evidence suggested significantly negative results in certain key districts, which had
dragged down the average answers for the regions as a whole, such as in the case of Lasanood, where
25% of respondents believed the situation had got worse over a twelve month period up to November
2008 and a further 50% believed it had not got worse, but neither had it improved.21
These distinct
differences in perceptions of the changes taking place in each district are best explained by recent
events that have occurred in or near there. Lasanood for example has long been a flashpoint in the
ongoing border conflict between Somaliland and Puntland. Although the traditional leaders in focus
group interviews in the district were more positive about the changing security environment than the
household respondents, they still underlined the fact that the continued political uncertainty facing the
district was a major security concern for them. Together, these facts account for the district’s negative
perception of the how their security environment is changing.
Although, 96.6% said that they considered their community to be safe, the results from their assessment
of the changing security environment in their community within the last year shows a more nuanced
20
For the definition of ‘significant’ and an explanation of how it is used in this report, refer to the Glossary 21
Please refer to Annex B for the timing of data collection in each district, which will necessarily have affected the
answers to this question
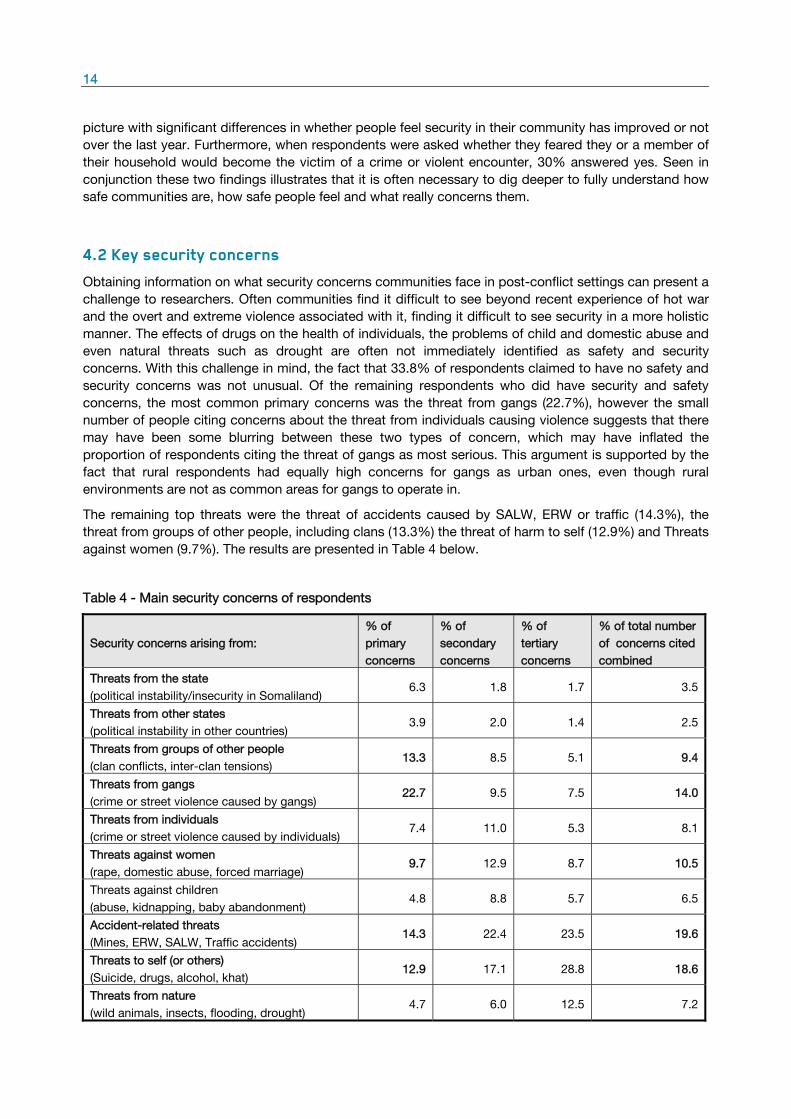
14
picture with significant differences in whether people feel security in their community has improved or not
over the last year. Furthermore, when respondents were asked whether they feared they or a member of
their household would become the victim of a crime or violent encounter, 30% answered yes. Seen in
conjunction these two findings illustrates that it is often necessary to dig deeper to fully understand how
safe communities are, how safe people feel and what really concerns them.
4.2 Key security concerns
Obtaining information on what security concerns communities face in post-conflict settings can present a
challenge to researchers. Often communities find it difficult to see beyond recent experience of hot war
and the overt and extreme violence associated with it, finding it difficult to see security in a more holistic
manner. The effects of drugs on the health of individuals, the problems of child and domestic abuse and
even natural threats such as drought are often not immediately identified as safety and security
concerns. With this challenge in mind, the fact that 33.8% of respondents claimed to have no safety and
security concerns was not unusual. Of the remaining respondents who did have security and safety
concerns, the most common primary concerns was the threat from gangs (22.7%), however the small
number of people citing concerns about the threat from individuals causing violence suggests that there
may have been some blurring between these two types of concern, which may have inflated the
proportion of respondents citing the threat of gangs as most serious. This argument is supported by the
fact that rural respondents had equally high concerns for gangs as urban ones, even though rural
environments are not as common areas for gangs to operate in.
The remaining top threats were the threat of accidents caused by SALW, ERW or traffic (14.3%), the
threat from groups of other people, including clans (13.3%) the threat of harm to self (12.9%) and Threats
against women (9.7%). The results are presented in Table 4 below.
Table 4 - Main security concerns of respondents
Security concerns arising from:
% of
primary
concerns
% of
secondary
concerns
% of
tertiary
concerns
% of total number
of concerns cited
combined
Threats from the state
(political instability/insecurity in Somaliland) 6.3 1.8 1.7 3.5
Threats from other states
(political instability in other countries) 3.9 2.0 1.4 2.5
Threats from groups of other people
(clan conflicts, inter-clan tensions) 13.3 8.5 5.1 9.4
Threats from gangs
(crime or street violence caused by gangs) 22.7 9.5 7.5 14.0
Threats from individuals
(crime or street violence caused by individuals) 7.4 11.0 5.3 8.1
Threats against women
(rape, domestic abuse, forced marriage) 9.7 12.9 8.7 10.5
Threats against children
(abuse, kidnapping, baby abandonment) 4.8 8.8 5.7 6.5
Accident-related threats
(Mines, ERW, SALW, Traffic accidents) 14.3 22.4 23.5 19.6
Threats to self (or others)
(Suicide, drugs, alcohol, khat) 12.9 17.1 28.8 18.6
Threats from nature
(wild animals, insects, flooding, drought) 4.7 6.0 12.5 7.2

15
In recognition of the fact that people have multiple security concerns, respondents in the household
survey were asked to give their top three security concerns, as represented in the table outlining main
security concerns shown above. By combining the number of times each issue was raised across
primary, secondary and tertiary categories and calculating percentages based on this accumulated
figures as shown in the final column of the same table, it was possible to highlight several issues that,
while not at the forefront of respondents’ minds, are clearly significant problems facing communities that
require further attention. When the total responses across primary, secondary and tertiary concerns are
combined, the five most common concerns are still the same as the five most common primary ones,
however, the threat from accidents now comes out as the most common one overall followed by threats
to self, instead of threats from gangs of street violence and crime. Furthermore, threats against women
were cited more times overall than threats from groups of other people (clans) which slipped into fifth
place behind rape and domestic violence.
Key informant and focus groups were asked not what their main security concerns were, but what, in
their opinion, were the biggest security problems in their districts. To some extent their answers mirrors
the concerns of the household respondents in that clan conflicts (mainly land and farm disputes), threats
against women, street violence and crime and accidents from mines and ERW were all frequently cited
as security problems. However, conflicts/disputes were by far most commonly cited security problems,
accounting for 14 of a total of 44 security problems cited by female focus groups, 15 out of 62 cited by
traditional leaders, 26 out of 83 among youth focus groups and 14 out of 31 cited by the police.
Furthermore, drugs and alcohol was only cited as a security concern 5 times between all the focus
groups and the police. This indicates that there might be a slight difference in what is perceived as a
security threat on a household level and what actual security problems occur in those communities.
It was suspected that different groups within the household survey would have different priorities in terms
of security concerns, however this was not the case when the proportions of answers given for primary
security concerns were analysed according to the gender and age. However, when analysed according
to urban or rural residence, there were significant differences. The Table 5 below demonstrates that
urban respondents with security concerns were three times more likely to cite internal state threats as
their primary security concern than their rural counterparts and significantly more likely to cite threats to
self as their primary concern. In comparison, rural respondents were twice as likely to be most concerned
by the threat of accidents caused by ERW, SALW and traffic than urban respondents, while also
significantly more likely to see the threat from groups of other people (clans) as their prime security
concern.

16
Table 5 - Primary security concerns by urban/rural location
Security concerns arising from:
% of urban
respondents total
concerns
% of rural
respondents total
concerns
Threats from the state
(political instability/insecurity in Somaliland) 11.1 3.6
Threats from other states
(political instability in other countries) 4.0 3.8
Threats from groups of other people
(clan conflicts, inter-clan tensions) 11.8 14.0
Threats from gangs
(crime or street violence caused by gangs) 22.6 22.8
Threats from individuals
(crime or street violence caused by individuals) 7.5 7.4
Threats against women
(rape, domestic abuse, forced marriage) 10.9 9.0
Threats against children
(abuse, kidnapping, baby abandonment) 5.0 4.7
Accident-related threats
(Mines, ERW, SALW, Traffic accidents) 8.4 17.7
Threats to self (or others)
(Suicide, drugs, alcohol, khat) 15.5 11.5
Threats from nature
(wild animals, insects, flooding, drought) 3.1 5.6
Total 100% 100%
But just how important is the issue of safety and security to Somalilanders? When asked as part of the
household questionnaire to rate the most important needs in life, safety and security as a need came in
fourth with 7.3% behind health (53.2%), water (12.9%) and education (8.2%), although ahead of
employment, food security and sanitation. In contrast to the opinions of the general population, some key
informant interviewees, when asked the same question, were unanimous in their agreement that safety
and security were a prerequisite for effective and sustainable development in areas like health, water and
education cited by the household survey respondents.22
Sheikh Ismail, a respected religious leader and
personal advisor to the President explained that this difference in opinion showed the need to raise
awareness among the population of Somaliland of the importance of reaching a peace settlement and
recognising the shared ownership of the country by different groups; in his opinion it is only in this way,
that stability can bring the prosperity and education needed to sustain Somaliland’s peaceful
development23
. The household survey results also certainly suggest that not everyone automatically
makes the link between peace and development.
The importance of safety and security as a life need for respondents appears to cut across gender and
clan lines. When the primary, secondary and tertiary responses are combined as before to get an overall
picture of the most common needs, safety and security still maintains a strong position in communities’
order of priorities, accounting for 8.8% of responses, once again falling behind only health, education,
water and employment. Even when respondents were asked more precisely what the most important
needs of their community were, 11.9% of primary responses related to rule of law and violence reduction
needs, ranging from ERW disposal and conflict resolution support to community based policing. These
responses, taken together with the security concerns outlined above and information on security-affected
22
Interview, Programme Coordinator, Hornpeace, 08/08/09 and Interview, Sheikh Ismail, DRC/FCA Religious
Leaders Programme, with Horn University, 04/08/09 23
ibid.

17
districts would indicate that there is significant space and need for bottom-up interventions focusing on
community safety in Somaliland.
4.3 Conclusions on perceptions of safety and security
Although at first glance the population of Somaliland appears to a large extent to perceive its security
environment as safe, it is clear that younger people feel a lot less secure than older members and
perhaps with good reason – later sections of this report demonstrate they are most likely to be victims of
crime. However, the types of security and safety issues that concern young people most, are not
necessarily the ones most likely to impact on their safety, which This indicates that there is a gap
between perception and reality that could usefully be addressed through targeted awareness raising
activities to positively alter certain groups’ perceptions of safety and security and encourage them to
address common security issues rather than less common or perceived ones. Until communities are
aware and accept what the main threats to their safety are, successfully advocating for interventions to
address them will be difficult.
The above findings also show that generally there is no one-size-fits-all approach to the sorts of safety
and security concerns that are experienced by different people in different places. Rural communities
have different concerns to urban populations, for example. It is also noticeable that certain types of
security concern, for example armed robbery, assault and rape and domestic violence, are shown by the
later sections on crime to be events that do occur quite often, in comparison to other security concerns
which although feared by the community, do not occur so frequently. This indicates that the population is
aware of and is ready to engage on some of the common safety threats they face and also indicates that
any intervention on these issues has the potential to create a significant positive impact on the
population in that area. However, any such intervention should be undertaken with the understanding
that safety and security, while important to the population, is part of a broader selection of concerns
including worries over health, water, education and employment, so any intervention aimed at increasing
safety and security, through whatever specific activity, should be undertaken if possible as part of an
integrated strategy that is complemented by work on these other issues.

18
Chapter 5 Disputes and Crime in Somaliland Crime and disputes are an inevitable part of life in every society. However, post-conflict societies can
face additional law and order challenges due to capacity issues in institutions such as the police and
judiciary and also from the negative consequences of conflict, such as the proliferation of SALW. This
report aims to highlight what kind of crimes and disputes occur where in Somaliland and to whom. By
assessing the types of disputes and crime that are most prevalent in the country, organisations working
in the field of community safety will have the information needed to identify who the appropriate partners
are for any intervention and to focus activities on high risk areas or target groups to maximise the impact
of their activities.
5.1 Disputes
79.1% of all respondents said disputes occur in their communities. Of this group, respondents were
most likely to cite disputes over compensation payments, criminal activity and farms as the most
common types, which accounted for 30.0%, 25.7% and 15.4% of primary responses respectively. These
three types of dispute also accounts for the highest proportions of responses across all three categories
overall, as shown in Table 6 below. This makes it clear that these three types of dispute are worth
particular attention from institutions working on dispute prevention and resolution.
Table 6 - Most common disputes
Dispute involving:
% of most
common
dispute
responses
cited
% of second
most common
dispute
responses
cited
% of third
most common
dispute
responses
cited
% of
combined
frequencies
of all three
responses
% of 803 total
disputes cited in
130 community
level grouped
interviews with
traditional leaders
Criminal activity 25.7 9.6 7.3 15.1 2.9
Compensation 30.0 17.8 10.8 19.0 3.7
Grazing lands 10.3 10.2 5.3 8.9 5.2
Farms 15.4 18.6 7.2 14.3 28.8
Enclosures 1.5 3.9 3.2 2.8 3.6
Water sources 4.7 10.0 8.5 7.6 8.8
Land titles 8.8 13.2 18.0 12.9 28.0
Livestock 3.8 8.0 13.1 7.8 4.1
Other property 3.8 5.7 15.3 6.8 3.6
Charcoal burning 2.4 2.9 11.4 5.0 9.0
Totals 100 100 100 100 97.724
When looking at the different outlooks of male and female respondents in responses to most common
disputes, there was no significant difference in the types reported, although women were slightly less
likely to recognise that disputes do occur at all than their male counterparts; possibly because dispute
resolution is predominantly conducted between the men of different clan groups, so women may not be
as aware of how frequently they are taking place.
No discernable trends were apparent when the data was analysed according to income but as would
seem natural, when the types of common dispute cited were analysed by the setting in which
respondents live, distinct differences were visible. As demonstrated in Table 7 below, criminal activity, for
example, was cited by twice the proportion of household respondents in urban areas as the most
24
The remaining responses related to political disputes, which were not answers included in the household survey
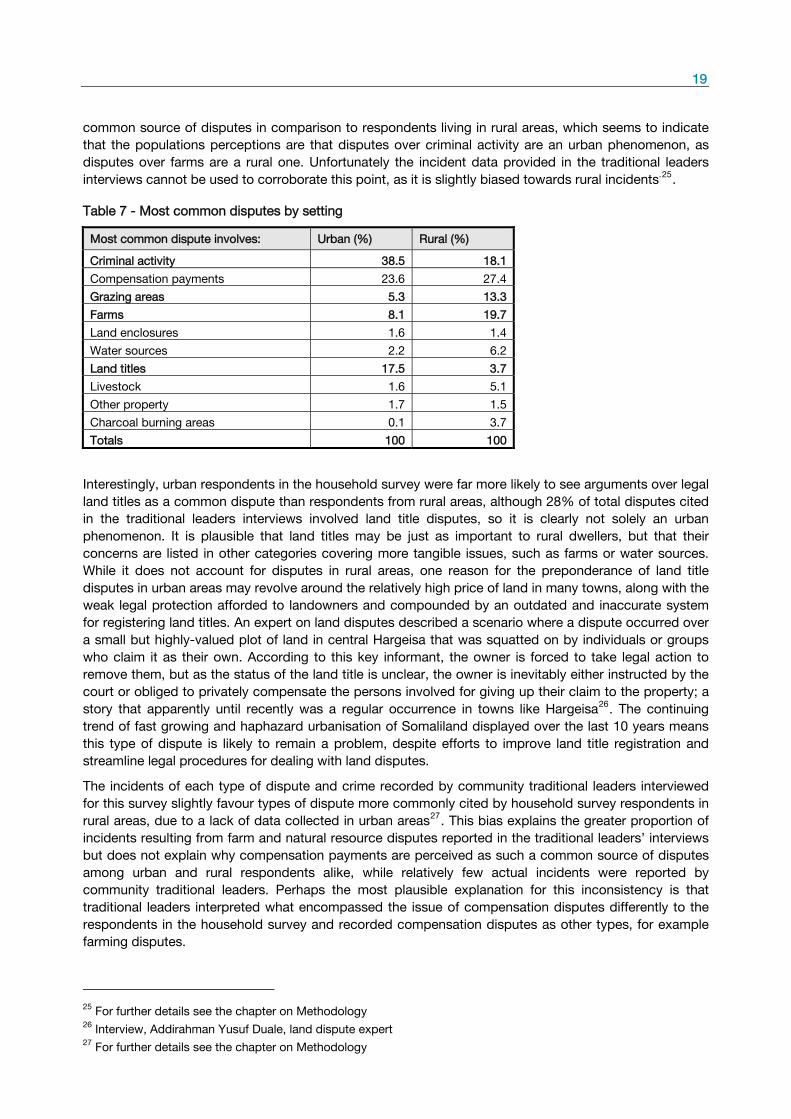
19
common source of disputes in comparison to respondents living in rural areas, which seems to indicate
that the populations perceptions are that disputes over criminal activity are an urban phenomenon, as
disputes over farms are a rural one. Unfortunately the incident data provided in the traditional leaders
interviews cannot be used to corroborate this point, as it is slightly biased towards rural incidents.25
.
Table 7 - Most common disputes by setting
Most common dispute involves: Urban (%) Rural (%)
Criminal activity 38.5 18.1
Compensation payments 23.6 27.4
Grazing areas 5.3 13.3
Farms 8.1 19.7
Land enclosures 1.6 1.4
Water sources 2.2 6.2
Land titles 17.5 3.7
Livestock 1.6 5.1
Other property 1.7 1.5
Charcoal burning areas 0.1 3.7
Totals 100 100
Interestingly, urban respondents in the household survey were far more likely to see arguments over legal
land titles as a common dispute than respondents from rural areas, although 28% of total disputes cited
in the traditional leaders interviews involved land title disputes, so it is clearly not solely an urban
phenomenon. It is plausible that land titles may be just as important to rural dwellers, but that their
concerns are listed in other categories covering more tangible issues, such as farms or water sources.
While it does not account for disputes in rural areas, one reason for the preponderance of land title
disputes in urban areas may revolve around the relatively high price of land in many towns, along with the
weak legal protection afforded to landowners and compounded by an outdated and inaccurate system
for registering land titles. An expert on land disputes described a scenario where a dispute occurred over
a small but highly-valued plot of land in central Hargeisa that was squatted on by individuals or groups
who claim it as their own. According to this key informant, the owner is forced to take legal action to
remove them, but as the status of the land title is unclear, the owner is inevitably either instructed by the
court or obliged to privately compensate the persons involved for giving up their claim to the property; a
story that apparently until recently was a regular occurrence in towns like Hargeisa26
. The continuing
trend of fast growing and haphazard urbanisation of Somaliland displayed over the last 10 years means
this type of dispute is likely to remain a problem, despite efforts to improve land title registration and
streamline legal procedures for dealing with land disputes.
The incidents of each type of dispute and crime recorded by community traditional leaders interviewed
for this survey slightly favour types of dispute more commonly cited by household survey respondents in
rural areas, due to a lack of data collected in urban areas27
. This bias explains the greater proportion of
incidents resulting from farm and natural resource disputes reported in the traditional leaders’ interviews
but does not explain why compensation payments are perceived as such a common source of disputes
among urban and rural respondents alike, while relatively few actual incidents were reported by
community traditional leaders. Perhaps the most plausible explanation for this inconsistency is that
traditional leaders interpreted what encompassed the issue of compensation disputes differently to the
respondents in the household survey and recorded compensation disputes as other types, for example
farming disputes.
25
For further details see the chapter on Methodology 26
Interview, Addirahman Yusuf Duale, land dispute expert 27
For further details see the chapter on Methodology
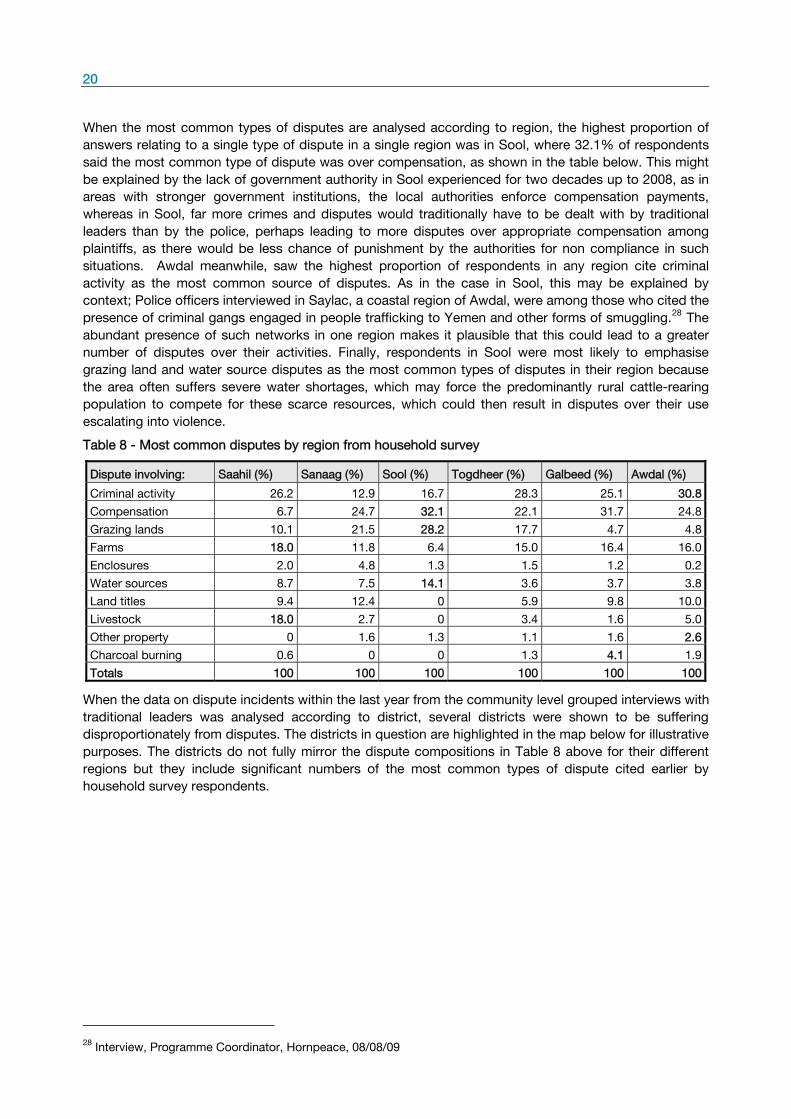
20
When the most common types of disputes are analysed according to region, the highest proportion of
answers relating to a single type of dispute in a single region was in Sool, where 32.1% of respondents
said the most common type of dispute was over compensation, as shown in the table below. This might
be explained by the lack of government authority in Sool experienced for two decades up to 2008, as in
areas with stronger government institutions, the local authorities enforce compensation payments,
whereas in Sool, far more crimes and disputes would traditionally have to be dealt with by traditional
leaders than by the police, perhaps leading to more disputes over appropriate compensation among
plaintiffs, as there would be less chance of punishment by the authorities for non compliance in such
situations. Awdal meanwhile, saw the highest proportion of respondents in any region cite criminal
activity as the most common source of disputes. As in the case in Sool, this may be explained by
context; Police officers interviewed in Saylac, a coastal region of Awdal, were among those who cited the
presence of criminal gangs engaged in people trafficking to Yemen and other forms of smuggling.28
The
abundant presence of such networks in one region makes it plausible that this could lead to a greater
number of disputes over their activities. Finally, respondents in Sool were most likely to emphasise
grazing land and water source disputes as the most common types of disputes in their region because
the area often suffers severe water shortages, which may force the predominantly rural cattle-rearing
population to compete for these scarce resources, which could then result in disputes over their use
escalating into violence.
Table 8 - Most common disputes by region from household survey
Dispute involving: Saahil (%) Sanaag (%) Sool (%) Togdheer (%) Galbeed (%) Awdal (%)
Criminal activity 26.2 12.9 16.7 28.3 25.1 30.8
Compensation 6.7 24.7 32.1 22.1 31.7 24.8
Grazing lands 10.1 21.5 28.2 17.7 4.7 4.8
Farms 18.0 11.8 6.4 15.0 16.4 16.0
Enclosures 2.0 4.8 1.3 1.5 1.2 0.2
Water sources 8.7 7.5 14.1 3.6 3.7 3.8
Land titles 9.4 12.4 0 5.9 9.8 10.0
Livestock 18.0 2.7 0 3.4 1.6 5.0
Other property 0 1.6 1.3 1.1 1.6 2.6
Charcoal burning 0.6 0 0 1.3 4.1 1.9
Totals 100 100 100 100 100 100
When the data on dispute incidents within the last year from the community level grouped interviews with
traditional leaders was analysed according to district, several districts were shown to be suffering
disproportionately from disputes. The districts in question are highlighted in the map below for illustrative
purposes. The districts do not fully mirror the dispute compositions in Table 8 above for their different
regions but they include significant numbers of the most common types of dispute cited earlier by
household survey respondents.
28
Interview, Programme Coordinator, Hornpeace, 08/08/09

21
Map 2 - Hotspots for disputes (districts)
Lughaya District: 65 in 6 communities, including 19 farm, 18 water and 11 land title disputes
Gabilay District: 40 in 4 communities, including 11 charcoal, 8 farm and 7 enclosure disputes
Hargeisa A-D District: 20 in 2 communities, comprising entirely of land title disputes
Boroma District: 96 in 10 communities, including 40 land title, 38 farm and 19 compensation disputes
Balligubadle District: 29 in 4 communities, including 20 farm, 6 water and 3 land title disputes
5.2 Crime in Somaliland
Compensation payments are normally one part of the system of redress when one party has been the
victim of a wrong from another, which may often indicate a crime has taken place. As disputes over
compensation payments are, together with disputes over criminal activity itself, the two most common
types of disputes in Somaliland, it is necessary to look more closely at what sort of crimes these two
types of issues commonly involve and what sort of impact they have on the population.
The issue of how to assess which crimes are actually taking place is a challenging one, as the police as
yet have no quality-assured centralised database or institutionalised electronic system for recording
crime information,29
making it difficult to directly contrast empirical evidence of crime with the
perceptions of the population on the issue. Meanwhile, the public often do not even report crime,
preferring to seek redress through other channels30
, meaning the picture relating to crime in official crime
statistics is at any rate incomplete. However, information gathered from interviews with police at the
district level, together with the reports of incidents provided by the traditional leaders interviewed in each
community, who are often closely involved in mediating disputes and dealing with criminal incidents,
provide some indication of the situation relating to crime in Somaliland that can be used for comparative
purposes. However, unfortunately 25 of the 31 district police interviewed declined to share their districts
crime records which made it difficult to make accurate comparisons with the incident data cited in the
29
Although in 2009 the MoI started piloting the collation of crime data from two police stations for use in a database
with GIS applications to enable crime mapping. Interview, Policy Advisor, MoI, 09/07/09 30
For more information on this subject see chapter 6 on Security Providers
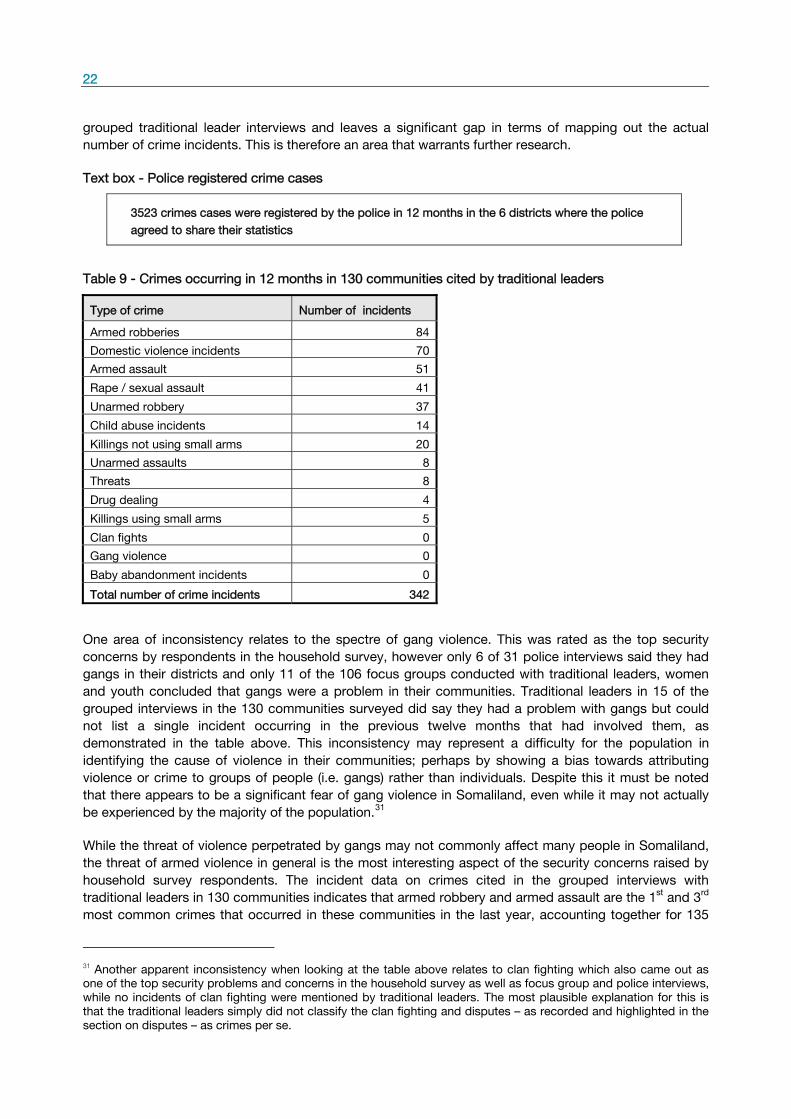
22
grouped traditional leader interviews and leaves a significant gap in terms of mapping out the actual
number of crime incidents. This is therefore an area that warrants further research.
Text box - Police registered crime cases
3523 crimes cases were registered by the police in 12 months in the 6 districts where the police
agreed to share their statistics
Table 9 - Crimes occurring in 12 months in 130 communities cited by traditional leaders
Type of crime Number of incidents
Armed robberies 84
Domestic violence incidents 70
Armed assault 51
Rape / sexual assault 41
Unarmed robbery 37
Child abuse incidents 14
Killings not using small arms 20
Unarmed assaults 8
Threats 8
Drug dealing 4
Killings using small arms 5
Clan fights 0
Gang violence 0
Baby abandonment incidents 0
Total number of crime incidents 342
One area of inconsistency relates to the spectre of gang violence. This was rated as the top security
concerns by respondents in the household survey, however only 6 of 31 police interviews said they had
gangs in their districts and only 11 of the 106 focus groups conducted with traditional leaders, women
and youth concluded that gangs were a problem in their communities. Traditional leaders in 15 of the
grouped interviews in the 130 communities surveyed did say they had a problem with gangs but could
not list a single incident occurring in the previous twelve months that had involved them, as
demonstrated in the table above. This inconsistency may represent a difficulty for the population in
identifying the cause of violence in their communities; perhaps by showing a bias towards attributing
violence or crime to groups of people (i.e. gangs) rather than individuals. Despite this it must be noted
that there appears to be a significant fear of gang violence in Somaliland, even while it may not actually
be experienced by the majority of the population.31
While the threat of violence perpetrated by gangs may not commonly affect many people in Somaliland,
the threat of armed violence in general is the most interesting aspect of the security concerns raised by
household survey respondents. The incident data on crimes cited in the grouped interviews with
traditional leaders in 130 communities indicates that armed robbery and armed assault are the 1st and 3
rd
most common crimes that occurred in these communities in the last year, accounting together for 135
31 Another apparent inconsistency when looking at the table above relates to clan fighting which also came out as
one of the top security problems and concerns in the household survey as well as focus group and police interviews,
while no incidents of clan fighting were mentioned by traditional leaders. The most plausible explanation for this is
that the traditional leaders simply did not classify the clan fighting and disputes – as recorded and highlighted in the
section on disputes – as crimes per se.

23
incidents of the 342 recorded. This indication of the pervasiveness of armed violence is confirmed by
police interviews, where information on the approximate number of killings and assaults which had taken
place over the past year was collected. The information, which is demonstrated in the Table 10 below,
suggests amongst others that 45 people were killed with small arms in the last year.
The suggestion from the security concerns cited by respondents are that they recognise the serious
threat posed by armed violence in the context of gang violence, but do not identify armed violence as
being something that can manifest itself in more everyday crime, like robbery or assault – which evidence
in the Tables 9 and 10 suggest it does. The conclusion one could draw from this interpretation is that
more awareness-raising is needed to make the population aware that armed violence is not just an
occurrence in gang violence but a common occurrence in their communities that has a real impact on
their lives personally as well as on the lives of those around them.
Table 10 - Armed violence statistics from police interviews
Type of crime Number of victims in last year
Killings using small arms 45
Killings using knives 14
Killings using other means 13
Assaults using small arms 6
Assaults using knives 20
Assaults using other means 6
It is not possible to attain accurate verification of overall crime and violence figures from the presented
data, however when analysing the proportions of different types of killings, it is noticeable that whereas
the police say 40% of killings are committed using small arms, only 20% of killings cited by traditional
leaders were committed using small arms. By contrast the police information suggests 20% of assaults
are committed with small arms in comparison to 86% reported by the traditional leaders. It is not
possible with the data available to determine which of the two represents the norm in terms of murder
and assault in Somaliland but it should be noted that on both scales, either killings or armed assaults
would increase if the other were to decrease, so these inconsistencies in no way remove from the
seriousness of the armed violence problem that has been highlighted and which requires sustained
attention from actors in the field of community safety.
Text box - Armed violence and crime
Armed robberies, armed assaults and killings using small arms accounted for 40.9% of crime
incidents recorded by traditional leaders in 12 months
12 out of the 35 victims who gave detailed information on the crime or violent encounter they
experienced said their assailant had a small arms
31 district police identified 45 deaths caused by small arms in 12 months
The need for further work on armed violence reduction is also highlighted by the number of people who
have experienced threatening behaviour, particularly threatening behaviour from someone with a small
arm. When respondents in the household survey were asked whether they or a member of their
household had been threatened or made to feel fearful by someone with a small arm within the last year,
67 households out of 2846 said that they had. Further information was collected in 29 of these 67
incidents which, while exercising caution over the limited sample size, indicated that the victims of such
threats are most likely to be males in their twenties, in line with the wider findings on victims of crime
outlined below. More than half of these incidents took place in public places, such as in the street,
market or at public gatherings and it is entirely possible that many such threats occur and are simply not
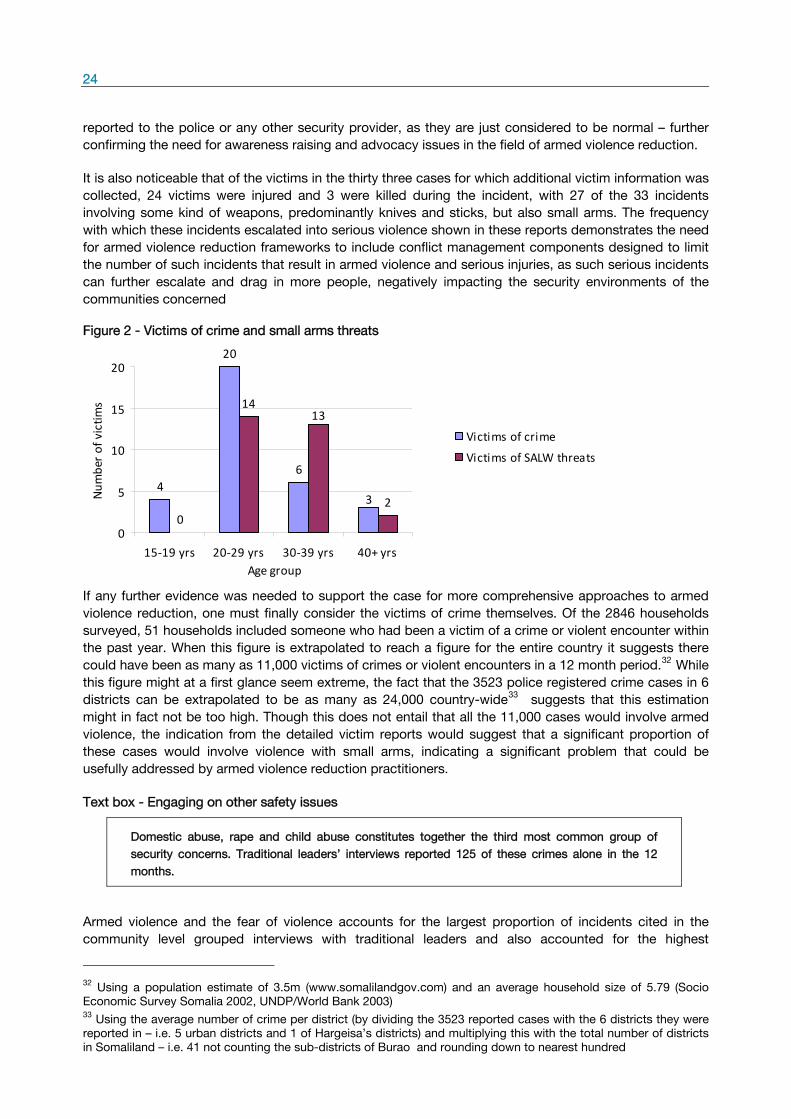
24
reported to the police or any other security provider, as they are just considered to be normal – further
confirming the need for awareness raising and advocacy issues in the field of armed violence reduction.
It is also noticeable that of the victims in the thirty three cases for which additional victim information was
collected, 24 victims were injured and 3 were killed during the incident, with 27 of the 33 incidents
involving some kind of weapons, predominantly knives and sticks, but also small arms. The frequency
with which these incidents escalated into serious violence shown in these reports demonstrates the need
for armed violence reduction frameworks to include conflict management components designed to limit
the number of such incidents that result in armed violence and serious injuries, as such serious incidents
can further escalate and drag in more people, negatively impacting the security environments of the
communities concerned
Figure 2 - Victims of crime and small arms threats
4
20
6
0
14
23
13
0
5
10
15
20
15‐19 yrs 20‐29 yrs 30‐39 yrs 40+ yrsAge group
Num
ber of victim
s
Victims of crime
Victims of SALW threats
If any further evidence was needed to support the case for more comprehensive approaches to armed
violence reduction, one must finally consider the victims of crime themselves. Of the 2846 households
surveyed, 51 households included someone who had been a victim of a crime or violent encounter within
the past year. When this figure is extrapolated to reach a figure for the entire country it suggests there
could have been as many as 11,000 victims of crimes or violent encounters in a 12 month period.32
While
this figure might at a first glance seem extreme, the fact that the 3523 police registered crime cases in 6
districts can be extrapolated to be as many as 24,000 country-wide33
suggests that this estimation
might in fact not be too high. Though this does not entail that all the 11,000 cases would involve armed
violence, the indication from the detailed victim reports would suggest that a significant proportion of
these cases would involve violence with small arms, indicating a significant problem that could be
usefully addressed by armed violence reduction practitioners.
Text box - Engaging on other safety issues
Domestic abuse, rape and child abuse constitutes together the third most common group of
security concerns. Traditional leaders’ interviews reported 125 of these crimes alone in the 12
months.
Armed violence and the fear of violence accounts for the largest proportion of incidents cited in the
community level grouped interviews with traditional leaders and also accounted for the highest
32
Using a population estimate of 3.5m (www.somalilandgov.com) and an average household size of 5.79 (Socio
Economic Survey Somalia 2002, UNDP/World Bank 2003) 33
Using the average number of crime per district (by dividing the 3523 reported cases with the 6 districts they were
reported in – i.e. 5 urban districts and 1 of Hargeisa’s districts) and multiplying this with the total number of districts
in Somaliland – i.e. 41 not counting the sub-districts of Burao and rounding down to nearest hundred

25
proportion of respondents listed security concerns. Violence against women and children however,
accounted for the third highest proportion of security concerns and the second highest proportion of
incidents cited in the community level grouped interviews with traditional leaders. While not the most
serious safety and security concern of the population, or the most frequently occurring types of crimes,
violence against women and children is still a significant problem that is both recognised and requires
attention. The recognition of the issue by the population is further confirmed by 5 of 31 focus group
interviews with traditional leaders, 10 of 31 with women and 11 of the 44 focus groups conducted with
youth that cited these crimes as key security concerns within their communities. The evidence that these
crimes are occurring frequently confirms that they constitute a very real safety threat that deserves
significant attention; the fact that so many people have recognised them as a security concern would
also indicate a willingness among both influential members of communities and the population at large to
engage on the subject.
In an effort to assess geographically where crime is most prevalent in Somaliland, the incidents of crime
reported in the traditional leaders interviews were broken down by district. There were several districts
that, as with disputes, seemed to be suffering disproportionately in comparison with others in terms of
the average number of crimes occurring in individual communities. These locations are illustrated in Map
3 below.
Map 3 - Hotspots for crime (districts)
Madheera District: 31 crimes in 3 communities, including 9 cases of domestic violence, 7 of unarmed
robbery and 7 of child abuse. Police in Madheera said they traditional leaders deal with domestic
violence
Garadag District: 19 crimes in 3 communities, including 6 cases of domestic violence, 5 rapes and 5
assaults. The police in Garadag say it is hard to acquire small arms, explain the unarmed crimes
Sheekh District: 34 crimes in 6 communities, including 14 cases of domestic violence, 6 threats, and 4
unarmed robbery. The police consider disputes and rape as the main problems they face in Sheekh
Ceelafweyne District: 19 crimes in 3 communities, including 6 cases of domestic violence, 6
knifings/shootings and 4 unarmed robbery. Police said 25 people had been hurt by SALW and 9 by
knives in 12 months

26
5.3 Conclusions on disputes and crimes
People are clearly concerned about disputes over criminal activity and compensation payments, as they
account for two of the top three most common disputes cited by household survey respondents,
however it seems likely that their wider security concerns may have biased their assessment of how
common these two types of dispute are. When analysing answers on the three most common disputes
combined, disputes over farms was by far the most common, followed by disputes over charcoal burning
and water sources. This represents the increasing competition over natural resources, a trend also
identified by organisations working in the field of dispute resolution34
. This evidence indicates that natural
resources should receive the full focus of actors in the sector, along with government agencies
responsible for issues such as property rights where institutional soft spots may feed into and prolong
such disputes.
On the issue of crime, it is clear that people are concerned by armed violence but currently associate it
with threats like gangs, whereas it appears to more commonly occur in the context of incidents such as
armed robberies and armed assaults, which together account for the greatest proportion of crimes. The
high number of victims of crime and violent encounters, which commonly involve armed perpetrators,
indicate that there is a significant need for armed violence reduction interventions on these issues,
preceded by awareness-raising and advocacy activities to sensitize the populations involved to the
problems of SALW and the impact they have on their communities. The second highest proportion of
crimes occurring was the grouping of violence against women and children, which also accounted for the
third highest proportion of security concerns among household survey respondents. There appeared to
be more direct recognition of this safety issue, even though it is less common than armed violence.
Despite this, the level of recognition suggests that communities would be willing to engage on the issues
if any organisations working in the fields of rights or protection wished to address them
34
Interview, Programme Coordinator, Hornpeace 08/08/09 and Interview, Sheikh Ismail, DRC/FCA Religious Leaders
Programme with Horn University, 10/08/09

27
Chapter 6 Security Providers in Somaliland Somaliland emerged from civil war in the mid nineties in large part thanks to the work of traditional clan
leaders and religious leaders, who managed through a series of truces and negotiated agreements, to
eventually bring peace to most of the country. Although some lingering problems remain unresolved, this
peace has largely held for over a decade to the present day and the creation of a functioning government
in Somaliland has allowed for the development of a variety of institutions, including a new police force.
Two of the characteristics of the internal safety and security environment that has evolved in Somaliland
in this time are the overlapping responsibilities and competencies of different security providers35
that
have developed as a response to the initial – and to some extent remaining – capacity gaps that the
police were dealing with. However, these overlaps also predate the creation of the Republic of
Somaliland. To properly comprehend the situation relating to security providers, it is necessary to look
not only at the police, but also the traditional leaders and religious leaders who continue to play a major
role at both nationwide and grassroots levels in maintaining safety and security now, as they have done
in the past. Understanding how these different actors operate and cooperate and how they are perceived
by the general population they serve will provide some of the information needed by actors working in
the in the field of community safety to identify ways to work with security providers and understand what
kind of support is needed.
6.1 Reporting Crime Text box – Assistance with crime and disputes
98,8% of the population would inform someone if they saw or experienced a crime
97,7% of the population would go to someone for a solution if they saw or experienced a dispute
In response to the question of whether they would inform someone if they saw or experienced a crime,
98.8% of people in the household survey said they would. When those respondents were then asked
who they would turn to, 71% said they would inform the police, 26.2% said they would tell traditional
leaders and 0.9% said they would inform religious leaders, with family, friends and the military
accounting for the remaining groups approached. The large number of respondents who would inform
the police if they saw or experienced a crime is a positive affirmation of the police’s position as primary
security provider in criminal matters. However, the significant proportion of people who would rather
inform traditional leaders suggests a sizeable sub-section of the population for whom the police do not
hold such an absolute role as safety and security guarantor.36
35
For clarification of what are termed ‘security providers’ and the terms ‘safety’ and ‘security’ see definitions in the
glossary 36
For an interpretation of the scores for religious leaders, please see “Who solves disputes and crime”

28
Figure 3 - Who would you inform if you saw or experienced a crime?
71%
26,20%
0,90%
1,90%
Would inform police
Would inform traditionalleaders
Would inform religiousleaders
Would inform others
Gender and clan affiliation were shown to have no significant impact on the answers given by
respondents on who they would inform if a crime occurred. However, age did have a significant impact
on the answers given by respondents. The figure below demonstrates that the younger the respondent
the greater likelihood there is of them informing police of crimes increases. By contrast, older
respondents were more likely with age to turn to traditional leaders if they see or experience a crime. This
would seem to indicate that the younger generation have a view of the police as a legitimate safety and
security provider that they can turn to in times of trouble which their parents, brought up in a time where
the police were used oppressively by the regime, will take longer to fully accept. This question is covered
in more depth in the section on trust in security providers. It is noticeable that only a small number of
respondents said that they would inform religious leaders if they saw or experienced a crime. According
to one key informant interviewed for the survey37
, this may be due to the fact that religious leaders will
normally only step in to assist on issues when both parties agree to arbitration – a situation that may not
arise so often in the case of crime, where a perpetrator is unlikely to agree to mediation unless left with
no other choice.
Figure 4 - Who would you inform if you saw or experienced a crime (age)?
010
2030
4050
6070
8090
100
15‐19 yrs 20‐29 yrs 30‐45 yrs 45+ yrs
% of respo
ndents
Inform police
Inform traditionalleaders
The most significant differences in who respondents said they would inform if they saw or experienced a
crime were seen when respondents were split between those living in urban areas and those living in
rural areas. In urban areas 96.4% of respondents said they would inform police but in rural areas, if a
crime occurred only 58.1% of respondents said they would inform the police, with 39.8% choosing
instead to inform traditional leaders. This trend is represented in the figures below. This divergence in
answers is due in large part to the geographical distribution of the police and their ability to maintain a
37
Interview, Programme Coordinator, Hornpeace, 29/08/09
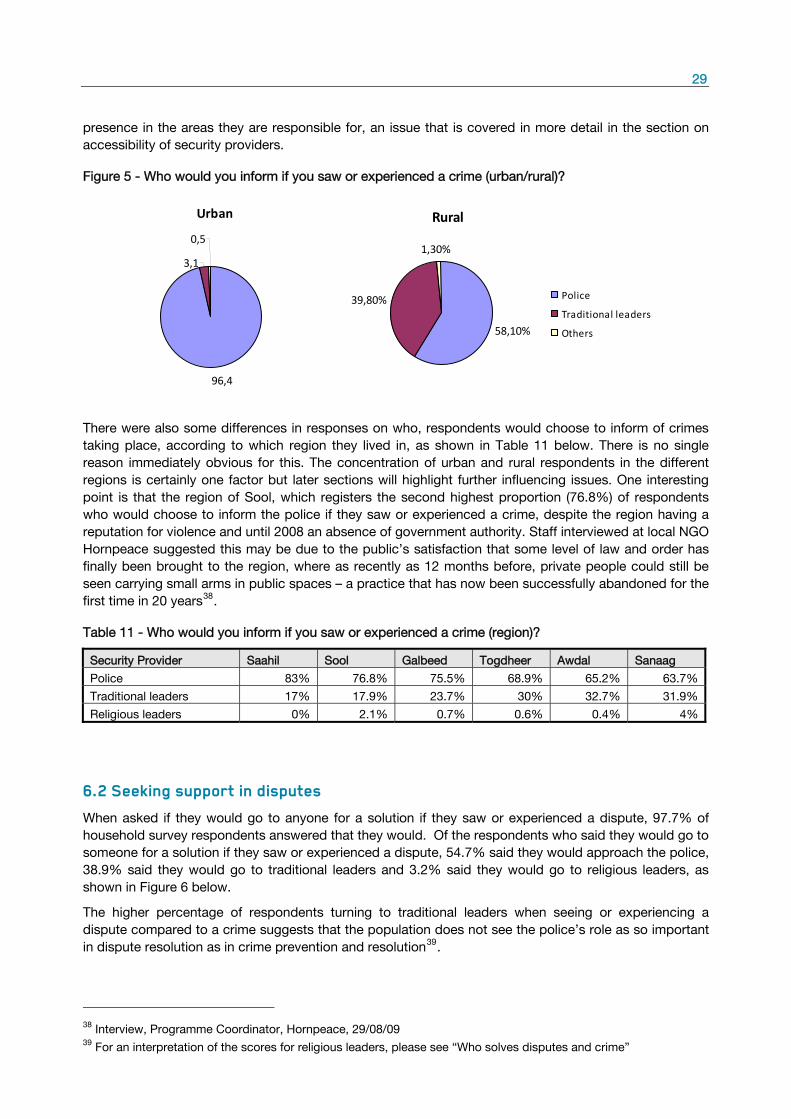
29
presence in the areas they are responsible for, an issue that is covered in more detail in the section on
accessibility of security providers.
Figure 5 - Who would you inform if you saw or experienced a crime (urban/rural)?
Urban
96,4
3,1
0,5
Rural
58,10%
39,80%
1,30%
Police
Traditional leaders
Others
There were also some differences in responses on who, respondents would choose to inform of crimes
taking place, according to which region they lived in, as shown in Table 11 below. There is no single
reason immediately obvious for this. The concentration of urban and rural respondents in the different
regions is certainly one factor but later sections will highlight further influencing issues. One interesting
point is that the region of Sool, which registers the second highest proportion (76.8%) of respondents
who would choose to inform the police if they saw or experienced a crime, despite the region having a
reputation for violence and until 2008 an absence of government authority. Staff interviewed at local NGO
Hornpeace suggested this may be due to the public’s satisfaction that some level of law and order has
finally been brought to the region, where as recently as 12 months before, private people could still be
seen carrying small arms in public spaces – a practice that has now been successfully abandoned for the
first time in 20 years38
.
Table 11 - Who would you inform if you saw or experienced a crime (region)?
Security Provider Saahil Sool Galbeed Togdheer Awdal Sanaag
Police 83% 76.8% 75.5% 68.9% 65.2% 63.7%
Traditional leaders 17% 17.9% 23.7% 30% 32.7% 31.9%
Religious leaders 0% 2.1% 0.7% 0.6% 0.4% 4%
6.2 Seeking support in disputes
When asked if they would go to anyone for a solution if they saw or experienced a dispute, 97.7% of
household survey respondents answered that they would. Of the respondents who said they would go to
someone for a solution if they saw or experienced a dispute, 54.7% said they would approach the police,
38.9% said they would go to traditional leaders and 3.2% said they would go to religious leaders, as
shown in Figure 6 below.
The higher percentage of respondents turning to traditional leaders when seeing or experiencing a
dispute compared to a crime suggests that the population does not see the police’s role as so important
in dispute resolution as in crime prevention and resolution39
.
38
Interview, Programme Coordinator, Hornpeace, 29/08/09 39
For an interpretation of the scores for religious leaders, please see “Who solves disputes and crime”

30
Interestingly, when comparing the responses on whom respondents would inform of crimes and go to for
dispute solution, 89.2% of the people who would inform traditional leaders of crime would also go to
them for dispute resolution. This percentage is significantly greater than the number of respondents who
would seek out the assistance of the police (75.7%) and religious leaders (24.0%) which suggest that for
the fourth of the population who does choose to inform traditional leaders on crime, these same leaders
are their primary - if not perhaps not only - security provider in their everyday life. This may be the case
even though the population might actually in some ways view the police as their preferred security
provider (see findings on “who solves disputes and crime” in section 6.3).
Figure 6 - Who would you go to for a solution to a dispute?
54,70%38,90%
3,20%
3,20%
Police
Traditional leaders
Religious leaders
Others
There was not the same clearly discernable trend as in the case of the first question on crime when
respondents’ ages were taken into account and as before, gender and clan affiliation had no effect on
the answers given by respondents. There was again however, a clear difference between urban and rural
respondents’ answers. Traditional leaders were selected significantly more often by rural respondents
than their urban counterparts, at the expense of the police. The difference is demonstrated in Figure 7
below.
Figure 7 - Who would you go to for a solution to a dispute (urban/rural)?
Urban
86,6%
10,0%3,4%
Rural
57,0%
38,5%
4,5%
Police
Traditional leaders
Others
It is noticeable though that, in urban areas, fewer people would seek the assistance of the police to find a
solution to disputes as opposed to solving crime. This may again suggest that the population does not
see the police’s role as so important in dispute resolution as in crime prevention and may choose not to
seek their services even when, as in urban areas, they are easily accessible.
Table 12 - Who would you go to for a solution if you saw or experienced a dispute?
Security Provider Saahil Sool Galbeed Awdal Togdheer Sanaag
Police 78.6% 58.7% 56.5% 55.5% 51.7% 40.2%
Traditional leaders 20.7% 37% 37.6% 42% 46.2% 51.7%
Religious leaders 0.4% 1.1% 5.6% 1.4% 1.3% 5.5%
31
Again, when the responses on seeking support in dispute resolution are analysed according to the
region, there are significant differences, with Sanaag registering the lowest use of police for dispute
resolution with 40.2% of responses in that region, while Saahil registers highest with 78.6% of
respondents indicating they would seek the help of police in such matters. This may again - as in the
case of reporting crime - be attributed largely to the accessibility of police; Sanaag is the largest of
Somaliland’s regions, but has few police stations or police posts outside the main urban centre of
Erigavo, to cover its entire population.40
Sanaag correspondingly has a relatively high proportion of
respondents who said they would go to a traditional or religious leader for a solution if they saw or
experienced a dispute, as there is a larger space for non-police security providers41
.
6.3 Who solves disputes and crimes?
In focus group discussions with groups of traditional leaders, participants were unanimous in their
conclusion that they themselves as a group were responsible for solving disputes, in ‘the traditional way’,
meaning by negotiation and payment of compensation if necessary. The police largely agreed that the
traditional leaders are the primary solvers of disputes while they (the police) are more responsible for
dealing with crimes, while focus groups with female participants and youth participants reached the
same conclusions. It was noted however that certain types of dispute, for example over inheritances, are
commonly dealt with by religious leaders through arbitration, with some cases also transferred to
religious leaders by police or the courts – but only if both sides agree to the process. 42
The average response across all 31 focus groups with traditional leaders was that 70% of incidents were
solved by traditional leaders, with police solving the remaining 30%. The 31 police officers who were
interviewed claimed on average that they solved 40% of crimes and disputes, while traditional leaders
solved the remaining 60% which appears to confirm that traditional leaders are responsible for dealing
with a majority of incidents. More specifically, there appears to be a fairly consistent division of labour,
with 30 of 31 focus groups with traditional leaders saying that they cooperate with police on solving
crimes and disputes, with traditional leaders largely being responsible for dealing with domestic violence
and disputes, while the police are considered responsible for the job of dealing particularly with violent
crimes such as rape and murder, the suggestion being that the burden for lower level crime and civil
disputes is carried by the traditional leaders.43
Text box – Sharing the burden of solving crime and disputes
There is a division of labour between the traditional leaders and the police with the traditional
leaders largely being responsible for dealing with domestic violence and disputes and the police
being responsible for dealing with crimes
The exceptions to this division of labour were the regions of Sool and Sanaag, where traditional leaders
maintained that solving crime was a joint effort, a claim supported by the conclusions of female and
youth focus group participants in those regions. While traditional leaders are used to dealing with
disputes and some crimes in other regions, they do this as a secondary security provider to the police. In
Sanaag, police presence is scarce, while in Sool it has only been introduced at all fairly recently, as a
result traditional leaders in these regions are less likely to see police as the primary security provider
because they have rarely received assistance from them, and are more likely to see them as an equal
partner in all dispute and crime-solving matters.
40
Interview, Programme Coordinator, Hornpeace, 29/08/09
41 Galbeed also saw a high proportion of respondents answering in a similar way but this is probably due to
the main Islamic court in Somaliland being situated in Hargeisa, the main city in Galbeed.
42 Interview, various religious leaders, 31/08/09
43 Police in western countries do not normally deal with civil disputes, If these were discounted, police in Somaliland
would be responsible for dealing with a significantly higher proportion of the ‘crime’ that occurs

32
It is noticeable that the 29 of 31 female focus groups and 40 of 44 youth focus groups when asked
should be the primary security provider in an ideal world concluded that it should be the police and cited
the need to build their capacity, indicating that while non-formal security providers can step in to
maintain a safe environment, the population would still in an ideal world prefer that the police fulfil the
role. Interestingly the majority of police officers - 27 of 31 interviewed - suggested the situation could be
improved by greater engagement with the population. 12 of the 33 focus group interviews with
traditional leaders agreed with this conclusion but the remaining 19 said that police capacity had to be
increased to improve the relationship. The indication from these results is that while efforts in areas such
as community based policing could yield positive results, there may also be a need to provide additional
inputs to police, perhaps in terms of training, transport or communications.
Text box – Police as a security provider
In the ideal world, the population thinks that the police should be the primary security provider
Neither the focus group respondents nor the traditional leaders and police highlighted religious leaders
as main actors in solving disputes and crime which seem to correspond well with the low scores the
religious leaders received from the questionnaire respondents in terms of whom they would inform of
crimes and go to in a dispute situation. However, interviewed religious leaders themselves were adamant
that they had a central role to play as security providers.44
This apparent inconsistency might in fact just
reflect a distinction in roles. Religious leaders are highly respected and learned members of Somaliland
society who are often called upon to provide clarification on matters of Sharia law - indeed they have
previously been utilised to great effect to educate and sensitize traditional leaders on issues such as how
human rights and revenge killings should be approached from a religious perspective.45
Religious
leaders, however, are not entrusted to “do the leg-work”. This point was confirmed by several religious
leaders themselves as well as the Programme Coordinator for Hornpeace who highlighted the ability of
religious leaders to offer arbitration services when both parties agree to them, to provide educated and
impartial counsel to negotiating parties, to use their Sharia knowledge in setting compensation levels and
to record the terms of agreements after negotiations, but all agreed that religious leaders would not
normally be involved in negotiations themselves.46
These facts together would appear to suggest that religious leaders are not so much security providers
as security enablers, in that they can contribute to crime and dispute resolution at specific stages of the
process and with particular skills but they do not play the role of negotiator or enforcer, hence the low
scores they receive in this area from the household survey respondents. This interpretation was further
compounded, by a key informant who suggested that a question phrased as “To whom would you look
for guidance in solving a dispute?” might have elicited higher scores for religious leaders from the
population.47
Text box – Religious leaders as security enablers
Religious leaders can be viewed as security enablers who contributes with guidance and
council to the population and the other security providers
44
Interview, Sheikh Almis, DRC/FCA Religious Leaders Programme with Horn University, 04/08/09 45
Interview, Programme Coordinator, Hornpeace, 29/08/09 46
Interview, various religious leaders, 31/08/09 & Interview, Sheikh Almis, DRC/FCA Religious Leaders Programme
with Horn University, 04/08/09 & Interview Programme Coordinator, Hornpeace, 29/08/09 47
Interview, Programme Coordinator, Hornpeace, 29/08/09

33
6.4 Assessing the performance of security providers
This report aims only to analyse security providers inside Somaliland and as can be seen above, the main
actors in this area as far as the population are concerned are the police, traditional leaders and religious
leaders. The household survey sought to assess these three actors against a range of indicators that
might give an overall impression of how the population see them dealing with crime and disputes. It is
not an attempt to tell security providers what they should be doing or how they should be working, it is
merely intended to highlight areas of interest for community safety practitioners and issues that may
merit further focus.
Respondents in the household survey were asked to rank security providers on a scale of 0 to 4, where 0
was the worst and 4 the best. This scale allowed for the recalculation of the scores to provide average
percentages for each provider on each indicator, with 0 symbolising a satisfaction level 0% and 4 a
satisfaction level of 100%. The findings are thus presented in percentages in the following sections.
Figure 8 below gives a summary of these findings by providing the average score attributed to the three
security providers on five parameters.
Figure 8 - How do you rate security providers on dealing with crime and disputes?
62% 63% 64%
58%
77%73%
70% 69% 67%
54%
45% 47%50%
44%
67%
0%
10%
20%
30%
40%
50%
60%
70%
80%
90%
Trust Efficiency Access ibi l i ty Fami l iari ty Transparency
Mean Percentages
Pol ice
Traditional Leaders
Rel igious Leaders
With this as a guide, it is now necessary to examine each indicator in more depth which is done in the
following sections. However, an initial finding worth stressing is that the traditional leaders score highest
all on five parameters, with the police coming in second and the religious leaders receiving the lowest
scores. Figure 9 below illustrates the overall attitudes and perceptions of the three security providers.
Figure 9 - Overall attitudes and perceptions of security providers
62% 71%
49%
0%
10%
20%
30%
40%
50%
60%
70%
80%
Overal l
Average
Percentages
Pol ice
Traditional Leaders
Rel igious Leaders

34
6.5 Trust in security providers (average satisfaction level 69%)
For the purposes of the household survey and interviews conducted for the community safety report,
trust was understood to relate to how the population perceive the ability of security providers to
discharge their duties in crime prevention and dispute, in layman’s terms, who people think can help
them with their problem and protect their interests.
The levels of trust put in the police were higher among the youngest and oldest respondent age groups
than in the middle age groups from 20-45 years, a fact that may be due to these groups having
experienced proportionately the least time of effective and democratic policing in comparison to the
youngest and oldest age groups. Police scores saw only a very small negative correlation between rising
income levels and trust, suggesting that trust in police is fairly universal regardless of income. Minority
and majority clan members overall rated levels of trust in police at similar levels, although it was
noticeable that 19.1% of minority respondents gave police the lowest possible score - zero on a scale of
zero to four – compared to only 8.1% of majority respondents, the implication being that some sections
of minority groups may not be engaging with the police at all because they don’t trust them.
Religious leaders scored highest on trust among the highest age group, those aged 46 years and older,
with the lowest scores coming from respondents aged between 20 and 45 year olds, perhaps for similar
reasons as with the different levels of trust of the police, where older people have more experience of
turning to non-formal security providers like religious leaders for assistance in solving crime and
disputes. Interestingly, a significant negative correlation was visible in terms of income. As income
increases, trust in religious leaders to deal with crime and disputes decreases. There is no immediate or
obvious explanation to this, so this issue might warrant further research.
Finally, it is interesting that religious leaders in Galbeed scored relatively poorly compared to other
regions. Hargeisa has one of only two Islamic courts in Somaliland48
and a large concentration of
mosques and religious schools, which would normally suggest a high degree of familiarity and trust from
the community but this is patently not the case. Further investigation is needed to provide a more
accurate interpretation of this finding as well.
Traditional leaders saw strongest levels of trust among the oldest age group, with less support among
people aged 15 to 45 years old, as in the case of religious leaders. As with trust levels in the police, this
may in part be due to the life experiences of these age groups; where older members of society have a
longer memory of all the times when traditional leaders have ensured their safety and place a greater
trust in traditional leaders as a result, as opposed to younger respondents, who are less familiar with the
role of traditional leaders in justice dispensation but are able to access police services more easily. It
could however also simply be that younger people recognise their inferior social status in relation to
traditional leaders and trust the police as a more status-neutral provider in this respect. Interestingly, as
in the case of religious leaders, there was a significant negative correlation between income of
respondents and level of trust in traditional leaders, with richer members of the population being
increasingly distrustful of traditional leaders. Again, further investigation is needed on this issue. It could
just be that more well-off people in general have lower trust levels in security providers and that the only
reason the trust level in the police does not similarly decrease as income increases is that it this general
tendency is counterbalanced by the fact that the police (as illustrated in the section about accessibility) is
more accessible to higher income groups and this increased accessibility affects trust ratings.
48
The other is in Burao

35
Figure 10 - Average trust in security providers by income
0
0,5
1
1,5
2
2,5
3
3,5
4
4,5
0‐10.000sh 10.000‐19.000sh 20.000‐39.000sh 40.000sh +Income group
Average score from
0 to
5
Pol ice
Traditional leaders
Religious leaders
When analysed according to region, some interesting findings emerged as illustrated in Figure 11 below.
Figure 11 - Average trust in security providers by region
0102030405060708090
100
Saahil Sanaag Sool Togdheer Galbeed Awdal
% of respo
ndents
Pol ice
Traditional leaders
Religious leaders
Results in Saahil are very positive across the board, suggesting there is limited need for immediate
interventions to support security providers’ existing efforts in this region. Results from Awdal region
meanwhile appear to indicate that the public has lost a significant amount of faith in both traditional
leaders and religious leaders. One possible reason for this could be that Awdal has had the highest
number of returnees from, amongst others, Djibouti over the last years49
. Certain parts of the population
in Awdal might thus be less accustomed to the informal Somaliland systems of security provision.
The lowest scores in trust by region for the police were in Sanaag. This can partly be attributed to the
remoteness of the region from central support and the small number of police stations in the region who
has to cover a very large geographical area with widely dispersed population and low-quality roads.50
Focus group interviews with traditional leaders in the region indicated that they were used to dealing with
problems without the help of the police, hence the relatively high trust scores for traditional and religious
leaders in the region. Statistical analysis discovered a significant relationship that showed strong positive
correlations between trust levels and scores in the other indicators of especially efficiency and
accessibility, where increases in the latter improved scores in trust. This supports the explanation that
the trust level has to do in part with the lack of accessibility. It also suggest, that any efforts to improve
accessibility and efficiency of security providers in those regions in particular would have a positive
knock on effect for trust in police as a whole, making future work with communities in those regions
easier.
49
According to UNHCR statistics 29,835 returnees were settled in Awdal between 2004 and 2007 50
Interview, Programme Coordinator, Hornpeace, 29/08/09

36
Text box – Security providers and efficiency
People’s perception of the security provider’s efficiency and accessibility significantly affects
their trust in these security providers
6.6 Efficiency of security providers (average satisfaction level 60%)
The indicator of efficiency was designed to assess how effective security providers were at discharging
their duties in terms of dealing with crime and disputes.
Police efficiency scores did not see any correlation according to the gender, clan affiliation or age group,
nor was there a significant correlation between income and perceived levels of police efficiency. This
latter point is pertinent, as it suggests that people regardless of income believe the police are willing to
provide efficient assistance, although they are constrained by a lack of resources51
. This hypothesis is
supported by the results of focus group discussions that claim police are too poorly paid and resourced
to be able to conduct proper investigations unsupported, but are much more efficient when proper
resources are available. This idea is also supported by interviews with police themselves, 28 of 31 of
whom claimed to have ‘good’ or ‘very good’ relations with the communities they served against only
three who said relations were ‘not good’ or ‘poor’ and the focus groups with traditional leaders that
indicate the police are called for complex and serious cases, particularly violent ones, suggesting they
have confidence in the police’s ability to handle such cases efficiently. The positive conclusion on this
issue is that police efficiency, while constrained is largely recognised as at least satisfactory by the
majority of the population.
Figure 12 - Average efficiency rankings for security providers by age group
0
0,5
1
1,5
2
2,5
3
3,5
4
4,5
15‐19 yrs 20‐29 yrs 30‐45 yrs 46 yrs +
Average
score on a scale from
0 to 5
Police
Traditional leaders
Religious leaders
In the scores for religious leaders, there was no correlation according to gender, income or clan but there
was a significant correlation between age and efficiency levels, with older age groups of the population
shown to believe religious leaders more efficient in dealing with crime and disputes than the younger age
groups, in a correlation similar to that seen between trust in religious leaders and the age of respondents.
This may be due to the status of religious leaders, as older members of their communities, along with the
work that they undertake on crime and disputes, being best known by those of a similar age. However it
may also demonstrate a cultural shift between the generations, with younger age groups of the
population perhaps seeing religious leaders as less central to the role of crime prevention and dispute
resolution than their older counterparts, and hence less efficient at solving such issues in comparison to
other actors such as the police.
51
As discussed earlier, 19 of 31 focus groups with traditional leaders concluded that to improve the relationship
between police and communities (and hence performance), police capacities needed to be strengthened
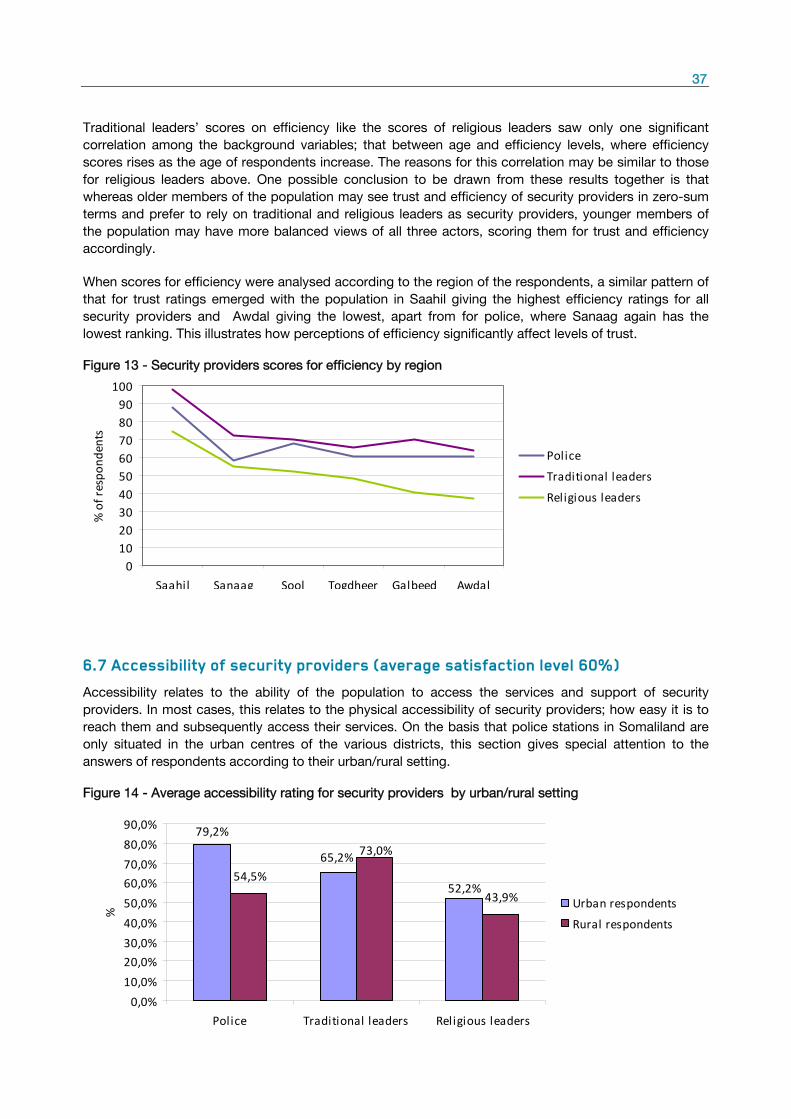
37
Traditional leaders’ scores on efficiency like the scores of religious leaders saw only one significant
correlation among the background variables; that between age and efficiency levels, where efficiency
scores rises as the age of respondents increase. The reasons for this correlation may be similar to those
for religious leaders above. One possible conclusion to be drawn from these results together is that
whereas older members of the population may see trust and efficiency of security providers in zero-sum
terms and prefer to rely on traditional and religious leaders as security providers, younger members of
the population may have more balanced views of all three actors, scoring them for trust and efficiency
accordingly.
When scores for efficiency were analysed according to the region of the respondents, a similar pattern of
that for trust ratings emerged with the population in Saahil giving the highest efficiency ratings for all
security providers and Awdal giving the lowest, apart from for police, where Sanaag again has the
lowest ranking. This illustrates how perceptions of efficiency significantly affect levels of trust.
Figure 13 - Security providers scores for efficiency by region
0102030405060708090
100
Saahil Sanaag Sool Togdheer Galbeed Awdal
% of respo
ndents
Police
Traditional leaders
Religious leaders
6.7 Accessibility of security providers (average satisfaction level 60%)
Accessibility relates to the ability of the population to access the services and support of security
providers. In most cases, this relates to the physical accessibility of security providers; how easy it is to
reach them and subsequently access their services. On the basis that police stations in Somaliland are
only situated in the urban centres of the various districts, this section gives special attention to the
answers of respondents according to their urban/rural setting.
Figure 14 - Average accessibility rating for security providers by urban/rural setting
79,2%
65,2%
52,2%43,9%
73,0%
54,5%
0,0%
10,0%
20,0%
30,0%
40,0%
50,0%
60,0%
70,0%
80,0%
90,0%
Police Traditional leaders Religious leaders
%
Urban respondents
Rural respondents

38
As illustrated in Figure 14 above perceptions of accessibility of local security providers differed between
urban and rural settings. In the urban sample, respondents viewed police as being significantly more
accessible than both religious leaders and traditional leaders. However, amongst the rural sample,
respondents found traditional leaders to be significantly more accessible than both religious leaders and
the police.
The reason for the large gap between urban and rural accessibility ratings for police may in large part be
due to a limited outreach of police because of lack of resources, such as vehicles and funding for fuel. It
is the responsibility of the victims of crime themselves to seek assistance. If this requires at the very least
a long trip to the nearest police station, potentially followed by partial contributions to fuel etc in order to
be able to access police services,52
it simply may not be undertaken or considered by many people
because of the costs – hence the low score for police accessibility among rural respondents.
It is noticeable that traditional leaders enjoy strong scores among both urban and rural respondents.
There is some indication therefore that although the police are the most accessible security provider in
urban areas; traditional leaders are still widely accessible in towns. Religious leaders, on the other hand,
enjoy by far the lowest accessibility ratings in both settings, particularly in rural settings, suggesting that
the penetration of religious leaders into the deeper rural areas is not as complete as their urban presence
and certainly less than that of traditional leaders.
There were no significant correlations between income levels of respondents and accessibility of
traditional or religious leaders, with respondents of all incomes feeling equally able to access their
services. There was however a significant negative correlation between the income of respondents and
accessibility levels of police, which was alluded to earlier. As the income of respondents decreases, so
too does their ability to access police services, as shown in Figure 15 below. This finding is particularly
important as it demonstrates that poorer people in Somaliland may in some circumstances face a barrier
to accessing the police services which the population have been shown to want, as described earlier in
this chapter.
Figure 15 - Income and access to police services
0
10
20
30
40
50
60
70
80
90
100
Group 1 Group 2 Group 3 Group 4 Group 5
Respondents by perceived income group (where 1 is lowest and 5 is highest)
% score fo
r po
lice accessibility
The security provider scores did not see any correlation on the grounds of gender or clan; however it was
notable that double the proportion of majority clan members scored the police 0 for accessibility in
comparison to majority clan members’ gender or clan background and levels of accessibility. But they
did experience a correlation between age and accessibility. As age increased scores of accessibility
52
Interview, various religious leaders, 31/08/09 & Interview Programme Coordinator, Hornpeace, 29/08/09 &
Interview, UNDP Community Safety / AVR analyst, 12/07/09

39
decreased for police. On the other hand accessibility scores for religious and traditional leaders
increased with age. Again, this might be explained in the historical context of younger members of the
population being more used to the police as an obvious security provider while older generations are
more used to traditional and religious leaders.
When the scores on accessibility were analysed according to region, similar trends as with trust and
efficiency were shown in each region again confirming the close link between trust scores and efficiency
and accessibility scores.
Figure 16 - Accessibility of security providers by region
01020304050
60708090
100
Saahil Sanaag Sool Togdheer Galbeed Awdal
% of respo
ndents per region
Police
Traditional leaders
Religious leaders
It is worth noting that there is one repeated exception to the overall trend detected with scores for all
security providers on trust, efficiency and accessibility decreasing across the board from Saahil to Awdal;
Sool always seem to register the second highest scores for police instead of the third as for the other
security providers in most cases. As has been earlier discussed, the regional capital of Lasanood has
only recently begun to see signs of governmental authority after two decades without governmental
support. This positive score for police could be attributed to a sense of thanks to the government for
providing basic law and order again in Lasanood.53
It may also represent a positive impression of police
from a population more used in recent years to security being provided by the military than a more
accountable civilian police force.
6.8 Familiarity with Security Providers (average satisfaction level 54.7%)
For the purposes of this survey, familiarity was understood to mean how aware people are of different
security providers, how comfortable they are with them and how familiar they are with the different tasks
these security providers fulfil.
There is no correlation between respondents’ age, gender or clan background and levels of familiarity.
However, it is noticeable that there is a small positive correlation between income and familiarity levels
for all three security providers, where familiarity with security providers increases with income. Given the
social status of religious and traditional leaders in Somali society and also to a certain extent the police, it
is probable that wealthier segments of the population, equal in status to these groups, are more familiar
with them simply because they have more contact with them.
When the scores on accessibility were analysed according to region the same trend as previously
occurred, although less pronounced than in the case of the other parameters.54
53
Interview, Programme Coordinator, Hornpeace, 08/08/09 54
Please note that the questions on familiarity and transparency were added to the questionnaire after data
collection in Saahil. The dataset therefore does not include data from Saahil on this.

40
Figure 17 - Familiarity of security providers by region
0%
10%
20%
30%
40%
50%
60%
70%
80%
Sanaag Sool Togdheer Galbeed Awdal
Average percentage of familiarity
Police
Traditional leaders
Religious leaders
6.9 Transparency of Security Providers (53.7%)
For the purposes of this survey, transparency was understood to be how open the different security
providers are in how they conduct the tasks that they are responsible for.
Figure 18 - Transparency of security providers (by age)
00,51
1,52
2,53
3,5
44,55
15‐19 yrs 20‐29 yrs 30‐45 yrs 46 yrs +
Average score on a scale
Police
Traditional leaders
Religious leaders
There were no significant correlation between, gender, income, clan back ground and transparency.
Police scores, however, saw a significant negative correlation between age and transparency levels,
where as respondents increased in age their perceptions of police transparency decreased. This is a
similar correlation to that seen between accessibility of police and age, perhaps suggesting that one
reason older people are less willing or able to access police services is actually because their longer
personal history of the police has shown them to be non-transparent and even if this is not the case with
the current police service, there has not been sufficient time or visible change from the police service to
alter perceptions among older members of the population formed during the period of oppressive police
and military rule under the Barre regime. It was more difficult, however, to identify any correlations
between age and transparency scores for religious and traditional leaders, as the scores given by the
different sub groups were more consistent throughout, as demonstrated in Figure 18 above.

41
Figure 19 - Transparency of security providers by region
0%
10%
20%
30%
40%
50%
60%
70%
80%
Sanaag Sool Togdheer Galbed Awdal
Average percentage of transparency
Police
Traditional leaders
Religious leaders
Figure 18 above shows a similarly high level of transparency for the police in Sool and a lower level for
traditional leaders in Awdal that mirrors results for other indicators noted and explained earlier in this
chapter. This further confirms that scores for different indicators impact on each other.
6.10 Conclusions
It is clear from the evidence above that the police service enjoys a good satisfaction level with all groups
across Somaliland and is widely supported overall as the ideal primary security provider for dealing with
crime and to a lesser extent resolving disputes. It should be noted though that this is despite receiving
scores consistently lower than those given to traditional leaders, indicating that while the police are
accepted as the primary safety and security provider, it does not mean people accept their performance
on dealing with crime and disputes as being as good as the one of the traditional leaders.
One area of concern is the significantly different experience of the police enjoyed by urban and rural
populations. Accessibility of police is considerably better in urban areas, with traditional leaders in rural
areas often left to fill the void on dealing with safety and security issues. This is an important point; as
pointed out in the section on trust, there are strong positive correlations between how communities rate
security providers on especially accessibility and efficiency and the overall level of trust they
subsequently place in those security providers. Thus improvements in accessibility and efficiency of
police services could potentially create genuine improvements in the safety and security environment, by
increasing public trust in and engagement with the work of the police as part of a virtuous cycle. The
indication is that more resources are needed to enhance police capacity and to extend the police’s
geographical reach in rural areas, while better coordination is also needed to maximise use of existing
resources; for example in the wider use of community-based policing committees to pass information
more effectively between the police and rural settlements.
Traditional leaders have the highest ratings for all indicators in comparison to the police and religious
leaders and for more than a quarter of the population of Somaliland, they are the primary security
provider. Spread across all communities, traditional leaders enjoy a geographical penetration unmatched
by police and religious leaders, which is why they are often sought out to settle or negotiate agreements
in disputes. This does not however mean they fulfil this role in a vacuum, without input from others. As
pointed out earlier, traditional leaders largely prefer that the police play the role of primary security
provider. Furthermore, when traditional leaders do get involved in crime and dispute resolution, they may
seek the assistance of religious leaders to arrange initial truces or for expert counsel.
Religious leaders have the lowest scores across the board; both in terms of who people would inform of
crimes and turn to for solutions to disputes and in terms of the population’s rankings on the five
parameters. These scores appear to reflect a distinction in roles in that religious leaders seem to be not
so much security providers as security enablers, who can provide educated and impartial religious

42
council but who do not engage directly in solving crime or disputes - hence the low scores in relation the
population. The indication is that religious leaders do have a role to play in security, but that their
accessibility, both socially and geographically, means their role is not always fully understood by the
general population.
The reality is that police as well as traditional and religious leaders have a role to play in security
provision in Somaliland and their roles are both interlinked and interdependent. Rather than working
through separate programmes, implementing actors might potentially benefit from working more closely
with all groups and attempt to develop a more comprehensive framework to define areas of competence
and create a more integrated strategy for future conflict management interventions that avoids
duplication of effort.

43
Chapter 7 Legal and Policy Framework relating to SALW and ERW This section aims to explain the legal environment that governs the ownership, registration and trade of
SALW and ERW in Somaliland, with particular reference to ownership of personal weapons, especially
pistols and AK-47 assault rifles, as well as looking at international obligations concerning SALW and
ERW. This analysis is a starting point for looking at ERW and SALW issues in Somaliland in more depth
in the following chapters. The declaration of independence in Somaliland and the subsequent adoption of
a new constitution and various new laws have raised a number of legal questions with regards to SALW
and ERW. The main issue has been to determine what legal instruments are now valid and how future
laws could change the legal landscape. Broadly speaking, where a new law has not been introduced
since independence, the laws of the Republic of Somalia (1963-1991) continue to be recognised in
Somaliland. The general aim is that new laws passed since independence are gradually rendering use of
the old laws unnecessary, but in instances where the new laws are in conflict with the old, the new laws
will normally take precedence.
7.1 SALW Ownership
In the instance of laws pertaining to SALW, the first issue to address is one of terminology and definition.
There is some disagreement among practitioners over the definition of SALW, however most would agree
on the rules that they should be man-portable, crew-operated weapons. ‘Personal weapons’ meanwhile
would normally refer to side-arms and other small arms no larger than automatic rifles. The reason for
this clarification is that different laws currently in force in Somaliland refer to ‘heavy weapons’ and ‘light
weapons’ and while readers may equate light weapons with those included in the above term SALW and
heavy weapons as being other larger, non-SALW weapons, this is not the case in the legal framework
governing weapons in Somaliland. Some items, such as mortars, Rocket Propelled Grenades (RPGs) and
smaller calibre, belt-fed machine guns appear to have fallen through the gaps between laws in terms of
classification. The fact that these items are not permitted for private ownership infers that they are the de
facto property of the state; a fact that will not trouble the majority of small arms owners in Somaliland but
one that should be noted as it is symptomatic of the lack of clarity in some parts of the legal framework
pertaining to SALW in the country that may affect the success of regulation initiatives in the future.
Prior to independence, all issues of ownership, sale and trading of arms in Somaliland were regulated by
the Public Order Law, passed by the Mogadishu based government in 1963. In this law, the definition of
arms included any type of small arms and ammunition, as well as any item containing explosive
substances. This law required all traders of small arms to be registered and all private owners of arms to
be authorised by the relevant regional governor. The only small arms that could be authorised for private
ownership under this law were non-automatic war rifles; rifles and guns for hunting purposes and
pistols55
. In the absence of a new law over-riding this clause, this would technically mean that at present,
owners of automatic assault rifles – including the AK47 variant that is the overwhelmingly popular choice
of the 72.8% of household who own a small arms56
– are not technically able to either legally own such a
weapon or register it.
In practice, two facts have effectively over-ridden this technicality. The first is that in the aftermath of the
civil war, the government sought to bolster its forces and address the proliferation of weaponry under
private control by passing Law No. 70/95 in 1995, which effectively nationalised all heavy weaponry in
Somaliland not already under government control. This gave implicit recognition of SALW, including
automatic assault rifles, as being appropriate weapons for private ownership, although crucially it did not
explicitly define what constituted SALW. The second fact is that in 2006 Ministry of Interior (MoI) began
to implement a small arms registration scheme based on the draft registration bill currently under debate,
which explicitly refers to pistols and AK-47s as weapons that can be registered for personal ownership.
55
Article 28, 1963 Public Order Law 56
See chapter on Small arms Ownership for further details

44
So the issue of the most common weapons in private ownership has been addressed, but as in Law No.
70/95, the absence of a clear definition for what constitutes light weapons in the current draft of the
Registration bill may continue to cause confusion. The draft currently under debate stipulates that only
AK47 assault rifles or weapons of similar calibre and pistols are eligible for registration. Until the situation
is clarified, there may be a small number of small arms owners whose weapons are neither eligible for
legal registration nor clearly nationalised under Law No. 70/95. This may present a small loophole that
requires attention in the future so that it is made clear that such items are the property of the state.
7.2 Voluntary Licensing and Registration of SALW
Under the terms of the bill under discussion, a weapon permit will last four years and entitle the holder to
keep one weapon and one magazine of the relevant ammunition. The bill stipulates that the owner is not
permitted to carry the weapon in public or to own a silencer for that weapon. When in storage, the
weapons should be kept in a locked room or box. Permits can be extended and transferred within
families and also be issued to companies for security. Against these stipulations are the reserved powers
of the MoI to rescind permits at the request of the regional security committees, to seize unregistered
weapons as the property of the state and to requisition or confiscate registered weapons if the security
situation dictates it necessary.
Although the Registration bill has not yet been passed into law, the MoI, with support from UNDP, has
started a voluntary registration scheme based on the principles of the draft bill. Small arms owners are
able to submit their request for a registration licence at any one of the regional offices. The intention is
that records are then kept securely at the regional level and copied to the MoI central registry on a
quarterly basis. Staff members of UNDP have suggested that further efforts at publicising the scheme
and educating small arms owners on what it entails would improve take-up. An initiative has also usefully
been started as part of this scheme to liaise with the arms traders and encourage buyers to register their
weapons at the district council weapon registration office or the regional governor’s weapon registration
office57
.
7.3 Trading, Manufacture and Conversion of Weapons
As with the ownership of small arms, until the Registration bill passes into law, the 1963 Public Order
Law governs weapons trading. This law requires all small arms traders to be authorised by the MoI and
obliges them to only sell weapons to persons holding a licence. This licence does not allow traders to
import or export weapons, which is a competency reserved for the government and at any rate is banned
under the UN arms embargo in force in the region58
– this subject is covered in further detail later in the
report. Article 18 of the draft Registration bill also suggests that trading of weapons will be further
restricted in the future, but it is unclear at present as to what extent. The fact that the sale of weapons is
not condoned by the MOI suggests sale of weapons may be further regulated or restricted in the future.
The MOI currently discretely monitors the activities of weapons dealers so as to be informed of incoming
illegal shipments of arms. They have intercepted several shipments in the past59.
7.4 Explosive Remnants of War Ownership
ERW are currently regulated by Law No. 70/95, although ERW restrictions are also written into the draft
Registration bill. Law No. 70/95 indicates that items of ERW, perhaps excluding smaller munitions as
described earlier, are the property of the state. Meanwhile, if this provision has not totally covered all
57
Interview, UNDP Community Safety / AVR analyst, 12/07/09 58
UN Security Council Resolution 733 adopted 23/01/92 created the embargo. 59
Interview, UNDP Community Safety / AVR analyst, 12/07/09

45
RW60
.
til after the nationwide assessment currently being conducted by the HALO
rust has been completed.
the fact that civilian ownership of ERW is illegal. Thus, there is still further work to
be done in this area.
items of ERW, the Public Order Law prohibits the import, export, manufacture, trade in or use of
explosives without authorisation from the MoI. Together this would suggest that very few individuals can
presently own ERW legally. In addition to this, the draft Registration bill explicitly prohibits the registration
and hence ownership of hand grenades, land mines and other munitions and explosives.
The army and police are both mandated to accept items of ERW surrendered by individuals, who can do
so without fear of reprisal. In addition to this, DDG and the HALO Trust will both destroy items on a case-
by-case basis. DDG conducts this work as part of their Community Safety Programme which builds on
an earlier assessment that the remaining ERW problem in Somaliland is largely due to a lack of risk-
aware behaviour among the population demonstrated by the harvesting and private stockpiling of
E
7.5 International Obligations
Somaliland is a non-state party to the Ottawa Convention of 1996, subsequent to Parliamentary
Resolution No. GW/KF7/98-99 passed on 1st March 1999, prohibiting the use, stockpiling, production
and transfer of anti-personnel mines. This obliges the government to destroy publicly and privately
owned stockpiles by the end of 2009. The National Policy for Humanitarian Mine Action (NPHMA) was
created with the overall objective of providing a safe and secure environment in which socio economic
development could take place, with particular emphasis on the resettlement of refugees and internally
displaced persons. To this end, the policy’s medium term objectives include coordinating the mine action
activities of different national and international agencies in Somaliland, developing national mine action
capacity, developing a centralised information database for humanitarian mine action in Somaliland and
conducting mine risk education and victim assistance. The original time frame to reach an end-state of a
Somaliland free from the effects of land mines and ERW was 7-10 years; how close the country is to this
target will not be known un
T
7.6 Conclusions on legal framework pertaining to SALW and ERW
Progress in legally regulating the sale, transfer and ownership of SALW within the Somaliland domestic
market has so far been characterised by encouraging and pragmatic operations by the Ministry of Interior
(MoI) to implement the basic aspects of the SALW registration bill, accompanied by slow process in
getting the bill passed into law. It is also noticeable that there remains some ambiguity on certain issues
within the draft bill, for example on classification of weapon categories which may cause inconsistencies
in implementation and confusion or distrust among small arms owners resulting in lower adoption of this
system by the public. The sooner the bill is passed into law and accompanied by detailed, transparent
implementation guidelines, the better. The picture relating to the regulation of ERW is clearer, but the
number of people admitting their ownership of items of ERW suggests that there has not been enough
awareness-raising of
60
This assessment is based on the fact that the average number of ERW found by DDG per community visit has
decreased from 17 in 2003 to 2 in 2008 and that the majority of the 44 Mine/UXO accidents registered by DDG
between April 2005 and December 2008 were the result of tampering with or harvesting of ERW by the victims.
Furthermore, results from the current survey estimates ERW ownership at 12.1%

46
Chapter 8 Import and Export of Weapons In Somaliland law, the trading of heavy weapons is prohibited except by the state, while the sale of small
arms61
is only permitted by traders with the authorisation of the MoI. This trade is only legal for business
conducted within Somaliland and prohibits the import to and export of weapons and ammunition from
Somaliland. The evidence from focus group interviews conducted across Somaliland indicating brokers
are the primary sources from whom people acquire small arms62
, the suggestion is that there is at
present a steady domestic demand for weapons that is being met in part by the re-sale of items
originating locally, as people sell excess weapons as un-needed assets. There is however also a demand
for newer weapons, particularly pistols,63
that is being met through imports arranged by private
businessmen.64
Despite there being an overall lack of demand for large quantities of additional weapons within
Somaliland’s domestic market at present, there is some evidence to suggest that imports of weapons
and munitions can easily be up-scaled to meet rapid increases in local demand. The best recent example
of this was a ship loaded with arms that was detained in the western coastal area of Saylac. The arms
were reportedly being moved from Yemen by a private businessman to supply warring parties in an
escalating clan conflict ongoing in the Baki District of Awdal region65
. An interview with a UNDP
Community Safety / AVR analyst in Somaliland indicated that the ability of private arms importers to
supply Somaliland’s clans with arms at short notice would represent a significant conflict driver if
tensions in Somaliland rise again in the future; as the trend has been in south central Somalia.66
The UN Arms Embargo covering the territory of Somalia, including Somaliland, was created to stop the
sort of weapons imports that could further destabilise the region, but it also creates problems within
Somaliland. As the independence of Somaliland continues to be unrecognised around the world, the
government is also covered by the embargo, preventing it from importing new weapons to equip its
police force or army with weapons more suited to the tasks they undertake, even if it could find the funds
to do so. As a result of this restriction, the majority of police and soldiers use their personal weapons,
frequently storing them at home when not working and taking them away with them at the end of their
period of enlistment. This adds to the challenges of reducing private weapons ownership, as the
government relies on a large proportion of weapons owners to fill gaps in their security services. UNDP
does provide some non-lethal equipment support under its Rule of Law programme such as vehicles and
radios, but hardware for military use is banned for export to Somaliland as part of the UN arms embargo.
Perversely, although the embargo prevents the Somaliland government from acquiring weapons, there is
a possibility that weapons provided by western governments to bolster the Transitional Federal
Government in Mogadishu could fall into the wrong hands and later be used to perpetrate violence in
Somaliland as has reportedly happened with weapons supplied to the TFG in the past that were lost to
al-Shabaab and later used by al-Shabaab against them. 67
The main issue of arms imports and exports in Somaliland is not related to the domestic market at all, but
rather to Somaliland’s role as a transhipment destination for other national markets in the region. Key
informant interviews with government officials, civil society figures and international organisations
knowledgeable in the security sector have all indicated that weapons commonly transit Somaliland
61
As discussed earlier, the legal situation pertaining to light weapons such as mortars, RPGs and belt-fed machine
guns of small and medium caliber is unclear although they are probably not strictly permitted for commercial sale. 62
See Chapter on Perceptions, Acquisition and Impact of Small arms 63
Pistols make up 12.1% of small arms identified by owners in this survey and are often preferred as they can be
carried concealed in public, where carrying assault rifles openly is forbidden, 64
An interview with the founder of Haqsoor, an NGO, cited example of a shipment of pistols intercepted by chance
at Berbera port as evidence of this trend. 09/08/09 65
NSP Daily Highlights, 10 June 2009 66
Interview, UNDP Community Safety / AVR Analyst, 12/07/09 67
Letter from UN Monitoring Group on Somalia, Dec 2008
47
destined for conflict mainly in south central Somalia, but also in other conflict areas such as Ethiopia’s
Ogaden region68
. Although weapons from other countries such as Eritrea have been reported as
supplying insurgents in south central Somalia with weapons – the latter frequently by small boats,
plausibly using Somaliland’s territorial waters69
, the main source of weapons imported by businessmen
for shipment through the country, according to key informants interviewed70
in Somaliland and
corroborated by the UN’s Monitoring Group on Somalia, is Yemen. At between only 100 and 170 miles
from the coast of Somaliland, even small boats can transport shipments of arms and munitions across
the Gulf of Aden to remote locations on the coast East of Berbera. The nascent Somaliland coastguard
has little capacity to disrupt these supply routes. From the coast, importers allegedly transfer their
shipments to vehicles and exploit the contested corridor of land between eastern Somaliland and the
west of Puntland, where the Rule of Law is weak, to move their loads south and either into southern
Puntland and on from there to Mogadishu, or into eastern Ethiopia.71
68
p26, ibid 69
p26, ibid 70
Interview, UNDP Community Safety / AVR Analyst, 12/07/09 71
Interview, UNDP Community Safety / AVR Analyst, 12/07/09 [as heard on the BBC Somali service]

48
Chapter 9 ERW Ownership Explosive Remnants of War are all types of conventional munitions containing explosives, excluding
mines and booby-trapped devices72
that have remained in the public sphere after the cessation of
hostilities in a conflict area. They can include unexploded ordinance such as mortar bombs which failed
to detonate on impact but may also include abandoned ordinance like unused artillery shells left behind
by retreating government forces. Somaliland, like many post-conflict environments, has experienced high
levels of ERW. There are still defined contaminated areas that are awaiting or undergoing clearance and
items are regularly discovered and destroyed by mine action agencies on an ad-hoc basis. However,
ERW is also privately owned and some individuals are still harvesting ERW for economic or protection
reasons.
The different contexts in which ERW and landmines are encountered in Somaliland present differing
levels and types of risk to the population. Arguably, although psychologically for the population the threat
from landmines is still high, the risk from landmines is far lower than it was a decade ago when
contamination in heavily populated urban areas was extensive and the risk to the population greater.
Minefields that have been identified by Mine Action agencies have - if not already cleared - largely been
marked and local populations are normally aware of minefields in their vicinity. Victim data indicates that
a significant number of incidents now involve ERW rather than landmines73
. The HALO Trust are currently
conducting a re-survey of the remaining mine and ERW contamination in Somaliland which will throw
more light on the issue but as discussed previously, on the basis of the findings from an earlier
assessment, DDG believes that the scale of the risks surrounding ERW being held in private ownership or
being harvested for economic and protection reasons are significant and require further examination74
.
These stockpiles represent a significant risk to the population of Somaliland as they are commonly stored
in households with few safety precautions. The impact of accidents in these circumstances has been
shown to be severe. For this reason, this analysis focuses mainly on the latter group of ERW in an effort
to better identify how successful interventions can be implemented.
9.1 Who owns ERW in Somaliland?
The results of the household survey indicate that at least 12.1% of households own items of ERW.
Grouped interviews with traditional leaders in 130 communities surveyed suggested that the figure was
lower, with traditional leaders of only six communities knowing of households in their communities that
owned ERW, while 4 of 30 focus group discussions with traditional leaders indicated people in their
communities kept ERW. In terms of the overall population of Somaliland, 12.1% of ERW owners are a
significant minority that would suggest traditional leaders would or should know of at least some ERW
owners. This lack of awareness is probably due to ERW owners not publicly advertising the fact that they
own such items, as it is illegal and they could as a consequence be confiscated by the police. It is also
quite plausible that communities, including traditional leaders, are suspicious of the motives for asking
such questions and did not want to admit such practices took place. On balance, the household survey
figure of 12.1% is scientifically the most defensible and overall may in fact underestimate the true
number of owners for the same reasons outlined above.
72
Protocol on Explosive Remnants of War (Protocol V to the 1980 Convention), 28 November 2003 73
Data provided by Somaliland Mine Action Centre (SMAC) indicates there were 24 accidents between July 2008
and July 2009, 19 of which involved items of ERW and only 4 of which involved anti-personnel mines. The cause of
the last accident is unknown 74
See chapter on Legal and Policy Framework for SALW and ERW
49
Text box – Who owns ERW?
12.1% of Households surveyed across Somaliland admit owning items of ERW.
This equates to approximately 70,000 households nationwide75
15.7% of rural respondents owned ERW compared to 8.7% of urban respondents
Proportionately, respondents from majority clans appear more likely to own items of ERW with 13.6% of
these respondents claiming to do so, compared to only 3% of respondents from minority clans. This may
be because majority clan members may feel more confident in the authorities’ unwillingness or inability to
take such actions and hence are less worried about admitting to owning ERW. It may also be because
minority clan members, frequently poorer on average than majority clan members may have previously
sold any items they owned, a possibility supported by the fact that there also appears to be a positive
correlation between income of households and ownership of ERW, with wealthier households more likely
to own items of ERW. This may be due to the economic value that is sometimes attached to ERW. This
point is re-examined in the assessment of why people own ERW.
No information was collected on the gender and age of the individual ERW owner in each household but
the experience of DDG’s ammunition disposal team who conduct private stockpile destruction activities
indicates that owners are commonly male, aged 20 years and older - similar to the predominant profile of
SALW owners.76
9.2 Where are ERW owners most prevalent?
The responses from the household survey indicate that the concentrations of ERW owners vary
significantly between Somaliland’s different regions. Map 4 below indicates how ERW ownership is most
prevalent in Sool, where 33.7% of households admit to owning ERW, a point backed up by claims made
in female focus groups in the region. On the other hand, ownership is least common in Awdal and
Galbeed, where only 2.3% and 7.4% of households respectively admitted to owning items of ERW. This
is best explained by a combination of factors; ERW are more widely available in Sool due to the presence
of former military positions, mined border areas and ongoing border disputes. Galbeed and Awdal by
contrast have received more attention from mine action agencies due to the higher density of populations
in the two regions as well as the more stable security situation, which has led to strategies prioritising the
mitigation of risk in these areas. Finally, communities in Sool are not covered as effectively by the police
service as those in Awdal and Galbeed.
75
Using a population estimate of 3.5m (www.somalilandgov.com) and an average household size of 5.79 (Socio
Economic Survey Somalia 2002, UNDP/World Bank 2003) 76
See chapter on Small arms Ownership for further details

50
Map 4 - ERW Ownership in Somaliland (household level)
It was also noticeable that the 15.7% proportion of rural respondents owning ERW was significantly
higher than the 8.7% of urban respondents. This may in part be attributed to the increased presence of
the Ministry of Interior and police in urban areas. Awareness raising activities on the illegality of privately
owning ERW may have been more effective in urban areas, while the more visible police presence in
many urban areas may also have contributed to persuading ERW owners to hand over their stocks for
fear of confiscation and prosecution in the future. It may also be a result of mine action agencies
previously having accessed and destroyed more private stockpiles in urban areas than in rural because
of ease of accessibility. On the other hand, it might though be the case that ERW owners in urban areas
are more aware of the illegal status of their stockpiles and hence simply less likely to admit to owning
them to researchers. Rural populations however may be less likely to know of the illegal status of their
stockpiles and hence are more likely to both own such holdings and to admit that they own them. Even if
they know it is illegal, they may feel that the lack of police presence in their vicinity makes the chances of
confiscation or prosecution unlikely, so they are still okay with admitting ownership. The conclusions one
could draw from this are that there are more ERW in private ownership in rural communities that may be
surrendered purely as a result of awareness-raising activities, whereas in urban areas the 8.7% of owners
among the population may be lower than the reality and at any rate, any intervention may require more
confidence building because of the increased likelihood that the owners realise they are breaking the law.
9.3 Why do people own ERW?
As can be seen in Table 13 below, 52% of the ERW owners claim to keep ERW with some sort of
potential future violence in mind, primarily for protective use (i.e. protection of community protection of
clan and fear of future conflict/instability/war – the latter though perhaps also implying potential offensive
use). The single biggest reason, though, appears to simply be that ERW owners have items of ERW left
over from previous wars and conflicts. The 41% of owners who fall into this category potentially form a
large constituency for ‘quick-wins’ in future efforts at private stockpile reduction. If they are not holding
items for any other reason, they may be persuaded to give up such items for destruction with appropriate

51
advocacy and awareness raising activities on safety and legal realities. This does not however take away
from the fact that for just over half of ERW owners, extensive confidence building measures, advocacy
and education measures will need to be implemented before there can be any hope of them giving up
their ERW holdings – particularly important from an Armed Violence Reduction standpoint, as it is this
group who have said they might actually use such items in a conflict.
Table 13 - Why do you own ERW?
Reason for owning ERW % of total ERW owners
Protection of community 29.1
Protection of clan 14.5
Fear of future conflict/instability/war 8.4
Prized family possession 6.4
Tradition 0.3
Left over from war 41.0
Don’t know what to do with it 0.3
Total 100
It was noticeable that rural respondents who admitted to owning ERW were significantly more likely than
their urban counterparts - 44.7% to 29.3% respectively - to say they owned ERW that were left over
from war. This difference would seem to suggest that not only do rural communities perhaps own more
ERW than urban communities; there may also be specific reasons for this. It is certainly the case that
many defensive minefields were laid along the border with Ethiopia in previous conflicts and there are
also many former military bases and positions in the border areas. This might indicate that people in rural
areas own more ERW because they are so readily available to harvest in these areas in comparison to
urban centres where high-impact clearance operations have already been concluded by mine action
agencies.
When analysing the reasons why people keep ERW in different regions in Somaliland, it is again useful to
combine the first three reasons of the table above into a broader category of “for protection in potential
conflict”. When this is done it is possible to see the results as in Table 14 below.
Table 14 - Reasons for owning ERW by region
Reason for owning ERW Saahil Sanaag Sool Togdheer Galbeed Awdal
For protection in potential conflict 34.9% 66.0% 59.4% 58.8% 39.0% 44.4%
Left over from war 51.2% 27.7% 37.5% 32.4% 58.4% 55.6%
Other reasons 13.9% 6.3% 3.1% 8.8% 2.6% 0%
TOTAL 100% 100% 100% 100% 100% 100%
Initial indications would be that Awdal and Galbeed represent the best possibilities for ‘quick win’
stockpile reduction initiatives, as these are the regions that experience the most people claiming to own
ERW mainly just because they were left over from war. This conclusion however would be misleading, as
when it is taken with the findings on numbers of ERW owners in these two regions, one can see they
have the lowest proportion of ERW owners of all six regions. Information from interviews with the
traditional leaders and focus groups suggest that this may be because a considerable amount of work
has already been undertaken in these districts and many people have already handed over their ERW for
destruction. The conclusion that one might reach is that while Explosive Ordinance Disposal (EOD)
operations focusing on private ERW holdings might be easier to conduct in these areas, the limited
numbers of ERW owners as well as their reasoning for owning ERW might mean that the overall impact
will be greater if operations were focused in Sanaag, Sool and Togdheer where there is a higher
proportion of households owning ERW and a higher percentage of these who own these items for
reasons of protection and fear of future conflict.

52
Text box – Owning ERW and SALW
People often own ERW for similar reasons to why they own small arms. 77.2% of the respondents
who said they owned ERW for protection of their community said they owned their small arms for
the same reason.
9.4 Conclusions on ERW ownership
ERW presents a challenge to community safety in Somaliland and will continue to do so for some time to
come. The greater challenge for organisations working in the field of community safety will be to critically
examine the approaches being taken to mitigate the risks posed by ERW and landmines and adapt
interventions accordingly to maximise assistance to the communities they serve. The risk posed by ERW
in private holdings does not represent the only risk from ERW and mines in Somaliland; people will
inevitably continue to be harmed by landmines and other types of munitions. However, as minefield
clearance, ERW spot clearance and Mine Risk Education continues, the risks posed by mines and ERW
in these contexts will continue to decrease, while if left unaddressed, the risk from private ERW holdings
will remain significant. These stockpiles are not as easy to destroy as other ERW as they require deep
engagement and confidence building with communities but this is precisely why interventions in this area
require further efforts. If risks from landmines and ERW encountered in other contexts continues to
diminish, privately owned and stored ERW will represent the greatest residual risk to communities, while
also remaining, given their sensitive nature, a risk that communities may find too challenging to address
alone while remaining suspicious of government attempts to intervene, making the assistance of
embedded and impartial NGOs invaluable.

53
Chapter 10 SALW Ownership
The insecurity that has plagued the Horn of Africa over the last three decades has left Somaliland
saturated with SALW. Some norms of behaviour relating to small arms have changed since the chaos of
the nineties; carrying of small arms in public for example is now taboo for persons not authorised to do
so. However, other behavioural norms for small arms owners continue to pose significant safety risks to
the population, tragically often to the members of the owners own household. This report identifies the
common profile of small arms owners, the small arms they commonly own and assesses the reasons for
small arms ownership. It also highlights information on small arms owners’ knowledge and willingness to
register their weapons with the authorities. This information, together with data on SALW accidents, can
then hopefully be used for targeted advocacy and education interventions to bring about positive
behavioural change among small arms owners.
10.1 Ownership Levels
Text box - Privately owned small arms in Somaliland
There may be 550,000 small arms in private ownership in Somaliland
73.6% of household survey respondents admitted to one or more members of their households owning
at least one small arm, averaging out at 1.27 small arms per household. Up to date and accurate census
data for Somaliland is not available, however using an official estimate of the population at 3.5 million
people and the average household as 5.79 persons in size77 this means that, the total number of SALW
of varying types in private ownership in Somaliland could be extrapolated to approximately 550,00078
.
Text box - Households and small arms owners
The average household includes an average of 1.24 small arms owners
The average number of small arms owned per household is 1.27
This is equivalent to 1.02 small arms per small arms owner
When the dispersal of small arms owners is analysed geographically, there is a significant variation in
levels of ownership between the different regions of Somaliland. This dispersal is shown in Map 5 below.
It is noticeable that the three regions which experience the highest proportions of small arms owners are
the same three regions that registered the highest proportions of respondents who perceive small arms
as desirable and normal and are also the same regions in which it is least difficult to acquire small arms
(please refer to the chapter on Perceptions, Acquisition and Impact of Small arms for elaboration). The
indication is that in these regions there are both significant proportions of the population who wish to
own small arms and are easily able to do so.
77
Using a population estimate of 3.5m (www.somalilandgov.com) and an average household size of 5.79 (Socio
Economic Survey Somalia 2002, UNDP/World Bank 2003) 78
Using an estimate from the above figures for the number of households in Somaliland, the proportion of
households estimated to be owning small arms and the average holding per household, to the nearest fifty thousand

54
Map 5 - SALW Ownership in Somaliland (household level)
10.2 Owner Profile
According to data from the household survey, the typical demographic of a small arms owner in
Somaliland is a male over the age of 19 years, as demonstrated in Figure 20 below. Females are highly
unlikely to own SALW, accounting for only 3.2% of all identified small arms owners. It should be noted,
however, that although women are not the principle owners of weapons in the majority of households,
they still represent an important conduit for awareness-raising and education activities on SALW issues,
so should not automatically be discarded from programming activities on SALW issues.
Figure 20 - Small arms owners in Somaliland
20,0%
29,5%
46,4%
1,0% 0,3% 0,1%2,2%
0,7%0,0%
5,0%
10,0%
15,0%
20,0%
25,0%
30,0%
35,0%
40,0%
45,0%
50,0%
15‐19 yrs 20‐29 yrs 30‐45 yrs 45+ yrs
Age category for firearms owners
% of total identified firearm
s ow
ners
Males
Females
Small arms owners in Somaliland are equally proportionate among rural and urban populations, although
this does not mean they keep small arms for the same reasons – a subject covered in more detail later in
this section.
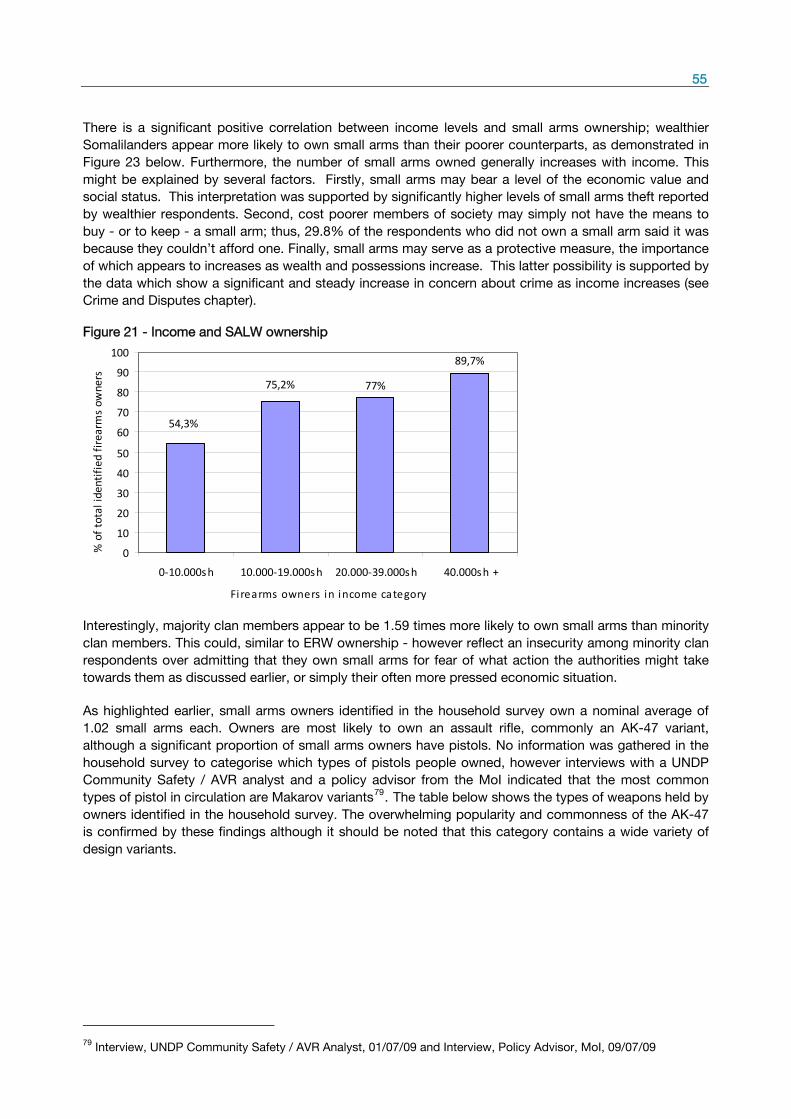
55
There is a significant positive correlation between income levels and small arms ownership; wealthier
Somalilanders appear more likely to own small arms than their poorer counterparts, as demonstrated in
Figure 23 below. Furthermore, the number of small arms owned generally increases with income. This
might be explained by several factors. Firstly, small arms may bear a level of the economic value and
social status. This interpretation was supported by significantly higher levels of small arms theft reported
by wealthier respondents. Second, cost poorer members of society may simply not have the means to
buy - or to keep - a small arm; thus, 29.8% of the respondents who did not own a small arm said it was
because they couldn’t afford one. Finally, small arms may serve as a protective measure, the importance
of which appears to increases as wealth and possessions increase. This latter possibility is supported by
the data which show a significant and steady increase in concern about crime as income increases (see
Crime and Disputes chapter).
Figure 21 - Income and SALW ownership
89,7%
77%75,2%
54,3%
0
10
20
30
40
50
60
70
80
90
100
0‐10.000sh 10.000‐19.000sh 20.000‐39.000sh 40.000sh +
Firearms owners in income category
% of total identified firearms ow
ners
Interestingly, majority clan members appear to be 1.59 times more likely to own small arms than minority
clan members. This could, similar to ERW ownership - however reflect an insecurity among minority clan
respondents over admitting that they own small arms for fear of what action the authorities might take
towards them as discussed earlier, or simply their often more pressed economic situation.
As highlighted earlier, small arms owners identified in the household survey own a nominal average of
1.02 small arms each. Owners are most likely to own an assault rifle, commonly an AK-47 variant,
although a significant proportion of small arms owners have pistols. No information was gathered in the
household survey to categorise which types of pistols people owned, however interviews with a UNDP
Community Safety / AVR analyst and a policy advisor from the MoI indicated that the most common
types of pistol in circulation are Makarov variants79
. The table below shows the types of weapons held by
owners identified in the household survey. The overwhelming popularity and commonness of the AK-47
is confirmed by these findings although it should be noted that this category contains a wide variety of
design variants.
79
Interview, UNDP Community Safety / AVR Analyst, 01/07/09 and Interview, Policy Advisor, MoI, 09/07/09

56
Table 15 - Types of SALW in private ownership (from household survey)
Type of SALW Frequency % of total
Pistols/revolvers 321 12.1%
AK-47 automatic rifles 1932 72.8%
M16 automatic rifles 197 7.4%
G3 automatic rifles 163 6.1%
SKS automatic rifles 14 0.5%
RPK automatic rifles 3 0.1%
Other automatic rifles 2 -
Medium/heavy machineguns 19 0.7%
Mortar tubes 1 -
Rocket Propelled Grenade Launchers 1 -
Totals 2653 100%
10.3 Reasons for owning / not owning small arms
Overall the most important reason for owning small arms cited in the household survey was protection
from clans, followed by protection of property and protection from wildlife, with 15.1%, 13.5% and
11.3% of responses respectively. However, as can be seen in the table below, when the top three
reasons given by household survey respondents are combined, protection of community accounted for
the greatest number of answers in total. On this measure, protection from gangs and criminals and
valued family possession are also significant reasons for owning small arms.
Table 16 - Reasons for small arms ownership
Reason: % of primary
reasons
% of
secondary
reasons
% of tertiary
reasons
% total
reasons
combined
Protection from clans 15.1 1.1 0.7 10.7
Protection from gangs/criminals 8.5 9.5 2.2 12.7
Protection from wildlife 11.3 6.4 6.1 15.1
Protection of property 13.5 6.5 2.9 14.4
Protection of community 9.3 10.5 6.9 16.8
Fear of future conflict 0.9 4.1 4.3 5.8
Work (soldiers, police) 1.2 1.4 1.3 2.5
Work (businessmen) 1.7 2.0 2.7 4.1
Hunting 0 0.5 1.0 1.0
Left over from war 1.7 1.7 0.7 2.6
Valued family possession 10.1 2.5 5.7 11.5
Tradition 0.1 1.8 2.8 2.9
Total 100% 100% 100% 100%
The wide range of answers meant it was difficult to analyse differences depending on the geographical
locations of respondents. There were, however, significant differences in answers given by respondents
depending on their income level, clan affiliation and whether they lived in urban or rural locations.
In terms of clan affiliation, it is interesting as illustrated in the table below that majority clan respondents
are significantly more likely than minority clan respondents to own small arms to protect their
communities or to give protection against other clans. By contrast minority clan members are
significantly more likely to own small arms as economic assets or to protect their economic assets. This
may partly be because minority clans have very limited resources for arming for protection in comparison
with majority clans and thus have no real hope of successfully defending themselves against others clans

57
for extended periods of time in an eventual conflict, while they do on the other hand have the ability to
protect their property. The reliance on weapons to protect property, moreover indicates a more usual
distrust of the ability of security providers to secure their safety (as also illustrated in the chapter on
Security Providers), hence the reliance on their own small arms, which are useful for protecting individual
households and private property.
Table 17 - Reasons for small arms ownership – by clan affiliation and urban/rural
Reason for small arms ownership % majority
clan
% minority
clan
% urban
respondents
% rural
respondents
Protection from clans 21.2 9.3 16.6 22.9
Protection from gangs/criminals 12.0 3.1 18.9 7.5
Protection of property 17.8 29.9 12.7 21.6
Protection of community 13.1 5.2 16.1 10.8
Valued family possession 12.6 36.1 13.1 14.0
Other reasons 23.3 16.4 22.6 23.2
Total 100% 100% 100% 100%
Furthermore, protection of property and protection from clans were considerably more common reasons
for rural respondents to own small arms than urban respondents, probably due to the lower presence
and effectiveness of security providers to offer immediate protection in rural regions and the higher
incidence of rural respondents needing to guard their livestock80.
Urban respondents were predictably
more likely to own small arms to protect themselves from gangs and other criminal behaviour which
more frequently occurs in urban areas than rural regions.
When the total combined reasons for owning small arms are grouped together, it is possible to see how
the reasons people keep small arms can affect how successful different types of intervention on the issue
of SALW in community safety could be. Thus, protection related reasons account for 75% of the reasons
people give for owning small arms, with 45.5% of the reasons being solely related to protection of
person(s) from person(s) (i.e. protection from clans, gangs or criminals and protection of community).
Obviously in this context, disarmament would not likely be a successful SALW activity, as self defence is
a legitimate major safety and security concern. On the basis of those same safety concerns about crime,
it might however be possible to advocate successfully for schemes reducing the accessibility of small
arms to criminals such as, for example, the MoI voluntary registration programme. Tailoring interventions
to approach the issue of SALW ownership in a manner sensitive to communities’ safety concerns is vital
if community safety approaches involving SALW are to be successful.
When examining the reasons for people not owning SALW, it is primarily because they don’t like small
arms (38.8%) or because they can’t afford them (29.6%), as illustrated in Figure 23 below. The reasons
people give for not owning small arms are not affected by their clan background, however young people
are more likely than old people to not own a small arms because they don’t like guns. Older people by
contrast are more likely than young people to say they do not own a small arm simply because they can’t
afford one. This would seem to indicate that younger people represent a group who may be more aware
of the risk associated with owning small arms, whereas older people, while possibly aware of the risks,
would still desire to own a small arms if they could afford one.
80
Theft of cattle is a common problem in Somaliland and as with much crime perpetrated in the country, it is not
uncommon for thieves to be armed, hence the need for pastoralists to carry weapons not only for protection against
animals, but also against cattle rustlers.
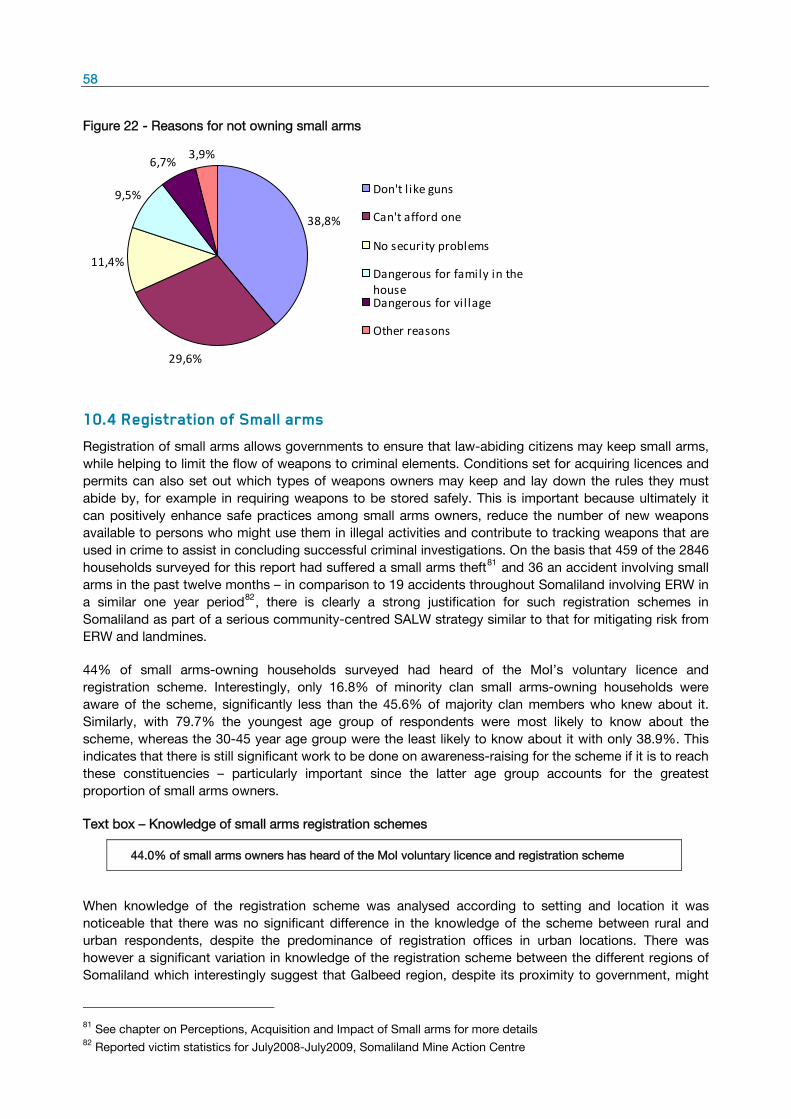
58
Figure 22 - Reasons for not owning small arms
38,8%
29,6%
11,4%
9,5%
6,7%3,9%
Don't l ike guns
Can't afford one
No security problems
Dangerous for family in thehouseDangerous for vil lage
Other reasons
10.4 Registration of Small arms
Registration of small arms allows governments to ensure that law-abiding citizens may keep small arms,
while helping to limit the flow of weapons to criminal elements. Conditions set for acquiring licences and
permits can also set out which types of weapons owners may keep and lay down the rules they must
abide by, for example in requiring weapons to be stored safely. This is important because ultimately it
can positively enhance safe practices among small arms owners, reduce the number of new weapons
available to persons who might use them in illegal activities and contribute to tracking weapons that are
used in crime to assist in concluding successful criminal investigations. On the basis that 459 of the 2846
households surveyed for this report had suffered a small arms theft81
and 36 an accident involving small
arms in the past twelve months – in comparison to 19 accidents throughout Somaliland involving ERW in
a similar one year period82
, there is clearly a strong justification for such registration schemes in
Somaliland as part of a serious community-centred SALW strategy similar to that for mitigating risk from
ERW and landmines.
44% of small arms-owning households surveyed had heard of the MoI’s voluntary licence and
registration scheme. Interestingly, only 16.8% of minority clan small arms-owning households were
aware of the scheme, significantly less than the 45.6% of majority clan members who knew about it.
Similarly, with 79.7% the youngest age group of respondents were most likely to know about the
scheme, whereas the 30-45 year age group were the least likely to know about it with only 38.9%. This
indicates that there is still significant work to be done on awareness-raising for the scheme if it is to reach
these constituencies – particularly important since the latter age group accounts for the greatest
proportion of small arms owners.
Text box – Knowledge of small arms registration schemes
44.0% of small arms owners has heard of the MoI voluntary licence and registration scheme
When knowledge of the registration scheme was analysed according to setting and location it was
noticeable that there was no significant difference in the knowledge of the scheme between rural and
urban respondents, despite the predominance of registration offices in urban locations. There was
however a significant variation in knowledge of the registration scheme between the different regions of
Somaliland which interestingly suggest that Galbeed region, despite its proximity to government, might
81
See chapter on Perceptions, Acquisition and Impact of Small arms for more details 82
Reported victim statistics for July2008-July2009, Somaliland Mine Action Centre

59
benefit from greater awareness-raising efforts, as although it has the third highest proportion of small
arms owners by region, it’s small arms owners are the least aware of the voluntary licence and
registration scheme’s existence. The table below presents the findings by region.
Table 18 - Knowledge of small arms voluntary licence and registration scheme83
Togdheer Saahil Sool Awdal Sanaag Galbeed
Yes, I have heard of it 63.1% 57.5% 51.8% 38.7% 33.7% 33.5%
No, I haven’t heard of it 35.9% 42.5% 47.1% 60.3% 65.8% 66.1%
When the group of small arms owners who knew about the registration scheme was asked whether they
would be willing to register and licence their small arms, 69.5% said they would consider doing so. While
this figure initially appears encouraging it should be approached with caution As people often tend to be
far more positive in their outlook towards such schemes until they are actually in the position where they
can or a required to do something about it, at which point they often become more cautious. Thus, while
increasing knowledge of the voluntary scheme may contribute a great deal to an increase in registration,
advocacy in target areas might be needed before starting new registration centres if they are to have
significant success in signing up small arms owners.
Text box – Would you be willing to register your small arms?
69.5% of the small arms owners who know about the voluntary licence registration scheme said they
would be willing to register their small arms
10.5 Conclusions on small arms ownership
The pervasiveness of small arms ownership in Somaliland suggests that the emphasis in SALW
programming for the future is best focused on management of small arms and mitigation of risks
associated with behavioural norms, rather than attempts at wholesale reduction of small arms holdings.
Encouragingly it also appears to be this first approach that has been adopted by the government of
Somaliland. The profile of small arms owners in Somaliland is clear; middle-aged males with higher-than-
average incomes. Small arms owners are more numerous in areas where there are ongoing conflicts and
a greater preponderance of safety and security concerns, with those concerns often the same as the
reasons cited for small arms ownership in the first place. This profile provides enough information for
stakeholders to focus their SALW interventions appropriately and help them to maximise the impact of
their activities.
83
Columns do not add up to 100% because fifteen respondents of 2094 identified small arms owners refused to
answer the question

60
Chapter 11 Perceptions, Acquisition and Impact of Small Arms The perception of small arms among all members of a community is a key factor in whether it is possible
to provoke behavioural change relating to small arms in that community. Perceptions are central to
deciding what is acceptable and what is not. In the aftermath of the civil war, large numbers of people in
Hargeisa and other urban locations would openly carry assault rifles, which inevitably resulted in wide-
scale armed violence and robbery. It was a concerted effort by female business owners, poets and the
authorities that altered public acceptance of this practice and led to a critical mass of the population
deciding that this was unacceptable84
, after which carrying weapons in public unless a members of the
security services has been largely taboo. This report seeks to assess the differences in perceptions
towards small arms among different sections of the population in an attempt to identify areas and
individuals to focus on in future advocacy and education activities.
While perceptions of small arms are central to understanding how to influence behavioural change,
effecting the supply side of the weapons markets in Somaliland could also positively affect the number
and type of persons using - and abusing - small arms. This report will therefore also attempt to highlight
the common methods of purchase of small arms in Somaliland and seek to understand how easily
people feel they can use these methods to acquire small arms now and whether this is easier or harder
than a year previously.
Comparing perceptions of small arms with the information on the supply environment also provides the
context with which to examine the impact that small arms are having on individuals and communities in
Somaliland. Increasing understanding of the effects of SALW on people’s lives and livelihoods can
improve organisations’ abilities to measure the effect their interventions are having on altering the SALW
situation in Somaliland and assist them in continuing to implement targeted and effective approaches.
11.1 Perceptions of small arms
When asked how they perceived small arms overall, it was noticeable that there was very little middle
ground in the answers given by household respondents. As Figure 24 below indicates, a significant
majority of respondents claimed they perceived small arms to be a threat to safety, while a significant
minority perceived small arms as both desirable and normal, leaving only a small number of respondents
saying they perceived small arms as neither desirable, nor a threat to safety.
Figure 23 - Perceptions of small arms
79%
18,8%2,2%
Firearms perceived asdesirable and normal
Firearms perceived as athreat to safety
Firearms perceived asneither desirable nor a
The immediate conclusion that may be drawn from this is that there is a significant minority of the
population whose perceptions towards small arms will make changing their behaviour a particular
challenge, so it is important to assess if these respondents make up any particular sub-group within the
population
84
Bottom-up disarmament in Somaliland, Brickhill 2008, in Armed Violence Reduction: Enabling Development, OECD, 2009
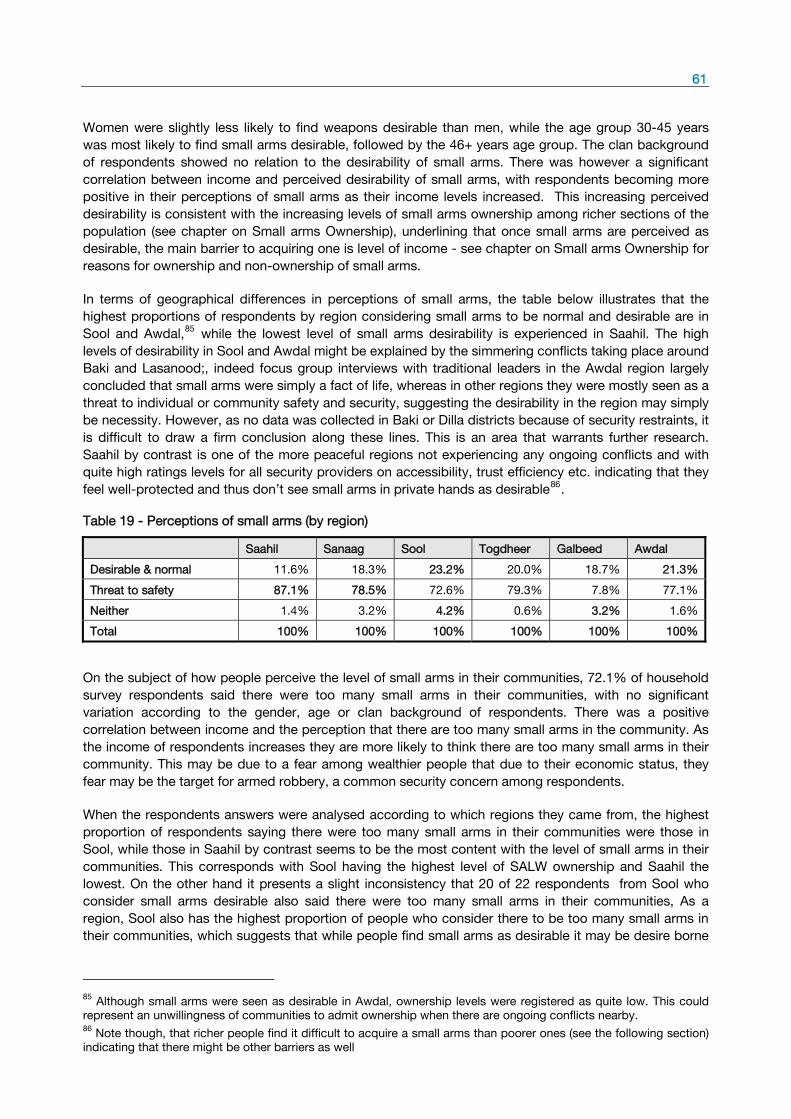
61
Women were slightly less likely to find weapons desirable than men, while the age group 30-45 years
was most likely to find small arms desirable, followed by the 46+ years age group. The clan background
of respondents showed no relation to the desirability of small arms. There was however a significant
correlation between income and perceived desirability of small arms, with respondents becoming more
positive in their perceptions of small arms as their income levels increased. This increasing perceived
desirability is consistent with the increasing levels of small arms ownership among richer sections of the
population (see chapter on Small arms Ownership), underlining that once small arms are perceived as
desirable, the main barrier to acquiring one is level of income - see chapter on Small arms Ownership for
reasons for ownership and non-ownership of small arms.
In terms of geographical differences in perceptions of small arms, the table below illustrates that the
highest proportions of respondents by region considering small arms to be normal and desirable are in
Sool and Awdal,85
while the lowest level of small arms desirability is experienced in Saahil. The high
levels of desirability in Sool and Awdal might be explained by the simmering conflicts taking place around
Baki and Lasanood;, indeed focus group interviews with traditional leaders in the Awdal region largely
concluded that small arms were simply a fact of life, whereas in other regions they were mostly seen as a
threat to individual or community safety and security, suggesting the desirability in the region may simply
be necessity. However, as no data was collected in Baki or Dilla districts because of security restraints, it
is difficult to draw a firm conclusion along these lines. This is an area that warrants further research.
Saahil by contrast is one of the more peaceful regions not experiencing any ongoing conflicts and with
quite high ratings levels for all security providers on accessibility, trust efficiency etc. indicating that they
feel well-protected and thus don’t see small arms in private hands as desirable86
.
Table 19 - Perceptions of small arms (by region)
Saahil Sanaag Sool Togdheer Galbeed Awdal
Desirable & normal 11.6% 18.3% 23.2% 20.0% 18.7% 21.3%
Threat to safety 87.1% 78.5% 72.6% 79.3% 7.8% 77.1%
Neither 1.4% 3.2% 4.2% 0.6% 3.2% 1.6%
Total 100% 100% 100% 100% 100% 100%
On the subject of how people perceive the level of small arms in their communities, 72.1% of household
survey respondents said there were too many small arms in their communities, with no significant
variation according to the gender, age or clan background of respondents. There was a positive
correlation between income and the perception that there are too many small arms in the community. As
the income of respondents increases they are more likely to think there are too many small arms in their
community. This may be due to a fear among wealthier people that due to their economic status, they
fear may be the target for armed robbery, a common security concern among respondents.
When the respondents answers were analysed according to which regions they came from, the highest
proportion of respondents saying there were too many small arms in their communities were those in
Sool, while those in Saahil by contrast seems to be the most content with the level of small arms in their
communities. This corresponds with Sool having the highest level of SALW ownership and Saahil the
lowest. On the other hand it presents a slight inconsistency that 20 of 22 respondents from Sool who
consider small arms desirable also said there were too many small arms in their communities, As a
region, Sool also has the highest proportion of people who consider there to be too many small arms in
their communities, which suggests that while people find small arms as desirable it may be desire borne
85
Although small arms were seen as desirable in Awdal, ownership levels were registered as quite low. This could
represent an unwillingness of communities to admit ownership when there are ongoing conflicts nearby. 86
Note though, that richer people find it difficult to acquire a small arms than poorer ones (see the following section)
indicating that there might be other barriers as well
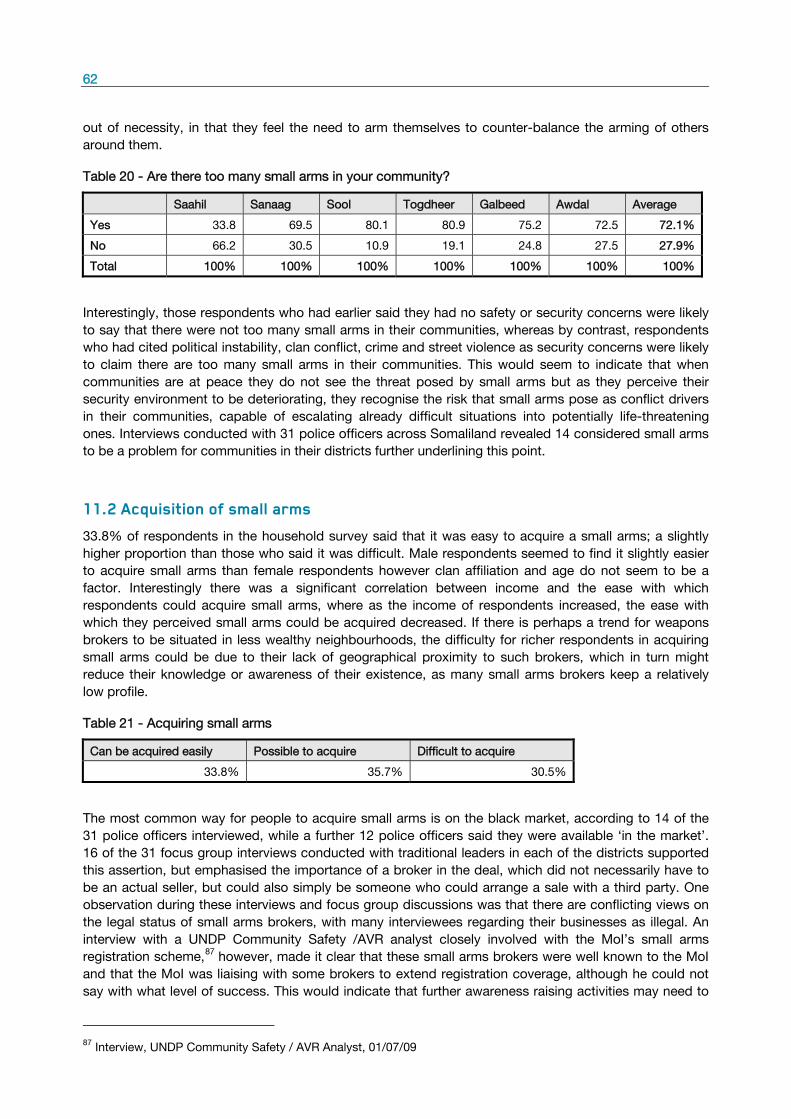
62
out of necessity, in that they feel the need to arm themselves to counter-balance the arming of others
around them.
Table 20 - Are there too many small arms in your community?
Saahil Sanaag Sool Togdheer Galbeed Awdal Average
Yes 33.8 69.5 80.1 80.9 75.2 72.5 72.1%
No 66.2 30.5 10.9 19.1 24.8 27.5 27.9%
Total 100% 100% 100% 100% 100% 100% 100%
Interestingly, those respondents who had earlier said they had no safety or security concerns were likely
to say that there were not too many small arms in their communities, whereas by contrast, respondents
who had cited political instability, clan conflict, crime and street violence as security concerns were likely
to claim there are too many small arms in their communities. This would seem to indicate that when
communities are at peace they do not see the threat posed by small arms but as they perceive their
security environment to be deteriorating, they recognise the risk that small arms pose as conflict drivers
in their communities, capable of escalating already difficult situations into potentially life-threatening
ones. Interviews conducted with 31 police officers across Somaliland revealed 14 considered small arms
to be a problem for communities in their districts further underlining this point.
11.2 Acquisition of small arms
33.8% of respondents in the household survey said that it was easy to acquire a small arms; a slightly
higher proportion than those who said it was difficult. Male respondents seemed to find it slightly easier
to acquire small arms than female respondents however clan affiliation and age do not seem to be a
factor. Interestingly there was a significant correlation between income and the ease with which
respondents could acquire small arms, where as the income of respondents increased, the ease with
which they perceived small arms could be acquired decreased. If there is perhaps a trend for weapons
brokers to be situated in less wealthy neighbourhoods, the difficulty for richer respondents in acquiring
small arms could be due to their lack of geographical proximity to such brokers, which in turn might
reduce their knowledge or awareness of their existence, as many small arms brokers keep a relatively
low profile.
Table 21 - Acquiring small arms
Can be acquired easily Possible to acquire Difficult to acquire
33.8% 35.7% 30.5%
The most common way for people to acquire small arms is on the black market, according to 14 of the
31 police officers interviewed, while a further 12 police officers said they were available ‘in the market’.
16 of the 31 focus group interviews conducted with traditional leaders in each of the districts supported
this assertion, but emphasised the importance of a broker in the deal, which did not necessarily have to
be an actual seller, but could also simply be someone who could arrange a sale with a third party. One
observation during these interviews and focus group discussions was that there are conflicting views on
the legal status of small arms brokers, with many interviewees regarding their businesses as illegal. An
interview with a UNDP Community Safety /AVR analyst closely involved with the MoI’s small arms
registration scheme,87
however, made it clear that these small arms brokers were well known to the MoI
and that the MoI was liaising with some brokers to extend registration coverage, although he could not
say with what level of success. This would indicate that further awareness raising activities may need to
87
Interview, UNDP Community Safety / AVR Analyst, 01/07/09
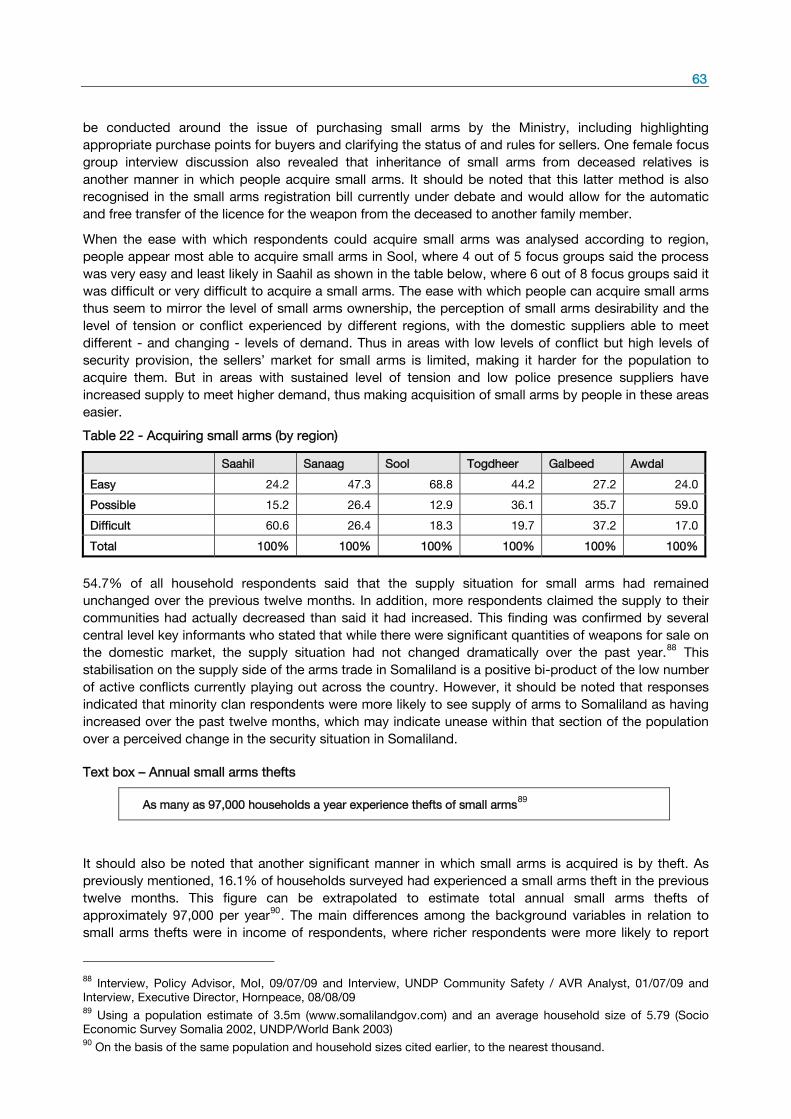
63
be conducted around the issue of purchasing small arms by the Ministry, including highlighting
appropriate purchase points for buyers and clarifying the status of and rules for sellers. One female focus
group interview discussion also revealed that inheritance of small arms from deceased relatives is
another manner in which people acquire small arms. It should be noted that this latter method is also
recognised in the small arms registration bill currently under debate and would allow for the automatic
and free transfer of the licence for the weapon from the deceased to another family member.
When the ease with which respondents could acquire small arms was analysed according to region,
people appear most able to acquire small arms in Sool, where 4 out of 5 focus groups said the process
was very easy and least likely in Saahil as shown in the table below, where 6 out of 8 focus groups said it
was difficult or very difficult to acquire a small arms. The ease with which people can acquire small arms
thus seem to mirror the level of small arms ownership, the perception of small arms desirability and the
level of tension or conflict experienced by different regions, with the domestic suppliers able to meet
different - and changing - levels of demand. Thus in areas with low levels of conflict but high levels of
security provision, the sellers’ market for small arms is limited, making it harder for the population to
acquire them. But in areas with sustained level of tension and low police presence suppliers have
increased supply to meet higher demand, thus making acquisition of small arms by people in these areas
easier.
Table 22 - Acquiring small arms (by region)
Saahil Sanaag Sool Togdheer Galbeed Awdal
Easy 24.2 47.3 68.8 44.2 27.2 24.0
Possible 15.2 26.4 12.9 36.1 35.7 59.0
Difficult 60.6 26.4 18.3 19.7 37.2 17.0
Total 100% 100% 100% 100% 100% 100%
54.7% of all household respondents said that the supply situation for small arms had remained
unchanged over the previous twelve months. In addition, more respondents claimed the supply to their
communities had actually decreased than said it had increased. This finding was confirmed by several
central level key informants who stated that while there were significant quantities of weapons for sale on
the domestic market, the supply situation had not changed dramatically over the past year.88
This
stabilisation on the supply side of the arms trade in Somaliland is a positive bi-product of the low number
of active conflicts currently playing out across the country. However, it should be noted that responses
indicated that minority clan respondents were more likely to see supply of arms to Somaliland as having
increased over the past twelve months, which may indicate unease within that section of the population
over a perceived change in the security situation in Somaliland.
Text box – Annual small arms thefts
As many as 97,000 households a year experience thefts of small arms89
It should also be noted that another significant manner in which small arms is acquired is by theft. As
previously mentioned, 16.1% of households surveyed had experienced a small arms theft in the previous
twelve months. This figure can be extrapolated to estimate total annual small arms thefts of
approximately 97,000 per year90
. The main differences among the background variables in relation to
small arms thefts were in income of respondents, where richer respondents were more likely to report
88
Interview, Policy Advisor, MoI, 09/07/09 and Interview, UNDP Community Safety / AVR Analyst, 01/07/09 and
Interview, Executive Director, Hornpeace, 08/08/09 89
Using a population estimate of 3.5m (www.somalilandgov.com) and an average household size of 5.79 (Socio
Economic Survey Somalia 2002, UNDP/World Bank 2003) 90
On the basis of the same population and household sizes cited earlier, to the nearest thousand.
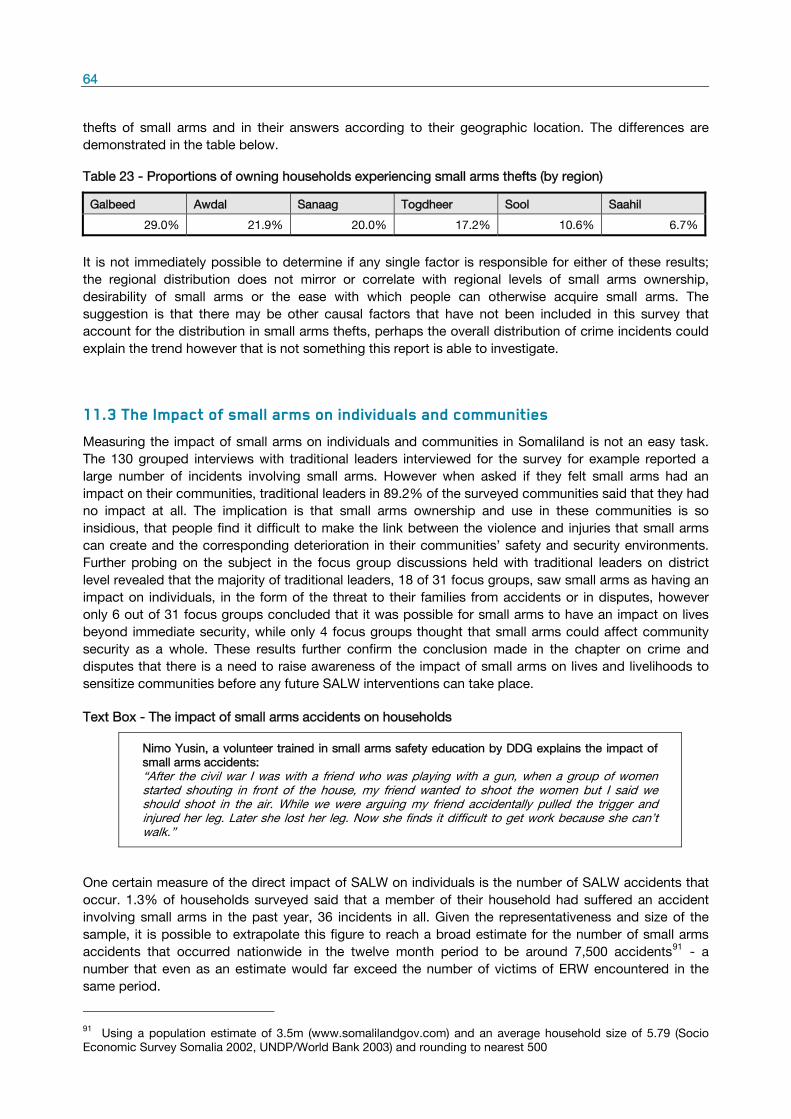
64
thefts of small arms and in their answers according to their geographic location. The differences are
demonstrated in the table below.
Table 23 - Proportions of owning households experiencing small arms thefts (by region)
Galbeed Awdal Sanaag Togdheer Sool Saahil
29.0% 21.9% 20.0% 17.2% 10.6% 6.7%
It is not immediately possible to determine if any single factor is responsible for either of these results;
the regional distribution does not mirror or correlate with regional levels of small arms ownership,
desirability of small arms or the ease with which people can otherwise acquire small arms. The
suggestion is that there may be other causal factors that have not been included in this survey that
account for the distribution in small arms thefts, perhaps the overall distribution of crime incidents could
explain the trend however that is not something this report is able to investigate.
11.3 The Impact of small arms on individuals and communities
Measuring the impact of small arms on individuals and communities in Somaliland is not an easy task.
The 130 grouped interviews with traditional leaders interviewed for the survey for example reported a
large number of incidents involving small arms. However when asked if they felt small arms had an
impact on their communities, traditional leaders in 89.2% of the surveyed communities said that they had
no impact at all. The implication is that small arms ownership and use in these communities is so
insidious, that people find it difficult to make the link between the violence and injuries that small arms
can create and the corresponding deterioration in their communities’ safety and security environments.
Further probing on the subject in the focus group discussions held with traditional leaders on district
level revealed that the majority of traditional leaders, 18 of 31 focus groups, saw small arms as having an
impact on individuals, in the form of the threat to their families from accidents or in disputes, however
only 6 out of 31 focus groups concluded that it was possible for small arms to have an impact on lives
beyond immediate security, while only 4 focus groups thought that small arms could affect community
security as a whole. These results further confirm the conclusion made in the chapter on crime and
disputes that there is a need to raise awareness of the impact of small arms on lives and livelihoods to
sensitize communities before any future SALW interventions can take place.
Text Box - The impact of small arms accidents on households
Nimo Yusin, a volunteer trained in small arms safety education by DDG explains the impact of
small arms accidents:
“After the civil war I was with a friend who was playing with a gun, when a group of women started shouting in front of the house, my friend wanted to shoot the women but I said we should shoot in the air. While we were arguing my friend accidentally pulled the trigger and injured her leg. Later she lost her leg. Now she finds it difficult to get work because she can’t walk.”
One certain measure of the direct impact of SALW on individuals is the number of SALW accidents that
occur. 1.3% of households surveyed said that a member of their household had suffered an accident
involving small arms in the past year, 36 incidents in all. Given the representativeness and size of the
sample, it is possible to extrapolate this figure to reach a broad estimate for the number of small arms
accidents that occurred nationwide in the twelve month period to be around 7,500 accidents91
- a
number that even as an estimate would far exceed the number of victims of ERW encountered in the
same period.
91
Using a population estimate of 3.5m (www.somalilandgov.com) and an average household size of 5.79 (Socio
Economic Survey Somalia 2002, UNDP/World Bank 2003) and rounding to nearest 500
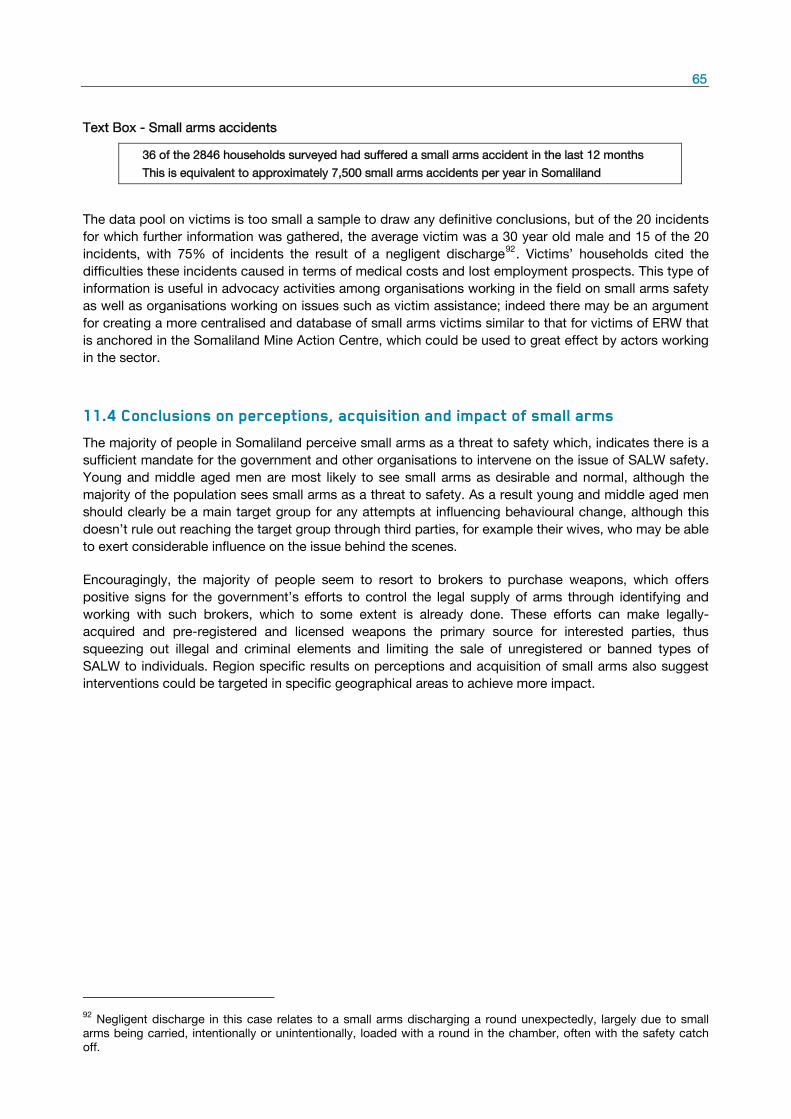
65
Text Box - Small arms accidents
36 of the 2846 households surveyed had suffered a small arms accident in the last 12 months
This is equivalent to approximately 7,500 small arms accidents per year in Somaliland
The data pool on victims is too small a sample to draw any definitive conclusions, but of the 20 incidents
for which further information was gathered, the average victim was a 30 year old male and 15 of the 20
incidents, with 75% of incidents the result of a negligent discharge92
. Victims’ households cited the
difficulties these incidents caused in terms of medical costs and lost employment prospects. This type of
information is useful in advocacy activities among organisations working in the field on small arms safety
as well as organisations working on issues such as victim assistance; indeed there may be an argument
for creating a more centralised and database of small arms victims similar to that for victims of ERW that
is anchored in the Somaliland Mine Action Centre, which could be used to great effect by actors working
in the sector.
11.4 Conclusions on perceptions, acquisition and impact of small arms
The majority of people in Somaliland perceive small arms as a threat to safety which, indicates there is a
sufficient mandate for the government and other organisations to intervene on the issue of SALW safety.
Young and middle aged men are most likely to see small arms as desirable and normal, although the
majority of the population sees small arms as a threat to safety. As a result young and middle aged men
should clearly be a main target group for any attempts at influencing behavioural change, although this
doesn’t rule out reaching the target group through third parties, for example their wives, who may be able
to exert considerable influence on the issue behind the scenes.
Encouragingly, the majority of people seem to resort to brokers to purchase weapons, which offers
positive signs for the government’s efforts to control the legal supply of arms through identifying and
working with such brokers, which to some extent is already done. These efforts can make legally-
acquired and pre-registered and licensed weapons the primary source for interested parties, thus
squeezing out illegal and criminal elements and limiting the sale of unregistered or banned types of
SALW to individuals. Region specific results on perceptions and acquisition of small arms also suggest
interventions could be targeted in specific geographical areas to achieve more impact.
92
Negligent discharge in this case relates to a small arms discharging a round unexpectedly, largely due to small
arms being carried, intentionally or unintentionally, loaded with a round in the chamber, often with the safety catch
off.

66
Chapter 12 Conclusions Despite the country’s recent history, or perhaps because of it, the population of Somaliland appear to
have a resiliently positive impression of their safety and security environment, although certain sections
of society clearly having deeper concerns, however discretely they may be held. The population is
currently experiencing a satisfactory level of security but still has security concerns surrounding issues
such as gang and clan violence, accidents from ERW and SALW and domestic violence. It can be
concluded from incident data that armed violence, accidents and domestic violence are regular
occurrences in Somaliland, affecting large number of individuals, households and communities and may
be exacerbated by the large quantities of SALW and ERW that are in circulation or easily available.
Communities can be suspicious of interventions on sensitive issues and may need sensitizing to the
safety concerns they are facing, including those related to SALW and ERW, before they will fully engage
with organisations implementing community safety interventions. Armed violence reduction is one such
area in particular where further sensitization, advocacy and awareness-raising may be needed prior to
implementing interventions. But the evidence in this survey indicates intensive awareness-raising,
advocacy and education may encourage people away from escalating disputes into armed violence,
could limit the number of weapons available to criminals and convince the significant minority of people
who think small arms are desirable and normal that this should not be the case.
ERW, like the SALW mentioned above, are held in private stockpiles and while not in such significant
numbers, represent one threat to safety and security in Somaliland that cannot easily be removed. Like
SALW, the threat they represent must be mitigated through consensual interventions stressing
awareness raising, advocacy and risk education, conducted as part of an approach to community safety
integrated with other development agencies to provide full chain assistance to target populations
Although there are significant challenges in issues relating to SALW and ERW as discussed above, on
other issues, for example domestic abuse, there appears to be recognition of the problem and a
willingness to engage with community safety practitioners. It is encouraging that all sections of society
are unanimous in their recognition of the seriousness of such crimes, even as these crimes occur with
depressing regularity; suggesting interventions in these areas have a clear mandate from the population
and that interventions could be immediately implemented and with some chance of success.
On the performance of security providers, it is noticeable that Somaliland does have a functioning
mechanism for traditional dispute regulation to cover soft spots in the institutional coverage of the police.
This is not necessarily a perfect model for security provision, as suggested by the responses from the
population, but neither does there appear to be any friction between the police, traditional leaders and
religious leaders in this practice, with both of the latter accepting that they should play the secondary role
if possible in the area of crime, if not also disputes. Furthermore, the reputation of the police and level of
trust placed in them as an institution is encouraging, even while they face challenges in terms of capacity
and resources.
The main issue in this relationship is actually between the traditional and religious leaders, where there is
some lack of clarity on how the two sides cooperate on and divide different tasks relating to crime and
particularly disputes. It should not be seen by practitioners as a competition for space, funding or
prestige, as to a large extent the two groups have separate and complementary abilities in the fields of
dispute resolution and conflict mediation. Organisations working through these two groups in the fields
of dispute resolution should perhaps, with the encouragement and coordination of their donors seek to
work together and importantly, also with the police, to create an integrated framework for their
interventions. This would ultimately benefit the field of community safety in Somaliland as a whole. Other
actors in the field of community safety could beneficially increase their support for improving the inter-
linkages between police, traditional leaders and religious leaders in these processes, while still
maintaining and developing cooperation with the police in areas such as community-based policing.

67
Whatever the progress in other areas, the issues of ERW and SALW will remain one of the big threats to
community safety in Somaliland unless coherently and realistically addressed. Voluntary-led registration
and advocacy to alter perceptions of small arms will be important; so too will small arms safety education
and awareness-raising on the dangers of keeping stockpiles of ERW. These are not easy or quick aims to
meet - even less so when taken as part of a wider community safety and development agenda but it may
be the case that such a wide ranging approach represents Somaliland’s best chance of continuing to
exemplify peaceful progress in the Horn of Africa.


Annex A
Key Informant Interviews
Community Safety / Armed Violence Reduction Analyst, UNDP, Hargeisa, 01/07/09
Policy Advisor for Security, Ministry of Interior, Hargeisa, 09/07/09
Programme Coordinator, Hornpeace NGO, Hargeisa, 08/08/09
Founder, Haqsoor NGO, Hargeisa, 09/08/09
Abdirahman Yusuf Duale, Land Disputes Expert, 12/07/09
Religious Leaders:
Sheikh Ismail, Consultant, Religious Leaders Programme, Horn University, Hargeisa, 10/08/09
Sheikh Almis, Coordinator, Religious Leaders Programme, Horn University, Hargeisa, 04/08/09
Bare Osmaan Muhamed, School Teacher, Hargeisa, 31/08/09
Hassan Ahmed Ali, School Teacher, Hargeisa, 31/08/09
Nuur Siciid C/laahi, Imam, Hargeisa, 31/08/09
Ahmed Cabdilahi Mohamed, Imam, Hargeisa, 31/08/09
Jubul Cali Guhaaad, Madras Teacher, Hargeisa, 31/08/09
Maxamed Cali Yuusuf, Madras Teacher, Hargeisa, 31/08/09
Maxamed Xuseen Xasan, Hargeisa, 31/08/09
Mohamed Ibrahim Jama, Hargeisa, 31/08/09

Annex B
Data Collection Timeframe
As with any survey conducted over an extended period, the data in this report may have been influenced
in certain places by the timing of the data collection. To enable the reader to identify when certain
information was collected the following table provides an overview of when and where data was
collected.93
District Date
Booroma April 2009
Lughaya February 2009
Saylac February 2009
Daarasalaam April 2009
Faraweyne March 2009
Allay baday March 2009
Cadaadlay March 2009
Sabawanaag March 2009
Salaxley March 2009
Gabilay March 2009
Balligubadle March 2009
Hargeisa 26 June April 2009
Hargeisa Ahmed Dhagah April 2009
Hargeisa Ga’an libah April 2009
Hargeisa Koodbuur April 2009
Hargeisa Mohamoud Haibe April 2009
Berbera August 2008
Madheera September 2008
Caynabo November 2008
Lasanood November 2008
Maydh October 2008
Erigavo October 2008
Eelafeweyne October 2008
Gara dag October 2008
Darer weyne April 2009
Qoryaale November 2008
Duruqsi November 2008
Oodweyne November 2008
Burao January 2009
Sheekh September 2008
Ballidihiig November 2008
93
Focus group interviews and district level police interviews were conducted during the same field trips as the
household questionnaires listed above

Annex C
1 of 7
DDG Somaliland Household Questionnaire
Interview data I1 Report number:
I2 District name:
I3 Community Name:
I4 Urban or Rural? 1 = Urban (Main town of each region + Gabiley) 2 = Rural ….|___|
I5 Size of community:
1 = Less than 100 households 2 = 100-200 households 3 = 200-400 households 4 = More than 400 households
….|___|
I6 GPS Coordinate:
I7 GPS indicator:
1 = School 2 = Mosque 3 = Police station 4 = MCH 5 = Sports field 6 = Commercial tower (etc tower etc) 7 = Market 8 = Community centre Other…………___________________ Code ….|___|
….|___|
I8 Date of interview:
I9 Month of interview:
1 = August 2 = September 3 = October 4 = November 5 = December 6 = January 7 = February 8 = March 9 = April
….|___|
I10 Day of Interview:
1 = Saturday 2 = Sunday 3 = Monday 4 = Tuesday 5 = Wednesday 6 = Thursday 7 = Friday
….|___|
I11 Time of interview: 1 = Morning (8-12) 2 = Afternoon (12-4) 3 = Other…………___________________ Code ….|___|
….|___|
I12 Enumerator code: ….|___|
I13 Questionnaire completed on the ...
1 = First visit to that household 2 = Second (return) visit to that household ….|___|

Annex C
2 of 7
Background data
B1 Sex of respondent: 1 = Female 2 = Male ….|___|
B2 How old are you?
B3 What is your occupation?
1 = Working (labourer) 2 = Pastoralist 3 = Farmer 4 = Fisherman 5 = Businessman/-woman 6 = Government employee (incl. military & police) 7 = Employee with LNGO, INGO, UN 8 = Housewife 9 = Student 10 = Retired/disabled 11 = Unemployed Other…………___________________ Code ….|___| 88 = Refused to answer
….|___|
B4
(NB: Only ask in urban areas) What is the average daily income size of this household?
(Write in Somaliland shillings)
B5
On a scale from 0 to 4, how do you perceive the income/situation for your family? (0 is considered very poor, while 4 is considered rich/well off)
77 = Don’t know 88 = Refused to answer
….|___|
B6
Which of the following groups do you belong to: (NB: Read out answer)
1 = Majority clan 2 = Minority clan 3 = Somalia outside Somaliland 4 = Ethiopia Other…………___________________ Code ….|___| 88 = Refused to answer
Safety and Security
SS1
Do you consider your community to be: NB: Read out answers 1-3
1 = Safe 2 = Neither safe nor unsafe 3 = Unsafe 77 = Don’t know 88 = Refused to answer
….|___|
SS2 Compared to 1 year ago, how is the security in your community?
1 = Improved 2 = The same 3 = Worsened 77 = Don’t know 88 = Refused to answer
….|___|

Annex C
3 of 7
SS3
What are the 3 main safety and security concerns in this community? Please rank 1, 2, 3
1 = No safety or security concerns Threats from the state 2 = Political instability/insecurity in Somaliland Threats from other states 3 = Political instability/insecurity in Somalia or neighbouring countries, incl. conflict with Puntland or neighbouring countries Threats from groups of other people 4 = Clan conflicts/Inter-clan tensions Threats from gangs 5 = Crime or street violence caused by gangs Threats from individuals 6 = Crime or street violence caused by individuals Threats against women 7 = Rape, domestic violence, forced marriage etc. Threats against children 8 = Child abuse, baby abandonment, kidnapping etc. Accident related threats 9 = Mines, UXOs, small arms related accidents, traffic accidents etc. Threats to self (or others) 10 = Suicide 11 = Drugs, alcohol, khat Threats from nature 12 = Wild animals, insects (incl. mosquitoes), natural disasters (incl. flooding) Other…………____________________________ Code ….|___| 77 = Don’t know 88 = Refused to answer
1. |___| 2. |___| 3. |___|
Disputes and Crime (NB. In this section threats against women and children are counted as crime as well)
DC1
In your opinion, what are the 3 most common types of disputes in your community? Please rank 1, 2, 3
1 = There are no disputes 2 = Disputes regarding criminal activity such as theft, murder or rape 3 = Disputes regarding compensation for accidents 4 = Grazing land disputes 5 = Farm disputes 6 = Disputes about enclosures 7 = Disputes about water sources 8 = Land (plot) disputes 9 = Disputes about livestock property 10 = Disputes about other property 11 = Disputes about charcoal burning area Other…………______________________ Code ….|___| 77 = Don’t know 88 = Refused to answer
1.|___|
2.|___|
3.|___|
DC2
Are you concerned that you or a member of your household may become victim of a crime or violent encounter?
1 = Yes 2 = No 77 = Don’t know 88 = Refused to answer
….|___|
DC3
Has anyone in your household been a victim of a crime or violent encounter within the last year?
1 = Yes ( fill out separate incident report) 2 = No 77 = Don’t know 88 = Refused to answer
….|___|
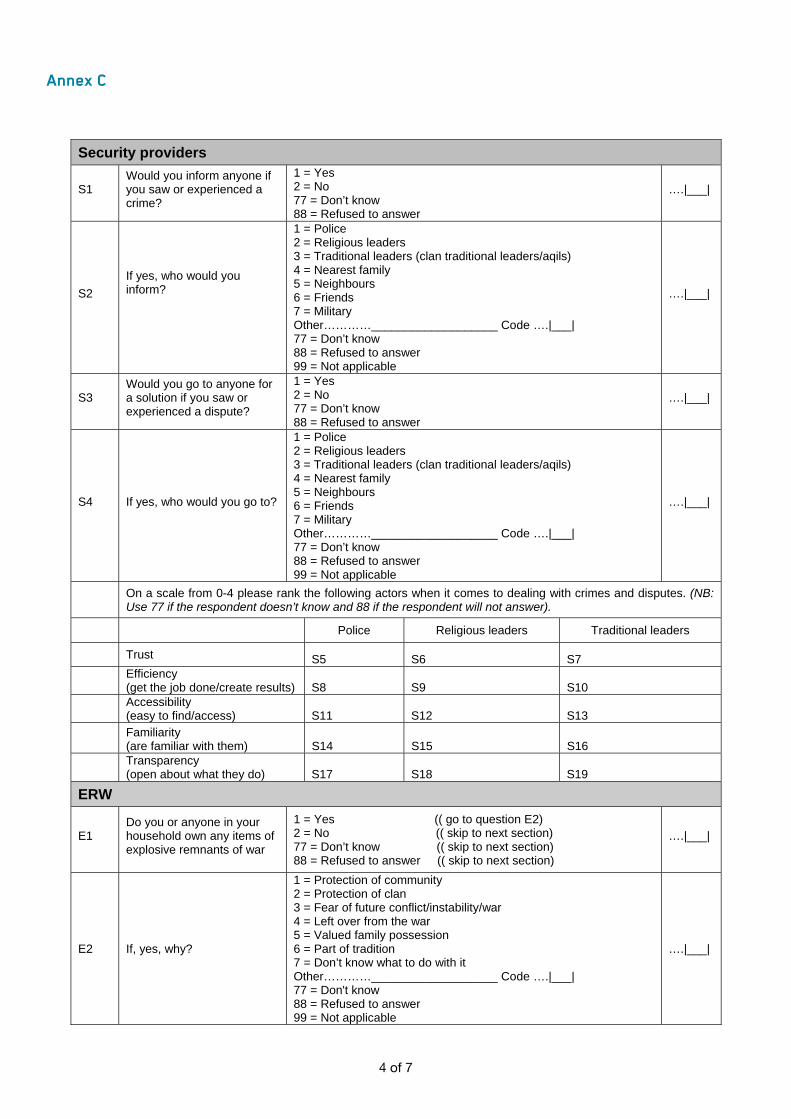
Annex C
4 of 7
Security providers
S1 Would you inform anyone if you saw or experienced a crime?
1 = Yes 2 = No 77 = Don’t know 88 = Refused to answer
….|___|
S2 If yes, who would you inform?
1 = Police 2 = Religious leaders 3 = Traditional leaders (clan traditional leaders/aqils) 4 = Nearest family 5 = Neighbours 6 = Friends 7 = Military Other…………___________________ Code ….|___| 77 = Don’t know 88 = Refused to answer 99 = Not applicable
….|___|
S3 Would you go to anyone for a solution if you saw or experienced a dispute?
1 = Yes 2 = No 77 = Don’t know 88 = Refused to answer
….|___|
S4 If yes, who would you go to?
1 = Police 2 = Religious leaders 3 = Traditional leaders (clan traditional leaders/aqils) 4 = Nearest family 5 = Neighbours 6 = Friends 7 = Military Other…………___________________ Code ….|___| 77 = Don’t know 88 = Refused to answer 99 = Not applicable
….|___|
On a scale from 0-4 please rank the following actors when it comes to dealing with crimes and disputes. (NB: Use 77 if the respondent doesn’t know and 88 if the respondent will not answer).
Police Religious leaders Traditional leaders
Trust S5 S6 S7
Efficiency (get the job done/create results) S8 S9 S10
Accessibility (easy to find/access) S11 S12 S13
Familiarity (are familiar with them) S14 S15 S16
Transparency (open about what they do) S17 S18 S19
ERW
E1 Do you or anyone in your household own any items of explosive remnants of war
1 = Yes (( go to question E2) 2 = No (( skip to next section) 77 = Don’t know (( skip to next section) 88 = Refused to answer (( skip to next section)
….|___|
E2 If, yes, why?
1 = Protection of community 2 = Protection of clan 3 = Fear of future conflict/instability/war 4 = Left over from the war 5 = Valued family possession 6 = Part of tradition 7 = Don’t know what to do with it Other…………___________________ Code ….|___| 77 = Don't know 88 = Refused to answer 99 = Not applicable
….|___|

Annex C
5 of 7
Small arms perceptions and incidents
F1
How do you mainly perceive small arms? (NB: Read out answers)
1 = Desirable & normal 2 = Threat to safety 3 = Makes no difference (neither desirable nor threat) 77 = Don’t know 88 = Refused to answer
….|___|
F2 How easy or difficult do you think it is to acquire a small arm in your community?
1 = Easy 2 = Possible 3 = Difficult 77 = Don’t know 88 = Refused to answer
….|___|
F3 In your opinion, are there too many small arms in your community?
1 = Yes 2 = No 77 = Don’t Know 88 = Refused to answer
….|___|
F4
In your opinion, how is the supply of small arms to your community compared to one year ago?
1 = Increased 2 = The same 3 = Decreased 77 = Don’t know 88 = Refused to answer
….|___|
F5
Has anyone in your household had an accident with small arms within the last year?
1 = Yes ( fill out separate accident report) 2 = No 77 = Don’t know 88 = Refused to answer
….|___|
F6
Has anyone in this house been threatened or made to feel fearful by someone with a small arm within the last year?
1 = Yes ( fill out separate threat report) 2 = No 77 = Don’t know 88 = Refused to answer
….|___|
Small arms ownership
FO1 Do you or anyone in your household own any small arms?
1 = Yes ( skip to question FO3) 2 = No (( go to question FO2) 77 = Don’t know (( skip to next section) 88 = Refused to answer (( skip to next section)
….|___|
FO2 If no, why not?
1 = No security problems 2 = Adequate protection 3 = Don’t like guns 4 = Dangerous for family in the house (i.e. children) 5 = Dangerous for community 6 = Don’t know how to use one 7 = Can’t afford 8 = Had one, but it was stolen Other…………___________________ Code ….|___| 77 = Don’t know 88 = Refused to answer 99 = Not applicable (Now skip to next section)
….|___|
FO3 If yes, how many small arms do the household own?
….|___|
FO4
Who are the owners of the small arms? Please explain according to gender and age.
(Up to 3 answers allowed if 3 or more small arms)
1 = Man, age 15-19 2 = Man, age 20-29 3 = Man, age 30-45 4 = Man, age 46+ 5 = Woman, age 15-19 6 = Woman, age 20-29 7 = Woman, age 30-45 8 = Woman, age 46+ 77 = Don’t know 88 = Refused to answer 99 = Not applicable
….|___|
….|___|
….|___|
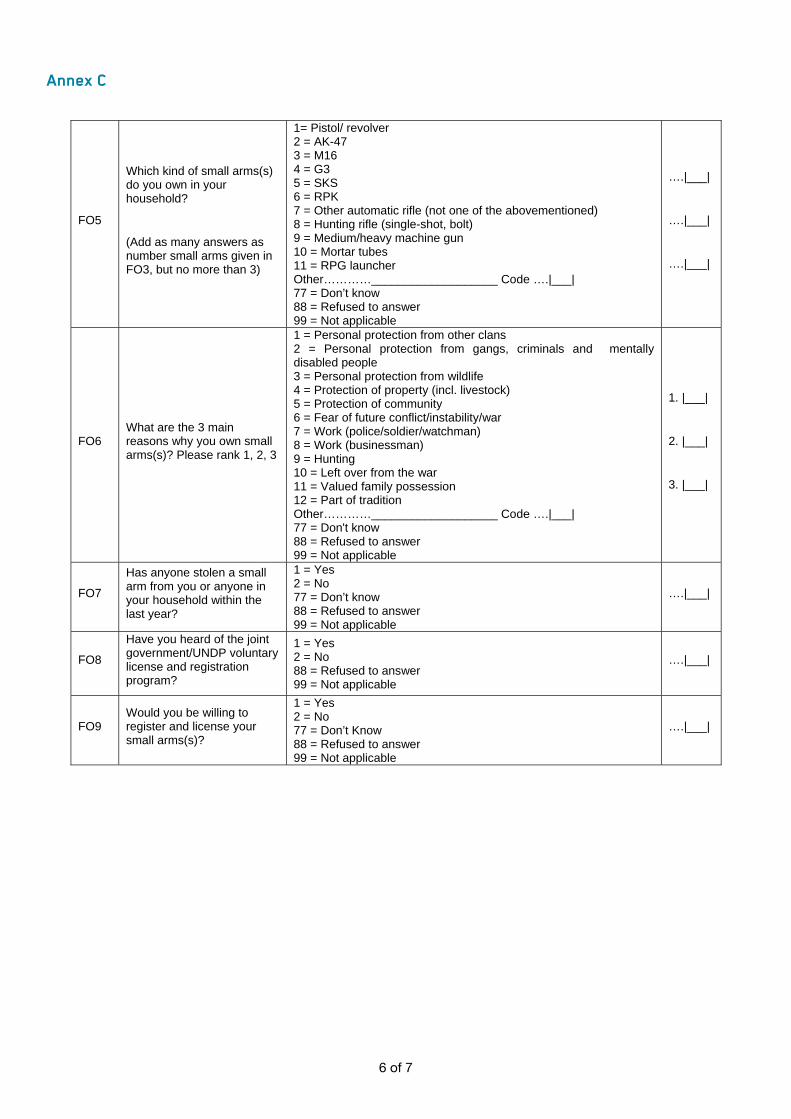
Annex C
6 of 7
FO5
Which kind of small arms(s) do you own in your household?
(Add as many answers as number small arms given in FO3, but no more than 3)
1= Pistol/ revolver 2 = AK-47 3 = M16 4 = G3 5 = SKS 6 = RPK 7 = Other automatic rifle (not one of the abovementioned) 8 = Hunting rifle (single-shot, bolt) 9 = Medium/heavy machine gun 10 = Mortar tubes 11 = RPG launcher Other…………___________________ Code ….|___| 77 = Don’t know 88 = Refused to answer 99 = Not applicable
….|___|
….|___|
….|___|
FO6 What are the 3 main reasons why you own small arms(s)? Please rank 1, 2, 3
1 = Personal protection from other clans 2 = Personal protection from gangs, criminals and mentally disabled people 3 = Personal protection from wildlife 4 = Protection of property (incl. livestock) 5 = Protection of community 6 = Fear of future conflict/instability/war 7 = Work (police/soldier/watchman) 8 = Work (businessman) 9 = Hunting 10 = Left over from the war 11 = Valued family possession 12 = Part of tradition Other…………___________________ Code ….|___| 77 = Don't know 88 = Refused to answer 99 = Not applicable
1. |___|
2. |___|
3. |___|
FO7
Has anyone stolen a small arm from you or anyone in your household within the last year?
1 = Yes 2 = No 77 = Don’t know 88 = Refused to answer 99 = Not applicable
….|___|
FO8
Have you heard of the joint government/UNDP voluntary license and registration program?
1 = Yes 2 = No 88 = Refused to answer 99 = Not applicable
….|___|
FO9 Would you be willing to register and license your small arms(s)?
1 = Yes 2 = No 77 = Don’t Know 88 = Refused to answer 99 = Not applicable
….|___|
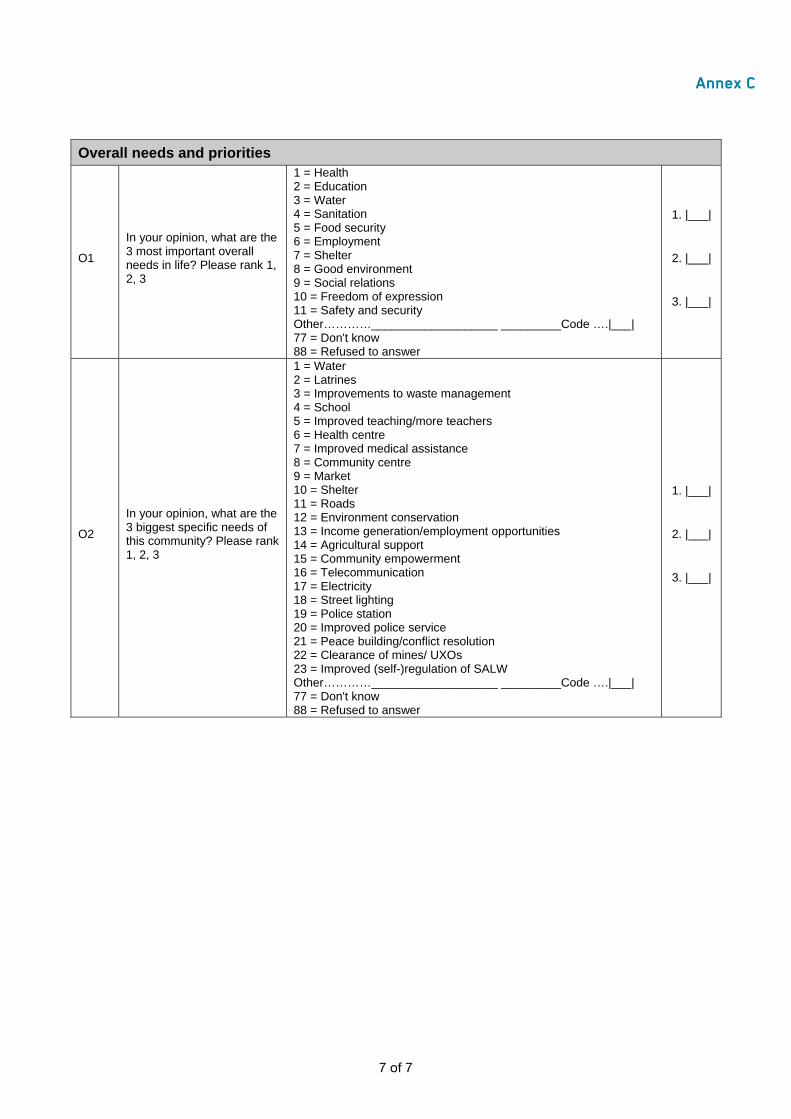
Annex C
7 of 7
Overall needs and priorities
O1
In your opinion, what are the 3 most important overall needs in life? Please rank 1, 2, 3
1 = Health 2 = Education 3 = Water 4 = Sanitation 5 = Food security 6 = Employment 7 = Shelter 8 = Good environment 9 = Social relations 10 = Freedom of expression 11 = Safety and security Other…………___________________ _________Code ….|___| 77 = Don't know 88 = Refused to answer
1. |___|
2. |___|
3. |___|
O2
In your opinion, what are the 3 biggest specific needs of this community? Please rank 1, 2, 3
1 = Water 2 = Latrines 3 = Improvements to waste management 4 = School 5 = Improved teaching/more teachers 6 = Health centre 7 = Improved medical assistance 8 = Community centre 9 = Market 10 = Shelter 11 = Roads 12 = Environment conservation 13 = Income generation/employment opportunities 14 = Agricultural support 15 = Community empowerment 16 = Telecommunication 17 = Electricity 18 = Street lighting 19 = Police station 20 = Improved police service 21 = Peace building/conflict resolution 22 = Clearance of mines/ UXOs 23 = Improved (self-)regulation of SALW Other…………___________________ _________Code ….|___| 77 = Don't know 88 = Refused to answer
1. |___|
2. |___|
3. |___|

Annex D
Crime Incident Report (Related to question DC3 in Household questionnaire)
Victim data
A1 Report number:
A2 District name:
A3 Community Name:
A4 GPS Coordinate:
A5 Enumerator code:
A6 Age of victim:
A7 Sex of victim: 1 = Female 2 = Male ….|___|
Incident details
A8 Type of crime:
1 = Threat/intimidation 2 = Spontaneous killing 3 = Intentional killing 4 = Revenge killing 5 = Assault/beating/shooting/fighting 6 = Rape/sexual assault 7 = Domestic violence 8 = Robbery/theft 9 = Victim of clan fighting 10 = Victim of gang violence 11 = Drug dealing 12 = Kidnapping 13 = Child abuse 14 = Baby throwing/abandonment Other…………________________________________ Code ….|___| 77 = Don’t know 88 = Refused to answer
….|___|
A9 Type of weapon used to (help) commit the crime:
1 = No weapon was used 2 = Stones 3 = Fire 4 = Stick 5 = Axe 6 = Knife/Sward/“Torris“ etc. 7 = Pistol/ revolver 8 = AK-47/Other automatic rifle 9 = Hunting rifle (single-shot, bolt) 10 = Medium/heavy machine gun Other…………_______________________________ Code ….|___| 77 = Don’t know 88 = Refused to answer
….|___|

Annex D
A10 Area of incident:
1 = In the home 2 = On private land 3 = On the street 4 = At a public gathering place 5 = At a market 6 = In the workplace Other…………_______________________________ Code ….|___| 77 = Don’t know 88 = Refused to answer
….|___|
A11 Weekday of incident:
1 = Saturday 2 = Sunday 3 = Monday 4 = Tuesday 5 = Wednesday 6 = Thursday 7 = Friday 77 = Don’t know 88 = Refused to answer
….|___|
A12 Time of day of incident:
1 = Morning (6am-12pm) 2 = Afternoon (12pm-6pm) 3 = Evening (6pm-12am) 4 = Night (12am-6am) 77 = Don’t know 88 = Refused to answer
….|___|
A13 Details of incident / what happened:

Annex D
Injuries
A14 Was the victim injured or killed?
1 =No 2 = Injured 3 = Killed 77 = Don’t know 88 = Refused to answer
….|___|
A15 Please tick off inflicted injuries, if any, (even if killed) in the two tables below
A16
Long term impact of crime on victim (and household)
(Up to 3 answers allowed)
1 = Loss of lems 2 = Loss of organs 3 = Long term pains 4 = Increased medical costs 5 = Loss of ability to work 6 = Mental impact/traumatize 7 = No long term impact Other…………_______________________________ Code ….|___| 77 = Don’t know 88 = Refused to answer
….|___|
….|___|
….|___|
Other Injuries:
Head/Neck
Chest
Back Abdomen
Pelvis/Buttocks Upper limbs
Lower limbs
Injuries of:
Eyesight Eyesight
Hearing Hearing
Right side Left side
Arm Arm
Hand/Finger Hand/Finger
Above Knee Above Knee
Leg Leg
Below Knee Below Knee
Foot/Toes Foot/Toes
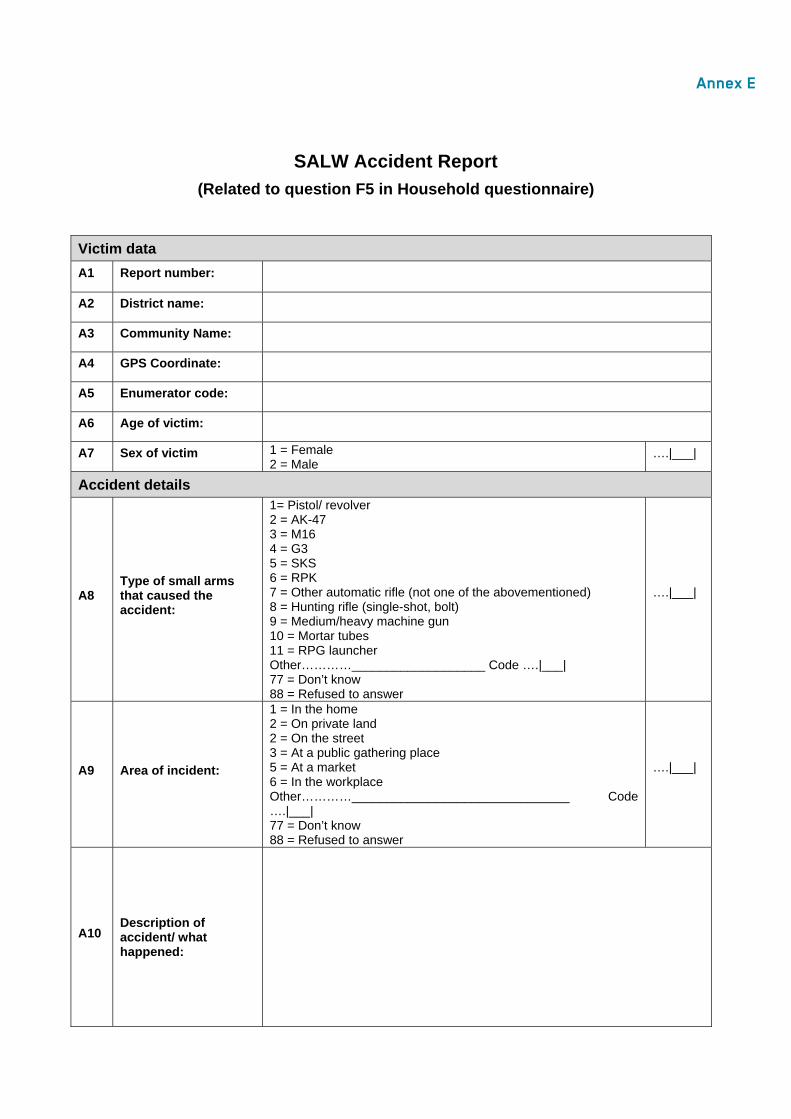
Annex E
SALW Accident Report (Related to question F5 in Household questionnaire)
Victim data A1 Report number:
A2 District name:
A3 Community Name:
A4 GPS Coordinate:
A5 Enumerator code:
A6 Age of victim:
A7 Sex of victim 1 = Female 2 = Male
….|___|
Accident details
A8 Type of small arms that caused the accident:
1= Pistol/ revolver 2 = AK-47 3 = M16 4 = G3 5 = SKS 6 = RPK 7 = Other automatic rifle (not one of the abovementioned) 8 = Hunting rifle (single-shot, bolt) 9 = Medium/heavy machine gun 10 = Mortar tubes 11 = RPG launcher Other…………___________________ Code ….|___| 77 = Don’t know 88 = Refused to answer
….|___|
A9 Area of incident:
1 = In the home 2 = On private land 2 = On the street 3 = At a public gathering place 5 = At a market 6 = In the workplace Other…………_______________________________ Code ….|___| 77 = Don’t know 88 = Refused to answer
….|___|
A10 Description of accident/ what happened:

Annex E
Injuries
A10 Was the person injured or killed 1 = No 2 = Injured 3 = Killed 77 = Don’t know
….|___|
A11 Please tick off inflicted injuries, if any, (even if killed) in the two tables on next page
A12
Long term impact of accident on victim (and household)
(Up to 3 answers allowed)
1 = Loss of lems 2 = Loss of organs 3 = Long term pains 4 = Increased medical costs 5 = Loss of ability to work 6 = Mental impact/traumatize Other…………_______________________________ Code ….|___| 77 = Don’t know 88 = Refused to answer
….|___|
….|___|
….|___|
Other Injuries:
Head/Neck
Chest
Back Abdomen
Pelvis/Buttocks
Upper limbs
Lower limbs
Injuries of:
Eyesight Eyesight
Hearing Hearing
Right side Left side
Arm Arm
Hand/Finger Hand/Finger
Above Knee Above Knee
Leg Leg
Below Knee Below Knee
Foot/Toes Foot/Toes

Annex F
SALW Threat Report (Related to question F6 in HH questionnaire)
Victim data
A1 Report number:
A2 District name:
A3 Community Name:
A4 GPS Coordinate:
A5 Enumerator code:
A6 Age of victim:
A7 Sex of victim 1 = Female 2 = Male
….|___|
Incident details
A8 Type of small arms used for the threat/intimidation:
1= Pistol/ revolver 2 = AK-47 3 = M16 4 = G3 5 = SKS 6 = RPK 7 = Other automatic rifle (not one of the abovementioned) 8 = Hunting rifle (single-shot, bolt) 9 = Medium/heavy machine gun 10 = Mortar tubes 11 = RPG launcher Other…………___________________ Code ….|___| 77 = Don’t know 88 = Refused to answer
….|___|
A9 Area where the threat/intimidation occured:
1 = In the home 2 = On private land 2 = On the street 3 = At a public gathering place 5 = At a market 6 = In the workplace Other…………_______________________________ Code ….|___| 77 = Don’t know 88 = Refused to answer
….|___|
A10 Weekday where the threat/initimidation occured
1 = Saturday 2 = Sunday 3 = Monday 4 = Tuesday 5 = Wednesday 6 = Thursday 7 = Friday 77 = Don’t know 88 = Refused to answer
….|___|
A11 Time of day of the threat/intimidation
1 = Morning (6am-12pm) 2 = Afternoon (12pm-6pm) 3 = Evening (6pm-12am) 4 = Night (12am-6am) 77 = Don’t know 88 = Refused to answer
….|___|

Annex F
A12 Details of what happened:
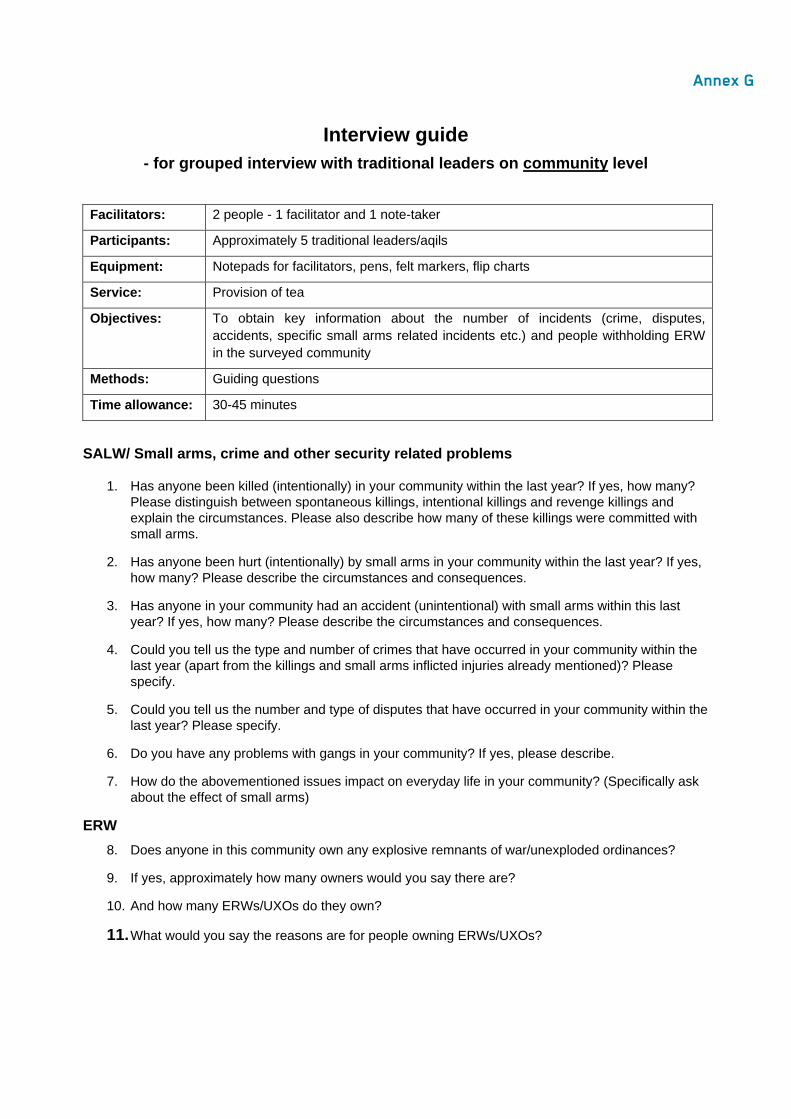
Annex G
Interview guide - for grouped interview with traditional leaders on community level
Facilitators: 2 people - 1 facilitator and 1 note-taker
Participants: Approximately 5 traditional leaders/aqils
Equipment: Notepads for facilitators, pens, felt markers, flip charts
Service: Provision of tea
Objectives: To obtain key information about the number of incidents (crime, disputes, accidents, specific small arms related incidents etc.) and people withholding ERW in the surveyed community
Methods: Guiding questions
Time allowance: 30-45 minutes
SALW/ Small arms, crime and other security related problems
1. Has anyone been killed (intentionally) in your community within the last year? If yes, how many? Please distinguish between spontaneous killings, intentional killings and revenge killings and explain the circumstances. Please also describe how many of these killings were committed with small arms.
2. Has anyone been hurt (intentionally) by small arms in your community within the last year? If yes, how many? Please describe the circumstances and consequences.
3. Has anyone in your community had an accident (unintentional) with small arms within this last year? If yes, how many? Please describe the circumstances and consequences.
4. Could you tell us the type and number of crimes that have occurred in your community within the last year (apart from the killings and small arms inflicted injuries already mentioned)? Please specify.
5. Could you tell us the number and type of disputes that have occurred in your community within the last year? Please specify.
6. Do you have any problems with gangs in your community? If yes, please describe.
7. How do the abovementioned issues impact on everyday life in your community? (Specifically ask about the effect of small arms)
ERW 8. Does anyone in this community own any explosive remnants of war/unexploded ordinances?
9. If yes, approximately how many owners would you say there are?
10. And how many ERWs/UXOs do they own?
11. What would you say the reasons are for people owning ERWs/UXOs?


Annex H
Interview Guide for Focus Groups
Facilitators: 2 people for each focus group discussion – 1 facilitator and 1 note-taker. When interviewing the women’s group, both should be women.
Participants:
In each district: 1 group of women 1 group of men 1 group of youth (mixed – but if the young women are not heard then 2 separate interviews should be held – one with the young women and one with the young men) In relevant areas: Minorities Refugees IDPs 7-10 persons per group is a good number
Equipment: Notepads for facilitators, pens, felt markers, flip charts Service: Provision of tea for participants
Objectives: To develop an understanding of the SALW and personal security situation and the differences in perspectives of women, men, youth and various minorities.
Method: Guiding questions Time allowance: 1 ½-2 hours
Introduction See also separate introduction note
Introduce yourselves to the group and explain the purpose of the meeting. Be very direct and honest about the project and be open to questions from the participants. Explain that the information collected is will be used to assist DDG, DRC and other agencies to better plan their activities in Somaliland in the future (Note that you cannot promise though, that we will specifically come back and assist their community). Explain that it is important that all members of the focus group be allowed to freely participate and respond and that people should feel welcome to add their opinions or experiences even when they differ from the majority in the group. Finally, introduce the structure of the interview so that the interviewees know what is coming.
Guiding Questions Overall safety and security concerns
1a. How safe do you consider this district to be? Use the scale of 0 to 4 and note down differences of opinion.
1b. Why do you place the safety level there?
2a. How do you think security in this district is compared to 1 year ago?
2b. If it has changed, how has changed and why it has changed?
3. What would you say are the biggest safety and security problems in your district? Write the issues down on a flip chart to help you keep an overview and to use it later.
4. Could you provide some specific examples of the kinds of security and safety issues you have listed?

Annex H
5. What do you think causes these safety and security problems? Probe for causes for each of the safety and security problems written down on the flip chart.
6. How do you find that these safety and security problems affect people’s daily lives? Probe for effect for each of the safety and security problems written down on the flip chart
7. What do you think could be done to prevent and counteract these safety and security problems?
8a. Do you have any problems with gangs in your district?
8b. If yes, please describe the problem and reflect on causes of the problem and possible solutions. Remember to include description of problem, causes and possible solutions in the answer.
SALW – Attitudes and perceptions
9a. What is your general perception of small arms?
9b. Why do you see small arms like this?
10a. Do you think there are too many small arms in your district?
10b1. If no, why not?
10b2. If yes, why?
10c. If yes, which groups of people have too many small arms?
SALW – supply and availability
11. On a scale from 1 to 5 with 5 being very easy and 1 being very difficult, how easy would you say it is to acquire a small arm in this district?
12. If someone wanted a small arm, where and how do you think he/she could get one? Please remember to include both the where and the how in the answers
SALW demand
13. Why do you think people keep small arms?
14a. Who would you say are the primary small arms owners/users in your district?
14b. Why do you think these are the primary small arms owners/users. (Note that there may be a bit of overlap with question 12)
SALW impact
15a. Do you think that small arms have an effect on people’s personal security?
15b. If yes, what kind of effect?
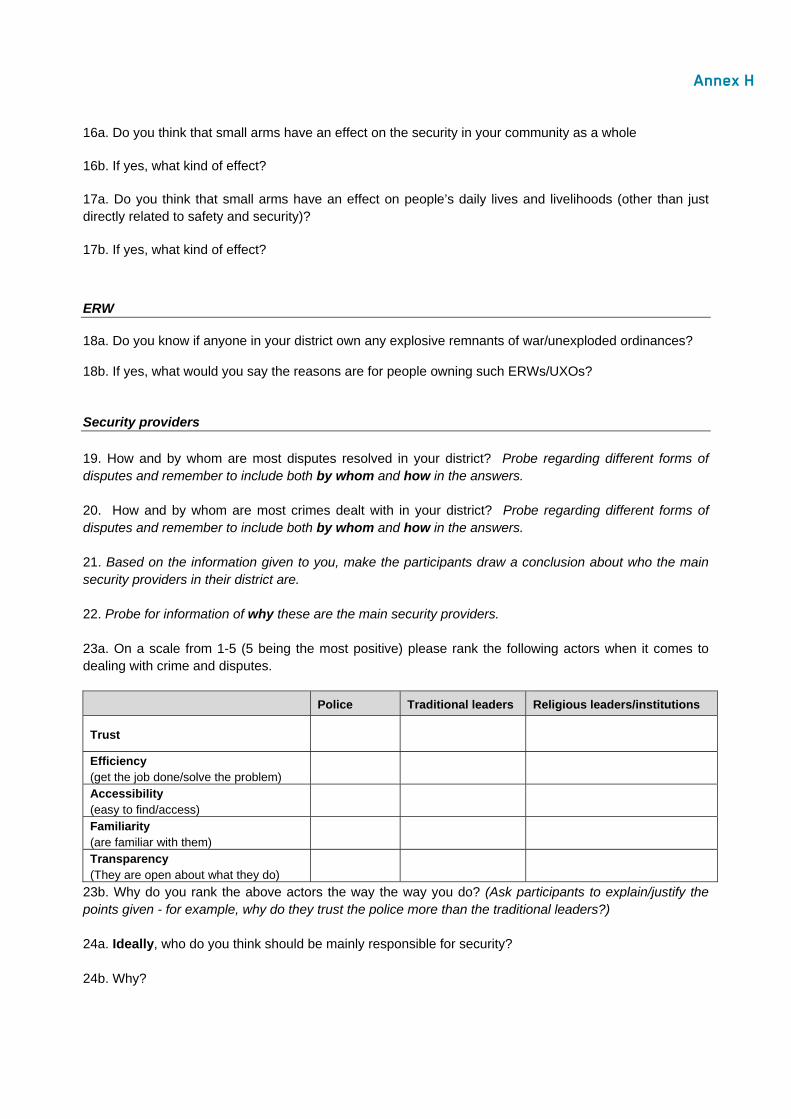
Annex H
16a. Do you think that small arms have an effect on the security in your community as a whole
16b. If yes, what kind of effect?
17a. Do you think that small arms have an effect on people’s daily lives and livelihoods (other than just directly related to safety and security)?
17b. If yes, what kind of effect?
ERW
18a. Do you know if anyone in your district own any explosive remnants of war/unexploded ordinances?
18b. If yes, what would you say the reasons are for people owning such ERWs/UXOs?
Security providers 19. How and by whom are most disputes resolved in your district? Probe regarding different forms of disputes and remember to include both by whom and how in the answers. 20. How and by whom are most crimes dealt with in your district? Probe regarding different forms of disputes and remember to include both by whom and how in the answers. 21. Based on the information given to you, make the participants draw a conclusion about who the main security providers in their district are. 22. Probe for information of why these are the main security providers. 23a. On a scale from 1-5 (5 being the most positive) please rank the following actors when it comes to dealing with crime and disputes.
Police Traditional leaders Religious leaders/institutions
Trust
Efficiency (get the job done/solve the problem)
Accessibility (easy to find/access)
Familiarity (are familiar with them)
Transparency (They are open about what they do)
23b. Why do you rank the above actors the way the way you do? (Ask participants to explain/justify the points given - for example, why do they trust the police more than the traditional leaders?) 24a. Ideally, who do you think should be mainly responsible for security? 24b. Why?

Annex H
Safety and security concerns in relation to other concerns 25. What, in your opinion, are the main problems of this district? Please look broadly at all concerns of the community – development as well as security/safety related problems
26. Do these problems somehow affect each other?
27a. How do you see the safety and security concerns listed in the beginning of the interview compared to the other concerns you have just mentioned? Which are most serious?
27b. Why do you consider these as the most serious ones?


The report has been produced with the financial assistance of Sida
and the Netherlands’ Government (NG). The views expressed in the
report may not reflect the official opinion of Sida and NG.
Danish Demining Group
Borgergade 10, 3rd floor
DK-1300 Copenhagen K.
Denmark
Tel: +45 3373 5000
E-mail: [email protected]
Web site: www.drc.dk & www.danishdemininggroup.dk