Embed Size (px)
Citation preview

COMMUNITY REINVESTMENT ASSOCIATION of NORTH CAROLINA
P.O. Box 1929 • 114 West PARRISH ST. • SECOND FLOOR • DURHAM N.C. 27702 • 919-667-1557 • 919-667-1558 FAX • WWW.CRA-NC.ORG
Federal Reserve Hearing, Atlanta Georgia, July 11, 2006 Testimony of Richard Brown, Community Organizer For the Community Reinvestment Association of North Carolina (CRA-NC)
I am Richard Brown, Community Organizer for the Community Reinvestment Association of North Carolina, also known by our acronym, CRA-NC. We promote social and financial justice through creative advocacy, television and radio production and community building.
The agency has often spoken to the need for reforms in the credit markets to protect consumers and strengthen the integrity of financial institutions. Serving on the 2000 HUD/Treasury Task Force, we requested that HMDA data be improved to include pricing data so that we can determine the type of loans being made. We applauded the data revisions adopted by the regulatory institutions to include pricing and to identify housing type. We were disappointed but not surprised by the results of the new data.
For the record, I am submitting our report Paying More and Getting Less: An Analysis of 2004 Mortgage Lending in North Carolina. Our key finding is that disproportionately, by a ratio of more than 4 to 1, African Americans pay more interest on home loans than whites do in North Carolina. This finding has also been reached by a number of other HMDA analyses.
Our report explains how current loan pricing of lenders has a disproportionate and adverse impact on minorities and why discrimination based on race is still a factor in lending. The North Carolina Fair Housing Center tested mortgage lenders for disparate treatment, for whites, blacks and Hispanics. The Center's study, Cash in Your Face, found race still played a factor in 51% of the tests. Based on the findings of these two studies, we call on federal enforcement agencies and private lenders to seek remedies to the policies and practices that are discriminatory.
We applaud the Federal Reserve for holding these hearings and for Chairman Bernanke's position that while financial literacy and consumer awareness are important in preventing predatory lending, it is a regulatory responsibility to ensure fair lending. CRA-NC too supports financial literacy through its radio and television shows and community workshops. But we continue to insist that more can be done through the existing enforcement mechanisms and authority of the regulatory bodies.

Critical to understanding the financial markets is the use of Home Mortgage Disclosure Data. Transparency has been perhaps one of the greatest catalysts for change. Like any tool, though, HMDA data needs to be kept current with the pace of change. New lending products change the landscape.
Most significant in recent years are popular adaptations of the traditional mortgage. Loans varying in their terms from as short as fifteen or as long as forty years are available to borrowers.
The structure of loans has also grown more heterogenous. In fact, the logic that HMDA's current structure encourages — that all loans use the same term — is erroneous. Only 72 percent of borrowers get a 30 year fixed rate mortgage, according to the Wall Street Journal, and that number is even lower in the Western United States.
Adjustable rate mortgages (ARMs) are now a popular choice for many consumers. So are interest only products (IO). Many people are using pay-option ARMs.
The amortization varies in these new products as well. Fixed rate interest-only loans account for 8 percent of loans, according to UBS. In many cases, interest-only products bear balloon payments. In each case, HMDA data is insensitive to the presence of these types of products.
These products have their place. For example, a recent graduate of professional school might want an interest-only loan under the expectation that their income will jump in the coming years. Nevertheless, a Consumer Federation of America study showed that more than one in three IO borrowers earned less than $70,000 in 2005 and one in six earned less than $48,000.
HMDA data has not kept up with the new mortgage products on the market. The result is to weaken the relevance of analysis. Imagine an alternative. If analysts knew the term and structure of a loan, analysis would be far more precise.
For example, if a loan was fixed, then the imputed relationship between borrower income and loan payment would quickly reveal the percent of borrower income devoted to mortgage payments. Similarly, if an analyst knew that a loan bore an adjustable rate and also the point that the loan would reset, then analysis could reveal changes to payment obligations over time. These proposed changes would only add to the efficacy of HMDA analysis.
We make four specific recommendations for the future:
1) The Federal Reserve should allow for a suitability standard where a principle of general safety and soundness and fairness to consumers provide a framework to adapt to changes in unfair lending practices as quickly as they develop in the marketplace. We will continually play catch-up to solve the problem of predatory and discriminatory

lending, if regulators do not have a standard to evaluate a financial institution's lending policy and practices for the suitability of consumers' borrowing capacity.
2) The Federal Reserve, as the regulator of bank holding companies, should more aggressively extend its authority into the subsidiaries of holding companies to ensure that lending is done fairly. Historically, the Federal Reserve has concerned itself with the overall financial soundness of the corporation as a whole, without adequate oversight applied to the lending practices of the subsidiary.
3) We recommend changes to the collection of HMDA data. Again, the market dynamics change far more quickly than the regulatory framework. Data is key to understanding the fairness and impact of mortgage lending trends. As an example, there has been a dramatic increase in Adjustable Rate Mortgages and Option ARMs which are registered as low cost loans at the time of origination. Yet the rates may very well become high cost after closing. How many of these loans are being made, to whom, and on what terms?
4) Finally, within the framework of the law and regulation, the Federal Reserve and other federal regulators must apply greater leadership, resources and authority in creating a credit market that values fairness to individual consumers as well as the stability of the macro credit market. In a credit market that treats consumers fairly, lenders, consumers and the economy at large all profit.
Thank you very much.

Paying More and Getting Less:
An Analysis of 2004 Mortgage Lending in North Carolina
Report by the Community Reinvestment Association of North Carolina - September 2005

Paying More and Getting Less: An Analysis of 2004 Mortgage Lending
in North Carolina
Report by the Community Reinvestment Association of North Carolina - September 2005
Introduction
Disproportionately, African-Americans pay more interest on home loans than whites do in North Carolina. As a result of this disparity, African-Americans pay more and get less, furthering economic inequality.
This report explains how current loan pricing of lenders has a disproportionate and adverse impact on minorities and why discrimination based on race is still a factor in lending. Based on the findings of this study, we call on federal enforcement agencies and private lenders to seek remedies to the policies and practices that are discriminatory.
The Community Reinvestment Association of North Carolina (CRA-NC) is a nonprofit advocacy agency that promotes and protects community wealth.
Background
The Home Mortgage Disclosure Act (HMDA) requires mortgage lenders to report to the federal government data on all of their loan applicants, including race, gender, income, loan sizes, and loan types. If a loan has an interest rate defined as high cost or "reportable", then the surplus cost must also be reported. The Federal Reserve defines high cost reportable loans as being 300 basis points above a comparable length U.S. Treasury Note on the 15th of the month preceding the loan origination. For example, a 20-year fixed rate mortgage would be evaluated for its cost in comparison to the price of a 20-year Treasury note on the 15th day of the previous month.
These reportable loans are known by the term "subprime." The word does not mean such loans have interest rates below the prime interest rate. It means just the opposite. The loans are not as good in their terms or their cost as are prime loans. Subprime loans in theory are for those borrowers who are unable to get a prime loan because of their credit risk. Our experience tells us that this is impacted by a number of factors, including how well borrowers have paid their bills in the past, their income level, the size of their assets, and their employment history.
The lending industry has consolidated these different variables into a credit score. Scores range from 400 to 850. Higher scores reflect better credit. The scores are calculated by Equifax, Transunion, and Experian. Below, see the distribution of credit scores in the U.S.:
Score Range Percentile Range (low to high)
Up to 499 1st
500 to 549 2nd to 7th
550 to 599 8th to 15th
600 to 649 16th to 27th
650 to 699 28th to 45th
"Paying More and Getting Less" Community Reinvestment Association of North Carolina
Page 1

700 to 749 46th to 66th 750 to 799 67th to 87th
Over 800 88th to 99th Source: About.com
Usually a 620 credit score or better should qualify a borrower for a prime loan. A borrower generally needs a credit history with at least one account that is more than six months old and with a current balance. Fair Isaac Credit Services, Inc. a company that collects credit scores from the three credit agencies, estimates that 50 million people in the United States cannot meet these criteria footnote
1. This group cannot access the kinds of prime credit offered by leading banks. Some of these borrowers take advantage of loan guarantee programs, community development funds, and other avenues to home ownership. Nevertheless, many of these borrowers end up with subprime loans.
Unfortunately, studies by Freddie Mac, Fannie Mae and HUD have demonstrated that between 15% and 35% of subprime borrowers have A credit quality - indicating that many borrowers are paying more in interest than they deserve based on their credit worthiness.
When borrowers with good credit are given subprime loans, the risk-based pricing system is not working and customers pay too much. When race or ethnicity plays a role in placing borrowers in higher cost loans, unlawful discrimination is at play.
Equity in Lending Patterns
All things being equal, borrowers who are white, black, Hawaiian or Pacific Islander, or Asian-American should have the same percentage of borrowers who are receiving high cost loans. But all things are not equal.
CRA-NC analyzed the 2004 HMDA data for 36 financial institutions doing business in North Carolina. Those lenders originated 187,958 loans in 2004. We examined whether the lender made high cost reportable subprime loans and to whom by race. We found that African-Americans received high cost loans at a rate greater than did whites - by as much as 4.15 to one. In other words, blacks were 4.15 times more likely than whites to receive a high cost loan.
These findings describe all originations in North Carolina for the 36 lenders. The disparities are not uniform, but vary across lenders.
Table 1: How this Report established criteria for selecting loans loan purpose loan types Lien Type Property Type Loan Action
purchase conventional First Site Built originations rehabilitation FHA Junior Manufactured Home
refinance VA not secured by a lien Multifamily FSA
footnote 1 Wides, Barry. "No Credit! No Problem!" Taking the Nontraditional Route to Bring Borrowers into the Prime
Mortgage Market," Community Developments, Office of the Comptroller of the Currency, Summer 2005, p. 20.
Page 2

A recent Charlotte Observer story matched our conclusions. The paper concluded that high cost loans were originated to African-American borrowers nationally at a pace that was four times greater than the occurrence for white borrowers. As in this paper, that study excluded home improvement and refinance loans and included only first liens on conventional home purchase loans for site built properties footnote
2.
In North Carolina, the incidence of high cost loans originated by African-American borrowers are more than four times (4.15) greater than for whites in North Carolina. This even exceeds national disparity ratios for conventional first lien home purchase loans on site built homes, according to a Federal Reserve study which found the national ratio to be 3.72 footnote
3. The table below breaks down the distribution of loans for this group by race category.
Table 2: Conventional 1st Lien Loans for Site Built Home Purchase, by Cost for Race race high cost not high cost Grand Total Percent High Cost Ratio to White
native American 28 222 250 11.2% 1.84 Asian-American 48 1,239 1,287 3.7% 0.61
African-American 1,360 4,041 5,401 25.2% 4.15 Pacific Islander 20 139 159 12.6% 2.07
White 2,698 41,728 44,426 6.1% 1.00 Other 605 4,084 4,689 12.9% 2.12
Unknown 20 936 956 2.1% 0.34
Total 4,779 52,389 57,168 8.4% 1.38
The biggest factor in the difference between this subset of loans and the overall market comes with the exclusion of government loans. Conventional loans account for more than 90 percent of the home loan market. Participants in Federal Housing Administration (FHA) or Veterans Administration (VA) programs rarely borrow money for high cost rates. The programs are still attractive to lenders because the government acts as a guarantor on behalf of borrowers in these programs. The loans must meet certain requirements. For example, loan-to-value ratios have a ceiling and there is a maximum amount of loan amount. The effect, though, is to reduce risk for lenders.
Technical Review: CRA-NC, the Federal Reserve and the Charlotte Observer all use the same criterion in selecting the types of loans appropriate for analysis. All chose first lien conventional loan home purchases on site built properties. That section consists of loans that fall in the first row of Table 1.
Industry Explanation for the Disparity
The lending industry asserts that discrimination is not a factor in these disparities. It asserts that pricing is based on an unbiased process of evaluating credit risk regardless of race or ethnicity.
footnote 2 Appelbaum, Binyamin and Mellnik, Ted. "The Hard Truth in Lending". Charlotte Observer. August 28-30th,
2005. footnote
3 Avery, Robert and Canner, Glenn. "New Information Reported under HMDA and its Application in Fair Lending Enforcement." Federal Reserve Bulletin. Summer 2005. pg. 379 Accessed at http://www.federalreserve.gov/pubs/bulletin/2005/3-05hmda.pdf
Page 3

Industry's explanation is that any differences in the percentages of borrowers in high cost loans are based on the existing differences between whites and minority income levels, asset levels, and levels of financial literacy.
CRA-NC agrees that there are fundamental economic and educational disparities among races that will lead to disparities in loan qualifications. These disparities are based on a legacy of discrimination and inequality. We also staunchly argue that continuing discrimination and corporate practices are a factor in the loan pricing disparities by race. The history of racism in finance continues to play a role in access and cost of credit.
One thing about the difference of opinion between advocates and lender is certain. Settling this dispute would be possible if banks released data to support their claims. Credit scores would be the most important piece of information, but debt to income ratios or appraisal data would also add transparency to the public debate. The industry, faced with this rejoinder, claims a responsibility to protect customers' privacy.
A recent American Banker article suggested that bankers may be on the defensive because of their unwillingness to back up their arguments with evidence.
"The numbers by themselves look bad for industry," says Sheila Bair, a former Treasury assistant secretary quoted in the September 19th, 2005 article. "People are conjecturing that the credit scores would explain away a good portion of the disparities away, but we don't know that because the Fed doesn't collect them. footnote
4"
In reviewing the 2004 HMDA data, the Federal Reserve seized upon this conflict and examined the issues in depth. The Federal Reserve acknowledged industry claims that HMDA data do not include important factors in underwriting decisions. At the same time, the Federal Reserve did not shy away from recognizing the presence of disparities and the need to explore the reasons behind those inconsistencies. "The information in the HMDA data," noted Federal Reserve analysts Robert Avery and Glenn Canner, "for borrower-related factors plus lender - is insufficient to account for racial or ethnic differences in the incidence of higher-priced lending; significant differences remained unexplained." footnote
5
The Federal Reserve called upon a private set of data held at Georgetown University. This information, at the Georgetown Credit Research Center (CRC), includes data about borrower credit scores and the loan to value ratios within loans. The Federal Reserve believed that when combining HMDA data with CRC data, the true story would emerge.
That "story" suggests that the claims of industry do not hold up. When the Federal Reserve factored in borrower-related factors, such as credit score or loan-to-value ratio, only one-quarter
footnote 4 Zindler, Ethan. "200 Facing Scrutiny on HMDA Data." American Banker. Vol CLXX. No. 180. Sept. 19th,
2005. pg. 1,3. footnote
5 Avery, Robert and Canner, Glenn. "New Information Reported under HMDA and its Application in Fair Lending Enforcement." Federal Reserve Bulletin. Summer 2005. Accessed at http://www.federalreserve.gov/pubs/bulletin2005/3-05hmda.pdf
Page 4

(24 percent) of the discrepancy was explained footnote 6. The Federal Reserve found that choice of lender
contributed greatly to the discrepancy as well. When HMDA data and borrower factors were supplemented with lender factors, another 37.9 percent of the discrepancies were explained.
Lender factors captures many things. It means, for one, that the set of lenders used by blacks is different than the set of lenders used by whites. The former set includes more lenders who have high cost prices. This may point to a need to consumer financial literacy. The Federal Reserve, having accounted for the additional information in the CRC data, observed that more than 21 percent of the variation could still not be accounted for.
Discrimination Defined by the Fair Housing Act
Passed in 1968, in the wake of Dr. Martin Luther King's assassination, the Fair Housing Act prohibits discrimination in the availability, price, terms or conditions in obtaining housing or any part of the housing process including lending. Subsequent federal regulation and court cases have defined three types of discriminatory behavior.
Prima Facie/Overt discrimination, from the Latin for "on the face of it," describes the type that is out in the open for all to see in plain sight. An example would be the signs displayed during the Jim Crow era that did not allow blacks access to restaurants, buses, or other facilities. In the case of banking, it would be a sign that said, "We don't lend to blacks."
Disparate Treatment discrimination occurs when equally qualified applicants receive different treatment in information provided, products offered, or assistance provided based on race or protected class. An example would be if a lender offers a white applicant a better product, lower price or greater assistance in obtaining a loan than the lender did for a minority applicant with the same qualifications.
Disparate Impact discrimination is when the rules are neutral but still have an adverse and disproportional impact. The impact must be disproportionate on a group defined by law as a "protected class." African-Americans are a protected class, as are groups of people characterized by a race. An example of disparate impact discrimination could occur if a bank says it does not make loans under $75,000 in size. This rule is race neutral but impacts African-Americans disproportionately because they are disproportionately more likely to apply for smaller loans due to lower incomes.
The HMDA data does not provide enough information to prove prima facie or disparate treatment discrimination, but it does show disparate outcomes. To determine disparate treatment a review of loan files of comparable loan applicants is necessary. With comparables, a determination can be made if the loan result was without bias. Another means is to send in similarly situated testers in the pre-application process to determine if race influences the treatment provided.
footnote 6 Avery and Canner. Pg. 379
Page 5
North Carolina Fair Housing Center's Study Finds Disparate Treatment
Last year, the North Carolina Fair Housing Center (NC FHC) conducted a series of fair lending tests of lenders in five cities in the United States. Released September, 2004, the Center's report Cash in Your Face details these tests' findings of disparate treatment.
Excerpts from Cash In Your Face:
NC FHC conducted fifty (50) paired tests of twenty-four (24) prime lenders in five metropolitan statistical areas. The Center has also conducted additional tests of 4 lenders where we found evidence of a pattern and practice of discrimination against Hispanic and African American testers.
Fifteen percent of the branches tested showed no evidence of disparate treatment. Twenty-six percent of the branches tested were inconclusive in showing disparate treatment by lenders. Fifty-one percent of the branches tested indicated various levels of disparate treatment against African American and Hispanic borrowers. Eight percent of the branches tested indicated disparate treatment against the White borrower. Eighteen percent showed evidence of a pattern and practice of discrimination against African American and Hispanic borrowers.
Our study finds that African Americans and Hispanic borrowers with high incomes, a high degree of accomplishment and pristine credit still face significant differences in the loan products offered, and terms and conditions of loans offered.
The full study is available on CRA-NC's website: http://www.cra-nc.org/Cash in Your Face.doc.
Similar results of disparate treatment of minorities were found through testing of lenders, by both the United States Department of Housing and Urban Development and the National Community Reinvestment Coalition.
Disparate Impact and Corporations Segmenting the Market
An analysis of the underwriting rules as determined by automated technology to determine which rules may have a disparate impact is not possible, because they are considered proprietary for business purposes. Without federal review, it also can not be determined if the rules have a discriminatory impact or if they are applied fairly.
The courts and regulators have not defined whether it is discriminatory when a holding company has two delivery mechanisms - one a subprime provider and one a prime provider. The ground for a disparate impact finding exists even if lenders can prove that underwriting rules are fair and treat everyone the same. If the impact of a policy targets high cost loans to one population and low cost loans to another, and the impacted group is a protected class, then it has a disparate impact.
Page 6

Consider the circumstances that characterize several large lenders. Regions Financial issues prime mortgages through Regions Bank but also offers subprime loans through Equifirst. Washington Mutual originates prime mortgages but channels subprime originations through an affiliate, Long Beach Mortgage. Citibank operates a prime bank, CitiMortgage, and a subprime shop, CitiFinancial. HSBC offers mortgages in North Carolina through HSBC Mortgage, Beneficical, and Decision One. While HSBC Mortgage issued only 0.3% of its mortgages at a high cost rate in 2004 in North Carolina, fully 68.5% percent of Decision One's originated mortgages in North Carolina were high cost loans. Beneficial originated 21.3 percent of its North Carolina mortgages at high cost rates footnote
7. This example uses loans in North Carolina from our first set of criteria - for all loan types, all property types, all lien positions, and all loan purposes. See table 3, below:
Table 3: Corporations have multiple channels for originating loans Corporate Parent Brand Percent High Cost Blacks Whites
Regions Financial Regions 14.5% 50% 7.9% Equifirst 71.4% 80.1% 67.8%
Citigroup CitiMortgage 0.8% 4.9% 0.5%
CitiFinancial 89.5% 92.1% 87.9%
Citibank FSB 1.4% 0% 2.1%
CitiFinancial Mortgage 55.5% 667% 46.4%
HSBC HSBC Mortgage 0.3% 0.0% 0.3% Decision One 68.5% 71.5% 67.5% Beneficial 21.3% 19.2% 22.3%
These brands reach consumers in a large part depending upon how those consumers learn about credit options. If a borrower goes to a lender in his neighborhood, then a borrower's choice of Equifirst or Regions may depend upon which lender sets up shop near his or her home. If a borrower uses a mortgage broker, then the choice may depend upon which products the broker offers to the customer. For now, though, one thing is clear - corporate parents have no market incentive to put borrowers in lower cost credit.
Economic Impact on Borrowers
The disparity in loan pricing strikes a dissonant note at a simple moral chord of fairness. It indicates that illegal discrimination may be taking place. It also has a clear economic impact on minorities. Borrowers who pay a higher rate get a worse deal, furthering the economic inequality between minorities and whites.
For example, if two equally qualified borrowers take out a 30-year loan for $100,000, but the African-American family receives an interest rate of nine percent and the white family receives a rate of six percent, the difference will mean a lot of dollars over a long time.
The 6% interest payment is $ 599.95 a month The 9% interest payment is $ 804.62 a month
For a difference of $ 205.07 per month
footnote 7 HSBC 2004 HMDA Loan Application Record.
Page 7
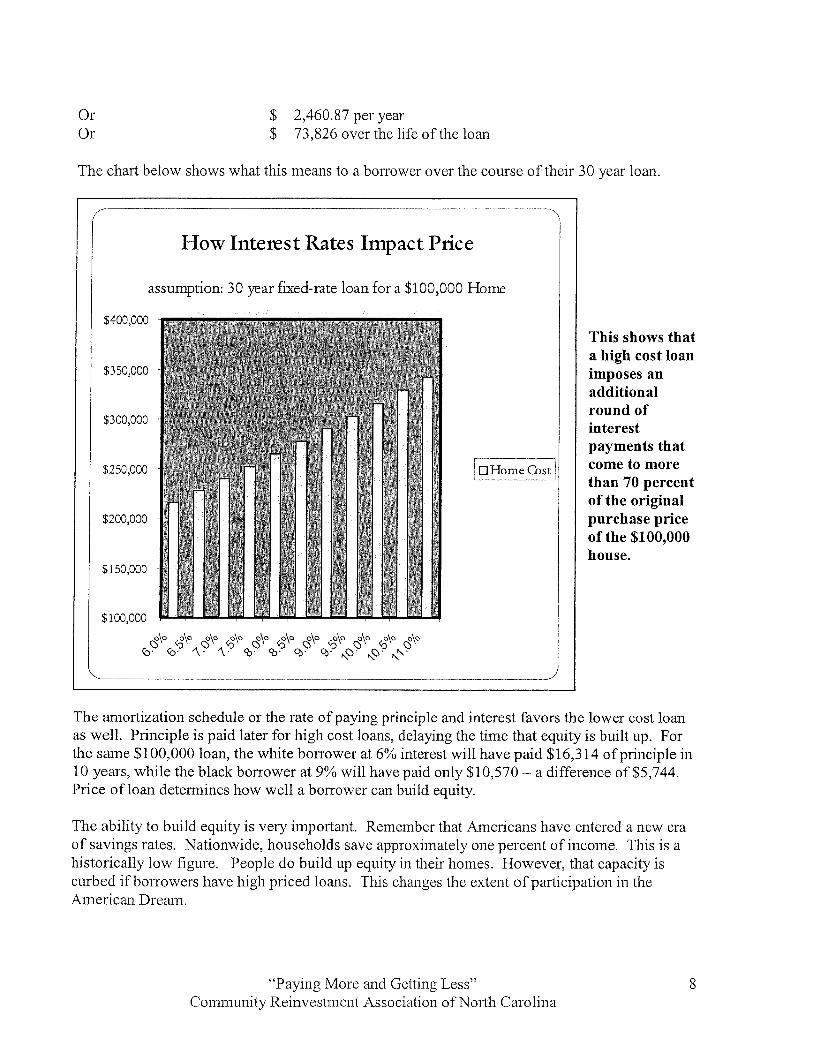
Or $ 2,460.87 per year Or $ 73,826 over the life of the loan
The chart below shows what this means to a borrower over the course of their 30 year loan.
How Interest Rates Impact Price
assumption: 30 year fixed-rate loan for a $100,000 Home
The amortization schedule or the rate of paying principle and interest favors the lower cost loan as well. Principle is paid later for high cost loans, delaying the time that equity is built up. For the same $100,000 loan, the white borrower at 6% interest will have paid $16,314 of principle in 10 years, while the black borrower at 9% will have paid only $10,570 - a difference of $5,744. Price of loan determines how well a borrower can build equity.
The ability to build equity is very important. Remember that Americans have entered a new era of savings rates. Nationwide, households save approximately one percent of income. This is a historically low figure. People do build up equity in their homes. However, that capacity is curbed if borrowers have high priced loans. This changes the extent of participation in the American Dream.
Page 8

Furthermore, 80% of higher interest rate subprime loans typically have prepayment penalties, which charge borrowers up to six months of interest for prepaying the loan. Because minorities are disproportionate represented in higher cost loans, they also receive a higher percentage of prepayment penalties. In our case example, this would cost about $4,980 to prepay the loan in the first year.
The findings can be taken another way. With the availability of new data on pricing, for the first time it is clear the extent to which the home mortgage market is bifurcated. Almost 15 percent of North Carolina mortgages were originated at high cost rates in 2004. For these borrowers, owning a home is much more expensive proposition. Their chance to build equity is lower. Their prospect of foreclosure looms larger.
The American Dream costs more and earns less for those with high cost loans, and these loans are disproportionately held by African-Americans and Hispanics. This difference continues the gap of disparities in wealth and economic opportunity based on race.
Conclusion
The findings in this paper add to the conclusions of the Federal Reserve, demonstrating a need for more regulatory scrutiny of banks. Industry has also claimed that Community Reinvestment Act obligations add an unnecessary layer of paperwork to lending without impacting the lending environment. That assertion does not hold up under review. The Sept. 2005 Federal Reserve study found that disparities in incidence of high cost loans among races fell dramatically within bank assessment areas. Overall, the disparity was only one-third as great within assessment areas as it was outside of assessment areas footnote
8. This finding says that when regulators scrutinize banks, their behavior changes.
The Community Reinvestment Association of North Carolina calls upon the lending industry and regulatory institutions to provide greater resources for equal and fair treatment in the pricing, terms and conditions of mortgage and home equity lending for all Americans regardless of race, color, national origin, religion, family status and gender, as the law requires and justice demands.
footnote 8 Avery and Canner, pg. 382
Page 9