Embed Size (px)
Citation preview

Public Disclosure
March 31, 2012
Community Reinvestment Act Performance Evaluation
U.S. Bank National Association
Charter Number: 24
425 Walnut Street Cincinnati, Ohio 45202
Office of the Comptroller of the Currency
Large Bank Supervision Constitution Center 400 7th Street SW
Washington, DC 20219
NOTE: This document is an evaluation of this institution's record of meeting the credit needs of its entire community, including low- and moderate-income neighborhoods, consistent with safe and sound operation of the institution. This evaluation is not, and should not be construed as, an assessment of the financial condition of this institution. The rating assigned to this institution does not represent an analysis, conclusion, or opinion of the federal financial supervisory agency concerning the safety and soundness of this financial institution.

Charter Number: 24
2
Table of Contents General Information and Definitions .........................................................................................5
General Information ............................................................................................................... 5 Definitions and Common Abbreviations ................................................................................ 6
Description of Institution ............................................................................................................ 11
Description of Evaluation Process ............................................................................................. 14
Evaluation Period .................................................................................................................... 14 Products Evaluated .................................................................................................................. 14 Selection of Areas for Full-Scope Review .............................................................................. 14 Ratings, Weighting and Other Considerations ........................................................................ 14 Data Integrity ........................................................................................................................... 16 Community Contacts ............................................................................................................... 16
Overall CRA Rating and Executive Summary ......................................................................... 17
Fair Lending or Other Illegal Credit Practices Review ........................................................... 22 Primary Rated Areas
Cincinnati-Middletown, OH–KY–IN Multistate MSA Rating ............................................... 25 Minneapolis–St. Paul-Bloomington, MN–WI Multistate MSA Rating .................................. 33 St. Louis, MO–IL Multistate MSA Rating .............................................................................. 40 State of California Rating ........................................................................................................ 48 State of Colorado Rating ......................................................................................................... 56 State of Washington Rating ..................................................................................................... 63 State of Wisconsin Rating ....................................................................................................... 71

Charter Number: 24
3
Other Rated Areas Chicago-Joliet-Naperville, IL-IN-WI Multistate MA Rating ................................................. 80 Clarksville, TN–KY Multistate MSA Rating .......................................................................... 84 Davenport–Moline–Rock Island, IA–IL Multistate MSA Rating ........................................... 87 Fargo, ND–MN Multistate MSA Rating ................................................................................. 90 Grand Forks, ND–MN Multistate MSA Rating ...................................................................... 93 Kansas City, MO–KS Multistate MSA Rating ....................................................................... 96 Lewiston, ID-WA Multistate MSA Rating ............................................................................. 99 Logan, UT-ID Multistate MSA Rating ................................................................................. 102 Louisville, KY-IN Multistate MSA Rating ........................................................................... 105 Omaha-Council Bluffs, NE–IA Multistate MSA Rating ...................................................... 108 Portland–Vancouver-Beaverton, OR–WA Multistate MSA Rating ..................................... 111 State of Arizona Rating ......................................................................................................... 114 State of Arkansas Rating ....................................................................................................... 117 State of Idaho Rating ............................................................................................................. 120 State of Illinois Rating ........................................................................................................... 123 State of Indiana Rating .......................................................................................................... 126 State of Iowa Rating .............................................................................................................. 129 State of Kansas Rating .......................................................................................................... 132 State of Kentucky Rating ...................................................................................................... 135 State of Minnesota Rating ..................................................................................................... 139 State of Missouri Rating ........................................................................................................ 142 State of Montana Rating ........................................................................................................ 146 State of Nebraska Rating ....................................................................................................... 149 State of Nevada Rating .......................................................................................................... 152 State of New Mexico Rating ................................................................................................. 155 State of North Dakota Rating ................................................................................................ 158 State of Ohio Rating .............................................................................................................. 161 State of Oregon Rating .......................................................................................................... 165 State of South Dakota Rating ................................................................................................ 169 State of Tennessee Rating ..................................................................................................... 172 State of Utah Rating .............................................................................................................. 175 State of Wyoming Rating ...................................................................................................... 179
Appendix A: Scope of Evaluation ........................................................................................... A-1 Appendix B: Ratings Summary .............................................................................................. B-1 Appendix C: Full-Scope Market Profiles for Primary Rated Areas
Cincinnati-Middletown, OH-KY-IN MMSA .................................................................. C-1 Minneapolis-St. Paul-Bloomington, MN-WI MMSA ..................................................... C-3 St. Louis, MO-IL MMSA ................................................................................................ C-5 State of California – Los Angeles-Long Beach-Glendale MD ....................................... C-8 State of Colorado – Denver-Aurora MSA ..................................................................... C-11 State of Washington – Seattle-Bellevue-Everett MD .................................................... C-13 State of Wisconsin – Milwaukee-Waukesha-West Allis MSA ..................................... C-15
Charter Number: 24
4
Appendix D: Tables of Performance Data ............................................................................. D-1
Chicago-Joliet-Naperville, IL-IN-WI Multistate Metropolitan Area .............................. D-4 Other Multistate Metropolitan Areas ............................................................................ D-18 State of Arizona ............................................................................................................ D-32 State of Arkansas ........................................................................................................... D-45 State of California ......................................................................................................... D-58 State of Colorado ........................................................................................................... D-86 State of Idaho............................................................................................................... D-100 State of Illinois ............................................................................................................ D-114 State of Indiana ............................................................................................................ D-128 State of Iowa ................................................................................................................ D-135 State of Kansas ............................................................................................................ D-149 State of Kentucky ........................................................................................................ D-157 State of Minnesota ....................................................................................................... D-170 State of Missouri ......................................................................................................... D-183 State of Montana ......................................................................................................... D-197 State of Nebraska......................................................................................................... D-208 State of Nevada ........................................................................................................... D-215 State of New Mexico ................................................................................................... D-225 State of North Dakota .................................................................................................. D-235 State of Ohio ................................................................................................................ D-242 State of Oregon ............................................................................................................ D-256 State of South Dakota .................................................................................................. D-270 State of Tennessee ....................................................................................................... D-278 State of Utah ................................................................................................................ D-291 State of Washington .................................................................................................... D-304 State of Wisconsin ....................................................................................................... D-318 State of Wyoming ........................................................................................................ D-332

Charter Number: 24
5
General Information The Community Reinvestment Act (CRA) requires each federal financial supervisory agency to use its authority, when examining financial institutions subject to its supervision, to assess the institution’s record of meeting the credit needs of its entire community, including low- and moderate-income neighborhoods, consistent with the safe and sound operation of the institution. Upon conclusion of such examination, the agency must prepare a written evaluation of the institution’s record of meeting the credit needs of its community. This document is an evaluation of the CRA performance of U.S. Bank National Association (USB) issued by the Office of the Comptroller of the Currency (OCC), the institution’s supervisory agency, for the evaluation period January 1, 2009 through December 31, 2011 (with consideration of community development activities through March 31, 2012). The agency rates the CRA performance of an institution consistent with the provisions set forth in Appendix A to 12 CFR Part 25.
Charter Number: 24
6
Definitions and Common Abbreviations The following terms and abbreviations are used throughout this performance evaluation, including the CRA tables. The definitions are intended to provide the reader with a general understanding of the terms, not a strict legal definition. Affiliate: Any company that controls, is controlled by, or is under common control with another company. A company is under common control with another company if the same company directly or indirectly controls both companies. A bank subsidiary is controlled by the bank and is, therefore, an affiliate. Aggregate Lending: The number of loans originated and purchased by all reporting lenders in specified income categories as a percentage of the aggregate number of loans originated and purchased by all reporting lenders in the metropolitan area/assessment area. Assessment Area (AA); Assessment Areas (AAs): A geographic area that consists generally of one or more metropolitan areas or one or more contiguous political subdivisions, such as counties, cities, or towns, in which the bank has its main office, branches, or deposit-taking ATMs. Automated Teller Machine (ATM): an automated, unstaffed banking facility owned or operated by, or operated exclusively for, the bank at which deposits are received, cash dispersed or money lent. Census Tract (CT): A small subdivision of metropolitan and other densely populated counties. Census tract boundaries do not cross county lines; however, they may cross the boundaries of metropolitan areas. Census tracts usually have between 2,500 and 8,000 persons, and their physical size varies widely depending upon population density. Census tracts are designed to be homogeneous with respect to population characteristics, economic status, and living conditions to allow for statistical comparisons. Community Development (CD): Affordable housing (including multifamily rental housing) for low- or moderate-income individuals; community services targeted to low- or moderate-income individuals; activities that promote economic development by financing businesses or farms that meet the size eligibility standards of the Small Business Administration’s Development Company or Small Business Investment Company programs (13 CFR 121.301) or have gross annual revenues of $1 million or less; activities that revitalize or stabilize low- or moderate-income geographies; or loans, investments, and services that support, enable or facilitate projects or activities that meet the ‘‘eligible uses’’ criteria described in Section 2301(c) of the Housing and Economic Recovery Act of 2008 (HERA), Public Law 110–289, 122 Stat. 2654, as amended, and are conducted in designated target areas identified in plans approved by the United States Department of Housing and Urban Development in accordance with the Neighborhood Stabilization Program (NSP), are provided no later than two years after the last date funds appropriated for the NSP are required to be spent by grantees, and benefit low-, moderate-, and middle-income individuals and geographies in the bank’s assessment area(s) or areas outside the bank’s assessment area(s) provided the bank has adequately addressed the community development needs of its assessment area(s).

Charter Number: 24
7
Community Reinvestment Act (CRA): The statute that requires the OCC to evaluate a bank’s record of meeting the credit needs of its local community, consistent with the safe and sound operation of the bank, and to take this record into account when evaluating certain corporate applications filed by the bank. Community Development Corporation (CDC): Nonprofit groups accountable to local residents that rebuild their communities through a wide range of housing, commercial, job development, and other activities. A CDC’s mission is typically focused on serving the needs of low- and moderate-income households. Resident control usually takes the form of board representation. Community Development Financial Institution (CDFI): Specialized financial institutions that work in market niches that have not been adequately served by traditional financial institutions. CDFIs provide a wide range of financial products and services, including mortgage financing for first-time home buyers, financing for needed community facilities, commercial loans and investments to start or expand small businesses, loans to rehabilitate rental housing, and financial services needed by low-income households and local businesses. In addition, these institutions provide services that help ensure that credit is used effectively, such as technical assistance to small businesses and credit counseling to consumers. CDFIs include community development banks, credit unions, loan funds, venture capital funds, and micro-enterprise loan funds, among others. Consumer Loan(s): A loan(s) to one or more individuals for household, family, or other personal expenditures. A consumer loan does not include a home mortgage, small business, or small farm loan. This definition includes the following categories: motor vehicle loans, credit card loans, home equity loans, other secured consumer loans, and other unsecured consumer loans. Family: Includes a householder and one or more other persons living in the same household who are related to the householder by birth, marriage, or adoption. The number of family households always equals the number of families; however, a family household may also include nonrelatives living with the family. Families are classified by type as either a married-couple family or other family, which is further classified into ‘male householder’ (a family with a male householder and no wife present) or ‘female householder’ (a family with a female householder and no husband present). Full-Scope Review: Performance under the Lending, Investment, and Service Tests is analyzed considering performance context, quantitative factors (e.g., geographic distribution, borrower distribution, and total number and dollar amount of investments), and qualitative factors (e.g., innovativeness, complexity, and responsiveness). Geography: A census tract delineated by the U. S. Bureau of the Census in the most recent decennial census. Home Mortgage Disclosure Act (HMDA): The statute that requires certain mortgage lenders that do business or have banking offices in a metropolitan statistical area to file annual summary reports of their mortgage lending activity. The reports include such data as the race, gender, and the income of applications, the amount of loan requested, the disposition of the application (e.g., approved, denied, and withdrawn), the reports also include data on loan pricing, the lien status of the collateral, any requests for preapproval, and loans for manufactured housing.

Charter Number: 24
8
Home Mortgage Loans: Includes home purchase, home improvement and refinancing, as defined in the HMDA regulation. These include loans for multifamily dwellings (five or more families) dwellings, manufactured housing and one-to-four family dwellings other than manufactured housing. Household: Includes all persons occupying a housing unit. Persons not living in households are classified as living in group quarters. In 100 percent tabulations, the count of households always equals the count of occupied housing units. Limited-Scope Review: Performance under the Lending, Investment, and Service Tests is analyzed using only quantitative factors (e.g., geographic distribution, borrower distribution, total number and dollar amount of investments, and branch distribution). LMI: Low- and moderate-income. Low-Income: Individual income that is less than 50 percent of the area median income, or a median family income that is less than 50 percent, in the case of a geography. Low-Income Housing Tax Credit (LIHTC): A program through which investors receive a credit against federal tax owed in return for providing funds to developers to build or renovate housing for low-income households. Market Share: The number of loans originated and purchased by the institution as a percentage of the aggregate number of loans originated and purchased by all reporting lenders in the metropolitan area/ assessment area. Median Family Income (MFI): The median income determined by the U.S. Census Bureau every ten years and used to determine the income level category of geographies. Also, the median income determined by the Department of Housing and Urban Development annually that is used to determine the income level category of individuals. For any given area, the median is the point at which half of the families have income above it and half below it. Metropolitan Area (MA): Any metropolitan statistical area or metropolitan division, as defined by the Office of Management and Budget, and any other area designated as such by the appropriate federal financial supervisory agency.
Charter Number: 24
9
Metropolitan Division (MD): As defined by the Office of Management and Budget, a county or group of counties within a Metropolitan Statistical Area that contains a population of at least 2.5 million. A Metropolitan Division consists of one or more counties that represent an employment center or centers, plus adjacent counties associated with the main county or counties through commuting ties. Metropolitan Statistical Area (MSA): An area, defined by the Office of Management and Budget, as having at least one urbanized area that has a population of at least 50,000. The Metropolitan Statistical Area comprises the central county or counties, plus adjacent outlying counties having a high degree of social and economic integration with the central county as measured through commuting. Middle-Income: Individual income that is at least 80 percent and less than 120 percent of the area median income, or a median family income that is at least 80 percent and less than 120 percent, in the case of a geography. Moderate-Income: Individual income that is at least 50 percent and less than 80 percent of the area median income, or a median family income that is at least 50 percent and less than 80 percent, in the case of a geography. MUI: Middle- and upper-income. Multifamily: Refers to a residential structure that contains five or more units. Other Products: Includes any unreported optional category of loans for which the institution collects and maintains data for consideration during a CRA examination. Examples of such activity include consumer loans and other loan data an institution may provide concerning its lending performance. Owner-Occupied Units: Includes units occupied by the owner or co-owner, even if the unit has not been fully paid for or is mortgaged. Qualified Investment: A qualified investment is defined as any lawful investment, deposit, membership share, or grant that has as its primary purpose community development. Rated Area: A rated area is a state or multistate metropolitan area. For an institution with domestic branches in only one state, the institution’s CRA rating would be the state rating. If an institution maintains domestic branches in more than one state, the institution will receive a rating for each state in which those branches are located. If an institution maintains domestic branches in two or more states within a multistate metropolitan area, the institution will receive a rating for the multistate metropolitan area. Small Loan(s) to Business(es): A loan included in 'loans to small businesses' as defined in the Consolidated Report of Condition and Income (Call Report) and the Thrift Financial Reporting (TFR) instructions. These loans have original amounts of $1 million or less and typically are either secured by nonfarm or nonresidential real estate or are classified as commercial and industrial loans.

Charter Number: 24
10
Small Loan(s) to Farm(s): A loan included in ‘loans to small farms’ as defined in the instructions for preparation of the Consolidated Report of Condition and Income (Call Report). These loans have original amounts of $500,000 or less and are either secured by farmland, or are classified as loans to finance agricultural production and other loans to farmers. Tier 1 Capital: The total of common shareholders’ equity, perpetual preferred shareholders’ equity with noncumulative dividends, retained earnings and minority interests in the equity accounts of consolidated subsidiaries. Upper-Income: Individual income that is at least 120 percent of the area median income, or a median family income that is at least 120 percent, in the case of a geography.

Charter Number: 24
11
Description of Institution U.S. Bank National Association (“USB” or “the bank”) is a full-service interstate bank headquartered in Minneapolis, Minnesota. USB is the lead bank subsidiary of U.S. Bancorp, a diversified financial services holding company with $340 billion assets and over 62,500 full-time equivalent employees as of year-end 2011. The current company results from a 2001 merger between the former Minnesota-based U.S. Bancorp and the Ohio-based Firstar Corporation. Firstar acquired U.S. Bancorp, retained the U.S. Bancorp name, and moved its corporate headquarters to Minneapolis. The company provides a comprehensive line of banking, brokerage, insurance, investment, mortgage, trust, and payment services to consumers, businesses, and institutions. National scale businesses include merchant processing (domestically and in Canada, Mexico, Brazil, and segments of Europe), corporate payments, corporate trust, asset management, mortgage banking, and commercial banking. The company is one of the largest providers of corporate and purchasing cards and corporate trust services in the United States. Significant subsidiaries of U.S. Bancorp include this bank, U.S. Bank National Association ND (USBND), trust companies, a brokerage company, insurance companies, a title company, and a company that invests in real estate projects designed to promote community welfare. During the evaluation period, USBND was a separately chartered bank that originated retail loans (including small business credit cards) for the company. All loans reported inside USB’s assessment areas (AAs) by both USB and USBND are considered in this evaluation, with the exception of USBND loans located in Cass County, North Dakota. USBND was subsequently merged into USB on May 13, 2013. USB is the fifth largest commercial bank in the United States with $330 billion assets as of year-end 2011. The bank serves a large retail base (17 million customers) and operates the country’s fourth largest branch network (3,084 banking offices in 25 states) primarily in the Midwest and West. Key markets, which reflect the merger history of the company, include Minneapolis, Portland (OR), Seattle, Cincinnati, Milwaukee, St. Louis, Denver, and Los Angeles. The bank has four primary lines of business. Consumer & Small Business Banking provides traditional products and services through branch offices, ATMs, Internet, and mobile banking. This business line offers loan products including home mortgage loans, home equity lines and loans, automobile loans and leases, and small business loans and lines. Payment Services offers consumer and business credit cards, corporate and purchasing cards, card-accessed secured and unsecured lines of credit, ATM processing, and merchant processing. Wealth Management & Securities Services includes institutional trust, investment management, mutual fund servicing, private banking, and personal trust. Wholesale Banking & Commercial Real Estate provides lending, treasury management, corporate trust and other financial services to middle market, large corporate, and public sector clients.
Charter Number: 24
12
At year-end 2011, USB had total assets of $330 billion, total deposits of $236 billion, and Tier 1 Capital of $25 billion. Tier 1 Capital increased 72 percent over the evaluation period, and domestic deposits grew by 51 percent. The growth in Tier 1 Capital was affected by regulatory requirements (including the Basel Accords) and capital restrictions in place for the banking industry. Deposit growth came from acquisitions and what bank management describes as a “flight to quality.” The bank’s $204 billion loan portfolio represents 62 percent of total assets, and is primarily comprised of commercial loans (35 percent), residential real estate loans (34 percent), and consumer loans (20 percent). USB is the fifth largest mortgage originator and seventh largest servicer in the country. Mortgage banking growth is a strategic focus for the bank. Significant subsidiaries of USB include merchant processing and payment service companies, mortgage companies, property management companies, leasing companies, trust companies, and a community development corporation. Bank subsidiaries and affiliates do not adversely affect the bank’s capacity for community reinvestment. Affiliate activities considered in this CRA evaluation are detailed in Appendix A. USB has purchased 13 failed banks across the country since 2008. The acquisitions allowed the bank to establish a presence in the state of New Mexico, enter into several new markets in the state of California, and significantly expand its presence in Chicago IL. Due to these acquisitions and other branch additions, USB has two new rated areas - the state of New Mexico, and the Logan UT-ID Multistate Metropolitan Statistical Area (MMSA). Corporate activities are more fully detailed below.
USB acquired two failed California thrifts in November 2008 (PFF Bank and Downey Savings). The thrifts collectively had $13 billion assets, $12 billion deposits, and 205 branches. The acquisition produced five new MSA AAs for the bank - three in California (Bakersfield-Delano MSA, San Luis Obispo-Paso Robles MSA, and Santa Barbara-Santa Maria-Goleta MSA) and two in Arizona (Lake Havasu City-Kingman MSA and Prescott MSA). The prior CRA evaluation did not include these AAs because the acquisition occurred late in the evaluation period.
USB acquired a failed Idaho thrift (First Bank of Idaho) in April 2009. The thrift had $489 million assets, $374 million deposits, and seven branches. The acquisition expanded the bank’s nonMSA presence in Idaho (Teton County) and Wyoming (Teton County).
USB acquired nine failed banks of FBOP Corporation in October 2009, with combined assets of $19 billion and 153 branches. The failed banks were: California National Bank, Los Angeles CA ($7 billion); Park National Bank, Chicago IL ($5 billion), San Diego National Bank, San Diego CA ($3 billion); Pacific National Bank, San Francisco CA ($2 billion); North Houston Bank, Houston TX ($315 million); Madisonville State Bank, Madisonville TX ($230 million); Bank USA NA, Phoenix AZ ($185 million); Citizens National Bank, Teague TX ($106 million); and Community Bank of Lemont, Lemont IL ($82 million). FBOP banks operated in USB’s existing footprint, so the only AA change was the addition of Kendall County to the Chicago AA.
Charter Number: 24
13
USB acquired a failed bank (First Community Bank, Taos, NM) in January 2011, thereby establishing operations in the state of New Mexico for the first time. The acquisition brought $2 billion assets, $2 billion deposits, and 38 branches. It produced three MSA AAs in New Mexico (Albuquerque MSA, Las Cruces MSA, and the Santa Fe MSA) and a presence in five nonMSA counties (Cibola, Curry, McKinley, Roosevelt, and Taos).
Branch additions during the evaluation period also resulted in the addition of Cass County MO to the Kansas City MMSA, expansion into the Utah side (Cache County) of the Logan UT-ID MMSA (bank previously only had branches on the Idaho side), and the addition of Lyon and Nye Counties to the bank’s nonMSA presence in Nevada.
Throughout the evaluation period, the worst financial crisis and recession since the Great Depression continued to affect the national economy. Economic recovery was generally flat during this period due to persistent high unemployment (and under-employment) and an unstable housing market. National foreclosure inventory and unemployment rates peaked in September 2010 and October 2009, respectively, and then started to improve gradually. Housing prices had stabilized in most parts of the country by late 2011, but remained substantially below pre-recession levels. Despite these challenges, USB increased its production of loans evaluated under CRA. The bank increased the number of loans in its AAs by 36 percent, and the dollar volume increased 65 percent, compared to the prior evaluation. It is notable that lending also increased in most (35 or 90 percent) of the bank’s 39 rated areas. Just four rated areas (the states of Indiana, Kansas, Nebraska, and Ohio) experienced a reduction (typically 10 percent or less) in the number and/or volume of loans. Increased lending is concentrated in home mortgage loans and attributable to the low rate environment and strong refinancing activity. Foreclosure concentrations in some markets, however, did impede home refinance lending in low- and moderate-income (LMI) areas. Even though the bank generally increased the number of refinance loans in LMI geographies, this increase is not discernable from its geographic distribution in markets with proportionally greater increases in refinance lending for middle- and upper-income (MUI) areas. In assessing the lower proportion of lending to LMI areas, we considered foreclosure concentrations in the AA and documented studies showing foreclosures lead to lower property values in their immediate vicinity. For markets with foreclosure concentrations in LMI areas, we considered (and noted as performance context) that the decline in housing values was intensified in LMI areas, making it even more challenging for homeowners in affected neighborhoods to refinance their homes. This context was considered in the following full-scope AAs: Cincinnati, Minneapolis, St. Louis, Phoenix, Los Angeles, Denver, Cleveland, Seattle, and Milwaukee. There are no other identified legal, financial or other factors that impede the bank’s ability to help meet the credit, investment, and service needs of its AAs. USB received an Outstanding rating at its previous CRA evaluation, which is dated December 31, 2008.

Charter Number: 24
14
Description of Evaluation Process Evaluation Period The time period for this evaluation is January 1, 2009, through December 31, 2011, with consideration for community development (CD) activities through March 31, 2012. Products Evaluated Products evaluated under the lending test include home mortgage loans, small loans to businesses, and small loans to farms. However, we did not analyze distributions for products with less than 50 loans. The bank has several markets with an insufficient number of farm loans and/or multifamily home mortgage loans for meaningful analysis. As permitted under the affiliate rule, we considered the lending activities of U.S. Bank National Association ND. We also considered the investment activities of the U.S. Bancorp Community Development Corporation, the U.S. Bancorp Community Investment Corporation, and the U.S. Bancorp Foundation. Appendix A also provides information on the products and affiliate activities considered in this evaluation. Selection of Areas for Full-Scope Review USB has 270 AAs covering portions of 25 states and 14 MMSAs. The number of AAs is reduced to 169 after the nonmetropolitan AAs are combined into one nonMSA AA per state for analysis purposes. The bank’s AAs meet regulatory requirements and do not arbitrarily exclude any low- or moderate-income census tracts. We generally selected one AA for full-scope review from each of the bank’s 39 rated areas, and this was typically (but not always) the AA representing the largest share of bank deposits. The “Scope” section under each rated area details the AA selected for full-scope review. Appendix A also provides a list of bank AAs and the type of review each received. Ratings, Weighting and Other Considerations USB’s overall rating is a blend of MMSA and state ratings, weighted by their share of the bank’s deposit base. MMSA and state ratings are primarily based on performance in full-scope AAs, with consideration for performance in limited-scope areas. The “Scope” section under each rated area describes the influence of limited-scope AAs (if applicable) in arriving at the overall MMSA or state rating.
Charter Number: 24
15
Seven rated areas carry the most weight in the bank’s performance evaluation as they collectively account for 70 percent of its deposits by dollar volume. These seven “Primary Rated Areas” are the Minneapolis-St Paul-Bloomington MMSA, the state of California, the state of Wisconsin, the Cincinnati-Middletown MMSA, the St. Louis MMSA, the state of Washington, and the state of Colorado. For lending performance, we gave the most weight to borrower and geographic distributions. When there were performance differences between loan products, we weighted the different products based on the loan mix specific to the AA over the evaluation period (by number of loans) in determining an overall conclusion. Weightings are fully described in the narrative comments. Weighing by number of loans gives credit for each lending decision regardless of the loan’s dollar amount. The volume and responsiveness of CD loans and flexible lending programs provided a neutral or positive impact to the lending conclusion. When there were performance differences between low- and moderate-income geographies, we gave more weight to the geography with more lending opportunity (e.g., businesses or owner-occupied housing units). In analyzing borrower distributions for home mortgage loans, we considered the impact of poverty on a low-income person’s ability to afford a mortgage loan, the impact of high housing costs on a LMI person’s ability to afford a mortgage loan, and the impact of fixed financing costs on a low-income borrower’s ability to benefit from a refinance loan. In markets where a majority of the bank’s reported business lending involved small business credit cards, we considered whether it was reasonable to emphasize market share performance in the borrower distribution conclusion. The bank does not typically collect or use revenue information for small business credit cards. While it will report revenue information if available through other borrowing relationships with the customer, the volume of bank loans to businesses with unknown revenues tends to be higher in these markets. More specifically, we considered whether CRA data was sufficiently robust (generally more than 30 reporters, including a majority of local lenders by deposit volume). We also considered whether the bank’s market share performance was consistently strong by analyzing the bank’s market shares for each year in the evaluation period. Ultimately, we emphasized market share performance in 22 full-scope AAs (Cincinnati, Fargo, Grand Forks, Kansas City, Lake-Kenosha, Lewiston, Minneapolis, Portland, St. Louis, Phoenix, Little Rock, Los Angeles, Denver, Chicago, Des Moines, Billings, Las Vegas, Albuquerque, Cleveland, Salem, Sioux Falls, Nashville) and one limited-scope area (Rapid City). Our evaluation of CD lending and investment performance considers anomalies in the way the bank aggregates and reports deposits. Approximately 19 percent (or $38 billion) of the bank’s deposits consist of brokered deposits and escrow accounts. These deposits come from across the country, but are attributed to just four markets for administration purposes – Minneapolis ($17.9 billion), Cincinnati ($9.3 billion), Milwaukee ($10.7 billion), and Owensboro ($303 million). We considered the volume of centralized, nonlocal deposits in our performance conclusions for these markets.

Charter Number: 24
16
For investment performance, we gave the most weight to investment volume in relation to bank capacity and responsiveness to CD needs. We also considered qualitative factors, such as complexity and innovation. Our analysis does not differentiate between statewide investments with the potential to benefit bank AAs, versus those without that potential. Bank performance was generally excellent based solely on the level and responsiveness of its AA-specific investments. For service performance, we gave the most weight to the geographic distribution of bank branches and changes in branch locations. In full-scope AAs, we also considered nearby branches in MUI tracts that improved access for LMI areas or individuals. Branch hours, products, and services, as well as CD services, received a lesser amount of weight. Weighting and other performance context considerations are more fully described, as applicable, in the conclusions for each rated area. . Data Integrity Examiners independently tested the accuracy of the home mortgage, business, and farm loan data publicly reported by the bank and considered in this evaluation. In addition, we reviewed CFPB (Consumer Financial Protection Bureau) testing results related to the accuracy of the bank’s publicly reported home mortgage data. No significant reporting errors were identified. Examiners also independently tested the bank’s CD loans, investments, and services to confirm the activities met the regulatory definition and otherwise qualified for consideration. We did not identify any concerns and consider the CD information presented in this performance evaluation to be reliable. Community Contacts We conducted new community contacts and/or used recent community contacts by other regulators in all 40 full-scope AAs. Contacts were made with a wide variety of small business, affordable housing, neighborhood revitalization, economic development, and social service representatives. Information from these community contacts for the Primary Rated Areas is summarized in the Market Profiles found in Appendix C.

Charter Number: 24
17
Overall CRA Rating & Executive Summary Overall CRA Rating Institution’s CRA Rating: This institution is rated Satisfactory. The following table indicates the performance level of U.S. Bank National Association with respect to the Lending, Investment, and Service Tests:
Performance Levels
U.S. Bank National Association Performance Tests
Lending Test* Investment Test Service Test
Outstanding X X X
High Satisfactory
Low Satisfactory
Needs to Improve
Substantial Noncompliance
*The Lending Test is weighted more heavily than the Investment and Service Tests when arriving at an overall rating.
Discriminatory or other illegal credit practices identified since the previous evaluation were considered in this evaluation and resulted in a downgrade of the bank’s CRA rating from Outstanding to Satisfactory. The “Fair Lending or Other Illegal Credit Practices Review” section details the issues identified.
Overall Lending Test performance is rated Outstanding based on excellent lending performance in 30 (of 39) rated areas, including all seven of the bank’s primary rated areas. Lending performance is generally good in the other rated areas.
Overall Investment Test performance is rated Outstanding based on excellent investment performance in all 39 rated areas.
Overall Service Test performance is rated Outstanding based on excellent service
performance in 25 (of 39) rated areas, including five of the bank’s primary rated areas. Service performance is generally good in the remaining areas.

Charter Number: 24
18
Lending Performance Summary Overall lending performance is excellent.
CD lending had a significantly positive impact on lending performance in most of the bank’s 40 full-scope AAs (31 AAs or 78 percent). USB originated more than $4.3 billion CD loans within its 25 state footprint during the evaluation period, representing more than 17 percent of its Tier 1 Capital. The bank reports it ranked among the top seven CD lenders during the evaluation period.
Borrower distributions are excellent in a majority of the bank’s 40 full-scope AAs
(23 AAs or 57.5 percent). Borrower distributions in the remaining full-scope areas are good (15 AAs or 37.5 percent) or adequate (two AAs or 5 percent). Home mortgage distributions are excellent in 26 full-scope AAs, good in 11, and adequate in three. Business loan distributions are excellent in 23 full-scope AAs, good in 16, and adequate in one.
Geographic distributions are at least good in a majority of the bank’s 40 full-scope AAs
(21 AAs or 52.5 percent). Geographic distributions in the remaining full-scope areas are adequate (15 AAs or 38 percent) or poor (four AAs or 10 percent). Home mortgage distributions are good in 14 full-scope AAs, adequate in 12, and less than adequate in 14. Business loan distributions are excellent in 21 full-scope AAs, good in 14, and adequate in five.
Our geographic distribution analysis also included a review for lending gaps, particularly in LMI areas. We did not identify any unexplained lending gaps in the full-scope AAs.
We also determined that lending activity in relation to bank resources and capacity was good to excellent in most of the bank’s AAs, and no less than adequate in any AA. Our assessment considered the bank’s rank/share of deposits compared to loans and the significant competition from nationwide lenders in most markets.
Performance differences in limited-scope AAs impacted Lending Test ratings in four states. Weaker performance in limited-scope areas adversely affected the lending test rating in the states of Illinois, Kentucky, and Wyoming. Stronger performance in limited-scope areas positively affected the lending test rating in the state of North Dakota.
Charter Number: 24
19
The bank’s use of innovative or flexible lending programs supports its overall lending performance, even though these programs did not generally elevate performance in individual AAs. In aggregate, the volume of innovative and flexible lending represents 94 percent of bank capital. USB offers a wide variety of lending products and programs that support affordable housing and economic development. For example:
USB offers more than 65 affordable mortgage products involving both national and local programs. These products generated more than 143,000 loans totaling more than $22 billion for the bank over the evaluation period.
The bank’s Mortgage Revenue Bond Program Division partners with various state and local housing finance agencies across the country to facilitate affordable home- ownership. USB works directly with municipalities offering these programs to prescreen and approve loan originators. USB subsequently purchases the transactions originated under these programs, which are typically FHA loans. These transactions are included in the bank’s HMDA data and the aforementioned affordable mortgage production numbers.
USB also participates in a large number of nationwide, statewide, and local down payment and special assistance programs. During the evaluation period, the bank facilitated more than 7,900 instances of assistance (and more than $38 million grant monies for borrowers) under these programs.
Through a Private Placement Bond Program, the bank offers innovative financing for
the development of affordable housing and community revitalization projects. The program’s innovative and complex financing structure brings together the interest-rate price advantages of tax-exempt municipal financing and the more traditional streamlined CD loan underwriting to create a lending mechanism that provides both tax-exempt interest rates and lower upfront financing costs. During this evaluation period, the bank made 51 private placements totaling $327 million.
USB remains one of the nation’s top Small Business Administration (SBA) lenders. As of September 30, 2011, it was the third largest SBA lender by dollar volume and the fourth largest by number of loans. During the evaluation period, the bank originated approximately 5,056 SBA loans nationwide, totaling $963 million.
The bank finances small farms through the United States Department of Agriculture Farm Service Agency Guarantee Loan Program. The loans can be for farm ownership or operating purposes, and a portion of the program’s funding is targeted to beginning farmers and ranchers and minority applicants. During the evaluation period, USB originated 44 loans in five states under this program, totaling $12 million.
Charter Number: 24
20
USB also provides several loss mitigation products under government, proprietary, and other programs, which are designed to help distressed homeowners avoid foreclosure. Under the federal government’s Making Home Affordable program, the bank offers the Home Affordable Modification Program (HAMP), Home Affordable Unemployment Program (HAUP), Home Affordable Refinance Program (HARP), and the Home Affordable Foreclosure Alternatives Program (HAFA). Proprietary loan restructure programs, second lien modifications, and settlement options are also available. In addition, the bank partnered with 18 states in 2010 to provide relief under the “Hardest Hit Fund Initiative.” More than 20,000 homeowners have successfully completed a modification program and avoided foreclosure through the bank’s offering of these programs.
The ratio of loans inside the bank’s AAs was also a positive factor in our evaluation of lending performance. A majority of USB’s reported loans (65 percent by number) are inside its AAs. This ratio excludes affiliate lending and is calculated at the bank level. By product type, 60 percent of home mortgage loans, 94 percent of business loans, and 84 percent of farm loans are inside the bank’s AAs. Investment Performance Summary Overall investment performance is excellent.
The volume of AA-specific investments in relation to bank capacity and available opportunity is excellent in most (39 or 97.5 percent) of the bank’s full-scope AAs. USB collectively invested more than $3.5 billion inside its AAs during the evaluation period, representing more than 14 percent of its Tier 1 Capital. The bank has another $935 million prior period investments inside its AAs that remain outstanding, representing 3.6 percent of Tier 1 Capital.
Investments demonstrate excellent responsiveness to CD needs, with a focus on
affordable housing and revitalization and stabilization initiatives. Low-Income Housing Tax Credits (LIHTCs) and mortgage-backed securities (MBSs) are the bank’s primary means of funding affordable housing investments. Revitalization and stabilization efforts are typically funded with Historic Tax Credits (HTCs) and New Market Tax Credits (NMTCs).
USB is a consistent leader in investing through tax credit programs. The U.S. Bancorp Community Development Corporation is the most active tax credit investor in the country. The bank estimates it has a 30 percent market share of NMTCs in the country. These investments are generally more complex and require more staffing resources and expertise to execute.
Performance differences in the limited-scope AAs did not impact Investment Test ratings, with one exception. Stronger performance in three limited-scope AAs did positively impact the investment test rating for the state of Oregon.

Charter Number: 24
21
Service Performance Summary Overall service performance is excellent.
The bank’s retail delivery systems are readily accessible in a majority of its 40 full-scope AAs (24 AAs or 60 percent). The remaining full-scope AAs have retail delivery systems that are accessible (12 AAs or 30 percent) or reasonably accessible (four AAs or 10 percent). In several markets, access is also enhanced by branches in MUI tracts that are in close proximity (across street or within blocks) to LMI areas.
Branching activity generally improved (or did not adversely affect) retail accessibility in the bank’s 40 full-scope AAs. USB opened 210 branches and closed 88 branches bank-wide over the evaluation period. On a net basis, the bank opened branches in geographies of all income levels, including five branches in low-income tracts and 16 branches in moderate-income tracts.
In addition to a traditional branch network, the bank offers alternate delivery systems
that include an extensive ATM network, 24-hour on-line banking, banking by mail, banking by telephone, and mobile banking. These options are available in all USB markets and give customers more flexibility in choosing delivery channels that suit their needs. With the exception of strong ATM distributions in LMI geographies, we did not give weight to these alternative delivery systems because the bank could not specifically demonstrate that they improve delivery of banking services for LMI individuals or areas.
We did not identify any differences between branches in the full-scope AAs related to
product availability, services offered, or business hours that inconvenience low- or moderate-income geographies or individuals.
The level of CD service activities is at least good in most of the bank’s full-scope AAs (33 AAs or 82.5 percent). Performance in other full-scope AAs is generally adequate. Activities address a wide variety of CD initiatives, and are most responsive to financial education needs.
Stronger performance in some limited-scope AAs (most notably the nonMSA AAs) did positively impact Service Test ratings for the states of Illinois, Montana, North Dakota and Kentucky.

Charter Number: 24
22
Fair Lending or Other Illegal Credit Practices Review Pursuant to 12 C.F.R. 25.28(c), or 12 C.F.R. 195.28(c), in determining a national bank’s (bank) or Federal savings association’s (FSA) CRA rating, respectively, the OCC considers evidence of discriminatory or other illegal credit practices in any geography by the bank or FSA, or in any assessment area by an affiliate whose loans have been considered as part of the bank’s or FSA’s lending performance. As part of this evaluation process, the OCC consults with other federal agencies with responsibility for compliance with the relevant laws and regulations, including the U.S. Department of Justice, the U.S. Department of Housing and Urban Development (HUD), and the Consumer Financial Protection Bureau (CFPB). We also considered other material practices the bank engaged in during the evaluation period involving home mortgage lending practices and foreclosure issues that provide relevant context for the bank’s activities during the period of the CRA evaluation. The OCC identified the following public information regarding non-compliance with the statutes and regulations prohibiting discriminatory or other illegal credit practices with respect to this institution: The OCC identified unfair practices involving billing for identity theft protection products
offered through an unaffiliated third party. The products were primarily marketed to the credit card customers of USBND, but were also marketed to customers of USB. The bank failed to adequately oversee the third party, which charged customers for services that were not delivered. The bank discontinued marketing these products in 2012, and cooperatively implemented an action plan to strengthen third party controls and remediate affected consumers for all fees paid (including the third party portion). For further information on this settlement, see OCC Enforcement Actions #2014-114 and #2014-115. In a related matter, the CFPB also cited the bank for unfair practices under sections 1031 and 1036 of the Dodd-Frank Act. For further information about the CFPB action, please see CFPB Consent Order 2014-CFPB-0013. Together, the OCC and CFPB actions required the bank to provide $51 million remediation to approximately 440,000 customers (of a 10.5 million credit card customer base). The OCC also assessed a $4 million civil money penalty (CMP), and the CFPB assessed an additional $5 million CMP.
In a separate action, the CFPB cited the bank for deceptive practices under sections 1031
and 1036 of the Dodd-Frank Act, and for a Truth in Lending violation under 12 C.F.R. Part 1026, involving the bank’s Military Installment Loans and Educational Services program. The CFPB required $3.2 million in redress to affected consumers. For further information about the CFPB action, please see CFPB consent order 2013-CFPB-0003. The CFPB terminated this consent order on November 12, 2014.
Charter Number: 24
23
The bank executed conciliation agreements in response to a disability discrimination complaint filed with HUD on April 23, 2012, and a racial discrimination complaint filed with HUD on September 13, 2013. For further information regarding these complaints and conciliation agreements, please see Fair Housing and Equal Opportunity (FHEO) case numbers 05-12-0713-08 and 08-13-0299-8, respectively.
The OCC does not have additional public information regarding non-compliance with statutes and regulations prohibiting discriminatory or other illegal credit practices with respect to this institution. In determining this institution’s overall CRA rating, the OCC has considered information that was made available to the OCC on a confidential basis during its consultations. As a result of these findings, the CRA Performance Evaluation rating was lowered from Outstanding to Satisfactory.

Charter Number: 24
24
PRIMARY RATED AREAS
Cincinnati-Middletown, OH-KY-IN Multistate MSA Minneapolis-St. Paul-Bloomington, MN-WI Multistate MSA St. Louis, MO-IL Multistate MSA State of California State of Colorado State of Washington State of Wisconsin
Charter Number: 24
25
Cincinnati-Middletown, OH–KY-IN Multistate MSA Rating (Cincinnati MMSA) CRA rating for the MMSA1: Outstanding
The Lending Test is rated: Outstanding The Investment Test is rated: Outstanding The Service Test is rated: Outstanding
The major factors that support this rating include:
Excellent lending performance based on excellent overall borrower distributions, excellent overall geographic distributions, and an excellent level of lending activity. CD lending has a positive impact and further supports lending performance.
Excellent investment performance based on investment volume and responsiveness to revitalization and affordable housing needs.
Excellent service performance based on readily accessible retail delivery systems and a relatively high level of CD services. Services include numerous leadership activities and are particularly responsive to financial education needs.
Description of Institution’s Operations in the Cincinnati MMSA The Cincinnati MMSA is the bank’s fourth largest rated area (of 39), in terms of deposits. It accounts for 21.6 billion (10.9 percent) of bank deposits, 121 (4 percent) of bank branches, 166 (3 percent) of bank ATMs, and 31,353 (3 percent) of bank-reported loans inside its AAs during the evaluation period. USB has one AA in this rated area (Cincinnati AA), which includes 11 (of 15) counties in the Cincinnati MMSA. Refer to Appendix A for a detailed listing of bank AAs. Scope of Evaluation in the Cincinnati MMSA We performed a full-scope review of the Cincinnati AA and rated the Cincinnati MMSA entirely on this assessment. Of the bank’s reported loans in the Cincinnati AA, 51 percent are business loans, 48 percent are home mortgage loans, and less than 1 percent are farm loans. Refer to Appendix C for detailed demographics, community contact results, and other performance context information specific to the Cincinnati AA.
1 This rating reflects performance in the multistate metropolitan area, which is evaluated separately and not
included in the evaluation or rating of any state-rated area.

Charter Number: 24
26
LENDING TEST Lending Test performance in the Cincinnati MMSA is rated Outstanding. Bank performance in the Cincinnati AA is excellent based on excellent borrower distributions, excellent geographic distributions, an excellent level of lending activity, and the positive impact of CD lending that further supports lending performance. Lending Activity Lending levels in the Cincinnati AA reflect excellent responsiveness to area credit needs in relation to deposits (with consideration for the large share of centralized, nonlocal deposits) and the competitive banking environment. USB has the most area deposits of 73 banks as of June 30, 2011 ($21.6 billion, 35 percent market share). Excluding the large volume of centralized, nonlocal deposits ($9.3 billion), the bank would have a second place deposit rank and a 23 percent market share. USB reported $2.9 billion in home mortgage, business, and farm loans in this AA over the evaluation period. The bank also originated $124 million in CD loans specific to the AA. Of all home mortgage loans reported in the Cincinnati AA for the year 2011, USB ranks third in the number of home purchase loans (fifth by dollar volume), second in the number of home improvement loans (first by dollar volume), and fifth in home refinance loans (both number and dollar volume). In addition, USB ranks second in the number of small business loans (third by dollar volume), and second in the number of small farm loans (fourth by dollar volume). While lending market shares are lower than the bank’s deposit market share, this is a competitive market with more than 385 home loan reporters and 95 CRA data reporters. Distribution of Loans by Income Level of the Geography The overall geographic distribution of loans in the Cincinnati AA is excellent, as evidenced by a good distribution of home mortgage loans, an excellent distribution of multifamily loans, excellent distributions of small loans to businesses and farms, and no unexplained lending gaps. Our assessment weights small business loans slightly more than home mortgage loans, as they respectively account for 51 percent and 48 percent of the bank’s reported loans in this AA (by number). Home Mortgage Loans The geographic distribution of home mortgage loans reported in the Cincinnati AA is good for home purchase, home improvement, and home refinance loans. Our assessment gives more weight to performance in moderate-income geographies as they contain substantially more owner-occupied housing units. Our assessment also considers the challenging economic conditions that existed during the evaluation period.
Charter Number: 24
27
The geographic distribution of home purchase loans is good. Bank performance is somewhat lower than the demographic comparator in low-income geographies, and performance is near the demographic comparator in moderate-income geographies. The bank’s market share of home purchase loans in both low- and moderate-income geographies exceeds its overall product share. The geographic distribution of home improvement loans is good. Bank performance is somewhat lower than the demographic comparator in low-income geographies, and performance is near the demographic comparator in moderate-income geographies. The bank’s market share of home improvement loans in low-income geographies exceeds, and in moderate-income geographies is lower than, its overall product share. The geographic distribution of home refinance loans is good. The bank’s geographic distributions are significantly lower than the demographic comparator for low-income geographies, and lower than the demographic comparator for moderate-income geographies. However, our conclusion emphasizes market share performance due to contextual information regarding geographic distributions for home refinance loans (explained in the next paragraph). The bank’s market share of home refinance loans in both low- and moderate-income geographies exceeds its overall product share. Geographic distributions for the home refinance product belie the bank’s increased lending in LMI areas. The bank reported 857 home refinance loans in moderate-income geographies during the current evaluation period, 74 percent more than the 493 loans reported in the prior evaluation. Despite significantly less lending opportunity and strong competition, the bank also slightly increased home refinance lending in low-income geographies by 54 percent (from 46 loans to 71 loans). Spurred by the evaluation period’s low rate environment, home refinance lending increased in geographies of all income levels. However, the increases were much greater for MUI areas. In total, the bank reported 173 percent more home refinance loans in the Cincinnati AA during the current evaluation period (from 3,303 loans to 9,022 loans). In assessing the lower proportion of lending in LMI areas, we considered foreclosure concentrations in the AA and documented studies showing foreclosures lead to lower property values in their immediate vicinity. HUD (U.S. Department of Housing and Urban Development) provided three rounds of funding to the City of Cincinnati under the Neighborhood Stabilization Program (NSP). The program is designed to promote the sale, rental, or redevelopment of abandoned and foreclosed homes in neighborhoods with the highest foreclosure and vacancy rates. Of the 13 Cincinnati neighborhoods targeted under the program, nine are predominantly comprised of LMI geographies. Foreclosure and vacancy concentrations intensify housing value declines, making it even more challenging for homeowners in affected neighborhoods to refinance their homes. Multifamily Loans The geographic distribution of multifamily loans reported in the Cincinnati AA is excellent. Bank performance exceeds the demographic comparator in both low- and moderate-income geographies. In addition, the bank’s market share of multifamily loans in both low- and moderate-income geographies exceeds its overall product share.

Charter Number: 24
28
Small Loans to Businesses The geographic distribution of business loans reported in the Cincinnati AA is excellent. Bank performance is near the demographic comparator for low-income geographies, and performance equals the demographic comparator for moderate-income geographies. The bank’s market share of business loans in both low- and moderate-income geographies exceeds its overall product share. Small Loans to Farms The geographic distribution of farm loans reported in the Cincinnati AA is excellent based on performance in moderate-income areas. Bank performance exceeds the demographic comparator, and the bank’s market share of farm loans in moderate-income geographies exceeds its overall product share. Opportunity for farm lending in low-income geographies is limited. There are fewer than 52 farms located in the area’s low-income geographies; and there was just one farm loan reported in these tracts for the year 2011 by all CRA data reporters in aggregate. Lending Gap Analysis Our geographic distribution analysis included a review for lending gaps, particularly in LMI areas. We did not identify any unexplained lending gaps in the Cincinnati AA. Distribution of Loans by Income Level of the Borrower The overall borrower distribution of loans in the Cincinnati AA is excellent, as evidenced by excellent distributions of home mortgage loans and small loans to businesses, and a good distribution of small loans to farms. Home Mortgage Loans The overall borrower distribution of home mortgage loans reported in the Cincinnati AA is excellent. Our assessment gives the most weight to home refinance and home purchase loans, as these products collectively account for 96 percent of the bank’s home mortgage loans in this AA (by number). The borrower distribution of home purchase loans is excellent. Bank performance essentially equals the demographic comparator for low-income borrowers, and performance exceeds the demographic comparator for moderate-income borrowers. The bank’s market share of home purchase loans to low-income borrowers is near, and to moderate-income borrowers exceeds, its overall product share.

Charter Number: 24
29
The borrower distribution of home improvement loans is good. Bank performance is near the demographic comparator for low-income borrowers (with consideration for poverty), and performance exceeds the demographic comparator for moderate-income borrowers. The bank’s market share of home improvement loans to low-income borrowers is somewhat lower than, and to moderate-income borrowers is near, its overall product share. The borrower distribution of home refinance loans is excellent. Bank performance is somewhat lower than the demographic comparator for low-income borrowers (with consideration for poverty), but the number of loans is increasing. The bank reported 909 home refinance loans to low-income borrowers during the current evaluation period (156 percent more than the 355 loans reported in the prior evaluation). Our assessment also considers the fact that fixed refinancing costs can be an impediment to low-income borrowers because it takes longer to recoup those costs through interest savings on smaller loans. With regard to moderate-income borrowers, bank performance exceeds the demographic comparator. The bank’s market share of home refinance loans to both low- and moderate-income borrowers exceeds its overall product share. Small Loans to Businesses The distribution of loans to businesses of different sizes in the Cincinnati AA is excellent. Although the bank’s percentage of loans to small businesses (i.e., those with gross annual revenues of $1 million or less) is near the demographic comparator, the bank’s market share of loans to small businesses exceeds its overall product share. As explained in the Description of Evaluation section, we emphasized market share performance in our performance conclusion for this market. A majority of the bank’s reported business loans are small business credit cards, for which the bank does not typically collect or use revenue information. This market has robust CRA data with at least 97 reporters, including the top ten local banks (ranked by deposits) with an aggregate deposit market share of 90 percent. The bank’s market share of loans to small businesses consistently exceeds its overall product share in each of the three years covered by the evaluation period. Small Loans to Farms The distribution of loans to farms of different sizes in the Cincinnati AA is good. The percentage of loans to small farms (i.e., those with gross annual revenues of $1 million or less) is near the demographic comparator, and the bank’s market share of loans to small farms exceeds its overall product share. Community Development Lending CD lending has a positive impact and further supports lending performance. Our conclusion considers the bank’s large volume of centralized, nonlocal deposits in this market (as described in the Lending Activity section).
Charter Number: 24
30
The bank made 55 CD loans totaling $124 million during the review period. By dollar volume, 24 percent of these loans provided affordable housing for LMI residents, 23 percent provided community services for LMI individuals, and 53 percent provided economic development. These loans created or rehabilitated 725 affordable housing units. This level of CD lending represents 5 percent of allocated Tier 1 Capital. CD loans include the following examples, which demonstrate responsiveness to identified revitalization needs:
- A $12.4 million construction loan to redevelop a 3.86-acre site into a 138-unit Class A apartment complex. The project is located in a low-income area, which is part of the Clifton Heights/UC Joint Urban Renewal Plan. The Plan addresses the need for higher density residential properties to support revitalization in the Clifton Heights neighborhood.
- A $9.375 million construction loan to redevelop two adjacent, non-contiguous sites into a 108-unit apartment project located near the University of Cincinnati. The project is in a low-income area, which is part of the defined Uptown District. A plan is in place to redevelop this area with a focus on additional housing and retail.
- A $6.5 million term loan in the form of a Recovery Zone Bank Qualified Private Placement Bond to support the expansion of a local company. The Recovery Zone Bond Program, created under the American Recovery and Reinvestment Act of 2009, helps to stimulate economic development in economically distressed areas with high unemployment. The loan will increase plant capacity and create skilled jobs.
- A $1 million revolving term loan, which is part of a larger pool of funds ($33 million), to the Cincinnati Housing Development Fund to finance community revitalization in the greater Cincinnati area. The funds support a single-family investment program to purchase, rehab and resell housing units at scattered sites in various LMI neighborhoods. The goals of the program are to increase home ownership, eliminate blight and beautify areas adjacent to the members’ properties.
Product Innovation and Flexibility Product innovation and flexibility have a neutral impact on lending performance. During the review period, the bank made two loans totaling $20 million through the Private Placement Bond Program. One loan supported community services for LMI individuals and the other revitalized an economically distressed area.
INVESTMENT TEST Investment Test performance in the Cincinnati MMSA is rated Outstanding. Performance in the Cincinnati AA is excellent in relation to bank capacity, identified needs, and available opportunities. Our conclusion also considers the bank’s large volume of centralized, nonlocal deposits in this market (as described in the Lending Activity section).

Charter Number: 24
31
The bank made 331 investments totaling $85 million during the evaluation period. Current period investments include 24 NMTCs totaling $39 million, 10 bonds totaling $21 million, 149 LIHTCs totaling $11 million, 30 MBSs totaling $9 million, a $2 million mortgage bond, a $2 million equity investment, three HTCs totaling $61 thousand, and $1 million qualified grants and in-kind donations. The bank also has 123 prior period investments with an aggregate outstanding balance of $31 million. These prior period investments continue to provide benefit and meet assessment area needs. Total investments represent 4 percent of allocated Tier 1 Capital. Our assessment also gives positive consideration for the responsiveness of investments to identified revitalization and affordable housing needs. By dollar volume, 81 percent of current period investments, and 100 percent of prior period investments, address these needs. Another 17 percent of current period investments address small business needs, and the remainder support qualifying community services. Investments include the following examples:
- A $12 million HTC investment related to the acquisition and restoration of a historic building in a highly distressed low-income area. The building was rehabilitated into hotel, contemporary art gallery, restaurant, and conference meeting spaces. In addition to creating 70 to 90 permanent jobs, the redevelopment project provides meeting and banquet facilities to local nonprofit organizations at no charge. The building’s reuse has been in the strategic planning of the City of Cincinnati and three CDCs for five years, and the project is considered a catalyst for further capital investment and job creation.
- Four NMTC investments totaling more than $10 million to restore and improve the campus of a nonprofit organization serving at-risk, low-income children who suffer from mental, behavioral, and cognitive disorders. The organization provides schooling, foster care, mental health treatment, and short-term hospitalization services. Renovations are projected to increase the facility’s capacity by 200 children (above the 600 children currently served). The campus is located in a moderate-income area.
- A $2 million investment in a mortgage bond that provided financing for a 98-unit LIHTC project. All units have rent restrictions for individuals at or below 60 percent of the area median income.
- More than $2 million investment in an equity fund that provides nontraditional financing for mixed-use projects that revitalize and stabilize distressed areas. The fund has made over $136 million in loans, resulting in $672 million total development to date. Projects include several condominiums and gap financing for downtown real estate development projects that would not otherwise be feasible.
- More than $1 million NMTC investment in a fund that provides below market-rate loans for real estate projects that revitalize LMI areas in Cincinnati. These projects, which would not otherwise be feasible, create home ownership opportunities, generate new jobs, re-populate the target neighborhoods, and reduce crime.

Charter Number: 24
32
SERVICE TEST Service Test performance in the Cincinnati MMSA is rated Outstanding. Bank performance in the Cincinnati AA is excellent as evidenced by readily accessible retail delivery systems and a relatively high level of CD services. Retail Banking Services Retail delivery systems are readily accessible to geographies and individuals of different income levels in the Cincinnati AA. Our assessment weights performance in moderate-income areas more heavily (three times more populated than low-income areas) and considers branches in MUI geographies that are in close proximity to LMI geographies. The bank has five branches in low-income geographies and 23 branches in moderate-income geographies. The percentage of branches in low-income tracts is below, and the percentage of branches in moderate-income tracts essentially equals, the percentage of the population residing in each area. Access is also enhanced by several branches in MUI tracts that are in close proximity to LMI geographies (across street or within blocks) and supported by an excellent distribution of ATMs. Branching activity has not affected access to banking services. The bank opened four branches and closed four branches during the evaluation period. There were no net branch changes in geographies of any income level. We did not identify any branch differences in product availability, services offered, or business hours that inconvenience LMI geographies or individuals. Community Development Services USB provided a relatively high level of CD services in the Cincinnati AA, with more than 320 service activities involving 119 different organizations. Leadership is evident through 65 activities involving Board or committee participation and an adequate number of average hours per activity. Activities address a wide variety of CD initiatives and are most responsive to financial education needs. Bank staff provided 237 financial education programs to more than 4,000 individuals, including first-time homebuyers, small businesses, and youth. USB also maintains two Individual Development Account program relationships with community partners. Refer to Tables 1-15 in the Other Multistate Metropolitan Area (MMA) section of Appendix D for the facts and data supporting performance conclusions under the Lending, Investment, and Service Tests.
Charter Number: 24
33
Minneapolis-St. Paul-Bloomington, MN-WI Multistate MSA Rating (Minneapolis MMSA) CRA rating for the MMSA1: Outstanding
The Lending Test is rated: Outstanding The Investment Test is rated: Outstanding The Service Test is rated: Outstanding
The major factors that support this rating include:
Excellent lending performance based on excellent overall borrower distributions, good overall geographic distributions, and an excellent level of lending activity. CD lending has a significantly positive impact and further supports lending performance.
Excellent investment performance based primarily on investment volume and responsiveness to affordable housing and revitalization needs.
Excellent service performance based on readily accessible retail delivery systems and an excellent level of CD services. Services reflect strong leadership and are particularly responsive to financial education needs.
Description of Institution’s Operations in the Minneapolis MMSA The Minneapolis MMSA is the bank’s largest rated area (of 39), in terms of deposits. It accounts for 35.8 billion (18.1 percent) of bank deposits, 94 (3 percent) of bank branches, 470 (9 percent) of bank ATMs, and 92,323 (8 percent) of bank-reported loans inside its AAs during the evaluation period. USB has one AA in this rated area (Minneapolis AA), which includes 12 (of 13) counties in the Minneapolis MMSA. Refer to Appendix A for a detailed listing of bank AAs. Scope of Evaluation in the Minneapolis MMSA We performed a full-scope review of the Minneapolis AA and rated the Minneapolis MMSA entirely on this assessment. Of the bank’s reported loans in the Minneapolis AA, 53 percent are home mortgage and 47 percent are business loans. There are insufficient multifamily loans for meaningful analysis. In addition, farm lending is limited and not included in our lending distribution analyses. Refer to Appendix C for detailed demographics, community contact results, and other performance context information specific to the Minneapolis AA.
1 This rating reflects performance in the multistate metropolitan area, which is evaluated separately and not
included in the evaluation or rating of any state-rated area.

Charter Number: 24
34
LENDING TEST Lending Test performance in the Minneapolis MMSA is rated Outstanding. Bank performance in the Minneapolis AA is excellent based on excellent borrower distributions, good geographic distributions, an excellent level of lending activity, and the significantly positive impact of CD lending that further supports lending performance. Lending Activity Lending levels in the Minneapolis AA reflect excellent responsiveness to area credit needs in relation to deposits (with consideration for the large share of centralized, nonlocal deposits) and the highly competitive banking environment. USB has the second-most area deposits of 161 banks as of June 30, 2011 ($35.8 billion, 33 percent market share). Excluding the large share of centralized, nonlocal deposits ($17.9 billion), the bank would maintain its second place rank with a 20 percent market share. USB reported $11 billion in home mortgage, business, and farm loans in this AA over the evaluation period. The bank also originated $284 million in CD loans specific to the AA. Of all home mortgage loans reported in the Minneapolis AA for the year 2011, USB ranks second in both the number and dollar volume of home purchase, home improvement, and home refinance loans. In addition, USB ranks second in the number and dollar volume of small business loans. While lending market shares are lower than the bank’s deposit market share, this is a highly competitive market with more than 500 home loan reporters and 115 CRA data reporters. Distribution of Loans by Income Level of the Geography The overall geographic distribution of loans in the Minneapolis AA is good, as evidenced by a good distribution of home mortgage loans, an excellent distribution of small loans to businesses, and no unexplained lending gaps. Our assessment weights home mortgage loans slightly more than business loans, as they respectively account for 53 percent and 47 percent of the bank’s reported loans in this AA (by number). Our assessment also considers the challenging economic conditions that existed during the evaluation period. Home Mortgage Loans The overall geographic distribution of home mortgage loans reported in the Minneapolis AA is good. Our assessment gives the most weight to home refinance and home purchase loans, as these products respectively account for 66 percent and 33 percent of the bank’s home mortgage loans in this AA (by number). Our assessment also gives more weight to performance in moderate-income geographies as they contain substantially more owner-occupied housing units.

Charter Number: 24
35
The geographic distribution of home purchase loans is excellent. Bank performance exceeds the demographic comparator in both low- and moderate-income geographies. The bank’s market share of home purchase loans in both low- and moderate-income geographies exceeds its overall product share. The geographic distribution of home improvement loans is good. Bank performance exceeds the demographic comparator in low-income geographies, and performance is somewhat lower than the demographic comparator in moderate-income geographies. The bank’s market share of home improvement loans in both low- and moderate-income geographies is near its overall product share. The geographic distribution of home refinance loans is good. The bank’s geographic distributions are significantly lower than the demographic comparator in low-income geographies, and lower than the demographic comparator in moderate-income geographies. However, our conclusion emphasizes market share performance due to contextual information regarding geographic distributions for home refinance loans (explained in the next paragraph). The bank’s market share of home refinance loans in both low-income and moderate-income geographies is near its overall product share. Geographic distributions for the home refinance product belie the bank’s increased lending in LMI areas. The bank reported 2,290 home refinance loans in moderate-income geographies during the current evaluation period, 85 percent more than the 1,236 loans reported in the prior evaluation. The bank also increased home refinance lending in low-income geographies by 75 percent (from 110 loans to 192 loans). Spurred by the evaluation period’s low rate environment, home refinance lending increased in geographies of all income levels. However, the increases were much greater for MUI areas. In total, the bank reported 183 percent more home refinance loans in the Minneapolis AA during the current evaluation period (from 11,302 loans to 31,932 loans). In assessing the lower proportion of lending in LMI areas, we considered foreclosure concentrations in the AA and documented studies showing foreclosures lead to lower property values in their immediate vicinity. According to a 2011 report by the Center for Responsible Lending, low-income neighborhoods in the Minneapolis MMSA have a completed foreclosure rate that is 2.6 times higher than the area’s overall rate. The completed foreclosure rate in moderate-income neighborhoods is 1.6 times higher. Foreclosure concentrations intensify housing value declines, making it even more challenging for homeowners in affected neighborhoods to refinance their homes. Small Loans to Businesses The geographic distribution of business loans reported in the Minneapolis AA is excellent. Bank performance is near the demographic comparator for low-income geographies, and performance essentially equals the demographic comparator for moderate-income geographies. The bank’s market share of business loans in both low- and moderate-income geographies exceeds its overall product share. It is also notable that the bank reported a comparable number of business loans in both low- and moderate-income geographies as the market leader.
Charter Number: 24
36
Lending Gap Analysis Our geographic distribution analysis included a review for lending gaps, particularly in LMI areas. We did not identify any unexplained lending gaps in the Minneapolis AA. Distribution of Loans by Income Level of the Borrower The overall borrower distribution of loans in the Minneapolis AA is excellent, as evidenced by an excellent distribution of home mortgage loans and a good distribution of business loans. Our assessment weights home mortgage loans slightly more than business loans, as they respectively account for 53 percent and 47 percent of the bank’s reported loans in this AA (by number). Home Mortgage Loans The borrower distribution of home mortgage loans reported in the Minneapolis AA is excellent for all product types. The borrower distribution of home purchase loans is excellent. Bank performance exceeds the demographic comparator for both low- and moderate-income borrowers. The bank’s market share of home purchase loans to both low- and moderate-income borrowers is near its overall product share. The borrower distribution of home improvement loans is excellent. Bank performance exceeds the demographic comparator for both low- and moderate-income borrowers. The bank’s market share of home improvement loans to both low- and moderate-income borrowers exceeds its overall product share. The borrower distribution of home refinance loans is excellent. Bank performance is near the demographic comparator for low-income borrowers. However, our assessment considers the level of poverty and the fact that fixed refinancing costs can be an impediment to low-income borrowers because it takes longer to recoup those costs through interest savings on smaller loans. With regard to moderate-income borrowers, bank performance exceeds the demographic comparator. The bank’s market share of home refinance loans to both low- and moderate-income borrowers exceeds its overall product share.

Charter Number: 24
37
Small Loans to Businesses The distribution of loans to businesses of different sizes in the Minneapolis AA is good. Although the percentage of loans to small businesses (i.e., those with gross annual revenues of $1 million or less) is somewhat lower than the demographic comparator, the bank’s market share of loans to small businesses is near its overall product share. As explained in the Description of Evaluation section, we emphasized market share performance in our performance conclusion for this market. A majority of the bank’s reported business loans are small business credit cards, for which the bank does not typically collect or use revenue information. This market has robust CRA data with at least 116 reporters, including nine of the top ten local banks (ranked by deposits) with an aggregate deposit market share of 84 percent. The bank’s market share of loans to small businesses exceeds its overall product share for the years 2009 and 2010. Community Development Lending CD lending has a significantly positive impact and further supports lending performance. Our conclusion considers the bank’s large volume of centralized, nonlocal deposits in this market (as described in the Lending Activity section). The bank made 61 CD loans totaling $284 million during the review period. By dollar volume, 57 percent of these loans provided economic development, 39 percent provided affordable housing for LMI residents, and 4 percent provided community services for LMI individuals. These loans created or rehabilitated 1,234 affordable housing units. This level of CD lending represents 6 percent of allocated Tier 1 Capital. CD loans include the following examples, which demonstrate responsiveness to identified needs for affordable housing and foreclosure assistance:
- A $2 million term loan to a nonprofit organization created by the cities of St. Paul and Minneapolis and an area foundation to provide financial support for affordable rental housing and homeownership opportunities for families in the Twin Cities. The term loan supports a fund that provides strategic acquisition and rehabilitation of housing stock, and programs to assist affordable and sustainable home ownership. Currently, the primary focus of the fund is to address the impact of the mortgage foreclosure crisis on LMI homeowners, renters and communities.
- Two loans totaling $25.2 million including a construction bridge loan and permanent term loan for the conversion of a vacant, multi-story historic building to a 136-unit affordable multi-family LIHTC project. Of the 136 units, 109 units are affordable to tenants earning 60 percent or less of area median income. All other units will be leased at HUD Fair Market rent levels.
- Two line of credit renewals totaling $12.5 million to an area organization committed to preserving, improving and increasing affordable housing for low- and moderate-income individuals and families and assisting communities with housing revitalization. Funds used for the construction and rehabilitation of affordable housing within the Twin Cities.
Charter Number: 24
38
- Nine credit extensions during the evaluation period totaling $7.35 million to a developer of single-family affordable housing in the Twin Cities. Credit extensions include three term loans ($750,000 each) to build affordable homes for low-income families, and two revolving lines of credit ($500,000 and $1.2 million) to fund ongoing construction and other short term needs.
Product Innovation and Flexibility Product innovation and flexibility have a neutral impact on lending performance. USB offers affordable mortgage products and a wide variety of mortgage assistance programs in this market. The bank originated seven loans totaling $30 million through the Private Placement Bond Program to support affordable housing. The bank also originated six loans totaling $246 thousand under the City of Minneapolis’ Two Percent Revolving Loan Program in support of economic development.
INVESTMENT TEST Investment Test performance in the Minneapolis MMSA is rated Outstanding. Performance is excellent in relation to bank capacity, identified needs, and available opportunities. Our conclusion also considers the bank’s large volume of centralized, nonlocal deposits in this market (as described in the Lending Activity section). The bank made 631 investments totaling $202 million during the evaluation period. Current period investments include 38 NMTCs totaling $115 million, 414 LIHTCs totaling $69 million, 24 MBSs totaling $11 million, eight HTCs totaling $3 million, a $250 thousand equity investment, and $4 million grants and in-kind donations. The bank also has 103 prior period investments with an aggregate outstanding balance of $56 million. These prior period investments continue to provide benefit and to meet assessment area needs. Total investments represent 6 percent of allocated Tier 1 Capital. Most current period investments (94 percent by dollar volume) and prior period investments are responsive to identified revitalization and affordable housing needs. Almost $110 million investments relate to revitalization/stabilization efforts, many of which support job growth. Another $81 million investments support affordable housing initiatives. Investments include the following examples: - A $23 million NMTC investment to rehabilitate environmental hazards and transform a
historic downtown Minneapolis building into usable office space. In addition to revitalizing the surrounding low-income area, the project acts as a catalyst for future development by increasing the number of people in the area (building will house up to 1,750 employees) and creating demand for new service businesses.
- An $11 million NMTC investment to support the expansion of a company located in a moderate-income area. The project is a pivotal component of the East St. Paul revitalization effort and will initially add 72 permanent jobs to the area, with 40 additional jobs over the next 10 years.
Charter Number: 24
39
- A $3 million NMTC investment to improve two commercial buildings in a low-income area that was hard hit by the recession. The improvements have attracted new retail and office tenants, and the project is expected to create 180 permanent jobs targeted to LMI workers.
- An $8 million NMTC investment in a new senior housing complex that will create 120 affordable housing units and 15 to 20 new jobs targeted to LMI workers.
- More than $26 million NMTC investments to fund lending pools for businesses that revitalize/stabilize communities and create jobs targeted to LMI workers. The loan pools, which provide below market rate financing, have supported numerous revitalization efforts that would not otherwise be feasible.
SERVICE TEST Service Test performance in the Minneapolis MMSA is rated Outstanding. Bank performance in the Minneapolis AA is excellent as evidenced by readily accessible retail delivery systems and an excellent level of CD services. Retail Banking Services Retail delivery systems are readily accessible to geographies and individuals of different income levels in the Minneapolis AA. The bank has four branches in low-income geographies and 17 branches in moderate-income geographies. The percentage of branches in low-income tracts essentially equals, and the percentage of branches in moderate-income tracts exceeds, the percentage of the population residing in each area. Access is also supported by an excellent distribution of ATMs. Branching activity has improved access to banking services. The bank opened seven branches and closed one branch during the evaluation period. There were no net branch changes in LMI tracts and five net openings in MUI tracts. We did not identify any branch differences in product availability, services offered, or business hours that inconvenience LMI geographies or individuals. Community Development Services USB is a leader in providing CD services in the Minneapolis AA, with more than 340 service activities involving 121 different organizations. Strong leadership is evident through 79 service activities involving Board or committee participation and a high number of average hours per activity. Activities address a wide variety of CD initiatives and are most responsive to financial education needs. Bank staff provided 233 financial education programs to more than 4,200 individuals, including first-time homebuyers, small businesses, and youth. Refer to Tables 1-15 in the Other MMA section of Appendix D for the facts and data supporting performance conclusions under the Lending, Investment, and Service Tests.

Charter Number: 24
40
St. Louis, MO-IL Multistate MSA Rating (St. Louis MMSA) CRA rating for the MMSA1: Outstanding
The Lending Test is rated: Outstanding The Investment Test is rated: Outstanding The Service Test is rated: High Satisfactory
The major factors that support this rating include:
Excellent lending performance based on excellent overall borrower distributions, adequate overall geographic distributions, and an excellent level of lending activity. CD lending has a significantly positive impact and elevates lending performance.
Excellent investment performance based primarily on investment volume and responsiveness to revitalization and affordable housing needs.
Good service performance based on accessible retail delivery systems and a relatively high level of CD services. Services include numerous leadership activities and are particularly responsive to financial education needs.
Description of Institution’s Operations in the St. Louis MMSA The St. Louis MMSA is the bank’s fifth largest rated area (of 39), in terms of deposits. It accounts for $11.3 billion (5.7 percent) of bank deposits, 118 (4 percent) of bank branches, 306 (6 percent) of bank ATMs, and 60,952 (6 percent) of bank-reported loans inside its AAs during the evaluation period. USB has one AA in this rated area (St. Louis AA), which includes 13 (of 16) counties in the St. Louis MMSA. Refer to Appendix A for a detailed listing of bank AAs. Scope of Evaluation in the St. Louis MMSA We performed a full-scope review of the St. Louis AA and rated the St. Louis MMSA entirely on this assessment. Of the bank’s reported loans in the St. Louis AA, 67 percent are home mortgage loans and 33 percent are business loans. Refer to Appendix C for detailed demographics, community contact results, and other performance context information specific to the St. Louis AA.
1 This rating reflects performance in the multistate metropolitan area, which is evaluated separately and
not included in the evaluation or rating of any state-rated area.
Charter Number: 24
41
LENDING TEST Lending Test performance in the St. Louis MMSA is rated Outstanding. Bank performance in the St. Louis AA is excellent based on excellent borrower distributions, adequate geographic distributions, an excellent level of lending activity, and the significantly positive impact of CD lending that elevates lending performance. Lending Activity Lending levels in the St. Louis AA reflect excellent responsiveness to area credit needs in relation to bank deposits and the competitive banking environment. USB has the most area deposits of 140 banks as of June 30, 2011 ($11.3 billion, 16 percent market share). USB reported $7.6 billion in home mortgage, business, and farm loans in this AA over the evaluation period. The bank also originated $160 million in CD loans specific to the AA. Of all home mortgage loans reported in the St. Louis AA for the year 2011, USB ranks third in home purchase loans (both number and dollar volume), first in home improvement loans (both number and dollar volume), and second in the number of home refinance loans (first by dollar volume). While home mortgage lending market shares are lower than the bank’s deposit market share, this is a competitive market with more than 495 home loan reporters. USB ranks first in the number of small business loans (second by dollar volume), and third in the number of small farm loans (first by dollar volume). The bank’s business and farm loan market shares exceed its deposit market share. Distribution of Loans by Income Level of the Geography The overall geographic distribution of loans in the St. Louis AA is adequate, as evidenced by an adequate distribution of home mortgage loans, a good distribution of multifamily loans, good distributions of small loans to businesses and farms, and no unexplained lending gaps. Our assessment weights home mortgage loans more than small business loans, as they respectively account for 67 percent and 32 percent of the bank’s reported loans in this AA (by number). Home Mortgage Loans The overall geographic distribution of home mortgage loans reported in the St. Louis AA is adequate. Our assessment gives the most weight to home refinance loans, as this product accounts for 73 percent the bank’s home mortgage loans in this AA (by number). Our assessment also gives more weight to performance in moderate-income geographies as they contain substantially more owner-occupied housing units. Limited lending opportunity in low-income geographies is also evidenced by aggregate home mortgage data. Despite being a competitive market with more than 495 home mortgage reporters, the number of loans in low-income geographies for the year 2011 consists of 438 home purchase, 56 home improvement, and 500 home refinance loans for all lenders in aggregate.

Charter Number: 24
42
The geographic distribution of home purchase loans is good. Bank performance is lower than the demographic comparator in low-income geographies, and performance is somewhat lower than the demographic comparator in moderate-income geographies. The bank’s market share of home purchase loans in both low- and moderate-income geographies exceeds its overall product share. The geographic distribution of home improvement loans is adequate. Bank performance is significantly lower than the demographic comparator in low-income geographies, and performance is somewhat lower than the demographic comparator in moderate-income geographies. The bank’s market share of home improvement loans in low-income geographies is significantly lower, and in moderate-income geographies is somewhat lower, than its overall product share. The geographic distribution of home refinance loans is adequate. The bank’s geographic distributions are significantly lower than the demographic comparator in both low- and moderate-income geographies. However, our conclusion emphasizes market share performance due to contextual information regarding geographic distributions for home refinance loans (explained in the next paragraph). The bank’s market share of home refinance loans in low-income geographies exceeds, and in moderate-income geographies is near, its overall product share. Geographic distributions for the home refinance product belie the bank’s level of lending in LMI areas. The bank reported 2,014 home refinance loans in moderate-income geographies during the current evaluation period, 15 percent more than the 1,745 loans reported in the prior evaluation. Bank lending in low-income geographies remained relatively flat (from 181 loans to 168 loans). Spurred by the evaluation period’s low rate environment, home refinance lending increased in moderate-income and MUI geographies. However, the increases were much greater for MUI areas. In total, the bank reported 129 percent more home refinance loans in the St. Louis AA during the current evaluation period (from 12,915 loans to 29,529 loans). In assessing the lower proportion of refinance lending in LMI areas, we considered foreclosure concentrations in the AA and documented studies showing foreclosures lead to lower property values in their immediate vicinity. According to a 2011 report by the Center for Responsible Lending, low-income neighborhoods in the St. Louis MMSA have a completed foreclosure rate that is 3.2 times higher than the area’s overall rate. The completed foreclosure rate in moderate-income neighborhoods is 2.1 times higher. Foreclosure concentrations intensify housing value declines, making it even more challenging for homeowners in affected neighborhoods to refinance their homes. Multifamily Loans The geographic distribution of multifamily loans reported in the St. Louis AA is good. Bank performance is somewhat lower than the demographic comparator in low-income geographies, and performance exceeds the demographic comparator in moderate-income geographies. The bank’s market share of multifamily loans in both low- and moderate-income geographies exceeds its overall product share.
Charter Number: 24
43
Small Loans to Businesses The geographic distribution of business loans reported in the St. Louis AA is good. Bank performance is near the demographic comparator in both low- and moderate-income geographies. The bank’s market share of business loans in both low- and moderate-income geographies exceeds its overall product share. Small Loans to Farms The geographic distribution of farm loans reported in the St. Louis AA is good. Bank performance is somewhat lower than the demographic comparator in low-income geographies, and performance is near the demographic comparator for moderate-income geographies. The bank’s market share of farm loans in both low- and moderate-income geographies exceeds its overall product share. Lending Gap Analysis Our geographic distribution analysis included a review for lending gaps, particularly in LMI areas. We did not identify any unexplained lending gaps in the St. Louis AA. Distribution of Loans by Income Level of the Borrower The overall borrower distribution of loans in the St. Louis AA is excellent, as evidenced by excellent distributions of home mortgage loans and small loans to businesses, and a good distribution of small loans to farms. Home Mortgage Loans The borrower distribution of home mortgage loans reported in the St. Louis AA is excellent for all product types. The borrower distribution of home purchase loans is excellent. Bank performance essentially equals the demographic comparator for low-income borrowers (with consideration for poverty), and exceeds the demographic comparator for moderate-income borrowers. The bank’s market share of home purchase loans to both low- and moderate-income borrowers exceeds its overall product share. The borrower distribution of home improvement loans is excellent. Bank performance essentially equals the demographic comparator for low-income borrowers (with consideration for poverty), and performance exceeds the demographic comparator for moderate-income borrowers. The bank’s market share of home improvement loans to low-income borrowers exceeds, and to moderate-income borrowers is near, its overall product share.

Charter Number: 24
44
The borrower distribution of home refinance loans is excellent. Bank performance is somewhat lower than the demographic comparator for low-income borrowers (with consideration for poverty). However, our assessment considers the fact that fixed refinancing costs can be an impediment to low-income borrowers because it takes longer to recoup those costs through interest savings on smaller loans. With regard to moderate-income borrowers, bank performance exceeds the demographic comparator. The bank’s market share of home refinance loans to both low- and moderate-income borrowers exceeds its overall product share. Small Loans to Businesses The distribution of loans to businesses of different sizes in the St. Louis AA is excellent. Although the percentage of loans to small businesses (i.e., those with gross annual revenues of $1 million or less) is near the demographic comparator, the bank’s market share of loans to small businesses exceeds its overall product share. As explained in the Description of Evaluation section, we emphasized market share performance in our performance conclusion for this market. A majority of the bank’s reported business loans are small business credit cards, for which the bank does not typically collect or use revenue information. This market has reliable CRA data with at least 123 reporters, including 14 of the top 15 local banks (ranked by deposits) with an aggregate deposit market share of 62 percent. The bank’s market share of loans to small businesses consistently exceeds its overall product share in each of the three years covered by the evaluation period. Small Loans to Farms The distribution of loans to farms of different sizes in the St. Louis AA is good. The percentage of loans to small farms (i.e., those with gross annual revenues of $1 million or less) is near the demographic comparator, and the bank’s market share of loans to small farms exceeds its overall product share. Community Development Lending CD lending has a significantly positive impact and elevates lending performance. The bank made 44 CD loans totaling $160 million during the review period. By dollar volume, 86 percent of these loans provided affordable housing for LMI residents, 10 percent provided community services for LMI individuals, and 4 percent provided economic development. These loans created or rehabilitated 1,394 affordable housing units. This level of CD lending represents over 11 percent of allocated Tier 1 Capital.
Charter Number: 24
45
CD loans include the following examples, which demonstrate responsiveness to an identified need for affordable housing:
- Twelve participation loans through the Missouri Housing Development Commission (MHDC) totaling $61.8 million, which promoted the development and preservation of affordable housing in St. Louis. Individual loans funded the construction or acquisition and rehab of LIHTC projects in the area creating 533 affordable units for seniors and families with incomes at or below 60 percent of area median income.
- Four loans totaling $34.9 million to fund construction and provide permanent financing for two LIHTC projects. One project included the acquisition and rehab of a vacant historically significant building in a low-income area that will include 86 units targeted to artists. The other project included the acquisition and rehab of a historic 8-story office building to be converted into 72 units of multi-family housing. All units in these developments will be affordable to tenants earning 60 percent or less of area median income.
Product Innovation and Flexibility Product innovation and flexibility have a neutral impact on lending performance.

Charter Number: 24
46
INVESTMENT TEST Investment Test performance in the St. Louis MMSA is rated Outstanding. Performance is excellent in relation to bank capacity, identified needs, and available opportunities. The bank made 711 investments totaling $461 million during the evaluation period. Current period investments consist of 90 NMTCs totaling $317 million, 280 LIHTCs totaling $85 million, 45 HTCs totaling $35 million, 15 blind fund investments totaling $20 million, a $2 million solar tax credit, and $2 million grants and in-kind donations. The bank also has 73 prior period investments with an aggregate outstanding balance of $79 million. Total investments represent 38 percent of allocated Tier 1 Capital. Most current and prior period investments are responsive to revitalization and affordable housing needs. Approximately $355 million current period investments address economic revitalization and stabilization needs; another $97 million address affordable housing needs. Investments include the following examples:
- A $15 million NMTC investment to purchase and develop a building in a moderate-income area. The revitalization project will develop the building’s under-utilized upper floors and is expected to create 1,000 jobs.
- A $20 million NMTC investment to develop a vacant building located in a moderate-income area, and designated Hub and Empowerment Zones. The mixed-use development includes 40 market rate apartments, two floors of commercial office and retail space, and potentially two restaurants. The project is also expected to create 257 permanent jobs targeted to LMI workers over the next three years.
- A $7 million investment using both New Market and Historic Tax Credits to restore a cultural performing arts facility in a low-income area of downtown St. Louis. The project is a high priority for the City, and integral to its Gateway Mall development plan, which seeks to remove blight from the City’s central corridor, increase cultural activity, and encourage more foot traffic and downtown visitors. The project is expected to create 80 new jobs and serve as a catalyst for additional development.
- Two NMTC investments totaling $23 million to convert a vacant shopping mall, located in a moderate-income area of downtown St. Louis, into a mixed-use structure that includes retail space and a parking garage. The project is expected to create 60 new permanent jobs.
- A $5 million NMTC investment to finance the construction of a grocery store in a blighted, moderate-income neighborhood with little access to groceries. The store anchors a $55 million mixed use development plan. The project is expected to create 23 new jobs and to be a catalyst for additional development.
- A $15 million NMTC investment to convert vacant office space into a secondary education facility and office space for a public library. The redevelopment project is located in a downtown moderate-income area, and it is expected to spur additional development and new jobs for the area.

Charter Number: 24
47
SERVICE TEST Service Test performance in the St. Louis MMSA is rated High Satisfactory. Bank performance in the St. Louis AA is good as evidenced by accessible retail delivery systems and a relatively high level of CD services. Retail Banking Services Retail delivery systems are accessible to geographies and individuals of different income levels in the St. Louis AA. There are five branches in low-income geographies and 19 branches in moderate-income geographies. The percentage of branches in both low- and moderate- income tracts is near the percentage of the population residing in each area. Access is also supported by a good distribution of ATMs. Branching activity has not generally affected access to banking services. The bank opened five MUI branches and closed one branch in a low-income tract during the evaluation period. The closure was necessitated by the closing of a hospital, which housed the branch. We did not identify any branch differences in product availability, services offered, or business hours that inconvenience LMI geographies or individuals. Community Development Services USB provided a relatively high level of CD services in the St. Louis AA, with more than 360 service activities involving 113 different organizations. Leadership is evident through 65 activities involving Board or committee participation. Activities address a wide variety of CD initiatives and are most responsive to financial education needs. Bank staff provided 260 financial education programs to more than 5,000 individuals, including first-time homebuyers, small businesses, and youth. USB also maintains eight Individual Development Account program relationships with community partners. Refer to Tables 1-15 in the Other MMA section of Appendix D for the facts and data supporting performance conclusions under the Lending, Investment, and Service Tests.

Charter Number: 24
48
State of California Rating CRA Rating for the State: Outstanding
The Lending Test is rated: Outstanding The Investment Test is rated: Outstanding The Service Test is rated: High Satisfactory
The major factors that support this rating include:
Excellent lending performance in the full-scope area based on good overall borrower distributions, good overall geographic distributions, an excellent level of lending activity, and the significantly positive impact of CD lending which elevates overall lending performance.
Excellent investment performance in the full-scope area based on investment volume and responsiveness to affordable housing and revitalization/stabilization needs.
Good service performance in the full-scope area based on accessible retail delivery systems and an excellent level of CD services. Services reflect strong leadership and are particularly responsive to financial education needs.
Performance differences in the limited-scope AAs did not impact state ratings. Description of Institution’s Operations in the State of California The state of California is the bank’s second largest rated area (of 39), in terms of deposits. It accounts for $30.9 billion (15.6 percent) of bank deposits, 668 (22 percent) of bank branches, 766 (15 percent) of bank ATMs, and 140,105 (13 percent) of bank-reported loans inside its AAs during the evaluation period. USB has 26 AAs in this rated area, 22 of which are metropolitan areas. The four nonmetropolitan AAs are combined for analysis and presentation. Refer to Appendix A for a detailed listing of bank AAs. Scope of Evaluation in the State of California We performed a full-scope review of the Los Angeles AA, which is comprised of the entire Los Angeles-Long Beach-Glendale MD. Other AAs received limited-scope reviews. State ratings are based primarily on performance in the full-scope area. The Los Angeles AA is the bank’s largest AA in this rated area. It accounts for $8.7 billion (28 percent) of rated area deposits, 150 (22 percent) of rated area branches, 166 (22 percent) of rated area ATMs, and 31,764 (23 percent) of rated area loans. Of the bank’s reported loans in the Los Angeles AA, 64 percent are business loans and 36 percent are home mortgage loans. There are insufficient farm loans for meaningful analysis. Refer to Appendix C for detailed demographics, community contact results, and other performance context information specific to the Los Angeles AA.
Charter Number: 24
49
LENDING TEST Lending Test performance in the state of California is rated Outstanding. Bank performance in the full-scope Los Angeles AA is excellent based on good borrower and geographic distributions, an excellent level of lending activity, and the significantly positive impact of CD lending that elevates overall lending performance. Performance differences in the limited-scope AAs did not impact the rating. ConclusionsforAreasReceivingFull‐ScopeReviews Lending Activity Lending levels in the Los Angeles AA reflect excellent responsiveness to area credit needs in relation to deposits and the competitive banking environment. USB has the ninth-most area deposits of 126 banks as of June 30, 2011 ($8.7 billion, 3 percent market share). USB reported $4.8 billion in home mortgage and business loans in this AA over the evaluation period. The bank also originated $412 million in CD loans specific to the AA. Of all home mortgage loans reported in the Los Angeles AA for the year 2011, USB ranks 17th in the number of home purchase loans (13th by dollar volume), 11th in the number of home improvement loans (12th by dollar volume), and ninth in the number of home refinance loans (10th by dollar volume). While home mortgage lending market shares are lower than the bank’s deposit market share, this is a competitive market with more than 500 home loan reporters. USB ranks seventh in the number of small business loans (ninth by dollar volume), and its business loan market share exceeds its deposit market share. Distribution of Loans by Income Level of the Geography The overall geographic distribution of loans in the Los Angeles AA is good, as evidenced by an adequate distribution of home mortgage loans, excellent distributions of multifamily and business loans, and no unexplained lending gaps. Home Mortgage Loans The overall geographic distribution of home mortgage loans reported in the Los Angeles AA is adequate. Our assessment gives the most weight to home refinance loans, as this product accounts for 69 percent the bank’s home mortgage loans in this AA (by number). Our assessment also gives more weight to performance in moderate-income geographies as they contain substantially more owner-occupied housing units.

Charter Number: 24
50
The geographic distribution of home purchase loans is good. Bank performance exceeds the demographic comparator in both low- and moderate-income geographies. The bank’s market share of home purchase loans in both low- and moderate-income geographies is lower than its overall product share. The geographic distribution of home improvement loans is poor. Bank performance is significantly lower than the demographic comparator in low-income geographies, and performance is lower than the demographic comparator in moderate-income geographies. The bank’s market share of home improvement loans in low-income geographies is significantly lower, and in moderate-income geographies is somewhat lower, than its overall product share. The geographic distribution of home refinance loans is adequate. The bank’s geographic distributions are significantly lower than the demographic comparator for both low- and moderate-income geographies. However, our conclusion emphasizes market share performance due to contextual information regarding geographic distributions for home refinance loans (explained in the next paragraph). The bank’s market share of home refinance loans in both low- and moderate-income geographies is somewhat lower than its overall product share. Geographic distributions for the home refinance product belie the bank’s level of lending in LMI areas. The bank reported 567 home refinance loans in moderate-income geographies during the current evaluation period, 43 percent more than the 397 loans reported in the prior evaluation. Bank lending in low-income geographies remained flat (from 53 loans to 51 loans). Spurred by the evaluation period’s low rate environment, home refinance lending increased in moderate-income and MUI geographies. However, the increases were much greater for MUI areas. In total, the bank reported 217 percent more home refinance loans in the Los Angeles MD during the current evaluation period (from 2,438 loans to 7,738 loans). In assessing the lower proportion of lending in LMI areas, we considered foreclosure concentrations in the AA and documented studies showing foreclosures lead to lower property values in their immediate vicinity. According to a 2011 report by the Center for Responsible Lending, low-income neighborhoods in the Los Angeles MD have a completed foreclosure rate that is 1.4 times higher than the area’s overall rate. The completed foreclosure rate in moderate-income neighborhoods is 1.2 times higher. Foreclosure concentrations intensify housing value declines, making it even more challenging for homeowners in affected neighborhoods to refinance their homes. Multifamily Loans The geographic distribution of multifamily loans reported in the Los Angeles AA is excellent. Bank performance exceeds the demographic comparator in both low- and moderate-income geographies. In addition, the bank’s market share of multifamily loans in both low- and moderate-income geographies exceeds its overall product share.

Charter Number: 24
51
Small Loans to Businesses The geographic distribution of business loans reported in the Los Angeles AA is excellent. Bank performance exceeds the demographic comparator in both low- and moderate-income geographies. The bank’s market share of business loans in both low- and moderate-income geographies exceeds its overall product share. Lending Gap Analysis Our geographic distribution analysis included a review for lending gaps, particularly in LMI areas. We did not identify any unexplained lending gaps in the Los Angeles AA. Distribution of Loans by Income Level of the Borrower The overall borrower distribution of loans in the Los Angeles AA is good, as evidenced by an adequate distribution of home mortgage loans and an excellent distribution of small loans to businesses. Home Mortgage Loans The overall borrower distribution of home mortgage loans reported in the Los Angeles AA is adequate. Our assessment gives the most weight to home refinance loans, as this product accounts for 69 percent of the bank’s home mortgage loans in this AA (by number). Adequate performance for this product was offset by poor performance for home purchase. The borrower distribution of home purchase loans is poor, with consideration for the area’s high cost of housing and shortage of affordable housing stock. Bank performance is significantly below the demographic comparators for both low- and moderate-income borrowers. In addition, the bank’s market share of home purchase loans to both low- and moderate-income borrowers is significantly below its overall product share. The borrower distribution of home improvement loans is good. Bank performance is lower than the demographic comparator for low-income borrowers (with consideration for poverty), and performance is somewhat lower than the demographic comparator for moderate-income borrowers. The bank’s market share of home improvement loans to both low- and moderate-income borrowers exceeds its overall product share. The borrower distribution of home refinance loans is adequate. Bank performance is significantly lower than the demographic comparator for low-income borrowers, and performance is lower than the demographic comparator for moderate-income borrowers. The bank’s market share of home refinance loans to low-income borrowers is near, and to moderate-income borrowers exceeds, its overall product share.

Charter Number: 24
52
Small Loans to Businesses The distribution of loans to businesses of different sizes in the Los Angeles AA is excellent. Although the percentage of loans to small businesses (i.e., those with gross annual revenues of $1 million or less) is near the demographic comparator, the bank’s market share of loans to small businesses exceeds its overall product share. As explained in the Description of Evaluation section, we emphasized market share performance in our performance conclusion for this market. A majority of the bank’s reported business loans are small business credit cards, for which the bank does not typically collect or use revenue information. This market has robust CRA data with at least 166 reporters, including the top 21 local banks (ranked by deposits) with an aggregate deposit market share of 89 percent. The bank’s market share of loans to small businesses consistently exceeds its overall product share in each of the three years covered by the evaluation period. Community Development Lending CD lending has a significantly positive impact and elevates overall lending performance. The bank made 62 CD loans totaling $412 million during the review period. By dollar volume, 25 percent of these loans provided affordable housing for LMI residents, 24 percent provided community services for LMI individuals, and 51 percent provided economic development. These loans created or rehabilitated 992 affordable housing units. This level of CD lending represents 37 percent of allocated Tier 1 Capital. CD loans include the following examples, which demonstrate responsiveness to identified needs small business financing, affordable rental housing, and funding for nonprofit organizations:
- A $2.0 million term loan to an organization that provides micro loans throughout the greater Los Angeles area and Inland Empire. Funding will provide working capital and equipment loans to small businesses and merchants ranging from $5,000 to $35,000 with a cap of $50,000.
- A $10.0 million unsecured revolving line of credit to bridge timing differences between investment maturities and funds required for working capital for a nonprofit charitable corporation that provides accessible healthcare for uninsured and low-income working individuals and families residing in Los Angeles County. To qualify for services, clients must have no insurance, not qualify for any governmental health program and earn a household income of less than 200 percent of the Federal Poverty Level.
- A $21.0 million construction to permanent loan financing the acquisition and rehabilitation of a 132-unit multi-family LIHTC project. All units, subsidized through a Section 8 contract, are affordable to tenants earning 60 percent or less of area median income.
- Three participation loans in the California Community Reinvestment Corporation bond pool facility totaling approximately $400,000 to finance affordable housing projects. Member banks receive a pro-rata share of the pool at the time of funding. The three credit facilities financed 185 affordable housing units.
Product Innovation and Flexibility Product innovation and flexibility have a neutral impact on lending performance.
Charter Number: 24
53
ConclusionsforAreasReceivingLimited‐ScopeReviews Lending performance is excellent and not inconsistent with the California Outstanding Lending Test rating in the Chico, Oakland-Fremont-Haywood, Redding, Riverside-San Bernardino-Ontario, Sacramento-Arden Arcade-Roseville, San Diego-Carlsbad-San Marcos, San Francisco- San Mateo-Redwood City, San Jose-Sunnyvale-Santa Clara, Santa Cruz-Watsonville, Santa Rosa-Petaluma, and the nonmetropolitan AAs. Lending performance in the other limited-scope areas is weaker than the California Outstanding Lending Test rating, but still considered good. Weaker performance is attributable to less favorable CD lending (Modesto, Napa, San Luis Obispo-Paso Robles, Santa Ana-Anaheim-Irvine, Vallejo-Fairfield, and Yuba City-Marysville AAs), less favorable borrower and geographic distributions (Bakersfield-Delano, Oxnard-Thousand Oaks-Ventura, Salinas, and Santa Barbara-Santa Maria-Goleta AAs), and less favorable geographic distributions (Stockton AAs). Performance differences in the limited-scope AAs did not impact the Lending Test rating for the state of California. INVESTMENT TEST Investment Test performance in the state of California is rated Outstanding. Bank performance in the full-scope Los Angeles AA is excellent. Performance in the limited-scope AAs did not impact the rating. ConclusionsforAreasReceivingFull‐ScopeReviews Bank performance in the Los Angeles AA is excellent in relation to bank capacity, identified needs, and available opportunities. The bank made 653 investments totaling $156 million during the evaluation period. Current period investments include 220 LIHTCs totaling $65 million, 17 NMTCs totaling $45 million, six mortgage bonds totaling $20 million, 39 MBSs totaling $15 million, a $4 million bond, 12 equity investments totaling $2 million, three HTCs totaling $1 million, three blind fund investments totaling $907 thousand, and $4 million qualified grants and in-kind donations. The bank also has 33 prior period investments with an aggregate outstanding balance of $26 million. Total investments represent 17 percent of allocated Tier 1 Capital. Most current period investments (64 percent by dollar volume) and prior period investments are responsive to affordable housing needs. Another 18 percent of current period investments address revitalization and stabilization needs. Investments include the following examples:
- Four NMTC investments totaling $13 million to complete a transit- and pedestrian-oriented commercial and retail development in a historically blighted area. The project is part of a larger redevelopment effort that will create approximately 100 jobs.
- A $3.8 million NMTC investment to redevelop a property located in a distressed neighborhood into useful retail space. The project will create up to 65 new full-time jobs.
- A $12 million NMTC investment to acquire a permanent facility for a public charter school located in Los Angeles. The project is located in a moderate-income and high poverty area.

Charter Number: 24
54
Conclusions for Areas Receiving Limited-Scope Reviews Investment performance is excellent in all limited-scope areas and not inconsistent with the California Outstanding Investment Test rating (Bakersfield-Delano, Chico, Modesto, Napa, Oakland-Fremont-Haywood, Oxnard-Thousand Oaks-Ventura, Redding, Riverside- San Bernardino-Ontario, Sacramento-Arden Arcade-Roseville, Salinas, San Diego-Carlsbad-San Marcos, San Francisco-San Mateo-Redwood City, San Jose-Sunnyvale-Santa Clara, San Luis Obispo-Paso Robles, Santa Ana-Anaheim-Irvine, Santa Barbara-Santa Maria-Goleta, Santa Cruz-Watsonville, Santa Rosa-Petaluma, Stockton, Vallejo-Fairfield, Yuba City-Marysville, and the nonmetropolitan AAs). SERVICE TEST Service Test performance in the state of California is rated High Satisfactory. Based on a full-scope review, performance in the Los Angeles AA is good as evidenced by accessible retail delivery systems and an excellent level of CD services. Performance differences in the limited-scope AAs did not impact the rating. Conclusions for Areas Receiving Full-Scope Reviews Retail Banking Services Retail delivery systems are accessible to geographies and individuals of different income levels in the Los Angeles AA, with consideration of branches in MUI geographies that are in close proximity to LMI geographies. There are four branches in low-income geographies and 25 branches in moderate-income geographies. The percentage of branches in low-income tracts is well below, and the percentage of branches in moderate-income census tracts is below, the percentage of the population residing in each area. However, we also considered numerous MUI branches in close proximity to LMI geographies (directly across the street or within a few blocks), which improve access to both low- and moderate-income areas. Our assessment gives slightly more weight to performance in moderate-income areas as they are nearly four times more populated than low-income areas. Branching activity has not generally affected access to banking services. The bank opened seven branches and closed ten branches over the evaluation period. There were four net closures in middle-income geographies and one net branch opening in a moderate-income geography. Branch services and hours are tailored to the convenience and needs of the AA.
Charter Number: 24
55
Community Development Services USB is a leader in providing CD services in the Los Angeles AA, with more than 260 service activities involving 108 different organizations. Strong leadership is evident through 82 service activities involving Board or committee participation. Activities address a wide variety of CD initiatives and are particularly responsive to financial education needs. Bank staff provided 130 financial education programs to nearly 3,500 individuals, including first-time homebuyers, homeowners in default, small businesses, and youth. USB also maintains an Individual Development Account program with a community partner. Conclusions for Areas Receiving Limited-Scope Reviews Service performance is good and not inconsistent with the California High Satisfactory Service Test rating in the Riverside-San Bernardino-Ontario and Santa Barbara-Santa Maria-Goleta AAs. Service performance is excellent and stronger than the California High Satisfactory Service Test rating in the Chico, Napa, Redding, Salinas, San Diego-Carlsbad-San Marcos, San Luis Obispo-Paso Robles, Santa Rosa-Petaluma, Vallejo-Fairfield, Yuba City-Marysville, and nonmetropolitan AAs. Service performance is adequate, but weaker than the California High Satisfactory Service Test rating in the Bakersfield, Modesto, Oakland-Fremont-Haywood, Sacramento-Arden Arcade-Roseville, San Francisco-San Mateo-Redwood City, Santa Ana-Anaheim-Irvine, Santa Cruz-Watsonville, and Stockton AAs. Service performance in the remaining AAs is weaker than the California High Satisfactory Service Test rating and considered poor (Oxnard-Thousand Oaks-Ventura AA) or very poor (San Jose-Sunnyvale- Santa Clara AA). Stronger (or weaker) performance is attributable to more accessible (or less accessible) retail delivery systems. Performance differences in the limited-scope AAs did not impact the Service Test rating for the state of California. Refer to Tables 1-15 in the state of California section of Appendix D for the facts and data supporting performance conclusions under the Lending, Investment, and Service Tests.
Charter Number: 24
56
State of Colorado Rating CRA Rating for the State: Outstanding
The Lending Test is rated: Outstanding The Investment Test is rated: Outstanding The Service Test is rated: Outstanding
The major factors that support this rating include:
Excellent lending performance in the full-scope area based on excellent overall borrower distributions, good overall geographic distributions, and an excellent level of lending activity. CD lending has a significantly positive impact and further supports lending performance.
Excellent investment performance in the full-scope area based on investment volume and responsiveness to affordable housing and revitalization/stabilization needs.
Excellent service performance in the full-scope area based on readily accessible retail delivery systems and a relatively high level of CD services. Services include numerous leadership activities and are particularly responsive to financial education needs.
Performance differences in the limited-scope AAs did not impact state ratings. Description of Institution’s Operations in the State of Colorado The state of Colorado is the bank’s seventh largest rated area (of 39), in terms of deposits. It accounts for $8.3 billion (4.2 percent) of bank deposits, 150 (5 percent) of bank branches, 237 (5 percent) of bank ATMs, and 70,695 (6 percent) of bank-reported loans inside its AAs during the evaluation period. USB has 10 AAs in this rated area, seven of which are metropolitan areas. The three nonmetropolitan AAs are combined for analysis and presentation. Refer to Appendix A for a detailed listing of bank AAs. Scope of Evaluation in the State of Colorado We performed a full-scope review of the Denver AA, which includes six (of 10) counties in the Denver-Aurora MSA. Other AAs received limited-scope reviews. State ratings are based primarily on performance in the full-scope area. The Denver AA is the bank’s largest AA in this rated area. It accounts for $6.2 billion (75 percent) of rated area deposits, 79 (53 percent) of rated area branches, 138 (58 percent) of rated area ATMs, and 42,313 (60 percent) of rated area loans. Of the bank’s reported loans in the Denver AA, 50 percent are home mortgage loans and 50 percent are business loans. There are insufficient multifamily loans for meaningful analysis. In addition, farm lending is limited and not included in our lending distribution analyses. Refer to Appendix C for detailed demographics, community contact results, and other performance context information specific to the Denver AA.

Charter Number: 24
57
LENDING TEST Lending Test performance in the state of Colorado is rated Outstanding. Bank performance in the full-scope Denver AA is excellent based on excellent borrower distributions, good geographic distributions, an excellent level of lending activity, and the significantly positive impact of CD lending that further supports lending performance. Performance differences in the limited-scope AAs did not impact the rating. ConclusionsforAreasReceivingFull‐ScopeReviews Lending Activity Lending levels in the Denver AA reflect excellent responsiveness to area credit needs in relation to deposits and the competitive banking environment. USB has the fourth most area deposits of 71 banks as of June 30, 2011 ($6.2 billion, 11 percent market share). USB reported $5.5 billion in home mortgage and business loans in this AA over the evaluation period. The bank also originated $158 million in CD loans specific to the AA. Of all home mortgage loans reported in the Denver AA for the year 2011, USB ranks seventh in home purchase loans, fourth in home improvement loans, and fifth in home refinance loans (by both number and dollar volume). While home mortgage lending market shares are lower than the bank’s deposit market share, this is a competitive market with more than 455 home loan reporters. USB ranks fourth in the number of small business loans (third by dollar volume), and its business loan market share is the same as its deposit market share. Distribution of Loans by Income Level of the Geography The overall geographic distribution of loans in the Denver AA is good, as evidenced by an adequate distribution of home mortgage loans, an excellent distribution of small loans to businesses, and no unexplained lending gaps. Home Mortgage Loans The geographic distribution of home mortgage loans reported in the Denver AA is adequate for all product types. Our assessment gives more weight to performance in moderate-income geographies as they contain substantially more owner-occupied housing units. The geographic distribution of home purchase loans is adequate. Bank performance exceeds the demographic comparator in low-income geographies, and performance is somewhat lower than the demographic comparator in moderate-income geographies. The bank’s market share of home purchase loans in low-income geographies is somewhat lower than, and in moderate-income geographies is near, its overall product share.
Charter Number: 24
58
The geographic distribution of home improvement loans is adequate. Bank performance is somewhat lower than the demographic comparator in both low- and moderate-income geographies. The bank’s market share of home improvement loans in low-income geographies is lower than, and in moderate-income geographies exceeds, its overall product share. The geographic distribution of home refinance loans is adequate. Bank performance is somewhat lower than the demographic comparator in low-income geographies, and performance is significantly lower than the demographic comparator in moderate-income geographies. The bank’s market share of home refinance loans in low-income geographies exceeds, and in moderate-income geographies is near, its overall product share. Small Loans to Businesses The geographic distribution of business loans reported in the Denver AA is excellent. Bank performance exceeds the demographic comparator in both low- and moderate-income geographies. The bank’s market share of business loans in both low- and moderate-income geographies equals/exceeds its overall product share. Lending Gap Analysis Our geographic distribution analysis included a review for lending gaps, particularly in LMI areas. We did not identify any unexplained lending gaps in the Denver AA. Distribution of Loans by Income Level of the Borrower The overall borrower distribution of loans in the Denver AA is excellent, as evidenced by a good distribution of home mortgage loans and an excellent distribution of small loans to businesses. Home Mortgage Loans The overall borrower distribution of home mortgage loans reported in the Denver AA is good. Our assessment gives the most weight to home refinance loans, as this product accounts for 70 percent of the bank’s home mortgage loans in this AA (by number). The borrower distribution of home purchase loans is excellent. Bank performance essentially equals the demographic comparator for low-income borrowers (with consideration for poverty), and performance exceeds the demographic comparator for moderate-income borrowers. The bank’s market share of home purchase loans to low-income borrowers exceeds, and to moderate-income borrowers is somewhat lower than, its overall product share. The borrower distribution of home improvement loans is excellent. Bank performance is essentially equal to the demographic comparator for low-income borrowers (with consideration for poverty), and performance exceeds the demographic comparator for moderate-income borrowers. The bank’s market share of home improvement loans to low-income borrowers exceeds, and to moderate-income borrowers is near, its overall product share.
Charter Number: 24
59
The borrower distribution of home refinance loans is good. Bank performance is somewhat lower than the demographic comparator for low-income borrowers (with consideration for poverty), and performance is near the demographic comparator for moderate-income borrowers. The bank’s market share of home refinance loans to both low- and moderate-income borrowers exceeds its overall product share. Small Loans to Businesses The distribution of loans to businesses of different sizes in the Denver AA is excellent. Although the percentage of loans to small businesses (i.e., those with gross annual revenues of $1 million or less) is near the demographic comparator, the bank’s market share of loans to small businesses exceeds its overall product share. As explained in the Description of Evaluation section, we emphasized market share performance in our performance conclusion for this market. A majority of the bank’s reported business loans are small business credit cards, for which the bank does not typically collect or use revenue information. This market has robust CRA data with at least 143 reporters, including the top 12 local banks (ranked by deposits) with an aggregate deposit market share of 83 percent. The bank’s market share of loans to small businesses consistently exceeds its overall product share in each of the three years covered by the evaluation period. Community Development Lending CD lending has a significantly positive impact and further supports lending performance. The bank made 28 CD loans totaling $158 million during the review period. By dollar volume, 50 percent of these loans provided affordable housing for LMI residents, 49 percent provided economic development, and 1 percent provided community services for LMI individuals. These loans created or rehabilitated 459 affordable housing units. This level of CD lending represents 20 percent of allocated Tier 1 Capital. CD loans include the following examples, which demonstrate responsiveness to identified needs for affordable rental housing stock and working capital loans for nonprofit organizations:
- A $10.0 million construction to permanent loan to build a 92-unit LIHTC affordable housing project in a portion of the Stapleton Redevelopment area in East Denver. The project’s rents will target families at 30, 40 and 50 percent of area median income with 46 units reserved for women and families considered chronically homeless.
- A $2.0 million operating line of credit (renewed in 2009, 2010, and 2011) for an area organization whose mission is to work to prevent homelessness and create lasting solutions for homeless and at-risk families, children and individuals. The organization’s primarily focus is on housing, support services and medical attention for the homeless in the Denver metro area.
- An $8.2 million construction to permanent loan for a 62-unit LIHTC apartment project in Denver. All units are affordable to senior households earning equal to or less than 60 percent of the area median income. Fifty percent of the units will be restricted to senior households earning 50 percent or less than area median income and 40 percent of the units will be restricted to senior households earning equal to or less than 40 percent of area median income.

Charter Number: 24
60
Product Innovation and Flexibility Product innovation and flexibility have a neutral impact on lending performance. Conclusions for Areas Receiving Limited-Scope Reviews Lending performance is excellent and not inconsistent with the Colorado Outstanding Lending Test rating in the Boulder, Colorado Springs, Grand Junction, and Pueblo AAs. Lending performance in the other limited-scope areas is weaker than the Colorado Outstanding Lending Test rating, but still considered good (Fort Collins-Loveland and nonmetropolitan AAs) or adequate (Greely AA). Weaker performance is attributable to less favorable CD lending (Fort Collins-Loveland and Greely AAs), as well as less favorable borrower and geographic distributions (Greely and nonmetropolitan AAs). Performance differences in the limited-scope AAs did not impact the Lending Test rating for the state of Colorado. INVESTMENT TEST Investment Test performance in the state of Colorado is rated Outstanding. Bank performance in the full-scope Denver AA is excellent. Performance in the limited-scope AAs did not impact the rating. Conclusions for Areas Receiving Full-Scope Reviews Bank performance in the Denver AA is excellent in relation to bank capacity, identified needs, and available opportunities. The bank made 343 investments totaling $88 million during the evaluation period. Current period investments include 212 LIHTCs totaling $71 million, two NMTCs totaling $14 million, a $1 million equity investment, and $2 million grants and in-kind donations. The bank also has 23 prior period investments with an aggregate outstanding balance of $17 million. Total investments represent 13 percent of allocated Tier 1 Capital. Most current period investments (82 percent by dollar volume) and prior period investments are responsive to affordable housing needs. Another 16 percent of current period investments address revitalization and stabilization needs. Investments include the following examples:
- An $8 million LIHTC for the construction of a mixed-use supportive housing development in downtown Denver. The project includes 16 apartments for homeless individuals, 82 apartments for people earning less than 60 percent of the area’s median income, and a job-training center in the attached retail space.
- An $11 million NMTC investment to develop a 153-unit hotel in a low-income area. The project is the first phase of a master development plan that is projected to create 100 jobs.
- A $3 million NMTC to install and operate energy efficient systems on the roofs of public buildings located in distressed low-income areas. The project will create 230 new jobs and will provide benefit to the host at each site, the AA, and a broader statewide area.

Charter Number: 24
61
Conclusions for Areas Receiving Limited-Scope Reviews Investment performance is excellent in most limited-scope areas and not inconsistent with the Colorado Outstanding Investment Test rating (Boulder, Fort Collins-Loveland, Grand Junction, Greeley, Pueblo, and nonmetropolitan AAs). Investment performance in the Colorado Springs AA is weaker than the Colorado Outstanding Investment Test rating, but still considered good. Weaker performance is attributable to a lower relative investment volume. This performance difference did not impact the Investment Test rating for the state of Colorado. SERVICE TEST Service Test performance in the state of Colorado is rated Outstanding. Based on a full-scope review, performance in the Denver AA is excellent as evidenced by readily accessible retail delivery systems and a relatively high level of CD services. Performance differences in the limited-scope AAs did not impact the rating. Conclusions for Areas Receiving Full-Scope Reviews Retail Banking Services Retail delivery systems are readily accessible to geographies and individuals of different income levels in the Denver AA, with consideration of branches in MUI geographies that are in close proximity to LMI geographies. There are three branches in low-income geographies and 16 branches in moderate-income geographies. The percentage of branches in both low- and moderate-income tracts is near the percentage of the population residing in each area. However, we also considered numerous MUI branches in close proximity to LMI geographies (directly across the street or within a few blocks), which improve access to both low- and moderate-income areas. Access is also supported by a good distribution of ATMs. The bank improved retail accessibility by opening two branches during the evaluation period, including one branch in a low-income area. There were no branch closures during the evaluation period. Branch services and hours are tailored to the convenience and needs of the AA. Community Development Services USB provided a relatively high level of CD services in the Denver AA, with more than 280 service activities involving 66 different organizations. Leadership is evident through 49 activities involving Board or committee participation. Activities address a wide variety of CD initiatives and are most responsive to financial education needs. Bank staff provided 277 financial education programs to more than 6,700 individuals, including first-time homebuyers, small businesses, and youth.
Charter Number: 24
62
Conclusions for Areas Receiving Limited-Scope Reviews Service performance is excellent and not inconsistent with the Colorado Outstanding Service Test rating in the Boulder, Fort Collins-Loveland, and Grand Junction AAs. Service performance in the remaining AAs is weaker than the Colorado Outstanding Service Test rating and considered good (Colorado Springs and nonmetropolitan AAs), adequate (Pueblo AA), or very poor (Greeley AA). Weaker performance is attributable to less accessible retail delivery systems. Performance differences in the limited-scope AAs did not impact the Service Test Rating for the state of Colorado. Refer to Tables 1-15 in the state of Colorado section of Appendix D for the facts and data supporting performance conclusions under the Lending, Investment, and Service Tests.

Charter Number: 24
63
State of Washington Rating CRA Rating for the State: Outstanding
The Lending Test is rated: Outstanding The Investment Test is rated: Outstanding The Service Test is rated: Outstanding
The major factors that support this rating include:
Excellent lending performance in the full-scope area based on good overall borrower distributions, excellent overall geographic distributions, and an excellent level of lending activity. CD lending has a significantly positive impact and further supports lending performance.
Excellent investment performance in the full-scope area based on investment volume and responsiveness to revitalization and affordable housing needs.
Excellent service performance in the full-scope area based on readily accessible retail delivery systems and a relatively high level of CD services.
Performance differences in the limited-scope AAs did not impact state ratings. Description of Institution’s Operations in the State of Washington The state of Washington is the bank’s sixth largest rated area (of 39), in terms of deposits. It accounts for $10.2 billion (5.2 percent) of bank deposits, 167 (5 percent) of bank branches, 333 (7 percent) of bank ATMs, and 72,102 (7 percent) of bank-reported loans inside its AAs during the evaluation period. USB has 15 AAs in this rated area, 11 of which are metropolitan areas. The four nonmetropolitan AAs are combined for analysis and presentation. Refer to Appendix A for a detailed listing of bank AAs. Scope of Evaluation in the State of Washington We performed a full-scope review of the Seattle AA, which is comprised of the entire Seattle-Bellevue-Everett MD. Other AAs received limited-scope reviews. State ratings are based primarily on performance in the full-scope area. The Seattle AA is the bank’s largest AA in this rated area. It accounts for $6.9 billion (68 percent) of rated area deposits, 66 (40 percent) of rated area branches, 169 (51 percent) of rated area ATMs, and 36,036 (50 percent) of rated area loans. Of the bank’s reported loans in the Seattle AA, 59 percent are business loans and 41 percent are home mortgage loans. There are insufficient farm loans for meaningful analysis. Refer to Appendix C for detailed demographics, community contact results, and other performance context information specific to the Seattle AA.

Charter Number: 24
64
LENDING TEST Lending Test performance in the state of Washington is rated Outstanding. Bank performance in the full-scope Seattle AA is excellent based on good borrower distributions, excellent geographic distributions, an excellent level of lending activity, and the significantly positive impact of CD lending that further supports lending performance. Performance differences in the limited-scope AAs did not impact the rating. Conclusions for Areas Receiving Full-Scope Reviews Lending Activity Lending levels in the Seattle AA reflect excellent responsiveness to area credit needs in relation to deposits and the competitive banking environment. USB has the third most area deposits of 58 banks as of June 30, 2011 ($7 billion, 11 percent market share). USB reported $5.4 billion in home mortgage and business loans in this AA over the evaluation period. The bank also originated $170 million in CD loans specific to the AA. Of all home mortgage loans reported in the Seattle AA for the year 2011, USB ranks 13th in the number of home purchase loans (eighth by dollar volume), fifth in home improvement loans (both number and dollar volume), and fifth in the number of home refinance loans (fourth by dollar volume). While home mortgage lending market shares are lower than the bank’s deposit market share, this is a competitive market with more than 400 home loan reporters. In addition, USB ranks third in the number of small business loans (second by dollar volume), and its business loan market share exceeds its deposit market share. Distribution of Loans by Income Level of the Geography The overall geographic distribution of loans in the Seattle AA is excellent, as evidenced by a good distribution of home mortgage and multifamily loans, an excellent distribution of small loans to businesses, and no unexplained lending gaps. Our assessment weights small business loans more than home mortgage loans, as they respectively account for 59 percent and 41 percent of the bank’s reported loans in this AA (by number).

Charter Number: 24
65
Home Mortgage Loans The geographic distribution of home mortgage loans reported in the Seattle AA is good for all product types. Our assessment gives more weight to performance in moderate-income geographies as they contain substantially more owner-occupied housing units. The geographic distribution of home purchase loans is good. Bank performance exceeds the demographic comparator in low-income geographies, and performance is near the demographic comparator in moderate-income geographies. The bank’s market share of home purchase loans in low-income geographies exceeds, and in moderate-income geographies is somewhat lower than, its overall product share. The geographic distribution of home improvement loans is good. Bank performance exceeds the demographic comparator in low-income geographies, and performance is lower than the demographic comparator in moderate-income geographies. The bank’s market share of home improvement loans in both low- and moderate-income geographies exceeds its overall product share. The geographic distribution of home refinance loans is good. Bank performance exceeds the demographic comparator for low-income geographies, and performance is somewhat lower than the demographic comparator for moderate-income geographies. The bank’s market share of home refinance loans in low-income geographies is lower than, and in moderate-income geographies is near, its overall product share. Multifamily Loans The geographic distribution of multifamily loans reported in the Seattle AA is good. Bank performance is significantly lower than the demographic comparator in low-income geographies, and performance exceeds the demographic comparator in moderate-income geographies. The bank’s market share of multifamily loans in low-income geographies is somewhat lower than, and in moderate-income geographies exceeds, its overall product share. Our assessment gives more weight to performance in moderate-income geographies as they contain substantially more multifamily housing units. Small Loans to Businesses The geographic distribution of business loans reported in the Seattle AA is excellent. Bank performance exceeds the demographic comparator in both low- and moderate-income geographies. The bank’s market share of business loans in low-income geographies is near, and in moderate-income geographies exceeds, its overall product share. Lending Gap Analysis Our geographic distribution analysis included a review for lending gaps, particularly in LMI areas. We did not identify any unexplained lending gaps in the Seattle AA.
Charter Number: 24
66
Distribution of Loans by Income Level of the Borrower The overall borrower distribution of loans in the Seattle AA is good, as evidenced by good distributions of home mortgage loans and small loans to businesses. Home Mortgage Loans The overall borrower distribution of home mortgage loans reported in the Seattle AA is good. Our assessment gives the most weight to home refinance and home purchase loans, as these products collectively account for 98 percent of the bank’s home mortgage loans in this AA (by number). The borrower distribution of home purchase loans is good. Bank performance is somewhat lower than the demographic comparator for low-income borrowers (with consideration for poverty and the relatively high cost of housing), and performance exceeds the demographic comparator for moderate-income borrowers. The bank’s market share of home purchase loans to low-income borrowers is somewhat lower, and to moderate-income borrowers is lower, than its overall product share. The borrower distribution of home improvement loans is excellent. Bank performance essentially equals the demographic comparator for low-income borrowers (with consideration for poverty), and performance is near the demographic comparator for moderate-income borrowers. The bank’s market share of home improvement loans to both low- and moderate-income borrowers exceeds its overall product share. The borrower distribution of home refinance loans is good. Bank performance is somewhat lower than the demographic comparator for low-income borrowers (with consideration for poverty), and performance is near the demographic comparator for moderate-income borrowers. The bank’s market share of home refinance loans to both low- and moderate-income borrowers exceeds its overall product share. Small Loans to Businesses The distribution of loans to businesses of different sizes in the Seattle AA is good. The percentage of loans to small businesses (i.e., those with gross annual revenues of $1 million or less) is somewhat lower than the demographic comparator, and the bank’s market share of loans to small businesses exceeds its overall product share.

Charter Number: 24
67
Community Development Lending CD lending has a significantly positive impact and further supports lending performance. The bank made 53 CD loans totaling $170 million during the review period. By dollar volume, 39 percent of these loans provided affordable housing for LMI residents, 39 percent provided economic development, and 22 percent provided community services for LMI individuals. These loans created or rehabilitated 1,201 affordable housing units. This level of CD lending represents 19 percent of allocated Tier 1 Capital. CD loans include the following examples, which demonstrate responsiveness to identified needs for small business financing, affordable rental housing stock, and community services for homeless individuals.
- A $1.1 million term loan to a manufacturer to purchase two pieces of equipment to expand the business and fulfill new contracts. The financing for this small business resulted in the creation of eight jobs in a low-income census tract.
- A $7.3 million loan to finance the construction of a 61-unit multi-family housing LIHTC project for formerly homeless low-income seniors. Of the 61 units, 60 are affordable to tenants earning 60 percent or less of area median income. Forty-five of those units are restricted to tenants earning 40 percent or less of area median income.
- A $200,000 operating line of credit to support ongoing working capital needs for an area nonprofit organization providing job training and placement program for homeless and disadvantaged individuals in the Seattle area. The line was renewed and increased in 2010 to $500,000, and again in 2011.
- Eight permanent loans totaling nearly $795,000 made through the Washington Community Reinvestment Association, a bank consortium designed to finance affordable housing projects. These eight projects created 380 housing units all of which are affordable to tenants earning 60 percent or less than area median income. Several projects have further income restrictions some as low as 30 percent of area median income. Additionally, several of these projects target certain groups including the formerly homeless and veterans.
In addition to these AA-specific loans, the bank made 13 CD loans totaling $41 million that provided statewide benefit. Product Innovation and Flexibility Product innovation and flexibility have a neutral impact on lending performance. USB originated six loans totaling $22 million through the Private Placement Bond Program to support affordable housing in the AA. The bank is also an active participant in the Washington State Linked Deposit Program, a program that links state deposits at below-market interest rates to loans for qualified minority- and women-owned businesses. During the review period, the bank originated 98 loans totaling $38.5 million throughout the state under this program.
Charter Number: 24
68
Conclusions for Areas Receiving Limited-Scope Reviews Lending performance is excellent and not inconsistent with the Washington Outstanding Lending Test rating in the Bellingham, Bremerton-Silverdale, Kennewick-Pasco-Richland, Mount Vernon-Anacortes, Olympia, Spokane, Tacoma, Yakima, and nonmetropolitan AAs. Lending performance in the other limited-scope areas is weaker than the Washington Outstanding Lending Test rating, but still considered good (Longview AA) or adequate (Wenatchee AA). Weaker performance is attributable to less favorable CD lending and geographic distributions (all), and less favorable borrower distributions (Wenatchee AA). Performance differences in the limited-scope AAs did not impact the Lending Test rating for the state of Washington. INVESTMENT TEST Investment Test performance in the state of Washington is rated Outstanding. Bank performance in the full-scope Seattle AA is excellent. Performance in the limited-scope AAs did not impact the rating. Conclusions for Areas Receiving Full-Scope Reviews Bank performance in the Seattle AA is excellent in relation to bank capacity, identified needs, and available opportunities. The bank made 409 investments totaling $154 million during the evaluation period. Current period investments include 21 NMTCs totaling $121 million, 232 LIHTCs totaling $31 million, five HTCs totaling $1 million, and $1 million grants and in-kind donations. The bank also has 72 prior period investments with an aggregate outstanding balance of $27 million. Total investments represent 21 percent of allocated Tier 1 Capital. Most current period investments (99 percent by dollar volume) and prior period investments are responsive to revitalization and affordable housing needs. Investments include the following examples:
- Four NMTC investments totaling more than $50 million to renovate a nine-acre historic district in downtown Seattle, which is home to 250 small owner-operated businesses, 100 seasonal farmers, and 200 arts and craft vendors.
- A $1.4 million NMTC investment to double the research facilities of a hospital, located in a targeted moderate-income area. The project is expected to support 246 permanent skilled jobs of varying types.
- A $3 million NMTC investment to acquire and renovate a support facility for individuals dealing with homelessness, addictions, and mental health challenges. The facility is located in a moderate-income area.
- A $3 million NMTC investment to construct new commercial retail/office space in a low-income area. The project is expected to create 60 new jobs.

Charter Number: 24
69
Conclusions for Areas Receiving Limited-Scope Reviews Investment performance is excellent in most limited-scope areas and not inconsistent with the Washington Outstanding Investment Test rating (Bellingham, Bremerton-Silverdale, Kennewick-Richland-Pasco, Mount Vernon-Anacortes, Olympia, Spokane, Tacoma, Yakima, and the nonmetropolitan AAs). Investment performance in the other limited-scope area is weaker than the Washington Outstanding Investment Test rating, but still considered good (Longview and Wenatchee AAs). Weaker performance is attributable to a lower relative investment volumes. Performance differences in the limited-scope AAs did not impact the Investment Test rating for the state of Washington. SERVICE TEST Service Test performance in the state of Washington is rated Outstanding. Based on a full-scope review, performance in the Seattle AA is excellent as evidenced by readily accessible retail delivery systems and a relatively high level of CD services. Performance differences in the limited-scope AAs did not impact the rating. Conclusions for Areas Receiving Full-Scope Reviews Retail Banking Services Retail delivery systems are readily accessible to geographies and individuals of different income levels in the Seattle AA. There are three branches in low-income geographies and 17 branches in moderate-income geographies. The percentage of branches in both low- and moderate-income tracts exceeds the percentage of the population residing in each area. Access is also supported by an excellent distribution of ATMs. Branching activity during the evaluation period has not affected access to banking services. The bank opened two branches in middle-income geographies. It also closed one branch in a moderate-income area, temporarily relocating it to a nearby low-income area due to construction. The branch will re-open in its original location once construction is complete. We did not identify any branch differences in product availability, services offered, or business hours that inconvenience LMI geographies or individuals. Community Development Services USB provided a relatively high level of CD services in the Seattle AA, with more than 135 service activities involving 52 different organizations. Leadership is evident through 38 activities involving Board or committee participation. Activities address a wide variety of CD initiatives and are most responsive to financial education needs. Bank staff provided 92 financial education programs to more than 2,400 individuals, including first-time homebuyers, small businesses, and youth. USB also maintains five Individual Development Account program relationships with community partners.

Charter Number: 24
70
Conclusions for Areas Receiving Limited-Scope Reviews Service performance is excellent and not inconsistent with the Washington Outstanding Service Test rating in the Kennewick-Pasco-Richland, Mount Vernon-Anacortes, Olympia, Spokane, Tacoma, and nonmetropolitan AAs. Service performance in the remaining AAs is weaker than the Washington Outstanding Service Test rating, but considered good (Bremerton-Silverdale AA) or adequate (Bellingham, Longview, Wenatchee, and Yakima AAs). Weaker performance is attributable to less accessible retail delivery systems. Performance differences in the limited-scope AAs did not impact the Service Test Rating for the state of Washington. Refer to Tables 1-15 in the state of Washington section of Appendix D for the facts and data supporting performance conclusions under the Lending, Investment, and Service Tests.

Charter Number: 24
71
State of Wisconsin Rating CRA Rating for the State: Outstanding
The Lending Test is rated: Outstanding The Investment Test is rated: Outstanding The Service Test is rated: Outstanding
The major factors that support this rating include:
Excellent lending performance in the full-scope area based on good overall borrower distributions, adequate overall geographic distributions, an good level of lending activity, and the significantly positive impact of CD lending, which elevates overall lending performance.
Excellent investment performance in the full-scope area based on investment volume and responsiveness to revitalization and affordable housing needs.
Excellent service performance in the full-scope area based on readily accessible retail delivery systems and a relatively high level of CD services. Services include numerous leadership activities and are particularly responsive to financial education needs.
Performance differences in the limited-scope AAs did not impact state ratings. Description of Institution’s Operations in the State of Wisconsin The state of Wisconsin is the bank’s third largest rated area (of 39), in terms of deposits. It accounts for $21.7 billion (10.9 percent) of bank deposits, 115 (4 percent) of bank branches, 204 (4 percent) of bank ATMs, and 73,813 (7 percent) of bank-reported loans inside its AAs during the evaluation period. USB has 18 AAs in this rated area, 12 of which are metropolitan areas. The six nonmetropolitan AAs are combined for analysis and presentation. Refer to Appendix A for a detailed listing of bank AAs. Scope of Evaluation in the State of Wisconsin We performed a full-scope review of the Milwaukee AA, which is comprised of the entire Milwaukee-Waukesha-West Allis MSA. Other AAs received limited-scope reviews. State ratings are based primarily on performance in the full-scope area. The Milwaukee AA is the bank’s largest AA in this rated area. It accounts for $17.7 billion (82 percent) of rated area deposits, 46 (40 percent) of rated area branches, 89 (44 percent) of rated area ATMs, and 25,985 (35 percent) of rated area loans. Of the bank’s reported loans in the Milwaukee AA, 63 percent are business loans and 37 percent are home mortgage loans. There are insufficient farm loans for meaningful analysis. Refer to Appendix C for detailed demographics, community contact results, and other performance context information specific to the Milwaukee AA.

Charter Number: 24
72
LENDING TEST Lending Test performance in the state of Wisconsin is rated Outstanding. Bank performance in the full-scope Milwaukee AA is excellent based on good borrower distributions, adequate geographic distributions, a good level of lending activity, and the significantly positive impact of CD lending that elevates overall lending performance. Performance differences in the limited-scope AAs did not impact the rating. Conclusions for Areas Receiving Full-Scope Reviews Lending Activity Lending levels in the Milwaukee AA reflect good responsiveness to area credit needs in relation to deposits and the competitive banking environment. USB has the most area deposits of 57 banks as of June 30, 2011 ($17.7 billion, 33 percent market share). Excluding the large share of centralized, nationwide deposits ($10.7 billion), the bank would have a second place deposit rank and16 percent market share. USB reported $2.4 billion in home mortgage and business loans in this AA over the evaluation period. The bank also originated $172 million in CD loans specific to the AA. Of all home mortgage loans reported in the Milwaukee AA for the year 2011, USB ranks fourth home purchase loans (by both number and dollar volume), fourth in the number of home improvement loans (third by dollar volume), fourth in the number of home refinance loans (sixth by dollar volume), and first in the number of small business loans (second by dollar volume). While lending market shares are lower than the bank’s deposit market share, this is a competitive market with more than 360 home loan reporters and 92 CRA data reporters. Distribution of Loans by Income Level of the Geography The overall geographic distribution of loans in the Milwaukee AA is adequate, as evidenced by a good distribution of home mortgage loans, an excellent distribution of multifamily loans, an adequate distribution of business loans, and no unexplained lending gaps. Our assessment weights small business loans more than home mortgage loans, as they respectively account for 63 percent and 37 percent of the bank’s reported loans in this AA (by number). Home Mortgage Loans The overall geographic distribution of home mortgage loans reported in the Milwaukee AA is good. Our assessment gives the most weight to home refinance and home purchase loans, as these products respectively account for 72 percent and 25 percent of the bank’s home mortgage loans in this AA (by number).

Charter Number: 24
73
The geographic distribution of home purchase loans is excellent. Bank performance essentially equals the demographic comparator in low-income geographies, and performance exceeds the demographic comparator in moderate-income geographies. The bank’s market share of home purchase loans in both low- and moderate-income geographies exceeds its overall product share. The geographic distribution of home improvement loans is excellent. The bank exceeds the demographic comparator in both low- and moderate-income geographies. In addition, the bank’s market share of home improvement loans in both low- and moderate-income geographies exceeds its overall product share. The geographic distribution of home refinance loans is adequate. The bank’s geographic distributions are significantly lower than the demographic comparator in both low- and moderate-income geographies. However, our conclusion emphasizes market share performance due to contextual information regarding geographic distributions for home refinance loans (explained in the next paragraph). The bank’s market share of home refinance loans in low-income geographies is near, and in moderate-income geographies exceeds, its overall product share. While home refinance lending increased significantly in this evaluation period due to the low interest rate environment, LMI areas experienced little/no home refinance lending growth. To illustrate, the bank reported 6,851 home refinance loans in the Milwaukee AA during the current evaluation period (a 155 percent increase over the 2,685 loans reported in the prior evaluation). However, its home refinance loans in moderate-income geographies increased just three percent (from 377 loans to 390 loans), and its lending in low-income geographies actually decreased (from 119 loans to 64 loans). This phenomenon is not unique to the bank as evidenced by its market rankings. The bank reported the fifth-most home refinance loans in both low- and moderate-income geographies, consistent with its market rank for the home refinance product overall. In evaluating this lower proportion of lending in LMI areas, we considered foreclosure concentrations in the AA and documented studies showing foreclosures lead to lower property values in their immediate vicinity. According to a 2011 report by the Center for Responsible Lending, low-income neighborhoods in the Milwaukee MSA have a completed foreclosure rate that is 3.2 times higher than the area’s overall rate. The completed foreclosure rate in moderate-income neighborhoods is two times higher. Foreclosure concentrations intensify housing value declines, making it even more challenging for homeowners in affected neighborhoods to refinance their homes.

Charter Number: 24
74
Multifamily Loans The geographic distribution of multifamily loans reported in the Milwaukee AA is excellent. Bank performance is near the demographic comparator in low-income geographies, and performance exceeds the demographic comparator in moderate-income geographies. In addition, the bank’s market share of multifamily loans in both low- and moderate-income geographies exceeds its overall product share. Our assessment gives more weight to performance in moderate-income geographies as they contain substantially more multifamily housing units. Small Loans to Businesses The geographic distribution of business loans reported in the Milwaukee AA is adequate. Bank performance is lower than the demographic comparator in low-income geographies, and performance is somewhat lower than the demographic comparator in moderate-income geographies. The bank’s market share of business loans in both low- and moderate-income geographies is near its overall product share. Lending Gap Analysis Our geographic distribution analysis included a review for lending gaps, particularly in LMI areas. We did not identify any unexplained lending gaps in the Milwaukee AA. Distribution of Loans by Income Level of the Borrower The overall borrower distribution of loans in the Milwaukee AA is good, as evidenced by a good distribution of home mortgage loans and small loans to businesses. Home Mortgage Loans The overall borrower distribution of home mortgage loans reported in the Milwaukee AA is good. Our assessment gives the most weight to home refinance and home purchase loans, as these products respectively account for 72 percent and 25 percent of the bank’s home mortgage loans in this AA (by number). The borrower distribution of home purchase loans is excellent. Bank performance exceeds the demographic comparators for both low- and moderate-income borrowers. In addition, the bank’s market share of home purchase loans to both low- and moderate-income borrowers exceeds its overall product share. The borrower distribution of home improvement loans is excellent. Bank performance exceeds the demographic comparator for both low- and moderate-income borrowers. In addition, the bank’s market share of home improvement loans to both low- and moderate-income borrowers exceeds its overall product share.

Charter Number: 24
75
The borrower distribution of home refinance loans is adequate. Bank performance is lower than the demographic comparator for low-income borrowers (even with consideration for poverty), and performance is lower than the demographic comparator for moderate-income borrowers. The bank’s market share of home refinance loans to low-income borrowers exceeds, and to moderate-income borrowers is near, its overall product share. Small Loans to Businesses The distribution of loans to businesses of different sizes in the Milwaukee AA is good. The percentage of loans to small businesses (i.e., those with gross annual revenues of $1 million or less) is somewhat lower than the demographic comparator, and the bank’s market share of loans to small businesses exceeds its overall product share. Community Development Lending CD lending has a significantly positive impact and elevates overall lending performance. Our conclusion considers the bank’s large volume of centralized, nonlocal deposits in this market (as described in the Lending Activity section). The bank made 40 CD loans totaling $172 million during the review period. By dollar volume, 51 percent of these loans provided affordable housing for LMI residents, 44 percent provided economic development, and 5 percent provided community services for LMI individuals. These loans created or rehabilitated a total of 982 affordable housing units. This level of CD lending represents 8 percent of allocated Tier 1 Capital. CD loans include the following examples, which demonstrate responsiveness to identified needs for affordable housing stock in suburban areas, job creation, and funding for community development organizations:
- A $20.5 million construction loan to finance the development of a 140-unit mixed income housing project, located in in a moderate-income census tract. Of the 140 units, 121 will be restricted to families with incomes at varying levels (30-60%) of the area median income.
- A $1.8 million allocation of a $5 million commitment to a CDFI formed to provide nonprofit corporations serving LMI communities with affordable financing for capital projects. This allocation funded qualified loans to area nonprofit organizations serving the needs of families, at-risk youth, the elderly and the disabled in the Milwaukee area.
- $4.5 million construction to permanent loan to facilitate the rehabilitation of a 74-unit multi-family affordable housing project. The units are restricted to families making between 30-60 percent of the area median income.
- A $14.0 million construction to permanent loan to finance an addition to a manufacturing plant in Milwaukee as part of a NMTC transaction. The plant is located in a low-income census tract, and funding will provide for the addition of a 100,000 square foot space. As part of the transaction, the company is committed to retain or create at least 450 jobs by 2025.
Charter Number: 24
76
Product Innovation and Flexibility Product innovation and flexibility have a neutral impact on lending performance. However, it is notable that the bank offers a wide variety of mortgage assistance programs in this market. The bank also originated six loans totaling $260 thousand throughout the state via the Petroleum Environmental Cleanup Fund Award Program. The program, which was created to help finance the cleanup of petroleum-contaminated sites throughout Wisconsin, assists small businesses that are at risk of going out of business due to the burden of clean-up costs. Conclusions for Areas Receiving Limited-Scope Reviews Lending performance is excellent and not inconsistent with the Wisconsin Outstanding Lending Test rating in the Appleton, Madison, Oshkosh-Neenah, Racine, and Sheboygan AAs. Lending performance in the other limited-scope areas is weaker than the Wisconsin Outstanding Lending Test rating, but still considered good (Eau Claire, Fond du Lac, Green Bay, Janesville, Wausau, and nonmetropolitan AAs) or adequate (La Crosse AA). Weaker performance is attributable to less favorable CD lending (all), and less favorable borrower distributions (La Crosse). Performance differences in the limited-scope AAs did not impact the Lending Test rating for the state of Wisconsin. INVESTMENT TEST Investment Test performance in the state of Wisconsin is rated Outstanding. Bank performance in the full-scope Milwaukee AA is excellent. Performance in the limited-scope AAs did not impact the rating. Conclusions for Areas Receiving Full-Scope Reviews Bank performance in the Milwaukee AA is excellent in relation to bank capacity, identified needs, and available opportunities. The bank made 415 investments totaling $159 million during the evaluation period. Our conclusion also considers the bank’s large volume of centralized, nonlocal deposits in this market (as described in the Lending Activity section). In reviewing the performance of competing financial institutions as presented in their public CRA performance evaluations, we did not identify any other bank with more investment dollars in this market. Current period investments consist of 21 NMTCs totaling $100 million, 235 LIHTCs totaling $55 million, five equity investments totaling $1 million, four HTCs totaling $1 million, and $2 million grants and in-kind donations. The bank also has 51 prior period investments with an aggregate outstanding balance of $39 million. Total investments represent nine percent of allocated Tier 1 Capital.

Charter Number: 24
77
Most current period investments (99 percent by dollar volume) and prior period investments are responsive to revitalization and affordable housing needs. Investments include the following examples:
- An $8 million NMTC investment to rehabilitate a building into office space, warehouse facilities, and additional retail space. The project is located in a moderate-income area, and is expected to create 230 new jobs.
- A $7 million NMTC investment to redevelop a vacant industrial property located in a low-income area. The development is projected to create/retain 205 permanent jobs.
- LIHTCs totaling $8 million to fund the adaptive reuse and new construction of 91 low-income housing units for families, seniors, and people with special needs.
- A $12 million NMTC investment to rehabilitate and construct an addition for a warehouse located in a low-income area. The end use includes retail and office space in the historic building and 44 residential units in the new addition. At least 70 new jobs are projected.
- An $8 million NMTC investment to expand a manufacturing operation located in a low-income area and on a recovered Brownfield site. The company has committed to retain/create 450 jobs by the year 2025.
- LIHTCs totaling $7 million to construct a 60-unit affordable housing project for LMI families.
Conclusions for Areas Receiving Limited-Scope Reviews Investment performance is excellent in all limited-scope areas and not inconsistent with the Wisconsin Outstanding Investment Test rating (Appleton, Eau Claire, Fond du Lac, Green Bay, Janesville, La Crosse, Madison, Oshkosh-Neenah, Sheboygan, Wausau, Racine, and nonmetropolitan AAs). SERVICE TEST Service Test performance in the state of Wisconsin is rated Outstanding. Based on a full-scope review, performance in the Milwaukee AA is excellent as evidenced by readily accessible retail delivery systems and a relatively high level of CD services. Performance differences in the limited-scope AAs did not impact the rating.

Charter Number: 24
78
Conclusions for Areas Receiving Full-Scope Reviews Retail Banking Services Retail delivery systems are readily accessible to geographies and individuals of different income levels in the Milwaukee AA, with consideration of branches in MUI geographies that are in close proximity to LMI geographies. There are four branches in low-income geographies and four branches in moderate-income geographies. The percentage of branches in low-income tracts is near, and the percentage of branches in moderate-income census tracts is below, the percentage of the population residing in each area. However, we also considered several MUI branches in close proximity of LMI geographies (directly across the street or within a few blocks), which improve access to both low- and moderate-income areas. The bank improved retail accessibility by opening three branches during the evaluation period, including one branch in a moderate-income area. A strong ATM distribution in low-income areas also supports access. Branch services and hours are tailored to the convenience and needs of the AA. Community Development Services USB provided a relatively high level of CD services in the Milwaukee AA, with more than 190 service activities involving 62 different organizations. Leadership is evident through 48 activities involving Board or committee participation. Activities address a wide variety of CD initiatives and are most responsive to financial education needs. Bank staff provided 137 financial education programs to more than 3,000 individuals, including first-time homebuyers, small businesses, and youth. Conclusions for Areas Receiving Limited-Scope Reviews Service performance is excellent and not inconsistent with the Wisconsin Outstanding Service Test rating in the Appleton, Eau Claire, Green Bay, La Crosse, Madison, Oshkosh-Neenah, Sheboygan, and Wausau AAs. Service performance is weaker than the Wisconsin Outstanding Service Test rating, but still considered adequate in the Fond du Lac, Janesville, Racine, and nonmetropolitan AAs. Weaker performance is attributable to less accessible retail delivery systems. Performance differences in the limited-scope AAs did not impact the Service Test Rating for the state of Wisconsin. Refer to Tables 1-15 in the state of Wisconsin section of Appendix D for the facts and data supporting performance conclusions under the Lending, Investment, and Service Tests.
Charter Number: 24
79
OTHER RATED AREAS
Chicago-Joliet-Naperville, IL-IN-WI Multistate MA Clarksville, TN-KY Multistate MSA Davenport-Moline-Rock Island, IA-IL Multistate MSA Fargo, ND-MN Multistate MSA Grand Forks, ND-MN Multistate MSA Kansas City, MO-KS Multistate MSA Lewiston, ID-WA Multistate MSA Logan, UT-ID Multistate MSA Louisville, KY-IN Multistate MSA Omaha-Council Bluffs, NE-IA Multistate MSA Portland-Vancouver-Beaverton, OR-WA Multistate MSA State of Arizona State of Arkansas State of Idaho State of Illinois State of Indiana State of Iowa State of Kansas State of Kentucky State of Minnesota State of Missouri State of Montana State of Nebraska State of Nevada State of New Mexico State of North Dakota State of Ohio State of Oregon State of South Dakota State of Tennessee State of Utah State of Wyoming

Charter Number: 24
80
Chicago-Joliet-Naperville, IL-IN-WI Multistate MA Rating (Chicago MMA) CRA rating for the Multistate MSA1: Outstanding
The Lending Test is rated: Outstanding The Investment Test is rated: Outstanding The Service Test is rated: High Satisfactory
The major factors that support this rating include:
Excellent lending performance in the Chicago AA based on good overall borrower distributions, adequate overall geographic distributions, an excellent level of lending activity, and the significantly positive impact of CD lending which elevates overall lending performance in this market.
Excellent lending performance in the Lake-Kenosha AA based on good overall borrower distributions, adequate overall geographic distributions, an excellent level of lending activity, and the significantly positive impact of CD lending which elevates overall lending performance in this market.
Excellent investment performance in both the Chicago and Lake-Kenosha AAs based on investment volume in relation to bank capacity, identified area needs, and available investment opportunities.
Good service performance in the Chicago AA based on accessible retail delivery systems and a relatively high level of CD services. Service performance in the Lake-Kenosha AA is excellent due to readily accessible retail delivery systems.
Description of Institution’s Operations in the Chicago Multistate MA The Chicago MMA is the bank’s 9th largest rated area (of 39), in terms of deposits. It accounts for $5.8 billion and 2.9 percent of bank deposits. The bank has two AAs in this rated area. The Chicago AA includes six (of eight) counties in the Chicago-Naperville-Joliet MD, and the Lake-Kenosha AA includes the entire Lake-Kenosha MD. Refer to Appendix A for a detailed listing of bank AAs. Scope of Evaluation in the Chicago MMA We performed full-scope reviews of both AAs in this rated area. However, ratings are primarily driven by performance in the Chicago AA as it accounts for significantly more deposits and lending activity.
1 This rating reflects performance in the multistate metropolitan area, which is evaluated separately and
not included in the evaluation or rating of any state-rated area.
Charter Number: 24
81
The Chicago AA is the bank’s largest AA in this rated area (accounts for 93 percent of rated area deposits). There are 218 banks with 2,587 offices in the AA as of June 30, 2011. USB has 78 branches, 163 ATMs, and $5.4 billion deposits, representing a 2 percent deposit market share and 10th place rank. Primary credit products are home mortgage and business loans. There are insufficient multifamily and farm loans for meaningful analysis. We conducted six community contacts and used other available information to determine there are ample CD opportunities in this AA. The Lake-Kenosha AA accounts for seven percent of rated area deposits. There are 53 banks with 288 offices in the AA as of June 30, 2011. USB has 10 branches, 19 ATMs, and $389 million deposits, representing a 2 percent deposit market share and 16th place rank. Primary credit products are home mortgage and business loans. There are insufficient multifamily and farm loans for meaningful analysis. We used three community contacts and other available information to determine there are many CD opportunities in this AA. LENDING TEST Lending Test performance in the Chicago MMA is rated Outstanding. Performance in the Chicago AA is excellent . Our assessment weights home mortgage loans more than small business loans as they respectively account for 64 percent and 36 percent of the bank’s reported loans in this AA (by number, excluding CD loans). Within the home mortgage category, our assessment gives the most weight to refinance and purchase loans, as these products respectively account for 77 percent and 22 percent of the bank’s reported home mortgage loans in this AA (by number, excluding multifamily loans). Lending Activity reflects excellent responsiveness to area credit needs in relation to deposits and competition. USB reported loans totaling $9.4 billion over the evaluation period, ranking 9th of 574 home purchase lenders, 8th of 254 home improvement lenders, 7th of 723 home refinance lenders, and 5th of 194 small business lenders. The Distribution of Reported Loans by Income Level of the Geography is adequate overall. Geographic distributions are poor for home mortgage loans and good for business loans. By individual product, geographic distributions are adequate for home purchase, adequate for home improvement, and poor for home refinance loans. There are no unexplained lending gaps. The Distribution of Reported Loans by Income Level of the Borrower is good overall. Borrower distributions are adequate for home mortgage loans and excellent for business loans. By individual product, borrower distributions are good for home purchase, good for home improvement, and adequate for home refinance loans. Our home mortgage assessment considers the impact of poverty and the shortage of affordable housing stock on a low-income person's ability to afford a mortgage loan. Our business loan assessment emphasizes market share performance.

Charter Number: 24
82
Community Development Lending has a significantly positive impact and elevates overall lending performance. USB originated 17 CD loans totaling $127 million during the evaluation period. By dollar volume, these loans address the needs of LMI persons for affordable housing (46 percent) and community services (9 percent), as well as community needs for revitalization and stabilization (45 percent). This level of CD lending represents over 18 percent of allocated Tier 1 Capital. Product Innovation and Flexibility have a neutral impact. Nationwide programs described in the Executive Summary section are offered in this market. Performance in the Lake-Kenosha AA is excellent. Our assessment weights home mortgage loans more than small business loans as they respectively account for 61 percent and 39 percent of the bank’s reported loans in this AA (by number, excluding CD loans). Within the home mortgage category, our assessment gives the most weight to refinance and purchase loans, as these products respectively account for 80 percent and 19 percent of the bank’s reported home mortgage loans in this AA (by number, excluding multifamily loans). Lending Activity reflects excellent responsiveness to area credit needs in relation to deposits and competition. USB reported loans totaling $1.3 billion over the evaluation period, ranking 4th of 304 home purchase lenders, 14th of 91 home improvement lenders, 7th of 421 home refinance lenders, and 4th of 116 small business lenders. The Distribution of Reported Loans by Income Level of the Geography is adequate overall. Geographic distributions are poor for all home mortgage products and excellent for business loans. There are no unexplained lending gaps. The Distribution of Reported Loans by Income Level of the Borrower is good overall. Borrower distributions are adequate for home mortgage loans and excellent for business loans. By individual product, borrower distributions are good for home purchase, excellent for home improvement, and adequate for home refinance loans. Our home mortgage assessment considers the impact of poverty, the shortage of affordable housing stock, and the impact of fixed financing costs on a low-income borrower’s ability to benefit from a refinance loan. Our business loan assessment emphasizes market share performance. Community Development Lending has a significantly positive impact and elevates overall lending performance. USB originated two CD loans totaling $17 million during the evaluation period to address the needs of LMI persons for affordable housing. This level of CD lending represents 35 percent of allocated Tier 1 Capital. Product Innovation and Flexibility have a neutral impact. Nationwide programs described in the Executive Summary section are offered in this market.
Charter Number: 24
83
INVESTMENT TEST Investment Test performance in the Chicago MMA is rated Outstanding. Performance in the Chicago AA is excellent in relation to bank capacity, identified area needs, and available investment opportunities. The bank made 525 investments totaling $210 million during the evaluation period. Current period investments include 50 NMTCs totaling $135 million, 218 LIHTCs totaling $43 million, seven blind funds totaling $9 million, four HTCs totaling $4 million, 10 equity investments totaling $620 thousand, and $19 million qualified grants and in-kind donations. The bank also has 27 prior period investments with an aggregate outstanding balance of nearly $10 million. Investments are particularly responsive to economic revitalization, affordable housing, and community service needs. Total investments represent 32 percent of allocated Tier 1 Capital. Performance in the Lake-Kenosha AA is excellent in relation to bank capacity, identified area needs, and available investment opportunities. The bank made 50 investments totaling $4 million during the evaluation period. Current period investments include 41 LIHTCs totaling more than $3 million, four MBSs totaling $657 thousand, and $37 thousand qualified grants. The bank also has 17 prior period investments with an aggregate outstanding balance of $2 million. Investments are particularly responsive to affordable housing needs. Total investments represent 13 percent of allocated Tier 1 Capital. SERVICE TEST Service Test performance in the Chicago MMA is rated High Satisfactory. Performance in the Chicago AA is good. Retail delivery systems are accessible to geographies and individuals of different income levels, with consideration of MUI branches in close proximity to low-income geographies. Branching activity during the evaluation period improved access to banking services. The bank opened six branches and closed three branches, with three net branch openings in moderate-income areas. Branch services and hours are tailored to the convenience and needs of the AA. The bank provided a relatively high level of CD services with at least 134 service activities involving 39 different organizations. Active leadership is evident through 33 activities involving Board or committee participation. Activities are most responsive to the needs of LMI persons for community services. Performance in the Lake-Kenosha AA is excellent. Retail delivery systems are readily accessible to geographies and individuals of different income levels. Branching activity during the evaluation period did not adversely affect access to banking services. The bank opened one branch in an upper-income geography. Branch services and hours are tailored to the convenience and needs of the AA. The bank provided an adequate level of CD services with at least eight service activities involving seven different organizations. Leadership is evident through five activities involving Board or committee participation. Activities are most responsive to the needs of LMI persons for community services. Refer to Tables 1-15 in the Chicago MMA section of Appendix D for the facts and data supporting performance conclusions under the Lending, Investment, and Service Tests.

Charter Number: 24
84
Clarksville, TN–KY Multistate MSA Rating (Clarksville MMSA) CRA rating for the Multistate MSA1: Outstanding
The Lending Test is rated: Outstanding The Investment Test is rated: Outstanding The Service Test is rated: Outstanding
The major factors that support this rating include:
Excellent lending performance based on excellent overall borrower distributions, poor overall geographic distributions, an excellent level of lending activity, and the significantly positive impact of CD lending which elevates overall lending performance.
Excellent investment performance based on investment volume in relation to bank capacity, identified area needs, and available investment opportunities.
Excellent service performance based on readily accessible retail delivery systems and a relatively high level of CD services.
Description of Institution’s Operations in the Clarksville MMSA The Clarksville MMSA is the bank’s 35th largest rated area (of 39), in terms of deposits. It accounts for $273 million and less than one percent of bank deposits. The bank has one AA in this rated area (Clarksville AA), which includes two (of four) counties in the Clarksville MMSA. Refer to Appendix A for a detailed listing of bank AAs. Scope of Evaluation in the Clarksville MMSA We performed a full-scope review of the Clarksville AA and rated the Clarksville MMSA entirely on this assessment. There are 14 banks with 75 offices in the AA as of June 30, 2011. USB has 12 branches, 17 ATMs, and $273 million deposits, representing a 9 percent deposit market share and 4th place rank. Primary credit products are home mortgage and business loans. There are insufficient multifamily loans for meaningful analysis. In addition, the AA has no low-income geographies. We used one community contact and other information to determine there are CD opportunities available.
1 This rating reflects performance in the multistate metropolitan area, which is evaluated separately and
not included in the evaluation or rating of any state-rated area.
Charter Number: 24
85
LENDING TEST Lending Test performance in the Clarksville MMSA is rated Outstanding. Performance in the Clarksville AA is excellent. Our assessment weights home mortgage loans more than small business loans as they respectively account for 59 percent and 41 percent of the bank’s reported loans in this AA (by number, excluding CD loans). Within the home mortgage category, our assessment gives the most weight to refinance and purchase loans, as these products respectively account for 60 percent and 35 percent of the bank’s reported home mortgage loans in this AA (by number, excluding multifamily loans). Lending Activity reflects excellent responsiveness to area credit needs in relation to deposits and competition. USB reported loans totaling $284 million over the evaluation period, ranking 13th of 120 home purchase lenders, 4th of 42 home improvement lenders, 4th of 183 home refinance lenders, 1st of 44 small business lenders, and 1st of 12 small farm lenders. The Distribution of Reported Loans by Income Level of the Geography is poor overall. Geographic distributions are poor for home mortgage loans, adequate for business loans, and poor for farm loans. By individual product, geographic distributions are poor for home purchase, excellent for home improvement, and poor for home refinance loans. There are no unexplained lending gaps. The Distribution of Reported Loans by Income Level of the Borrower is excellent overall. Borrower distributions are excellent for home mortgage loans, excellent for business loans, and good for farm loans. By individual product, borrower distributions are good for home purchase loans, good for home improvement loans, and excellent for home refinance loans. Our home mortgage assessment considers the impact of poverty on a low-income person’s ability to afford a mortgage loan, and the impact of fixed financing costs on a low-income borrower’s ability to benefit from a refinance loan. Community Development Lending has a significantly positive impact and elevates lending performance. USB originated five CD loans totaling $4.3 million during the evaluation period. By dollar volume, these loans address community needs for revitalization and stabilization (92 percent), as well as the needs of LMI persons for affordable housing (6 percent) and community services (2 percent). This level of CD lending represents more than 12 percent of allocated Tier 1 Capital. Product Innovation and Flexibility have a neutral impact. Nationwide programs described in the Executive Summary section are offered in this market.

Charter Number: 24
86
INVESTMENT TEST Investment Test performance in the Clarksville MMSA is rated Outstanding. Performance in the Clarksville AA is excellent in relation to bank capacity, identified area needs, and available investment opportunities. The bank made 16 investments totaling $2 million during the evaluation period. Current period investments include seven LIHTCs totaling $2 million, and $38 thousand qualified grants and in-kind donations. The bank also has 13 prior period investments with an aggregate outstanding balance of $1 million. Investments are particularly responsive to affordable housing needs. Total investments represent 10 percent of allocated Tier 1 Capital. SERVICE TEST Service Test performance in the Clarksville MMSA is rated Outstanding. Retail delivery systems are readily accessible to geographies and individuals of different income levels in the Clarksville AA. The bank had no branch openings or closings during the evaluation period. We did not identify any branch differences in product availability, services offered, or business hours that inconvenience LMI geographies or individuals. The bank provided a relatively high level of CD services with at least 24 service activities involving 15 different organizations. Leadership is evident through seven activities involving Board or committee participation. Activities are most responsive to the needs of LMI persons for community services. Refer to Tables 1-15 in the Other MMA section of Appendix D for the facts and data supporting performance conclusions under the Lending, Investment, and Service Tests.
Charter Number: 24
87
Davenport-Moline-Rock Island, IA-IL Multistate MSA Rating (Davenport MMSA) CRA rating for the Multistate MSA1: Outstanding
The Lending Test is rated: Outstanding The Investment Test is rated: Outstanding The Service Test is rated: Outstanding
The major factors that support this rating include:
Excellent lending performance based on excellent overall borrower distributions, poor overall geographic distributions, an excellent level of lending activity, and the significantly positive impact of CD lending which elevates overall lending performance.
Excellent investment performance based on investment volume in relation to bank capacity, identified area needs, and available investment opportunities.
Excellent service performance based on readily accessible retail delivery systems and an excellent level of CD services.
Description of Institution’s Operations in the Davenport MMSA The Davenport MMSA is the bank’s 31st largest rated area (of 39), in terms of deposits. It accounts for $600 million and less than one percent of bank deposits. The bank has one AA in this rated area (Davenport AA), which includes three (of four) counties in the Davenport MMSA. Refer to Appendix A for a detailed listing of bank AAs. Scope of Evaluation in the Davenport MMSA We performed a full-scope review of the Davenport AA and rated the Davenport MMSA entirely on this assessment. There are 37 banks with 148 offices in the AA as of June 30, 2011. USB has 11 branches, 25 ATMs, and $600 million deposits, representing a 9 percent deposit market share and 4th place rank. Primary credit products are home mortgage and business loans. There are insufficient multifamily loans for meaningful analysis. In addition, farm lending is limited and not included in our lending distribution analyses. We used one community contact and other available information to determine there are many CD opportunities.
1 This rating reflects performance in the multistate metropolitan area, which is evaluated separately and
not included in the evaluation or rating of any state-rated area.

Charter Number: 24
88
LENDING TEST Lending Test performance in the Davenport MMSA is rated Outstanding. Performance in the Davenport AA is excellent. Our assessment weights home mortgage loans more than small business loans as they respectively account for 67 percent and 33 percent of the bank’s reported loans in this AA (by number, excluding CD loans). Within the home mortgage category, our assessment gives the most weight to refinance and purchase loans, as these products respectively account for 61 percent and 37 percent of the bank’s reported home mortgage loans in this AA (by number, excluding multifamily loans). Lending Activity reflects excellent responsiveness to area credit needs in relation to deposits and competition. USB reported loans totaling $786 million over the evaluation period, ranking 2nd of 149 home purchase lenders, 5th of 79 home improvement lenders, 2nd of 226 home refinance lenders, and 2nd of 56 small business lenders. The Distribution of Reported Loans by Income Level of the Geography is poor overall. Geographic distributions are poor for home mortgage loans and adequate for business loans. By individual product, geographic distributions are adequate for home purchase, good for home improvement, and poor for home refinance loans. Our assessment of home improvement loans and business loans emphasizes moderate-income geographies as they have more lending opportunity. There are no unexplained lending gaps. The Distribution of Reported Loans by Income Level of the Borrower is excellent overall. Borrower distributions are excellent for all home mortgage products reviewed and good for business loans. Community Development Lending has a significantly positive impact and elevates overall lending performance. USB originated eight CD loans totaling $33 million during the evaluation period. By dollar volume, these loans address community needs for revitalization and stabilization (87 percent), as well as the needs of LMI persons for community services (9 percent) and affordable housing (4 percent). This level of CD lending represents 44 percent of allocated Tier 1 Capital. Product Innovation and Flexibility have a neutral impact. Nationwide programs described in the Executive Summary section are offered in this market.
Charter Number: 24
89
INVESTMENT TEST Investment Test performance in the Davenport MMSA is rated Outstanding. Performance in the Davenport AA is excellent in relation to bank capacity, identified area needs, and available investment opportunities. The bank made 32 investments totaling $21 million during the evaluation period. Current period investments include three NMTCs totaling $18 million, 12 LIHTCs totaling $2 million, and $117 thousand qualified grants. The bank also has 16 prior period investments with an aggregate outstanding balance of nearly $4 million. Investments are particularly responsive to revitalization and affordable housing needs. Total investments represent 32 percent of allocated Tier 1 Capital. SERVICE TEST Service Test performance in the Davenport MMSA is rated Outstanding. Retail delivery systems are readily accessible to geographies and individuals of different income levels in the Davenport AA. Branching activity during the evaluation period did not adversely affect access to banking services. The bank opened one branch in an upper-income geography. We did not identify any branch differences in product availability, services offered, or business hours that inconvenience LMI geographies or individuals. The bank provided an excellent level of CD services with at least 81 service activities involving 25 different organizations. Active leadership is evident through 19 activities involving Board or committee participation. Activities are most responsive to the needs of LMI persons for community services. Refer to Tables 1-15 in the Other MMA section of Appendix D for the facts and data supporting performance conclusions under the Lending, Investment, and Service Tests.

Charter Number: 24
90
Fargo, ND-MN Multistate MSA Rating (Fargo MMSA) CRA rating for the Multistate MSA1: Outstanding
The Lending Test is rated: Outstanding The Investment Test is rated: Outstanding The Service Test is rated: Outstanding
The major factors that support this rating include:
Excellent lending performance based on excellent overall borrower distributions, poor overall geographic distributions, an excellent level of lending activity, and the significantly positive impact of CD lending which elevates overall lending performance.
Excellent investment performance based on investment volume in relation to bank capacity, identified area needs, and available investment opportunities.
Excellent service performance based on readily accessible retail delivery systems and a relatively high level of CD services.
Description of Institution’s Operations in the Fargo MMSA The Fargo MMSA is the bank’s 33rd largest rated area (of 39), in terms of deposits. It accounts for $377 million and less than one percent of bank deposits. The bank has one AA in this rated area (Fargo AA), which includes the entire Fargo MMSA. Refer to Appendix A for a detailed listing of bank AAs. Scope of Evaluation in the Fargo MMSA We performed a full-scope review of the Fargo AA and rated the Fargo MMSA entirely on this assessment. There are 29 banks with 91 offices in the AA as of June 30, 2011. USB has seven branches, 23 ATMs, and $377 million deposits, representing a 7 percent deposit market share and 4th place rank. Primary credit products are home mortgage and business loans. There are insufficient home improvement, multifamily, and farm loans for meaningful analysis. We used two community contacts and other information to determine there are CD opportunities available, with more limited opportunities for equity investments.
1 This rating reflects performance in the multistate metropolitan area, which is evaluated separately and
not included in the evaluation or rating of any state-rated area.

Charter Number: 24
91
LENDING TEST Lending Test performance in the Fargo MMSA is rated Outstanding. Performance in the Fargo AA is excellent. Our assessment weights home mortgage loans more than small business loans as they respectively account for 78 percent and 22 percent of the bank’s reported loans in this AA (by number, excluding CD loans). Within the home mortgage category, our assessment gives the most weight to refinance and purchase loans, as these products respectively account for 55 percent and 44 percent of the bank’s reported home mortgage loans in this AA (by number, excluding multifamily loans). Lending Activity reflects excellent responsiveness to area credit needs in relation to deposits and competition. USB reported loans totaling $356 million over the evaluation period, ranking 3rd of 96 home purchase lenders, 3rd of 133 home refinance lenders, and 7th of 38 small business lenders. The Distribution of Reported Loans by Income Level of the Geography is poor overall. Geographic distributions are very poor for home mortgage loans and good for business loans. By individual product, geographic distributions are poor for home purchase loans and very poor for home refinance loans. There are no identified lending gaps. The Distribution of Reported Loans by Income Level of the Borrower is excellent overall. Borrower distributions are excellent for all home mortgage products reviewed and good for business loans. Our home mortgage assessment considers the impact of poverty on a low-income person’s ability to afford a mortgage loan, and the impact of fixed financing costs on a low-income borrower’s ability to benefit from a refinance loan. Our business loan assessment emphasizes market share performance. Community Development Lending has a significantly positive impact and elevates overall lending performance. USB originated three CD loans totaling $7 million during the evaluation period. By dollar volume, these loans address the needs of LMI persons for affordable housing (79 percent) and community needs for revitalization and stabilization (20 percent). This level of CD lending represents 16 percent of allocated Tier 1 Capital. Product Innovation and Flexibility have a neutral impact. Nationwide programs described in the Executive Summary section are offered in this market.

Charter Number: 24
92
INVESTMENT TEST Investment Test performance in the Fargo MMSA is rated Outstanding. Performance in the Fargo AA is excellent in relation to bank capacity, identified area needs, and available investment opportunities. The bank made 64 investments totaling more than $5 million during the evaluation period. Current period investments include 51 LIHTCs totaling nearly $5 million, a $500 thousand equity investment, and $138 thousand qualified grants and in-kind donations. The bank also has five prior period investments with an aggregate outstanding balance exceeding $1 million. Investments are particularly responsive to affordable housing needs. Total investments represent 14 percent of allocated Tier 1 Capital. SERVICE TEST Service Test performance in the Fargo MMSA is rated Outstanding. Retail delivery systems are readily accessible to geographies and individuals of different income levels in the Fargo AA. The bank had no branch openings or closings during the evaluation period. We did not identify any branch differences in product availability, services offered, or business hours that inconvenience LMI geographies or individuals. The bank provided a relatively high level of CD services with at least 23 service activities involving 14 different organizations. Active leadership is evident through 14 activities involving Board or committee participation. Activities are most responsive to the needs of LMI persons for community services and community needs for economic development. Refer to Tables 1-15 in the Other MMA section of Appendix D for the facts and data supporting performance conclusions under the Lending, Investment, and Service Tests.

Charter Number: 24
93
Grand Forks, ND-MN Multistate MSA Rating (Grand Forks MMSA) CRA rating for the Multistate MSA1: Outstanding
The Lending Test is rated: Outstanding The Investment Test is rated: Outstanding The Service Test is rated: Low Satisfactory
The major factors that support this rating include:
Excellent lending performance based on adequate overall borrower distributions, good overall geographic distributions, an excellent level of lending activity, and the significantly positive impact of CD lending which elevates overall lending performance.
Excellent investment performance based on investment volume in relation to bank capacity, identified area needs, and available investment opportunities.
Adequate service performance based on reasonably accessible retail delivery systems and an adequate level of CD services.
Description of Institution’s Operations in the Grand Forks MMSA The Grand Forks MMSA is the bank’s 37th largest rated area (of 39), in terms of deposits. It accounts for $208 million and less than one percent of bank deposits. The bank has one AA in this rated area (Grand Forks AA), which includes the entire Grand Forks MMSA. Refer to Appendix A for a detailed listing of bank AAs. Scope of Evaluation in the Grand Forks MMSA We performed a full-scope review of the Grand Forks AA and rated the Grand Forks MMSA entirely on this assessment. There are 21 banks with 49 offices in the AA as of June 30, 2011. USB has three branches, 13 ATMs, and $208 million deposits, representing a 10 percent deposit market share and 3rd place rank. Primary credit products are business and home mortgage loans. There are insufficient home improvement and multifamily loans for meaningful analysis. We used one community contact and other information to determine there are CD opportunities available.
1 This rating reflects performance in the multistate metropolitan area, which is evaluated separately and
not included in the evaluation or rating of any state-rated area.
Charter Number: 24
94
LENDING TEST Lending Test performance in the Grand Forks MMSA is rated Outstanding. Performance in the Grand Forks AA is excellent. Our assessment weights small business loans more than home mortgage loans as they respectively account for 60 percent and 40 percent of the bank’s reported loans in this AA (by number, excluding CD loans). Within the home mortgage category, our assessment gives the most weight to refinance and purchase loans, as these products respectively account for 64 percent and 31 percent of the bank’s reported home mortgage loans in this AA (by number, excluding multifamily loans). Lending Activity reflects excellent responsiveness to area credit needs in relation to deposits and competition. USB reported loans totaling $144 million over the evaluation period, ranking 6th of 76 home purchase lenders, 4th of 84 home refinance lenders, 1st of 34 small business lenders, and 6th of 15 small farm lenders. The Distribution of Reported Loans by Income Level of the Geography is good overall. Geographic distributions are good for home mortgage loans, good for business loans, and very poor for farm loans. By individual product, geographic distributions are excellent (with emphasis on moderate-income geographies) for home purchase loans and adequate for home refinance loans. There are no unexplained lending gaps. The Distribution of Reported Loans by Income Level of the Borrower is adequate overall. Borrower distributions are good for all home mortgage products reviewed, adequate for business loans, and poor for farm loans. Our home mortgage assessment considers the impact of poverty on a low-income person’s ability to afford a mortgage loan. Our business loan assessment emphasizes market share performance. Community Development Lending has a significantly positive impact and elevates overall lending performance. USB originated four CD loans totaling $7.5 million during the evaluation period. By dollar volume, these loans address community needs for revitalization and stabilization (56 percent) and the needs of LMI persons for affordable housing (44 percent). This level of CD lending represents 29 percent of allocated Tier 1 Capital. Product Innovation and Flexibility have a neutral impact. Nationwide programs described in the Executive Summary section are offered in this market.
Charter Number: 24
95
INVESTMENT TEST Investment Test performance in the Grand Forks MMSA is rated Outstanding. Performance in the Grand Forks AA is excellent in relation to bank capacity, identified area needs, and available investment opportunities. The bank made 33 investments totaling nearly $9 million during the evaluation period. Current period investments include two NMTCs totaling $7 million, 16 LIHTCs totaling $777 thousand, one $500 thousand tax credit, and $37 thousand qualified grants. The bank also has 11 prior period investments with an aggregate outstanding balance of $665 thousand. Investments are particularly responsive to economic revitalization and affordable housing needs. Total investments represent 36 percent of allocated Tier 1 Capital. SERVICE TEST Service Test performance in the Grand Forks MMSA is rated Low Satisfactory. Retail delivery systems are reasonably accessible to geographies and individuals of different income levels in the Grand Forks AA. While the bank has no branches in LMI geographies, its three branches are located in the most populated area of the MMSA (cities of Grand Forks/East Grand Forks). The cities serve as a retail/medical center for the MMSA, which is quite large in terms of geography and rural immediately outside the cities. The MMSA’s sole low-income tract and one of its moderate-income tracts are located in the cities of Grand Forks/East Grand Forks. There is a USB branch within a mile of the low-income tract and two USB branches within a mile of the moderate-income tract (one of which is located directly across the street). Lending distributions for home mortgage and business loans provide further evidence that retail delivery systems are accessible. The bank had no branch openings or closings during the evaluation period. Branch services and hours are tailored to the convenience and needs of the AA. The bank provided an adequate level of CD services with at least three service activities involving three different organizations. Two activities involve Board or committee leadership. Activities are most responsive to the needs of LMI persons for affordable housing and community services. Refer to Tables 1-15 in the Other MMA section of Appendix D for the facts and data supporting performance conclusions under the Lending, Investment, and Service Tests.
Charter Number: 24
96
Kansas City, MO-KS Multistate MSA Rating (Kansas City MMSA) CRA rating for the Multistate MSA1: Outstanding
The Lending Test is rated: Outstanding The Investment Test is rated: Outstanding The Service Test is rated: Low Satisfactory
The major factors that support this rating include:
Excellent lending performance based on excellent overall borrower distributions, adequate overall geographic distributions, an excellent level of lending activity, and the significantly positive impact of CD lending which elevates overall lending performance.
Excellent investment performance based on investment volume in relation to bank capacity, identified area needs, and available investment opportunities.
Adequate service performance based on reasonably accessible retail delivery systems and a relatively high level of CD services.
Description of Institution’s Operations in the Kansas City MMSA The Kansas City MMSA is the bank’s 16th largest rated area (of 39), in terms of deposits. It accounts for $2.5 billion and less than two percent of bank deposits. The bank has one AA in this rated area (Kansas City AA), which includes nine (of 15) counties in the Kansas City MMSA. Refer to Appendix A for a detailed listing of bank AAs. Scope of Evaluation in the Kansas City MMSA We performed a full-scope review of the Kansas City AA and rated the Kansas City MMSA entirely on this assessment. There are 132 banks with 713 offices in the AA as of June 30, 2011. USB has 57 branches, 76 ATMs, and $2.5 billion deposits, representing a 6 percent deposit market share and 4th place rank. Primary credit products are home mortgage and business loans. There are insufficient multifamily loans for meaningful analysis. We made one community contact and used other available information to determine there are many CD opportunities.
1 This rating reflects performance in the multistate metropolitan area, which is evaluated separately and
not included in the evaluation or rating of any state-rated area.

Charter Number: 24
97
LENDING TEST Lending Test performance in the Kansas City MMSA is rated Outstanding. Performance in the Kansas City AA is excellent. Our assessment weights home mortgage loans more than small business loans as they respectively account for 64 percent and 36 percent of the bank’s reported loans in this AA (by number, excluding CD loans). Within the home mortgage category, our assessment gives the most weight to refinance and purchase loans, as these products respectively account for 61 percent and 37 percent of the bank’s reported home mortgage loans in this AA (by number, excluding multifamily loans). Lending Activity reflects excellent responsiveness to area credit needs in relation to deposits and competition. USB reported loans totaling $3.4 billion over the evaluation period, ranking 2nd of 392 home purchase lenders, 3rd of 164 home improvement lenders, 3rd of 437 home refinance lenders, 2nd of 122 small business lenders, and 3rd of 39 small farm lenders. The Distribution of Reported Loans by Income Level of the Geography is adequate overall. Geographic distributions are poor for home mortgage loans, excellent for business loans, and excellent (with emphasis on moderate-income geographies) for farm loans. By individual product, geographic distributions are adequate for home purchase, good for home improvement, and poor for home refinance loans. There are no unexplained lending gaps. The Distribution of Reported Loans by Income Level of the Borrower is excellent overall. Borrower distributions are excellent for all home mortgage products, excellent for business loans, and good for farm loans. Our home mortgage assessment considers the impact of poverty on a low-income person’s ability to afford a mortgage loan, and the impact of fixed financing costs on a low-income borrower’s ability to benefit from a refinance loan. Our business loan assessment emphasizes market share performance. Community Development Lending has a significantly positive impact and elevates overall lending performance. USB originated 24 CD loans totaling $77 million during the evaluation period. By dollar volume, these loans address the needs of LMI persons for affordable housing (44 percent) and community services (32 percent), as well as community needs for revitalization and stabilization (24 percent). This level of CD lending represents almost 25 percent of allocated Tier 1 Capital. Product Innovation and Flexibility have a neutral impact. Nationwide programs described in the Executive Summary section are offered in this market.
Charter Number: 24
98
INVESTMENT TEST Investment Test performance in the Kansas City MMSA is rated Outstanding. Performance in the Kansas City AA is excellent in relation to bank capacity, identified area needs, and available investment opportunities. The bank made 251 investments totaling $128 million during the evaluation period. Current period investments include 18 NMTCs totaling $52 million, 139 LIHTCs totaling $46 million, 27 HTCs totaling $27 million, four tax credits totaling nearly $3 million, and $349 thousand qualified grants. The bank also has 36 prior period investments with an aggregate outstanding balance of $28 million. Investments are particularly responsive to economic revitalization and affordable housing needs. Total investments represent 50 percent of allocated Tier 1 Capital. SERVICE TEST Service Test performance in the Kansas City MMSA is rated Low Satisfactory. Retail delivery systems are reasonably accessible to geographies and individuals of different income levels (with consideration of MUI branches in close proximity to LMI geographies) in the Kansas City AA. Branching activity during the evaluation period has not adversely affected access to banking services. The bank opened 16 branches during the evaluation period, all of which are located in MUI areas. Branch services and hours are tailored to the convenience and needs of the AA. The bank provided a relatively high level of CD services with at least 116 service activities involving 36 different organizations. Active leadership hours are evident through 26 activities involving Board or committee participation. Activities are most responsive to the needs of LMI persons for community services. Refer to Tables 1-15 in the Other MMA section of Appendix D for the facts and data supporting performance conclusions under the Lending, Investment, and Service Tests.

Charter Number: 24
99
Lewiston, ID-WA Multistate MSA Rating (Lewiston MMSA) CRA rating for the Multistate MSA1: Outstanding
The Lending Test is rated: Outstanding The Investment Test is rated: Outstanding The Service Test is rated: Outstanding
The major factors that support this rating include:
Excellent lending performance based on excellent overall borrower distributions, adequate overall geographic distributions, an excellent level of lending activity, and the significantly positive impact of CD lending which elevates overall lending performance.
Excellent investment performance based on investment volume in relation to bank capacity, identified area needs, and available investment opportunities.
Excellent service performance based on readily accessible retail delivery systems and a relatively high level of CD services.
Description of Institution’s Operations in the Lewiston MMSA The Lewiston MMSA is the bank’s 38th largest rated area (of 39), in terms of deposits. It accounts for $93 million and less than one percent of bank deposits. The bank has one AA in this rated area (Lewiston AA), which includes the entire Lewiston MMSA. Refer to Appendix A for a detailed listing of bank AAs. Scope of Evaluation in the Lewiston MMSA We performed a full-scope review of the Lewiston AA and rated the Lewiston MMSA entirely on this assessment. There are 11 banks with 25 offices in the AA as of June 30, 2011. USB has three branches, six ATMs, and $93 million deposits, representing a 12 percent deposit market share and 4th place rank. Primary credit products are home mortgage and business loans. There are insufficient farm loans for meaningful analysis, and no multifamily loans. In addition, the AA has no low-income geographies. We used one community contact and other available information to determine there are limited CD opportunities.
1 This rating reflects performance in the multistate metropolitan area, which is evaluated separately and
not included in the evaluation or rating of any state-rated area.
Charter Number: 24
100
LENDING TEST Lending Test performance in the Lewiston MMSA is rated Outstanding. Performance in the Lewiston AA is excellent. Our assessment weights home mortgage loans more than small business loans as they respectively account for 55 percent and 45 percent of the bank’s reported loans in this AA (by number, excluding CD loans). Within the home mortgage category, our assessment gives the most weight to refinance and purchase loans, as these products respectively account for 77 percent and 15 percent of the bank’s reported home mortgage loans in this AA (by number). Lending Activity reflects excellent responsiveness to area credit needs in relation to deposits and competition. USB reported loans totaling $137 million over the evaluation period, ranking 9th of 47 home purchase lenders, 1st of 15 home improvement lenders, 3rd of 85 home refinance lenders, and 3rd of 26 small business lenders. The Distribution of Reported Loans by Income Level of the Geography is adequate overall. Geographic distributions are adequate for home mortgage loans and good for business loans. By individual product, geographic distributions are good for home purchase, excellent for home improvement, and adequate for home refinance loans. There are no identified lending gaps. The Distribution of Reported Loans by Income Level of the Borrower is excellent overall. Borrower distributions are excellent for home mortgage loans and excellent for business loans. By individual product, borrower distributions are good for home purchase, excellent for home improvement, and excellent for home refinance loans. Our home mortgage assessment considers the impact of poverty on a low-income person’s ability to afford a mortgage loan, and the impact of fixed financing costs on a low-income borrower’s ability to benefit from a refinance loan. Our business loan assessment emphasizes market share performance. Community Development Lending has a significantly positive impact and elevates overall lending performance. USB originated four CD loans totaling $1.9 million during the evaluation period. By dollar volume, these loans address community needs for revitalization and stabilization (64 percent) and the needs of LMI persons for affordable housing (36 percent). This level of CD lending represents 16 percent of allocated Tier 1 Capital. Product Innovation and Flexibility have a neutral impact. Nationwide programs described in the Executive Summary section are offered in this market.
Charter Number: 24
101
INVESTMENT TEST Investment Test performance in the Lewiston MMSA is rated Outstanding. Performance in the Lewiston AA is excellent in relation to bank capacity, identified area needs, and available investment opportunities. The bank made 15 investments totaling $3 million during the evaluation period. Current period investments include seven LIHTCs totaling $2 million, a $931 thousand bond, and $21 thousand qualified grants. The bank also has eight prior period investments with an aggregate outstanding balance of $288 thousand. Investments are particularly responsive to affordable housing and small business/farm needs. Total investments represent 29 percent of allocated Tier 1 Capital. SERVICE TEST Service Test performance in the Lewiston MMSA is rated Outstanding. Retail delivery systems are readily accessible to geographies and individuals of different income levels in the Lewiston AA. USB has a relatively small presence in this MMSA; however, two of its three branches are located in moderate-income geographies. The bank had no branch openings or closings during the evaluation period. We did not identify any branch differences in product availability, services offered, or business hours that inconvenience LMI geographies or individuals. The bank provided a relatively high level of CD services with at least seven service activities involving four different organizations. Leadership is evident through three activities involving Board or committee participation. Activities are most responsive to the needs of LMI persons for community services. Refer to Tables 1-15 in the Other MMA section of Appendix D for the facts and data supporting performance conclusions under the Lending, Investment, and Service Tests.

Charter Number: 24
102
Logan, UT-ID Multistate MSA Rating (Logan MMSA) CRA rating for the Multistate MSA1: Satisfactory
The Lending Test is rated: High Satisfactory The Investment Test is rated: Outstanding The Service Test is rated: High Satisfactory
The major factors that support this rating include:
Good lending performance based on good overall borrower distributions, good overall geographic distributions, and an excellent level of lending activity. CD lending has a positive impact and further supports lending performance.
Excellent investment performance based on investment volume in relation to bank capacity, identified area needs, and available investment opportunities.
Good service performance based on readily accessible retail delivery systems and the lack of any documented CD service activities.
Description of Institution’s Operations in the Logan MMSA The Logan MMSA is the bank’s smallest rated area (of 39), in terms of deposits. It accounts for $21 million and less than one percent of bank deposits. The bank has one AA in this rated area (Logan AA), which includes the entire Logan MMSA. Refer to Appendix A for a detailed listing of bank AAs. Scope of Evaluation in the Logan MMSA We performed a full-scope review of the Logan AA and rated the Logan MMSA entirely on this assessment. There are 10 banks with 27 offices in the AA as of June 30, 2011. USB has two branches, two ATMs, and $21 million deposits, representing a 2 percent deposit market share and 10th place rank. Primary credit products are home mortgage and business loans. There are insufficient home improvement loans for meaningful analysis, and no multifamily loans. We used one community contact and other available information to determine there are limited CD opportunities.
1 This rating reflects performance in the multistate metropolitan area, which is evaluated separately and
not included in the evaluation or rating of any state-rated area.

Charter Number: 24
103
LENDING TEST Lending Test performance in the Logan MMSA is rated High Satisfactory. Performance in the Logan AA is good. Our assessment weights home mortgage loans more than small business loans as they respectively account for 77 percent and 23 percent of the bank’s reported loans in this AA (by number, excluding CD loans). Within the home mortgage category, our assessment gives the most weight to refinance and purchase loans, as these products respectively account for 83 percent and 16 percent of the bank’s reported home mortgage loans in this AA (by number, excluding multifamily loans). Lending Activity reflects excellent responsiveness to area credit needs in relation to deposits and competition. USB reported loans totaling $232 million over the evaluation period, ranking 8th of 77 home purchase lenders, 1st of 123 home refinance lenders, 6th of 33 small business lenders, and 2nd of 11 small farm lenders. The Distribution of Reported Loans by Income Level of the Geography is good overall. Our assessment emphasizes moderate-income geographies as they have more lending opportunity for all product types. Geographic distributions are good for all home mortgage products reviewed, adequate for business loans, and very poor for farm loans. There are no identified lending gaps. The Distribution of Reported Loans by Income Level of the Borrower is good overall. Borrower distributions are good for home mortgage loans and good for business loans. By individual product, borrower distributions are poor for home purchase loans and good for home refinance loans. Our home mortgage assessment considers the impact of poverty on a low-income person’s ability to afford a mortgage loan, and the impact of fixed financing costs on a low-income borrower’s ability to benefit from a refinance loan. Community Development Lending has a positive impact and further supports lending performance. USB originated three CD loans totaling $164 thousand during the evaluation period. These loans address the needs of LMI persons for affordable housing. This level of CD lending represents six percent of allocated Tier 1 Capital. Product Innovation and Flexibility have a neutral impact. Nationwide programs described in the Executive Summary section are offered in this market.

Charter Number: 24
104
INVESTMENT TEST Investment Test performance in the Logan MMSA is rated Outstanding. Performance in the Logan AA is excellent in relation to bank capacity, identified area needs, and available investment opportunities. The bank made two investments totaling $255 thousand during the evaluation period. The bank also has four prior period investments with an aggregate outstanding balance of $119 thousand. Investments are responsive to affordable housing needs. Total investments represent 13 percent of allocated Tier 1 Capital. SERVICE TEST Service Test performance in the Logan MMSA is rated High Satisfactory. Retail delivery systems are readily accessible to geographies and individuals of different income levels in the Logan AA. The bank improved retail accessibility by opening one branch in a moderate-income geography during the evaluation period. We did not identify any branch differences in product availability, services offered, or business hours that inconvenience LMI geographies or individuals. The bank had no documented CD service activities in this market, which lowered our overall retail service assessment to good. Refer to Tables 1-15 in the Other MMA section of Appendix D for the facts and data supporting performance conclusions under the Lending, Investment, and Service Tests.

Charter Number: 24
105
Louisville, KY-IN Multistate MSA Rating (Louisville MMSA) CRA rating for the Multistate MSA1: Outstanding
The Lending Test is rated: Outstanding The Investment Test is rated: Outstanding The Service Test is rated: Outstanding
The major factors that support this rating include:
Excellent lending performance based on excellent overall borrower distributions, adequate overall geographic distributions, an excellent level of lending activity, and the significantly positive impact of CD lending which elevates overall lending performance.
Excellent investment performance based on investment volume in relation to bank capacity, identified area needs, and available investment opportunities.
Excellent service performance based on readily accessible retail delivery systems and a relatively high level of CD services.
Description of Institution’s Operations in the Louisville MMSA The Louisville MMSA is the bank’s 28th largest rated area (of 39), in terms of deposits. It accounts for $748 million and less than one percent of bank deposits. The bank has one AA in this rated area (Louisville AA), which includes five (of 13) counties in the Louisville MMSA. Refer to Appendix A for a detailed listing of bank AAs. Scope of Evaluation in the Louisville MMSA We performed a full-scope review of the Louisville AA and rated the Louisville MMSA entirely on this assessment. There are 34 banks with 391 offices in the AA as of June 30, 2011. USB has 28 branches, 44 ATMs, and $748 million deposits, representing a 4 percent deposit market share and 8th place rank. Primary credit products are home mortgage and business loans. There are insufficient multifamily and farm loans for meaningful analysis. We made three community contacts and used other available information to determine there are many CD opportunities.
1 This rating reflects performance in the multistate metropolitan area, which is evaluated separately and
not included in the evaluation or rating of any state-rated area.

Charter Number: 24
106
LENDING TEST Lending Test performance in the Louisville MMSA is rated Outstanding. Performance in the Louisville AA is excellent. Our assessment weights home mortgage loans more than small business loans as they respectively account for 70 percent and 30 percent of the bank’s reported loans in this AA (by number, excluding CD loans). Within the home mortgage category, our assessment gives the most weight to refinance and purchase loans, as these products respectively account for 61 percent and 37 percent of the bank’s reported home mortgage loans in this AA (by number, excluding multifamily loans). Lending Activity reflects excellent responsiveness to area credit needs in relation to deposits and competition. USB reported loans totaling $1 billion over the evaluation period, ranking 6th of 733 home purchase lenders, 5th of 98 home improvement lenders, 6th of 293 home refinance lenders, and 5th of 71 small business lenders. The Distribution of Reported Loans by Income Level of the Geography is adequate overall. Geographic distributions are poor for home mortgage loans and good for business loans. By individual product, geographic distributions are good (with emphasis on moderate-income geographies) for home purchase, poor for home improvement, and very poor for home refinance loans. There are no unexplained lending gaps. The Distribution of Reported Loans by Income Level of the Borrower is excellent overall. Borrower distributions are excellent for all products reviewed. Our home mortgage assessment considers the impact of poverty on a low-income person’s ability to afford a mortgage loan, and the impact of fixed financing costs on a low-income borrower’s ability to benefit from a refinance loan. Community Development Lending has a significantly positive impact and elevates overall lending performance. USB originated 11 CD loans totaling $66 million during the evaluation period. By dollar volume, these loans address community needs for revitalization and stabilization (89 percent), as well as the needs of LMI persons for community services (9 percent) and affordable housing (2 percent). This level of CD lending represents 70 percent of allocated Tier 1 Capital. Product Innovation and Flexibility have a neutral impact. Nationwide programs described in the Executive Summary section are offered in this market.

Charter Number: 24
107
INVESTMENT TEST Investment Test performance in the Louisville MMSA is rated Outstanding. Performance in the Louisville AA is excellent in relation to bank capacity, identified area needs, and available investment opportunities. The bank made 65 investments totaling $60 million during the evaluation period. Current period investments include 17 NMTCs totaling $55 million, 16 LIHTCs totaling $3 million, six MBSs totaling $795 thousand, a $250 thousand equity investment, a $234 thousand HTC, and $109 thousand qualified grants. The bank also has 22 prior period investments with an aggregate outstanding balance of $9 million. Investments are particularly responsive to economic revitalization needs. Total investments represent 73 percent of allocated Tier 1 Capital. SERVICE TEST Service Test performance in the Louisville MMSA is rated Outstanding. Retail delivery systems are readily accessible to geographies and individuals of different income levels in the Louisville AA. Branch openings and closings during the evaluation period did not adversely affect retail accessibility. The bank opened one branch and closed one branch during the evaluation period, with no net branch changes in geographies of any income level. We did not identify any branch differences in product availability, services offered, or business hours that inconvenience LMI geographies or individuals. The bank provided a relatively high level of CD services with at least 45 service activities involving 27 different organizations. Leadership is evident through 11 activities involving Board or committee participation. Activities are most responsive to the needs of LMI persons for community services. Refer to Tables 1-15 in the Other MMA section of Appendix D for the facts and data supporting performance conclusions under the Lending, Investment, and Service Tests.

Charter Number: 24
108
Omaha-Council Bluffs, NE-IA Multistate MSA Rating (Omaha MMSA) CRA rating for the Multistate MSA1: Outstanding
The Lending Test is rated: Outstanding The Investment Test is rated: Outstanding The Service Test is rated: High Satisfactory
The major factors that support this rating include:
Excellent lending performance based on excellent overall borrower distributions, good overall geographic distributions, and an excellent level of lending activity. CD lending received significantly positive consideration and further supports lending performance.
Excellent investment performance based on investment volume in relation to bank capacity, identified area needs, and available investment opportunities.
Good service performance based on accessible retail delivery systems and a relatively high level of CD services.
Description of Institution’s Operations in the Omaha MMSA The Omaha MMSA is the bank’s 20th largest rated area (of 39), in terms of deposits. It accounts for $1.8 billion and less than one percent of bank deposits. The bank has one AA in this rated area (Omaha AA), which includes five (of eight) counties in the Omaha MMSA. Refer to Appendix A for a detailed listing of bank AAs. Scope of Evaluation in the Omaha MMSA We performed a full-scope review of the Omaha AA and rated the Omaha MMSA entirely on this assessment. There are 57 banks with 299 offices in the AA as of June 30, 2011. USB has 34 branches, 65 ATMs, and $1.8 billion deposits, representing a 9 percent deposit market share and 4th place rank. Primary credit products are home mortgage and business loans. There are insufficient multifamily loans for meaningful analysis. We made three community contacts and used other available information to determine there are many CD opportunities.
1 This rating reflects performance in the multistate metropolitan area, which is evaluated separately and
not included in the evaluation or rating of any state-rated area.

Charter Number: 24
109
LENDING TEST Lending Test performance in the Omaha MMSA is rated Outstanding. Performance in the Omaha AA is excellent. Our assessment weights home mortgage loans more than small business loans as they respectively account for 64 percent and 36 percent of the bank’s reported loans in this AA (by number, excluding CD loans). Within the home mortgage category, our assessment gives the most weight to refinance and purchase loans, as these products respectively account for 57 percent and 41 percent of the bank’s reported home mortgage loans in this AA (by number, excluding multifamily loans). Lending Activity reflects excellent responsiveness to area credit needs in relation to deposits and competition. USB reported loans totaling $1.6 billion over the evaluation period, ranking 2nd of 215 home purchase lenders, 6th of 92 home improvement lenders, 3rd of 267 home refinance lenders, 3rd of 64 small business lenders, and 2nd of 24 small farm lenders. The Distribution of Reported Loans by Income Level of the Geography is good overall. Geographic distributions are adequate for home mortgage loans, excellent for business loans, and poor for farm loans. By individual product, geographic distributions are good for home purchase, adequate for home improvement, and adequate for home refinance loans. Our assessment of home mortgage loans and business loans emphasizes moderate-income geographies as they have more lending opportunity. There are no unexplained lending gaps. The Distribution of Reported Loans by Income Level of the Borrower is excellent overall. Borrower distributions are excellent for all home mortgage products, good for business loans, and good for farm loans. Our home mortgage assessment considers the impact of poverty on a low-income person’s ability to afford a mortgage loan. Community Development Lending has a significantly positive impact and further supports lending performance. USB originated 12 CD loans totaling $25.6 million during the evaluation period. By dollar volume, these loans address the needs of LMI persons for affordable housing (51 percent) and community needs for revitalization and stabilization (49 percent). This level of CD lending represents 11 percent of allocated Tier 1 Capital. Product Innovation and Flexibility have a neutral impact. Nationwide programs described in the Executive Summary section are offered in this market.

Charter Number: 24
110
INVESTMENT TEST Investment Test performance in the Omaha MMSA is rated Outstanding. Performance in the Omaha AA is excellent in relation to bank capacity, identified area needs, and available investment opportunities. The bank made 329 investments totaling $31 million during the evaluation period. Current period investments include 268 LIHTCs totaling $16 million, 11 NMTCs totaling $7 million, seven HTCs totaling $7 million, three MBSs totaling $505 thousand, and $296 thousand qualified grants. The bank also has 31 prior period investments with an aggregate outstanding balance of $23 million. Investments are particularly responsive to affordable housing and economic revitalization needs. Total investments represent 24 percent of allocated Tier 1 Capital. SERVICE TEST Service Test performance in the Omaha MMSA is rated High Satisfactory. Retail delivery systems are accessible to geographies and individuals of different income levels in the Omaha AA. Strong ATM distributions in LMI areas also support access. Branch openings and closings during the evaluation period did not adversely affect retail accessibility. The bank opened one branch in an upper-income geography and closed one branch in a middle-income geography. Branch services and hours are tailored to the convenience and needs of the AA. The bank provided a relatively high level of CD services with at least 77 service activities involving 37 different organizations. Active leadership hours are evident through 23 activities involving Board or committee participation. Activities are most responsive to the needs of LMI persons for community services. Refer to Tables 1-15 in the Other MMA section of Appendix D for the facts and data supporting performance conclusions under the Lending, Investment, and Service Tests.

Charter Number: 24
111
Portland-Vancouver-Beaverton, OR-WA Multistate MSA Rating (Portland MMSA) CRA rating for the MMSA1: Outstanding
The Lending Test is rated: Outstanding The Investment Test is rated: Outstanding The Service Test is rated: Outstanding
The major factors that support this rating include:
Excellent lending performance based on excellent overall borrower distributions, excellent overall geographic distributions, and a good level of lending activity. CD lending received significantly positive consideration and further supports lending performance.
Excellent investment performance based on investment volume in relation to bank capacity, identified area needs, and available investment opportunities.
Excellent service performance based on readily accessible retail delivery systems and a relatively high level of CD services.
Description of Institution’s Operations in the Portland MMSA The Portland MMSA is the bank’s eighth largest rated area (of 39), in terms of deposits. It accounts for $7.6 billion and almost four percent of bank deposits. The bank has one AA in this rated area (Portland AA), which includes six (of seven) counties in the Portland MMSA. Refer to Appendix A for a detailed listing of bank AAs. Scope of Evaluation in the Portland MMSA We performed a full-scope review of the Portland AA and rated the Portland MMSA entirely on this assessment. There are 40 banks with 578 offices in the AA as of June 30, 2011. USB has 106 branches, 227 ATMs, and $7.6 billion deposits, representing a 19 percent deposit market share and 2nd place rank. Primary credit products are business and home mortgage loans. We used two community contacts and other available information to determine there are many CD opportunities.
1 This rating reflects performance in the multistate metropolitan area, which is evaluated separately and
not included in the evaluation or rating of any state-rated area.

Charter Number: 24
112
LENDING TEST Lending Test performance in the Portland MMSA is rated Outstanding. Performance in the Portland AA is excellent. Our assessment weights small business loans more than home mortgage loans as they respectively account for 67 percent and 33 percent of the bank’s reported loans in this AA (by number, excluding CD loans). Within the home mortgage category, our assessment gives the most weight to refinance and purchase loans, as these products respectively account for 77 percent and 20 percent of the bank’s reported home mortgage loans in this AA (by number). Lending Activity reflects good responsiveness to area credit needs in relation to deposits and competition. USB reported loans totaling $3.8 billion over the evaluation period, ranking 8th of 321 home purchase lenders, 2nd of 113 home improvement lenders, 4th of 404 home refinance lenders, 1st of 97 small business lenders, and 5th of 20 small farm lenders. The Distribution of Reported Loans by Income Level of the Geography is excellent overall. Geographic distributions are good for home mortgage loans, excellent for multifamily loans, excellent for business loans, and poor for farm loans. By individual product, geographic distributions are good for home purchase, excellent for home improvement, and good for home refinance loans. Our assessment of home improvement loans and farm loans emphasizes moderate-income geographies as they have more lending opportunity. There are no identified lending gaps. The Distribution of Reported Loans by Income Level of the Borrower is excellent overall. Borrower distributions are excellent for home mortgage loans, excellent for business loans, and good for farm loans. By individual product, borrower distributions are good for home purchase, excellent for home improvement, and excellent for home refinance loans. Our home mortgage assessment considers the impact of poverty on a low-income person’s ability to afford a mortgage loan. Our business loan assessment emphasizes market share performance. Community Development Lending has a significantly positive impact and further supports lending performance. USB originated 63 CD loans totaling $138 million during the evaluation period. By dollar volume, these loans address the needs of LMI persons for affordable housing (68 percent) and community services (12 percent), as well as community needs for revitalization and stabilization (18 percent) and economic development (2 percent). This level of CD lending represents 14 percent of allocated Tier 1 Capital. Product Innovation and Flexibility have a neutral impact. Nationwide programs described in the Executive Summary section are offered in this market.

Charter Number: 24
113
INVESTMENT TEST Investment Test performance in the Portland MMSA is rated Outstanding. Performance in the Portland AA is excellent in relation to bank capacity, identified area needs, and available investment opportunities. The bank made 434 investments totaling $111 million during the evaluation period. Current period investments include 228 LIHTCs totaling $46 million, 20 HTCs totaling $34 million, 12 NMTCs totaling $23 million, two solar tax credits totaling $6 million, and $2 million qualified grants and in-kind donations. The bank also has 61 prior period investments with an aggregate outstanding balance of $22 million. Investments are particularly responsive to affordable housing and revitalization/stabilization needs. Total investments represent 14 percent of allocated Tier 1 Capital. SERVICE TEST Service Test performance in the Portland MMSA is rated Outstanding. Retail delivery systems are readily accessible to geographies and individuals of different income levels in the Portland AA. The bank improved retail accessibility by opening three branches during the evaluation period, including one branch in a moderate-income area. We did not identify any branch differences in product availability, services offered, or business hours that inconvenience LMI geographies or individuals. The bank provided a relatively high level of CD services with at least 201 service activities involving 83 different organizations. Active leadership is evident through 62 activities involving Board or committee participation. Activities are most responsive to the needs of LMI persons for community services. Refer to Tables 1-15 in the Other MMA section of Appendix D for the facts and data supporting performance conclusions under the Lending, Investment, and Service Tests.

Charter Number: 24
114
State of Arizona Rating CRA rating for the State: Outstanding
The Lending Test is rated: Outstanding The Investment Test is rated: Outstanding The Service Test is rated: High Satisfactory
The major factors that support this rating include:
Excellent lending performance in the full-scope area based on good overall borrower distributions, good overall geographic distributions, an excellent level of lending activity, and the significantly positive impact of CD lending which elevates overall lending performance.
Excellent investment performance in the full-scope area based on investment volume in relation to bank capacity, identified area needs, and available investment opportunities.
Good service performance in the full-scope area based on accessible retail delivery systems and a relatively high level of CD services.
Performance differences in the limited-scope AAs did not impact state ratings. Description of Institution’s Operations in the State of Arizona The state of Arizona is the bank’s 24th largest rated area (of 39), in terms of deposits. It accounts for $1.23 billion and less than one percent of bank deposits. The bank has four AAs in this rated area, all of which are metropolitan areas. Refer to Appendix A for a detailed listing of bank AAs. Scope of Evaluation in the State of Arizona We performed a full-scope review of the Phoenix AA, which includes the entire Phoenix-Mesa-Scottsdale MSA. Other AAs received limited-scope reviews. State ratings are based primarily on performance in the full-scope area. The Phoenix AA is the bank’s largest AA in this rated area, accounting for 79 percent of rated area deposits. There are 61 banks with 933 offices in the Phoenix AA as of June 30, 2011. USB has 64 branches, 75 ATMs, and $967 million deposits, representing a 2 percent deposit market share and 7th place rank. Primary credit products are home mortgage and business loans. There are insufficient multifamily and farm loans for meaningful analysis. We made three community contacts and used other information to determine there are CD opportunities available.
Charter Number: 24
115
LENDING TEST Lending Test performance in the state of Arizona is rated Outstanding. Based on a full-scope review, performance in the Phoenix AA is excellent. Our assessment weights home mortgage loans more than small business loans as they respectively account for 63 percent and 37 percent of the bank’s reported loans in this AA (by number, excluding CD loans). Within the home mortgage category, our assessment gives the most weight to purchase and refinance loans, as these products respectively account for 51 percent and 48 percent of the bank’s reported home mortgage loans in this AA (by number, excluding multifamily loans). Lending Activity reflects excellent responsiveness to area credit needs in relation to deposits and competition. USB reported loans totaling $3 billion over the evaluation period, ranking 10th of 564 home purchase lenders, 8th of 125 home improvement lenders, 7th of 504 home refinance lenders, and 6th of 167 small business lenders. The Distribution of Reported Loans by Income Level of the Geography is good overall. Geographic distributions are adequate for home mortgage loans and excellent for business loans. By individual product, geographic distributions are adequate for home purchase, adequate (with emphasis on moderate-income geographies) for home improvement, and poor for home refinance loans. There are no unexplained lending gaps. The Distribution of Reported Loans by Income Level of the Borrower is good overall. Borrower distributions are good for home mortgage loans and excellent for business loans. By individual product, borrower distributions are good for home purchase, adequate for home improvement, and adequate for home refinance loans. Our home mortgage assessment considers the impact of poverty on a low-income person’s ability to afford a mortgage loan. Our business loan assessment emphasizes market share performance. Community Development Lending has a significantly positive impact and elevates overall lending performance. USB originated ten CD loans totaling $33 million during the evaluation period. By dollar volume, these loans address community needs for revitalization and stabilization (79 percent) and the needs of LMI persons for community services (21 percent). This level of CD lending represents 27 percent of allocated Tier 1 Capital. Product Innovation and Flexibility have a neutral impact. Nationwide programs described in the Executive Summary section are offered in this market. Based on a limited-scope review, performance in the Tucson AA is excellent and not inconsistent with the Arizona Outstanding Lending Test rating. Performance in other limited-scope areas is weaker than the Arizona Outstanding Lending Test rating, but still considered good (Prescott) or adequate (Lake Havasu City-Kingman AA). Weaker performance is attributable to less favorable CD lending and borrower distributions (Lake Havasu City-Kingman AA), and less favorable geographic distributions. Performance differences in the limited-scope AAs did not impact the Lending Test rating for the state of Arizona.

Charter Number: 24
116
INVESTMENT TEST Investment Test performance in the state of Arizona is rated Outstanding. Based on a full-scope review, performance in the Phoenix AA is excellent. The bank made 114 investments totaling $74 million during the evaluation period. Current period investments include 12 NMTCs totaling $50 million, six blind fund investments totaling nearly $18 million, 25 LIHTCs totaling $6 million, and $289 thousand qualified grants. The bank also has 12 prior period investments with an aggregate outstanding balance of $23 million. Investments are particularly responsive to revitalization and stabilization needs. Total investments represent 80 percent of allocated Tier 1 Capital. Based on a limited-scope review, performance in the Tucson AA is excellent and not inconsistent with the Arizona Outstanding Investment Test rating. Performance in the Lake Havasu City-Kingman and Prescott AAs is weaker than the Arizona Outstanding Investment Test rating, but still considered good. Weaker performance is attributable to lower relative investment volumes. Performance differences in the limited-scope AAs did not impact the Investment Test rating for the state of Arizona. USB also made 15 statewide investments totaling $55 thousand during the evaluation period, and it has one prior period statewide investment with an outstanding balance of $100 thousand. SERVICE TEST Service Test performance in the state of Arizona is rated High Satisfactory. Based on a full-scope review, performance in the Phoenix AA is good. Retail delivery systems are accessible to geographies and individuals of different income levels. Branching activity has improved access to banking services. The bank opened six branches and closed two branches during the evaluation period, with one net opening in moderate-income tracts and three net openings in middle-income tracts. Branch services and hours are tailored to the convenience and needs of the AA. The bank provided a relatively high level of CD services with at least 102 service activities involving 38 different organizations. Leadership is evident through 19 activities involving Board or committee participation. Activities are most responsive to the needs of LMI persons for community services. Based on a limited-scope review, performance is excellent in the Tucson AA and stronger than the Arizona High Satisfactory Service Test rating. Service performance in the Lake Havasu City-Kingman and Prescott AAs is weaker than the Arizona High Satisfactory Service Test Rating, but still considered adequate. Stronger (or weaker) performance is attributable to more accessible (or less accessible) retail delivery systems. Performance differences in the limited-scope AAs did not impact the Service Test rating for the state of Arizona. Refer to Tables 1-15 in the state of Arizona section of Appendix D for the facts and data supporting performance conclusions under the Lending, Investment, and Service Tests.
Charter Number: 24
117
State Of Arkansas CRA Rating for the State: Outstanding
The Lending Test is rated: Outstanding The Investment Test is rated: Outstanding The Service Test is rated: Outstanding
The major factors that support this rating include:
Excellent lending performance in the full-scope area based on excellent overall borrower distributions, adequate overall geographic distributions, an excellent level of lending activity, and the significantly positive impact of CD lending which elevates overall lending performance.
Excellent investment performance in the full-scope area based on investment volume in relation to bank capacity, identified area needs, and available investment opportunities.
Excellent service performance in the full-scope area based on readily accessible retail delivery systems and a relatively high level of CD services.
Performance differences in the limited-scope AAs did not impact state ratings. Description of Institution’s Operations in the State of Arkansas The state of Arkansas is the bank’s 27th largest rated area (of 39), in terms of deposits. It accounts for $814 million and less than 1 percent of bank deposits. The bank has seven AAs in this rated area, three of which are metropolitan areas. The four nonmetropolitan AAs are combined for analysis and presentation. Refer to Appendix A for a detailed listing of bank AAs. Scope of Evaluation in the State of Arkansas We performed a full-scope review of the Little Rock AA, which includes five (of six) counties in the Little Rock-North Little Rock-Conway MSA. Other AAs received limited-scope reviews. State ratings are based primarily on performance in the full-scope area. The Little Rock AA is the bank’s largest AA in this rated area, accounting for 59 percent of rated area deposits. There are 35 banks with 317 offices in the AA as of June 30, 2011. USB has 22 branches, 23 ATMs, and $484 million deposits, representing a 4 percent deposit market share and 8th place rank. Primary credit products are home mortgage and business loans. There are insufficient multifamily and farm loans for meaningful analysis. We used two community contacts and other available information to determine there are many CD opportunities.

Charter Number: 24
118
LENDING TEST Lending Test performance in the state of Arkansas is rated Outstanding. Based on a full-scope review, performance in the Little Rock AA is excellent. Our assessment weights home mortgage loans more than small business loans as they respectively account for 62 percent and 38 percent of the bank’s reported loans in this AA (by number, excluding CD loans). Within the home mortgage category, our assessment gives the most weight to refinance and purchase loans, as these products respectively account for 52 percent and 43 percent of the bank’s reported home mortgage loans in this AA (by number, excluding multifamily loans). Lending Activity reflects excellent responsiveness to area credit needs in relation to deposits and competition. USB reported loans totaling $754 million over the evaluation period, ranking 3rd of 203 home purchase lenders, 1st of 74 home improvement lenders, 3rd of 226 home refinance lenders, and 2nd of 63 small business lenders. The Distribution of Reported Loans by Income Level of the Geography is adequate overall. Geographic distributions are adequate for home mortgage loans and good for business loans. By individual product, geographic distributions are adequate for home purchase, good for home improvement, and adequate for home refinance loans. Our home mortgage assessment emphasizes moderate-income geographies as they have more lending opportunity. There are no unexplained lending gaps. The Distribution of Reported Loans by Income Level of the Borrower is excellent overall. Borrower distributions are excellent for all products reviewed. Our home mortgage assessment considers the impact of poverty on a low-income person’s ability to afford a mortgage loan, and the impact of fixed financing costs on a low-income borrower’s ability to benefit from a refinance loan. Our business loan assessment emphasizes market share performance. Community Development Lending has a significantly positive impact and elevates overall lending performance. USB originated ten CD loans totaling $15 million during the evaluation period. By dollar volume, these loans address the needs of LMI persons for affordable housing (91 percent) and community services (8 percent), as well as community needs for revitalization and stabilization (1 percent). This level of CD lending represents 25 percent of allocated Tier 1 Capital. Product Innovation and Flexibility have a neutral impact. Nationwide programs described in the Executive Summary section are offered in this market. Based on a limited-scope review, performance in the Hot Springs and nonmetropolitan AAs is excellent and not inconsistent with the Arkansas Outstanding Lending Test rating. Performance in the Fort Smith AA is weaker than the Arkansas Outstanding Lending Test rating, but still considered good. Weaker performance is attributable to less favorable CD lending. Performance differences in the limited-scope AAs did not impact the Lending Test rating for the state of Arkansas.

Charter Number: 24
119
INVESTMENT TEST Investment Test performance in the state of Arkansas is rated Outstanding. Based on a full-scope review, performance in the Little Rock AA is excellent. The bank made 139 investments totaling $16 million during the evaluation period. Current period investments include 120 LIHTCs totaling $11 million, one $5 million NMTC, two MBSs totaling $219 thousand, and $47 thousand qualified grants. The bank also has 12 prior period investments with an aggregate outstanding balance of $3 million. Investments are particularly responsive to affordable housing and economic revitalization needs. Total investments represent 32 percent of allocated Tier 1 Capital. Based on limited-scope reviews, performance in the Fort Smith and nonmetropolitan AAs is excellent and not inconsistent with the Arkansas Outstanding Investment Test rating. Performance in the Hot Springs AA is weaker than the Arkansas Outstanding Investment Test rating, but still considered good. Weaker performance is attributable to a lower relative investment volume. This performance difference did not impact the Investment Test rating for the state of Arkansas. USB also made six statewide investments totaling $17 thousand during the evaluation period. SERVICE TEST Service Test performance in the state of Arkansas is rated Outstanding. Based on a full-scope review, performance in the Little Rock AA is excellent. Retail delivery systems are readily accessible to geographies and individuals of different income levels. The bank had no branch openings or closings during the evaluation period. We did not identify any branch differences in product availability, services offered, or business hours that inconvenience LMI geographies or individuals. The bank provided a relatively high level of CD services with at least 73 service activities involving 34 different organizations. Leadership is evident through 13 activities involving Board or committee participation. Activities are most responsive to the needs of LMI persons for community services. Based on a limited-scope review, performance in the Hot Springs AA is excellent and not inconsistent with the Arkansas Outstanding Service Test rating. Service performance in the Fort Smith and nonmetropolitan AAs is weaker than the Arkansas Outstanding Service Test rating, but still considered good. Weaker performance is attributable to less accessible retail delivery systems. Performance differences in the limited-scope AAs did not impact the Service Test rating for the state of Arkansas. Refer to Tables 1-15 in the state of Arkansas section of Appendix D for the facts and data supporting performance conclusions under the Lending, Investment, and Service Tests.

Charter Number: 24
120
State of Idaho Rating CRA Rating for the State: Outstanding
The Lending Test is rated: Outstanding The Investment Test is rated: Outstanding The Service Test is rated: Outstanding
The major factors that support this rating include:
Excellent lending performance in the full-scope area based on excellent overall borrower distributions, good overall geographic distributions, and an excellent level of lending activity. CD lending received significantly positive consideration and further supports performance.
Excellent investment performance in the full-scope area based on investment volume in relation to bank capacity, identified area needs, and available investment opportunities.
Excellent service performance in the full-scope area based on readily accessible retail delivery systems and a relatively high level of CD services.
Performance differences in the limited-scope AAs did not impact state ratings. Description of Institution’s Operations in the State of Idaho The state of Idaho is the bank’s 14th largest rated area (of 39), in terms of deposits. It accounts for $2.8 billion and less than 2 percent of bank deposits. The bank has nine AAs in this rated area, four of which are metropolitan areas. The five nonmetropolitan AAs are combined for analysis and presentation. Refer to Appendix A for a detailed listing of bank AAs. Scope of Evaluation in the State of Idaho We performed a full-scope review of the Boise AA, which includes four (of five) counties in the Boise City-Nampa MSA. Other AAs received limited-scope reviews. State ratings are based primarily on performance in the full-scope area. The Boise AA is the bank’s largest AA in this rated area, accounting for 52 percent of rated area deposits. There are 22 banks with 195 offices in the AA as of June 30, 2011. USB has 37 branches, 52 ATMs, and $1.47 billion deposits, representing an 18 percent deposit market share and 2nd place rank. Primary credit products are business and home mortgage loans. There are insufficient multifamily loans for meaningful analysis. We used two community contacts and other information to determine there are CD opportunities available.

Charter Number: 24
121
LENDING TEST Lending Test performance in the state of Idaho is rated Outstanding. Based on a full-scope review, performance in the Boise AA is excellent. Our assessment weights small business loans more than home mortgage loans as they respectively account for 61 percent and 39 percent of the bank’s reported loans in this AA (by number, excluding CD loans). Within the home mortgage category, our assessment gives the most weight to refinance and purchase loans, as these products respectively account for 66 percent and 32 percent of the bank’s reported home mortgage loans in this AA (by number, excluding multifamily loans). Lending Activity reflects excellent responsiveness to area credit needs in relation to deposits and competition. USB reported loans totaling $1.1 billion over the evaluation period, ranking 5th of 168 home purchase lenders, 3rd of 56 home improvement lenders, 5th of 195 home refinance lenders, 2nd of 56 small business lenders, and 3rd of 18 small farm lenders. The Distribution of Reported Loans by Income Level of the Geography is good overall. Our assessment emphasizes moderate-income geographies as they have more lending opportunity for all product types. Geographic distributions are adequate for home mortgage loans, excellent for business loans, and excellent for farm loans. By individual product, geographic distributions are poor for home purchase, adequate for home improvement, and adequate for home refinance loans. There are no unexplained lending gaps. The Distribution of Reported Loans by Income Level of the Borrower is excellent overall. Borrower distributions are excellent for home mortgage loans, excellent for business loans, and good for farm loans. By individual product, borrower distributions are excellent for home purchase, good for home improvement, and excellent for home refinance loans. Our home mortgage assessment considers the impact of poverty on a low-income person’s ability to afford a mortgage loan. Community Development Lending has a significantly positive impact and further supports lending performance. USB originated 13 CD loans totaling $31 million during the evaluation period. By dollar volume, these loans address community needs for revitalization and stabilization (56 percent), as well as the needs of LMI persons for affordable housing (39 percent) and community services (5 percent). This level of CD lending represents 17 percent of allocated Tier 1 Capital. Product Innovation and Flexibility have a neutral impact. Nationwide programs described in the Executive Summary section are offered in this market. Based on limited-scope reviews, performance in the Coeur d'Alene, Pocatello AAs, and nonmetropolitan AAs is excellent and not inconsistent with the Idaho Outstanding Lending Test rating. Performance in the Idaho Falls AA is weaker than the Idaho Outstanding Lending Test rating, but still considered good. Weaker performance is attributable to less favorable borrower and geographic distributions. Performance differences in the limited-scope AAs did not impact the Lending Test rating for the state of Idaho.

Charter Number: 24
122
INVESTMENT TEST Investment Test performance in the state of Idaho is rated Outstanding. Based on a full-scope review, performance in the Boise AA is excellent. The bank made 93 investments totaling more than $9 million during the evaluation period. Current period investments include 31 MBSs totaling more than $4 million, three bonds totaling nearly $4 million, 10 LIHTCs totaling $1 million, and $280 thousand qualified grants. The bank also has 59 prior period investments with an aggregate outstanding balance of nearly $7 million. . These prior period investments continue to provide benefit and meet assessment area needs. Investments are responsive to affordable housing and small business/farm needs. Total investments represent 9 percent of allocated Tier 1 Capital. Based on limited-scope reviews, performance in the Coeur d’Alene, Idaho Falls, Pocattello, and nonmetropolitan AAs is excellent and not inconsistent with the Idaho Outstanding Investment Test rating. USB also made 19 statewide investments totaling $100 thousand during the evaluation period, and it has four prior period statewide investments with an outstanding balance of $875 thousand. SERVICE TEST Service Test performance in the state of Idaho is rated Outstanding. Based on a full-scope review, performance in the Boise AA is excellent. Retail delivery systems are readily accessible to geographies and individuals of different income levels. Branching activity did not adversely affect access to banking services. The bank opened two MUI branches during the evaluation period. We did not identify any branch differences in product availability, services offered, or business hours that inconvenience LMI geographies or individuals. The bank provided a relatively high level of CD services with at least 70 service activities involving 29 different organizations. Active leadership hours are evident through 13 activities involving Board or committee participation. Activities are most responsive to the needs of LMI persons for community services. Based on limited-scope reviews, performance in the Coeur d’Alene, Idaho Falls, and Pocatello AAs is excellent and not inconsistent with the Idaho Outstanding Service Test rating. Service performance in the nonmetropolitan AA is weaker than the Idaho Outstanding Service Test rating, but still considered adequate. Weaker performance is attributable to less accessible retail delivery systems. Performance differences in the limited-scope AAs did not impact the Service Test rating for the state of Idaho. Refer to Tables 1-15 in the state of Idaho section of Appendix D for the facts and data supporting performance conclusions under the Lending, Investment, and Service Tests.

Charter Number: 24
123
State of Illinois Rating CRA Rating for the State: Outstanding
The Lending Test is rated: High Satisfactory The Investment Test is rated: Outstanding The Service Test is rated: Outstanding
The major factors that support this rating include:
Excellent lending performance in the full-scope area based on excellent overall borrower distributions, good overall geographic distributions, an excellent level of lending activity. CD lending received significantly positive consideration and further supports lending performance. However, weaker performance in some limited-scope areas did negatively impact our assessment and result in an overall good lending performance assessment for the state.
Excellent investment performance in the full-scope area based on investment volume in relation to bank capacity, identified area needs, and available investment opportunities.
Good service performance in the full-scope area based on accessible retail delivery systems and an adequate level of CD services. However, stronger performance in some limited-scope areas did positively impact our assessment and result in an overall excellent service performance assessment for the state.
Description of Institution’s Operations in the State of Illinois The state of Illinois is the bank’s 25th largest rated area (of 39), in terms of deposits. It accounts for $1.2 billion and less than one percent of bank deposits. The bank has 10 AAs in this rated area, three of which are metropolitan areas. The seven nonmetropolitan AAs are combined for analysis and presentation. Refer to Appendix A for a detailed listing of bank AAs. Scope of Evaluation in the State of Illinois We performed a full-scope review of the Springfield AA, which includes one (of two) counties in the Springfield MSA. Other AAs received limited-scope reviews. Performance in limited-scope areas did impact state ratings as they collectively account for 75 percent of rated area deposits. The Springfield AA is the bank’s largest AA in this rated area, accounting for 24 percent of rated area deposits. There are 29 banks with 97 offices in the AA as of June 30, 2011. USB has six branches, 10 ATMs, and $290 million deposits, representing a six percent deposit market share and 7th place rank. Primary credit products are home mortgage and business loans. There are insufficient multifamily loans for meaningful analysis. We used two recent community contacts and other available information to determine there are CD opportunities available.

Charter Number: 24
124
LENDING TEST Lending Test performance in the state of Illinois is rated High Satisfactory. Based on a full-scope review, performance in the Springfield AA is excellent. Our assessment weights home mortgage loans more than small business loans as they respectively account for 56 percent and 44 percent of the bank’s reported loans in this AA (by number, excluding CD loans). Within the home mortgage category, our assessment gives the most weight to refinance and purchase loans, as each product accounts for 49 percent of the bank’s reported home mortgage loans in this AA (by number, excluding multifamily loans). Lending Activity reflects excellent responsiveness to area credit needs in relation to deposits. USB reported loans totaling $303 million over the evaluation period. The Distribution of Reported Loans by Income Level of the Geography is good overall. Geographic distributions are good for home mortgage loans, excellent for business loans, and poor for farm loans. By individual product, geographic distributions are excellent (with emphasis on moderate-income geographies) for home purchase, adequate for home improvement, and adequate for home refinance loans. There are no identified lending gaps. The Distribution of Reported Loans by Income Level of the Borrower is excellent overall. Borrower distributions are excellent for all home mortgage products, good for business loans, and good for farm loans. Our home mortgage assessment considers the impact of poverty on a low-income person’s ability to afford a mortgage loan, and the impact of fixed financing costs on a low-income borrower’s ability to benefit from a refinance loan. Community Development Lending has a significantly positive impact and further supports lending performance. USB originated six CD loans totaling $4.8 million during the evaluation period. These loans address the needs of LMI persons for community services. This level of CD lending represents 13 percent of allocated Tier 1 Capital. Product Innovation and Flexibility have a neutral impact. Nationwide programs described in the Executive Summary section are offered in this market. Based on limited-scope reviews, performance in the Bloomington-Normal AA is excellent and not inconsistent with performance in the Springfield AA. Performance in the Rockford and nonmetropolitan AAs is weaker than performance in the Springfield AA, but still considered good. Weaker performance is attributable to less favorable borrower distributions, less favorable geographic distributions (Rockford AA), and less favorable CD lending (nonmetropolitan AAs). Because the Rockford and nonmetropolitan AAs account for most of the bank’s deposits in this state (72 percent), weaker performance in these areas did negatively impact our assessment and result in a High Satisfactory Lending Test rating for the state of Illinois.

Charter Number: 24
125
INVESTMENT TEST Investment Test performance in the state of Illinois is rated Outstanding. Based on a full-scope review, performance in the Springfield AA is excellent. The bank made 21 investments totaling $2.3 million during the evaluation period. Current period investments include 13 LIHTCs totaling $2.2 million and eight qualified grants totaling $43 thousand. The bank also has 16 prior period investments with an aggregate outstanding balance of $470 thousand. Investments are particularly responsive to affordable housing needs. Total investments represent 8 percent of allocated Tier 1 Capital. Based on limited-scope reviews, performance in the Rockford and nonmetropolitan AAs is excellent and not inconsistent with the Illinois Outstanding Investment Test rating. Performance in the Bloomington-Normal AA is weaker than the Illinois Outstanding Investment Test rating, but still considered good. Weaker performance is attributable to a lower relative investment volume. This performance difference did not impact the Investment Test rating for the state of Illinois. USB also made 14 statewide investments totaling $55 million during the evaluation period, and it has one prior period statewide investment with an outstanding balance of $30 thousand. These statewide investments further demonstrate the bank’s commitment to community development. SERVICE TEST Service Test performance in the state of Illinois is rated Outstanding. Based on a full-scope review, performance in the Springfield AA is good. Retail delivery systems are accessible to geographies and individuals of different income levels. The bank had no branch openings or closings during the evaluation period. We did not identify any branch differences in product availability, services offered, or business hours that inconvenience LMI geographies or individuals. The bank provided an adequate level of CD services with at least eight service activities involving six different organizations. Leadership is evident through one activity involving Board participation. Activities are most responsive to the needs of LMI persons for community services. Based on limited-scope reviews, performance in the Rockford and nonmetropolitan AAs is excellent and stronger than performance in the Springfield AA. Service performance in the Bloomington-Normal AA is weaker than the Springfield AA, but still considered adequate. Stronger (or weaker) performance is attributable to more accessible (or less accessible) retail delivery systems. Because the Rockford and nonmetropolitan AAs account for most of the bank’s deposits in this state (72 percent), stronger performance in these areas did positively impact our assessment and result in an Outstanding Service Test rating for the state of Illinois. Refer to Tables 1-15 in the state of Illinois section of Appendix D for the facts and data supporting performance conclusions under the Lending, Investment, and Service Tests.

Charter Number: 24
126
State of Indiana Rating CRA Rating for the State: Satisfactory
The Lending Test is rated: High Satisfactory The Investment Test is rated: Outstanding The Service Test is rated: High Satisfactory
The major factors that support this rating include:
Good lending performance in the full-scope area based on excellent overall borrower distributions, adequate overall geographic distributions, a good level of lending activity, and the positive impact of flexible lending programs.
Excellent investment performance in the full-scope area based on investment volume in relation to bank capacity, identified area needs, and available investment opportunities.
Good service performance in the full-scope area based on accessible retail delivery systems and a relatively high level of CD services.
Description of Institution’s Operations in the State of Indiana The state of Indiana is the bank’s 36th largest rated area (of 39), in terms of deposits. It accounts for $256 million and less than 1 percent of bank deposits. The bank has one AA in this rated area (IN NonMSA AA), which consists of three nonmetropolitan counties. Refer to Appendix A for a detailed listing of bank AAs. Scope of Evaluation in the State of Indiana We performed a full-scope review of the IN NonMSA AA; and rated the state of Indiana entirely on this assessment. There are 17 banks with 64 offices in the AA as of June 30, 2011. USB has 12 branches, 12 ATMs, and $256 million deposits, representing a 13 percent deposit market share and 2nd place rank. Primary credit products are home mortgage and business loans. There are insufficient home improvement loans for meaningful analysis, and no multifamily loans. We made one community contact and used other information to determine there are CD opportunities available.
Charter Number: 24
127
LENDING TEST Lending Test performance in the state of Indiana is rated High Satisfactory. Performance in the IN NonMSA AA is good. Our assessment weights home mortgage loans and small business loans equally as they each account for 50 percent of the bank’s reported loans in this AA (by number, excluding CD loans). Within the home mortgage category, our assessment gives the most weight to refinance and purchase loans, as these products respectively account for 70 percent and 25 percent of the bank’s reported home mortgage loans in this AA (by number). Lending Activity reflects good responsiveness to area credit needs in relation to deposits and competition. USB reported loans totaling $107 million over the evaluation period, ranking 2nd of 72 home purchase lenders, 1st of 96 home refinance lenders, 1st of 36 small business lenders, and 3rd of 17 small farm lenders. The Distribution of Reported Loans by Income Level of the Geography is adequate overall. Geographic distributions are poor for home mortgage loans, good for business loans, and excellent for farm loans. By individual product, geographic distributions are adequate for home purchase loans and poor for home refinance loans. Our assessment of home refinance loans and farm loans emphasizes moderate-income geographies as they have more lending opportunity. There are no identified lending gaps. The Distribution of Reported Loans by Income Level of the Borrower is excellent overall. Borrower distributions are excellent for home mortgage products reviewed, excellent for business loans, and good for farm loans. Our home mortgage assessment considers the impact of poverty on a low-income person’s ability to afford a mortgage loan, and the impact of fixed financing costs on a low-income borrower’s ability to benefit from a refinance loan. Community Development Lending has a neutral impact on lending performance. Product Innovation and Flexibility have a positive impact and further support lending performance. Statewide, the bank made 157 loans totaling $8.4 million under affordable mortgage or down payment assistance programs.

Charter Number: 24
128
INVESTMENT TEST Investment Test performance in the state of Indiana is rated Outstanding. Performance in the IN NonMSA AA is excellent. The bank made 34 investments totaling nearly $3 million during the evaluation period. Current period investments include two bonds totaling $2 million, a $560 thousand mortgage bond, three MBSs totaling $204 thousand, and $45 thousand qualified grants. The bank also has 26 prior period investments with an aggregate outstanding balance of $2 million. Investments are particularly responsive to affordable housing and small business/farm needs. Total investments represent 15 percent of allocated Tier 1 Capital. SERVICE TEST Service Test performance in the state of Indiana is rated High Satisfactory. Performance in the IN NonMSA AA is good. Retail delivery systems are accessible to geographies and individuals of different income levels. Branching activity has not generally affected access to banking services. The bank closed one branch in an upper-income tract during the evaluation period. We did not identify any branch differences in product availability, services offered, or business hours that inconvenience LMI geographies or individuals. The bank provided a relatively high level of CD services with at least 35 service activities involving 20 different organizations. Leadership is evident through 16 activities involving Board or committee participation. Activities are most responsive to the needs of LMI persons for community services. Refer to Tables 1-15 in the state of Indiana section of Appendix D for the facts and data supporting performance conclusions under the Lending, Investment, and Service Tests.

Charter Number: 24
129
State of Iowa Rating CRA Rating for the State: Outstanding
The Lending Test is rated: Outstanding The Investment Test is rated: Outstanding The Service Test is rated: Outstanding
The major factors that support this rating include:
Excellent lending performance in the full-scope area based on excellent overall borrower distributions, adequate overall geographic distributions, an excellent level of lending activity, and the significantly positive impact of CD lending which elevates overall lending performance.
Excellent investment performance in the full-scope area based on investment volume in relation to bank capacity, identified area needs, and available investment opportunities.
Excellent service performance in the full-scope area based on readily accessible retail delivery systems and a relatively high level of CD services.
Performance differences in the limited-scope AAs did not impact state ratings. Description of Institution’s Operations in the State of Iowa The state of Iowa is the bank’s 11th largest rated area (of 39), in terms of deposits. It accounts for $3.7 billion and less than 2 percent of bank deposits. The bank has 21 AAs in this rated area, seven of which are metropolitan areas. The 14 nonmetropolitan AAs are combined for analysis and presentation. Refer to Appendix A for a detailed listing of bank AAs. Scope of Evaluation in the State of Iowa We performed a full-scope review of the Des Moines AA, which includes three (of five) counties in the Des Moines–West Des Moines MSA. Other AAs received limited-scope reviews. State ratings are based primarily on performance in the full-scope area. The Des Moines AA is the bank’s largest AA in this rated area, accounting for 20 percent of rated area deposits. There are 44 banks with 208 offices in the AA as of June 30, 2011. USB has 15 branches, 49 ATMs, and $727 million deposits, representing a 5 percent deposit market share and 6th place rank. Primary credit products are home mortgage and business loans. There are insufficient multifamily loans for meaningful analysis. We used two community contacts and other available information to determine there are many CD opportunities.
Charter Number: 24
130
LENDING TEST Lending Test performance in the state of Iowa is rated Outstanding. Based on a full-scope review, performance in the Des Moines AA is excellent. Our assessment weights home mortgage loans more than small business loans as they respectively account for 71 percent and 29 percent of the bank’s reported loans in this AA (by number, excluding CD loans). Within the home mortgage category, our assessment gives the most weight to refinance and purchase loans, as these products respectively account for 63 percent and 35 percent of the bank’s reported home mortgage loans in this AA (by number, excluding multifamily loans). Lending Activity reflects excellent responsiveness to area credit needs in relation to deposits and competition. USB reported loans totaling $1.4 billion over the evaluation period, ranking 2nd of 192 home purchase lenders, 4th of 83 home improvement lenders, 2nd of 250 home refinance lenders, 3rd of 63 small business lenders, and 2nd of 18 small farm lenders. The Distribution of Reported Loans by Income Level of the Geography is adequate overall. Geographic distributions are poor for home mortgage loans, excellent for business loans, and poor for farm loans. By individual product, geographic distributions are poor for home purchase, adequate (with emphasis on moderate-income geographies) for home improvement, and poor for home refinance loans. There are no identified lending gaps. The Distribution of Reported Loans by Income Level of the Borrower is excellent overall. Borrower distributions are excellent for all home mortgage products, good for business loans, and good for farm loans. Our home mortgage assessment considers the impact of poverty on a low-income person’s ability to afford a mortgage loan, and the impact of fixed financing costs on a low-income borrower’s ability to benefit from a refinance loan. Our business loan assessment emphasizes market share performance. Community Development Lending has a significantly positive impact and elevates overall lending performance. USB originated four CD loans totaling $128 million during the evaluation period. By dollar volume, these loans address community needs for revitalization and stabilization (99 percent) and economic development (1 percent). This level of CD lending represents 140 percent of allocated Tier 1 Capital. Product Innovation and Flexibility have a neutral impact. Nationwide programs described in the Executive Summary section are offered in this market. Based on limited-scope reviews, performance in the Cedar Rapids, Dubuque, Iowa City, and nonmetropolitan AAs is excellent and not inconsistent with the Iowa Outstanding Lending Test rating. Performance in the Ames, Sioux City, and Waterloo-Cedar Falls AAs is weaker than the Iowa Outstanding Lending Test rating, but still considered good. Weaker performance is attributable to less favorable CD lending. Performance differences in the limited-scope AAs did not impact the Lending Test rating for the state of Iowa.

Charter Number: 24
131
INVESTMENT TEST Investment Test performance in the state of Iowa is rated Outstanding. Based on a full-scope review, performance in the Des Moines AA is excellent. The bank made 91 investments totaling nearly $12 million during the evaluation period. Current period investments include 62 LIHTCs totaling $8 million, five HTCs totaling $3 million, and $149 thousand qualified grants. The bank also has 11 prior period investments with an aggregate outstanding balance of nearly $18 million. Investments are particularly responsive to affordable housing and economic revitalization needs. Total investments represent 32 percent of allocated Tier 1 Capital. Based on limited-scope reviews, performance in the Ames, Cedar Rapids, Dubuque, Iowa City, Sioux City, Waterloo-Cedar Falls, and nonmetropolitan AAs is excellent and not inconsistent with the Iowa Outstanding Investment Test rating. USB also made 18 statewide investments totaling $59 thousand during the evaluation period, and it has one prior period statewide investment with an outstanding balance of $697 thousand. SERVICE TEST Service Test performance in the state of Iowa is rated Outstanding. Based on a full-scope review, performance in the Des Moines AA is excellent. Retail delivery systems are readily accessible to geographies and individuals of different income levels. The bank had no branch openings or closings during the evaluation period. We did not identify any branch differences in product availability, services offered, or business hours that inconvenience LMI geographies or individuals. The bank provided a relatively high level of CD services with at least 39 service activities involving 23 different organizations. Active leadership hours are evident through eight activities involving Board or committee participation. Activities are most responsive to the needs of LMI persons for community services. Based on limited-scope reviews, performance in the Cedar Rapids, Dubuque, and nonmetropolitan AAs is excellent and not inconsistent with the Iowa Outstanding Service Test rating. Service performance in the other limited-scope AAs is weaker than the Iowa Outstanding Service Test Rating, but still considered good (Iowa City and Sioux City AAs) or adequate (Ames and Waterloo-Cedar Falls AAs). Weaker performance is attributable to less accessible retail delivery systems. Performance differences in the limited-scope AAs did not impact the Service Test rating for the state of Iowa. Refer to Tables 1-15 in the state of Iowa section of Appendix D for the facts and data supporting performance conclusions under the Lending, Investment, and Service Tests.

Charter Number: 24
132
State of Kansas Rating CRA Rating for the State: Satisfactory
The Lending Test is rated: High Satisfactory The Investment Test is rated: Outstanding The Service Test is rated: High Satisfactory
The major factors that support this rating include:
Good lending performance in the full-scope area based on excellent overall borrower distributions, good overall geographic distributions, and a good level of lending activity.
Excellent investment performance in the full-scope area based on investment volume in relation to bank capacity, identified area needs, and available investment opportunities.
Good service performance in the full-scope area based on accessible retail delivery systems and a relatively high level of CD services.
Performance differences in the limited-scope AAs did not impact state ratings. Description of Institution’s Operations in the State of Kansas The state of Kansas is the bank’s 32nd largest rated area (of 39), in terms of deposits. It accounts for $592 million and less than 1 percent of bank deposits. The bank has three AAs in this rated area, two of which are metropolitan areas. Refer to Appendix A for a detailed listing of bank AAs. Scope of Evaluation in the State of Kansas We performed a full-scope review of the Lawrence AA, which includes the entire Lawrence MSA. Other AAs received limited-scope reviews. State ratings are based primarily on performance in the full-scope area. The Lawrence AA is the bank’s largest AA in this rated area, accounting for 63 percent of rated area deposits. There are 24 banks with 57 offices in the AA as of June 30, 2011. USB has five branches, 13 ATMs, and $375 million deposits, representing a 20 percent deposit market share and 2nd place rank. Primary credit products are home mortgage and business loans. There are insufficient home improvement, multifamily, and farm loans for meaningful analysis. We used one community contact and other information to determine there are CD opportunities available.
Charter Number: 24
133
LENDING TEST Lending Test performance in the state of Kansas is rated High Satisfactory. Based on a full-scope review, performance in the Lawrence AA is good. Our assessment weights home mortgage loans more than small business loans as they respectively account for 53 percent and 47 percent of the bank’s reported loans in this AA (by number, excluding CD loans). Within the home mortgage category, our assessment gives the most weight to refinance and purchase loans, as these products respectively account for 70 percent and 28 percent of the bank’s reported home mortgage loans in this AA (by number, excluding multifamily loans). Lending Activity reflects good responsiveness to area credit needs in relation to deposits and competition. USB reported loans totaling $167 million over the evaluation period, ranking 5th of 108 home purchase lenders, 3rd of 155 home refinance lenders, and 2nd of 47 small business lenders. The Distribution of Reported Loans by Income Level of the Geography is good overall. Geographic distributions are good for all home mortgage loans reviewed and good for business loans. Our assessment emphasizes moderate-income geographies as they have more lending opportunity. There are no unexplained lending gaps. The Distribution of Reported Loans by Income Level of the Borrower is excellent overall. Borrower distributions are excellent for all home mortgage loans reviewed and good for business loans. Our home mortgage assessment considers the impact of poverty on a low-income person’s ability to afford a mortgage loan, and the impact of fixed financing costs on a low-income borrower’s ability to benefit from a refinance loan. Community Development Lending has a neutral impact on lending performance. Product Innovation and Flexibility have a neutral impact. Nationwide programs described in the Executive Summary section are offered in this market. Based on a limited-scope review, performance in the Topeka and Pittsburg nonmetropolitan AAs is stronger than the Kansas Outstanding Lending Test rating and considered excellent. Stronger performance is attributable to more favorable CD lending (Topeka AA) and more favorable geographic distributions (Pittsburg AA). Performance differences in the limited-scope AAs did not impact the Lending Test rating for the state of Kansas.

Charter Number: 24
134
INVESTMENT TEST Investment Test Performance in the state of Kansas is rated Outstanding. Based on a full-scope review, performance in the Lawrence AA is excellent. The bank made 21 investments totaling more than $3 million during the evaluation period. Current period investments include four bonds totaling nearly $3 million, four MBSs totaling $638 thousand, a $130 thousand mortgage bond, and $28 thousand qualified grants. The bank also has 23 prior period investments with an aggregate outstanding balance of $1 million. Investments are particularly responsive affordable housing and small business/farm needs. Total investments represent 10 percent of allocated Tier 1 Capital. Based on a limited-scope review, performance in the Pittsburg nonmetropolitan AA is excellent and not inconsistent with the Kansas Outstanding Investment Test rating. Performance in the Topeka AA is weaker than the Kansas Outstanding Investment Test rating, but still considered good. Weaker performance is attributable to a lower relative investment volume. This performance difference did not impact the Investment Test rating for the state of Kansas. USB also made one statewide investment totaling $10 thousand during the evaluation period. SERVICE TEST Service Test performance in the state of Kansas is rated High Satisfactory. Based on a full-scope review, performance in the Lawrence AA is good. Retail delivery systems are accessible to geographies and individuals of different income levels. The bank had no branch openings or closings during the evaluation period. Branch services and hours are tailored to the convenience and needs of the AA. The bank provided a relatively high level of CD services with at least 19 service activities involving nine different organizations. Active leadership hours are evident through four activities involving Board or committee participation. Activities are most responsive to the needs of LMI persons for community services. Based on a limited-scope review, performance in nonmetropolitan AA is excellent and stronger than the Kansas High Satisfactory Service Test rating. Service performance in the Topeka AA is weaker than the Kansas High Satisfactory Service Test rating, but still considered adequate. Stronger (or weaker) performance is attributable to more accessible (or less accessible) retail delivery systems. Performance differences in the limited-scope AAs did not impact the Service Test rating for the state of Kansas. Refer to Tables 1-15 in the state of Kansas section of Appendix D for the facts and data supporting performance conclusions under the Lending, Investment, and Service Tests.

Charter Number: 24
135
State of Kentucky Rating CRA Rating for the State: Outstanding
The Lending Test is rated: High Satisfactory The Investment Test is rated: Outstanding The Service Test is rated: Outstanding
The major factors that support this rating include:
Excellent lending performance in the full-scope area based on excellent overall borrower distributions, adequate overall geographic distributions, an excellent level of lending activity, and the significantly positive impact of CD lending which elevates overall lending performance in the full-scope area. However, weaker performance in some limited-scope areas did negatively impact our assessment and result in an overall good lending performance assessment for the state.
Excellent investment performance in the full-scope area based on investment volume in relation to bank capacity, identified area needs, and available investment opportunities. Investment performance is also excellent in the limited-scope areas.
Good service performance in full-scope area based on accessible retail delivery systems and a relatively high level of CD services. However, stronger performance in some limited-scope areas did positively impact our assessment and result in an overall excellent service performance assessment for the state.
Description of Institution’s Operations in the State of Kentucky The state of Kentucky is the bank’s 17th largest rated area (of 39), in terms of deposits. It accounts for $2.1 billion and 1 percent of bank deposits. The bank has 12 AAs in this rated area, four of which are metropolitan areas. The eight nonmetropolitan AAs are combined for analysis and presentation. Refer to Appendix A for a detailed listing of bank AAs. Scope of Evaluation in the State of Kentucky We performed a full-scope review of the Owensboro AA, which includes the entire Owensboro MSA. Other AAs received limited-scope reviews. Performance in limited-scope areas did impact State ratings as they collectively account for 93 percent of rated area deposits. The Owensboro AA is the bank’s second largest metropolitan AA in this rated area, accounting for 7 percent of rated area deposits. There are 15 banks with 57 offices in the AA as of June 30, 2011. USB has nine branches, 13 ATMs, and $435 million deposits, representing a 19 percent deposit market share and 2nd place rank. Primary credit products are home mortgage and business loans. There are insufficient farm loans for meaningful analysis, and no multifamily loans. In addition, the AA has no low-income geographies. We made one community contact and used other information to determine there are CD opportunities available.
Charter Number: 24
136
LENDING TEST Lending Test performance in the state of Kentucky is rated High Satisfactory. Based on a full-scope review, performance in the Owensboro AA is excellent. Our assessment weights home mortgage loans more than small business loans as they respectively account for 70 percent and 30 percent of the bank’s reported loans in this AA (by number, excluding CD loans). Within the home mortgage category, our assessment gives the most weight to refinance and purchase loans, as these products respectively account for 51 percent and 45 percent of the bank’s reported home mortgage loans in this AA (by number). Lending Activity reflects excellent responsiveness to area credit needs in relation to deposits and competition. Our assessment also considers the level of centralized, nonlocal deposits in this market ($303 million). USB reported loans totaling $172 million over the evaluation period, ranking 2nd of 86 home purchase lenders, 3rd of 24 home improvement lenders, 2nd of 87 home refinance lenders, and 1st of 35 small business lenders. The Distribution of Reported Loans by Income Level of the Geography is adequate overall. Geographic distributions are poor for home mortgage loans and good for business loans. By individual product, geographic distributions are adequate for home purchase, very poor for home improvement, and poor for home refinance loans. There are no identified lending gaps. The Distribution of Reported Loans by Income Level of the Borrower is excellent overall. Borrower distributions are excellent for home mortgage loans and excellent for business loans. By individual product, borrower distributions are excellent for home purchase, good for home improvement, and excellent for home refinance loans. Our home mortgage assessment considers the impact of poverty on a low-income person’s ability to afford a mortgage loan, and the impact of fixed financing costs on a low-income borrower’s ability to benefit from a refinance loan. Community Development Lending has a significantly positive impact (with consideration for the large volume of centralized, nonlocal deposits in this market) and elevates overall lending performance. USB originated two CD loans totaling $3.8 million during the evaluation period. These loans address community needs for economic development. This level of CD lending represents 7 percent of allocated Tier 1 Capital. Product Innovation and Flexibility have a neutral impact. Nationwide programs described in the Executive Summary section are offered in this market. Based on limited-scope reviews, performance in the Bowling Green and Evansville AAs is excellent and not inconsistent with performance in the Owensboro AA. Performance in Lexington-Fayette and nonmetropolitan AAs is weaker than performance in the Owensboro AA, but still considered good. Weaker performance is attributable to less favorable CD lending. Because the nonmetropolitan AAs account for a majority of the bank’s deposit base in this state, the weaker performance did negatively impact our assessment and result in a High Satisfactory Lending Test rating for the state of Kentucky.

Charter Number: 24
137
INVESTMENT TEST Investment Test performance in the state of Kentucky is rated Outstanding. Based on a full-scope review, performance in the Owensboro AA is excellent. The bank made 29 investments totaling $2.6 million during the evaluation period. Current period investments include three bonds totaling $1.4 million, seven MBSs totaling $665 thousand, 14 LIHTCs totaling $584 thousand, and $15 thousand qualified grants. The bank also has 15 prior period investments with an aggregate outstanding balance of $2 million. These prior period investments continue to provide benefit and meet assessment area needs. Investments are particularly responsive to affordable housing and small business/farm needs. Total investments represent 9 percent of allocated Tier 1 Capital. Based on limited-scope reviews, performance in the Bowling Green, Evansville, Lexington-Fayette, and nonmetropolitan AAs is excellent and not inconsistent with the Kentucky Outstanding Investment Test rating. USB also made seven statewide investments totaling $335 thousand during the evaluation period, and it has two prior period statewide investments with an outstanding balance of $277 thousand. SERVICE TEST Service Test performance in the state of Kentucky is rated Outstanding. Based on a full-scope review, performance in the Owensboro AA is good. Retail delivery systems are accessible to geographies and individuals of different income levels, with consideration of MUI branches in close proximity to moderate-income geographies. The bank had no branch openings or closings during the evaluation period. We did not identify any branch differences in product availability, services offered, or business hours that inconvenience LMI geographies or individuals. The bank provided a relatively high level of CD services with at least 41 service activities involving 23 different organizations. Leadership is evident through six activities involving Board or committee participation. Activities are most responsive to the needs of LMI persons for community services.
Charter Number: 24
138
Based on a limited-scope review, performance in the Lexington-Fayette AA is good and not inconsistent with performance in the Owensboro AA. Service performance in the Evansville AA is weaker than performance in the Owensboro AA, but still considered adequate. Service performance in the Bowling Green and nonmetropolitan AAs is excellent and stronger than performance in the Owensboro AA. Stronger (or weaker) performance is attributable to more accessible (or less accessible) retail delivery systems. Because the Bowling Green and nonmetropolitan AAs account for most of the bank’s deposits in this state (85 percent), their stronger performance did impact our assessment and result in an Outstanding Service Test rating for the state of Kentucky. Refer to Tables 1-15 in the state of Kentucky section of Appendix D for the facts and data supporting performance conclusions under the Lending, Investment, and Service Tests.
Charter Number: 24
139
State of Minnesota Rating CRA Rating for the State: Outstanding
The Lending Test is rated: Outstanding The Investment Test is rated: Outstanding The Service Test is rated: Outstanding
The major factors that support this rating include:
Excellent lending performance in the full-scope area based on good overall borrower distributions, good overall geographic distributions, an excellent level of lending activity, the positive impact of flexible lending programs, and the significantly positive impact of CD lending which elevates overall lending performance.
Excellent investment performance in the full-scope area based on investment volume in relation to bank capacity, identified area needs, and available investment opportunities.
Excellent service performance in the full-scope area based on readily accessible retail delivery systems and a relatively high level of CD services.
Performance differences in the limited-scope AAs did not impact state ratings. Description of Institution’s Operations in the State of Minnesota The state of Minnesota is the bank’s 18th largest rated area (of 39), in terms of deposits. It accounts for $1.9 billion and 1 percent of bank deposits. The bank has 11 AAs in this rated area, four of which are metropolitan areas. The seven nonmetropolitan AAs are combined for analysis and presentation. Refer to Appendix A for a detailed listing of bank AAs. Scope of Evaluation in the State of Minnesota We performed a full-scope review of the Duluth AA, which includes the two Minnesota counties in the Duluth MN-WI MMSA. Other AAs received limited-scope reviews. State ratings are based primarily on performance in the full-scope area. The Duluth AA the bank’s largest AA in this rated area, accounting for 27 percent rated area deposits. There are 26 banks with 86 offices in the AA as of June 30, 2011. USB has 10 branches, 37 ATMs, and $517 million deposits, representing a 16 percent deposit market share and 2nd place rank. Primary credit products are home mortgage and business loans. There are insufficient multifamily and farm loans for meaningful analysis. We made one community contact and used other available information to determine there are many CD opportunities.

Charter Number: 24
140
LENDING TEST Lending Test performance in the state of Minnesota is rated Outstanding. Based on a full-scope review, performance in the Duluth AA is excellent. Our assessment weights home mortgage loans more than small business loans as they respectively account for 61 percent and 39 percent of the bank’s reported loans in this AA (by number, excluding CD loans). Within the home mortgage category, our assessment gives the most weight to refinance and purchase loans, as these products respectively account for 68 percent and 26 percent of the bank’s reported home mortgage loans in this AA (by number, excluding multifamily loans). Lending Activity reflects excellent responsiveness to area credit needs in relation to deposits and competition. USB reported loans totaling $495 million over the evaluation period, ranking 2nd of 132 home purchase lenders, 2nd of 50 home improvement lenders, 2nd of 189 home refinance lenders, and 2nd of 40 small business lenders. The Distribution of Reported Loans by Income Level of the Geography is good overall. Geographic distributions are adequate for home mortgage loans and excellent for business loans. By individual product, geographic distributions are excellent (with emphasis on moderate-income geographies) for home purchase, poor for home improvement, and adequate for home refinance loans. There are no identified lending gaps. The Distribution of Reported Loans by Income Level of the Borrower is good overall. Borrower distributions are excellent for home mortgage loans and adequate for business loans. By individual product, borrower distributions are excellent for home purchase, good for home improvement, and excellent for home refinance loans. Our home mortgage assessment considers the impact of poverty on a low-income person’s ability to afford a mortgage loan, and the impact of fixed financing costs on a low-income borrower’s ability to benefit from a refinance loan. Community Development Lending has a significantly positive impact and elevates overall lending performance. USB originated four CD loans totaling $6.4 million during the evaluation period. By dollar volume, these loans address community needs for revitalization and stabilization (78 percent) and the needs of LMI persons for affordable housing (22 percent). This level of CD lending represents 10 percent of allocated Tier 1 Capital. Product Innovation and Flexibility also have a positive impact on lending performance. In the Duluth AA, the bank originated 31 loans totaling $844 thousand under affordable housing down payment assistance programs. Statewide, the bank made another 432 loans totaling $35 million under affordable mortgage and down payment assistance programs. Based on a limited-scope review, performance in the Mankato-North Mankato AA is excellent and not inconsistent with the Minnesota Outstanding Lending Test rating. Performance in the Rochester, St. Cloud, and nonmetropolitan AAs is weaker than the Minnesota Outstanding Lending Test rating, but still considered good. Weaker performance is attributable to less favorable borrower distributions. Performance differences in the limited-scope AAs did not impact the Lending Test rating for the state of Minnesota.
Charter Number: 24
141
INVESTMENT TEST Investment Test performance in the state of Minnesota is rated Outstanding. Based on a full-scope review, performance in the Duluth AA is excellent. The bank made 70 investments totaling $12 million during the evaluation period. Current period investments include three NMTCs totaling $9 million, 15 LIHTCs totaling $3 million, four HTCs totaling $30 thousand, and $129 thousand qualified grants. The bank also has 13 prior period investments with an aggregate outstanding balance of nearly $5 million. Investments are particularly responsive to economic revitalization and affordable housing needs. Total investments represent 27 percent of allocated Tier 1 Capital. Based on limited-scope reviews, performance in the Mankato-North Mankato, Rochester, and nonmetropolitan AAs is excellent and not inconsistent with the Minnesota Outstanding Investment Test rating. Performance in the St. Cloud AA is weaker than the Minnesota Outstanding Investment Test rating, but still considered good. Weaker performance is attributable to lower relative investment volumes. This performance difference did not impact the Investment Test rating for the state of Minnesota. USB also made 22 statewide investments totaling $122 thousand during the evaluation period, and it has eight prior period statewide investments with an outstanding balance of $4.3 million. These statewide investments further demonstrate the bank’s commitment to CD. SERVICE TEST Service Test performance in the state of Minnesota is rated Outstanding. Based on a full-scope review, performance in the Duluth AA is excellent. Retail delivery systems are readily accessible to geographies and individuals of different income levels. The bank had no branch openings or closings during the evaluation period. We did not identify any branch differences in product availability, services offered, or business hours that inconvenience LMI geographies or individuals. The bank provided a relatively high level of CD services with at least 37 service activities involving 16 different organizations. Leadership is evident through eight activities involving Board or committee participation. Activities are most responsive to the needs of LMI persons for affordable housing and community services. Based on limited-scope reviews, performance in the Rochester, St. Cloud, and nonmetropolitan AAs is excellent and not inconsistent with the Minnesota Outstanding Service Test rating. Service performance in the Mankato-North Mankato AA is weaker than the Minnesota Outstanding Service Test rating, but still considered adequate. Weaker performance is attributable to less accessible retail delivery systems. Performance differences in the limited-scope AAs did not impact the Service Test rating for the state of Minnesota. Refer to Tables 1-15 in the state of Minnesota section of Appendix D for the facts and data supporting performance conclusions under the Lending, Investment, and Service Tests.
Charter Number: 24
142
State of Missouri Rating CRA Rating for the State: Outstanding
The Lending Test is rated: Outstanding The Investment Test is rated: Outstanding The Service Test is rated: Outstanding
The major factors that support this rating include:
Excellent lending performance in the full-scope area based on good overall borrower distributions, good overall geographic distributions, a good level of lending activity, the positive impact of flexible lending programs, and the significantly positive impact of CD lending which elevates overall lending performance.
Excellent investment performance in the full-scope area based on investment volume in relation to bank capacity, identified area needs, and available investment opportunities.
Excellent service performance in the full-scope area based on readily accessible retail delivery systems and a relatively high level of CD services.
Performance differences in the limited-scope AAs did not impact state ratings. Description of Institution’s Operations in the State of Missouri The state of Missouri is the bank’s 15th largest rated area (of 39), in terms of deposits. It accounts for $2.6 billion and less than 2 percent of bank deposits. The bank has 19 AAs in this rated area, seven of which are metropolitan areas. The 12 nonmetropolitan AAs are combined for analysis and presentation. Refer to Appendix A for a detailed listing of bank AAs. Scope of Evaluation in the State of Missouri We performed a full-scope review of the Joplin AA, which includes the entire Joplin MSA. Other AAs received limited-scope reviews. State ratings are based primarily on performance in the full-scope area. The Joplin AA is the bank’s largest AA in this rated area, accounting for 15 percent of rated area deposits. There are 16 banks with 82 offices in the AA as of June 30, 2011. USB has 10 branches, 12 ATMs, and $383 million deposits, representing a 14 percent deposit market share and 2nd place rank. Primary credit products are home mortgage and business loans. There are insufficient multifamily loans for meaningful analysis. In addition, the AA has no low-income geographies. We used one community contact and other available information to determine there are many CD opportunities.

Charter Number: 24
143
LENDING TEST Lending Test performance in the state of Missouri is rated Outstanding. Based on a full-scope review, performance in the Joplin AA is excellent. Our assessment weights home mortgage loans slightly more than small business loans as they respectively account for 52 percent and 48 percent of the bank’s reported loans in this AA (by number, excluding CD loans). Within the home mortgage category, our assessment gives the most weight to refinance and purchase loans, as these products respectively account for 53 percent and 43 percent of the bank’s reported home mortgage loans in this AA (by number, excluding multifamily loans). Lending Activity reflects good responsiveness to area credit needs in relation to deposits and competition. USB reported loans totaling $204 million over the evaluation period, ranking 7th of 115 home purchase lenders, 2nd of 36 home improvement lenders, 6th of 126 home refinance lenders, 1st of 47 small business lenders, and 3rd of 9 small farm lenders. The Distribution of Reported Loans by Income Level of the Geography is good overall. Geographic distributions are good for home mortgage loans, excellent for business loans, and very poor for farm loans. By individual product, geographic distributions are excellent for home purchase, good for home improvement, and adequate for home refinance loans. There are no identified lending gaps. The Distribution of Reported Loans by Income Level of the Borrower is good overall. Borrower distributions are good for all home mortgage products, excellent for business loans, and good for farm loans. Our home mortgage assessment considers the impact of poverty on a low-income person’s ability to afford a mortgage loan, and the impact of fixed financing costs on a low-income borrower’s ability to benefit from a refinance loan. Community Development Lending has a significantly positive impact and elevates overall lending performance. USB originated eight CD loans totaling $9.8 million during the evaluation period. By dollar volume, these loans address community needs for revitalization and stabilization (54 percent) and economic development (5 percent), as well as the needs of LMI persons for affordable housing (41 percent). This level of CD lending represents 20 percent of allocated Tier 1 Capital. Product Innovation and Flexibility also have a positive impact on lending performance. In the Joplin AA, the bank originated one loan totaling $3.6 million under its innovative private placement bond program. This volume of innovative lending represents 7 percent of allocated Tier 1 Capital. Statewide, the bank made another 701 loans totaling $40 million under affordable mortgage and down payment assistance programs.

Charter Number: 24
144
Based on limited-scope reviews, performance in most limited-scope areas is excellent and not inconsistent with the Missouri Outstanding Lending Test rating (Columbia, Fayetteville-Springdale-Rogers, Jefferson City, Springfield, and the nonmetropolitan AAs). Performance in the Cape Girardeau-Jackson and St. Joseph AAs is weaker than the Missouri Outstanding Lending Test rating, but still considered good. Weaker performance is attributable to less favorable CD lending. Performance differences in the limited-scope AAs did not impact the Lending Test rating for the state of Missouri. INVESTMENT TEST Investment Test performance in the state of Missouri is rated Outstanding. Based on a full-scope review, performance in the Joplin AA is excellent. The bank made 70 investments totaling $19 million during the evaluation period. Current period investments include 35 LIHTCs totaling nearly $19 million, a $180 thousand bond, and $139 thousand qualified grants. The bank also has 17 prior period investments with an aggregate outstanding balance of $2.6 million. Investments are particularly responsive to affordable housing and small business/farm needs. Total investments represent 45 percent of allocated Tier 1 Capital. Investment performance in most limited-scope areas is excellent and not inconsistent with the Missouri Outstanding Investment Test rating (Columbia, Jefferson City, Springfield, St. Joseph, and the nonmetropolitan AAs). Performance in the other limited-scope areas is weaker than the Missouri Outstanding Investment Test rating, but still considered good (Fayetteville-Springdale-Rogers and Cape Girardeau-Jackson AAs). Weaker performance is attributable to lower relative investment volumes. Performance differences in the limited-scope AAs did not impact the Investment Test rating for the state of Missouri. USB also made 15 statewide investments totaling $26 million during the evaluation period, and it has five prior period statewide investments with an outstanding balance of $16 million. These statewide investments further demonstrate the bank’s commitment to CD.
Charter Number: 24
145
SERVICE TEST Service Test performance in the state of Missouri is rated Outstanding. Based on a full-scope review, performance in the Joplin AA is excellent. Retail delivery systems are readily accessible to geographies and individuals of different income levels. The bank had no branch openings or closings during the evaluation period. We did not identify any branch differences in product availability, services offered, or business hours that inconvenience LMI geographies or individuals. The bank provided a relatively high level of CD services with at least 26 service activities involving 17 different organizations. Active leadership is evident through 11 activities involving Board or committee participation. Activities are most responsive to the needs of LMI persons for community services. Based on limited-scope reviews, performance in the Fayetteville-Springdale-Rogers, Jefferson City, Springfield, St. Joseph, and nonmetropolitan AAs is excellent and not inconsistent with the Missouri Outstanding Service Test rating. Service performance in the Cape Girardeau-Jackson and Columbia AAs is weaker than the Missouri Outstanding Service Test rating, but still considered adequate. Weaker performance is attributable to less accessible retail delivery systems. Performance differences in the limited-scope AAs did not impact the Service Test rating for the state of Missouri. Refer to Tables 1-15 in the state of Missouri section of Appendix D for the facts and data supporting performance conclusions under the Lending, Investment, and Service Tests.

Charter Number: 24
146
State of Montana Rating CRA Rating for the State: Outstanding
The Lending Test is rated: Outstanding The Investment Test is rated: Outstanding The Service Test is rated: Outstanding
The major factors that support this rating include:
Excellent lending performance in the full-scope area based on good overall borrower distributions, adequate overall geographic distributions, a good level of lending activity, and the significantly positive impact of CD lending which elevates overall lending performance. Performance differences in the limited-scope AAs did not impact the lending performance assessment for the state.
Excellent investment performance in the full-scope area based on investment volume in relation to bank capacity, identified area needs, and available investment opportunities. Investment performance is also excellent in the limited-scope areas.
Good service performance in the full-scope area based on accessible retail delivery systems and an excellent level of CD services. However, stronger performance in the limited-scope areas did positively impact our assessment and result in an overall excellent service performance assessment for the state.
Description of Institution’s Operations in the State of Montana The state of Montana is the bank’s 19th largest rated area (of 39), in terms of deposits. It accounts for $1.9 billion and 1 percent of bank deposits. The bank has 10 AAs in this rated area, three of which are metropolitan areas. The seven nonmetropolitan AAs are combined for analysis and presentation. Refer to Appendix A for a detailed listing of bank AAs. Scope of Evaluation in the State of Montana We performed a full-scope review of the Billings AA, which includes one (of two) counties in the Billings MSA. Other AAs received limited-scope reviews. State ratings are based primarily on performance in the full-scope area. The Billings AA is the bank’s largest AA in this rated area, accounting for 46 percent of rated area deposits. There are 12 banks with 41 offices in the AA as of June 30, 2011. USB has four branches, 18 ATMs, and $856 million deposits, representing a 24 percent deposit market share and 2nd place rank. Primary credit products are home mortgage and business loans. There are insufficient multifamily and farm loans for meaningful analysis. We used one community contact and other available information to determine there are many CD opportunities.

Charter Number: 24
147
LENDING TEST Lending Test performance in the state of Montana is rated Outstanding. Based on a full-scope review, performance in the Billings AA is excellent. Our assessment weights home mortgage loans more than small business loans as they respectively account for 60 percent and 40 percent of the bank’s reported loans in this AA (by number, excluding CD loans). Within the home mortgage category, our assessment gives the most weight to refinance and purchase loans, as these products respectively account for 60 percent and 36 percent of the bank’s reported home mortgage loans in this AA (by number, excluding multifamily loans). Lending Activity reflects good responsiveness to area credit needs in relation to deposits and competition. USB reported loans totaling $390 million over the evaluation period, ranking 6th of 70 home purchase lenders, 6th of 28 home improvement lenders, 4th of 91 home refinance lenders, and 4th of 30 small business lenders. The Distribution of Reported Loans by Income Level of the Geography is adequate overall. Geographic distributions are adequate for home mortgage loans and good (with emphasis on moderate-income geographies) for business loans. By individual product, geographic distributions are good for home purchase, excellent for home improvement, and adequate for home refinance loans. There are no identified lending gaps. The Distribution of Reported Loans by Income Level of the Borrower is good overall. Borrower distributions are good for home mortgage loans and good for business loans. By individual product, borrower distributions are good for home purchase, excellent for home improvement, and good for home refinance loans. Our home mortgage assessment considers the impact of poverty on a low-income person’s ability to afford a mortgage loan. Our business loan assessment emphasizes market share performance. Community Development Lending has a significantly positive impact on performance and elevates overall lending performance. USB originated five CD loans totaling $20 million during the evaluation period. By dollar volume, these loans address community needs for revitalization and stabilization (98 percent) and the needs of LMI persons for affordable housing (2 percent). This level of CD lending represents 19 percent of allocated Tier 1 Capital. Product Innovation and Flexibility have a neutral impact. Nationwide programs described in the Executive Summary section are offered in this market. Based on a limited-scope review, performance in the Missoula AA is excellent and not inconsistent with the Montana Outstanding Lending Test rating. Performance in the Great Falls and nonmetropolitan AAs is weaker than the Montana Outstanding Lending Test rating, but still considered good. Weaker performance is attributable to less favorable CD lending. Performance differences in the limited-scope AAs did not impact the Lending Test rating for the state of Montana.

Charter Number: 24
148
INVESTMENT TEST Investment Test performance in the state of Montana is rated Outstanding. Based on a full-scope review, performance in the Billings AA is excellent. The bank made 55 investments totaling $5 million during the evaluation period. Current period investments include 18 MBSs totaling $3 million, two bonds totaling $1.5 million, 13 LIHTCs totaling $641 thousand, and $75 thousand qualified grants. The bank also has 14 prior period investments with an aggregate outstanding balance of $3 million. These prior period investments continue to provide benefit and meet assessment area needs. Investments are particularly responsive to affordable housing and small business/farm needs. Total investments represent 8 percent of allocated Tier 1 Capital. Based on limited-scope reviews, performance in the Great Falls, Missoula, and nonmetropolitan AAs is excellent and not inconsistent with the Montana Outstanding Investment Test rating. USB also made eight statewide investments totaling $22 thousand during the evaluation period. SERVICE TEST Service Test performance in the state of Montana is rated Outstanding. Based on a full-scope review, performance in the Billings AA is good. Retail delivery systems are accessible to geographies and individuals of different income levels, with consideration for ATM distributions in LMI areas. The bank had no branch openings or closings during the evaluation period. We did not identify any branch differences in product availability, services offered, or business hours that inconvenience LMI geographies or individuals. The bank provided an excellent level of CD services with at least 17 service activities involving 14 different organizations. Strong leadership is evident through 10 activities involving Board or committee participation. Activities are most responsive to the needs of LMI persons for community services. Based on limited-scope reviews, performance in the Great Falls, Missoula, and nonmetropolitan AAs is excellent and stronger than performance in the Billings AA. Stronger performance is attributable to more accessible retail delivery systems. Because the limited-scope AAs account for a majority of the bank’s deposit base in this state, the stronger performance did positively impact our assessment and result in an Outstanding Service Test rating for the state of Montana. Refer to Tables 1-15 in the state of Montana section of Appendix D for the facts and data supporting performance conclusions under the Lending, Investment, and Service Tests.

Charter Number: 24
149
State of Nebraska Rating CRA Rating for the State: Outstanding
The Lending Test is rated: Outstanding The Investment Test is rated: Outstanding The Service Test is rated: Outstanding
The major factors that support this rating include:
Excellent lending performance in the full-scope area based on excellent overall borrower distributions, good overall geographic distributions, an excellent level of lending activity, as well as the positive impact of flexible lending programs and the significantly positive impact of CD lending which further support lending performance.
Excellent investment performance in the full-scope area based on investment volume in relation to bank capacity, identified area needs, and available investment opportunities.
Excellent service performance in the full-scope area based on readily accessible retail delivery systems and a relatively high level of CD services.
Performance differences in the limited-scope AAs did not impact state ratings. Description of Institution’s Operations in the State of Nebraska The state of Nebraska is the bank’s 26th largest rated area (of 39), in terms of deposits. It accounts for $1 billion and less than 1 percent of bank deposits. The bank has six AAs in this rated area, one of which is a metropolitan area. The five nonmetropolitan AAs are combined for analysis and presentation. Refer to Appendix A for a detailed listing of bank AAs. Scope of Evaluation in the State of Nebraska We performed a full-scope review of the Lincoln AA, which includes one (of two) counties in the Lincoln MSA. Other AAs received limited-scope reviews. State ratings are based primarily on performance in the full-scope area. The Lincoln AA is the bank’s largest AA in this rated area, accounting for 63 percent of rated area deposits. There are 25 banks with 133 offices in the AA as of June 30, 2011. USB has 12 branches, 17 ATMs, and $648 million deposits, representing a 12 percent deposit market share and 3rd place rank. Primary credit products are home mortgage and business loans. There are insufficient multifamily and farm loans for meaningful analysis. We used two community contacts and other information to determine there are CD opportunities available.
Charter Number: 24
150
LENDING TEST Lending Test performance in the state of Nebraska is rated Outstanding. Based on a full-scope review, performance in the Lincoln AA is excellent. Our assessment weights home mortgage loans more than small business loans as they respectively account for 57 percent and 43 percent of the bank’s reported loans in this AA (by number, excluding CD loans). Within the home mortgage category, our assessment gives the most weight to purchase and refinance loans, as each product accounts for 49 percent of the bank’s reported home mortgage loans in this AA (by number, excluding multifamily loans). Lending Activity reflects excellent responsiveness to area credit needs in relation to deposits and competition. USB reported loans totaling $409 million over the evaluation period, ranking 2nd of 115 home purchase lenders, 6th of 47 home improvement lenders, 4th of 156 home refinance lenders, and 2nd of 48 small business lenders. The Distribution of Reported Loans by Income Level of the Geography is good overall. Geographic distributions good for home mortgage loans and excellent for business loans. By individual product, geographic distributions are excellent for home purchase, good for home improvement, and adequate for home refinance loans. Our assessment for home improvement and home refinance loans emphasizes moderate-income geographies as they have more lending opportunity. There are no unexplained lending gaps. The Distribution of Reported Loans by Income Level of the Borrower is excellent overall. Borrower distributions are excellent for all products reviewed. Our home mortgage assessment considers the impact of poverty on a low-income person’s ability to afford a mortgage loan. Community Development Lending has a significantly positive impact and further supports lending performance. USB originated 11 CD loans totaling $20 million during the evaluation period. By dollar volume, these loans address community needs for revitalization and stabilization (90 percent), as well as the needs of LMI persons for community services (9 percent) and affordable housing (1 percent). This level of CD lending represents 25 percent of allocated Tier 1 Capital. Product Innovation and Flexibility also have a positive impact on lending performance. In the Lincoln AA, the bank originated 1 loan totaling $1.8 million under its innovative private placement bond program. It also made 159 loans totaling $2.4 million under affordable housing down payment assistance programs. This volume of innovative and flexible lending represents 5 percent of allocated Tier 1 Capital. Statewide, the bank made another 81 loans totaling $8 million under affordable mortgage and down payment assistance programs. Based on a limited-scope review, performance in the nonmetropolitan AAs is excellent and not inconsistent with the Nebraska Outstanding Lending Test rating.
Charter Number: 24
151
INVESTMENT TEST Investment Test performance in the state of Nebraska is rated Outstanding. Based on a full-scope review, performance in the Lincoln AA is excellent. The bank made 54 investments totaling $6 million during the evaluation period. Current period investments include eight LIHTCs totaling $3 million, three bonds totaling $2 million, eight MBSs totaling $1 million, and $222 thousand qualified grants. The bank also has 32 prior period investments with an aggregate outstanding balance of $2.5 million. Investments are particularly responsive to affordable housing and small business/small farm needs. Total investments represent 10 percent of allocated Tier 1 Capital. Based on a limited-scope review, performance in the nonmetropolitan AAs is excellent and not inconsistent with the Nebraska Outstanding Investment Test rating. USB also made 12 statewide investments totaling $33 thousand during the evaluation period, and it has three prior period statewide investments with an outstanding balance of $600 thousand. SERVICE TEST Service Test performance in the state of Nebraska is rated Outstanding. Based on a full-scope review, performance Lincoln AA is excellent. Retail delivery systems are readily accessible to geographies and individuals of different income levels. The bank had no branch openings or closings during the evaluation period. We did not identify any branch differences in product availability, services offered, or business hours that inconvenience LMI geographies or individuals. The bank provided a relatively high level of CD services with at least 45 service activities involving 25 different organizations. Active leadership is evident through 18 activities involving Board or committee participation. Activities are most responsive to the needs of LMI persons for community services. Based on a limited-scope review, performance in the nonmetropolitan AA is excellent and not inconsistent with the Nebraska Outstanding Service Test rating. Refer to Tables 1-15 in the state of Nebraska section of Appendix D for the facts and data supporting performance conclusions under the Lending, Investment, and Service Tests.

Charter Number: 24
152
State of Nevada Rating CRA Rating for the State: Satisfactory
The Lending Test is rated: Low Satisfactory The Investment Test is rated: Outstanding The Service Test is rated: High Satisfactory
The major factors that support this rating include:
Adequate lending performance in the full-scope area based on good overall borrower distributions, poor overall geographic distributions, and an excellent level of lending activity. CD lending has a positive impact and further supports lending performance.
Excellent investment performance in the full-scope area based on investment volume in relation to bank capacity, identified area needs, and available investment opportunities.
Good service performance in the full-scope area based on accessible retail delivery systems and an adequate level of CD services.
Performance differences in the limited-scope AAs did not impact state ratings. Description of Institution’s Operations in the State of Nevada The state of Nevada is the bank’s 13th largest rated area (of 39), in terms of deposits. It accounts for $2.9 billion and less than 2 percent of bank deposits. The bank has six AAs in this rated area, three of which are metropolitan areas. The three nonmetropolitan AAs are combined for analysis and presentation. Refer to Appendix A for a detailed listing of bank AAs. Scope of Evaluation in the State of Nevada We performed a full-scope review of the Las Vegas AA, which includes the entire Las Vegas-Paradise MSA. Other AAs received limited-scope reviews. State ratings are based primarily on performance in the full-scope area. The Las Vegas AA is the bank’s largest AA in this rated area, accounting for 64 percent of rated area deposits. There are 41 banks with 383 offices in the AA as of June 30, 2011. USB has 73 branches, 80 ATMs, and $1.9 billion deposits, representing a 1 percent deposit market share and 7th place rank. Primary credit products are home mortgage and business loans. There are insufficient multifamily and farm loans for meaningful analysis. We made one community contact and used other available information to determine there are numerous CD opportunities.
Charter Number: 24
153
LENDING TEST Lending Test performance in the state of Nevada is rated Low Satisfactory. Based on a full-scope review, performance in the Las Vegas AA is adequate. Our assessment weights home mortgage loans more than small business loans as they respectively account for 53 percent and 47 percent of the bank’s reported loans in this AA (by number, excluding CD loans). Within the home mortgage category, our assessment gives the most weight to purchase and refinance loans, as these products respectively account for 64 percent and 35 percent of the bank’s reported home mortgage loans in this AA (by number, excluding multifamily loans). Lending Activity reflects excellent responsiveness to area credit needs in relation to deposits and competition. USB reported loans totaling $1.2 billion over the evaluation period, ranking 13th of 298 home purchase lenders, 4th of 50 home improvement lenders, 5th of 261 home refinance lenders, and 6th of 100 small business lenders. The Distribution of Reported Loans by Income Level of the Geography is poor overall. Geographic distributions are very poor for all home mortgage products and adequate (with emphasis on moderate-income geographies) for business loans. There are no unexplained lending gaps. The Distribution of Reported Loans by Income Level of the Borrower is good overall. Borrower distributions are good for home mortgage loans and excellent for business loans. By individual product, borrower distributions are good for home purchase, excellent for home improvement, and excellent for home refinance loans. Our home mortgage assessment considers the impact of poverty on a low-income person’s ability to afford a mortgage loan, and the impact of fixed financing costs on a low-income borrower’s ability to benefit from a refinance loan. Our business loan assessment emphasizes market share performance. Community Development Lending has a positive impact and further supports lending performance. USB originated 13 CD loans totaling $19.6 million during the evaluation period. By dollar volume, these loans address the needs of LMI persons for affordable housing (82 percent) and community services (2 percent), as well as community needs for revitalization and stabilization (15 percent) and economic development (1 percent). This level of CD lending represents 8 percent of allocated Tier 1 Capital. Product Innovation and Flexibility have a neutral impact. Nationwide programs described in the Executive Summary section are offered in this market. Based on a limited-scope review, performance in the nonmetropolitan AAs is adequate and not inconsistent with the Nevada Low Satisfactory Lending Test rating. Performance in the Carson City and Reno-Sparks AAs is stronger than the Nevada Low Satisfactory Lending Test rating and considered good. Stronger performance is attributable to more favorable geographic distributions. Performance differences in the limited-scope AAs did not impact the Lending Test rating for the state of Nevada.

Charter Number: 24
154
INVESTMENT TEST Investment Test performance in the state of Nevada is rated Outstanding. Based on a full-scope review, performance in the Las Vegas AA is excellent. The bank made 101 investments totaling $17 million during the evaluation period. Current period investments include two bonds totaling nearly $9 million, 21 LIHTCs totaling $5 million, 19 MBSs totaling $3 million, and $425 thousand qualified grants. The bank also has 44 prior period investments with an aggregate outstanding balance of nearly $16 million. Investments are particularly responsive to affordable housing and small business needs. Total investments represent 14 percent of allocated Tier 1 Capital. Based on limited-scope reviews, performance in the Carson City, Reno-Sparks, and nonmetropolitan AAs is excellent and not inconsistent with the Nevada Outstanding Investment Test rating. USB also made 17 statewide investments totaling $79 thousand during the evaluation period. SERVICE TEST Service Test performance in the state of Nevada is rated High Satisfactory. Based on a full-scope review, performance in the Las Vegas AA is good. Retail delivery systems are accessible to geographies and individuals of different income levels, with consideration of MUI branches in close proximity to moderate-income geographies. Branching activity has improved access to banking services. The bank opened 29 branches and closed seven branches over the evaluation period. There were five net openings in LMI tracts and 17 net openings in MUI tracts. We did not identify any branch differences in product availability, services offered, or business hours that inconvenience LMI geographies or individuals. The bank provided an adequate level of CD services with at least 120 service activities involving 30 different organizations. Leadership is evident through 14 activities involving Board or committee participation. Activities are most responsive to the needs of LMI persons for community services. Based on limited-scope reviews, performance in the Carson City, Reno-Sparks, and nonmetropolitan AAs is excellent and stronger than the Nevada High Satisfactory Service Test rating. Stronger performance is attributable to more accessible retail delivery systems. Performance differences in the limited-scope AAs did not impact the Service Test rating for the state of Nevada. Refer to Tables 1-15 in the state of Nevada section of Appendix D for the facts and data supporting performance conclusions under the Lending, Investment, and Service Tests.

Charter Number: 24
155
State of New Mexico CRA Rating for the State: Outstanding
The Lending Test is rated: High Satisfactory The Investment Test is rated: Outstanding The Service Test is rated: Outstanding
The major factors that support this rating include:
Good lending performance in the full-scope area based on good overall borrower distributions, good overall geographic distributions, and an excellent level of lending activity.
Excellent investment performance in the full-scope area based on investment volume in relation to bank capacity, identified area needs, and available investment opportunities.
Excellent service performance in the full-scope area based on readily accessible retail delivery systems and a relatively high level of CD services.
Performance differences in the limited-scope AAs did not impact state ratings. Description of Institution’s Operations in the State of New Mexico The state of New Mexico is the bank’s 22nd largest rated area (of 39), in terms of deposits. It accounts for $1.5 billion and less than 1 percent of bank deposits. The bank has six AAs in this rated area, three of which are metropolitan areas. The three nonmetropolitan AAs are combined for analysis and presentation. Refer to Appendix A for a detailed listing of bank AAs. Scope of Evaluation in the State of New Mexico We performed a full-scope review of the Albuquerque AA, which includes the entire Albuquerque MSA. Other AAs received limited-scope reviews. State ratings are based primarily on performance in the full-scope area. The Albuquerque AA is the bank’s largest AA in this rated area, accounting for 67 percent of rated area deposits. There are 25 banks with 177 offices in the AA as of June 30, 2011. USB has 18 branches, 24 ATMs, and $1 billion deposits, representing an 8 percent deposit market share and 5th place rank. Primary credit products are home mortgage and business loans. There are insufficient home improvement, multifamily, and farm loans for meaningful analysis. We used two community contacts and other available information to determine there are limited CD opportunities.

Charter Number: 24
156
LENDING TEST Lending Test performance in the state of New Mexico is rated High Satisfactory. Based on a full-scope review, performance in the Albuquerque AA is good. Our assessment weights home mortgage loans more than small business loans as they respectively account for 82 percent and 18 percent of the bank’s reported loans in this AA (by number, excluding CD loans). Within the home mortgage category, our assessment gives the most weight to purchase and refinance loans, as these products respectively account for 58 percent and 41 percent of the bank’s reported home mortgage loans in this AA (by number, excluding multifamily loans). Lending Activity reflects excellent responsiveness to area credit needs in relation to deposits and competition. USB reported loans totaling $790 million over the evaluation period, ranking 3rd of 206 home purchase lenders, 11th of 271 home refinance lenders, and 5th of 72 small business lenders. The Distribution of Reported Loans by Income Level of the Geography is good overall. Geographic distributions are good for home purchase loans and excellent for business loans. By individual product, geographic distributions are excellent for home purchase loans and poor (with emphasis on moderate-income geographies) for home refinance loans. There are no unexplained lending gaps. The Distribution of Reported Loans by Income Level of the Borrower is good overall. Borrower distributions are good for home mortgage loans and excellent for business loans. By individual product, borrower distributions are good for home purchase and adequate for home refinance. Our home mortgage assessment considers the impact of poverty on a low-income person’s ability to afford a mortgage loan. Our business loan assessment emphasizes market share performance. Community Development Lending has a neutral impact on lending performance. Product Innovation and Flexibility have a neutral impact. Nationwide programs described in the Executive Summary section are offered in this market. Based on a limited-scope review, performance the Santa Fe AA is stronger than the New Mexico High Satisfactory rating and considered excellent due to more favorable CD lending. Performance in the Las Cruces and nonmetropolitan AAs is weaker than the New Mexico High Satisfactory rating, but still considered adequate. Weaker performance is attributable to less favorable borrower distributions (Las Cruces) and less favorable geographic distributions (Las Cruces AA, nonmetropolitan AAs). Performance differences in the limited-scope AAs did not impact the Lending Test rating for the state of New Mexico.

Charter Number: 24
157
INVESTMENT TEST Investment Test performance in the state of New Mexico is rated Outstanding. Based on a full-scope review, performance in the Albuquerque AA is excellent. The bank made 47 investments totaling $15 million during the evaluation period. Current period investments include nine NMTCs totaling nearly $9 million, six HTCs totaling $5 million, 15 LIHTCs totaling $1 million, and $223 thousand qualified grants. Investments are particularly responsive to revitalization/stabilization needs. Total investments represent 12 percent of allocated Tier 1 Capital. Based on a limited-scope review, bank performance in the Las Cruces AA, Santa Fe, and nonmetropolitan AAs is excellent and not inconsistent with the New Mexico Outstanding Investment Test rating. USB also made nine statewide investments totaling $95 thousand during the evaluation period, and it has two prior period statewide investments with an outstanding balance of $1 million. SERVICE TEST Service Test performance in the state of New Mexico is rated Outstanding. Based on a full-scope review, performance in the Albuquerque AA is excellent. Retail delivery systems are readily accessible to geographies and individuals of different income levels. The bank had no branch openings or closings during the evaluation period. We did not identify any branch differences in product availability, services offered, or business hours that inconvenience LMI geographies or individuals. The bank provided a relatively high level of CD services with at least ten service activities involving ten different organizations, all of which involve Board or committee leadership. Activities are most responsive to community needs for economic development. Based on limited-scope reviews, performance in the Las Cruces and Santa Fe AAs is excellent and not inconsistent with the New Mexico Outstanding Service Test rating. Service performance in the nonmetropolitan AA is weaker than the New Mexico Outstanding Service Test rating and considered very poor. Weaker performance is attributable to less accessible retail delivery systems. Performance differences in the limited-scope AAs did not impact the Service Test rating for the state of New Mexico. Refer to Tables 1-15 in the state of New Mexico section of Appendix D for the facts and data supporting performance conclusions under the Lending, Investment, and Service Tests.

Charter Number: 24
158
State of North Dakota Rating CRA Rating for the State: Outstanding
The Lending Test is rated: Outstanding The Investment Test is rated: Outstanding The Service Test is rated: High Satisfactory
The major factors that support this rating include:
Good lending performance in the full-scope area based on good overall borrower distributions, adequate overall geographic distributions, a good level of lending activity, and the positive impact of flexible lending programs. However, stronger performance in the limited-scope nonmetropolitan areas did positively impact our assessment and result in an overall excellent lending performance assessment for the state.
Excellent investment performance in the full-scope area based on investment volume (in relation to bank capacity, identified area needs, and available investment opportunities) and responsiveness to affordable housing needs. Investment performance is also excellent in the limited-scope nonmetropolitan areas.
Adequate service performance in the full-scope area based on reasonably accessible retail delivery systems and a relatively high level of CD services. However, stronger performance in the limited-scope nonmetropolitan areas did positively impact our assessment and result in an overall good service performance assessment for the state.
Description of Institution’s Operations in the State of North Dakota The state of North Dakota is the bank’s 30th largest rated area (of 39), in terms of deposits. It accounts for $682 million and less than 1 percent of bank deposits. The bank has six AAs in this rated area, one of which is a metropolitan area. The five nonmetropolitan AAs are combined for analysis and presentation. Refer to Appendix A for a detailed listing of bank AAs. Scope of Evaluation in the State of North Dakota We performed a full-scope review of the Bismarck AA, which includes the entire Bismarck MSA. Other AAs received limited-scope reviews. State ratings are based primarily on performance in the full-scope area. The Bismarck AA is the bank’s largest AA in this rated area, accounting for 48 percent of rated area deposits. There are 17 banks with 53 offices in the AA as of June 30, 2011. USB has four branches, seven ATMs, and $329 million deposits, representing a 12 percent deposit market share and 3rd place rank. Primary credit products are business and home mortgage loans. There are insufficient home improvement, multifamily, and farm loans for meaningful analysis. In addition, the AA has no low-income geographies. We used two community contacts and other available information to determine there are somewhat limited CD opportunities.
Charter Number: 24
159
LENDING TEST Lending Test performance in the state of North Dakota is rated Outstanding. Based on a full-scope review, performance in the Bismarck AA is good. Our assessment weights small business loans more than home mortgage loans as they respectively account for 69 percent and 31 percent of the bank’s reported loans in this AA (by number, excluding CD loans). Within the home mortgage category, our assessment gives the most weight to refinance and purchase loans, as these products respectively account for 74 percent and 23 percent of the bank’s reported home mortgage loans in this AA (by number, excluding multifamily loans). Lending Activity reflects good responsiveness to area credit needs in relation to deposits and competition. USB reported loans totaling $137 million over the evaluation period, ranking 15th of 65 home purchase lenders, 7th of 75 home refinance lenders, and 1st of 38 small business lenders. The Distribution of Reported Loans by Income Level of the Geography is adequate overall. Geographic distributions are poor for home mortgage loans and good for business loans. By individual product, geographic distributions are adequate for home purchase loans and very poor for home refinance loans. There are no identified lending gaps. The Distribution of Reported Loans by Income Level of the Borrower is good overall. Borrower distributions are excellent for all home mortgage products reviewed and adequate for business loans. Our home mortgage assessment considers the impact of poverty on a low-income person’s ability to afford a mortgage loan, and the impact of fixed financing costs on a low-income borrower’s ability to benefit from a refinance loan. Community Development Lending has a neutral impact on lending performance. Product Innovation and Flexibility have a positive impact and further support performance. Statewide, the bank originated 167 loans totaling $11.7 million under affordable mortgage and down payment assistance programs. Based on a limited-scope review, lending performance in the nonmetropolitan AAs is stronger than the North Dakota High Satisfactory rating and considered excellent. Stronger performance is attributable to more favorable CD lending. Because the nonmetropolitan AAs account for a majority of the bank’s deposit base in this state, the stronger performance did positively impact our assessment and result in an Outstanding Lending Test rating for the state of North Dakota.

Charter Number: 24
160
INVESTMENT TEST Investment Test performance in the state of North Dakota is rated Outstanding. Based on a full-scope review, performance in the Bismarck AA is excellent, especially after considering the somewhat limited CD opportunities. The bank made 27 investments totaling $1.7 million during the evaluation period. Current period investments include three bonds totaling $805 thousand, three MBSs totaling $733 thousand, a $181 thousand mortgage bond, and $25 thousand qualified grants. USB also has 15 prior period investments with an aggregate outstanding balance of more than $1 million. These prior period investments continue to provide benefit and meet assessment area needs. Investments are particularly responsive to affordable housing needs. Total investments represent 7 percent of allocated Tier 1 Capital. Based on a limited-scope review, performance in the nonmetropolitan AAs is excellent and not inconsistent with the North Dakota Outstanding Investment Test rating. USB also made five statewide investments totaling $708 thousand during the evaluation period, and it has two prior period statewide investments with an outstanding balance of $450 thousand. These statewide investments further demonstrate the bank’s commitment to CD. SERVICE TEST Service Test performance in the state of North Dakota is rated High Satisfactory. Based on a full-scope review, performance in the Bismarck AA is adequate. Retail delivery systems are reasonably accessible to geographies and individuals of different income levels. The bank had no branch openings or closings during the evaluation period. Branch services and hours are tailored to the convenience and needs of the AA. The bank provided a relatively high level of CD services with at least seven service activities involving seven different organizations. Leadership is evident through five activities involving Board or committee participation. Activities are most responsive to the needs of LMI persons for community services. Based on a limited-scope review, performance in the nonmetropolitan AA is excellent and stronger than performance in the Bismarck AA. Stronger performance is attributable to more accessible retail delivery systems. Because the nonmetropolitan AA accounts for a majority of the bank’s deposits in this state (52 percent), the stronger performance did positively impact our assessment and result in a High Satisfactory Service Test rating for the state of North Dakota. Refer to Tables 1-15 in the state of North Dakota section of Appendix D for the facts and data supporting performance conclusions under the Lending, Investment, and Service Tests.

Charter Number: 24
161
State of Ohio Rating CRA Rating for the State: Outstanding
The Lending Test is rated: Outstanding The Investment Test is rated: Outstanding The Service Test is rated: Outstanding
The major factors that support this rating include:
Excellent lending performance in the full-scope area based on good overall borrower distributions, excellent overall geographic distributions, a good level of lending activity, and the significantly positive impact of CD lending which elevates overall lending performance.
Excellent investment performance in the full-scope area based on investment volume in relation to bank capacity, identified area needs, and available investment opportunities.
Excellent service performance in the full-scope area based on readily accessible retail delivery systems and a relatively high level of CD services.
Performance differences in the limited-scope AAs did not impact state ratings. Description of Institution’s Operations in the State of Ohio The state of Ohio is the bank’s 10th largest rated area (of 39), in terms of deposits. It accounts for $5 billion and less than 3 percent of bank deposits. The bank has 21 AAs in this rated area, 13 of which are metropolitan areas. The eight nonmetropolitan AAs are combined for analysis and presentation. Refer to Appendix A for a detailed listing of bank AAs. Scope of Evaluation in the State of Ohio We performed a full-scope review of the Cleveland AA, which includes the entire Cleveland-Elyria-Mentor MSA. Other AAs received limited-scope reviews. State ratings are based primarily on performance in the full-scope area. The Cleveland AA is the bank’s largest AA in this rated area, accounting for 34 percent of rated area deposits. There are 43 banks with 722 offices in the AA as of June 30, 2011. USB has 65 branches, 91 ATMs, and $1.8 billion deposits, representing a 4 percent deposit market share and 9th place rank. Primary credit products are business and home mortgage loans. There are insufficient multifamily and farm loans for meaningful analysis. We used three community contacts and other available information to determine there are numerous CD opportunities.
Charter Number: 24
162
LENDING TEST Lending Test performance in the state of Ohio is rated Outstanding. Based on a full-scope review, performance in the Cleveland AA is excellent. Our assessment weights small business loans more than home mortgage loans as they respectively account for 65 percent and 35 percent of the bank’s reported loans in this AA (by number, excluding CD loans). Within the home mortgage category, our assessment gives the most weight to purchase and refinance loans, as these products respectively account for 54 percent and 42 percent of the bank’s reported home mortgage loans in this AA (by number, excluding multifamily loans). Lending Activity reflects good responsiveness to area credit needs in relation to deposits and competition. USB reported loans totaling $854 million over the evaluation period, ranking 8th of 257 home purchase lenders, 6th of 85 home improvement lenders, 12th of 313 home refinance lenders, and 4th of 95 small business lenders. The Distribution of Reported Loans by Income Level of the Geography is excellent overall. Geographic distributions are good for home mortgage loans and excellent for business loans. By individual product, geographic distributions are good for home purchase, good for home improvement, and adequate for home refinance loans. There are no unexplained lending gaps. The Distribution of Reported Loans by Income Level of the Borrower is good overall. Borrower distributions are excellent for all home mortgage products and good for business loans. Our home mortgage assessment considers the impact of poverty on a low-income person’s ability to afford a mortgage loan, and the impact of fixed financing costs on a low-income borrower’s ability to benefit from a refinance loan. Our business loan assessment emphasizes market share performance. Community Development Lending has a significantly positive impact and elevates overall lending performance. USB originated six CD loans totaling $27.5 million during the evaluation period. By dollar volume, these loans address community needs for revitalization and stabilization (65 percent) and economic development (6 percent), as well as the needs of LMI persons for affordable housing (29 percent). This level of CD lending represents 12 percent of allocated Tier 1 Capital. Product Innovation and Flexibility have a neutral impact. Nationwide programs described in the Executive Summary section are offered in this market.
Charter Number: 24
163
Based on limited-scope reviews, performance in the Akron, Columbus, Dayton, Sandusky, and Youngstown-Warren-Boardman AAs is excellent and not inconsistent with the Ohio Outstanding Lending Test rating. Performance in the other limited-scope areas is weaker than the Ohio Outstanding Lending Test rating, but still considered good (Canton-Massillon, Lima, Mansfield, Springfield, Toledo, Weirton-Steubenville, and nonmetropolitan AAs) or adequate (Huntington-Ashland AA). Weaker performance is attributable to less favorable CD lending (Mansfield, Weirton-Steubenville, and nonmetropolitan AAs), less favorable borrower distributions (Mansfield and Springfield AAs), and less favorable geographic distributions (Canton-Massillon, Huntington-Ashland, Lima, and Weirton-Steubenville AAs). Performance differences in the limited-scope AAs did not impact the Lending Test rating for the state of Ohio. INVESTMENT TEST Investment Test performance in the state of Ohio is rated Outstanding. Based on a full-scope review, performance in the Cleveland AA is excellent. The bank made 371 investments totaling $71 million during the evaluation period. Current period investments include of 248 LIHTCs totaling $27 million, 10 NMTCs totaling $22 million, 15 HTCs totaling $20 million, two equity investments totaling more than $1 million, and $497 thousand qualified grants and in-kind donations. The bank also has 33 prior period investments with an aggregate outstanding balance of $27 million. Investments are particularly responsive to affordable housing and revitalization/stabilization needs. Total investments represent 43 percent of allocated Tier 1 Capital. Performance in most of the limited-scope AAs is excellent and not inconsistent with the Ohio Outstanding Investment Test rating (Akron, Canton-Massillon, Columbus, Dayton, Lima, Mansfield, Sandusky, Springfield, Toledo, Weirton-Steubenville, Youngstown-Warren-Boardman, and the nonmetropolitan AAs). Performance in the Huntington-Ashland AA is weaker than the Ohio Outstanding Investment Test rating, but still considered good. Weaker performance is attributable to lower relative investment volumes. This performance difference did not impact the Investment Test rating for the state of Ohio. USB also made 20 statewide investments totaling almost $10 million during the evaluation period, and it has one prior period statewide investment with an outstanding balance of $500 thousand. These statewide investments further demonstrate the bank’s commitment to community development.

Charter Number: 24
164
SERVICE TEST Service Test performance in the state of Ohio is rated Outstanding. Based on a full-scope review, performance in the Cleveland AA is excellent. Retail delivery systems are readily accessible to geographies and individuals of different income levels, with consideration of MUI branches in close proximity to moderate-income geographies. Strong ATM distributions in LMI areas also support access. Branching activity has not significantly affected access to banking services. The bank opened seven and closed 13 branches during the evaluation period. Retail accessibility for low-income areas improved with one net branch opening in a low-income tract. The bank had two net branch closures in moderate-income tracts, which were due to lease expirations. It also had four net closures in MUI tracts. We did not identify any branch differences in product availability, services offered, or business hours that inconvenience LMI geographies or individuals. The bank provided a relatively high level of CD services with at least 138 service activities involving 58 different organizations. Active leadership hours are evident through 36 activities involving Board or committee participation. Activities are most responsive to the needs of LMI persons for community services. Based on limited-scope reviews, performance in the Canton-Massillon, Columbus, Huntington-Ashland, Sandusky, and nonmetropolitan AAs is excellent and not inconsistent with the Ohio Outstanding Service Test rating. Service performance in the other limited-scope AAs is weaker than the Ohio Outstanding Service Test rating, but still considered good (Akron, Toledo, Weirton-Steubenville, and Youngstown-Warren-Boardman AAs) or adequate (Dayton, Lima, Mansfield, and Springfield AAs). Weaker performance is attributable to less accessible retail delivery systems. Performance differences in the limited-scope AAs did not impact the Service Test rating for the state of Ohio. Refer to Tables 1-15 in the state of Ohio section of Appendix D for the facts and data supporting performance conclusions under the Lending, Investment, and Service Tests.

Charter Number: 24
165
State of Oregon Rating CRA Rating for the State: Outstanding
The Lending Test is rated: Outstanding The Investment Test is rated: Outstanding The Service Test is rated: Outstanding
The major factors that support this rating include:
Excellent lending performance in the full-scope area based on good overall borrower distributions, good overall geographic distributions, an excellent level of lending activity, and the significantly positive impact of CD lending which elevates overall lending performance.
Good investment performance in the full-scope area based on investment volume in relation to bank capacity, identified area needs, and available investment opportunities. However, stronger performance in several limited-scope areas did positively impact our assessment and result in an overall excellent performance assessment for the state.
Excellent service performance in the full-scope area based on readily accessible retail delivery systems and an adequate level of CD services.
Performance differences in the limited-scope AAs did not impact state ratings. Description of Institution’s Operations in the State of Oregon The state of Oregon is the bank’s 12th largest rated area (of 39), in terms of deposits. It accounts for $3.7 billion and less than 2 percent of bank deposits. The bank has eight AAs in this rated area, five of which are metropolitan areas. The three nonmetropolitan AAs are combined for analysis and presentation. Refer to Appendix A for a detailed listing of bank AAs. Scope of Evaluation in the State of Oregon We performed a full-scope review of the Salem AA, which includes the entire Salem MSA. Other AAs received limited-scope reviews. State ratings are based primarily on performance in the full-scope area. The Salem AA is the bank’s largest AA in this rated area, accounting for 22 percent of rated area deposits. There are 17 banks with 99 offices in the AA as of June 30, 2011. USB has 17 branches, 31 ATMs, and $791 million deposits, representing a 20 percent deposit market share and 1st place rank. Primary credit products are business and home mortgage loans. There are insufficient multifamily loans for meaningful analysis. We used two community contacts and other available information to determine there are many CD opportunities.
Charter Number: 24
166
LENDING TEST Lending Test performance in the state of Oregon is rated Outstanding. Based on a full-scope review, performance in the Salem AA is excellent. Our assessment weights small business loans more than home mortgage loans as they respectively account for 62 percent and 38 percent of the bank’s reported loans in this AA (by number, excluding CD loans). Within the home mortgage category, our assessment gives the most weight to refinance and purchase loans, as these products respectively account for 75 percent and 21 percent of the bank’s reported home mortgage loans in this AA (by number, excluding multifamily loans). Lending Activity reflects excellent responsiveness to area credit needs in relation to deposits and competition. USB reported loans totaling $474 million over the evaluation period, ranking 6th of 147 home purchase lenders, 2nd of 41 home improvement lenders, 3rd of 219 home refinance lenders, 1st of 44 small business lenders, and 6th of 18 small farm lenders. The Distribution of Reported Loans by Income Level of the Geography is good overall. Our assessment emphasizes moderate-income geographies as they have more lending opportunity for all product types. Geographic distributions are adequate for home mortgage loans, good for business loans, and poor for farm loans. By individual product, geographic distributions are excellent for home purchase, adequate for home improvement, and adequate for home refinance loans. There are no identified lending gaps. The Distribution of Reported Loans by Income Level of the Borrower is good overall. Borrower distributions are excellent for home mortgage loans, good for business loans, and adequate for farm loans. By individual product, borrower distributions are excellent for home purchase, good for home improvement, and excellent for home refinance loans. Our home mortgage assessment considers the impact of poverty on a low-income person’s ability to afford a mortgage loan, and the impact of fixed financing costs on a low-income borrower’s ability to benefit from a refinance loan. Our business loan assessment emphasizes market share performance. Community Development Lending has a significantly positive impact and elevates overall lending performance. USB originated 11 CD loans totaling $13.9 million during the evaluation period. By dollar volume, these loans address the needs of LMI persons for community services (94 percent) and affordable housing (6 percent). This level of CD lending represents 14 percent of allocated Tier 1 Capital. Product Innovation and Flexibility have a neutral impact. Nationwide programs described in the Executive Summary section are offered in this market.

Charter Number: 24
167
Based on a limited-scope review, performance in the Medford and nonmetropolitan AAs is excellent and not inconsistent with the Oregon Outstanding Lending Test rating. Performance in the Bend, Corvallis, and Eugene-Springfield is weaker than the Oregon Outstanding Lending Test rating, but still considered good. Weaker performance is attributable to less favorable CD lending (Bend, Corvallis, and Eugene-Springfield AAs), and less favorable geographic distributions (nonmetropolitan AAs). Performance differences in the limited-scope AAs did not impact the Lending Test rating for the state of Oregon. INVESTMENT TEST Investment Test performance in the state of Oregon is rated Outstanding. Based on a full-scope review, performance in the Salem AA is good. The bank made 43 investments totaling $4.5 million during the evaluation period. Current period investments include 15 LIHTCs totaling $2 million, six MBSs totaling $1 million, two bonds totaling $981 thousand, and $122 thousand qualified grants. The bank also has 19 prior period investments with an aggregate outstanding balance of $1.4 million. Investments are particularly responsive to affordable housing needs. Total investments represent 6 percent of allocated Tier 1 Capital. Based on limited-scope reviews, performance in the Eugene-Springfield AA is good and not inconsistent with performance in the Salem AA. Performance in the Bend, Corvallis, Medford, and nonmetropolitan AAs is excellent and stronger than performance in the Salem AA. Stronger performance is attributable to higher relative investment volumes. Because the stronger performing AAs collectively account for a majority of the bank’s deposits in this state (65 percent), their stronger performance did positively impact our assessment and result in an Outstanding Investment Test rating for the state of Oregon. USB also made 54 statewide investments totaling $310 thousand during the evaluation period, and it has five prior period statewide investments with an outstanding balance of $1.4 million. These statewide investments further demonstrate the bank’s commitment to CD. SERVICE TEST Service Test performance in the state of Oregon is rated Outstanding. Based on a full-scope review, performance in the Salem AA is excellent. Retail delivery systems are readily accessible to geographies and individuals of different income levels. Branching activity during the evaluation period did not adversely affect access to banking services. The bank opened one branch in an upper-income geography. We did not identify any branch differences in product availability, services offered, or business hours that inconvenience LMI geographies or individuals. The bank provided an adequate level of CD services with at least 36 service activities involving 19 different organizations. Leadership is evident through nine activities involving Board or committee participation. Activities are most responsive to the needs of LMI persons for community services.

Charter Number: 24
168
Based on limited-scope reviews, performance in the Bend, Corvallis, and nonmetropolitan AAs is excellent and not inconsistent with the Oregon Outstanding Service Test Rating. Service performance in the other limited-scope areas is weaker than the Oregon Outstanding Service Test rating, but still considered good (Eugene-Springfield AA) or adequate (Medford AA). Weaker performance is attributable to less accessible retail delivery systems. Performance differences in the limited-scope AAs did not impact the Service Test rating for the state of Oregon. Refer to Tables 1-15 in the state of Oregon section of Appendix D for the facts and data supporting performance conclusions under the Lending, Investment, and Service Tests.

Charter Number: 24
169
State of South Dakota Rating CRA Rating for the State: Outstanding
The Lending Test is rated: Outstanding The Investment Test is rated: Outstanding The Service Test is rated: Outstanding
The major factors that support this rating include:
Excellent lending performance in the full-scope area based on good overall borrower distributions, adequate overall geographic distributions, an excellent level of lending activity, the positive impact of innovative and flexible lending programs, and the significantly positive impact of CD lending which elevates overall lending performance.
Excellent investment performance in the full-scope area based on investment volume (in relation to bank capacity, identified area needs, and available investment opportunities) and responsiveness to affordable housing needs.
Excellent service performance in the full-scope area based on readily accessible retail delivery systems and a relatively high level of CD services.
Performance differences in the limited-scope AAs did not impact state ratings. Description of Institution’s Operations in the State of South Dakota The state of South Dakota is the bank’s 29th largest rated area (of 39), in terms of deposits. It accounts for $745 million and less than 1 percent of bank deposits. The bank has five AAs in this rated area, two of which are metropolitan areas. The three nonmetropolitan AAs are combined for analysis and presentation. Refer to Appendix A for a detailed listing of bank AAs. Scope of Evaluation in the State of South Dakota We performed a full-scope review of the Sioux Falls AA, which includes two (of four) counties in the Sioux Falls MSA. Other AAs received limited-scope reviews. State ratings are based primarily on performance in the full-scope area. The Sioux Falls AA is the bank’s largest AA in this rated area, accounting for 43 percent of rated area deposits. There are 29 banks with 122 offices in the AA as of June 30, 2011. USB has 10 branches, 27 ATMs, and $323 million deposits, representing less than 1 percent deposit market share and a 7th place rank. Primary credit products are business and home mortgage loans. There are insufficient multifamily loans for meaningful analysis. In addition, the AA has no low-income geographies. We used two community contacts and other information to determine there are CD opportunities available.
Charter Number: 24
170
LENDING TEST Lending Test performance in the state of South Dakota is rated Outstanding. Based on a full-scope review, performance in the Sioux Falls AA is excellent. Our assessment weights small business loans more than home mortgage loans as they respectively account for 61 percent and 39 percent of the bank’s reported loans in this AA (by number, excluding CD loans). Within the home mortgage category, our assessment gives the most weight to refinance and purchase loans, as these products respectively account for 72 percent and 24 percent of the bank’s reported home mortgage loans in this AA (by number, excluding multifamily loans). Lending Activity reflects excellent responsiveness to area credit needs in relation to deposits and competition. USB reported loans totaling $442 million over the evaluation period, ranking 15th of 96 home purchase lenders, 7th of 41 home improvement lenders, 5th of 119 home refinance lenders, 2nd of 44 small business lenders, and 2nd of 15 small farm lenders. The Distribution of Reported Loans by Income Level of the Geography is adequate overall. Geographic distributions are poor for home mortgage loans, excellent for business loans, and very poor for farm loans. By individual product, geographic distributions are poor for home purchase, excellent for home improvement, and poor for home refinance loans. There are no unexplained lending gaps. The Distribution of Reported Loans by Income Level of the Borrower is good overall. Borrower distributions are excellent for all home mortgage products, good for business loans, and good for farm loans. Our home mortgage assessment considers the impact of poverty on a low-income person’s ability to afford a mortgage loan. Our business loan assessment emphasizes market share performance. Community Development Lending has a significantly positive impact and elevates overall lending performance. USB originated eight CD loans totaling $28.4 million during the evaluation period. By dollar volume, these loans address community needs for revitalization and stabilization (85 percent) and economic development (7 percent), as well as the needs of LMI persons for community services (8 percent). This level of CD lending represents 70 percent of allocated Tier 1 Capital. Product Innovation and Flexibility have a positive impact and further support performance. In the Sioux Falls AA, the bank originated two loans totaling $21.5 million under its innovative private placement bond program. It also made 15 loans totaling $76 thousand under affordable housing down payment assistance programs. This volume of innovative and flexible lending represents 53 percent of allocated Tier 1 Capital. Statewide, the bank made another 94 loans totaling $7.5 million under affordable mortgage and down payment assistance programs, and three loans totaling $428 thousand under a government farm lending program.

Charter Number: 24
171
Based on a limited-scope review, performance in the nonmetropolitan AAs is excellent and not inconsistent with the South Dakota Outstanding Lending Test rating. Performance in the Rapid City AA is weaker than the South Dakota Outstanding Lending Test rating, but still considered good. Weaker performance is attributable to less favorable CD lending. Performance differences in the limited-scope AAs did not impact the Lending Test rating for the state of South Dakota. INVESTMENT TEST Investment Test performance in the state of South Dakota is rated Outstanding. Based on a full-scope review, performance in the Sioux Falls AA is excellent. The bank made 18 investments totaling $2 million during the evaluation period. Current period investments include seven MBSs totaling $799 thousand, two bonds totaling $745 thousand, a $169 thousand mortgage bond, and $331 thousand grants and in-kind donations. The bank also has 10 prior period investments with an aggregate outstanding balance of $742 thousand. These prior period investments continue to provide benefit and meet assessment area needs. Investments are particularly responsive to affordable housing needs. Total investments represent 7 percent of allocated Tier 1 Capital. Based on limited-scope reviews, performance in the Rapid City and nonmetropolitan AAs is excellent and not inconsistent with the South Dakota Outstanding Investment Test rating. USB also has four prior period statewide investments with an outstanding balance of $1 million. These statewide investments further demonstrate the bank’s commitment to CD. SERVICE TEST Service Test performance in the state of South Dakota is rated Outstanding. Based on a full-scope review, performance in the Sioux Falls AA is excellent. Retail delivery systems are readily accessible to geographies and individuals of different income levels. The bank had no branch openings or closings during the evaluation period. Branch services and hours are tailored to the convenience and needs of the AA. The bank provided a relatively high level of CD services with at least 27 service activities involving 16 different organizations. Active leadership hours are evident through 11 activities involving Board or committee participation. Activities are most responsive to the needs of LMI persons for community services. Based on limited-scope reviews, performance in the Rapid City and nonmetropolitan AAs is excellent and not inconsistent with the South Dakota Outstanding Service Test rating. Refer to Tables 1-15 in the state of South Dakota section of Appendix D for the facts and data supporting performance conclusions under the Lending, Investment, and Service Tests.

Charter Number: 24
172
State of Tennessee Rating CRA Rating for the State: Satisfactory
The Lending Test is rated: High Satisfactory The Investment Test is rated: Outstanding The Service Test is rated: Low Satisfactory
The major factors that support this rating include:
Good lending performance in the full-scope area based on excellent overall borrower distributions, adequate overall geographic distributions, and an excellent level of lending activity. CD lending has a positive impact and further supports lending performance.
Excellent investment performance in the full-scope area based on investment volume in relation to bank capacity, identified area needs, and available investment opportunities.
Adequate service performance in the full-scope area based on reasonably accessible retail delivery systems and a relatively high level of CD services.
Performance differences in the limited-scope AAs did not impact state ratings. Description of Institution’s Operations in the State of Tennessee The state of Tennessee is the bank’s 21st largest rated area (of 39), in terms of deposits. It accounts for $1.8 billion and 1 percent of bank deposits. The bank has six AAs in this rated area, three of which are metropolitan areas. The three nonmetropolitan AAs are combined for analysis and presentation. Refer to Appendix A for a detailed listing of bank AAs. Scope of Evaluation in the State of Tennessee We performed a full-scope review of the Nashville AA, which includes eight (of 13) counties in the Nashville-Davidson-Murfreesboro-Franklin MSA. Other AAs received limited-scope reviews. State ratings are based primarily on performance in the full-scope area. The Nashville AA is the bank’s largest AA in this rated area, accounting for 64 percent of rated area deposits. There are 62 banks with 533 offices in the AA as of June 30, 2011. USB has 52 branches, 65 ATMs, and $1.2 billion deposits, representing a 3 percent deposit market share and 8th place rank. Primary credit products are home mortgage and business loans. There are insufficient multifamily and farm loans for meaningful analysis. We used three community contacts and other information to determine there are CD opportunities available.

Charter Number: 24
173
LENDING TEST Lending Test performance in the state of Tennessee is rated High Satisfactory. Based on a full-scope review, performance in the Nashville AA is good. Our assessment weights home mortgage loans more than small business loans as they respectively account for 58 percent and 42 percent of the bank’s reported loans in this AA (by number, excluding CD loans). Within the home mortgage category, our assessment gives the most weight to refinance and purchase loans, as these products respectively account for 69 percent and 28 percent of the bank’s reported home mortgage loans in this AA (by number, excluding multifamily loans). Lending Activity reflects excellent responsiveness to area credit needs in relation to deposits and competition. USB reported loans totaling $1.5 billion over the evaluation period, ranking 10th of 382 home purchase lenders, 5th of 131 home improvement lenders, 4th of 432 home refinance lenders, and 3rd of 109 small business lenders. The Distribution of Reported Loans by Income Level of the Geography is adequate overall. Geographic distributions are poor for home mortgage loans and good for business loans. By individual product, geographic distributions are poor for home purchase, adequate for home improvement, and poor for home refinance loans. There are no unexplained lending gaps. The Distribution of Reported Loans by Income Level of the Borrower is excellent overall. Borrower distributions are excellent for all products reviewed. Our home mortgage assessment considers the impact of poverty on a low-income person’s ability to afford a mortgage loan. Our business loan assessment emphasizes market share performance. Community Development Lending has a positive impact and further supports lending performance. USB originated six CD loans totaling $13.5 million during the evaluation period. By dollar volume, these loans address the needs of LMI persons for affordable housing (76 percent), as well as community needs for revitalization and stabilization (17 percent) and economic development (7 percent). This level of CD lending represents 9 percent of allocated Tier 1 Capital. Product Innovation and Flexibility have a neutral impact. Nationwide programs described in the Executive Summary section are offered in this market. Based on limited-scope reviews, performance in the Kingsport-Bristol and nonmetropolitan AAs is good and not inconsistent with the Tennessee High Satisfactory Lending Test rating. Performance in the Morristown AA is stronger than the Tennessee High Satisfactory Lending Test rating and considered excellent. Stronger performance is attributable to more favorable geographic distributions. Performance differences in the limited-scope AAs did not impact the Lending Test rating for the state of Tennessee.
Charter Number: 24
174
INVESTMENT TEST Investment Test performance in the state of Tennessee is rated Outstanding. Based on a full-scope review, performance in the Nashville AA is excellent. The bank made 64 investments totaling $6 million during the evaluation period. Current period investments include three bonds totaling $3 million, 14 MBSs totaling nearly $3 million, four LIHTCs totaling $164 thousand, and $137 thousand qualified grants. The bank also has 46 prior period investments with an aggregate outstanding balance of $36 million. These prior period investments continue to provide benefit and meet assessment area needs. Investments are particularly responsive to affordable housing and small business needs. Total investments represent 29 percent of allocated Tier 1 Capital. Based on limited-scope reviews, performance in the Kingsport-Bristol, Morristown, and nonmetropolitan AAs is excellent and not inconsistent with the Tennessee Outstanding Investment Test rating. USB also made one statewide investment totaling $5 thousand during the evaluation period. SERVICE TEST Service Test performance in the state of Tennessee is rated Low Satisfactory. Based on a full-scope review, performance in the Nashville AA is adequate. Retail delivery systems are reasonably accessible to geographies and individuals of different income levels, with consideration of MUI branches in close proximity to LMI geographies. Branching activity did not adversely affect access to banking services. The bank opened three MUI branches during the evaluation period. Branch services and hours are tailored to the convenience and needs of the AA. The bank provided a relatively high level of CD services with at least 117 service activities involving 41 different organizations. Leadership is evident through 18 activities involving Board or committee participation. Activities are most responsive to the needs of LMI persons for community services. Based on a limited-scope review, performance in the Kingsport-Bristol AA is adequate and not inconsistent with the Tennessee Low Satisfactory Service Test rating. Service performance in other limited-scope areas is stronger than the Tennessee Low Satisfactory Service Test rating, and considered excellent (nonmetropolitan AA) or good (Morristown AA). Stronger performance is attributable to more accessible retail delivery systems. Performance differences in the limited-scope AAs did not impact the Service Test rating for the state of Tennessee. Refer to Tables 1-15 in the state of Tennessee section of Appendix D for the facts and data supporting performance conclusions under the Lending, Investment, and Service Tests.

Charter Number: 24
175
State of Utah Rating CRA Rating for the State: Outstanding
The Lending Test is rated: Outstanding The Investment Test is rated: Outstanding The Service Test is rated: High Satisfactory
The major factors that support this rating include:
Excellent lending performance in the full-scope area based on excellent overall borrower distributions, good overall geographic distributions, an excellent level of lending activity. CD lending has a significantly positive impact and further supports lending performance.
Excellent investment performance in the full-scope area based on investment volume in relation to bank capacity, identified area needs, and available investment opportunities.
Good service performance in the full-scope area based on accessible retail delivery systems and an adequate level of CD services.
Performance differences in the limited-scope AAs did not impact state ratings. Description of Institution’s Operations in the State of Utah The state of Utah is the bank’s 23rd largest rated area (of 39), in terms of deposits. It accounts for $1.5 billion and less than 1 percent of bank deposits. The bank has seven AAs in this rated area, four of which are metropolitan areas. The three nonmetropolitan AAs are combined for analysis and presentation. Refer to Appendix A for a detailed listing of bank AAs. Scope of Evaluation in the State of Utah We performed a full-scope review of the Salt Lake AA, which includes two (of three) counties in the Salt Lake City MSA. Other AAs received limited-scope reviews. State ratings are based primarily on performance in the full-scope area. The Salt Lake AA is the bank’s largest AA in this rated area, accounting for 84 percent of rated area deposits. There are 50 banks with 268 offices in the AA as of June 30, 2011. USB has 38 branches, 52 ATMs, and $1.2 billion deposits, representing less than a 1 percent deposit market share and 18th place rank. Primary credit products are home mortgage and business loans. There are insufficient multifamily and farm loans for meaningful analysis. We used two community contacts and other information to determine there are CD opportunities available.
Charter Number: 24
176
LENDING TEST Lending Test performance in the state of Utah is rated Outstanding. Based on a full-scope review, performance in the Salt Lake AA is excellent. Our assessment weights home mortgage loans more than small business loans as they respectively account for 61 percent and 39 percent of the bank’s reported loans in this AA (by number, excluding CD loans). Within the home mortgage category, our assessment gives the most weight to refinance and purchase loans, as these products respectively account for 73 percent and 25 percent of the bank’s reported home mortgage loans in this AA (by number, excluding multifamily loans). Lending Activity reflects excellent responsiveness to area credit needs in relation to deposits and competition. USB reported loans totaling $1.7 billion over the evaluation period, ranking 12th of 230 home purchase lenders, 7th of 76 home improvement lenders, 5th of 268 home refinance lenders, and 5th of 77 small business lenders. The Distribution of Reported Loans by Income Level of the Geography is good overall. Geographic distributions are good for home mortgage loans and excellent for business loans. By individual product, geographic distributions are excellent for home purchase, good (with emphasis on moderate-income geographies) for home improvement, and adequate for home refinance loans. There are no unexplained lending gaps. The Distribution of Reported Loans by Income Level of the Borrower is excellent overall. Borrower distributions are excellent for home mortgage loans and good for business loans. By individual product, borrower distributions are good for home purchase, good for home improvement, and excellent for home refinance loans. Our home mortgage assessment considers the impact of poverty on a low-income person’s ability to afford a mortgage loan, and the impact of fixed financing costs on a low-income borrower’s ability to benefit from a refinance loan. Community Development Lending has a significantly positive impact and further supports lending performance. USB originated eight CD loans totaling $27.3 million during the evaluation period. By dollar volume, these loans address the needs of LMI persons for affordable housing (49 percent), as well as community needs for revitalization and stabilization (43 percent) and economic development (8 percent). This level of CD lending represents 18 percent of allocated Tier 1 Capital. Product Innovation and Flexibility have a neutral impact. Nationwide programs described in the Executive Summary section are offered in this market. Based on a limited-scope review, performance in the Ogden-Clearfield AA is excellent and not inconsistent with the Utah Outstanding Lending Test rating. Performance in the other limited-scope areas is weaker than the Utah Outstanding Lending Test rating, but still considered good (St. George AA) or adequate (Provo-Orem and nonmetropolitan AAs). Weaker performance is attributable to less favorable CD lending and borrower distributions (all) and less favorable geographic distributions (Provo-Orem and nonmetropolitan AAs). Performance differences in the limited-scope AAs did not impact the Lending Test rating for the state of Utah.
Charter Number: 24
177
INVESTMENT TEST Investment Test performance in the state of Utah is rated Outstanding. Based on a full-scope review, performance in the Salt Lake AA is excellent. The bank made 72 investments totaling $9 million during the evaluation period. Current period investments include 21 LIHTCs totaling $6 million, seven MBSs totaling $2 million, two HTCs totaling $779 thousand, a $430 thousand bond, and $223 thousand qualified grants. The bank also has 14 prior period investments with an aggregate outstanding balance of $7 million. These prior period investments continue to provide benefit and meet assessment area needs. Investments are particularly responsive to affordable housing needs. Total investments represent 10 percent of allocated Tier 1 Capital. Based on limited-scope reviews, performance in the Ogden-Clearfield, Provo-Orem, St. George, and nonmetropolitan AAs is excellent and not inconsistent with the Utah Outstanding Investment Test rating. USB also made 10 statewide investments totaling $31 thousand during the evaluation period, and it has one prior period statewide investment with an outstanding balance of $200 thousand. SERVICE TEST Service Test performance in the state of Utah is rated High Satisfactory. Based on a full-scope review, performance in the Salt Lake AA is good. Retail delivery systems are accessible to geographies and individuals of different income levels. The bank improved retail accessibility by opening 14 branches during the evaluation period, including two branches in moderate-income tracts. We did not identify any branch differences in product availability, services offered, or business hours that inconvenience LMI geographies or individuals. The bank provided an adequate level of CD services with at least 58 service activities involving 14 different organizations. Leadership is evident through ten activities involving Board or committee participation. Activities are most responsive to the needs of LMI persons for community services.
Charter Number: 24
178
Based on a limited-scope review, performance in the Ogden-Clearfield AA is excellent and stronger than the Utah High Satisfactory Service Test rating. Service performance in the Provo-Orem, St. George, and nonmetropolitan AAs is weaker than the Utah High Satisfactory Service Test rating, but still considered adequate. Stronger (or weaker) performance is attributable to more accessible (or less accessible) retail delivery systems. Performance differences in the limited-scope AAs did not impact the Service Test rating for the state of Utah. Refer to Tables 1-15 in the state of Utah section of Appendix D for the facts and data supporting performance conclusions under the Lending, Investment, and Service Tests.
Charter Number: 24
179
State of Wyoming Rating CRA Rating for the State: Outstanding
The Lending Test is rated: High Satisfactory The Investment Test is rated: Outstanding The Service Test is rated: Outstanding
The major factors that support this rating include:
Excellent lending performance in the full-scope area based on adequate overall borrower distributions, good overall geographic distributions, an excellent level of lending activity, and the significantly positive impact of CD lending which elevates overall lending performance in the full-scope area. However, weaker performance in the limited-scope areas did impact our assessment and result in an overall good lending performance assessment for the state
Excellent investment performance in the full-scope area based on investment volume in relation to bank capacity, identified area needs, and available investment opportunities. Investment performance is also excellent in the limited-scope areas.
Excellent service performance in the full-scope area based on readily accessible retail delivery systems and an excellent level of CD services. Service performance is also excellent in the limited-scope areas.
Description of Institution’s Operations in the State of Wyoming The state of Wyoming is the bank’s 34th largest rated area (of 39), in terms of deposits. It accounts for $338 million and less than 1 percent of bank deposits. The bank has eight AAs in this rated area, two of which are metropolitan areas. The six nonmetropolitan AAs are combined for analysis and presentation. Refer to Appendix A for a detailed listing of bank AAs. Scope of Evaluation in the State of Wyoming We performed a full-scope review of the Cheyenne AA, which includes the entire Cheyenne MSA. Other AAs received limited-scope reviews. State ratings are based primarily on performance in the full-scope area, unless noted otherwise. The Cheyenne AA is the bank’s largest AA in this rated area, accounting for 30 percent of rated area deposits. There are 19 banks with 31 offices in the AA as of June 30, 2011. USB has two branches, two ATMs, and $101 million deposits, representing an 8 percent deposit market share and 6th place rank. Primary credit products are home mortgage and business loans. There are insufficient home improvement, multifamily, and farm loans for meaningful analysis. In addition, the AA has no low-income geographies. We used two community contacts and other information to determine there are CD opportunities available.

Charter Number: 24
180
LENDING TEST Lending Test performance in the state of Wyoming is rated High Satisfactory. Based on a full-scope review, performance in the Cheyenne AA is excellent. Our assessment weights home mortgage loans more than small business loans as they respectively account for 65 percent and 35 percent of the bank’s reported loans in this AA (by number, excluding CD loans). Within the home mortgage category, our assessment gives the most weight to refinance and purchase loans, as these products respectively account for 64 percent and 34 percent of the bank’s reported home mortgage loans in this AA (by number, excluding multifamily loans). Lending Activity reflects excellent responsiveness to area credit needs in relation to deposits and competition. USB reported loans totaling $124 million over the evaluation period, ranking 8th of 80 home purchase lenders, 4th of 110 home refinance lenders, and 5th of 41 small business lenders. The Distribution of Reported Loans by Income Level of the Geography is good overall. Geographic distributions are adequate for all home mortgage products reviewed and excellent for business loans. There are no unexplained lending gaps. The Distribution of Reported Loans by Income Level of the Borrower is adequate overall. Borrower distributions are adequate for all products reviewed. Our home mortgage assessment considers the impact of poverty on a low-income person’s ability to afford a mortgage loan. Community Development Lending has a significantly positive impact and elevates overall lending performance. USB originated eight CD loans totaling $1.6 million during the evaluation period. By dollar volume, these loans community needs for revitalization and stabilization (88 percent), as well as the needs of LMI persons for community services (6 percent) and affordable housing (6 percent). This level of CD lending represents 12 percent of allocated Tier 1 Capital. Product Innovation and Flexibility have a neutral impact. Nationwide programs described in the Executive Summary section are offered in this market. Based on a limited-scope review, performance in the limited scope AAs is weaker than performance in the Cheyenne AA, but still considered good (Casper AA) or adequate (nonmetropolitan AAs). Weaker performance is attributable to less favorable CD lending and geographic distributions. Because the limited scope AAs account for a majority of the bank’s deposit base in this state, the weaker performance did impact our assessment and result in a High Satisfactory Lending Test rating for the state of Wyoming.

Charter Number: 24
181
INVESTMENT TEST Investment Test performance in the state of Wyoming is rated Outstanding. Based on a full-scope review, performance in the Cheyenne AA is excellent. The bank made 22 investments totaling $1.8 million during the evaluation period. Current period investments include eight MBSs totaling $1.3 million, a $500 thousand bond, and $18 thousand qualified grants. The bank also has five prior period investments with an aggregate outstanding balance of $2 million. Investments are particularly responsive to affordable housing and small business needs. Total investments represent 30 percent of allocated Tier 1 Capital. Based on a limited-scope review, performance in the Casper and nonmetropolitan AAs is excellent and not inconsistent with the Wyoming Outstanding Investment Test rating. USB also made three statewide investments totaling $11 thousand during the evaluation period. SERVICE TEST Service Test performance in the state of Wyoming is rated Outstanding. Based on a full-scope review, performance in the Cheyenne AA is excellent. Retail delivery systems are readily accessible to geographies and individuals of different income levels. The bank had no branch openings or closings during the evaluation period. We did not identify any branch differences in product availability, services offered, or business hours that inconvenience LMI geographies or individuals. The bank provided an excellent level of CD services with at least seven service activities involving five different organizations. Strong leadership is evident through five activities involving Board or committee participation. Activities are most responsive to the needs of LMI persons for community services. Based on limited-scope reviews, performance in the Casper and nonmetropolitan AAs is excellent and not inconsistent with the Wyoming Outstanding Service Test rating. Refer to Tables 1-15 in the state of Wyoming section of Appendix D for the facts and data supporting performance conclusions under the Lending, Investment, and Service Tests.
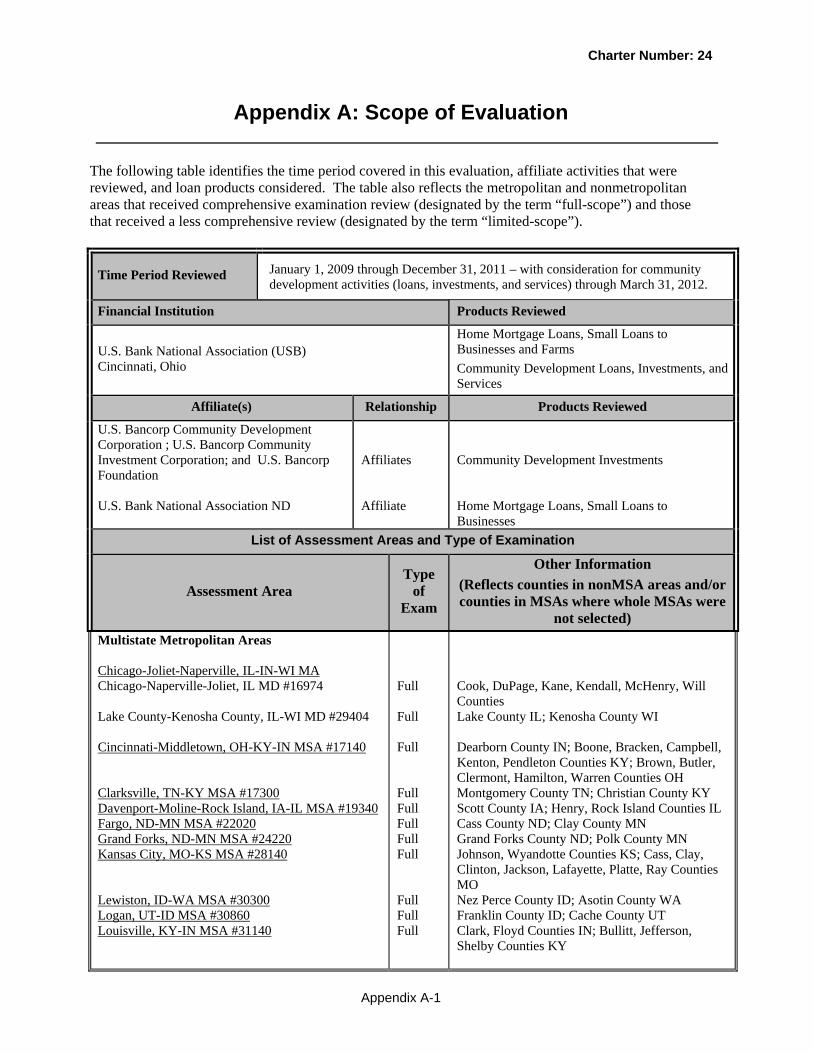
Charter Number: 24
Appendix A-1
Appendix A: Scope of Evaluation The following table identifies the time period covered in this evaluation, affiliate activities that were reviewed, and loan products considered. The table also reflects the metropolitan and nonmetropolitan areas that received comprehensive examination review (designated by the term “full-scope”) and those that received a less comprehensive review (designated by the term “limited-scope”).
Time Period Reviewed January 1, 2009 through December 31, 2011 – with consideration for community development activities (loans, investments, and services) through March 31, 2012.
Financial Institution Products Reviewed
U.S. Bank National Association (USB) Cincinnati, Ohio
Home Mortgage Loans, Small Loans to Businesses and Farms
Community Development Loans, Investments, and Services
Affiliate(s) Relationship Products Reviewed
U.S. Bancorp Community Development Corporation ; U.S. Bancorp Community Investment Corporation; and U.S. Bancorp Foundation U.S. Bank National Association ND
Affiliates Affiliate
Community Development Investments Home Mortgage Loans, Small Loans to Businesses
List of Assessment Areas and Type of Examination
Assessment Area Type
of Exam
Other Information (Reflects counties in nonMSA areas and/or counties in MSAs where whole MSAs were
not selected) Multistate Metropolitan Areas Chicago-Joliet-Naperville, IL-IN-WI MA Chicago-Naperville-Joliet, IL MD #16974 Lake County-Kenosha County, IL-WI MD #29404 Cincinnati-Middletown, OH-KY-IN MSA #17140 Clarksville, TN-KY MSA #17300 Davenport-Moline-Rock Island, IA-IL MSA #19340 Fargo, ND-MN MSA #22020 Grand Forks, ND-MN MSA #24220 Kansas City, MO-KS MSA #28140 Lewiston, ID-WA MSA #30300 Logan, UT-ID MSA #30860 Louisville, KY-IN MSA #31140
Full Full Full Full Full Full Full Full Full Full Full
Cook, DuPage, Kane, Kendall, McHenry, Will Counties Lake County IL; Kenosha County WI Dearborn County IN; Boone, Bracken, Campbell, Kenton, Pendleton Counties KY; Brown, Butler, Clermont, Hamilton, Warren Counties OH Montgomery County TN; Christian County KY Scott County IA; Henry, Rock Island Counties IL Cass County ND; Clay County MN Grand Forks County ND; Polk County MN Johnson, Wyandotte Counties KS; Cass, Clay, Clinton, Jackson, Lafayette, Platte, Ray Counties MO Nez Perce County ID; Asotin County WA Franklin County ID; Cache County UT Clark, Floyd Counties IN; Bullitt, Jefferson, Shelby Counties KY
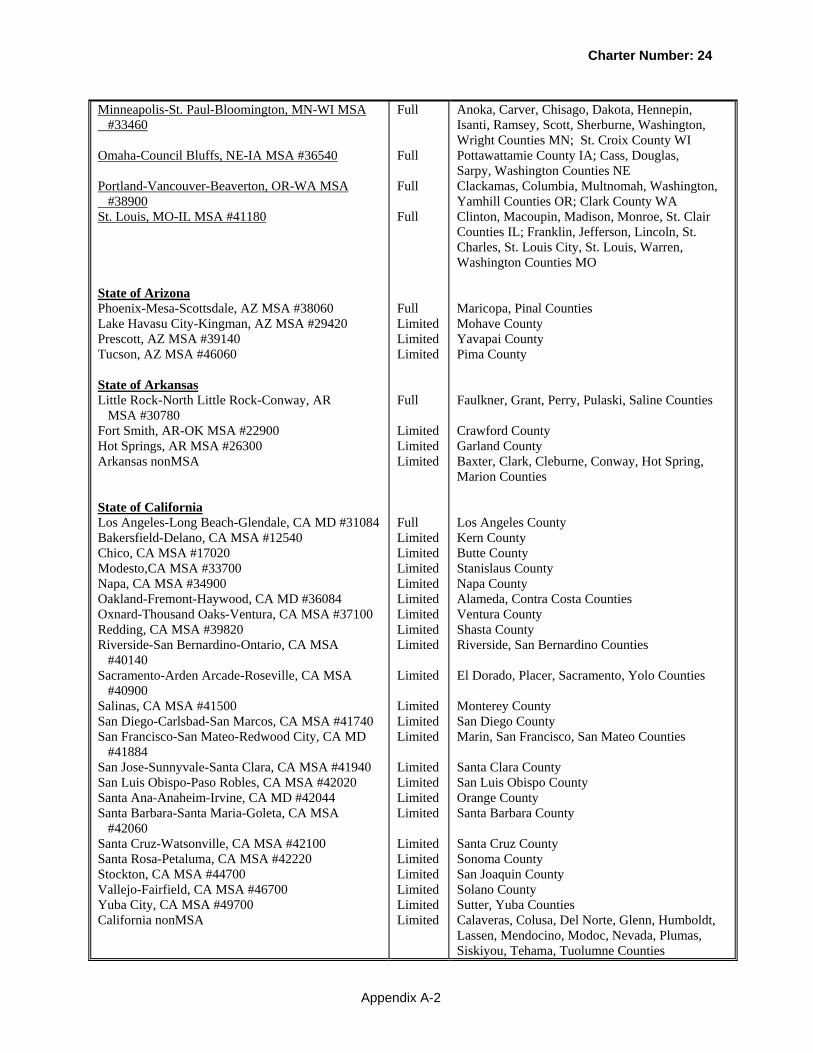
Charter Number: 24
Appendix A-2
Minneapolis-St. Paul-Bloomington, MN-WI MSA #33460 Omaha-Council Bluffs, NE-IA MSA #36540 Portland-Vancouver-Beaverton, OR-WA MSA #38900 St. Louis, MO-IL MSA #41180 State of Arizona Phoenix-Mesa-Scottsdale, AZ MSA #38060 Lake Havasu City-Kingman, AZ MSA #29420 Prescott, AZ MSA #39140 Tucson, AZ MSA #46060 State of Arkansas Little Rock-North Little Rock-Conway, AR MSA #30780 Fort Smith, AR-OK MSA #22900 Hot Springs, AR MSA #26300 Arkansas nonMSA State of California Los Angeles-Long Beach-Glendale, CA MD #31084 Bakersfield-Delano, CA MSA #12540 Chico, CA MSA #17020 Modesto,CA MSA #33700 Napa, CA MSA #34900 Oakland-Fremont-Haywood, CA MD #36084 Oxnard-Thousand Oaks-Ventura, CA MSA #37100 Redding, CA MSA #39820 Riverside-San Bernardino-Ontario, CA MSA #40140 Sacramento-Arden Arcade-Roseville, CA MSA #40900 Salinas, CA MSA #41500 San Diego-Carlsbad-San Marcos, CA MSA #41740 San Francisco-San Mateo-Redwood City, CA MD #41884 San Jose-Sunnyvale-Santa Clara, CA MSA #41940 San Luis Obispo-Paso Robles, CA MSA #42020 Santa Ana-Anaheim-Irvine, CA MD #42044 Santa Barbara-Santa Maria-Goleta, CA MSA #42060 Santa Cruz-Watsonville, CA MSA #42100 Santa Rosa-Petaluma, CA MSA #42220 Stockton, CA MSA #44700 Vallejo-Fairfield, CA MSA #46700 Yuba City, CA MSA #49700 California nonMSA
Full Full Full Full Full Limited Limited Limited Full Limited Limited Limited Full Limited Limited Limited Limited Limited Limited Limited Limited Limited Limited Limited Limited Limited Limited Limited Limited Limited Limited Limited Limited Limited Limited
Anoka, Carver, Chisago, Dakota, Hennepin, Isanti, Ramsey, Scott, Sherburne, Washington, Wright Counties MN; St. Croix County WI Pottawattamie County IA; Cass, Douglas, Sarpy, Washington Counties NE Clackamas, Columbia, Multnomah, Washington, Yamhill Counties OR; Clark County WA Clinton, Macoupin, Madison, Monroe, St. Clair Counties IL; Franklin, Jefferson, Lincoln, St. Charles, St. Louis City, St. Louis, Warren, Washington Counties MO Maricopa, Pinal Counties Mohave County Yavapai County Pima County Faulkner, Grant, Perry, Pulaski, Saline Counties Crawford County Garland County Baxter, Clark, Cleburne, Conway, Hot Spring, Marion Counties Los Angeles County Kern County Butte County Stanislaus County Napa County Alameda, Contra Costa Counties Ventura County Shasta County Riverside, San Bernardino Counties El Dorado, Placer, Sacramento, Yolo Counties Monterey County San Diego County Marin, San Francisco, San Mateo Counties Santa Clara County San Luis Obispo County Orange County Santa Barbara County Santa Cruz County Sonoma County San Joaquin County Solano County Sutter, Yuba Counties Calaveras, Colusa, Del Norte, Glenn, Humboldt, Lassen, Mendocino, Modoc, Nevada, Plumas, Siskiyou, Tehama, Tuolumne Counties

Charter Number: 24
Appendix A-3
State of Colorado Denver-Aurora, CO MSA #19740 Boulder, CO MSA #14500 Colorado Springs, CO MSA #17820 Fort Collins-Loveland, CO MSA #22660 Grand Junction, CO MSA #24300 Greeley, CO MSA #24540 Pueblo, CO MSA #39380 Colorado nonMSA State of Idaho Boise City-Nampa, ID MSA #14260 Coeur d’Alene, ID MSA #17660 Idaho Falls, ID MSA #26820 Pocatello, ID MSA #38540 Idaho nonMSA State of Illinois Springfield, IL MSA #44100 Bloomington-Normal, IL MSA #14060 Rockford, IL MSA #40420 Illinois nonMSA State of Indiana Indiana nonMSA State of Iowa Des Moines-West Des Moines, IA MSA #19780 Ames, IA MSA #11180 Cedar Rapids, IA MSA #16300 Dubuque, IA MSA #20220 Iowa City, IA MSA #26980 Sioux City, IA-NE-SD MSA #43580 Waterloo-Cedar Falls, IA MSA #47940 Iowa nonMSA State of Kansas Lawrence, KS MSA #29940 Topeka, KS MSA #45820 Kansas nonMSA
Full Limited Limited Limited Limited Limited Limited Limited Full Limited Limited Limited Limited Full Limited Limited Limited Full Full Limited Limited Limited Limited Limited Limited Limited Full Limited Limited
Adams, Arapahoe, Broomfield, Denver, Douglas, Jefferson Counties Boulder County El Paso County Larimer County Mesa County Weld County Pueblo County Delta, Eagle, Fremont, Garfield, Grand, Montrose, Otero, Pitkin, San Miguel, Summit Counties Ada, Canyon, Gem, Owyhee Counties Kootenai County Bonneville, Jefferson Counties Bannock, Power Counties Adams, Bear Lake, Benewah, Bingham, Blaine, Bonner, Camas, Caribou, Cassia, Clearwater, Custer, Elmore, Gooding, Idaho, Jerome, Latah, Lemhi, Lewis, Madison, Minidoka, Oneida, Payette, Shoshone, Teton, Twin Falls, Valley, Washington Counties Sangamon County McLean County Winnebago County Christian, Clay, Coles, Franklin, Jefferson, Jo Daviess, Lee, Marion, Morgan, Stephenson Union, Whiteside, Williamson Counties Fayette, Randolph, Wayne Counties Dallas, Polk, Warren Counties Story County Benton, Linn Counties Dubuque County Johnson, Washington Counties Woodbury County IA Black Hawk County Appanoose, Boone, Cedar, Cerro Gordo, Clay, Clinton, Des Moines, Dickinson, Hamilton, Henry, Humboldt, Iowa, Jackson, Jasper, Keokuk, Lucas, Lyon, Mahaska, Marion, Marshall, Monona, Montgomery, Muscatine, O’Brien, Osceola, Ringgold, Sioux, Wapello, Wayne Counties Douglas County Shawnee County Crawford County

Charter Number: 24
Appendix A-4
State of Kentucky Owensboro, KY MSA #36980 Bowling Green, KY MSA #14540 Evansville, IN-KY MSA #21780 Lexington-Fayette, KY MSA #30460 Kentucky nonMSA State of Minnesota Duluth, MN-WI MSA #20260 Mankato-North Mankato, MN MSA #31860 Rochester, MN MSA #40340 St. Cloud, MN MSA #41060 Minnesota nonMSA State of Missouri Joplin, MO MSA #27900 Cape Girardeau-Jackson, MO-IL MSA #16020 Columbia, MO MSA #17860 Fayetteville-Springdale-Rogers, AR-MO MSA #22220 Jefferson City, MO MSA #27620 Springfield, MO MSA #44180 St. Joseph, MO-KS MSA #41140 Missouri nonMSA State of Montana Billings, MT MSA #13740 Great Falls, MT MSA #24500 Missoula, MT MSA #33540 Montana nonMSA State of Nebraska Lincoln, NE MSA #30700 Nebraska nonMSA State of Nevada Las Vegas-Paradise, NV MSA #29820 Carson City, NV MSA #16180 Reno-Sparks, NV MSA #39900 Nevada nonMSA
Full Limited Limited Limited Limited Full Limited Limited Limited Limited Full Limited Limited Limited Limited Limited Limited Limited Full Limited Limited Limited Full Limited Full Limited Limited Limited
Daviess, Hancock, McLean Counties Warren County Henderson County KY Fayette County Allen, Barren, Boyle, Calloway, Carroll, Estill, Fleming, Floyd, Graves, Hopkins, Logan, Madison, Marion, Marshall, Mason, McCracken, Monroe, Pike, Rowan, Simpson, Washington Counties Carlton, St. Louis Counties MN Blue Earth County Olmstead County Benton, Stearns Counties Cass, Crow Wing, Douglas, Freeborn, Itasca, Kandiyohi, Lyon, Martin, Mille Lacs, Morrison, Mower, Otter Tail, Pine, Redwood, Steele Counties Jasper, Newton Counties Bollinger, Cape Girardeau Counties MO Boone County McDonald County MO Cole County Christian, Dallas, Greene, Polk, Webster Counties Andrew, Buchanan, DeKalb Counties MO Adair, Atchison, Audrain, Barry, Barton, Butler, Camden, Chariton, Dent, Grundy, Henry, Hickory, Howell, Johnson, Laclede, Lawrence, Linn, Macon, Marion, Mercer, Miller, Montgomery, Morgan, New Madrid, Nodaway, Perry, Pettis, Phelps, Pike, Pulaski, Randolph, Ripley, St. Francois, Ste. Genevieve, Scotland, Scott, Shelby, Stoddard, Stone, Taney, Vernon, Wright Counties Yellowstone County Cascade County Missoula County Chouteau, Custer, Dawson, Flathead, Gallatin, Hill, Lewis and Clark, Liberty, Ravalli, Silver Bow, Toole Counties Lancaster County Adams, Buffalo, Butler, Dodge, Gage, Hall, Lincoln, Madison, Platte, Scotts Bluff Counties Clark County Carson City County Washoe County

Charter Number: 24
Appendix A-5
State of New Mexico Albuquerque, NM MSA #10740 Las Cruces, NM MSA #29740 Santa Fe, NM MSA #42140 New Mexico nonMSA State of North Dakota Bismarck, ND MSA #13900 North Dakota nonMSA State of Ohio Cleveland-Elyria-Mentor, OH MSA #17460 Akron, OH MSA #10420 Canton-Massillon, OH MSA #15940 Columbus, OH MSA #18140 Dayton, OH MSA #19380 Huntington-Ashland, WV-KY-OH MSA #26580 Lima, OH MSA #30620 Mansfield, OH MSA #31900 Sandusky, OH MSA #41780 Springfield, OH MSA #44220 Toledo, OH MSA #45780 Weirton-Steubenville, WV-OH MSA #48260 Youngstown-Warren-Boardman, OH-PA MSA #49660 Ohio nonMSA State of Oregon Salem, OR MSA #41420 Bend, OR MSA #13460 Corvallis, OR MSA #18700 Eugene-Springfield, OR MSA #21660 Medford, OR MSA #32780 Oregon nonMSA
State of South Dakota Sioux Falls, SD MSA #43620 Rapid City, SD MSA #39660 South Dakota nonMSA State of Tennessee Nashville-Davisdon-Murfreesboro-Franklin, TN MSA #34980
Full Limited Limited Limited Full Limited Full Limited Limited Limited Limited Limited Limited Limited Limited Limited Limited Limited Limited Limited Full Limited Limited Limited Limited Limited Full Limited Limited Full
Churchill, Douglas, Elko, Humboldt, Lyon, Nye Counties Bernalillo, Sandoval, Torrance, Valencia Counties Dona Ana County Santa Fe County Cibola, Curry, McKinley, Roosevelt, Taos Counties Burleigh, Morton Counties Barnes, Cavalier, Mercer, Ramsey, Ransom, Richland, Stark, Stutsman, Walsh, Ward, Williams Counties Cuyahoga, Geauga, Lake, Lorain, Medina Counties Portage, Summit Counties Carroll, Starck Counties Delaware, Fairfield, Franklin, Licking, Morrow, Pickaway Counties Greene, Miami, Montgomery, Preble Counties Lawrence County OH Allen County Richland County Erie County Clark County Ottawa County Jefferson County OH Mahoning, Trumbull Counties OH Ashtabula, Auglaize, Crawford, Darke, Fayette, Gallia, Guernsey, Hardin, Harrison, Highland, Hocking, Perry, Pike, Sandusky, Scioto, Seneca, Shelby, Tuscarawas, Van Wert, Wayne Counties Marion, Polk Counties Deschutes County Benton County Lane County Jackson County Baker, Clatsop, Coos, Crook, Curry, Douglas, Grant, Harney, Hood River, Jefferson, Josephine, Klamath, Lake, Lincoln, Linn, Malheur, Tillamook, Umatilla, Union, Wasco Counties Lincoln, Minnehaha Counties Pennington County Brown, Davison, Hughes Counties Cheatham, Davidson, Dickson, Robertson,
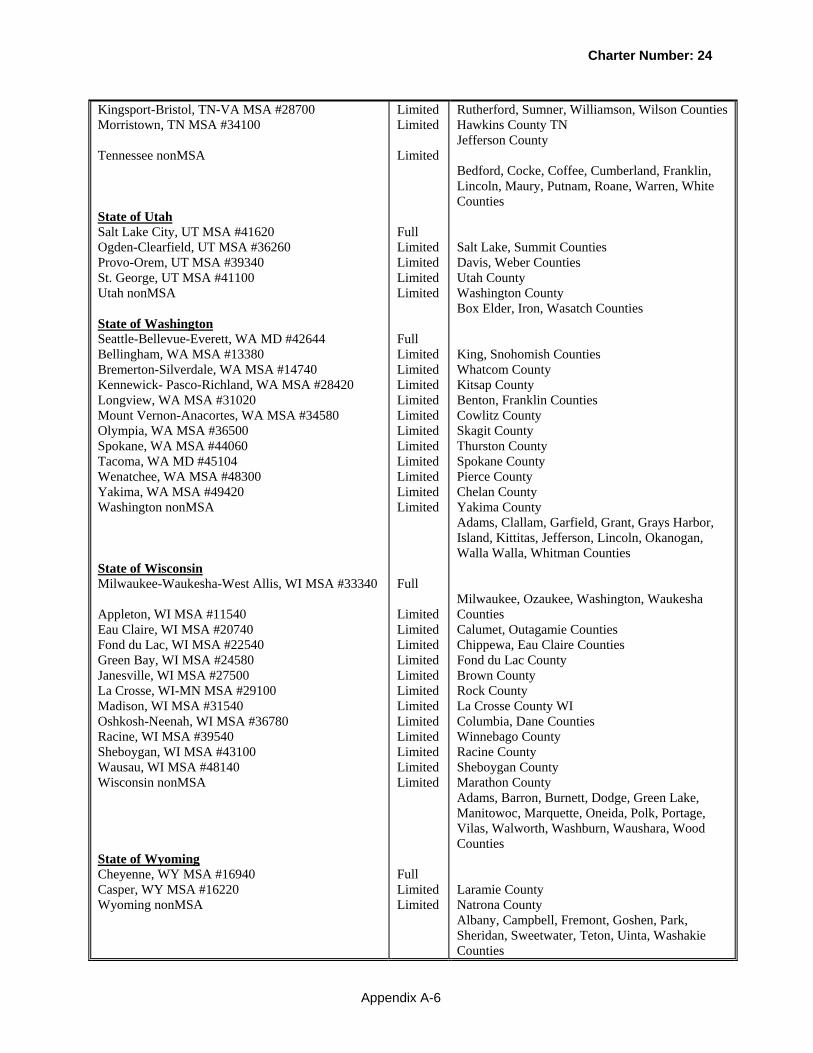
Charter Number: 24
Appendix A-6
Kingsport-Bristol, TN-VA MSA #28700 Morristown, TN MSA #34100 Tennessee nonMSA State of Utah Salt Lake City, UT MSA #41620 Ogden-Clearfield, UT MSA #36260 Provo-Orem, UT MSA #39340 St. George, UT MSA #41100 Utah nonMSA State of Washington Seattle-Bellevue-Everett, WA MD #42644 Bellingham, WA MSA #13380 Bremerton-Silverdale, WA MSA #14740 Kennewick- Pasco-Richland, WA MSA #28420 Longview, WA MSA #31020 Mount Vernon-Anacortes, WA MSA #34580 Olympia, WA MSA #36500 Spokane, WA MSA #44060 Tacoma, WA MD #45104 Wenatchee, WA MSA #48300 Yakima, WA MSA #49420 Washington nonMSA State of Wisconsin Milwaukee-Waukesha-West Allis, WI MSA #33340 Appleton, WI MSA #11540 Eau Claire, WI MSA #20740 Fond du Lac, WI MSA #22540 Green Bay, WI MSA #24580 Janesville, WI MSA #27500 La Crosse, WI-MN MSA #29100 Madison, WI MSA #31540 Oshkosh-Neenah, WI MSA #36780 Racine, WI MSA #39540 Sheboygan, WI MSA #43100 Wausau, WI MSA #48140 Wisconsin nonMSA State of Wyoming Cheyenne, WY MSA #16940 Casper, WY MSA #16220 Wyoming nonMSA
Limited Limited Limited Full Limited Limited Limited Limited Full Limited Limited Limited Limited Limited Limited Limited Limited Limited Limited Limited Full Limited Limited Limited Limited Limited Limited Limited Limited Limited Limited Limited Limited Full Limited Limited
Rutherford, Sumner, Williamson, Wilson Counties Hawkins County TN Jefferson County Bedford, Cocke, Coffee, Cumberland, Franklin, Lincoln, Maury, Putnam, Roane, Warren, White Counties Salt Lake, Summit Counties Davis, Weber Counties Utah County Washington County Box Elder, Iron, Wasatch Counties King, Snohomish Counties Whatcom County Kitsap County Benton, Franklin Counties Cowlitz County Skagit County Thurston County Spokane County Pierce County Chelan County Yakima County Adams, Clallam, Garfield, Grant, Grays Harbor, Island, Kittitas, Jefferson, Lincoln, Okanogan, Walla Walla, Whitman Counties Milwaukee, Ozaukee, Washington, Waukesha Counties Calumet, Outagamie Counties Chippewa, Eau Claire Counties Fond du Lac County Brown County Rock County La Crosse County WI Columbia, Dane Counties Winnebago County Racine County Sheboygan County Marathon County Adams, Barron, Burnett, Dodge, Green Lake, Manitowoc, Marquette, Oneida, Polk, Portage, Vilas, Walworth, Washburn, Waushara, Wood Counties Laramie County Natrona County Albany, Campbell, Fremont, Goshen, Park, Sheridan, Sweetwater, Teton, Uinta, Washakie Counties

Charter Number: 24
Appendix B-1
Appendix B: Ratings Summary
U.S. Bank National Association CRA Ratings
Overall Bank:
Lending Test Rating*
Investment Test Rating
Service Test Rating
Overall Bank/State/
Multistate Rating
U.S. Bank NA Outstanding Outstanding Outstanding Satisfactory
Multistate Metropolitan Area: Chicago-Joliet-Naperville, IL-IN-WI
Outstanding Outstanding High Satisfactory Outstanding
Cincinnati-Middletown, OH-KY-IN
Outstanding Outstanding Outstanding Outstanding
Clarksville, TN-KY Outstanding Outstanding Outstanding Outstanding
Davenport-Moline-Rock Island, IA-IL
Outstanding Outstanding Outstanding Outstanding
Fargo, ND-MN Outstanding Outstanding Outstanding Outstanding
Grand Forks, ND-MN Outstanding Outstanding Low Satisfactory Outstanding
Kansas City, MO-KS Outstanding Outstanding Low Satisfactory Outstanding
Lewiston, ID-WA Outstanding Outstanding Outstanding Outstanding
Logan, UT-ID High Satisfactory Outstanding High Satisfactory Satisfactory
Louisville, KY-IN Outstanding Outstanding Outstanding Outstanding
Minneapolis-St. Paul-Bloomington, MN-WI
Outstanding Outstanding Outstanding Outstanding
Omaha-Council Bluffs, NE-IA Outstanding Outstanding High Satisfactory Outstanding
Portland-Vancouver-Beaverton, OR-WA
Outstanding Outstanding Outstanding Outstanding
St. Louis, MO-IL Outstanding Outstanding High Satisfactory Outstanding
State:
Arizona Outstanding Outstanding High Satisfactory Outstanding
Arkansas Outstanding Outstanding Outstanding Outstanding
California Outstanding Outstanding High Satisfactory Outstanding
Colorado Outstanding Outstanding Outstanding Outstanding
Idaho Outstanding Outstanding Outstanding Outstanding
Illinois High Satisfactory Outstanding Outstanding Outstanding
Indiana High Satisfactory Outstanding High Satisfactory Satisfactory
Iowa Outstanding Outstanding Outstanding Outstanding

Charter Number: 24
Appendix B-2
U.S. Bank National Association CRA Ratings (Continued)
Lending Test
Rating* Investment Test
Rating Service Test
Rating Overall Bank/State/ Multistate Rating
Kansas High Satisfactory Outstanding High Satisfactory Satisfactory
Kentucky High Satisfactory Outstanding Outstanding Outstanding
Minnesota Outstanding Outstanding Outstanding Outstanding
Missouri Outstanding Outstanding Outstanding Outstanding
Montana Outstanding Outstanding Outstanding Outstanding
Nebraska Outstanding Outstanding Outstanding Outstanding
Nevada Low Satisfactory Outstanding High Satisfactory Satisfactory
New Mexico High Satisfactory Outstanding Outstanding Outstanding
North Dakota Outstanding Outstanding High Satisfactory Outstanding
Ohio Outstanding Outstanding Outstanding Outstanding
Oregon Outstanding Outstanding Outstanding Outstanding
South Dakota Outstanding Outstanding Outstanding Outstanding
Tennessee High Satisfactory Outstanding Low Satisfactory Satisfactory
Utah Outstanding Outstanding High Satisfactory Outstanding
Washington Outstanding Outstanding Outstanding Outstanding
Wisconsin Outstanding Outstanding Outstanding Outstanding
Wyoming High Satisfactory Outstanding Outstanding Outstanding
(*) The Lending Test is weighted more heavily than the Investment and Service Tests in the overall rating.

Charter Number: 24
Appendix C- 1
Appendix C: Full-Scope Market Profiles for Primary Rated Areas
Cincinnati-Middletown, OH-KY-IN MMSA
Demographic Information for Full-Scope Area: Cincinnati Assessment Area
Demographic Characteristics
# Low
% of # Moderate
% of # Middle % of #
Upper % of #
NA* % of #
Geographies (Census Tracts/BNAs) 474 10.55 23.42 44.94 20.25 0.84
Population by Geography 1,951,604 6.41 19.48 47.85 26.16 0.09
Owner-Occupied Housing by Geography 507,672
2.23 16.26 51.49 30.02 0.00
Business by Geography 186,941 4.37 16.60 47.63 30.78 0.62
Farms by Geography 5,191 1.00 16.57 57.98 24.37 0.08
Family Distribution by Income Level 512,077 19.07 18.44 23.17 39.33 0.00
Distribution of LMI Families throughout AA 192,059
10.68 28.46 47.44 13.42 0.00
Median Family Income (2000) $54,771 HUD Adjusted Median Family Income (2011) $70,400
Families Below Poverty Level 6.91%
Median Housing Value (2011) $122,300 Fair Market Two-Bedroom Rent (2011) $752 Unemployment Rate (Dec 2011, NSA) 7.6%
(*) The NA category consists of geographies that have not been assigned an income classification. Source: US Census, HUD, Bureau of Labor Statistics, and National Association of Realtors
The Cincinnati AA consists of 11 (of 15) counties in the Cincinnati-Middletown, OH-KY-IN MMSA (Cincinnati MMSA). The area includes Brown, Butler, Clermont, Hamilton, and Warren Counties in Ohio; Boone, Bracken, Campbell, Kenton, and Pendleton Counties in Kentucky; and Dearborn County in Indiana. Gallatin and Grant Counties in Kentucky, and Franklin and Ohio Counties in Indiana, are not included as they are generally located on the outer edges of a very large MMSA. The AA meets regulatory requirements and does not arbitrarily exclude low- or moderate-income census tracts. Area demographics are reflected in the table above. The Cincinnati MMSA is the 27th largest metropolitan area in the United States. While there has been growth in the northern suburban areas of Cincinnati, the city is experiencing a decline in population and jobs overall. The city has several wealthy neighborhoods, but it also has areas with significant economic and social needs. Outer portions of the Cincinnati MMSA are more rural, and unemployment rates and poverty levels vary significantly across the area. Warren County (northeast of the City of Cincinnati) generally has the lowest levels of unemployment and poverty (6.7 percent and 3 percent as of year-end 2011, respectively). Pendleton County Kentucky (south of the City of Cincinnati) has higher levels of unemployment and poverty (9.3 percent and 9.8 percent, respectively).

Charter Number: 24
Appendix C- 2
The banking environment is very competitive. There are 73 banks with 784 offices in this area as of June 30, 2011. USB is the market leader with $21.6 billion deposits, a 35 percent deposit market share, 121 branches, and 166 ATMs. Fifth Third Bank is the only other financial institution with a significant deposit market share (30 percent). All other financial institutions have deposit market shares of 9 percent or less. The economy is diverse. Major employers include Kroger Company, the University of Cincinnati, Proctor & Gamble, the Archdiocese of Cincinnati, GE Aviation, Fifth Third Bancorp, Walmart Stores, and various healthcare-related companies. Cincinnati is home to nine FORTUNE 500 companies and three Global 500 companies. The region ranks in the top ten markets for number of Fortune 500 headquarters per million residents (higher than New York, Boston, Chicago, and Los Angeles). Unemployment dropped to 7.6 percent in December 2011, but improvement is partly attributable to a declining labor force rather than increased hiring. While economic recovery from the national recession of 2008 continues, declining housing prices remain a threat. Moody’s predicts that housing prices will continue to decline, as foreclosures are more problematic in the area than nationally, and the area continues to have a large inventory of foreclosed properties. The OCC conducted three community contacts in 2012 involving a variety of economic development, affordable housing, and social service representatives. Contacts indicate a need for more flexible first-time homebuyer financing, additional foreclosure prevention programs, and more small business financing. Contacts mentioned USB support for recent affordable housing projects, youth programs, and foreclosure prevention programs. One contact praised USB’s American Dream mortgage product, which has a smaller down payment requirement and assistance for closing costs. USB conducted an external survey in 2012 and identified community needs for job creation and job placement, improved schools, homeless programs, economic revitalization, economic development planning, and access to healthy food. There are significant opportunities to meet credit and community development needs. The area has five CDFIs. Additionally, there is an Empowerment Zone for several areas of Cincinnati, an Urban Renewal Community for portions of Butler County, and several Brownfield sites. These designations typically allow financial support and/or incentives for specific economic development efforts. The area also has numerous community-based, nonprofit organizations. Some of these organizations address community development needs throughout the AA, while others focus on the needs of specific neighborhoods such as Over the Rhine, Avondale, and Walnut Hills.
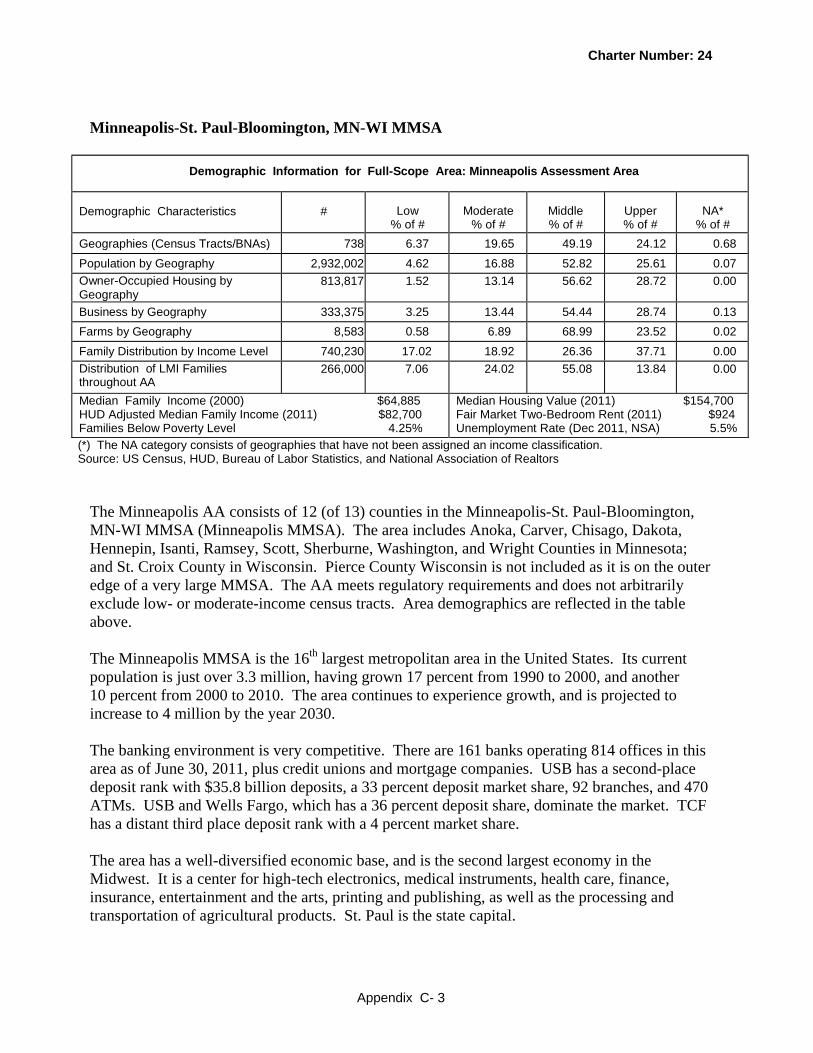
Charter Number: 24
Appendix C- 3
Minneapolis-St. Paul-Bloomington, MN-WI MMSA
Demographic Information for Full-Scope Area: Minneapolis Assessment Area
Demographic Characteristics
# Low
% of # Moderate
% of # Middle % of #
Upper % of #
NA* % of #
Geographies (Census Tracts/BNAs) 738 6.37 19.65 49.19 24.12 0.68
Population by Geography 2,932,002 4.62 16.88 52.82 25.61 0.07
Owner-Occupied Housing by Geography
813,817 1.52 13.14 56.62 28.72 0.00
Business by Geography 333,375 3.25 13.44 54.44 28.74 0.13
Farms by Geography 8,583 0.58 6.89 68.99 23.52 0.02
Family Distribution by Income Level 740,230 17.02 18.92 26.36 37.71 0.00
Distribution of LMI Families throughout AA
266,000 7.06 24.02 55.08 13.84 0.00
Median Family Income (2000) $64,885 HUD Adjusted Median Family Income (2011) $82,700
Families Below Poverty Level 4.25%
Median Housing Value (2011) $154,700 Fair Market Two-Bedroom Rent (2011) $924 Unemployment Rate (Dec 2011, NSA) 5.5%
(*) The NA category consists of geographies that have not been assigned an income classification. Source: US Census, HUD, Bureau of Labor Statistics, and National Association of Realtors
The Minneapolis AA consists of 12 (of 13) counties in the Minneapolis-St. Paul-Bloomington, MN-WI MMSA (Minneapolis MMSA). The area includes Anoka, Carver, Chisago, Dakota, Hennepin, Isanti, Ramsey, Scott, Sherburne, Washington, and Wright Counties in Minnesota; and St. Croix County in Wisconsin. Pierce County Wisconsin is not included as it is on the outer edge of a very large MMSA. The AA meets regulatory requirements and does not arbitrarily exclude low- or moderate-income census tracts. Area demographics are reflected in the table above. The Minneapolis MMSA is the 16th largest metropolitan area in the United States. Its current population is just over 3.3 million, having grown 17 percent from 1990 to 2000, and another 10 percent from 2000 to 2010. The area continues to experience growth, and is projected to increase to 4 million by the year 2030. The banking environment is very competitive. There are 161 banks operating 814 offices in this area as of June 30, 2011, plus credit unions and mortgage companies. USB has a second-place deposit rank with $35.8 billion deposits, a 33 percent deposit market share, 92 branches, and 470 ATMs. USB and Wells Fargo, which has a 36 percent deposit share, dominate the market. TCF has a distant third place deposit rank with a 4 percent market share. The area has a well-diversified economic base, and is the second largest economy in the Midwest. It is a center for high-tech electronics, medical instruments, health care, finance, insurance, entertainment and the arts, printing and publishing, as well as the processing and transportation of agricultural products. St. Paul is the state capital.
Charter Number: 24
Appendix C- 4
The area is home to 19 (of 20) FORTUNE 500 companies in Minnesota. Target Corporation is the largest employer, with approximately 29,000 employees. Other large employers include Allina Health System, Fairview Health System, Wells Fargo, University of Minnesota, and 3M Corp. Unemployment was 5.5 percent in December 2011, which compares favorably to the national rate of 8.3 percent. The Twin Cities is also a major sports and entertainment center for the upper Midwest. There are several professional sports teams, as well as thriving theatres, orchestras, and art museums. The region is second only to New York City in live theater per capita, and it is the largest theater market in the country after New York City and Chicago. The Mall of America is another popular tourist attraction. While the Twin Cities has a strong tourism draw on its own, it is also a starting point for much of Minnesota’s fishing, hunting, and lake recreation areas. The economy experienced the lagging effects of the housing meltdown and recession during the evaluation period, but is starting to shows signs of recovery. Recently, there have been job gains in business services, finance, healthcare, and manufacturing. Moreover, while median housing values declined more from 2009-2011 (though not as sharply), the housing market appears to be stabilizing. According to the Minneapolis Area Association of Realtors, the price of a median single-family home increased 10.5 percent in one year as of May 2012 – assisted by a sharp increase in regular home sales and a corresponding drop in distress sales, which are at their lowest level in two years. Foreclosure rates in the Twin Cities metro area also continue to improve, with a sizeable decrease in 2012 over the previous year. Despite the recession, the area continues to have an owner-occupied housing rate of more than 70 percent. The OCC conducted four community contacts in 2012, and used one contact from another regulator. The contacts involved a variety of small business, affordable housing, neighborhood revitalization, and social service representatives. Needs for affordable housing, homebuyer counseling, foreclosure referral programs, and start-up business financing were expressed. Contacts also indicated there are several community development projects in which banks can be involved. Contacts generally had favorable comments about the level of participation by local banks, although one contact thought more could be done to support the North Minneapolis neighborhood, which was hard hit by foreclosures, and also by a devastating tornado in 2011. USB conducted an external survey in 2012 and identified community needs for financial education, job creation, job placement, capacity building for nonprofit organizations, affordable rental housing units, and improved schools. There are ample opportunities to meet credit and community development needs in this market. There is a wide variety of active community development organizations – and the nonprofit sector is well organized, informed, and aware of CRA requirements. The area has 25 CDFIs; portions of Minneapolis (north, south, and east of the downtown area) are designated Empowerment Zones; and there are several designated Brownfield sites.

Charter Number: 24
Appendix C- 5
St. Louis, MO-IL MMSA
Demographic Information for Full-Scope Area: St. Louis Assessment Area
Demographic Characteristics
# Low
% of # Moderate
% of # Middle % of #
Upper % of #
NA* % of #
Geographies (Census Tracts/BNAs) 540 10.37 24.44 43.33 21.11 0.74
Population by Geography 2,654,302 5.75 20.55 48.84 24.85 0.00
Owner-Occupied Housing by Geography
738,253 3.06 17.77 51.81 27.36 0.00
Business by Geography 247,083 3.92 16.34 46.78 32.69 0.27
Farms by Geography 7,566 0.86 10.76 67.31 21.05 0.01
Family Distribution by Income Level 701,007 19.50 18.44 22.60 39.47 0.00
Distribution of LMI Families throughout AA
265,950 10.23 30.51 47.94 11.32 0.00
Median Family Income (2000) $53,435 HUD Adjusted Median Family Income (2011) $69,500
Families Below Poverty Level 7.53%
Median Housing Value (2011) $121,800 Fair Market Two-Bedroom Rent (2011) $794 Unemployment Rate (Dec 2011, NSA) 8.1%
(*) The NA category consists of geographies that have not been assigned an income classification. Source: US Census, HUD, Bureau of Labor Statistics, and National Association of Realtors
The St. Louis AA consists of 13 (of 16) counties in the St. Louis, MO-IL MMSA (St. Louis MMSA). The area includes Franklin, Jefferson, Lincoln, St. Charles, St. Louis, Warren, and Washington Counties, as well as St. Louis City, all in Missouri. The area also includes Clinton, Macoupin, Madison, Monroe, and St. Clair Counties in Illinois. Bond, Calhoun, and Jersey Counties in Illinois are not included as the bank has no branches or deposit-taking ATMs in these counties. The AA meets regulatory requirements and does not arbitrarily exclude low- or moderate-income census tracts. Area demographics are reflected in the table above. The St. Louis MMSA is the 19th largest metropolitan area in the United States. It is one of the nation’s most important rail centers and inland ports. In addition it is an important crossroad for ground transportation with its proximity to both north-south and east-west interstate highways. The rivers of St. Louis play a large role in moving goods, especially bulk commodities such as grain, coal, salt, and certain chemicals and petroleum products. The Gateway Arch is a well-known landmark for the City of St. Louis, the largest city in the MMSA. St. Louis is also home to several professional sports teams, a large zoological park, a world-renowned symphony orchestra, and an active theater district. The city is defined by music and the performing arts, especially its association with blues, jazz, and ragtime music. There are numerous economic and social challenges in the MMSA. Disparity exists between the City of St. Louis and the surrounding suburban areas. The city lost over half its population between 1950 and 2000. And while the exodus to appears to have slowed due to revitalization efforts downtown and elsewhere in the city, there continue to be areas with poor schools, high crime rates, blight and deteriorating housing.

Charter Number: 24
Appendix C- 6
The City of East St. Louis Illinois has been economically depressed for decades. It has drastic urban blight, high unemployment and poverty, deteriorated housing, depressed housing values, and significant crime. Sections of urban prairie can be found where vacant buildings are torn down and whole blocks are overgrown with vegetation. Much of the territory surrounding the city remains undeveloped, bypassed by developers who chose more affluent suburban areas. Economic conditions in the city are significantly worse than for the area overall. Unemployment exceeded 17 percent in December 2011. The 2011 median household income is $19,934, and approximately 42 percent of the population lives below poverty level. The 2011 median house value is $61,700. The city also has the highest crime rate in the country per the FBI. Banking competition is strong. There are 140 banks operating 934 offices in the area as of June 30, 2011. USB is the market leader with $11.3 billion deposits, a 16 percent deposit market share, 118 branches, and 306 ATMs. Bank of America and Scottrade have the next largest market shares of area deposits (13 percent and 10 percent, respectively). The local economy is diverse. Major employers include Boeing Defense, Washington University in St. Louis, Scott Air Force Base, Schnuck Markets, Walmart Stores, AT&T, and several healthcare companies. The area is home to nine FORTUNE 500 companies. The unemployment rate for the St. Louis MMSA is 8.1 percent as of December 2011, compared to an 8.3 percent national rate. The economy is slowly healing from the national recession of 2008, but recovery is hampered by a weak job and housing market. The job market is particularly struggling in the construction and leisure/hospitality sectors due to limited population growth. Professional and business service job growth has primarily involved lower-wage administrative/support positions; and manufacturing wages continue to lag. It is also notable that low-income neighborhoods have a completed foreclosure rate that is 3.2 times higher than the rate for the metropolitan area overall (and 2.1 times higher for moderate-income neighborhoods) according to a 2011 report by the Center for Responsible Lending. OCC conducted two community contacts with affordable housing representatives in 2011. The contacts expressed concern with the high foreclosure rate, and indicated more funding was needed to support foreclosure counseling. One contact believed easier access to mortgage products was also needed, particularly through home equity lines. Both contacts considered the level of local bank involvement to be good. OCC also participated in a 2012 Listening Session with 12 community development organizations from the area. The contacts indicated foreclosures had declined, but their impressions with regard to the willingness of local banks to work with customers were mixed. One organization stated they had successfully worked with several banks in the area and, as a result, saved 1,500 homes from foreclosure between 2010 and 2011. Several organizations stated it continued to be difficult for LMI individuals to obtain home loans. USB conducted an external survey in 2012 and identified community needs for job creation, job placement, capacity building for nonprofit organizations, technical assistance for small businesses, improved schools, and affordable housing stock.
Charter Number: 24
Appendix C- 7
There are many opportunities to meet credit and community development needs in the area. There are numerous nonprofit organizations that provide housing counseling, financial education, home purchase/rehabilitation, job training, small business development, and other community development activities. The area has at least five CDFIs. Additionally, there is a large Empowerment Zone and numerous Brownfield sites in St. Louis and East St. Louis - designations that typically allow financial support and/or incentives for specific economic development efforts.
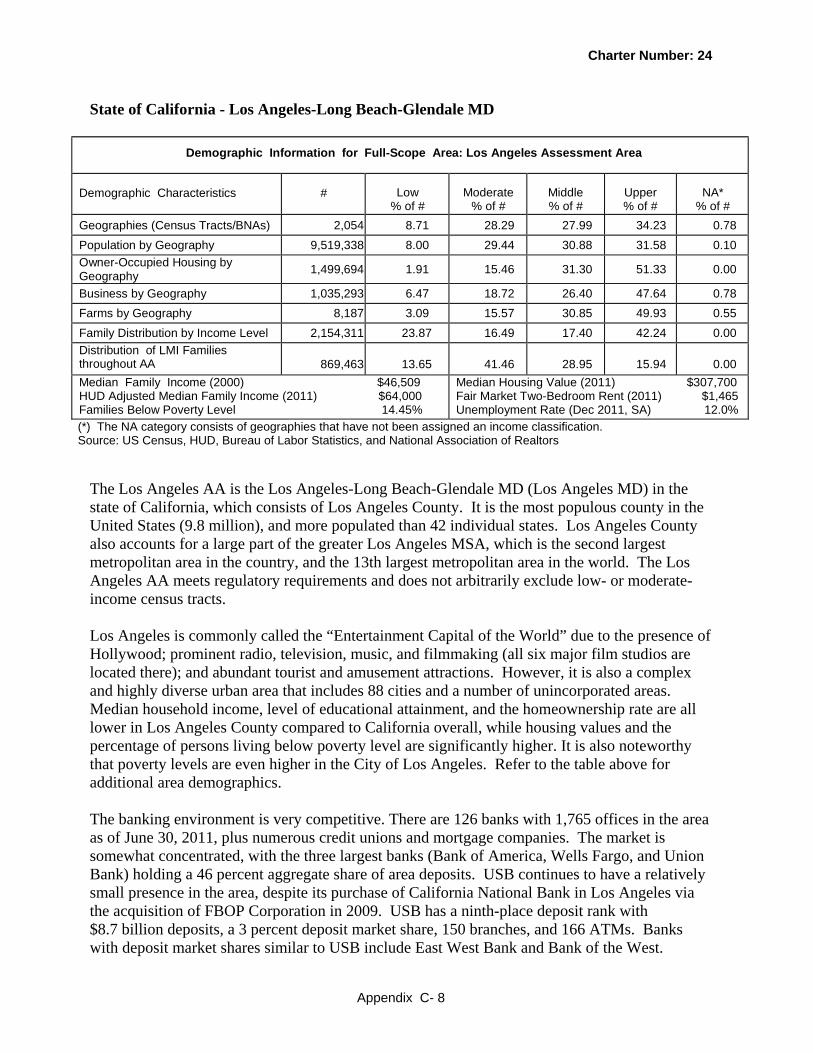
Charter Number: 24
Appendix C- 8
State of California - Los Angeles-Long Beach-Glendale MD
Demographic Information for Full-Scope Area: Los Angeles Assessment Area
Demographic Characteristics
# Low
% of # Moderate
% of # Middle % of #
Upper % of #
NA* % of #
Geographies (Census Tracts/BNAs) 2,054 8.71 28.29 27.99 34.23 0.78 Population by Geography 9,519,338 8.00 29.44 30.88 31.58 0.10
Owner-Occupied Housing by Geography 1,499,694 1.91 15.46 31.30
51.33 0.00
Business by Geography 1,035,293 6.47 18.72 26.40 47.64 0.78
Farms by Geography 8,187 3.09 15.57 30.85 49.93 0.55
Family Distribution by Income Level 2,154,311 23.87 16.49 17.40 42.24 0.00
Distribution of LMI Families throughout AA 869,463 13.65 41.46 28.95
15.94 0.00
Median Family Income (2000) $46,509 HUD Adjusted Median Family Income (2011) $64,000
Families Below Poverty Level 14.45%
Median Housing Value (2011) $307,700 Fair Market Two-Bedroom Rent (2011) $1,465 Unemployment Rate (Dec 2011, SA) 12.0%
(*) The NA category consists of geographies that have not been assigned an income classification. Source: US Census, HUD, Bureau of Labor Statistics, and National Association of Realtors
The Los Angeles AA is the Los Angeles-Long Beach-Glendale MD (Los Angeles MD) in the state of California, which consists of Los Angeles County. It is the most populous county in the United States (9.8 million), and more populated than 42 individual states. Los Angeles County also accounts for a large part of the greater Los Angeles MSA, which is the second largest metropolitan area in the country, and the 13th largest metropolitan area in the world. The Los Angeles AA meets regulatory requirements and does not arbitrarily exclude low- or moderate-income census tracts. Los Angeles is commonly called the “Entertainment Capital of the World” due to the presence of Hollywood; prominent radio, television, music, and filmmaking (all six major film studios are located there); and abundant tourist and amusement attractions. However, it is also a complex and highly diverse urban area that includes 88 cities and a number of unincorporated areas. Median household income, level of educational attainment, and the homeownership rate are all lower in Los Angeles County compared to California overall, while housing values and the percentage of persons living below poverty level are significantly higher. It is also noteworthy that poverty levels are even higher in the City of Los Angeles. Refer to the table above for additional area demographics. The banking environment is very competitive. There are 126 banks with 1,765 offices in the area as of June 30, 2011, plus numerous credit unions and mortgage companies. The market is somewhat concentrated, with the three largest banks (Bank of America, Wells Fargo, and Union Bank) holding a 46 percent aggregate share of area deposits. USB continues to have a relatively small presence in the area, despite its purchase of California National Bank in Los Angeles via the acquisition of FBOP Corporation in 2009. USB has a ninth-place deposit rank with $8.7 billion deposits, a 3 percent deposit market share, 150 branches, and 166 ATMs. Banks with deposit market shares similar to USB include East West Bank and Bank of the West.

Charter Number: 24
Appendix C- 9
The housing meltdown and recession continue to impact the area. Foreclosure rates are declining, but remain substantial. A local newspaper reported the number of homes slipping toward foreclosure in Los Angeles County dropped by 18 percent in first quarter 2012 compared to the same period last year. This is evidenced by the number of default notices sent to homeowners (11,443 in first quarter 2012 versus 13,957 in first quarter 2011). According to another report, Los Angeles homeowners are estimated to lose nearly $79 billion in home value from the 200,000 foreclosures from 2008-2012. Some of the hardest hit neighborhoods in Los Angeles include Sylmar, Pacoima, and Van Nuys. Median housing values declined during the evaluation period, but not as sharply. The area still remains one of the most expensive housing markets in the country; and there continues to be a significant need for affordable housing stock (both owner-occupied and rental units). As of December 2011, the seasonally adjusted median price for an existing single-family home was $307,700 (down from an approximate high of $580,000 in 2006). Home ownership became somewhat more feasible for moderate-income families with lower prices and interest rates, but remains largely out of reach for low-income families. To afford a $307,700 home (assuming a 30-year loan, 4 percent fixed interest rate, and 20 percent down payment), a buyer needs approximately $47,000 annual income (which is 73 percent of the area’s MFI, and at the higher-end of the moderate-income range). A slight rise in interest rates (to 5 percent) or a housing price increase (to $346,900), however, requires income of approximately $53,000 (which is in the middle-income range at 83 percent of the area’s MFI). The Los Angeles area has a very large and diverse economy. Beyond motion picture and television program production, other major industries include international trade supported by the Port of Los Angeles and the Port of Long Beach (the two largest ports in the country, in terms of container capacity, as of first quarter 2011), music recording and production, aerospace, and professional services such as law and medicine. The City of Los Angeles is home to five Fortune 500 companies: energy company Occidental Petroleum; healthcare provider Health Net; metals distributor Reliance Steel & Aluminum; engineering firm AECOM; and real estate group CB Richard Ellis. Large employers include the University of California Los Angeles, Kaiser Permanente, Northrop Grumman, University of Southern California, Target, Kroger, Cedars-Sinai Medical Center, Bank of America, and Boeing. Area unemployment has exceeded 12 percent since fourth quarter 2009. As of December 2011, the seasonally adjusted unemployment rate is at 12 percent, down slightly from an all-time high of 12.8 percent in October 2010. OCC participated in a CRA Listening Session in 2011 that included numerous nonprofit organizations and government agencies serving the greater Los Angeles area. OCC also contacted a local housing representative in 2012, and used three community contacts conducted by other regulators in 2011. Contacts expressed pressing needs for affordable rental and owner-occupied housing stock; more flexible financing for first-time homebuyers; low-cost checking accounts and other basic services to attract the unbanked population; financial education, credit counseling, and foreclosure prevention counseling; financing and technical assistance for small/start-up businesses; and additional funding for nonprofit organizations. Contacts were generally neutral with regard to USB involvement, although one favorably commented on the bank’s participation in Equity Equivalent Investments.

Charter Number: 24
Appendix C- 10
USB conducted an external survey in 2012 and identified needs for job creation, job placement, economic revitalization financing, affordable housing stock, and small business/farm financing. There are abundant opportunities to meet credit and community development needs in this market. Twenty-two CDFIs serve the area, including several federally-regulated/insured depositories and sophisticated housing-related CDFIs. There are also many accomplished nonprofit organizations that develop commercial real estate and affordable housing, provide financial education and homebuyer counseling, provide assistance to small business owners, and provide social services targeted to LMI persons. Additionally, federal, state and local governments have identified multiple areas for redevelopment with designations such as empowerment and renewal community zones, and Brownfield redevelopment sites.

Charter Number: 24
Appendix C- 11
State of Colorado - Denver-Aurora MSA
Demographic Information for Full-Scope Area: Denver Assessment Area
Demographic Characteristics
# Low
% of # Moderate
% of # Middle % of #
Upper % of #
NA* % of #
Geographies (Census Tracts/BNAs) 531 3.95 26.93 38.79 28.25 2.07
Population by Geography 2,130,766 4.67 28.17 39.55 27.49 0.12
Owner-Occupied Housing by Geography
554,528 1.94 22.29 42.16 33.62 0.00
Business by Geography 341,380 3.31 20.97 36.81 37.91 1.01
Farms by Geography 5,329 1.71 18.31 39.44 39.97 0.56
Family Distribution by Income Level 536,892 18.26 18.82 23.74 39.18 0.00
Distribution of LMI Families throughout AA
199,086 7.79 42.25 36.86 13.10 0.00
Median Family Income (2000) $61,301 HUD Adjusted Median Family Income (2011) $78,200
Families Below Poverty Level 5.54%
Median Housing Value (2011) $231,400 Fair Market Two-Bedroom Rent (2011) $1,007 Unemployment Rate (Dec 2011, NSA) 8.4%
(*) The NA category consists of geographies that have not been assigned an income classification. Source: US Census, HUD, Bureau of Labor Statistics, and National Association of Realtors
The Denver AA consists of six (of 10) counties in the Denver-Aurora MSA in the state of Colorado. The area includes Adams, Arapahoe, Broomfield, Denver, Douglas, and Jefferson Counties. Clear Creek, Elbert, Gilpin, and Park Counties are not included due to the large size of the MSA. The AA meets regulatory requirements and does not arbitrarily exclude low- or moderate-income census tracts. Area demographics are reflected in the table above. The Denver MSA is the largest metropolitan area in the state of Colorado (and 21st largest in the United States). The City of Denver is Colorado’s largest city, state capital, and center of economic activity. Denver’s geographic location (largest city within 500 miles, and equal distance between major Midwest and West Coast cites), coupled with a well-developed transportation hub (including the fifth busiest airport in the country), makes Denver a natural location for the storage and distribution of goods and services. It also provides the area with a degree of economic stability. The banking environment is competitive. There are 71 banks operating 710 offices in this area as of June 30, 2011. USB has $6.2 billion deposits, an 11 percent deposit market share, 79 branches, and 138 ATMs. It has the fourth highest share of deposits in this market behind Wells Fargo (28 percent), FirstBank (12 percent), and JPMorgan Chase (12 percent). Bank of the West has a distant fifth place market rank, with a 4 percent deposit share.

Charter Number: 24
Appendix C- 12
The local economy is diverse with several sectors each providing more than 10 percent of the area’s total employment (professional and business services, government, education and health services, leisure and hospitality services, and retail trade). The area is a hub for technology and telecommunication firms, and is attractive to these industries due to its well-educated workforce and relatively low business costs. Large employers include HealthONE, King Soopers, Walmart Stores, CenturyLink, Exempla Healthcare, and Lockheed Martin. Unemployment is 7.9 percent as of December 2011, which is better than the national rate of 8.3 percent. Tourism is also a major component of the economy, both locally and for the state overall. The Denver metro area had a record 13.2 million overnight visitors (up from 12.7 million in 2010), which generated $3.3 billion spending in 2011. Denver is home to many nationally recognized museums, the second-largest performing arts center in the county, and several professional sports teams. The Denver University and the Colorado University provide additional sporting venues. The Red Rocks Amphitheatre is renowned for its beauty and sound quality, and nearby mountains offer other outdoor recreational activities such as skiing, kayaking, and camping. The Denver housing market had relatively flat prices, low inventory, and reduced sales during the evaluation period. The area did not experience the same degree of decline seen in other markets, but home values still hit a 25-month low in March 2011 – off 14 percent from their peak in August 2006, according to the S&P/Case-Shiller Home Price Index. The median sales price of an existing single-family home is $231,400 as of December 2011. While home ownership became more feasible for moderate-income families with lower home prices and interest rates, it remains largely out of reach for low-income families. The area continues to deal with a spate of distressed homes in the aftermath of the recession, but it is faring better than the rest of the state. Denver foreclosure filings fell 20 percent in May 2011, with one in 475 housing units receiving notices, according to RealtyTrac. Foreclosure rates are declining as well, but remain above historic levels. The OCC conducted four community contacts during 2011-2012 with a variety of affordable housing representatives. Contacts expressed needs for financial education, flexible first-time homebuyer financing, affordable rental stock, small business loans (including mezzanine financing, and micro-loans), and working capital loans for nonprofit organizations. Contacts generally had favorable comments regarding USB’s participation, specifically regarding its financial literacy program, affordable mortgage product, and support for creating/preserving affordable housing. USB conducted an external survey in 2012 and identified needs for job creation and/or job placement, improved schools, financial education, capacity building for nonprofits, and affordable rental housing. There are many opportunities to meet credit and community development needs in this market. The area has a wide variety of active community development organizations – including eight CDFIs, at least three community development corporations, several housing authorities, and numerous community development nonprofits. There also are a number of federally designated Brownfield sites.

Charter Number: 24
Appendix C- 13
State of Washington - Seattle-Bellevue-Everett MD
Demographic Information for Full-Scope Area: Seattle Assessment Area
Demographic Characteristics
# Low
% of # Moderate
% of # Middle % of #
Upper % of #
NA* % of #
Geographies (Census Tracts/BNAs) 506 2.17 20.75 52.96 24.11 0.00
Population by Geography 2,343,058 1.93 21.89 52.39 23.79 0.00
Owner-Occupied Housing by Geography
577,775 0.49 15.58 55.45 28.48 0.00
Business by Geography 288,917 2.15 21.37 48.65 27.84 0.00
Farms by Geography 5,658 0.92 16.54 59.03 23.51 0.00
Family Distribution by Income Level 582,505 18.50 18.70 24.54 38.26 0.00
Distribution of LMI Families throughout AA
216,658 2.61 31.49 51.85 14.06 0.00
Median Family Income (2000) $63,951 HUD Adjusted Median Family Income (2011) $86,800
Families Below Poverty Level 5.20%
Median Housing Value (2011) $285,000 Fair Market Two-Bedroom Rent (2011) $1,176 Unemployment Rate (Dec 2011, NSA) 7.9%
(*) The NA category consists of geographies that have not been assigned an income classification. Source: US Census, HUD, Bureau of Labor Statistics, and National Association of Realtors
The Seattle AA is the Seattle-Bellevue-Everett MD (Seattle MD). It is located in the western part of the state of Washington, adjacent to Puget Sound. The area is comprised of King and Snohomish Counties. The Seattle MD is part of the Seattle-Tacoma-Bellevue MSA, which is the largest metropolitan area in the state of Washington (and 15th largest in the United States). The Seattle AA meets regulatory requirements and does not arbitrarily exclude low- or moderate-income census tracts. Area demographics are reflected in the table above. The AA includes the City of Seattle, which is the largest city in the Pacific Northwest region of North America and the fastest-growing major city in the United States. The Port of Seattle, which also operates Seattle-Tacoma International Airport, is a major gateway for trade with Asia and cruises to Alaska, and is the fifth largest port in the United States in terms of container capacity as of first quarter 2011. The banking environment is competitive. There are 58 financial institutions operating 710 offices in this area as of June 30, 2011. USB has $7 billion deposits, an 11 percent deposit market share, 66 branches, and 169 ATMs. It has the third highest share of deposits in the market, behind Bank of America (29 percent share) and Wells Fargo (13 percent share).

Charter Number: 24
Appendix C- 14
Despite the recession, the local economy remains comparatively strong. Recent job growth is outpacing that of the United States and much of the West due to increased manufacturing and construction jobs (both residential and commercial). Tourism continues to play an important role, as the area has several scenic attractions and also serves as a gateway for travel to Alaska and British Columbia. Major employers include Boeing, Microsoft, and the University of Washington. The area is also home to eight FORTUNE 500 companies. Unemployment is 7.7 percent as of December 2011, the lowest level since early 2009 and slightly better than the national rate of 8.3 percent.
The housing market is starting to see a slow-down in foreclosures and leveling of housing prices. However, the number of past due mortgages remains high and could potentially result in more foreclosures. Moody’s reports that apartment rents climbed faster than existing house prices in 2011, which is producing more multifamily homebuilding. Despite reduced housing values, the relative high cost of housing in this market makes home ownership difficult for low-income families. To afford a $285,000 home (assuming a 30-year loan, 4 percent fixed interest rate, and 20 percent down payment), a buyer needs approximately $43,550 annual income (which is 68 percent of the area’s MFI, and solidly in the moderate-income range). OCC conducted one community contact in 2011, and used two contacts conducted in 2012 by another regulator. The contacts primarily involved small business representatives. Contacts expressed a need for more flexible and affordable small business financing. USB conducted an external survey in 2012 and identified needs for job creation, job placement, affordable rental stock, rehabilitation loans for multifamily properties and commercial real estate, services for homeless persons, and program-related investments. There are many opportunities to meet credit and community development needs in this market. There are a variety of active community development organizations – including nine CDFIs, and a number of other community development nonprofit organizations. The City of Seattle coordinates with other public agency programs to use LIHTCs and NMTCs in funding capital and development projects. There also are a number of federally designated Brownfield sites.
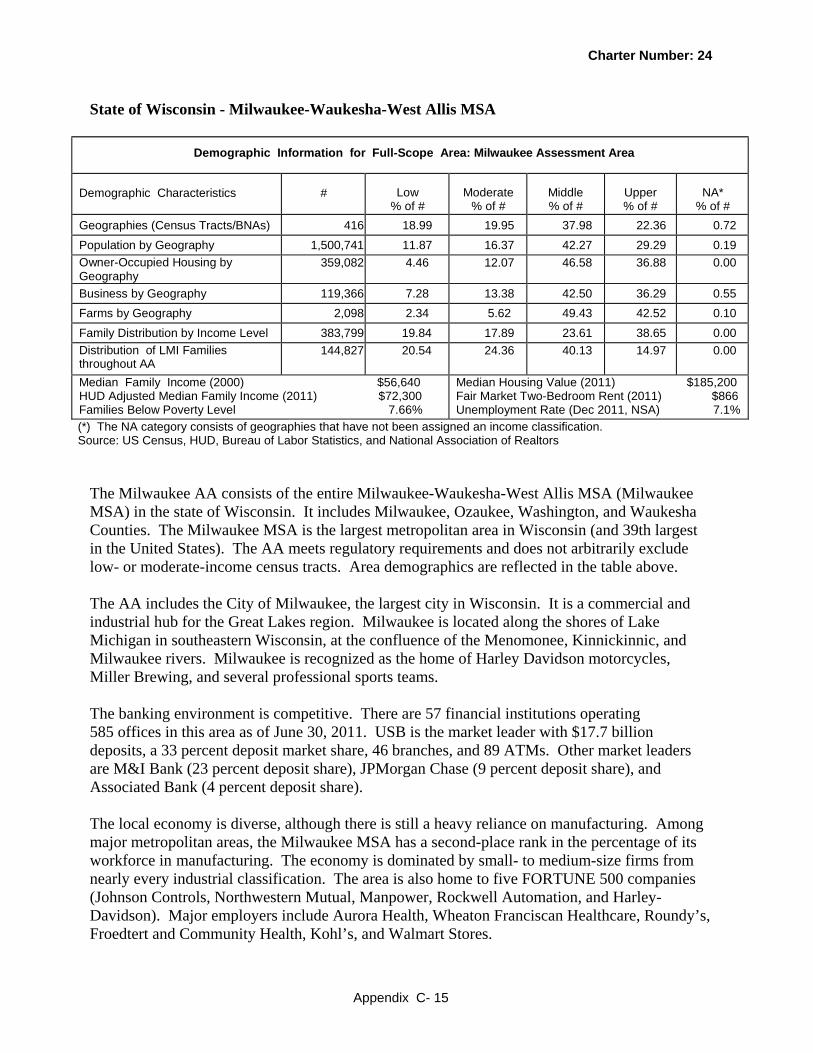
Charter Number: 24
Appendix C- 15
State of Wisconsin - Milwaukee-Waukesha-West Allis MSA
Demographic Information for Full-Scope Area: Milwaukee Assessment Area
Demographic Characteristics
# Low
% of # Moderate
% of # Middle % of #
Upper % of #
NA* % of #
Geographies (Census Tracts/BNAs) 416 18.99 19.95 37.98 22.36 0.72
Population by Geography 1,500,741 11.87 16.37 42.27 29.29 0.19
Owner-Occupied Housing by Geography
359,082 4.46 12.07 46.58 36.88 0.00
Business by Geography 119,366 7.28 13.38 42.50 36.29 0.55
Farms by Geography 2,098 2.34 5.62 49.43 42.52 0.10
Family Distribution by Income Level 383,799 19.84 17.89 23.61 38.65 0.00
Distribution of LMI Families throughout AA
144,827 20.54 24.36 40.13 14.97 0.00
Median Family Income (2000) $56,640 HUD Adjusted Median Family Income (2011) $72,300
Families Below Poverty Level 7.66%
Median Housing Value (2011) $185,200 Fair Market Two-Bedroom Rent (2011) $866 Unemployment Rate (Dec 2011, NSA) 7.1%
(*) The NA category consists of geographies that have not been assigned an income classification. Source: US Census, HUD, Bureau of Labor Statistics, and National Association of Realtors
The Milwaukee AA consists of the entire Milwaukee-Waukesha-West Allis MSA (Milwaukee MSA) in the state of Wisconsin. It includes Milwaukee, Ozaukee, Washington, and Waukesha Counties. The Milwaukee MSA is the largest metropolitan area in Wisconsin (and 39th largest in the United States). The AA meets regulatory requirements and does not arbitrarily exclude low- or moderate-income census tracts. Area demographics are reflected in the table above. The AA includes the City of Milwaukee, the largest city in Wisconsin. It is a commercial and industrial hub for the Great Lakes region. Milwaukee is located along the shores of Lake Michigan in southeastern Wisconsin, at the confluence of the Menomonee, Kinnickinnic, and Milwaukee rivers. Milwaukee is recognized as the home of Harley Davidson motorcycles, Miller Brewing, and several professional sports teams. The banking environment is competitive. There are 57 financial institutions operating 585 offices in this area as of June 30, 2011. USB is the market leader with $17.7 billion deposits, a 33 percent deposit market share, 46 branches, and 89 ATMs. Other market leaders are M&I Bank (23 percent deposit share), JPMorgan Chase (9 percent deposit share), and Associated Bank (4 percent deposit share). The local economy is diverse, although there is still a heavy reliance on manufacturing. Among major metropolitan areas, the Milwaukee MSA has a second-place rank in the percentage of its workforce in manufacturing. The economy is dominated by small- to medium-size firms from nearly every industrial classification. The area is also home to five FORTUNE 500 companies (Johnson Controls, Northwestern Mutual, Manpower, Rockwell Automation, and Harley-Davidson). Major employers include Aurora Health, Wheaton Franciscan Healthcare, Roundy’s, Froedtert and Community Health, Kohl’s, and Walmart Stores.

Charter Number: 24
Appendix C- 16
Tourism is also a major contributor to the local economy. Milwaukee hosts many festivals and parades throughout the year, and is home to nationally recognized museums, a zoo, professional sports teams, and entertainment venues. Altogether, these attractions bring more than 5 million tourists and generate $1.9 billion annually. Unemployment is 7.1 percent as of December 2011, which compares favorably to a national rate of 8.3 percent. However, unemployment is much higher in the City of Milwaukee (9.5 percent) compared to the suburban counties of Ozaukee (5.2 percent), Washington (6.1 percent), and Waukesha (5.6 percent). Most of the area’s LMI tracts are concentrated in the central and north part of the city. The Wisconsin Department of Public Instruction found that 83.5 percent of children in Milwaukee Public Schools qualify for free or reduced price school lunches, an indicator of child poverty. That is the highest rate in the state, while the surrounding suburbs have some of the lowest rates. Housing prices continued to decline throughout the evaluation period, due to a rising tide of foreclosures. LMI areas have been particularly hard hit by foreclosures. According to a 2011 report by the Center for Responsible Lending, low-income neighborhoods have a completed foreclosure rate that is 3.3 times higher than the overall rate for the metropolitan area (and the rate for moderate-income neighborhoods is twice as high). The median home price in the City of Milwaukee ($96,256) is much lower than the MSA’s median value ($185,200), and the second lowest median housing price for any city in the state. During 2011-2012, OCC staff spoke with a number of organizations and reviewed a number of reports involving a wide variety of community development initiatives. OCC also conducted a community contact and used three contacts conducted by another regulator (all in 2012). Contacts expressed needs for more credit availability in LMI areas, more affordable housing stock in suburban areas, better public transportation between Milwaukee and suburban counties, more flexible financing for LMI home buyers, combined home purchase/rehabilitation financing, small and micro- business loans, job readiness and skills training, transportation to work programs, financial education and counseling, school-age tutoring and mentoring programs to break multi-generational cycles of poverty, and funding for community development organizations. USB conducted an external survey in 2012 and identified needs for job creation, job placement, economic revitalization, economic development planning, affordable housing stock, and improved schools. There are many opportunities to meet credit and community development needs. The area has several sophisticated, accomplished and well-capitalized community development organizations, supported by an extensive network of foundations and universities that provide funding, information, and expertise. The area also has 12 CDFIs, as well as several low-income credit unions certified by the National Credit Union Administration. Milwaukee has an Urban Renewal Community designation, the boundaries of which generally follow the LMI census tracts in the greater downtown area. Much of the city also qualifies as an SBA Historically Underutilized Business Zone, evidencing a critical need for job creation and business development. There are several Brownfield-designated sites. LIHTCs tax credits are also available in the area under the NMTC program.
Charter Number: 24
Appendix D- 1
Appendix D: Tables of Performance Data Content of Standardized Tables A separate set of tables is provided for each state and for the Chicago-Joliet-Naperville MMSA. All other multistate metropolitan statistical areas are presented in one set of tables. References to the “bank” include activities of any affiliates that the bank provided for consideration (refer to Appendix A: Scope of the Examination). For purposes of reviewing the Lending Test tables, the following are applicable: (1) purchased loans are treated as originations/purchases and market share is the number of loans originated and purchased by the bank as a percentage of the aggregate number of reportable loans originated and purchased by all lenders in the MA/assessment area; (2) Partially geocoded loans (loans where no census tract is provided) cannot be broken down by income geographies and, therefore, are only reflected in the Total Loans in Core Tables 2 through 7 and part of Table 13; and (3) Partially geocoded loans are included in the Total Loans and Percent Bank Loans Column in Core Tables 8 through 12 and part of Table 13. Deposit data are compiled by the FDIC and are available as of June 30th of each year. Tables without data are not included in this PE. The following is a listing and brief description of the tables included in each set: Table 1. Lending Volume - Presents the number and dollar amount of reportable loans
originated and purchased by the bank over the evaluation period by MA/assessment area. Community development loans to statewide or regional entities or made outside the bank’s assessment area may receive positive CRA consideration. Refer to Interagency Q&As __.12(i) - 5 and - 6 for guidance on when a bank may receive positive CRA consideration for such loans.
Table 1. Other Products - Presents the number and dollar amount of any unreported
category of loans originated and purchased by the bank, if applicable, over the evaluation period by MA/assessment area. Examples include consumer loans or other data that a bank may provide, at its option, concerning its lending performance. This is a two-page table that lists specific categories.
Table 2. Geographic Distribution of Home Purchase Loans - Compares the percentage
distribution of the number of loans originated and purchased by the bank in low-, moderate-, middle-, and upper-income geographies to the percentage distribution of owner-occupied housing units throughout those geographies. The table also presents market share information based on the most recent aggregate market data available.
Table 3. Geographic Distribution of Home Improvement Loans - See Table 2. Table 4. Geographic Distribution of Home Mortgage Refinance Loans - See Table 2.

Charter Number: 24
Appendix D- 2
Table 5. Geographic Distribution of Multifamily Loans - Compares the percentage distribution of multifamily loans originated and purchased by the bank in low-, moderate-, middle-, and upper-income geographies to the percentage distribution of multifamily housing units throughout those geographies. The table also presents market share information based on the most recent aggregate market data available.
Table 6. Geographic Distribution of Small Loans to Businesses - The percentage
distribution of the number of small loans (less than or equal to $1 million) to businesses originated and purchased by the bank in low-, moderate-, middle-, and upper-income geographies compared to the percentage distribution of businesses (regardless of revenue size) throughout those geographies. The table also presents market share information based on the most recent aggregate market data available. Because small business data are not available for geographic areas smaller than counties, it may be necessary to use geographic areas larger than the bank’s assessment area.
Table 7. Geographic Distribution of Small Loans to Farms - The percentage distribution
of the number of small loans (less than or equal to $500,000) to farms originated and purchased by the bank in low-, moderate-, middle-, and upper-income geographies compared to the percentage distribution of farms (regardless of revenue size) throughout those geographies. The table also presents market share information based on the most recent aggregate market data available. Because small farm data are not available for geographic areas smaller than counties, it may be necessary to use geographic areas larger than the bank’s assessment area.
Table 8. Borrower Distribution of Home Purchase Loans - Compares the percentage distribution of the number of loans originated and purchased by the bank to low-, moderate-, middle-, and upper-income borrowers to the percentage distribution of families by income level in each MA/assessment area. The table also presents market share information based on the most recent aggregate market data available.
Table 9. Borrower Distribution of Home Improvement Loans - See Table 8. Table 10. Borrower Distribution of Home Mortgage Refinance Loans - See Table 8. Table 11. Borrower Distribution of Small Loans to Businesses - Compares the percentage
distribution of the number of small loans (less than or equal to $1 million) originated and purchased by the bank to businesses with revenues of $1 million or less to the percentage distribution of businesses with revenues of $1 million or less. In addition, the table presents the percentage distribution of the number of loans originated and purchased by the bank by loan size, regardless of the revenue size of the business. Market share information is presented based on the most recent aggregate market data available.

Charter Number: 24
Appendix D- 3
Table 12. Borrower Distribution of Small Loans to Farms - Compares the percentage distribution of the number of small loans (less than or equal to $500,000) originated and purchased by the bank to farms with revenues of $1 million or less to the percentage distribution of farms with revenues of $1 million or less. In addition, the table presents the percentage distribution of the number of loans originated and purchased by the bank by loan size, regardless of the revenue size of the farm. Market share information is presented based on the most recent aggregate market data available.
Table 13. Geographic and Borrower Distribution of Consumer Loans (OPTIONAL) -
For geographic distribution, the table compares the percentage distribution of the number of loans originated and purchased by the bank in low-, moderate-, middle-, and upper-income geographies to the percentage distribution of households within each geography. For borrower distribution, the table compares the percentage distribution of the number of loans originated and purchased by the bank to low-, moderate-, middle-, and upper-income borrowers to the percentage of households by income level in each MA/assessment area.
Table 14. Qualified Investments - Presents the number and dollar amount of qualified
investments made by the bank in each MA/AA. The table separately presents investments made during prior evaluation periods that are still outstanding and investments made during the current evaluation period. Prior-period investments are reflected at their book value as of the end of the evaluation period. Current period investments are reflected at their original investment amount even if that amount is greater than the current book value of the investment. The table also presents the number and dollar amount of unfunded qualified investment commitments. In order to be included, an unfunded commitment must be legally binding and tracked and recorded by the bank’s financial reporting system.
A bank may receive positive consideration for qualified investments in
statewide/regional entities or made outside of the bank’s assessment area. See Interagency Q&As __.12(i) - 5 and - 6 for guidance on when a bank may receive positive CRA consideration for such investments.
Table 15. Distribution of Branch Delivery System and Branch Openings/Closings -
Compares the percentage distribution of the number of the bank’s branches in low-, moderate-, middle-, and upper-income geographies to the percentage of the population within each geography in each MA/AA. The table also presents data on branch openings and closings in each MA/AA.

Charter Number 24
D - 4
Table 1. Lending Volume
LENDING VOLUME Geography: CHICAGO MULTISTATE MA Evaluation Period: JANUARY 1, 2009 To DECEMBER 31, 2011
MA/Assessment Area:
% of
Rated Area
Loans (#) in MA/AA*
Home Mortgage
Small Loans to
Businesses
Small Loans to
Farms
Community
Development Loans**
Total Reported Loans
% of Rated Area Deposits in MA/AA***
#
$ (000’s)
#
$ (000’s)
#
$
(000’s)
#
$ (000’s)
#
$(000’s)
Full-Review:
Chicago-Naperville-Joliet 87.98 34,200 8,717,627 18,902 534,825 26 1,616 17 126,764 53,145 9,380,832 93.30 Lake County-Kenosha County
12.02 4,394 1,209,128 2,857 72,016 10 284 2 17,064 7,263 1,298,492 6.70
* Loan Data as of December 31, 2011. Rated area refers to either the state or multistate MA rating area. ** The evaluation period for Community Development Loans is from January 1, 2009 to March 31, 2012. *** Deposit Data as of June 30, 2011. Rated Area refers to the state, multistate MA, or institution, as appropriate.

Charter Number 24
D - 5
Table 2. Geographic Distribution of Home Purchase Loans
Geographic Distribution: HOME PURCHASE Geography: CHICAGO MULTISTATE MA Evaluation Period: JANUARY 1, 2009 To DECEMBER 31, 2011
MA/Assessment Area:
Total Home
Purchase Loans
Low-Income Geographies
Moderate-Income
Geographies
Middle-Income Geographies
Upper-Income Geographies
Market Share (%) by Geography*
#
% of
Total**
% Owner
Occ Units***
% USB Loans
% Owner
Occ Units***
% USB Loans
% Owner
Occ Units***
% USB Loans
% Owner
Occ Units***
% USB Loans
Over-
all
Low
Mod
Mid
Upp
Full-Review:
Chicago- Naperville-Joliet
7,575 90.02 2.62 1.65 15.23 10.43 44.44 37.45 37.70 50.43 2.96 1.49 2.32 2.88 3.28
Lake County-Kenosha County
840 9.98
1.51 0.60 20.24 11.07 40.98 43.93 37.26 44.40 3.00 0.00 1.55 2.71 4.10
Data shown includes only one to four-family and manufactured housing (property type 1 or 2). * Based on 2011 Peer Mortgage Data (USPR). ** Home purchase loans originated and purchased in the MA/AA as a percentage of all home purchase loans originated and purchased in the rated area. *** Percentage of Owner-Occupied Units is the number of owner-occupied housing units in a particular geography divided by the number of owner-occupied housing units in the area based on 2000 Census information.

Charter Number 24
D - 6
Table 3. Geographic Distribution of Home Improvement Loans
Geographic Distribution: HOME IMPROVEMENT Geography: CHICAGO MULTISTATE MA Evaluation Period: JANUARY 1, 2009 To DECEMBER 31, 2011
MA/Assessment Area:
Total Home
Improvement Loans
Low-Income Geographies
Moderate-Income
Geographies
Middle-Income Geographies
Upper-Income Geographies
Market Share (%) by Geography*
#
% of
Total**
% Owner
Occ Units***
% USB Loans
% Owner
Occ Units***
% USB Loans
% Owner
Occ Units***
% USB Loans
% Owner
Occ Units***
%
USB Loans
Overall
Low
Mod
Mid
Upp
Full-Review:
Chicago-Naperville- Joliet
345 85.82 2.62 1.45 15.23 11.59 44.44 36.52 37.70 50.43 3.08 1.12 2.64 3.24 3.30
Lake County-Kenosha County
57 14.18
1.51 1.75 20.24 10.53 40.98 54.39 37.26 33.33 2.60 0.00 1.56 3.52 2.11
Data shown includes only one to four-family and manufactured housing (property type 1 or 2). * Based on 2011 Peer Mortgage Data (USPR). ** Home improvement loans originated and purchased in the MA/AA as a percentage of all home improvement loans originated and purchased in the rated area. *** Percentage of Owner-Occupied Units is the number of owner-occupied housing units in a particular geography divided by number of owner-occupied housing units in the area based on 2000 Census information.

Charter Number 24
D - 7
Table 4. Geographic Distribution of Home Mortgage Refinance Loans
Geographic Distribution: HOME MORTGAGE REFINANCE Geography: CHICAGO MULTISTATE MA Evaluation Period: JANUARY 1, 2009 To DECEMBER 31, 2011
MA/Assessment Area:
Total Home Mortgage
Refinance Loans
Low-Income Geographies
Moderate-Income
Geographies
Middle-Income Geographies
Upper-Income Geographies
Market Share (%) by Geography*
#
% of
Total**
% Owner
Occ Units***
% USB Loans
% Owner
Occ Units***
% USB Loans
% Owner
Occ Units***
% USB Loans
% Owner
Occ Units***
% USB Loans
Over-
all
Low
Mod
Mid
Upp
Full-Review:
Chicago- Naperville-Joliet
26,235 88.26 2.62 1.01 15.23 5.88 44.44 29.75 37.70 63.32 3.70 2.07 2.65 3.40 4.06
Lake County-Kenosha County
3,491 11.74
1.51 0.17 20.24 6.76 40.98 35.49 37.26 57.58 3.38 0.72 3.13 3.37 3.45
Data shown includes only one to four-family and manufactured housing (property type 1 or 2). * Based on 2011 Peer Mortgage Data (USPR). ** Home mortgage refinance loans originated and purchased in the MA/AA as a percentage of all home mortgage refinance loans originated and purchased in the rated area. *** Percentage of Owner-Occupied Units is the number of owner-occupied housing units in a particular geography divided by number of owner-occupied housing units in the area based on 2000 Census information.
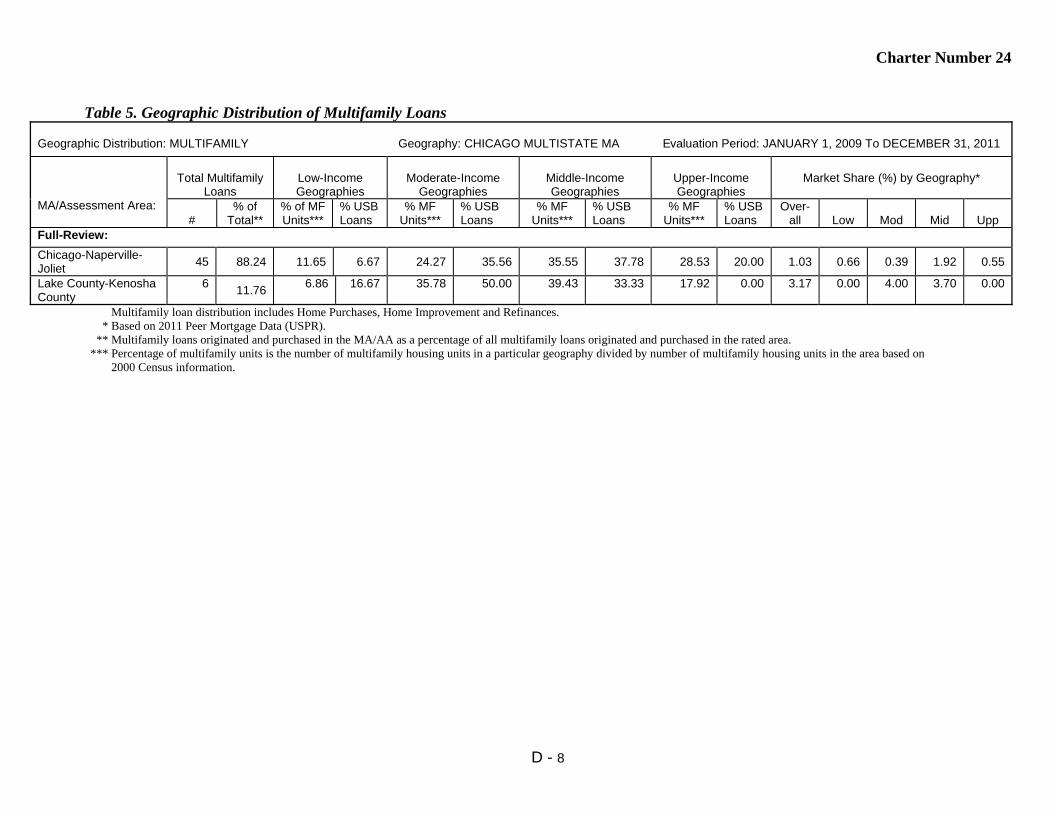
Charter Number 24
D - 8
Table 5. Geographic Distribution of Multifamily Loans
Geographic Distribution: MULTIFAMILY Geography: CHICAGO MULTISTATE MA Evaluation Period: JANUARY 1, 2009 To DECEMBER 31, 2011
MA/Assessment Area:
Total Multifamily
Loans
Low-Income Geographies
Moderate-Income
Geographies
Middle-Income Geographies
Upper-Income Geographies
Market Share (%) by Geography*
#
% of Total**
% of MF Units***
% USB Loans
% MF Units***
% USB Loans
% MF Units***
% USB Loans
% MF Units***
% USB Loans
Over-all
Low
Mod
Mid
Upp
Full-Review:
Chicago-Naperville- Joliet
45 88.24 11.65 6.67 24.27 35.56 35.55 37.78 28.53 20.00 1.03 0.66 0.39 1.92 0.55
Lake County-Kenosha County
6 11.76
6.86 16.67 35.78 50.00 39.43 33.33 17.92 0.00 3.17 0.00 4.00 3.70 0.00
Multifamily loan distribution includes Home Purchases, Home Improvement and Refinances. * Based on 2011 Peer Mortgage Data (USPR). ** Multifamily loans originated and purchased in the MA/AA as a percentage of all multifamily loans originated and purchased in the rated area. *** Percentage of multifamily units is the number of multifamily housing units in a particular geography divided by number of multifamily housing units in the area based on 2000 Census information.

Charter Number 24
D - 9
Table 6. Geographic Distribution of Small Loans to Businesses
Geographic Distribution: SMALL LOANS TO BUSINESSES Geography: CHICAGO MULTISTATE MA Evaluation Period: JANUARY 1, 2009 To DECEMBER 31, 2011
MA/Assessment Area:
Total Small
Business Loans
Low-Income Geographies
Moderate-Income
Geographies
Middle-Income Geographies
Upper-Income Geographies
Market Share (%) by Geography*
#
% of Total
**
% of
Businesses ***
%
USB Loans
% of
Businesses***
%
USB Loans
% of
Businesses ***
% USB Loans
% of
Businesses ***
%
USB Loans
Overall
Low
Mod
Mid
Upp
Full-Review:
Chicago-Naperville- Joliet
18,902 86.87 3.47 1.98 13.74 10.89 37.52 39.22 45.05 47.73 5.44 5.52 5.48 5.78 5.14
Lake County-Kenosha County
2,857 13.13
1.86 1.68 15.86 15.65 36.63 40.71 45.66 41.97 6.30 9.66 8.27 7.91 4.64
* Based on 2011 Peer Small Business Data – US and PR. ** Small loans to businesses originated and purchased in the MA/AA as a percentage of all small loans to businesses originated and purchased in the rated area. *** Source Data - Dun and Bradstreet (2011).

Charter Number 24
D - 10
Table 7. Geographic Distribution of Small Loans to Farms
Geographic Distribution: SMALL LOANS TO FARMS Geography: CHICAGO MULTISTATE MA Evaluation Period: JANUARY 1, 2009 To DECEMBER 31, 2011
MA/Assessment Area:
Total Small
Farm Loans
Low-Income Geographies
Moderate-Income
Geographies
Middle-Income Geographies
Upper-Income Geographies
Market Share (%) by Geography*
#
% of
Total**
% of
Farms***
% USB Loans
% of
Farms***
% USB Loans
% of
Farms***
% USB Loans
% of
Farms***
% USB Loans
Overall
Low
Mod
Mid
Upp
Full-Review:
Chicago-Naperville- Joliet
26 72.22 1.35 0.00 9.60 0.00 46.91 53.85 42.15 46.15 1.97 0.00 0.00 1.40 3.25
Lake County-Kenosha County
10 27.78
1.16 0.00 18.74 0.00 48.96 90.00 31.15 10.00 3.39 0.00 0.00 4.00 0.00
* Based on 2011 Peer Small Business Data – US and PR. ** Small loans to farms originated and purchased in the MA/AA as a percentage of all small loans to farms originated and purchased in the rated area. *** Source Data - Dun and Bradstreet (2011).
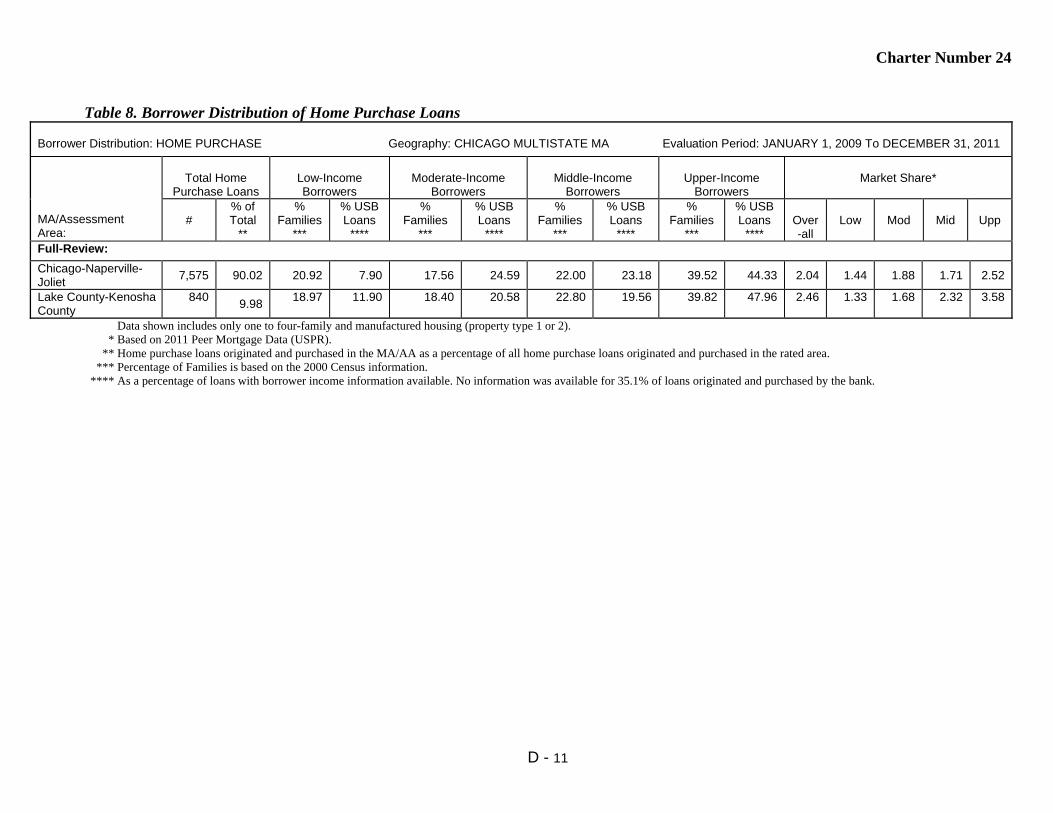
Charter Number 24
D - 11
Table 8. Borrower Distribution of Home Purchase Loans
Borrower Distribution: HOME PURCHASE Geography: CHICAGO MULTISTATE MA Evaluation Period: JANUARY 1, 2009 To DECEMBER 31, 2011
MA/Assessment Area:
Total Home
Purchase Loans
Low-Income Borrowers
Moderate-Income
Borrowers
Middle-Income
Borrowers
Upper-Income
Borrowers
Market Share*
#
% of Total
**
% Families
***
% USB Loans
****
% Families
***
% USB Loans
****
% Families
***
% USB Loans
****
% Families
***
% USB Loans
****
Over-all
Low
Mod
Mid
Upp
Full-Review:
Chicago-Naperville- Joliet
7,575 90.02 20.92 7.90 17.56 24.59 22.00 23.18 39.52 44.33 2.04 1.44 1.88 1.71 2.52
Lake County-Kenosha County
840 9.98
18.97 11.90 18.40 20.58 22.80 19.56 39.82 47.96 2.46 1.33 1.68 2.32 3.58
Data shown includes only one to four-family and manufactured housing (property type 1 or 2). * Based on 2011 Peer Mortgage Data (USPR). ** Home purchase loans originated and purchased in the MA/AA as a percentage of all home purchase loans originated and purchased in the rated area. *** Percentage of Families is based on the 2000 Census information. **** As a percentage of loans with borrower income information available. No information was available for 35.1% of loans originated and purchased by the bank.

Charter Number 24
D - 12
Table 9. Borrower Distribution of Home Improvement Loans
Borrower Distribution: HOME IMPROVEMENT Geography: CHICAGO MULTISTATE MA Evaluation Period: JANUARY 1, 2009 To DECEMBER 31, 2011
MA/Assessment Area:
Total Home Improvement
Loans
Low-Income Borrowers
Moderate-Income
Borrowers
Middle-Income
Borrowers
Upper-Income
Borrowers
Market Share*
#
% of Total
**
% Families
***
% USB Loans
****
% Families
***
% USB Loans
****
% Families
***
% USB Loans
****
% Families
***
% USB Loans
****
Over-
all
Low
Mod
Mid
Upp
Full-Review:
Chicago-Naperville- Joliet
345 85.82 20.92 17.09 17.56 15.82 22.00 23.42 39.52 43.67 3.22 4.46 2.69 2.99 3.24
Lake County-Kenosha County 57 14.18
18.97 16.67 18.40 16.67 22.80 25.93 39.82 40.74 2.81 3.42 2.33 2.78 2.81
Data shown includes only one to four-family and manufactured housing (property type of 1 or 2). * Based on 2011 Peer Mortgage Data (USPR). ** Home improvement loans originated and purchased in the MA/AA as a percentage of all home improvement loans originated and purchased in the rated area. *** Percentage of Families is based on the 2000 Census information. **** As a percentage of loans with borrower income information available. No information was available 8% of loans originated and purchased by the bank.

Charter Number 24
D - 13
Table 10. Borrower Distribution of Home Mortgage Refinance Loans
Borrower Distribution: HOME MORTGAGE REFINANCE Geography: CHICAGO MULTISTATE MA Evaluation Period: JANUARY 1, 2009 To DECEMBER 31, 2011
MA/Assessment Area:
Total Home Mortgage
Refinance Loans
Low-Income Borrowers
Moderate-Income
Borrowers
Middle-Income
Borrowers
Upper-Income
Borrowers
Market Share*
#
% of Total
**
% Families
***
% USB Loans
****
% Families
***
% USB Loans
****
% Families
***
% USB Loans
****
% Families
***
% USB Loans
****
Over-
all
Low
Mod
Mid
Upp
Full-Review:
Chicago- Naperville-Joliet
26,235 88.26 20.92 4.49 17.56 11.59 22.00 22.97 39.52 60.96 3.32 3.07 2.96 3.21 3.47
Lake County-Kenosha County 3,491 11.74
18.97 6.57 18.40 13.25 22.80 24.72 39.82 55.47 3.36 3.61 2.71 3.28 3.53
Data shown includes only one to four-family and manufactured housing (property type 1 or 2). * Based on 2011 Peer Mortgage Data (USPR). ** Home refinance loans originated and purchased in the MA/AA as a percentage of all home refinance loans originated and purchased in the rated area. *** Percentage of Families is based on the 2000 Census information. **** As a percentage of loans with borrower income information available. No information was available for 30.5% of loans originated and purchased by the bank.

Charter Number 24
D - 14
Table 11. Borrower Distribution of Small Loans to Businesses
Borrower Distribution: SMALL LOANS TO BUSINESSES Geography: CHICAGO MULTISTATE MA Evaluation Period: JANUARY 1, 2009 To DECEMBER 31, 2011
MA/Assessment Area:
Total Small Loans to
Businesses
Businesses With Revenues of $1 million or
less
Loans by Original Amount Regardless of Business Size
Market Share*
#
% of
Total**
% of Businesses
***
% USB
Loans****
$100,000 or
less
>$100,000 to $250,000
>$250,000 to $1,000,000
All
Rev $1 Million or
Less Full-Review:
Chicago-Naperville- Joliet
18,902 86.87 65.07 56.45 95.24 2.25 2.50 5.44 8.19
Lake County-Kenosha County
2,857 13.13
67.00 58.10 95.34 2.38 2.28 6.30 8.88
* Based on 2011 Peer Small Business Data – US and PR. ** Small loans to businesses originated and purchased in the MA/AA as a percentage of all small loans to businesses originated and purchased in the rated area. *** Businesses with revenues of $1 million or less as a percentage of all businesses (Source Dun and Bradstreet - 2011). **** Small loans to businesses with revenues of $1 million or less as a percentage of all loans reported as small loans to businesses. No information was available for 25.1% of small loans to businesses originated and purchased by the bank.
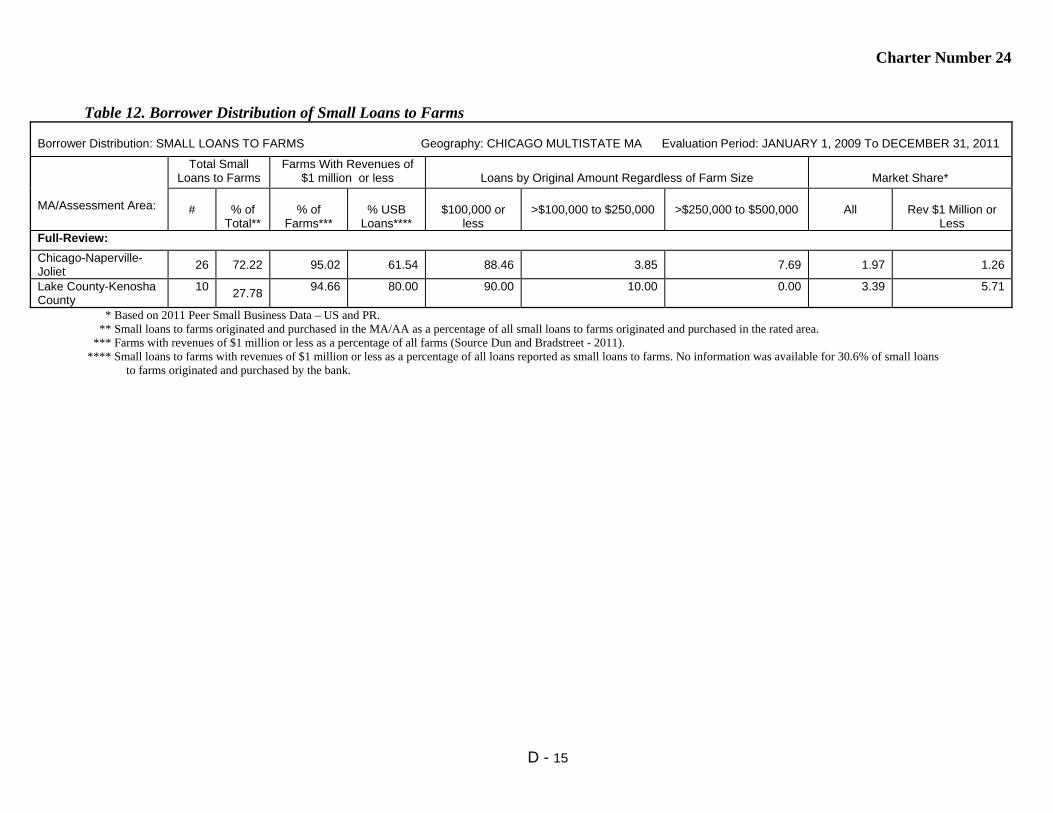
Charter Number 24
D - 15
Table 12. Borrower Distribution of Small Loans to Farms
Borrower Distribution: SMALL LOANS TO FARMS Geography: CHICAGO MULTISTATE MA Evaluation Period: JANUARY 1, 2009 To DECEMBER 31, 2011
MA/Assessment Area:
Total Small Loans to Farms
Farms With Revenues of $1 million or less
Loans by Original Amount Regardless of Farm Size
Market Share*
#
% of
Total**
% of
Farms***
% USB
Loans****
$100,000 or
less
>$100,000 to $250,000
>$250,000 to $500,000
All
Rev $1 Million or
Less Full-Review:
Chicago-Naperville- Joliet
26 72.22 95.02 61.54 88.46 3.85 7.69 1.97 1.26
Lake County-Kenosha County
10 27.78
94.66 80.00 90.00 10.00 0.00 3.39 5.71
* Based on 2011 Peer Small Business Data – US and PR. ** Small loans to farms originated and purchased in the MA/AA as a percentage of all small loans to farms originated and purchased in the rated area. *** Farms with revenues of $1 million or less as a percentage of all farms (Source Dun and Bradstreet - 2011). **** Small loans to farms with revenues of $1 million or less as a percentage of all loans reported as small loans to farms. No information was available for 30.6% of small loans to farms originated and purchased by the bank.

Charter Number 24
D - 16
Table 14. Qualified Investments
QUALIFIED INVESTMENTS Geography: CHICAGO MULTISTATE MA Evaluation Period: JANUARY 1, 2009 To MARCH 31, 2012
MA/Assessment Area:
Prior Period Investments* Current Period Investments** Total Investments Unfunded Commitments***
# $(000’s) # $(000’s) # $(000’s) % of Total # $(000’s) Full-Review:
Chicago-Naperville- Joliet
27 9,690 525 209,895 552 219,584 74.81% 8 43,718
Lake County-Kenosha County
17 2.109 50 4.103 67 6,212 100% 2 19,061
* 'Prior Period Investments' means investments made in a previous evaluation period that are outstanding as of the examination date. ** The evaluation period for current period investments is January 1, 2009 to March 31, 2012. *** 'Unfunded Commitments' means legally binding investment commitments that are tracked and recorded by the institution's financial reporting system.

Charter Number 24
D - 17
Table 15. Distribution of Branch Delivery System and Branch Openings/Closings
DISTRIBUTION OF BRANCH DELIVERY SYSTEM/BRANCH OPENINGS/CLOSINGS Geography: CHICAGO MULTISTATE MA Evaluation Period: JANUARY 1, 2009 To DECEMBER 31, 2011 MA/Assessment Area:
Deposits Branches Branch Openings/Closings Population
% of
Rated Area
Deposits in AA
# of USB
Branch-es
% of Rated Area
Branch-es in AA
Location of Branches by
Income of Geographies (%)
# of Branch Open-ings
# of Branch
Closings
Net change in Location of Branches (+ or - )
% of Population within Each
Geography
Low
Mod
Mid
Upp
Low
Mod
Mid
Upp
Low
Mod
Mid
Upp
Full-Review:
Chicago- Naperville-Joliet
93.30 78 88.64 5.13 16.67 35.90 42.31 6 3 0 3 0 0 7.98 23.66 38.77 29.58
Lake County- Kenosha County
6.70 10 11.36 0 40.00 30.00 30.00 1 0 0 0 0 1 3.53 27.25 37.38 31.84
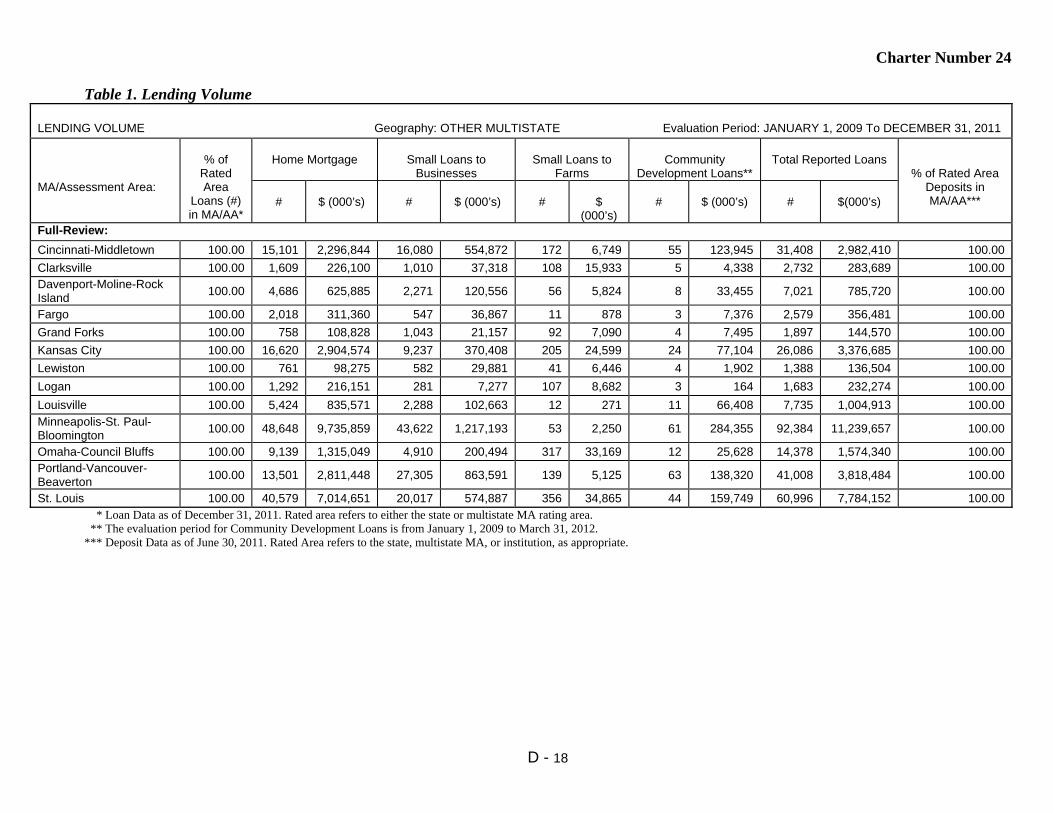
Charter Number 24
D - 18
Table 1. Lending Volume
LENDING VOLUME Geography: OTHER MULTISTATE Evaluation Period: JANUARY 1, 2009 To DECEMBER 31, 2011
MA/Assessment Area:
% of
Rated Area
Loans (#) in MA/AA*
Home Mortgage
Small Loans to
Businesses
Small Loans to
Farms
Community
Development Loans**
Total Reported Loans
% of Rated Area Deposits in MA/AA***
#
$ (000’s)
#
$ (000’s)
#
$
(000’s)
#
$ (000’s)
#
$(000’s)
Full-Review:
Cincinnati-Middletown 100.00 15,101 2,296,844 16,080 554,872 172 6,749 55 123,945 31,408 2,982,410 100.00
Clarksville 100.00 1,609 226,100 1,010 37,318 108 15,933 5 4,338 2,732 283,689 100.00 Davenport-Moline-Rock Island
100.00 4,686 625,885 2,271 120,556 56 5,824 8 33,455 7,021 785,720 100.00
Fargo 100.00 2,018 311,360 547 36,867 11 878 3 7,376 2,579 356,481 100.00
Grand Forks 100.00 758 108,828 1,043 21,157 92 7,090 4 7,495 1,897 144,570 100.00
Kansas City 100.00 16,620 2,904,574 9,237 370,408 205 24,599 24 77,104 26,086 3,376,685 100.00
Lewiston 100.00 761 98,275 582 29,881 41 6,446 4 1,902 1,388 136,504 100.00
Logan 100.00 1,292 216,151 281 7,277 107 8,682 3 164 1,683 232,274 100.00
Louisville 100.00 5,424 835,571 2,288 102,663 12 271 11 66,408 7,735 1,004,913 100.00 Minneapolis-St. Paul- Bloomington
100.00 48,648 9,735,859 43,622 1,217,193 53 2,250 61 284,355 92,384 11,239,657 100.00
Omaha-Council Bluffs 100.00 9,139 1,315,049 4,910 200,494 317 33,169 12 25,628 14,378 1,574,340 100.00 Portland-Vancouver- Beaverton
100.00 13,501 2,811,448 27,305 863,591 139 5,125 63 138,320 41,008 3,818,484 100.00
St. Louis 100.00 40,579 7,014,651 20,017 574,887 356 34,865 44 159,749 60,996 7,784,152 100.00 * Loan Data as of December 31, 2011. Rated area refers to either the state or multistate MA rating area. ** The evaluation period for Community Development Loans is from January 1, 2009 to March 31, 2012. *** Deposit Data as of June 30, 2011. Rated Area refers to the state, multistate MA, or institution, as appropriate.

Charter Number 24
D - 19
Table 2. Geographic Distribution of Home Purchase Loans
Geographic Distribution: HOME PURCHASE Geography: OTHER MULTISTATE Evaluation Period: JANUARY 1, 2009 To DECEMBER 31, 2011
MA/Assessment Area:
Total Home
Purchase Loans
Low-Income Geographies
Moderate-Income
Geographies
Middle-Income Geographies
Upper-Income Geographies
Market Share (%) by Geography*
#
% of
Total**
% Owner
Occ Units***
% USB Loans
% Owner
Occ Units***
% USB Loans
% Owner
Occ Units***
% USB Loans
% Owner
Occ Units***
% USB Loans
Over-
all
Low
Mod
Mid
Upp
Full-Review:
Cincinnati-Middletown 5,480 100.00 2.23 1.64 16.26 14.23 51.49 54.64 30.02 29.49 6.80 7.24 8.14 7.29 5.73
Clarksville 566 100.00 NA NA 10.53 6.01 59.46 63.43 30.01 30.57 1.90 NA 1.00 1.58 2.85
Davenport-Moline-Rock Island
1,726 100.00
1.27 0.81 14.63 10.78 59.83 57.13 24.27 31.29 9.42 6.90 10.87 9.97 8.23
Fargo 876 100.00 NA NA 8.26 4.45 72.89 62.67 18.86 32.88 9.18 NA 6.08 9.15 9.69
Grand Forks 235 100.00 0.09 0.43 1.58 2.13 75.52 65.11 22.81 32.34 6.98 0.00 14.29 7.17 6.39
Kansas City 6,154 100.00 3.16 0.52 16.58 10.82 47.61 46.04 32.65 42.62 8.07 6.21 10.21 8.30 7.52
Lewiston 114 100.00 NA NA 13.34 16.67 45.98 40.35 40.68 42.98 3.03 NA 1.89 3.61 2.87
Logan 212 100.00 0.27 0.00 17.81 19.34 50.26 42.92 31.66 37.74 5.25 0.00 5.09 4.76 5.97
Louisville 1,989 100.00 2.05 0.65 16.73 14.23 48.63 46.30 32.59 38.81 4.10 1.08 4.95 3.66 4.46
Minneapolis-St. Paul- Bloomington
15,911 100.00
1.52 2.27 13.14 15.49 56.62 54.77 28.72 27.48 11.71 15.34 13.72 11.38 11.31
Omaha-Council Bluffs 3,740 100.00 1.05 0.29 20.44 17.49 49.98 50.72 28.54 31.50 9.97 3.70 13.84 10.89 7.99
Portland-Vancouver- Beaverton
2,656 100.00
0.71 0.56 15.28 16.42 55.67 50.56 28.34 32.45 3.12 2.05 2.90 2.98 3.49
St. Louis 10,326 100.00 3.06 1.74 17.77 13.71 51.81 54.79 27.36 29.71 8.09 10.27 8.34 8.36 7.52
Data shown includes only one to four-family and manufactured housing (property type 1 or 2). Distributions may not total 100% in markets with NA tracts (St. Louis). * Based on 2011 Peer Mortgage Data (USPR). ** Home purchase loans originated and purchased in the MA/AA as a percentage of all home purchase loans originated and purchased in the rated area. *** Percentage of Owner-Occupied Units is the number of owner-occupied housing units in a particular geography divided by the number of owner-occupied housing units in the area based on 2000 Census information.

Charter Number 24
D - 20
Table 3. Geographic Distribution of Home Improvement Loans
Geographic Distribution: HOME IMPROVEMENT Geography: OTHER MULTISTATE Evaluation Period: JANUARY 1, 2009 To DECEMBER 31, 2011
MA/Assessment Area:
Total Home
Improvement Loans
Low-Income Geographies
Moderate-Income
Geographies
Middle-Income Geographies
Upper-Income Geographies
Market Share (%) by Geography*
#
% of
Total**
% Owner
Occ Units***
% USB Loans
% Owner
Occ Units***
% USB Loans
% Owner
Occ Units***
% USB Loans
% Owner
Occ Units***
%
USB Loans
Overall
Low
Mod
Mid
Upp
Full-Review:
Cincinnati-Middletown 543 100.00 2.23 1.84 16.26 15.29 51.49 51.01 30.02 31.86 10.91 11.11 7.25 11.45 12.06
Clarksville 72 100.00 NA NA 10.53 11.11 59.46 56.94 30.01 31.94 7.06 NA 6.25 8.70 4.71
Davenport-Moline- Rock Island
113 100.00
1.27 0.00 14.63 23.01 59.83 43.36 24.27 33.63 4.50 0.00 6.00 4.02 4.89
Fargo 20 100.00 NA NA 8.26 5.00 72.89 70.00 18.86 25.00 2.59 NA 2.33 2.58 2.68
Grand Forks 36 100.00 0.09 0.00 1.58 2.78 75.52 66.67 22.81 30.56 5.53 0.00 0.00 5.00 6.67
Kansas City 279 100.00 3.16 2.87 16.58 12.90 47.61 45.52 32.65 38.71 7.57 11.43 9.04 7.11 7.57
Lewiston 63 100.00 NA NA 13.34 14.29 45.98 44.44 40.68 41.27 30.11 NA 28.57 22.58 35.42
Logan 10 100.00 0.27 0.00 17.81 20.00 50.26 60.00 31.66 20.00 3.09 0.00 10.00 2.08 2.56
Louisville 144 100.00 2.05 0.69 16.73 8.33 48.63 45.83 32.59 45.14 4.30 0.00 2.78 3.73 5.90
Minneapolis-St. Paul- Bloomington
756 100.00
1.52 1.85 13.14 9.92 56.62 52.51 28.72 35.71 8.63 8.33 7.51 7.82 10.37
Omaha-Council Bluffs 212 100.00 1.05 0.00 20.44 16.04 49.98 48.11 28.54 35.85 4.70 0.00 4.13 4.88 4.83
Portland-Vancouver- Beaverton
476 100.00
0.71 0.42 15.28 14.92 55.67 60.08 28.34 24.58 10.71 11.11 11.86 11.20 9.40
St. Louis 633 100.00 3.06 1.11 17.77 13.27 51.81 52.29 27.36 33.33 9.00 0.00 6.81 8.16 12.69
Data shown includes only one to four-family and manufactured housing (property type 1 or 2). * Based on 2011 Peer Mortgage Data (USPR). ** Home improvement loans originated and purchased in the MA/AA as a percentage of all home improvement loans originated and purchased in the rated area. *** Percentage of Owner-Occupied Units is the number of owner-occupied housing units in a particular geography divided by number of owner-occupied housing units in the area based on 2000 Census information.
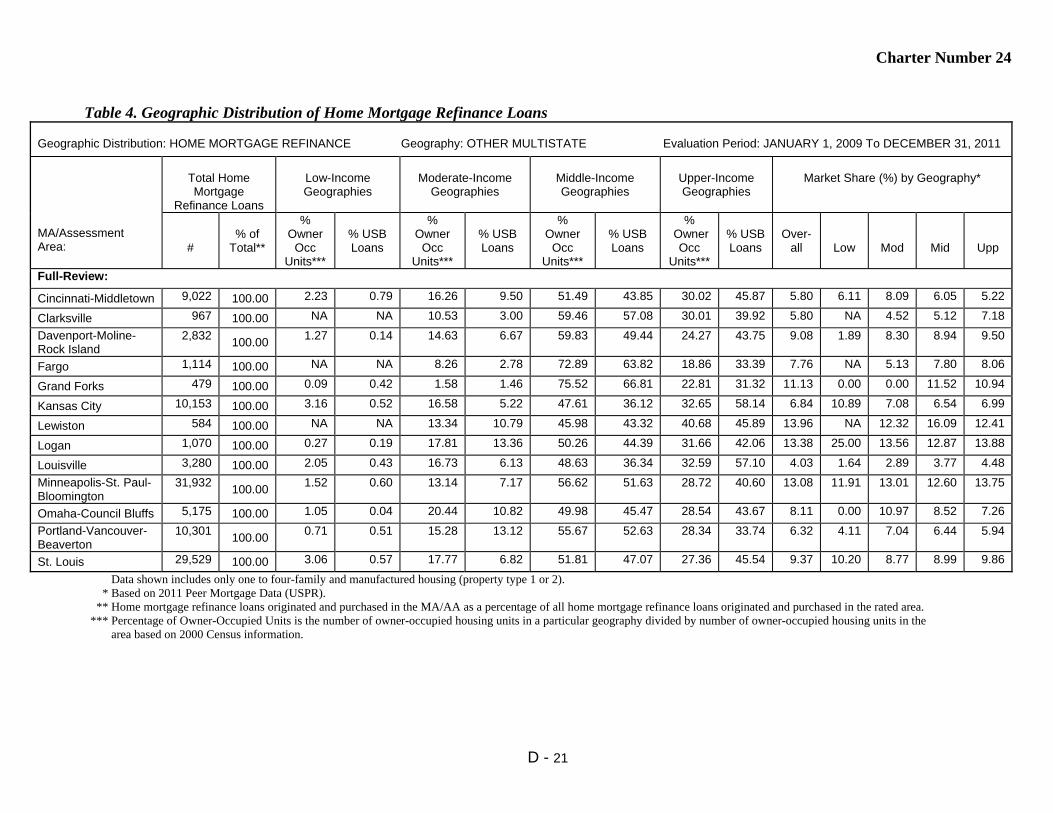
Charter Number 24
D - 21
Table 4. Geographic Distribution of Home Mortgage Refinance Loans
Geographic Distribution: HOME MORTGAGE REFINANCE Geography: OTHER MULTISTATE Evaluation Period: JANUARY 1, 2009 To DECEMBER 31, 2011
MA/Assessment Area:
Total Home Mortgage
Refinance Loans
Low-Income Geographies
Moderate-Income
Geographies
Middle-Income Geographies
Upper-Income Geographies
Market Share (%) by Geography*
#
% of
Total**
% Owner
Occ Units***
% USB Loans
% Owner
Occ Units***
% USB Loans
% Owner
Occ Units***
% USB Loans
% Owner
Occ Units***
% USB Loans
Over-
all
Low
Mod
Mid
Upp
Full-Review:
Cincinnati-Middletown 9,022 100.00 2.23 0.79 16.26 9.50 51.49 43.85 30.02 45.87 5.80 6.11 8.09 6.05 5.22
Clarksville 967 100.00 NA NA 10.53 3.00 59.46 57.08 30.01 39.92 5.80 NA 4.52 5.12 7.18
Davenport-Moline- Rock Island
2,832 100.00
1.27 0.14 14.63 6.67 59.83 49.44 24.27 43.75 9.08 1.89 8.30 8.94 9.50
Fargo 1,114 100.00 NA NA 8.26 2.78 72.89 63.82 18.86 33.39 7.76 NA 5.13 7.80 8.06
Grand Forks 479 100.00 0.09 0.42 1.58 1.46 75.52 66.81 22.81 31.32 11.13 0.00 0.00 11.52 10.94
Kansas City 10,153 100.00 3.16 0.52 16.58 5.22 47.61 36.12 32.65 58.14 6.84 10.89 7.08 6.54 6.99
Lewiston 584 100.00 NA NA 13.34 10.79 45.98 43.32 40.68 45.89 13.96 NA 12.32 16.09 12.41
Logan 1,070 100.00 0.27 0.19 17.81 13.36 50.26 44.39 31.66 42.06 13.38 25.00 13.56 12.87 13.88
Louisville 3,280 100.00 2.05 0.43 16.73 6.13 48.63 36.34 32.59 57.10 4.03 1.64 2.89 3.77 4.48
Minneapolis-St. Paul- Bloomington
31,932 100.00
1.52 0.60 13.14 7.17 56.62 51.63 28.72 40.60 13.08 11.91 13.01 12.60 13.75
Omaha-Council Bluffs 5,175 100.00 1.05 0.04 20.44 10.82 49.98 45.47 28.54 43.67 8.11 0.00 10.97 8.52 7.26
Portland-Vancouver- Beaverton
10,301 100.00
0.71 0.51 15.28 13.12 55.67 52.63 28.34 33.74 6.32 4.11 7.04 6.44 5.94
St. Louis 29,529 100.00 3.06 0.57 17.77 6.82 51.81 47.07 27.36 45.54 9.37 10.20 8.77 8.99 9.86
Data shown includes only one to four-family and manufactured housing (property type 1 or 2). * Based on 2011 Peer Mortgage Data (USPR). ** Home mortgage refinance loans originated and purchased in the MA/AA as a percentage of all home mortgage refinance loans originated and purchased in the rated area. *** Percentage of Owner-Occupied Units is the number of owner-occupied housing units in a particular geography divided by number of owner-occupied housing units in the area based on 2000 Census information.

Charter Number 24
D - 22
Table 5. Geographic Distribution of Multifamily Loans
Geographic Distribution: MULTIFAMILY Geography: OTHER MULTISTATE Evaluation Period: JANUARY 1, 2009 To DECEMBER 31, 2011
MA/Assessment Area:
Total Multifamily
Loans
Low-Income Geographies
Moderate-Income
Geographies
Middle-Income Geographies
Upper-Income Geographies
Market Share (%) by Geography*
#
% of Total**
% of MF Units***
% USB Loans
% MF Units***
% USB Loans
% MF Units***
% USB Loans
% MF Units***
% USB Loans
Over-all
Low
Mod
Mid
Upp
Full-Review:
Cincinnati-Middletown 56 100.00 17.21 17.86 22.93 30.36 43.76 33.93 16.03 17.86 15.09 33.33 17.24 11.11 11.54
Clarksville 4 100.00 NA NA 30.43 0.00 52.69 100.0 16.88 0.00 9.09 NA 0.00 11.43 0.00
Davenport-Moline-Rock Island
15 100.00
5.90 6.67 20.24 46.67 50.16 26.67 23.70 20.00 7.69 9.09 8.70 0.00 21.43
Fargo 8 100.00 NA NA 30.13 62.50 60.36 25.00 9.51 12.50 1.85 NA 0.00 1.59 4.76
Grand Forks 8 100.00 7.01 0.00 3.65 0.00 80.23 100.0 9.11 0.00 27.78 0.00 0.00 33.33 0.00
Kansas City 34 100.00 7.02 8.82 27.98 32.35 45.98 47.06 19.01 11.76 9.33 28.57 8.70 10.96 0.00
Lewiston 0 100.00 NA NA 39.46 0.00 31.28 0.00 29.25 0.00 0.00 NA 0.00 0.00 0.00
Logan 0 100.00 24.45 0.00 65.36 0.00 8.26 0.00 1.93 0.00 0.00 0.00 0.00 0.00 0.00
Louisville 11 100.00 10.39 0.00 27.86 45.45 37.85 36.36 23.90 18.18 5.26 0.00 5.56 8.57 0.00
Minneapolis-St. Paul- Bloomington
49 100.00
9.92 18.37 29.30 36.73 47.04 34.69 13.74 10.20 4.18 7.14 4.20 3.33 3.45
Omaha-Council Bluffs 12 100.00 1.85 0.00 30.85 41.67 52.76 41.67 14.54 16.67 3.23 0.00 1.52 6.00 0.00
Portland-Vancouver- Beaverton
68 100.00
3.45 4.41 34.92 48.53 43.32 36.76 18.32 10.29 7.74 12.50 8.76 7.69 2.50
St. Louis 91 100.00 10.69 7.69 20.27 35.16 47.89 48.35 21.08 8.79 9.70 12.50 22.67 3.62 5.13
Multifamily loan distribution includes Home Purchases, Home Improvement and Refinances. Distributions may not total 100% in markets with NA tracts (Cincinnati, St. Louis). * Based on 2011 Peer Mortgage Data (USPR). ** Multifamily loans originated and purchased in the MA/AA as a percentage of all multifamily loans originated and purchased in the rated area. *** Percentage of multifamily units is the number of multifamily housing units in a particular geography divided by number of multifamily housing units in the area based on 2000 Census information.

Charter Number 24
D - 23
Table 6. Geographic Distribution of Small Loans to Businesses
Geographic Distribution: SMALL LOANS TO BUSINESSES Geography: OTHER MULTISTATE Evaluation Period: JANUARY 1, 2009 To DECEMBER 31, 2011
MA/Assessment Area:
Total Small
Business Loans
Low-Income Geographies
Moderate-Income
Geographies
Middle-Income Geographies
Upper-Income Geographies
Market Share (%) by Geography*
#
% of Total
**
% of
Businesses ***
%
USB Loans
% of
Businesses***
%
USB Loans
% of
Businesses ***
% USB Loans
% of
Businesses ***
%
USB Loans
Overall
Low
Mod
Mid
Upp
Full-Review:
Cincinnati-Middletown 16,080 100.00 4.37 4.09 16.60 16.67 47.63 45.00 30.78 33.41 19.58 21.13 21.83 19.34 17.98
Clarksville 1,010 100.00 NA NA 22.61 15.54 51.73 51.19 25.66 33.27 18.22 NA 15.74 18.54 18.84
Davenport-Moline-Rock Island
2,271 100.00
4.82 6.91 16.75 13.78 50.04 42.80 28.39 36.50 20.22 18.12 14.32 20.60 23.19
Fargo 547 100.00 NA NA 22.48 26.14 58.95 59.96 18.56 13.89 25.97 NA 22.50 21.06 37.14
Grand Forks 1,043 100.00 2.34 3.26 3.17 2.88 70.60 65.68 23.89 28.19 33.78 56.00 16.67 29.87 28.28
Kansas City 9,237 100.00 2.91 2.73 14.37 15.75 41.86 39.31 40.07 40.90 13.86 17.38 17.90 13.48 12.65
Lewiston 582 100.00 NA NA 30.61 37.11 37.25 32.99 32.14 29.90 17.01 NA 18.97 17.22 15.00
Logan 281 100.00 1.18 1.07 25.32 18.15 42.82 64.41 30.68 16.37 5.68 20.00 4.09 7.87 2.98
Louisville 2,288 100.00 3.38 2.67 20.26 18.79 36.93 32.52 39.42 46.02 5.64 3.93 6.10 5.34 5.70
Minneapolis-St. Paul- Bloomington
43,622 100.00
3.25 3.00 13.44 13.33 54.44 51.57 28.74 32.08 23.87 26.37 27.68 23.63 22.66
Omaha-Council Bluffs 4,910 100.00 1.57 0.88 17.90 19.96 47.36 48.59 33.17 30.57 15.86 16.94 20.70 16.24 13.06
Portland-Vancouver- Beaverton
27,305 100.00
3.87 4.41 19.29 19.37 47.65 48.17 29.18 28.04 20.43 25.46 20.80 20.36 18.17
St. Louis 20,017 100.00 3.92 3.48 16.34 14.62 46.78 45.96 32.69 35.59 18.60 22.25 20.74 18.07 17.68
* Based on 2011 Peer Small Business Data – US and PR. ** Small loans to businesses originated and purchased in the MA/AA as a percentage of all small loans to businesses originated and purchased in the rated area. *** Source Data - Dun and Bradstreet (2011).
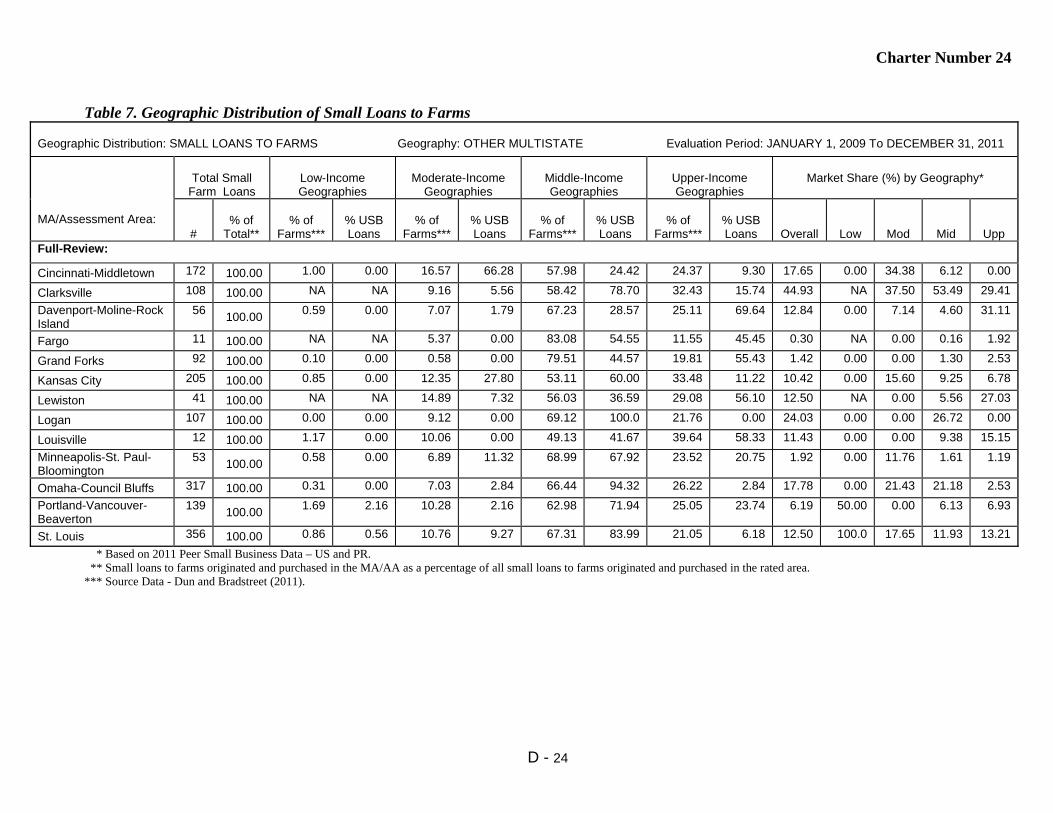
Charter Number 24
D - 24
Table 7. Geographic Distribution of Small Loans to Farms
Geographic Distribution: SMALL LOANS TO FARMS Geography: OTHER MULTISTATE Evaluation Period: JANUARY 1, 2009 To DECEMBER 31, 2011
MA/Assessment Area:
Total Small
Farm Loans
Low-Income Geographies
Moderate-Income
Geographies
Middle-Income Geographies
Upper-Income Geographies
Market Share (%) by Geography*
#
% of
Total**
% of
Farms***
% USB Loans
% of
Farms***
% USB Loans
% of
Farms***
% USB Loans
% of
Farms***
% USB Loans
Overall
Low
Mod
Mid
Upp
Full-Review:
Cincinnati-Middletown 172 100.00 1.00 0.00 16.57 66.28 57.98 24.42 24.37 9.30 17.65 0.00 34.38 6.12 0.00
Clarksville 108 100.00 NA NA 9.16 5.56 58.42 78.70 32.43 15.74 44.93 NA 37.50 53.49 29.41
Davenport-Moline-Rock Island
56 100.00
0.59 0.00 7.07 1.79 67.23 28.57 25.11 69.64 12.84 0.00 7.14 4.60 31.11
Fargo 11 100.00 NA NA 5.37 0.00 83.08 54.55 11.55 45.45 0.30 NA 0.00 0.16 1.92
Grand Forks 92 100.00 0.10 0.00 0.58 0.00 79.51 44.57 19.81 55.43 1.42 0.00 0.00 1.30 2.53
Kansas City 205 100.00 0.85 0.00 12.35 27.80 53.11 60.00 33.48 11.22 10.42 0.00 15.60 9.25 6.78
Lewiston 41 100.00 NA NA 14.89 7.32 56.03 36.59 29.08 56.10 12.50 NA 0.00 5.56 27.03
Logan 107 100.00 0.00 0.00 9.12 0.00 69.12 100.0 21.76 0.00 24.03 0.00 0.00 26.72 0.00
Louisville 12 100.00 1.17 0.00 10.06 0.00 49.13 41.67 39.64 58.33 11.43 0.00 0.00 9.38 15.15
Minneapolis-St. Paul- Bloomington
53 100.00
0.58 0.00 6.89 11.32 68.99 67.92 23.52 20.75 1.92 0.00 11.76 1.61 1.19
Omaha-Council Bluffs 317 100.00 0.31 0.00 7.03 2.84 66.44 94.32 26.22 2.84 17.78 0.00 21.43 21.18 2.53
Portland-Vancouver- Beaverton
139 100.00
1.69 2.16 10.28 2.16 62.98 71.94 25.05 23.74 6.19 50.00 0.00 6.13 6.93
St. Louis 356 100.00 0.86 0.56 10.76 9.27 67.31 83.99 21.05 6.18 12.50 100.0 17.65 11.93 13.21
* Based on 2011 Peer Small Business Data – US and PR. ** Small loans to farms originated and purchased in the MA/AA as a percentage of all small loans to farms originated and purchased in the rated area. *** Source Data - Dun and Bradstreet (2011).
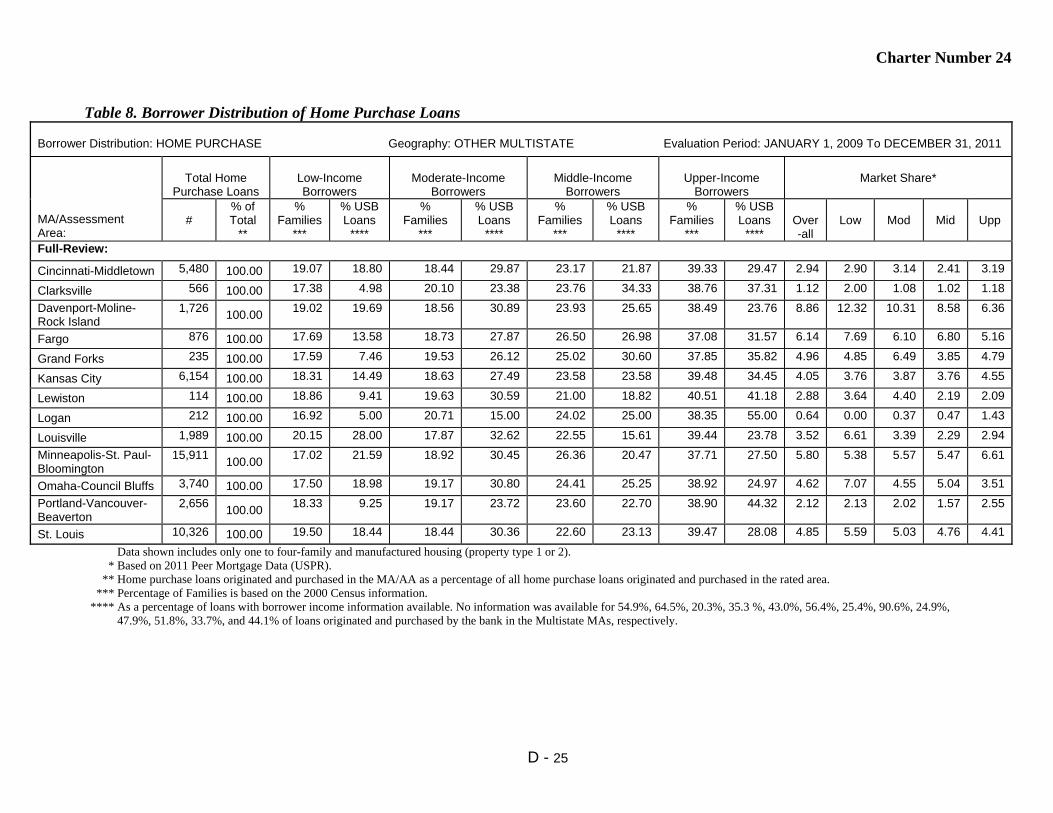
Charter Number 24
D - 25
Table 8. Borrower Distribution of Home Purchase Loans
Borrower Distribution: HOME PURCHASE Geography: OTHER MULTISTATE Evaluation Period: JANUARY 1, 2009 To DECEMBER 31, 2011
MA/Assessment Area:
Total Home
Purchase Loans
Low-Income Borrowers
Moderate-Income
Borrowers
Middle-Income
Borrowers
Upper-Income
Borrowers
Market Share*
#
% of Total
**
% Families
***
% USB Loans
****
% Families
***
% USB Loans
****
% Families
***
% USB Loans
****
% Families
***
% USB Loans
****
Over-all
Low
Mod
Mid
Upp
Full-Review:
Cincinnati-Middletown 5,480 100.00 19.07 18.80 18.44 29.87 23.17 21.87 39.33 29.47 2.94 2.90 3.14 2.41 3.19
Clarksville 566 100.00 17.38 4.98 20.10 23.38 23.76 34.33 38.76 37.31 1.12 2.00 1.08 1.02 1.18
Davenport-Moline- Rock Island
1,726 100.00
19.02 19.69 18.56 30.89 23.93 25.65 38.49 23.76 8.86 12.32 10.31 8.58 6.36
Fargo 876 100.00 17.69 13.58 18.73 27.87 26.50 26.98 37.08 31.57 6.14 7.69 6.10 6.80 5.16
Grand Forks 235 100.00 17.59 7.46 19.53 26.12 25.02 30.60 37.85 35.82 4.96 4.85 6.49 3.85 4.79
Kansas City 6,154 100.00 18.31 14.49 18.63 27.49 23.58 23.58 39.48 34.45 4.05 3.76 3.87 3.76 4.55
Lewiston 114 100.00 18.86 9.41 19.63 30.59 21.00 18.82 40.51 41.18 2.88 3.64 4.40 2.19 2.09
Logan 212 100.00 16.92 5.00 20.71 15.00 24.02 25.00 38.35 55.00 0.64 0.00 0.37 0.47 1.43
Louisville 1,989 100.00 20.15 28.00 17.87 32.62 22.55 15.61 39.44 23.78 3.52 6.61 3.39 2.29 2.94
Minneapolis-St. Paul- Bloomington
15,911 100.00
17.02 21.59 18.92 30.45 26.36 20.47 37.71 27.50 5.80 5.38 5.57 5.47 6.61
Omaha-Council Bluffs 3,740 100.00 17.50 18.98 19.17 30.80 24.41 25.25 38.92 24.97 4.62 7.07 4.55 5.04 3.51
Portland-Vancouver- Beaverton
2,656 100.00
18.33 9.25 19.17 23.72 23.60 22.70 38.90 44.32 2.12 2.13 2.02 1.57 2.55
St. Louis 10,326 100.00 19.50 18.44 18.44 30.36 22.60 23.13 39.47 28.08 4.85 5.59 5.03 4.76 4.41
Data shown includes only one to four-family and manufactured housing (property type 1 or 2). * Based on 2011 Peer Mortgage Data (USPR). ** Home purchase loans originated and purchased in the MA/AA as a percentage of all home purchase loans originated and purchased in the rated area. *** Percentage of Families is based on the 2000 Census information. **** As a percentage of loans with borrower income information available. No information was available for 54.9%, 64.5%, 20.3%, 35.3 %, 43.0%, 56.4%, 25.4%, 90.6%, 24.9%, 47.9%, 51.8%, 33.7%, and 44.1% of loans originated and purchased by the bank in the Multistate MAs, respectively.
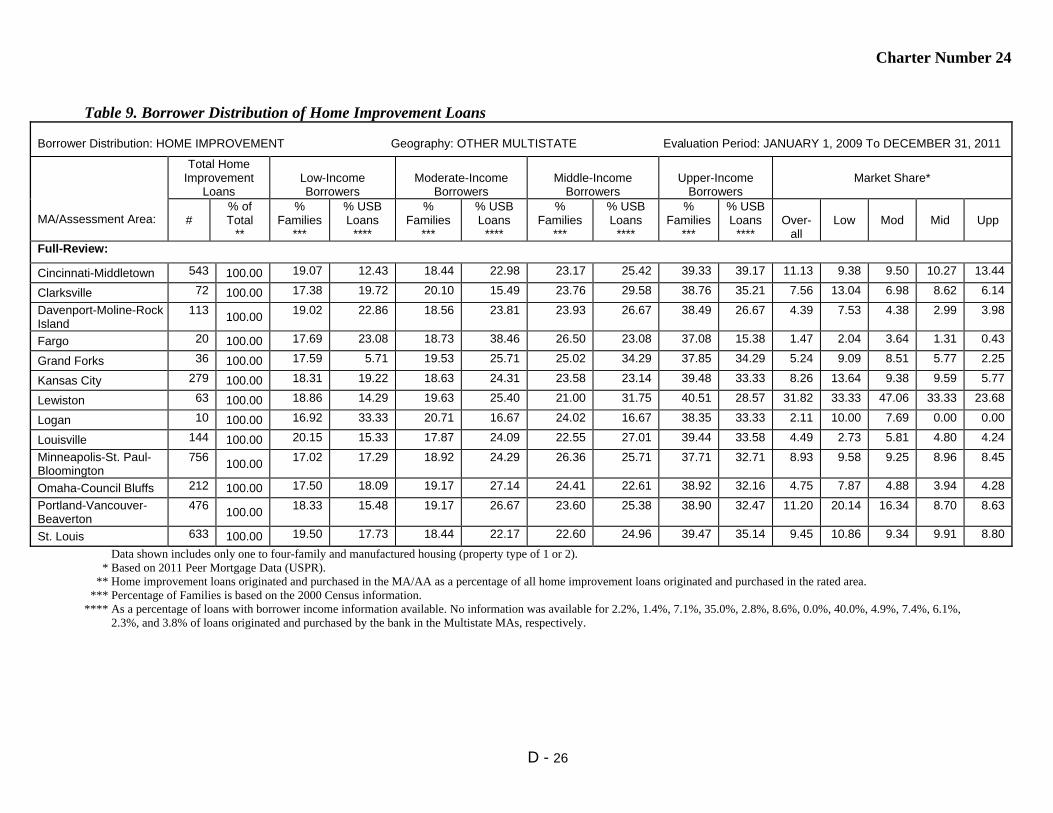
Charter Number 24
D - 26
Table 9. Borrower Distribution of Home Improvement Loans
Borrower Distribution: HOME IMPROVEMENT Geography: OTHER MULTISTATE Evaluation Period: JANUARY 1, 2009 To DECEMBER 31, 2011
MA/Assessment Area:
Total Home Improvement
Loans
Low-Income Borrowers
Moderate-Income
Borrowers
Middle-Income
Borrowers
Upper-Income
Borrowers
Market Share*
#
% of Total
**
% Families
***
% USB Loans
****
% Families
***
% USB Loans
****
% Families
***
% USB Loans
****
% Families
***
% USB Loans
****
Over-
all
Low
Mod
Mid
Upp
Full-Review:
Cincinnati-Middletown 543 100.00 19.07 12.43 18.44 22.98 23.17 25.42 39.33 39.17 11.13 9.38 9.50 10.27 13.44
Clarksville 72 100.00 17.38 19.72 20.10 15.49 23.76 29.58 38.76 35.21 7.56 13.04 6.98 8.62 6.14
Davenport-Moline-Rock Island
113 100.00
19.02 22.86 18.56 23.81 23.93 26.67 38.49 26.67 4.39 7.53 4.38 2.99 3.98
Fargo 20 100.00 17.69 23.08 18.73 38.46 26.50 23.08 37.08 15.38 1.47 2.04 3.64 1.31 0.43
Grand Forks 36 100.00 17.59 5.71 19.53 25.71 25.02 34.29 37.85 34.29 5.24 9.09 8.51 5.77 2.25
Kansas City 279 100.00 18.31 19.22 18.63 24.31 23.58 23.14 39.48 33.33 8.26 13.64 9.38 9.59 5.77
Lewiston 63 100.00 18.86 14.29 19.63 25.40 21.00 31.75 40.51 28.57 31.82 33.33 47.06 33.33 23.68
Logan 10 100.00 16.92 33.33 20.71 16.67 24.02 16.67 38.35 33.33 2.11 10.00 7.69 0.00 0.00
Louisville 144 100.00 20.15 15.33 17.87 24.09 22.55 27.01 39.44 33.58 4.49 2.73 5.81 4.80 4.24
Minneapolis-St. Paul- Bloomington
756 100.00
17.02 17.29 18.92 24.29 26.36 25.71 37.71 32.71 8.93 9.58 9.25 8.96 8.45
Omaha-Council Bluffs 212 100.00 17.50 18.09 19.17 27.14 24.41 22.61 38.92 32.16 4.75 7.87 4.88 3.94 4.28
Portland-Vancouver- Beaverton
476 100.00
18.33 15.48 19.17 26.67 23.60 25.38 38.90 32.47 11.20 20.14 16.34 8.70 8.63
St. Louis 633 100.00 19.50 17.73 18.44 22.17 22.60 24.96 39.47 35.14 9.45 10.86 9.34 9.91 8.80
Data shown includes only one to four-family and manufactured housing (property type of 1 or 2). * Based on 2011 Peer Mortgage Data (USPR). ** Home improvement loans originated and purchased in the MA/AA as a percentage of all home improvement loans originated and purchased in the rated area. *** Percentage of Families is based on the 2000 Census information. **** As a percentage of loans with borrower income information available. No information was available for 2.2%, 1.4%, 7.1%, 35.0%, 2.8%, 8.6%, 0.0%, 40.0%, 4.9%, 7.4%, 6.1%, 2.3%, and 3.8% of loans originated and purchased by the bank in the Multistate MAs, respectively.
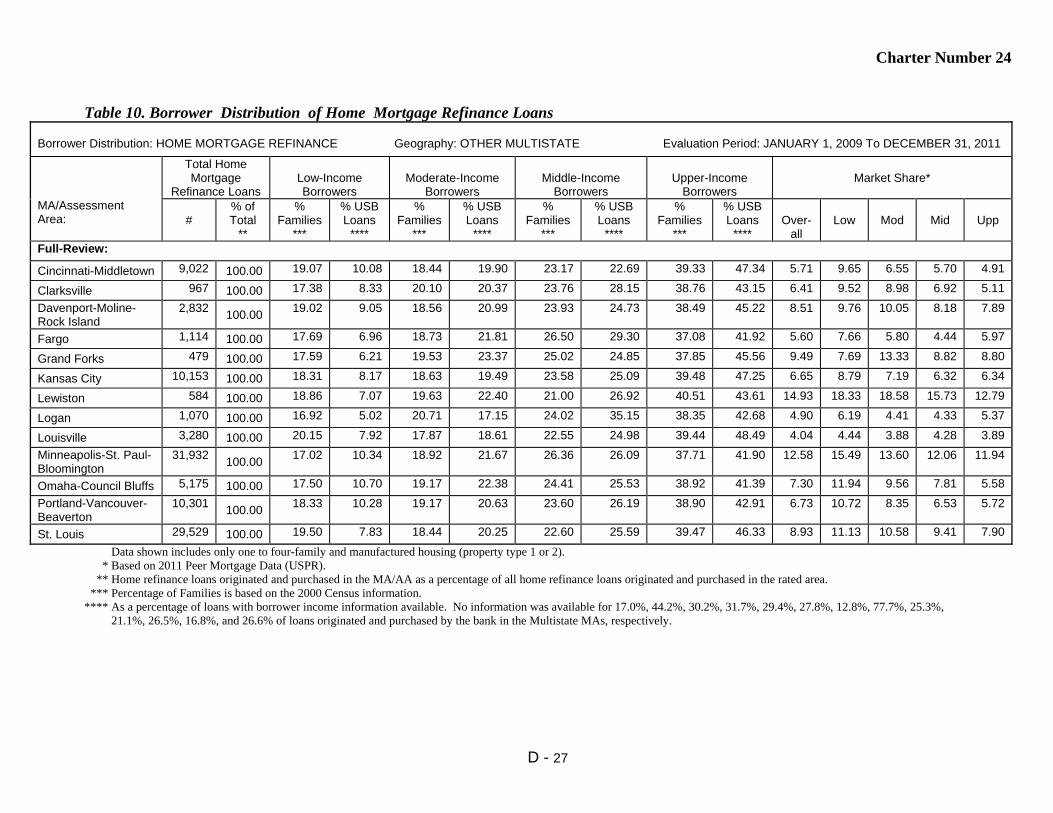
Charter Number 24
D - 27
Table 10. Borrower Distribution of Home Mortgage Refinance Loans
Borrower Distribution: HOME MORTGAGE REFINANCE Geography: OTHER MULTISTATE Evaluation Period: JANUARY 1, 2009 To DECEMBER 31, 2011
MA/Assessment Area:
Total Home Mortgage
Refinance Loans
Low-Income Borrowers
Moderate-Income
Borrowers
Middle-Income
Borrowers
Upper-Income
Borrowers
Market Share*
#
% of Total
**
% Families
***
% USB Loans
****
% Families
***
% USB Loans
****
% Families
***
% USB Loans
****
% Families
***
% USB Loans
****
Over-
all
Low
Mod
Mid
Upp
Full-Review:
Cincinnati-Middletown 9,022 100.00 19.07 10.08 18.44 19.90 23.17 22.69 39.33 47.34 5.71 9.65 6.55 5.70 4.91
Clarksville 967 100.00 17.38 8.33 20.10 20.37 23.76 28.15 38.76 43.15 6.41 9.52 8.98 6.92 5.11
Davenport-Moline- Rock Island
2,832 100.00
19.02 9.05 18.56 20.99 23.93 24.73 38.49 45.22 8.51 9.76 10.05 8.18 7.89
Fargo 1,114 100.00 17.69 6.96 18.73 21.81 26.50 29.30 37.08 41.92 5.60 7.66 5.80 4.44 5.97
Grand Forks 479 100.00 17.59 6.21 19.53 23.37 25.02 24.85 37.85 45.56 9.49 7.69 13.33 8.82 8.80
Kansas City 10,153 100.00 18.31 8.17 18.63 19.49 23.58 25.09 39.48 47.25 6.65 8.79 7.19 6.32 6.34
Lewiston 584 100.00 18.86 7.07 19.63 22.40 21.00 26.92 40.51 43.61 14.93 18.33 18.58 15.73 12.79
Logan 1,070 100.00 16.92 5.02 20.71 17.15 24.02 35.15 38.35 42.68 4.90 6.19 4.41 4.33 5.37
Louisville 3,280 100.00 20.15 7.92 17.87 18.61 22.55 24.98 39.44 48.49 4.04 4.44 3.88 4.28 3.89
Minneapolis-St. Paul- Bloomington
31,932 100.00
17.02 10.34 18.92 21.67 26.36 26.09 37.71 41.90 12.58 15.49 13.60 12.06 11.94
Omaha-Council Bluffs 5,175 100.00 17.50 10.70 19.17 22.38 24.41 25.53 38.92 41.39 7.30 11.94 9.56 7.81 5.58
Portland-Vancouver- Beaverton
10,301 100.00
18.33 10.28 19.17 20.63 23.60 26.19 38.90 42.91 6.73 10.72 8.35 6.53 5.72
St. Louis 29,529 100.00 19.50 7.83 18.44 20.25 22.60 25.59 39.47 46.33 8.93 11.13 10.58 9.41 7.90
Data shown includes only one to four-family and manufactured housing (property type 1 or 2). * Based on 2011 Peer Mortgage Data (USPR). ** Home refinance loans originated and purchased in the MA/AA as a percentage of all home refinance loans originated and purchased in the rated area. *** Percentage of Families is based on the 2000 Census information. **** As a percentage of loans with borrower income information available. No information was available for 17.0%, 44.2%, 30.2%, 31.7%, 29.4%, 27.8%, 12.8%, 77.7%, 25.3%, 21.1%, 26.5%, 16.8%, and 26.6% of loans originated and purchased by the bank in the Multistate MAs, respectively.

Charter Number 24
D - 28
Table 11. Borrower Distribution of Small Loans to Businesses
Borrower Distribution: SMALL LOANS TO BUSINESSES Geography: OTHER MULTISTATE Evaluation Period: JANUARY 1, 2009 To DECEMBER 31, 2011
MA/Assessment Area:
Total Small Loans to
Businesses
Businesses With Revenues of $1 million or
less
Loans by Original Amount Regardless of Business Size
Market Share*
#
% of
Total**
% of Businesses
***
% USB
Loans****
$100,000 or
less
>$100,000 to $250,000
>$250,000 to $1,000,000
All
Rev $1 Million or
Less Full-Review:
Cincinnati-Middletown 16,080 100.00 66.02 61.23 93.95 2.70 3.35 19.58 24.46
Clarksville 1,010 100.00 70.12 72.67 91.39 5.15 3.47 18.22 27.72
Davenport-Moline- Rock Island
2,271 100.00
65.75 55.83 90.49 3.26 6.25 20.22 21.25
Fargo 547 100.00 68.65 45.89 86.11 5.30 8.59 25.97 18.30
Grand Forks 1,043 100.00 68.55 40.46 96.74 2.01 1.25 33.78 26.17
Kansas City 9,237 100.00 65.99 57.61 92.71 3.10 4.19 13.86 17.38
Lewiston 582 100.00 72.10 65.12 88.66 6.87 4.47 17.01 19.66
Logan 281 100.00 71.84 59.79 94.66 3.56 1.78 5.68 8.73
Louisville 2,288 100.00 67.32 68.58 91.65 3.50 4.85 5.64 8.24
Minneapolis-St. Paul- Bloomington
43,622 100.00
68.70 51.84 95.91 1.43 2.67 23.87 20.59
Omaha-Council Bluffs 4,910 100.00 67.02 56.60 92.40 3.56 4.03 15.86 18.12
Portland-Vancouver- Beaverton
27,305 100.00
66.82 56.97 95.09 1.76 3.15 20.43 23.10
St. Louis 20,017 100.00 65.76 63.63 95.13 2.42 2.45 18.60 25.05
* Based on 2011 Peer Small Business Data – US and PR. ** Small loans to businesses originated and purchased in the MA/AA as a percentage of all small loans to businesses originated and purchased in the rated area. *** Businesses with revenues of $1 million or less as a percentage of all businesses (Source Dun and Bradstreet - 2011). **** Small loans to businesses with revenues of $1 million or less as a percentage of all loans reported as small loans to businesses. No information was available for 25.4%, 19.2%, 22.4%, 33.6%, 39.8%, 24.6%, 21.3%, 32.7%, 19.2%, 32.0%, 23.7%, 28.5%, and 22.1% of small loans to businesses originated and purchased by the bank in the Multistate MAs, respectively.

Charter Number 24
D - 29
Table 12. Borrower Distribution of Small Loans to Farms
Borrower Distribution: SMALL LOANS TO FARMS Geography: OTHER MULTISTATE Evaluation Period: JANUARY 1, 2009 To DECEMBER 31, 2011
MA/Assessment Area:
Total Small Loans to Farms
Farms With Revenues of $1 million or less
Loans by Original Amount Regardless of Farm Size
Market Share*
#
% of
Total**
% of
Farms***
% USB
Loans****
$100,000 or
less
>$100,000 to $250,000
>$250,000 to $500,000
All
Rev $1 Million or
Less Full-Review:
Cincinnati-Middletown 172 100.00 97.94 91.86 91.28 6.98 1.74 17.65 21.97
Clarksville 108 100.00 98.76 92.59 52.78 28.70 18.52 44.93 49.12
Davenport-Moline-Rock Island
56 100.00
97.93 87.50 67.86 25.00 7.14 12.84 16.67
Fargo 11 100.00 97.31 72.73 72.73 27.27 0.00 0.30 0.45
Grand Forks 92 100.00 97.38 29.35 77.17 16.30 6.52 1.42 0.22
Kansas City 205 100.00 97.07 90.24 61.46 26.83 11.71 10.42 10.82
Lewiston 41 100.00 98.58 75.61 51.22 29.27 19.51 12.50 11.76
Logan 107 100.00 98.24 90.65 85.05 6.54 8.41 24.03 28.87
Louisville 12 100.00 98.08 100.0 100.0 0.00 0.00 11.43 15.09
Minneapolis-St. Paul- Bloomington
53 100.00
97.22 67.92 86.79 7.55 5.66 1.92 1.60
Omaha-Council Bluffs 317 100.00 98.40 88.64 63.09 27.44 9.46 17.78 15.03
Portland-Vancouver- Beaverton
139 100.00
96.20 77.70 88.49 10.79 0.72 6.19 8.24
St. Louis 356 100.00 97.78 87.64 66.57 25.56 7.87 12.50 12.88
* Based on 2011 Peer Small Business Data – US and PR. ** Small loans to farms originated and purchased in the MA/AA as a percentage of all small loans to farms originated and purchased in the rated area. *** Farms with revenues of $1 million or less as a percentage of all farms (Source Dun and Bradstreet - 2011). **** Small loans to farms with revenues of $1 million or less as a percentage of all loans reported as small loans to farms. No information was available for 3.5%, 0.9%, 7.1%, 0.1%, 15.2%, 8.8%, 7.3%, 2.8%, 0.0%, 20.8%, 7.9%, 15.1%, and 7.6% of small loans to farms originated and purchased by the bank in the Multistate MAs, respectively.

Charter Number 24
D - 30
Table 14. Qualified Investments
QUALIFIED INVESTMENTS Geography: OTHER MULTISTATE Evaluation Period: JANUARY 1, 2009 To MARCH 31, 2012
MA/Assessment Area:
Prior Period Investments* Current Period Investments** Total Investments Unfunded Commitments***
# $(000’s) # $(000’s) # $(000’s) % of Total # $(000’s) Full-Review:
Cincinnati-Middletown 123 30,613 331 85,335 454 115,948 100% 5 10,791
Clarksville 13 1,303 16 2,306 29 3,609 100% 0 0
Davenport-Moline-Rock Island
16 3,774 32 20,675 48 24,449 100% 1 1
Fargo 8 1,253 64 5,367 72 6,620 100% 0 0
Grand Forks 11 665 33 8,715 44 9,380 100% 1 3,925
Kansas City 37 27,729 251 127,836 288 155,565 100% 17 23,495
Lewiston 8 288 15 3,058 23 3,346 100% 0 0
Logan 4 119 2 226 6 345 100% 0 0
Louisville 22 8,948 65 59,591 87 68,539 100% 5 59
Minneapolis-St. Paul- Bloomington
103 56,396 630 202,005 733 258,401 100% 21 51,045
Omaha-Council Bluffs 31 23,440 329 31,192 360 54,631 100% 10 8,330
Portland-Vancouver- Beaverton
61 22,197 434 110,882 495 133,079 100% 15 20,443
St. Louis 73 78,995 711 461,394 784 540,388 100% 62 59,752
* 'Prior Period Investments' means investments made in a previous evaluation period that are outstanding as of the examination date. ** The evaluation period for current period investments is January 1, 2009 to March 31, 2012. *** 'Unfunded Commitments' means legally binding investment commitments that are tracked and recorded by the institution's financial reporting system.

Charter Number 24
D - 31
Table 15. Distribution of Branch Delivery System and Branch Openings/Closings
DISTRIBUTION OF BRANCH DELIVERY SYSTEM/BRANCH OPENINGS/CLOSINGS Geography: OTHER MULTISTATE Evaluation Period: JANUARY 1, 2009 To DECEMBER 31, 2011 MA/Assessment Area:
Deposits Branches Branch Openings/Closings Population
% of
Rated Area
Deposits in AA
# of USB
Branch-es
% of Rated Area
Branch-es in AA
Location of Branches by
Income of Geographies (%)
# of Branch
Openings
# of Branch
Closings
Net change in Location of Branches (+ or - )
% of Population within Each
Geography
Low
Mod
Mid
Upp
Low
Mod
Mid
Upp
Low
Mod
Mid
Upp
Full-Review:
Cincinnati-Middletown 100.00 121 100.00 4.13 19.01 52.89 22.31 4 4 0 0 0 0 6.41 19.48 47.85 26.16
Clarksville 100.00 12 100.00 NA 25.00 66.67 8.33 0 0 NA 0 0 0 NA 21.56 56.38 22.06
Davenport-Moline- Rock Island
100.00 11 100.00 9.09 18.18 36.36 36.36 1 0 0 0 0 1 2.73 17.86 56.92 22.48
Fargo 100.00 7 100.00 NA 42.86 42.86 14.29 0 0 NA 0 0 0 NA 16.18 67.69 16.12
Grand Forks 100.00 3 100.00 0 0 66.67 33.33 0 0 0 0 0 0 5.13 6.27 70.35 18.25
Kansas City 100.00 57 100.00 0 10.53 52.63 35.09 16 0 0 0 8 8 5.08 20.06 46.07 28.67
Lewiston 100.00 3 100.00 NA 66.67 0 33.33 0 0 NA 0 0 0 NA 17.72 45.21 37.07
Logan 100.00 2 100.00 0 50.00 50.00 0 1 0 0 1 0 0 3.83 29.00 42.31 24.86
Louisville 100.00 28 100.00 0 25.00 39.29 35.71 1 1 0 0 0 0 4.72 21.38 45.47 28.42
Minneapolis-St. Paul- Bloomington
100.00 94 100.00 4.26 18.09 59.57 17.02 7 1 0 0 4 1 4.62 16.88 52.82 25.61
Omaha-Council Bluffs 100.00 34 100.00 0 20.59 50.00 29.41 1 1 0 0 -1 1 2.10 26.18 47.00 24.72
Portland-Vancouver- Beaverton
100.00 106 100.00 2.83 30.19 51.89 15.09 3 0 0 1 0 2 1.58 20.92 53.55 23.96
St. Louis 100.00 118 100.00 4.24 16.10 47.46 32.20 5 1 -1 0 4 1 5.75 20.55 48.84 24.85

Charter Number 24
D - 32
Table 1. Lending Volume
LENDING VOLUME Geography: ARIZONA Evaluation Period: JANUARY 1, 2009 To DECEMBER 31, 2011
MA/Assessment Area:
% of
Rated Area
Loans (#) in MA/AA*
Home Mortgage
Small Loans to
Businesses
Small Loans to Farms
Community
Development Loans**
Total Reported Loans
% of Rated Area Deposits in MA/AA***
#
$ (000’s)
#
$ (000’s)
#
$ (000’s)
#
$ (000’s)
#
$(000’s)
Full-Review:
Phoenix-Mesa- Scottsdale
80.59 12,992 2,783,164 7,593 174,671 12 181 10 32,572 20,607 2,990,588 78.74
Limited-Review:
Lake Havasu City- Kingman
3.07 551 79,805 231 8,315 4 157 0 0 786 88,277 10.89
Prescott 3.07 549 107,612 230 5,935 1 24 4 14,750 784 128,321 3.31
Tucson 13.27 2,359 445,260 1,023 16,653 5 49 6 3,955 3,393 465,917 7.05
AZ Statewide 0.00 0 0 0 0 0 0 0 0 0 0 0.00 * Loan Data as of December 31, 2011. Rated area refers to either the state or multistate MA rating area. ** The evaluation period for Community Development Loans is from January 1, 2009 to March 31, 2012. *** Deposit Data as of June 30, 2011. Rated Area refers to the state, multistate MA, or institution, as appropriate.
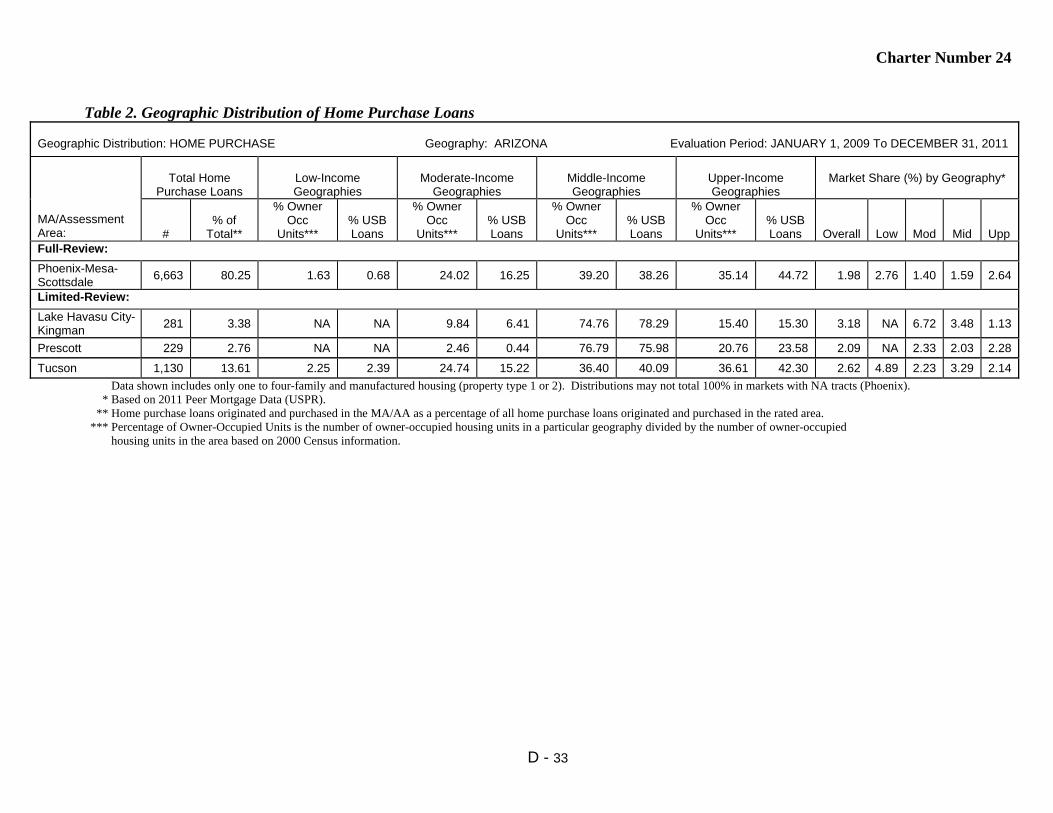
Charter Number 24
D - 33
Table 2. Geographic Distribution of Home Purchase Loans
Geographic Distribution: HOME PURCHASE Geography: ARIZONA Evaluation Period: JANUARY 1, 2009 To DECEMBER 31, 2011
MA/Assessment Area:
Total Home
Purchase Loans
Low-Income Geographies
Moderate-Income
Geographies
Middle-Income Geographies
Upper-Income Geographies
Market Share (%) by Geography*
#
% of
Total**
% Owner Occ
Units***
% USB Loans
% Owner Occ
Units***
% USB Loans
% Owner Occ
Units***
% USB Loans
% Owner Occ
Units***
% USB Loans
Overall
Low
Mod
Mid
Upp
Full-Review:
Phoenix-Mesa- Scottsdale
6,663 80.25 1.63 0.68 24.02 16.25 39.20 38.26 35.14 44.72 1.98 2.76 1.40 1.59 2.64
Limited-Review:
Lake Havasu City- Kingman
281 3.38 NA NA 9.84 6.41 74.76 78.29 15.40 15.30 3.18 NA 6.72 3.48 1.13
Prescott 229 2.76 NA NA 2.46 0.44 76.79 75.98 20.76 23.58 2.09 NA 2.33 2.03 2.28
Tucson 1,130 13.61 2.25 2.39 24.74 15.22 36.40 40.09 36.61 42.30 2.62 4.89 2.23 3.29 2.14
Data shown includes only one to four-family and manufactured housing (property type 1 or 2). Distributions may not total 100% in markets with NA tracts (Phoenix). * Based on 2011 Peer Mortgage Data (USPR). ** Home purchase loans originated and purchased in the MA/AA as a percentage of all home purchase loans originated and purchased in the rated area. *** Percentage of Owner-Occupied Units is the number of owner-occupied housing units in a particular geography divided by the number of owner-occupied housing units in the area based on 2000 Census information.

Charter Number 24
D - 34
Table 3. Geographic Distribution of Home Improvement Loans
Geographic Distribution: HOME IMPROVEMENT Geography: ARIZONA Evaluation Period: JANUARY 1, 2009 To DECEMBER 31, 2011
MA/Assessment Area:
Total Home
Improvement Loans
Low-Income Geographies
Moderate-Income
Geographies
Middle-Income Geographies
Upper-Income Geographies
Market Share (%) by Geography*
#
% of
Total**
% Owner
Occ Units***
% USB Loans
% Owner
Occ Units***
% USB Loans
% Owner
Occ Units***
% USB Loans
% Owner
Occ Units***
%
USB Loans
Overall
Low
Mod
Mid
Upp
Full-Review:
Phoenix-Mesa- Scottsdale
82 71.30 1.63 0.00 24.02 18.29 39.20 28.05 35.14 53.66 3.18 0.00 5.21 2.30 3.36
Limited-Review:
Lake Havasu City- Kingman
9 7.83 NA NA 9.84 22.22 74.76 77.78 15.40 0.00 1.94 NA 7.69 1.43 0.00
Prescott 3 2.61 NA NA 2.46 0.00 76.79 66.67 20.76 33.33 1.25 NA 0.00 0.00 5.56
Tucson 21 18.26 2.25 0.00 24.74 4.76 36.40 38.10 36.61 57.14 0.78 0.00 1.06 1.57 0.32
Data shown includes only one to four-family and manufactured housing (property type 1 or 2). * Based on 2011 Peer Mortgage Data (USPR). ** Home improvement loans originated and purchased in the MA/AA as a percentage of all home improvement loans originated and purchased in the rated area. *** Percentage of Owner-Occupied Units is the number of owner-occupied housing units in a particular geography divided by number of owner-occupied housing units in the area based on 2000 Census information.

Charter Number 24
D - 35
Table 4. Geographic Distribution of Home Mortgage Refinance Loans
Geographic Distribution: HOME MORTGAGE REFINANCE Geography: ARIZONA Evaluation Period: JANUARY 1, 2009 To DECEMBER 31, 2011
MA/Assessment Area:
Total Home Mortgage Refinance Loans
Low-Income Geographies
Moderate-Income
Geographies
Middle-Income Geographies
Upper-Income Geographies
Market Share (%) by Geography*
#
% of
Total**
% Owner Occ
Units***
% USB Loans
% Owner Occ
Units***
% USB Loans
% Owner Occ
Units***
% USB Loans
% Owner Occ
Units***
% USB Loans
Overall
Low
Mod
Mid
Upp
Full-Review:
Phoenix-Mesa- Scottsdale
6,241 77.80 1.63 0.35 24.02 9.45 39.20 31.12 35.14 59.06 2.93 0.50 2.05 2.47 3.36
Limited-Review:
Lake Havasu City- Kingman
261 3.25 NA NA 9.84 4.21 74.76 72.41 15.40 23.37 3.74 NA 5.49 3.73 3.49
Prescott 316 3.94 NA NA 2.46 0.00 76.79 65.51 20.76 34.49 2.44 NA 0.00 2.20 3.11
Tucson 1,204 15.01 2.25 0.33 24.74 6.31 36.40 31.06 36.61 62.29 1.79 0.00 1.21 1.85 1.88
Data shown includes only one to four-family and manufactured housing (property type 1 or 2). Distributions may not total 100% in markets with NA tracts (Phoenix). * Based on 2011 Peer Mortgage Data (USPR). ** Home mortgage refinance loans originated and purchased in the MA/AA as a percentage of all home mortgage refinance loans originated and purchased in the rated area. *** Percentage of Owner-Occupied Units is the number of owner-occupied housing units in a particular geography divided by number of owner-occupied housing units in the area based on 2000 Census information.

Charter Number 24
D - 36
Table 5. Geographic Distribution of Multifamily Loans
Geographic Distribution: MULTIFAMILY Geography: ARIZONA Evaluation Period: JANUARY 1, 2009 To DECEMBER 31, 2011
MA/Assessment Area:
Total
Multifamily Loans
Low-Income Geographies
Moderate-Income
Geographies
Middle-Income Geographies
Upper-Income Geographies
Market Share (%) by Geography*
#
% of Total**
% of MF Units***
% USB Loans
% MF Units***
% USB Loans
% MF Units***
% USB Loans
% MF Units***
% USB Loans
Overall
Low
Mod
Mid
Upp
Full-Review:
Phoenix-Mesa- Scottsdale
6 54.55 6.87 33.33 41.48 50.00 36.08 16.67 15.57 0.00 3.45 50.00 2.38 0.00 0.00
Limited-Review:
Lake Havasu City- Kingman
0 0.00 NA NA 2.08 0.00 83.28 0.00 14.64 0.00 0.00 NA 0.00 0.00 0.00
Prescott 1 9.09 NA NA 13.37 0.00 66.24 100.00 20.39 0.00 0.00 NA 0.00 0.00 0.00
Tucson 4 36.36 5.05 25.00 38.28 50.00 38.41 25.00 18.26 0.00 4.55 0.00 10.00 0.00 0.00
Multifamily loan distribution includes Home Purchases, Home Improvement and Refinances. * Based on 2011 Peer Mortgage Data (USPR). ** Multifamily loans originated and purchased in the MA/AA as a percentage of all multifamily loans originated and purchased in the rated area. *** Percentage of multifamily units is the number of multifamily housing units in a particular geography divided by number of multifamily housing units in the area based on 2000 Census information.

Charter Number 24
D - 37
Table 6. Geographic Distribution of Small Loans to Businesses
Geographic Distribution: SMALL LOANS TO BUSINESSES Geography: ARIZONA Evaluation Period: JANUARY 1, 2009 To DECEMBER 31, 2011
MA/Assessment Area:
Total Small Business
Loans
Low-Income Geographies
Moderate-Income
Geographies
Middle-Income Geographies
Upper-Income Geographies
Market Share (%) by Geography*
#
% of Total
**
% of
Businesses ***
%
USB Loans
% of
Businesses***
%
USB Loans
% of
Businesses ***
% USB Loans
% of
Businesses ***
%
USB Loans
Overall
Low
Mod
Mid
Upp
Full-Review:
Phoenix-Mesa- Scottsdale
7,593 83.65 3.46 5.18 19.49 20.78 32.55 32.28 44.42 41.76 3.70 5.02 4.16 3.99 3.09
Limited-Review:
Lake Havasu City- Kingman
231 2.54 NA NA 5.03 2.60 78.62 83.98 16.35 13.42 3.07 NA 1.75 3.04 3.00
Prescott 230 2.53 NA NA 5.99 13.48 70.51 52.61 23.50 33.91 2.03 NA 4.28 1.45 3.02
Tucson 1,023 11.27 3.07 2.35 24.95 22.87 33.33 33.53 38.65 41.25 2.58 1.06 2.46 2.86 2.39
* Based on 2011 Peer Small Business Data – US and PR. ** Small loans to businesses originated and purchased in the MA/AA as a percentage of all small loans to businesses originated and purchased in the rated area. *** Source Data - Dun and Bradstreet (2011).

Charter Number 24
D - 38
Table 7. Geographic Distribution of Small Loans to Farms
Geographic Distribution: SMALL LOANS TO FARMS Geography: ARIZONA Evaluation Period: JANUARY 1, 2009 To DECEMBER 31, 2011
MA/Assessment Area:
Total Small
Farm Loans
Low-Income Geographies
Moderate-Income
Geographies
Middle-Income Geographies
Upper-Income Geographies
Market Share (%) by Geography*
#
% of
Total**
% of
Farms***
% USB Loans
% of
Farms***
% USB Loans
% of
Farms***
% USB Loans
% of
Farms***
% USB Loans
Overall
Low
Mod
Mid
Upp
Full-Review:
Phoenix-Mesa- Scottsdale
12 54.55 2.15 0.00 23.70 8.33 35.73 91.67 38.39 0.00 1.68 0.00 0.00 5.31 0.00
Limited-Review:
Lake Havasu City- Kingman
4 18.18 NA NA 8.77 0.00 77.89 25.00 13.33 75.00 4.76 NA 0.00 0.00 25.00
Prescott 1 4.55 NA NA 4.55 0.00 68.78 100.00 26.67 0.00 0.00 NA 0.00 0.00 0.00
Tucson 5 22.73 2.45 0.00 24.42 0.00 35.01 100.00 38.13 0.00 0.00 0.00 0.00 0.00 0.00
* Based on 2011 Peer Small Business Data – US and PR. ** Small loans to farms originated and purchased in the MA/AA as a percentage of all small loans to farms originated and purchased in the rated area. *** Source Data - Dun and Bradstreet (2011).
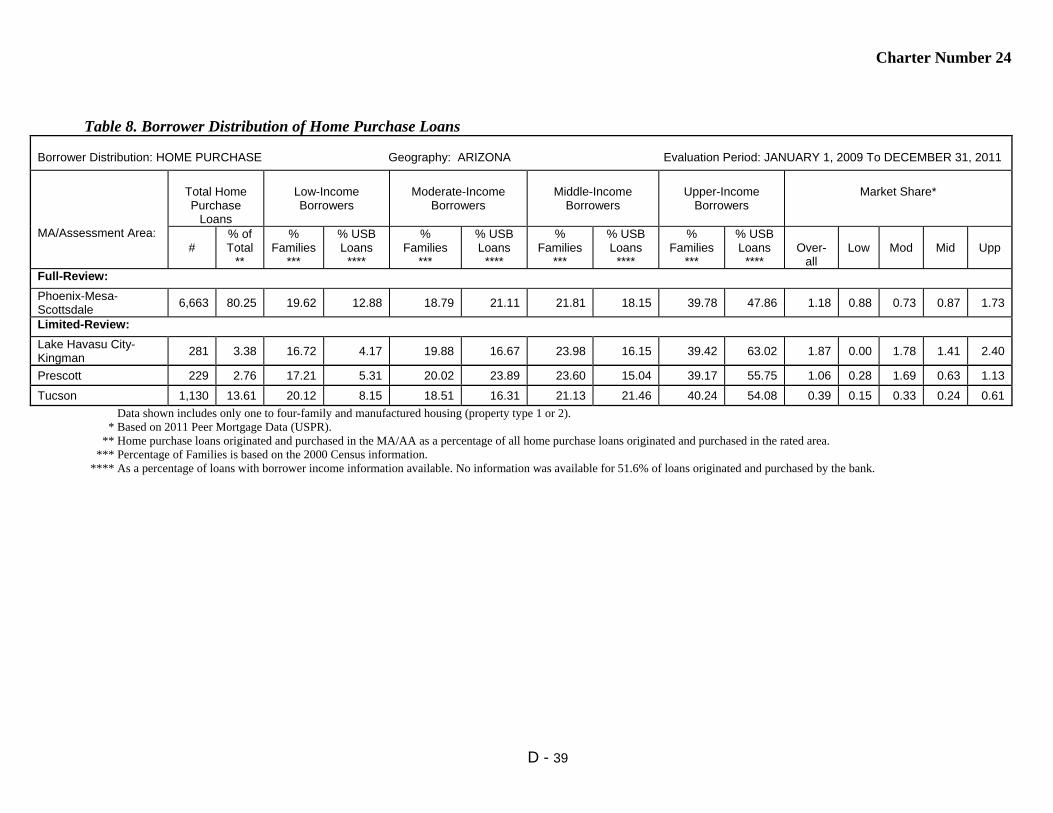
Charter Number 24
D - 39
Table 8. Borrower Distribution of Home Purchase Loans
Borrower Distribution: HOME PURCHASE Geography: ARIZONA Evaluation Period: JANUARY 1, 2009 To DECEMBER 31, 2011
MA/Assessment Area:
Total Home Purchase
Loans
Low-Income Borrowers
Moderate-Income
Borrowers
Middle-Income
Borrowers
Upper-Income
Borrowers
Market Share*
#
% of Total
**
% Families
***
% USB Loans
****
% Families
***
% USB Loans
****
% Families
***
% USB Loans
****
% Families
***
% USB Loans
****
Over-
all
Low
Mod
Mid
Upp
Full-Review:
Phoenix-Mesa- Scottsdale
6,663 80.25 19.62 12.88 18.79 21.11 21.81 18.15 39.78 47.86 1.18 0.88 0.73 0.87 1.73
Limited-Review:
Lake Havasu City- Kingman
281 3.38 16.72 4.17 19.88 16.67 23.98 16.15 39.42 63.02 1.87 0.00 1.78 1.41 2.40
Prescott 229 2.76 17.21 5.31 20.02 23.89 23.60 15.04 39.17 55.75 1.06 0.28 1.69 0.63 1.13
Tucson 1,130 13.61 20.12 8.15 18.51 16.31 21.13 21.46 40.24 54.08 0.39 0.15 0.33 0.24 0.61
Data shown includes only one to four-family and manufactured housing (property type 1 or 2). * Based on 2011 Peer Mortgage Data (USPR). ** Home purchase loans originated and purchased in the MA/AA as a percentage of all home purchase loans originated and purchased in the rated area. *** Percentage of Families is based on the 2000 Census information. **** As a percentage of loans with borrower income information available. No information was available for 51.6% of loans originated and purchased by the bank.
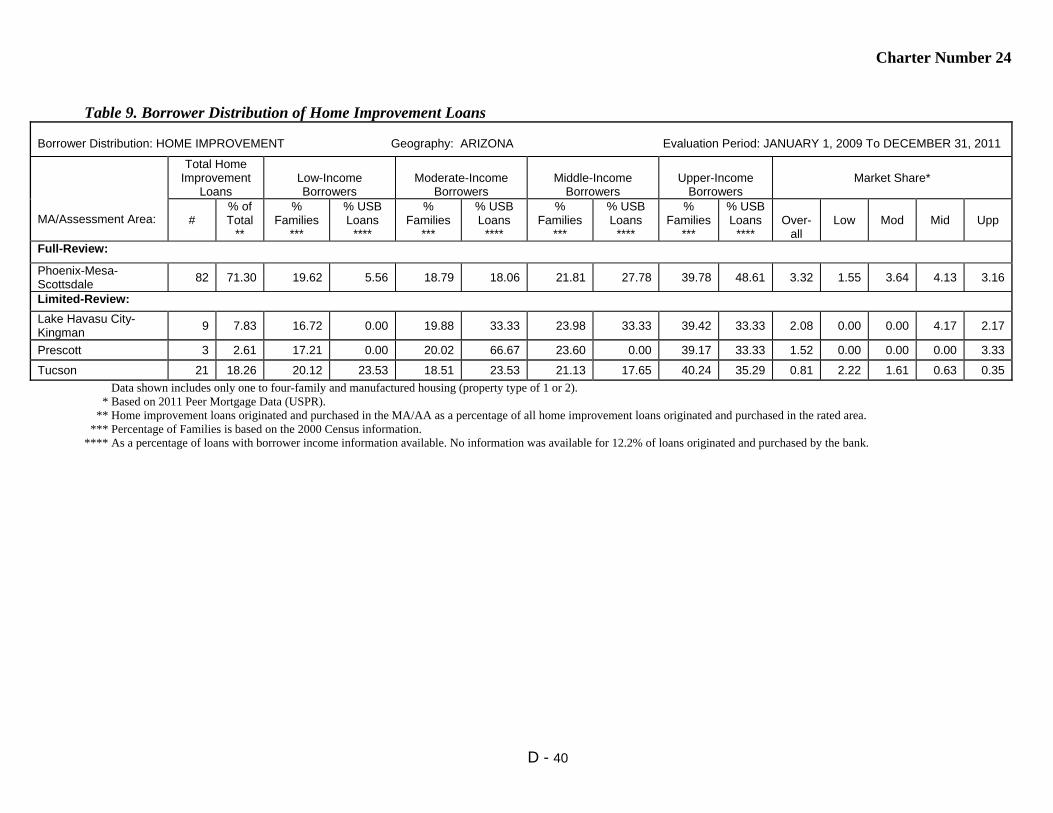
Charter Number 24
D - 40
Table 9. Borrower Distribution of Home Improvement Loans
Borrower Distribution: HOME IMPROVEMENT Geography: ARIZONA Evaluation Period: JANUARY 1, 2009 To DECEMBER 31, 2011
MA/Assessment Area:
Total Home Improvement
Loans
Low-Income Borrowers
Moderate-Income
Borrowers
Middle-Income
Borrowers
Upper-Income
Borrowers
Market Share*
#
% of Total
**
% Families
***
% USB Loans
****
% Families
***
% USB Loans
****
% Families
***
% USB Loans
****
% Families
***
% USB Loans
****
Over-
all
Low
Mod
Mid
Upp
Full-Review:
Phoenix-Mesa- Scottsdale
82 71.30 19.62 5.56 18.79 18.06 21.81 27.78 39.78 48.61 3.32 1.55 3.64 4.13 3.16
Limited-Review:
Lake Havasu City- Kingman
9 7.83 16.72 0.00 19.88 33.33 23.98 33.33 39.42 33.33 2.08 0.00 0.00 4.17 2.17
Prescott 3 2.61 17.21 0.00 20.02 66.67 23.60 0.00 39.17 33.33 1.52 0.00 0.00 0.00 3.33
Tucson 21 18.26 20.12 23.53 18.51 23.53 21.13 17.65 40.24 35.29 0.81 2.22 1.61 0.63 0.35
Data shown includes only one to four-family and manufactured housing (property type of 1 or 2). * Based on 2011 Peer Mortgage Data (USPR). ** Home improvement loans originated and purchased in the MA/AA as a percentage of all home improvement loans originated and purchased in the rated area. *** Percentage of Families is based on the 2000 Census information. **** As a percentage of loans with borrower income information available. No information was available for 12.2% of loans originated and purchased by the bank.

Charter Number 24
D - 41
Table 10. Borrower Distribution of Home Mortgage Refinance Loans
Borrower Distribution: HOME MORTGAGE REFINANCE Geography: ARIZONA Evaluation Period: JANUARY 1, 2009 To DECEMBER 31, 2011
MA/Assessment Area:
Total Home Mortgage
Refinance Loans
Low-Income Borrowers
Moderate-Income
Borrowers
Middle-Income
Borrowers
Upper-Income
Borrowers
Market Share*
#
% of Total **
% Families
***
% USB Loans
****
% Families
***
% USB Loans
****
% Families
***
% USB Loans
****
% Families
***
% USB Loans
****
Over-
all
Low
Mod
Mid
Upp
Full-Review:
Phoenix-Mesa- Scottsdale
6,241 77.80 19.62 6.20 18.79 15.63 21.81 21.02 39.78 57.15 2.91 2.25 2.68 2.75 3.12
Limited-Review:
Lake Havasu City- Kingman
261 3.25 16.72 7.78 19.88 15.57 23.98 20.96 39.42 55.69 2.88 3.61 3.22 3.20 2.54
Prescott 316 3.94 17.21 3.72 20.02 20.21 23.60 23.40 39.17 52.66 2.24 1.18 2.81 1.94 2.33
Tucson 1,204 15.01 20.12 8.68 18.51 14.29 21.13 20.61 40.24 56.42 1.54 1.95 1.49 1.32 1.58
Data shown includes only one to four-family and manufactured housing (property type 1 or 2). * Based on 2011 Peer Mortgage Data (USPR). ** Home refinance loans originated and purchased in the MA/AA as a percentage of all home refinance loans originated and purchased in the rated area. *** Percentage of Families is based on the 2000 Census information. **** As a percentage of loans with borrower income information available. No information was available for 41.2% of loans originated and purchased by the bank.
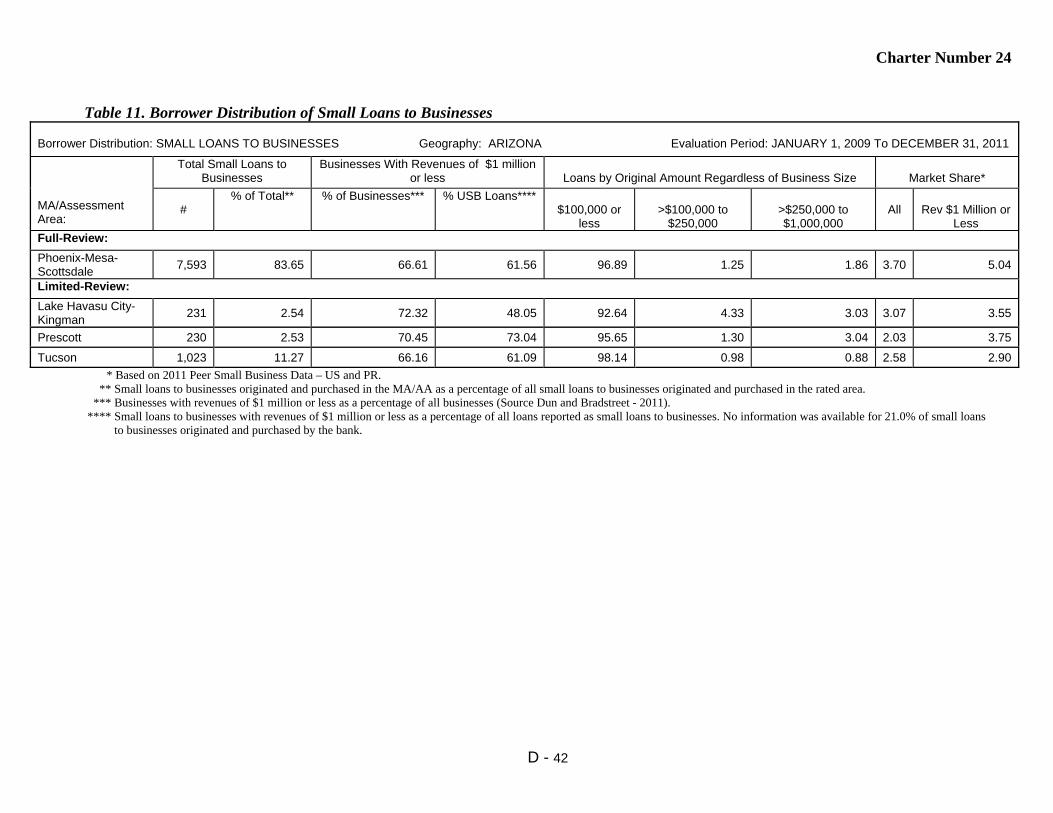
Charter Number 24
D - 42
Table 11. Borrower Distribution of Small Loans to Businesses
Borrower Distribution: SMALL LOANS TO BUSINESSES Geography: ARIZONA Evaluation Period: JANUARY 1, 2009 To DECEMBER 31, 2011
MA/Assessment Area:
Total Small Loans to Businesses
Businesses With Revenues of $1 million or less
Loans by Original Amount Regardless of Business Size
Market Share*
#
% of Total** % of Businesses*** % USB Loans**** $100,000 or
less
>$100,000 to
$250,000
>$250,000 to $1,000,000
All
Rev $1 Million or
Less Full-Review:
Phoenix-Mesa- Scottsdale
7,593 83.65 66.61 61.56 96.89 1.25 1.86 3.70 5.04
Limited-Review:
Lake Havasu City- Kingman
231 2.54 72.32 48.05 92.64 4.33 3.03 3.07 3.55
Prescott 230 2.53 70.45 73.04 95.65 1.30 3.04 2.03 3.75
Tucson 1,023 11.27 66.16 61.09 98.14 0.98 0.88 2.58 2.90
* Based on 2011 Peer Small Business Data – US and PR. ** Small loans to businesses originated and purchased in the MA/AA as a percentage of all small loans to businesses originated and purchased in the rated area. *** Businesses with revenues of $1 million or less as a percentage of all businesses (Source Dun and Bradstreet - 2011). **** Small loans to businesses with revenues of $1 million or less as a percentage of all loans reported as small loans to businesses. No information was available for 21.0% of small loans to businesses originated and purchased by the bank.

Charter Number 24
D - 43
Table 12. Borrower Distribution of Small Loans to Farms
Borrower Distribution: SMALL LOANS TO FARMS Geography: ARIZONA Evaluation Period: JANUARY 1, 2009 To DECEMBER 31, 2011
MA/Assessment Area:
Total Small Loans to Farms
Farms With Revenues of $1 million or less
Loans by Original Amount Regardless of Farm Size
Market Share*
#
% of Total**
% of Farms***
% USB Loans****
$100,000 or
less
>$100,000 to $250,000
>$250,000 to $500,000
All
Rev $1 Million or
Less Full-Review:
Phoenix-Mesa- Scottsdale
12 54.55 95.11 33.33 100.00 0.00 0.00 1.68 0.00
Limited-Review:
Lake Havasu City- Kingman
4 18.18 97.19 75.00 100.00 0.00 0.00 4.76 7.69
Prescott 1 4.55 98.54 100.00 100.00 0.00 0.00 0.00 0.00
Tucson 5 22.73 96.63 100.00 100.00 0.00 0.00 0.00 0.00
* Based on 2011 Peer Small Business Data – US and PR. ** Small loans to farms originated and purchased in the MA/AA as a percentage of all small loans to farms originated and purchased in the rated area. *** Farms with revenues of $1 million or less as a percentage of all farms (Source Dun and Bradstreet - 2011). **** Small loans to farms with revenues of $1 million or less as a percentage of all loans reported as small loans to farms. No information was available for 21.0% of small loans to farms originated and purchased by the bank.

Charter Number 24
D - 44
Table 14. Qualified Investments
QUALIFIED INVESTMENTS Geography: ARIZONA Evaluation Period: JANUARY 1, 2009 To MARCH 31, 2012
MA/Assessment Area:
Prior Period Investments* Current Period Investments** Total Investments Unfunded Commitments***
# $(000’s) # $(000’s) # $(000’s) % of Total # $(000’s) Full-Review:
Phoenix-Mesa- Scottsdale
12 22,508 114 74,357 126 96,866 90.57 2 2,155
Limited-Review:
Lake Havasu City- Kingman
0 0 6 937 6 937 0.88 0 0
Prescott 0 0 3 268 3 268 0.25 0 0
Tucson 2 100 17 8,631 19 8,730 8.16 0 0
AZ Statewide 1 100 15 55 16 155 0.14 0 0
* 'Prior Period Investments' means investments made in a previous evaluation period that are outstanding as of the examination date. ** The evaluation period for current period investments is January 1, 2009 to March 31, 2012. *** 'Unfunded Commitments' means legally binding investment commitments that are tracked and recorded by the institution's financial reporting system.
Table 15. Distribution of Branch Delivery System and Branch Openings/Closings DISTRIBUTION OF BRANCH DELIVERY SYSTEM/BRANCH OPENINGS/CLOSINGS Geography: ARIZONA Evaluation Period: JANUARY 1, 2009 To DECEMBER 31, 2011
MA/Assessment Area:
Deposits Branches Branch Openings/Closings Population
% of
Rated Area
Deposits in AA
# of USB
Branches
% of
Rated Area
Branches in AA
Location of Branches by
Income of Geographies (%)
# of Branch
Openings
# of Branch
Closings
Net change in Location of Branches (+ or - )
% of Population within Each
Geography
Low
Mod
Mid
Upp
Low
Mod
Mid
Upp
Low
Mod
Mid
Upp
Full-Review:
Phoenix-Mesa- Scottsdale
78.74 64 77.11 1.56 23.44 34.38 40.63 6 2 0 1 3 0 4.89 30.55 36.18 28.36
Limited-Review:
Lake Havasu City- Kingman
10.89 3 3.61 NA 0 100 0 0 0 NA 0 0 0 NA 10.22 75.87 13.91
Prescott 3.31 2 2.41 NA 0 0 100 0 0 NA 0 0 0 NA 4.22 77.74 18.04
Tucson 7.05 14 16.87 7.14 35.71 0.00 57.14 0 0 0 0 0 0 4.41 33.94 33.03 28.62
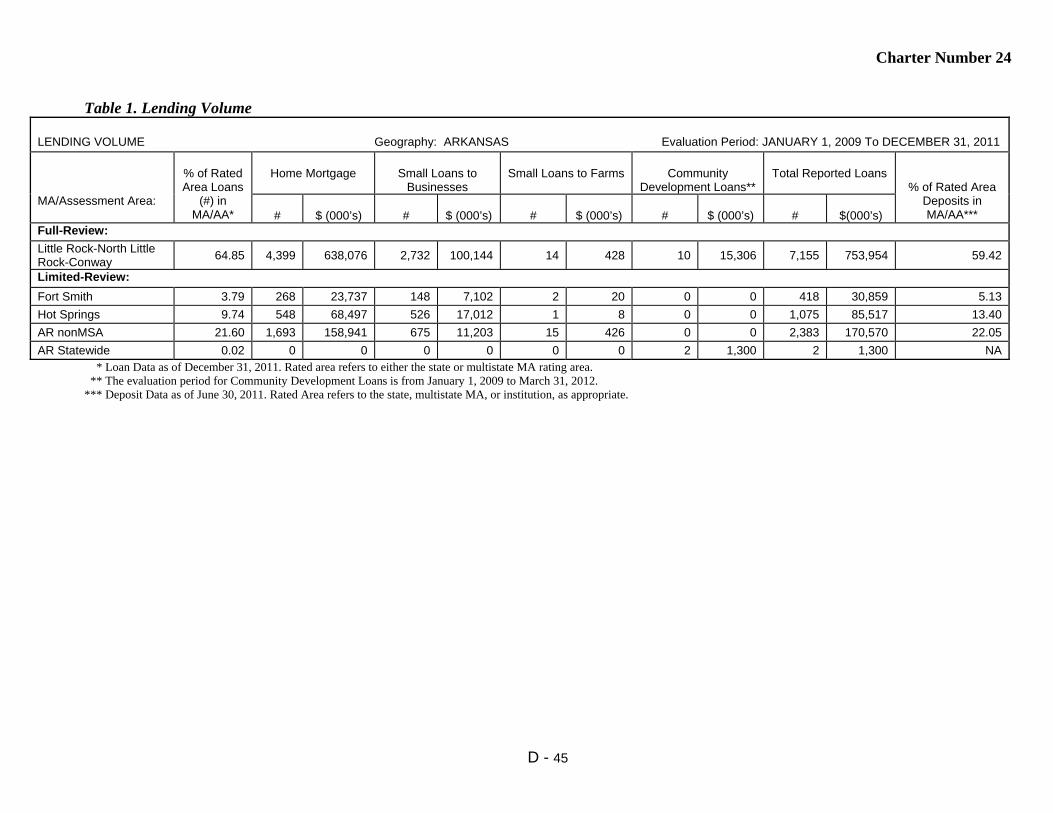
Charter Number 24
D - 45
Table 1. Lending Volume
LENDING VOLUME Geography: ARKANSAS Evaluation Period: JANUARY 1, 2009 To DECEMBER 31, 2011
MA/Assessment Area:
% of Rated Area Loans
(#) in MA/AA*
Home Mortgage
Small Loans to
Businesses
Small Loans to Farms
Community
Development Loans**
Total Reported Loans
% of Rated Area Deposits in MA/AA***
#
$ (000’s)
#
$ (000’s)
#
$ (000’s)
#
$ (000’s)
#
$(000’s)
Full-Review:
Little Rock-North Little Rock-Conway
64.85 4,399 638,076 2,732 100,144 14 428 10 15,306 7,155 753,954 59.42
Limited-Review:
Fort Smith 3.79 268 23,737 148 7,102 2 20 0 0 418 30,859 5.13
Hot Springs 9.74 548 68,497 526 17,012 1 8 0 0 1,075 85,517 13.40
AR nonMSA 21.60 1,693 158,941 675 11,203 15 426 0 0 2,383 170,570 22.05
AR Statewide 0.02 0 0 0 0 0 0 2 1,300 2 1,300 NA * Loan Data as of December 31, 2011. Rated area refers to either the state or multistate MA rating area. ** The evaluation period for Community Development Loans is from January 1, 2009 to March 31, 2012. *** Deposit Data as of June 30, 2011. Rated Area refers to the state, multistate MA, or institution, as appropriate.

Charter Number 24
D - 46
Table 2. Geographic Distribution of Home Purchase Loans
Geographic Distribution: HOME PURCHASE Geography: ARKANSAS Evaluation Period: JANUARY 1, 2009 To DECEMBER 31, 2011
MA/Assessment Area:
Total Home
Purchase Loans
Low-Income Geographies
Moderate-Income
Geographies
Middle-Income Geographies
Upper-Income Geographies
Market Share (%) by Geography*
#
% of
Total**
% Owner
Occ Units***
% USB Loans
% Owner
Occ Units***
% USB Loans
% Owner
Occ Units***
% USB Loans
% Owner
Occ Units***
%
USB Loans
Overall
Low
Mod
Mid
Upp
Full-Review:
Little Rock-North Little Rock-Conway
1,869 74.14 1.60 0.48 15.69 10.06 52.34 58.37 30.36 31.09 7.76 6.49 10.41 7.57 7.56
Limited-Review:
Fort Smith 111 4.40 NA NA NA NA 100.0 100.0 NA NA 5.42 NA NA 5.42 NA
Hot Springs 172 6.82 NA NA 15.07 9.30 71.45 78.49 13.48 12.21 6.11 NA 7.27 6.44 4.40
AR nonMSA 369 14.64 NA NA NA NA 95.46 97.02 4.54 2.98 8.12 NA NA 8.38 4.00
Data shown includes only one to four-family and manufactured housing (property type 1 or 2). * Based on 2011 Peer Mortgage Data (USPR). ** Home purchase loans originated and purchased in the MA/AA as a percentage of all home purchase loans originated and purchased in the rated area. *** Percentage of Owner-Occupied Units is the number of owner-occupied housing units in a particular geography divided by the number of owner-occupied housing units in the area based on 2000 Census information.

Charter Number 24
D - 47
Table 3. Geographic Distribution of Home Improvement Loans
Geographic Distribution: HOME IMPROVEMENT Geography: ARKANSAS Evaluation Period: JANUARY 1, 2009 To DECEMBER 31, 2011
MA/Assessment Area:
Total Home
Improvement Loans
Low-Income Geographies
Moderate-Income
Geographies
Middle-Income Geographies
Upper-Income Geographies
Market Share (%) by Geography*
#
% of
Total**
% Owner
Occ Units***
% USB Loans
% Owner
Occ Units***
% USB Loans
% Owner
Occ Units***
% USB Loans
% Owner
Occ Units***
%
USB Loans
Overall
Low
Mod
Mid
Upp
Full-Review:
Little Rock-North Little Rock-Conway
239 56.10 1.60 2.09 15.69 14.64 52.34 59.00 30.36 24.27 10.19 0.00 12.86 12.25 6.07
Limited-Review:
Fort Smith 27 6.34 NA NA NA NA 100.0 100.0 NA NA 6.67 NA NA 6.67 NA
Hot Springs 38 8.92 NA NA 15.07 15.79 71.45 65.79 13.48 18.42 10.08 NA 17.65 9.38 6.25
AR nonMSA 122 28.64 NA NA NA NA 95.46 96.72 4.54 3.28 13.40 NA NA 13.52 10.00
Data shown includes only one to four-family and manufactured housing (property type 1 or 2). * Based on 2011 Peer Mortgage Data (USPR). ** Home improvement loans originated and purchased in the MA/AA as a percentage of all home improvement loans originated and purchased in the rated area. *** Percentage of Owner-Occupied Units is the number of owner-occupied housing units in a particular geography divided by number of owner-occupied housing units in the area based on 2000 Census information.
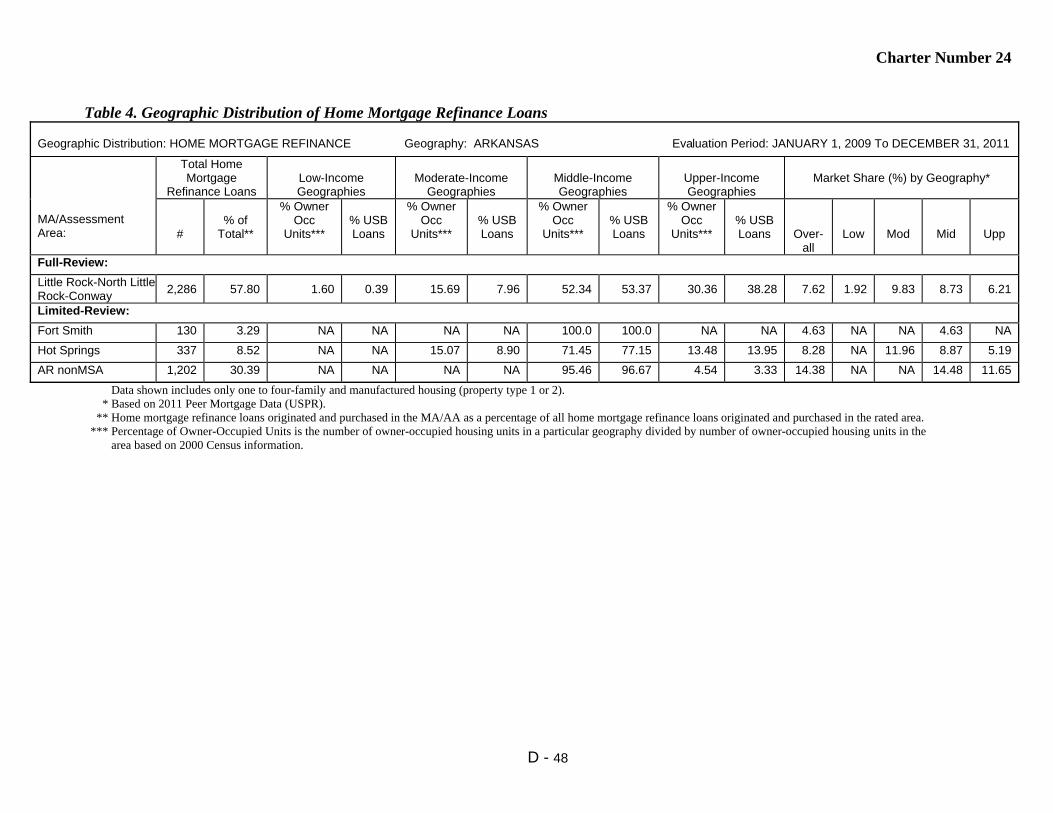
Charter Number 24
D - 48
Table 4. Geographic Distribution of Home Mortgage Refinance Loans
Geographic Distribution: HOME MORTGAGE REFINANCE Geography: ARKANSAS Evaluation Period: JANUARY 1, 2009 To DECEMBER 31, 2011
MA/Assessment Area:
Total Home Mortgage
Refinance Loans
Low-Income Geographies
Moderate-Income
Geographies
Middle-Income Geographies
Upper-Income Geographies
Market Share (%) by Geography*
#
% of
Total**
% Owner Occ
Units***
% USB Loans
% Owner Occ
Units***
% USB Loans
% Owner Occ
Units***
% USB Loans
% Owner Occ
Units***
% USB Loans
Over-
all
Low
Mod
Mid
Upp
Full-Review:
Little Rock-North Little Rock-Conway
2,286 57.80 1.60 0.39 15.69 7.96 52.34 53.37 30.36 38.28 7.62 1.92 9.83 8.73 6.21
Limited-Review:
Fort Smith 130 3.29 NA NA NA NA 100.0 100.0 NA NA 4.63 NA NA 4.63 NA
Hot Springs 337 8.52 NA NA 15.07 8.90 71.45 77.15 13.48 13.95 8.28 NA 11.96 8.87 5.19
AR nonMSA 1,202 30.39 NA NA NA NA 95.46 96.67 4.54 3.33 14.38 NA NA 14.48 11.65
Data shown includes only one to four-family and manufactured housing (property type 1 or 2). * Based on 2011 Peer Mortgage Data (USPR). ** Home mortgage refinance loans originated and purchased in the MA/AA as a percentage of all home mortgage refinance loans originated and purchased in the rated area. *** Percentage of Owner-Occupied Units is the number of owner-occupied housing units in a particular geography divided by number of owner-occupied housing units in the area based on 2000 Census information.

Charter Number 24
D - 49
Table 5. Geographic Distribution of Multifamily Loans
Geographic Distribution: MULTIFAMILY Geography: ARKANSAS Evaluation Period: JANUARY 1, 2009 To DECEMBER 31, 2011
MA/Assessment Area:
Total Multifamily
Loans
Low-Income Geographies
Moderate-Income
Geographies
Middle-Income Geographies
Upper-Income Geographies
Market Share (%) by Geography*
#
% of Total**
% of MF Units***
% USB Loans
% MF Units***
% USB Loans
% MF Units***
% USB Loans
% MF Units***
% USB Loans
Overall
Low
Mod
Mid
Upp
Full-Review:
Little Rock-North Little Rock-Conway
5 83.33 7.22 0.00 16.39 20.00 46.17 80.00 30.23 0.00 4.76 0.00 0.00 8.11 0.00
Limited-Review:
Fort Smith 0 0.00 NA NA NA NA 100.0 NA NA NA 0.00 NA NA 0.00 NA
Hot Springs 1 16.67 NA NA 49.40 0.00 41.51 100.00 9.09 0.00 0.00 NA 0.00 0.00 0.00
AR nonMSA 0 0.00 NA NA NA NA 74.86 NA 25.14 0.00 0.00 NA NA 0.00 0.00
Multifamily loan distribution includes Home Purchases, Home Improvement and Refinances. * Based on 2011 Peer Mortgage Data (USPR). ** Multifamily loans originated and purchased in the MA/AA as a percentage of all multifamily loans originated and purchased in the rated area. *** Percentage of multifamily units is the number of multifamily housing units in a particular geography divided by number of multifamily housing units in the area based on 2000 Census information.
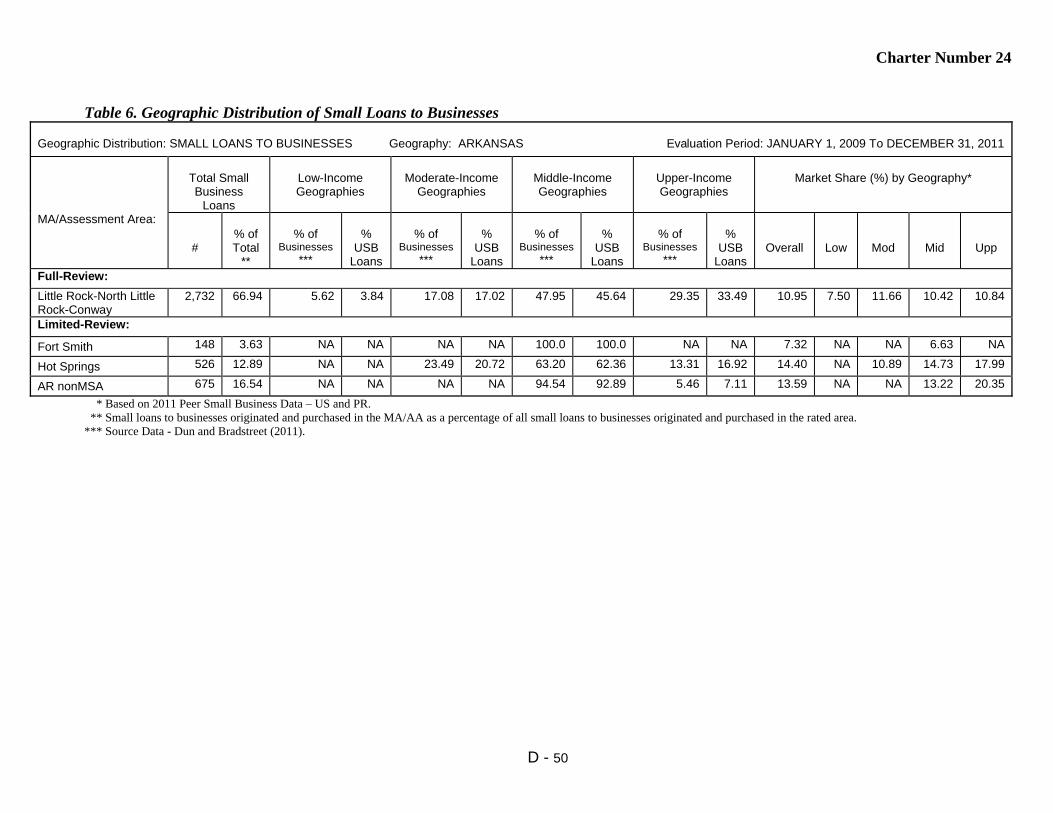
Charter Number 24
D - 50
Table 6. Geographic Distribution of Small Loans to Businesses
Geographic Distribution: SMALL LOANS TO BUSINESSES Geography: ARKANSAS Evaluation Period: JANUARY 1, 2009 To DECEMBER 31, 2011
MA/Assessment Area:
Total Small Business
Loans
Low-Income Geographies
Moderate-Income
Geographies
Middle-Income Geographies
Upper-Income Geographies
Market Share (%) by Geography*
#
% of Total
**
% of
Businesses ***
%
USB Loans
% of
Businesses ***
%
USB Loans
% of
Businesses ***
%
USB Loans
% of
Businesses ***
%
USB Loans
Overall
Low
Mod
Mid
Upp
Full-Review:
Little Rock-North Little Rock-Conway
2,732 66.94 5.62 3.84 17.08 17.02 47.95 45.64 29.35 33.49 10.95 7.50 11.66 10.42 10.84
Limited-Review:
Fort Smith 148 3.63 NA NA NA NA 100.0 100.0 NA NA 7.32 NA NA 6.63 NA
Hot Springs 526 12.89 NA NA 23.49 20.72 63.20 62.36 13.31 16.92 14.40 NA 10.89 14.73 17.99
AR nonMSA 675 16.54 NA NA NA NA 94.54 92.89 5.46 7.11 13.59 NA NA 13.22 20.35
* Based on 2011 Peer Small Business Data – US and PR. ** Small loans to businesses originated and purchased in the MA/AA as a percentage of all small loans to businesses originated and purchased in the rated area. *** Source Data - Dun and Bradstreet (2011).

Charter Number 24
D - 51
Table 7. Geographic Distribution of Small Loans to Farms
Geographic Distribution: SMALL LOANS TO FARMS Geography: ARKANSAS Evaluation Period: JANUARY 1, 2009 To DECEMBER 31, 2011
MA/Assessment Area:
Total Small
Farm Loans
Low-Income Geographies
Moderate-Income
Geographies
Middle-Income Geographies
Upper-Income Geographies
Market Share (%) by Geography*
#
% of
Total**
% of
Farms***
% USB Loans
% of
Farms***
% USB Loans
% of
Farms***
% USB Loans
% of
Farms***
% USB Loans
Overall
Low
Mod
Mid
Upp
Full-Review:
Little Rock-North Little Rock-Conway
14 43.75 2.26 0.00 12.13 0.00 55.50 85.71 30.11 14.29 1.42 0.00 0.00 2.06 0.00
Limited-Review:
Fort Smith 2 6.25 NA NA NA NA 100.00 100.00 NA NA 5.00 NA NA 5.00 NA
Hot Springs 1 3.13 NA NA 8.89 0.00 75.93 100.00 15.19 0.00 0.00 NA 0.00 0.00 0.00
AR nonMSA 15 46.88 NA NA NA NA 94.79 100.00 5.21 0.00 0.53 NA NA 0.58 0.00
* Based on 2011 Peer Small Business Data – US and PR. ** Small loans to farms originated and purchased in the MA/AA as a percentage of all small loans to farms originated and purchased in the rated area. *** Source Data - Dun and Bradstreet (2011).
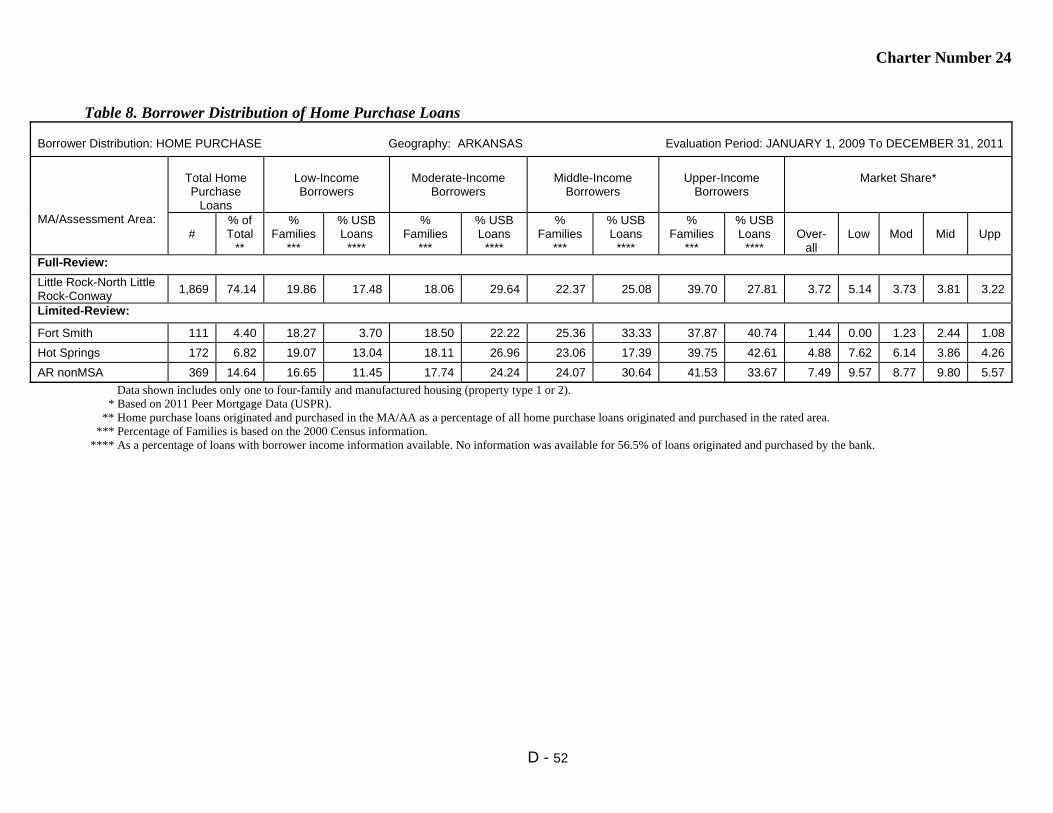
Charter Number 24
D - 52
Table 8. Borrower Distribution of Home Purchase Loans
Borrower Distribution: HOME PURCHASE Geography: ARKANSAS Evaluation Period: JANUARY 1, 2009 To DECEMBER 31, 2011
MA/Assessment Area:
Total Home Purchase
Loans
Low-Income Borrowers
Moderate-Income
Borrowers
Middle-Income
Borrowers
Upper-Income
Borrowers
Market Share*
#
% of Total
**
% Families
***
% USB Loans
****
% Families
***
% USB Loans
****
% Families
***
% USB Loans
****
% Families
***
% USB Loans
****
Over-
all
Low
Mod
Mid
Upp
Full-Review:
Little Rock-North Little Rock-Conway
1,869 74.14 19.86 17.48 18.06 29.64 22.37 25.08 39.70 27.81 3.72 5.14 3.73 3.81 3.22
Limited-Review:
Fort Smith 111 4.40 18.27 3.70 18.50 22.22 25.36 33.33 37.87 40.74 1.44 0.00 1.23 2.44 1.08
Hot Springs 172 6.82 19.07 13.04 18.11 26.96 23.06 17.39 39.75 42.61 4.88 7.62 6.14 3.86 4.26
AR nonMSA 369 14.64 16.65 11.45 17.74 24.24 24.07 30.64 41.53 33.67 7.49 9.57 8.77 9.80 5.57
Data shown includes only one to four-family and manufactured housing (property type 1 or 2). * Based on 2011 Peer Mortgage Data (USPR). ** Home purchase loans originated and purchased in the MA/AA as a percentage of all home purchase loans originated and purchased in the rated area. *** Percentage of Families is based on the 2000 Census information. **** As a percentage of loans with borrower income information available. No information was available for 56.5% of loans originated and purchased by the bank.
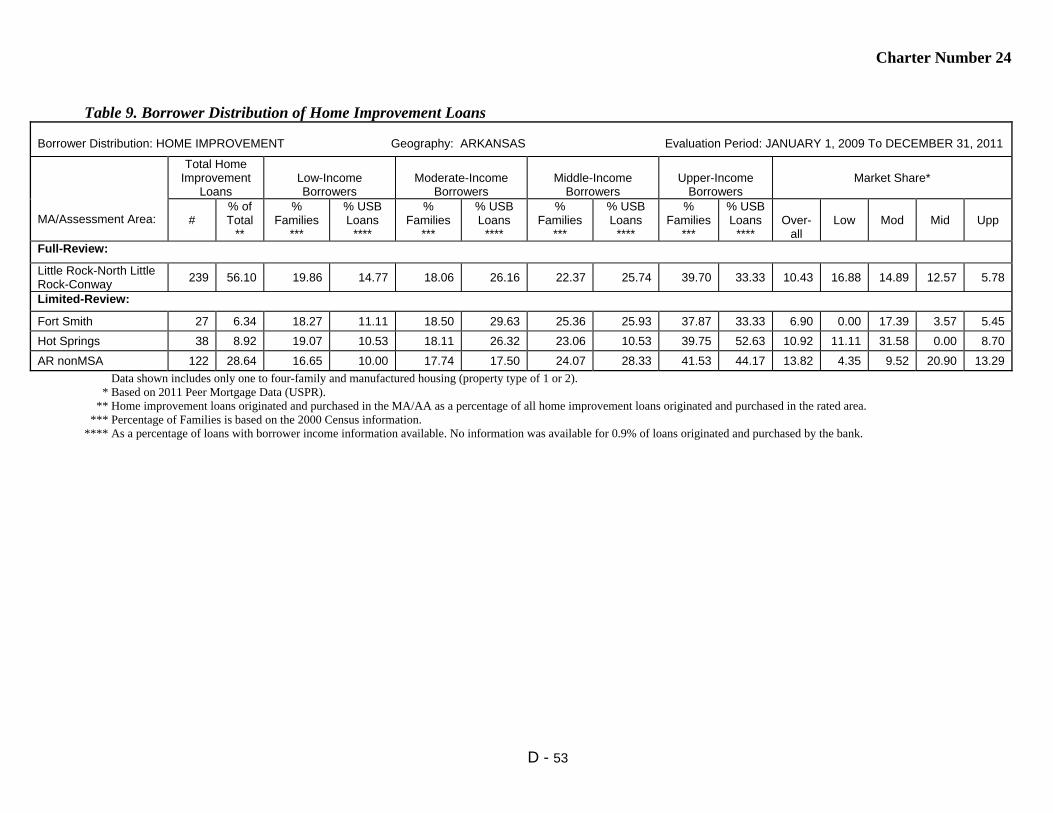
Charter Number 24
D - 53
Table 9. Borrower Distribution of Home Improvement Loans
Borrower Distribution: HOME IMPROVEMENT Geography: ARKANSAS Evaluation Period: JANUARY 1, 2009 To DECEMBER 31, 2011
MA/Assessment Area:
Total Home Improvement
Loans
Low-Income Borrowers
Moderate-Income
Borrowers
Middle-Income
Borrowers
Upper-Income
Borrowers
Market Share*
#
% of Total
**
% Families
***
% USB Loans
****
% Families
***
% USB Loans
****
% Families
***
% USB Loans
****
% Families
***
% USB Loans
****
Over-
all
Low
Mod
Mid
Upp
Full-Review:
Little Rock-North Little Rock-Conway
239 56.10 19.86 14.77 18.06 26.16 22.37 25.74 39.70 33.33 10.43 16.88 14.89 12.57 5.78
Limited-Review:
Fort Smith 27 6.34 18.27 11.11 18.50 29.63 25.36 25.93 37.87 33.33 6.90 0.00 17.39 3.57 5.45
Hot Springs 38 8.92 19.07 10.53 18.11 26.32 23.06 10.53 39.75 52.63 10.92 11.11 31.58 0.00 8.70
AR nonMSA 122 28.64 16.65 10.00 17.74 17.50 24.07 28.33 41.53 44.17 13.82 4.35 9.52 20.90 13.29
Data shown includes only one to four-family and manufactured housing (property type of 1 or 2). * Based on 2011 Peer Mortgage Data (USPR). ** Home improvement loans originated and purchased in the MA/AA as a percentage of all home improvement loans originated and purchased in the rated area. *** Percentage of Families is based on the 2000 Census information. **** As a percentage of loans with borrower income information available. No information was available for 0.9% of loans originated and purchased by the bank.

Charter Number 24
D - 54
Table 10. Borrower Distribution of Home Mortgage Refinance Loans
Borrower Distribution: HOME MORTGAGE REFINANCE Geography: ARKANSAS Evaluation Period: JANUARY 1, 2009 To DECEMBER 31, 2011
MA/Assessment Area:
Total Home Mortgage Refinance
Loans
Low-Income Borrowers
Moderate-Income Borrowers
Middle-Income Borrowers
Upper-Income Borrowers
Market Share*
#
% of Total
**
% Families
***
% USB Loans
****
% Families
***
% USB Loans
****
% Families
***
% USB Loans
****
% Families
***
% USB Loans
****
Over-
all
Low
Mod
Mid
Upp
Full-Review:
Little Rock-North Little Rock-Conway
2,286 57.80 19.86 9.59 18.06 20.34 22.37 24.25 39.70 45.82 6.28 9.88 9.22 6.55 4.99
Limited-Review:
Fort Smith 130 3.29 18.27 9.35 18.50 20.56 25.36 27.10 37.87 42.99 5.23 4.76 7.08 5.32 4.70
Hot Springs 337 8.52 19.07 8.33 18.11 22.22 23.06 25.00 39.75 44.44 8.80 8.45 12.04 12.83 6.45
AR nonMSA 1,202 30.39 16.65 6.46 17.74 19.01 24.07 26.05 41.53 48.48 15.21 18.97 19.43 17.85 12.86
Data shown includes only one to four-family and manufactured housing (property type 1 or 2). * Based on 2011 Peer Mortgage Data (USPR). ** Home refinance loans originated and purchased in the MA/AA as a percentage of all home refinance loans originated and purchased in the rated area. *** Percentage of Families is based on the 2000 Census information. **** As a percentage of loans with borrower income information available. No information was available for 26.5% of loans originated and purchased by the bank.
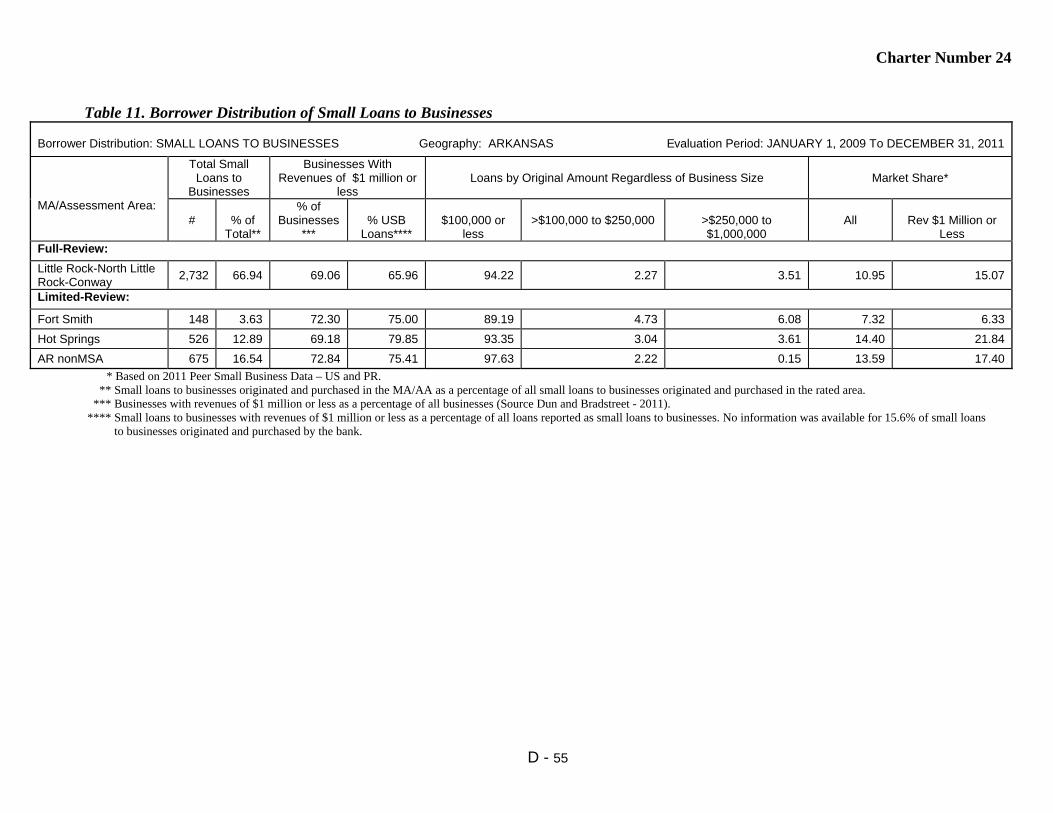
Charter Number 24
D - 55
Table 11. Borrower Distribution of Small Loans to Businesses
Borrower Distribution: SMALL LOANS TO BUSINESSES Geography: ARKANSAS Evaluation Period: JANUARY 1, 2009 To DECEMBER 31, 2011
MA/Assessment Area:
Total Small Loans to
Businesses
Businesses With Revenues of $1 million or
less
Loans by Original Amount Regardless of Business Size
Market Share*
#
% of
Total**
% of Businesses
***
% USB
Loans****
$100,000 or
less
>$100,000 to $250,000
>$250,000 to $1,000,000
All
Rev $1 Million or
Less Full-Review:
Little Rock-North Little Rock-Conway
2,732 66.94 69.06 65.96 94.22 2.27 3.51 10.95 15.07
Limited-Review:
Fort Smith 148 3.63 72.30 75.00 89.19 4.73 6.08 7.32 6.33
Hot Springs 526 12.89 69.18 79.85 93.35 3.04 3.61 14.40 21.84
AR nonMSA 675 16.54 72.84 75.41 97.63 2.22 0.15 13.59 17.40
* Based on 2011 Peer Small Business Data – US and PR. ** Small loans to businesses originated and purchased in the MA/AA as a percentage of all small loans to businesses originated and purchased in the rated area. *** Businesses with revenues of $1 million or less as a percentage of all businesses (Source Dun and Bradstreet - 2011). **** Small loans to businesses with revenues of $1 million or less as a percentage of all loans reported as small loans to businesses. No information was available for 15.6% of small loans to businesses originated and purchased by the bank.

Charter Number 24
D - 56
Table 12. Borrower Distribution of Small Loans to Farms
Borrower Distribution: SMALL LOANS TO FARMS Geography: ARKANSAS Evaluation Period: JANUARY 1, 2009 To DECEMBER 31, 2011
MA/Assessment Area:
Total Small Loans to Farms
Farms With Revenues of $1 million or less
Loans by Original Amount Regardless of Farm Size
Market Share*
#
% of
Total**
% of
Farms***
% USB
Loans****
$100,000 or
less
>$100,000 to $250,000
>$250,000 to $500,000
All
Rev $1 Million or
Less Full-Review:
Little Rock-North Little Rock-Conway
14 43.75 97.25 42.86 100.0 0.00 0.00 1.42 0.00
Limited-Review:
Fort Smith 2 6.25 97.87 50.00 100.0 0.00 0.00 5.00 5.26
Hot Springs 1 3.13 97.41 100.0 100.0 0.00 0.00 0.00 0.00
AR nonMSA 15 46.88 97.74 73.33 100.0 0.00 0.00 0.53 0.00
* Based on 2011 Peer Small Business Data – US and PR. ** Small loans to farms originated and purchased in the MA/AA as a percentage of all small loans to farms originated and purchased in the rated area. *** Farms with revenues of $1 million or less as a percentage of all farms (Source Dun and Bradstreet - 2011). **** Small loans to farms with revenues of $1 million or less as a percentage of all loans reported as small loans to farms. No information was available for 28.1% of small loans to farms originated and purchased by the bank.

Charter Number 24
D - 57
Table 14. Qualified Investments
QUALIFIED INVESTMENTS Geography: ARKANSAS Evaluation Period: JANUARY 1, 2009 To MARCH 31, 2012
MA/Assessment Area:
Prior Period Investments* Current Period Investments** Total Investments Unfunded Commitments***
# $(000’s) # $(000’s) # $(000’s) % of Total # $(000’s) Full-Review:
Little Rock-North Little Rock-Conway
12 3,134 139 16,304 151 19,438 86.69 4 18,981
Limited-Review:
Fort Smith 7 224 2 198 9 422 1.88 0 0
Hot Springs 9 257 5 483 14 740 3.30 0 0
AR nonMSA 20 1,042 7 763 27 1,805 8.05 0 0
AR Statewide 0 0 6 18 6 18 0.08 0 0
* 'Prior Period Investments' means investments made in a previous evaluation period that are outstanding as of the examination date. ** The evaluation period for current period investments is January 1, 2009 to March 31, 2012. *** 'Unfunded Commitments' means legally binding investment commitments that are tracked and recorded by the institution's financial reporting system.
Table 15. Distribution of Branch Delivery System and Branch Openings/Closings DISTRIBUTION OF BRANCH DELIVERY SYSTEM/BRANCH OPENINGS/CLOSINGS Geography: ARKANSAS Evaluation Period: JANUARY 1, 2009 To DECEMBER 31, 2011
MA/Assessment Area:
Deposits Branches Branch Openings/Closings Population
% of
Rated Area
Deposits in AA
# of USB
Branch-es
% of
Rated Area
Branches in AA
Location of Branches by
Income of Geographies (%)
# of Branch
Openings
# of Branch
Closings
Net change in Location of Branches (+ or - )
% of Population within Each
Geography
Low
Mod
Mid
Upp
Low
Mod
Mid
Upp
Low
Mod
Mid
Upp
Full-Review:
Little Rock-North Little Rock-Conway
59.42 22 48.89 4.55 22.73 31.82 40.91 0 0 0 0 0 0 3.04 20.79 50.68 25.49
Limited-Review:
Fort Smith 5.13 4 8.89 NA NA 100.0 NA 0 0 NA NA 0 NA NA NA 100.00 NA
Hot Springs 13.40 6 13.33 NA 33.33 33.33 33.33 0 0 NA 0 0 0 NA 21.35 65.29 13.36
AR nonMSA 22.05 13 28.89 NA NA 92.31 7.69 0 1 NA NA -1 0 NA NA 92.77 7.23

Charter Number 24
D - 58
Table 1. Lending Volume
LENDING VOLUME Geography: CALIFORNIA Evaluation Period: JANUARY 1, 2009 To DECEMBER 31, 2011
MA/Assessment Area:
% of Rated Area Loans
(#) in MA/AA*
Home Mortgage
Small Loans to
Businesses
Small Loans to Farms
Community
Development Loans**
Total Reported Loans
% of Rated Area
Deposits in MA/AA***
#
$ (000’s)
#
$ (000’s) #
$ (000’s)
#
$ (000’s)
#
$(000’s)
Full-Review:
Los Angeles-Long Beach- Glendale
22.68 11,276 4,144,097 20,470 666,068 18 1,832 62 412,244 31,826 5,224,241 28.31
Limited-Review:
Bakersfield-Delano 0.71 485 85,428 511 14,819 1 25 2 13,161 999 113,433 0.08
Chico 1.20 541 91,840 1,136 38,563 10 508 4 6,900 1,691 137,811 0.45
Modesto 1.06 503 79,634 976 36,854 4 16 1 1,080 1,484 117,584 0.43
Napa 0.64 309 103,958 592 13,467 0 0 1 50 902 117,475 0.29 Oakland-Fremont- Haywood
8.59 5,324 1,992,939 6,704 225,046 10 260 19 105,794 12,057 2,324,039 6.72
Oxnard-Thousand Oaks- Ventura
1.78 1,381 488,848 1,099 35,560 4 500 8 15,757 2,492 540,665 1.12
Redding 1.06 589 97,254 886 19,109 6 155 0 0 1,481 116,518 0.49 Riverside-San Bernardino -Ontario
8.71 6,368 1,393,335 5,827 170,061 6 81 21 63,480 12,222 1,626,957 8.67
Sacramento- Arden Arcade-Roseville
9.15 5,870 1,409,345 6,926 261,945 17 1,023 25 133,345 12,838 1,805,658 14.25
Salinas 0.55 422 145,740 351 7,497 2 25 1 9,510 776 162,772 0.03 San Diego-Carlsbad- San Marcos
10.56 7,202 2,540,014 7,586 313,558 6 91 29 161,541 14,823 3,015,204 11.83
San Francisco-San Mateo-Redwood City
7.38 4,396 2,034,419 5,946 179,294 10 1,004 11 17,701 10,363 2,232,418 6.13
San Jose-Sunnyvale- Santa Clara
6.29 4,769 2,251,716 4,037 150,273 0 0 16 151,278 8,822 2,553,267 4.36
San Luis Obispo- Paso Robles
0.50 452 142,294 247 7,450 3 40 1 198 703 149,982 0.41
Santa Ana-Anaheim-Irvine 9.48 5,498 2,016,925 7,786 289,641 5 91 10 28,401 13,299 2,335,058 11.94 Santa Barbara- Santa Maria-Goleta
0.58 472 172,848 344 8,217 2 68 3 13,709 821 194,842 0.19

Charter Number 24
D - 59
Table 1. Lending Volume (Continued)
LENDING VOLUME Geography: CALIFORNIA Evaluation Period: JANUARY 1, 2009 To DECEMBER 31, 2011
MA/Assessment Area:
% of Rated Area Loans
(#) in MA/AA*
Home Mortgage
Small Loans to
Businesses
Small Loans to Farms
Community
Development Loans**
Total Reported Loans
% of Rated Area
Deposits in MA/AA***
#
$ (000’s) #
$ (000’s)
#
$ (000’s)
#
$ (000’s)
#
$(000’s)
Limited-Review (continued):
Santa Cruz-Watsonville 0.88 420 157,138 809 11,682 2 4 0 0 1,231 168,824 0.32
Santa Rosa-Petaluma 1.97 849 278,467 1,903 49,623 10 86 3 13,110 2,765 341,286 0.67
Stockton 0.82 557 104,873 580 23,873 4 57 6 27,150 1,147 155,953 0.29
Vallejo-Fairfield 1.04 683 154,654 780 19,854 1 25 2 57 1,466 174,590 0.75
Yuba City 0.57 245 40,721 542 18,443 15 1,098 0 0 802 60,262 0.21
CA nonMSA 3.79 2,140 445,204 3,121 91,718 59 5,792 3 4,050 5,323 546,764 2.08
CA Statewide 0.01 0 0 0 0 0 0 19 61,588 19 61,588 NA * Loan Data as of December 31, 2011. Rated area refers to either the state or multistate MA rating area. ** The evaluation period for Community Development Loans is from January 1, 2009 to March 31, 2012. *** Deposit Data as of June 30, 2011. Rated Area refers to the state, multistate MA, or institution, as appropriate.

Charter Number 24
D - 60
Table 2. Geographic Distribution of Home Purchase Loans
Geographic Distribution: HOME PURCHASE Geography: CALIFORNIA Evaluation Period: JANUARY 1, 2009 To DECEMBER 31, 2011
MA/Assessment Area:
Total Home
Purchase Loans
Low-Income Geographies
Moderate-Income
Geographies
Middle-Income Geographies
Upper-Income Geographies
Market Share (%) by Geography*
#
% of
Total**
% Owner
Occ Units***
% USB Loans
% Owner
Occ Units***
% USB Loans
% Owner
Occ Units***
% USB Loans
% Owner
Occ Units***
%
USB Loans
Overall
Low
Mod
Mid
Upp
Full-Review:
Los Angeles-Long Beach- Glendale
3,206 16.98 1.91 2.74 15.46 17.06 31.30 26.45 51.33 53.62 1.14 0.64 0.60 0.94 1.54
Limited-Review:
Bakersfield-Delano 245 1.30 2.10 0.41 23.06 5.31 33.51 35.10 41.33 59.18 0.56 0.00 0.13 0.69 0.59
Chico 115 0.61 0.38 1.74 14.86 11.30 60.46 58.26 24.30 28.70 1.73 0.00 1.04 1.95 1.66
Modesto 263 1.39 1.12 0.00 14.63 14.07 53.88 58.17 30.36 27.76 0.66 0.00 0.32 0.68 0.75
Napa 74 0.39 NA NA 13.85 25.68 60.87 56.76 25.28 17.57 1.25 NA 1.10 1.02 2.26
Oakland-Fremont- Haywood
1,547 8.19 3.49 4.07 13.07 12.48 43.58 42.79 39.86 40.66 1.40 0.77 1.01 1.18 1.88
Oxnard-Thousand Oaks- Ventura
334 1.77 1.20 0.90 15.46 11.68 46.06 43.71 37.29 43.71 1.15 0.83 0.41 1.13 1.62
Redding 143 0.76 NA NA 12.78 14.69 70.92 69.93 16.30 15.38 2.44 NA 2.22 2.97 1.19
Riverside-San Bernardino -Ontario
2,776 14.70 1.49 0.47 21.74 17.72 43.33 44.09 33.44 37.72 1.07 0.52 1.19 0.90 1.28
Sacramento- Arden Arcade-Roseville
2,535 13.42 3.32 3.67 18.33 20.24 42.14 40.00 36.21 36.09 2.28 3.04 3.59 2.40 1.72
Salinas 224 1.19 NA NA 13.83 14.73 45.09 52.23 41.08 33.04 1.12 NA 0.40 1.15 1.41
San Diego-Carlsbad- San Marcos
2,267 12.01 2.30 3.04 14.03 11.42 41.01 38.77 42.66 46.76 1.74 1.39 1.23 1.65 2.01
San Francisco-San Mateo-Redwood City
843 4.46 1.54 2.49 12.79 13.76 45.12 45.43 40.55 38.32 2.12 1.20 1.52 2.35 2.19

Charter Number 24
D - 61
Table 2. Geographic Distribution of Home Purchase Loans (continued)
Geographic Distribution: HOME PURCHASE Geography: CALIFORNIA Evaluation Period: JANUARY 1, 2009 To DECEMBER 31, 2011
MA/Assessment Area:
Total Home
Purchase Loans
Low-Income Geographies
Moderate-Income
Geographies
Middle-Income Geographies
Upper-Income Geographies
Market Share (%) by Geography*
#
% of
Total**
% Owner
Occ Units***
% USB Loans
% Owner
Occ Units***
% USB Loans
% Owner
Occ Units***
% USB Loans
% Owner
Occ Units***
%
USB Loans
Overall
Low
Mod
Mid
Upp
Limited-Review (continued):
San Jose-Sunnyvale- Santa Clara
1,085 5.75 1.17 1.38 14.81 19.08 48.40 48.94 35.63 30.60 2.01 1.33 1.48 2.19 2.19
San Luis Obispo- Paso Robles
111 0.59 NA NA 10.27 9.01 75.43 81.98 14.31 9.01 1.22 NA 0.61 1.35 0.92
Santa Ana-Anaheim- Irvine
1,267 6.71 1.25 1.10 19.56 15.71 33.56 31.18 45.63 52.01 1.28 0.25 0.78 1.19 1.61
Santa Barbara- Santa Maria-Goleta
185 0.98 0.97 0.54 17.42 18.92 39.94 53.51 41.68 27.03 1.32 0.00 0.99 1.37 1.55
Santa Cruz-Watsonville 105 0.56 NA NA 20.21 26.67 40.44 41.90 39.35 31.43 1.55 NA 1.88 1.47 1.40
Santa Rosa-Petaluma 243 1.29 NA NA 9.17 16.46 71.27 69.55 19.56 13.99 1.24 NA 1.10 1.27 1.20
Stockton 302 1.60 1.80 0.33 19.48 9.27 39.28 31.79 39.43 58.61 0.62 0.00 0.78 0.51 0.66
Vallejo-Fairfield 282 1.49 0.52 0.00 15.69 13.48 50.32 46.81 33.48 39.72 0.85 0.00 1.23 0.70 0.94
Yuba City 120 0.64 NA NA 17.49 27.50 52.57 50.00 29.94 22.50 1.13 NA 1.47 1.22 0.71
CA nonMSA 611 3.24 NA NA 10.20 9.33 69.14 65.63 20.66 25.04 2.75 NA 5.02 2.91 1.98
Data shown includes only one to four-family and manufactured housing (property type 1 or 2). Distributions may not total 100% in markets with NA tracts (Los Angeles). * Based on 2011 Peer Mortgage Data (USPR). ** Home purchase loans originated and purchased in the MA/AA as a percentage of all home purchase loans originated and purchased in the rated area. *** Percentage of Owner-Occupied Units is the number of owner-occupied housing units in a particular geography divided by the number of owner-occupied housing units in the area based on 2000 Census information.

Charter Number 24
D - 62
Table 3. Geographic Distribution of Home Improvement Loans
Geographic Distribution: HOME IMPROVEMENT Geography: CALIFORNIA Evaluation Period: JANUARY 1, 2009 To DECEMBER 31, 2011
MA/Assessment Area:
Total Home
Improvement Loans
Low-Income Geographies
Moderate-Income
Geographies
Middle-Income Geographies
Upper-Income Geographies
Market Share (%) by Geography*
#
% of
Total**
% Owner
Occ Units***
% USB Loans
% Owner
Occ Units***
% USB Loans
% Owner
Occ Units***
% USB Loans
% Owner
Occ Units***
%
USB Loans
Overall
Low
Mod
Mid
Upp
Full-Review:
Los Angeles-Long Beach-Glendale
251 19.25 1.91 0.80 15.46 8.76 31.30 25.90 51.33 64.54 2.26 0.00 1.60 2.12 2.52
Limited-Review:
Bakersfield-Delano 4 0.31 2.10 0.00 23.06 0.00 33.51 0.00 41.33 100.0 0.75 0.00 0.00 0.00 1.35
Chico 25 1.92 0.38 0.00 14.86 8.00 60.46 64.00 24.30 28.00 13.00 0.00 9.09 15.00 10.71
Modesto 9 0.69 1.12 0.00 14.63 22.22 53.88 66.67 30.36 11.11 3.27 0.00 11.11 3.95 0.00
Napa 5 0.38 NA NA 13.85 0.00 60.87 60.00 25.28 40.00 2.42 NA 0.00 1.11 7.69
Oakland-Fremont- Haywood
97 7.44 3.49 3.09 13.07 4.12 43.58 40.21 39.86 52.58 2.76 1.85 1.33 3.17 2.85
Oxnard-Thousand Oaks- Ventura
22 1.69 1.20 0.00 15.46 0.00 46.06 45.45 37.29 54.55 1.29 0.00 0.00 1.55 1.26
Redding 19 1.46 NA NA 12.78 0.00 70.92 84.21 16.30 15.79 8.33 NA 0.00 8.57 13.33
Riverside- San Bernardino -Ontario
180 13.80 1.49 0.56 21.74 18.33 43.33 40.00 33.44 41.11 4.81 5.00 5.90 4.29 4.89
Sacramento- Arden Arcade-Roseville
136 10.43 3.32 2.21 18.33 13.24 42.14 48.53 36.21 36.03 3.91 4.76 2.49 5.25 3.23
Salinas 3 0.23 NA NA 13.83 33.33 45.09 66.67 41.08 0.00 1.05 NA 6.67 1.11 0.00
San Diego-Carlsbad- San Marcos
123 9.43 2.30 2.44 14.03 13.82 41.01 38.21 42.66 45.53 2.37 0.00 2.48 2.81 2.13
San Francisco- San Mateo-Redwood City
92 7.06 1.54 2.17 12.79 18.48 45.12 50.00 40.55 29.35 2.62 5.26 3.50 4.16 1.06

Charter Number 24
D - 63
Table 3. Geographic Distribution of Home Improvement Loans (continued)
Geographic Distribution: HOME IMPROVEMENT Geography: CALIFORNIA Evaluation Period: JANUARY 1, 2009 To DECEMBER 31, 2011
MA/Assessment Area:
Total Home
Improvement Loans
Low-Income Geographies
Moderate-Income
Geographies
Middle-Income Geographies
Upper-Income Geographies
Market Share (%) by Geography*
#
% of
Total**
% Owner
Occ Units***
% USB Loans
% Owner
Occ Units***
% USB Loans
% Owner
Occ Units***
% USB Loans
% Owner
Occ Units***
%
USB Loans
Overall
Low
Mod
Mid
Upp
Limited Review (continued):
San Jose-Sunnyvale- Santa Clara
70 5.37 1.17 0.00 14.81 4.29 48.40 38.57 35.63 57.14 2.55 0.00 1.28 2.01 3.59
San Luis Obispo- Paso Robles
10 0.77 NA NA 10.27 10.00 75.43 60.00 14.31 30.00 2.41 NA 0.00 2.15 5.00
Santa Ana-Anaheim- Irvine
109 8.36 1.25 0.00 19.56 7.34 33.56 25.69 45.63 66.97 2.27 0.00 1.30 2.16 2.64
Santa Barbara- Santa Maria-Goleta
13 1.00 0.97 0.00 17.42 15.38 39.94 46.15 41.68 38.46 1.62 0.00 3.85 2.96 0.60
Santa Cruz-Watsonville 17 1.30 NA NA 20.21 5.88 40.44 35.29 39.35 58.82 7.46 NA 4.55 7.84 7.81
Santa Rosa-Petaluma 14 1.07 NA NA 9.17 7.14 71.27 57.14 19.56 35.71 1.63 NA 4.55 1.43 1.65
Stockton 10 0.77 1.80 0.00 19.48 10.00 39.28 30.00 39.43 60.00 2.48 0.00 2.94 2.27 2.65
Vallejo-Fairfield 10 0.77 0.52 0.00 15.69 0.00 50.32 70.00 33.48 30.00 3.09 0.00 0.00 5.32 1.49
Yuba City 4 0.31 NA NA 17.49 25.00 52.57 50.00 29.94 25.00 1.30 NA 0.00 2.22 0.00
CA nonMSA 81 6.21 NA NA 10.20 13.58 69.14 65.43 20.66 20.99 11.14 NA 12.50 12.95 7.50
Data shown includes only one to four-family and manufactured housing (property type 1 or 2). * Based on 2011 Peer Mortgage Data (USPR). ** Home improvement loans originated and purchased in the MA/AA as a percentage of all home improvement loans originated and purchased in the rated area. *** Percentage of Owner-Occupied Units is the number of owner-occupied housing units in a particular geography divided by number of owner-occupied housing units in the area based on 2000 Census information.
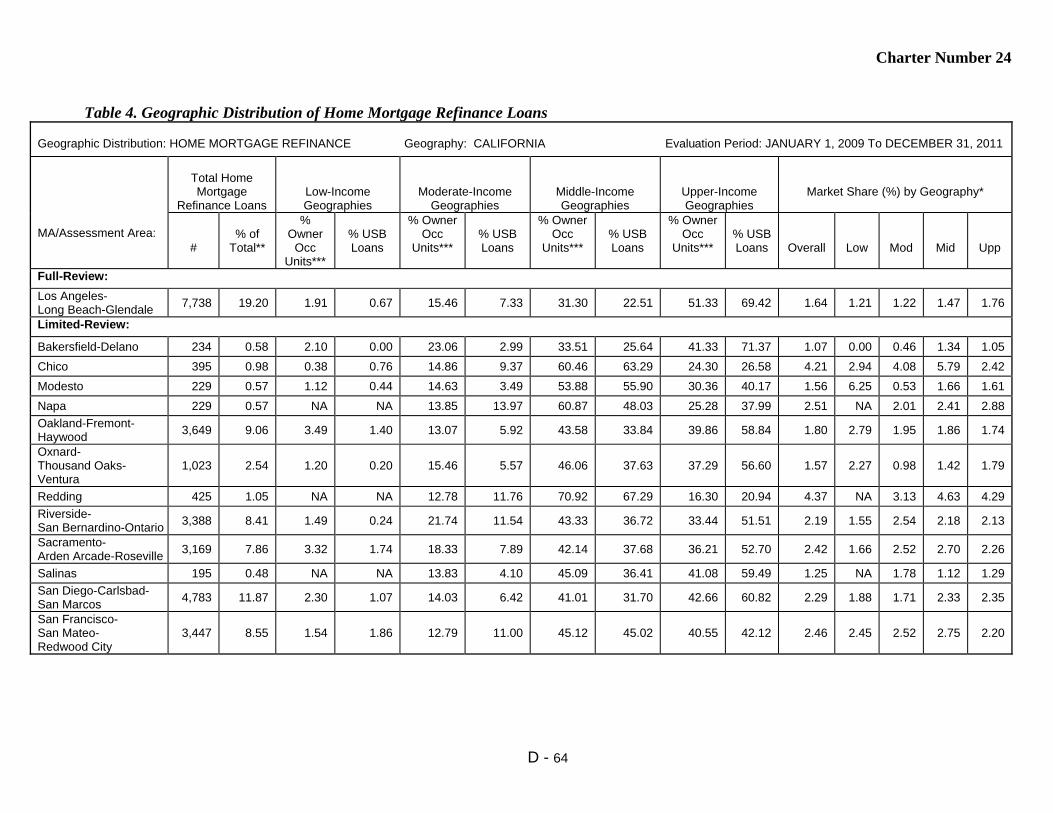
Charter Number 24
D - 64
Table 4. Geographic Distribution of Home Mortgage Refinance Loans
Geographic Distribution: HOME MORTGAGE REFINANCE Geography: CALIFORNIA Evaluation Period: JANUARY 1, 2009 To DECEMBER 31, 2011
MA/Assessment Area:
Total Home Mortgage
Refinance Loans
Low-Income Geographies
Moderate-Income Geographies
Middle-Income Geographies
Upper-Income Geographies
Market Share (%) by Geography*
#
% of
Total**
% Owner
Occ Units***
% USB Loans
% Owner Occ
Units***
% USB Loans
% Owner Occ
Units***
% USB Loans
% Owner Occ
Units***
% USB Loans
Overall
Low
Mod
Mid
Upp
Full-Review:
Los Angeles- Long Beach-Glendale
7,738 19.20 1.91 0.67 15.46 7.33 31.30 22.51 51.33 69.42 1.64 1.21 1.22 1.47 1.76
Limited-Review:
Bakersfield-Delano 234 0.58 2.10 0.00 23.06 2.99 33.51 25.64 41.33 71.37 1.07 0.00 0.46 1.34 1.05
Chico 395 0.98 0.38 0.76 14.86 9.37 60.46 63.29 24.30 26.58 4.21 2.94 4.08 5.79 2.42
Modesto 229 0.57 1.12 0.44 14.63 3.49 53.88 55.90 30.36 40.17 1.56 6.25 0.53 1.66 1.61
Napa 229 0.57 NA NA 13.85 13.97 60.87 48.03 25.28 37.99 2.51 NA 2.01 2.41 2.88
Oakland-Fremont- Haywood
3,649 9.06 3.49 1.40 13.07 5.92 43.58 33.84 39.86 58.84 1.80 2.79 1.95 1.86 1.74
Oxnard- Thousand Oaks- Ventura
1,023 2.54 1.20 0.20 15.46 5.57 46.06 37.63 37.29 56.60 1.57 2.27 0.98 1.42 1.79
Redding 425 1.05 NA NA 12.78 11.76 70.92 67.29 16.30 20.94 4.37 NA 3.13 4.63 4.29
Riverside- San Bernardino-Ontario
3,388 8.41 1.49 0.24 21.74 11.54 43.33 36.72 33.44 51.51 2.19 1.55 2.54 2.18 2.13
Sacramento- Arden Arcade-Roseville
3,169 7.86 3.32 1.74 18.33 7.89 42.14 37.68 36.21 52.70 2.42 1.66 2.52 2.70 2.26
Salinas 195 0.48 NA NA 13.83 4.10 45.09 36.41 41.08 59.49 1.25 NA 1.78 1.12 1.29
San Diego-Carlsbad- San Marcos
4,783 11.87 2.30 1.07 14.03 6.42 41.01 31.70 42.66 60.82 2.29 1.88 1.71 2.33 2.35
San Francisco- San Mateo- Redwood City
3,447 8.55 1.54 1.86 12.79 11.00 45.12 45.02 40.55 42.12 2.46 2.45 2.52 2.75 2.20

Charter Number 24
D - 65
Table 4. Geographic Distribution of Home Mortgage Refinance Loans (continued)
Geographic Distribution: HOME MORTGAGE REFINANCE Geography: CALIFORNIA Evaluation Period: JANUARY 1, 2009 To DECEMBER 31, 2011
MA/Assessment Area:
Total Home Mortgage
Refinance Loans
Low-Income Geographies
Moderate-Income Geographies
Middle-Income Geographies
Upper-Income Geographies
Market Share (%) by Geography*
#
% of
Total**
% Owner
Occ Units***
% USB Loans
% Owner Occ
Units***
% USB Loans
% Owner Occ
Units***
% USB Loans
% Owner Occ
Units***
% USB Loans
Overall
Low
Mod
Mid
Upp
Limited Review (continued):
San Jose-Sunnyvale- Santa Clara
3,602 8.94 1.17 0.53 14.81 7.08 48.40 43.25 35.63 49.14 2.10 1.99 1.67 2.11 2.18
San Luis Obispo- Paso Robles
331 0.82 NA NA 10.27 9.06 75.43 74.32 14.31 16.62 1.68 NA 2.08 1.62 1.75
Santa Ana-Anaheim- Irvine
4,112 10.20 1.25 0.22 19.56 9.29 33.56 29.67 45.63 60.82 1.75 0.87 1.35 1.68 1.87
Santa Barbara- Santa Maria-Goleta
273 0.68 0.97 0.37 17.42 11.36 39.94 45.05 41.68 43.22 1.44 0.00 0.61 1.69 1.48
Santa Cruz-Watsonville 298 0.74 NA NA 20.21 12.08 40.44 41.28 39.35 46.64 2.02 NA 1.20 2.17 2.16
Santa Rosa-Petaluma 585 1.45 NA NA 9.17 6.67 71.27 69.40 19.56 23.93 1.47 NA 1.49 1.45 1.52
Stockton 243 0.60 1.80 0.00 19.48 4.94 39.28 30.04 39.43 65.02 1.16 0.00 0.69 1.07 1.27
Vallejo-Fairfield 383 0.95 0.52 0.52 15.69 7.57 50.32 44.91 33.48 47.00 2.32 7.69 2.42 2.20 2.40
Yuba City 118 0.29 NA NA 17.49 10.17 52.57 61.02 29.94 28.81 2.68 NA 1.01 3.19 2.52
CA nonMSA 1,445 3.59 NA NA 10.20 6.71 69.14 64.22 20.66 29.07 3.78 NA 4.45 4.33 2.78
Data shown includes only one to four-family and manufactured housing (property type 1 or 2). Distributions may not total 100% in markets with NA tracts (Los Angeles). * Based on 2011 Peer Mortgage Data (USPR). ** Home mortgage refinance loans originated and purchased in the MA/AA as a percentage of all home mortgage refinance loans originated and purchased in the rated area. *** Percentage of Owner-Occupied Units is the number of owner-occupied housing units in a particular geography divided by number of owner-occupied housing units in the area based on 2000 Census information.
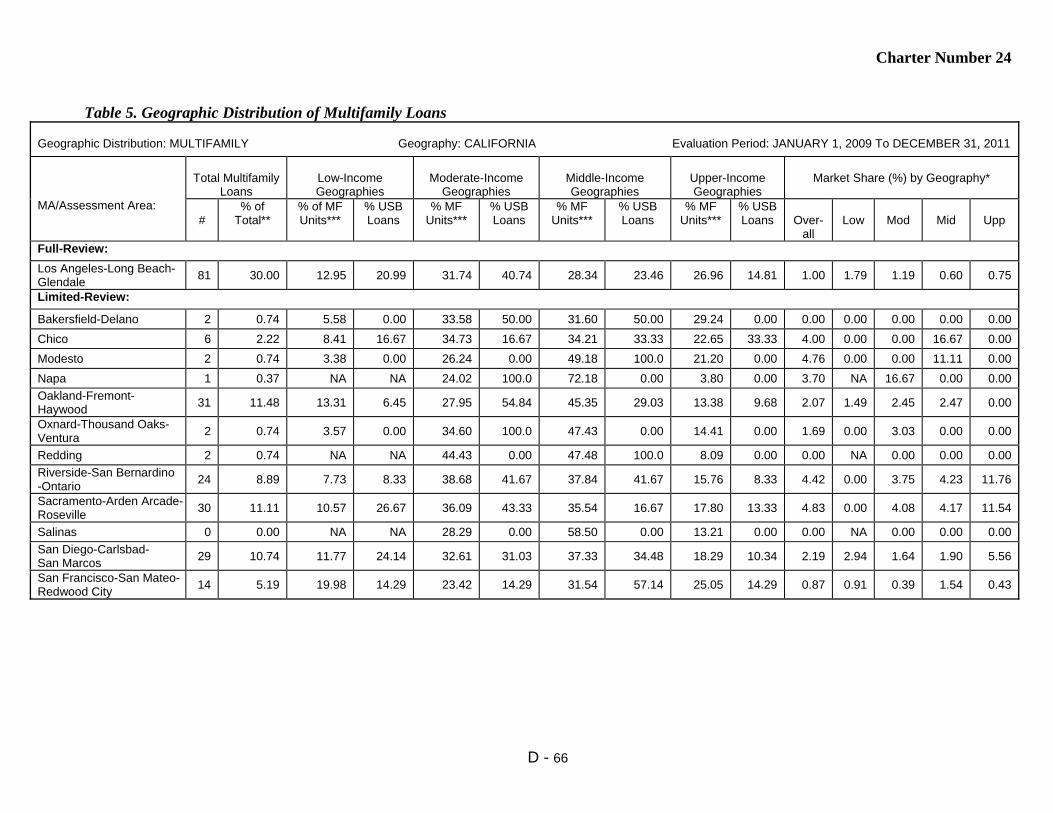
Charter Number 24
D - 66
Table 5. Geographic Distribution of Multifamily Loans
Geographic Distribution: MULTIFAMILY Geography: CALIFORNIA Evaluation Period: JANUARY 1, 2009 To DECEMBER 31, 2011
MA/Assessment Area:
Total Multifamily
Loans
Low-Income Geographies
Moderate-Income
Geographies
Middle-Income Geographies
Upper-Income Geographies
Market Share (%) by Geography*
#
% of Total**
% of MF Units***
% USB Loans
% MF Units***
% USB Loans
% MF Units***
% USB Loans
% MF Units***
% USB Loans
Over-
all
Low
Mod
Mid
Upp
Full-Review:
Los Angeles-Long Beach- Glendale
81 30.00 12.95 20.99 31.74 40.74 28.34 23.46 26.96 14.81 1.00 1.79 1.19 0.60 0.75
Limited-Review:
Bakersfield-Delano 2 0.74 5.58 0.00 33.58 50.00 31.60 50.00 29.24 0.00 0.00 0.00 0.00 0.00 0.00
Chico 6 2.22 8.41 16.67 34.73 16.67 34.21 33.33 22.65 33.33 4.00 0.00 0.00 16.67 0.00
Modesto 2 0.74 3.38 0.00 26.24 0.00 49.18 100.0 21.20 0.00 4.76 0.00 0.00 11.11 0.00
Napa 1 0.37 NA NA 24.02 100.0 72.18 0.00 3.80 0.00 3.70 NA 16.67 0.00 0.00
Oakland-Fremont- Haywood
31 11.48 13.31 6.45 27.95 54.84 45.35 29.03 13.38 9.68 2.07 1.49 2.45 2.47 0.00
Oxnard-Thousand Oaks- Ventura
2 0.74 3.57 0.00 34.60 100.0 47.43 0.00 14.41 0.00 1.69 0.00 3.03 0.00 0.00
Redding 2 0.74 NA NA 44.43 0.00 47.48 100.0 8.09 0.00 0.00 NA 0.00 0.00 0.00
Riverside-San Bernardino -Ontario
24 8.89 7.73 8.33 38.68 41.67 37.84 41.67 15.76 8.33 4.42 0.00 3.75 4.23 11.76
Sacramento-Arden Arcade- Roseville
30 11.11 10.57 26.67 36.09 43.33 35.54 16.67 17.80 13.33 4.83 0.00 4.08 4.17 11.54
Salinas 0 0.00 NA NA 28.29 0.00 58.50 0.00 13.21 0.00 0.00 NA 0.00 0.00 0.00
San Diego-Carlsbad- San Marcos
29 10.74 11.77 24.14 32.61 31.03 37.33 34.48 18.29 10.34 2.19 2.94 1.64 1.90 5.56
San Francisco-San Mateo- Redwood City
14 5.19 19.98 14.29 23.42 14.29 31.54 57.14 25.05 14.29 0.87 0.91 0.39 1.54 0.43

Charter Number 24
D - 67
Table 5. Geographic Distribution of Multifamily Loans (continued)
Geographic Distribution: MULTIFAMILY Geography: CALIFORNIA Evaluation Period: JANUARY 1, 2009 To DECEMBER 31, 2011
MA/Assessment Area:
Total Multifamily
Loans
Low-Income Geographies
Moderate-Income
Geographies
Middle-Income Geographies
Upper-Income Geographies
Market Share (%) by Geography*
#
% of Total**
% of MF Units***
% USB Loans
% MF Units***
% USB Loans
% MF Units***
% USB Loans
% MF Units***
% USB Loans
Over-
all
Low
Mod
Mid
Upp
Limited Review (continued):
San Jose-Sunnyvale- Santa Clara
12 4.44 6.98 25.00 25.75 0.00 53.88 58.33 13.39 16.67 2.09 8.33 0.00 2.92 0.00
San Luis Obispo- Paso Robles
0 0.00 NA NA 34.31 0.00 64.12 0.00 1.56 0.00 0.00 NA 0.00 0.00 0.00
Santa Ana-Anaheim- Irvine
10 3.70 6.27 20.00 41.07 60.00 33.61 10.00 19.05 10.00 1.03 2.00 1.33 0.00 0.00
Santa Barbara- Santa Maria-Goleta
1 0.37 12.99 0.00 41.94 0.00 28.08 100.0 16.99 0.00 1.54 0.00 0.00 5.88 0.00
Santa Cruz-Watsonville 0 0.00 NA NA 43.78 0.00 44.77 0.00 11.45 0.00 0.00 NA 0.00 0.00 0.00
Santa Rosa-Petaluma 7 2.59 NA NA 29.86 28.57 65.54 71.43 4.60 0.00 8.16 NA 10.53 6.67 0.00
Stockton 2 0.74 22.11 0.00 26.33 50.00 37.30 50.00 14.27 0.00 0.00 0.00 0.00 0.00 0.00
Vallejo-Fairfield 8 2.96 6.21 12.50 35.41 37.50 37.98 37.50 20.40 12.50 19.23 50.00 6.25 42.86 0.00
Yuba City 3 1.11 NA NA 49.32 66.67 37.49 33.33 13.19 0.00 0.00 NA 0.00 0.00 0.00
CA nonMSA 3 1.11 NA NA 33.99 0.00 60.71 100.0 5.30 0.00 13.04 NA 0.00 21.43 0.00
Multifamily loan distribution includes Home Purchases, Home Improvement and Refinances. Distributions may not total 100% in markets with NA tracts (Los Angeles, Oakland). * Based on 2011 Peer Mortgage Data (USPR). ** Multifamily loans originated and purchased in the MA/AA as a percentage of all multifamily loans originated and purchased in the rated area. *** Percentage of multifamily units is the number of multifamily housing units in a particular geography divided by number of multifamily housing units in the area based on 2000 Census information.
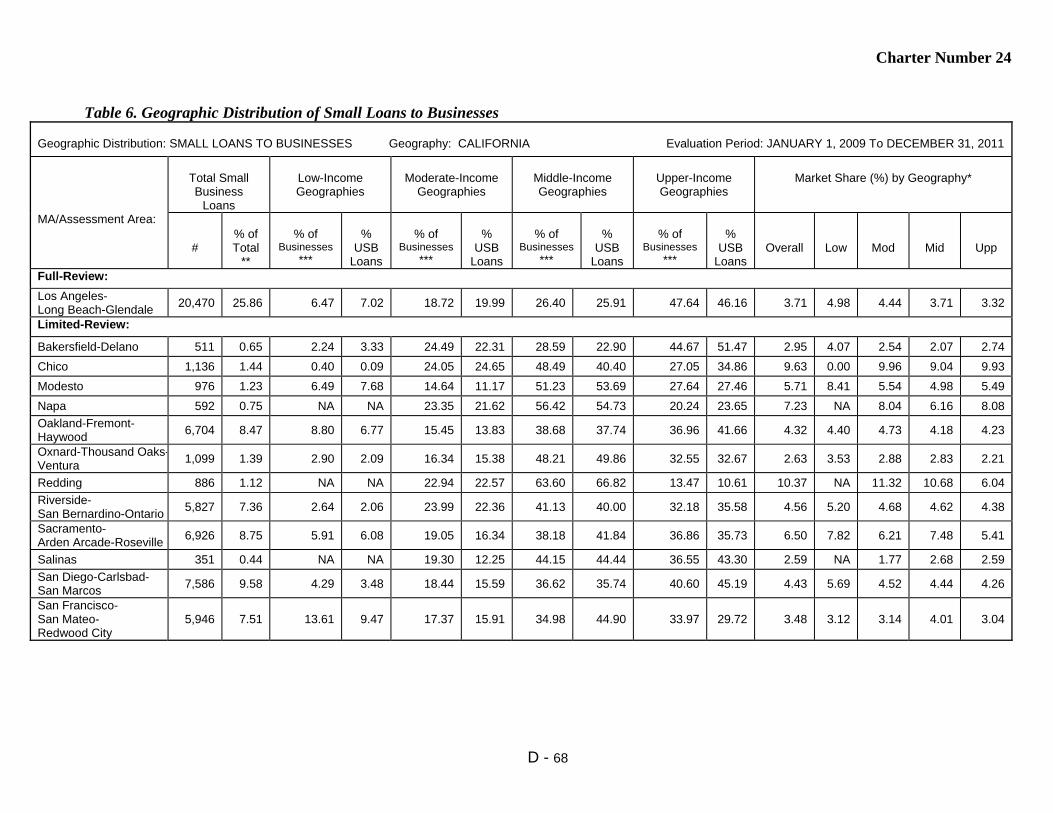
Charter Number 24
D - 68
Table 6. Geographic Distribution of Small Loans to Businesses
Geographic Distribution: SMALL LOANS TO BUSINESSES Geography: CALIFORNIA Evaluation Period: JANUARY 1, 2009 To DECEMBER 31, 2011
MA/Assessment Area:
Total Small Business
Loans
Low-Income Geographies
Moderate-Income
Geographies
Middle-Income Geographies
Upper-Income Geographies
Market Share (%) by Geography*
#
% of Total
**
% of
Businesses ***
%
USB Loans
% of
Businesses***
%
USB Loans
% of
Businesses ***
%
USB Loans
% of
Businesses ***
%
USB Loans
Overall
Low
Mod
Mid
Upp
Full-Review:
Los Angeles- Long Beach-Glendale
20,470 25.86 6.47 7.02 18.72 19.99 26.40 25.91 47.64 46.16 3.71 4.98 4.44 3.71 3.32
Limited-Review:
Bakersfield-Delano 511 0.65 2.24 3.33 24.49 22.31 28.59 22.90 44.67 51.47 2.95 4.07 2.54 2.07 2.74
Chico 1,136 1.44 0.40 0.09 24.05 24.65 48.49 40.40 27.05 34.86 9.63 0.00 9.96 9.04 9.93
Modesto 976 1.23 6.49 7.68 14.64 11.17 51.23 53.69 27.64 27.46 5.71 8.41 5.54 4.98 5.49
Napa 592 0.75 NA NA 23.35 21.62 56.42 54.73 20.24 23.65 7.23 NA 8.04 6.16 8.08
Oakland-Fremont- Haywood
6,704 8.47 8.80 6.77 15.45 13.83 38.68 37.74 36.96 41.66 4.32 4.40 4.73 4.18 4.23
Oxnard-Thousand Oaks-Ventura
1,099 1.39 2.90 2.09 16.34 15.38 48.21 49.86 32.55 32.67 2.63 3.53 2.88 2.83 2.21
Redding 886 1.12 NA NA 22.94 22.57 63.60 66.82 13.47 10.61 10.37 NA 11.32 10.68 6.04
Riverside- San Bernardino-Ontario
5,827 7.36 2.64 2.06 23.99 22.36 41.13 40.00 32.18 35.58 4.56 5.20 4.68 4.62 4.38
Sacramento- Arden Arcade-Roseville
6,926 8.75 5.91 6.08 19.05 16.34 38.18 41.84 36.86 35.73 6.50 7.82 6.21 7.48 5.41
Salinas 351 0.44 NA NA 19.30 12.25 44.15 44.44 36.55 43.30 2.59 NA 1.77 2.68 2.59
San Diego-Carlsbad- San Marcos
7,586 9.58 4.29 3.48 18.44 15.59 36.62 35.74 40.60 45.19 4.43 5.69 4.52 4.44 4.26
San Francisco- San Mateo- Redwood City
5,946 7.51 13.61 9.47 17.37 15.91 34.98 44.90 33.97 29.72 3.48 3.12 3.14 4.01 3.04
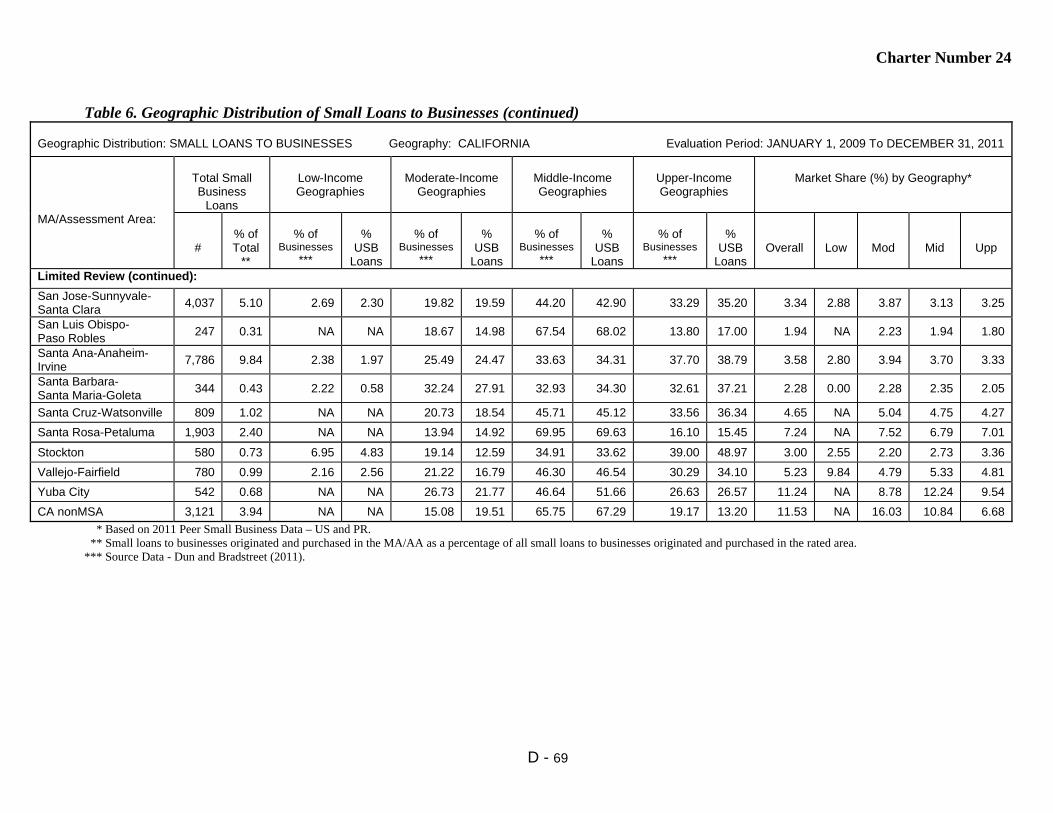
Charter Number 24
D - 69
Table 6. Geographic Distribution of Small Loans to Businesses (continued)
Geographic Distribution: SMALL LOANS TO BUSINESSES Geography: CALIFORNIA Evaluation Period: JANUARY 1, 2009 To DECEMBER 31, 2011
MA/Assessment Area:
Total Small Business
Loans
Low-Income Geographies
Moderate-Income
Geographies
Middle-Income Geographies
Upper-Income Geographies
Market Share (%) by Geography*
#
% of Total
**
% of
Businesses ***
%
USB Loans
% of
Businesses ***
%
USB Loans
% of
Businesses ***
%
USB Loans
% of
Businesses ***
%
USB Loans
Overall
Low
Mod
Mid
Upp
Limited Review (continued):
San Jose-Sunnyvale- Santa Clara
4,037 5.10 2.69 2.30 19.82 19.59 44.20 42.90 33.29 35.20 3.34 2.88 3.87 3.13 3.25
San Luis Obispo- Paso Robles
247 0.31 NA NA 18.67 14.98 67.54 68.02 13.80 17.00 1.94 NA 2.23 1.94 1.80
Santa Ana-Anaheim- Irvine
7,786 9.84 2.38 1.97 25.49 24.47 33.63 34.31 37.70 38.79 3.58 2.80 3.94 3.70 3.33
Santa Barbara- Santa Maria-Goleta
344 0.43 2.22 0.58 32.24 27.91 32.93 34.30 32.61 37.21 2.28 0.00 2.28 2.35 2.05
Santa Cruz-Watsonville 809 1.02 NA NA 20.73 18.54 45.71 45.12 33.56 36.34 4.65 NA 5.04 4.75 4.27
Santa Rosa-Petaluma 1,903 2.40 NA NA 13.94 14.92 69.95 69.63 16.10 15.45 7.24 NA 7.52 6.79 7.01
Stockton 580 0.73 6.95 4.83 19.14 12.59 34.91 33.62 39.00 48.97 3.00 2.55 2.20 2.73 3.36
Vallejo-Fairfield 780 0.99 2.16 2.56 21.22 16.79 46.30 46.54 30.29 34.10 5.23 9.84 4.79 5.33 4.81
Yuba City 542 0.68 NA NA 26.73 21.77 46.64 51.66 26.63 26.57 11.24 NA 8.78 12.24 9.54
CA nonMSA 3,121 3.94 NA NA 15.08 19.51 65.75 67.29 19.17 13.20 11.53 NA 16.03 10.84 6.68
* Based on 2011 Peer Small Business Data – US and PR. ** Small loans to businesses originated and purchased in the MA/AA as a percentage of all small loans to businesses originated and purchased in the rated area. *** Source Data - Dun and Bradstreet (2011).
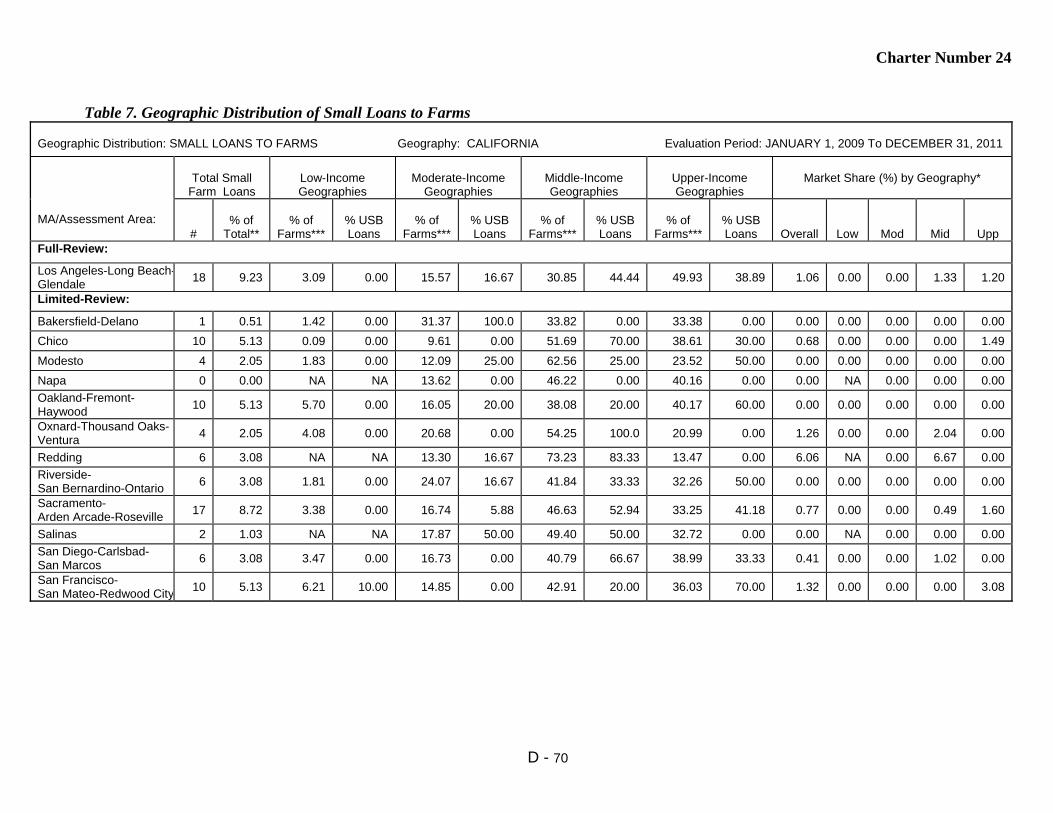
Charter Number 24
D - 70
Table 7. Geographic Distribution of Small Loans to Farms
Geographic Distribution: SMALL LOANS TO FARMS Geography: CALIFORNIA Evaluation Period: JANUARY 1, 2009 To DECEMBER 31, 2011
MA/Assessment Area:
Total Small
Farm Loans
Low-Income Geographies
Moderate-Income
Geographies
Middle-Income Geographies
Upper-Income Geographies
Market Share (%) by Geography*
#
% of
Total**
% of
Farms***
% USB Loans
% of
Farms***
% USB Loans
% of
Farms***
% USB Loans
% of
Farms***
% USB Loans
Overall
Low
Mod
Mid
Upp
Full-Review:
Los Angeles-Long Beach-Glendale
18 9.23 3.09 0.00 15.57 16.67 30.85 44.44 49.93 38.89 1.06 0.00 0.00 1.33 1.20
Limited-Review:
Bakersfield-Delano 1 0.51 1.42 0.00 31.37 100.0 33.82 0.00 33.38 0.00 0.00 0.00 0.00 0.00 0.00
Chico 10 5.13 0.09 0.00 9.61 0.00 51.69 70.00 38.61 30.00 0.68 0.00 0.00 0.00 1.49
Modesto 4 2.05 1.83 0.00 12.09 25.00 62.56 25.00 23.52 50.00 0.00 0.00 0.00 0.00 0.00
Napa 0 0.00 NA NA 13.62 0.00 46.22 0.00 40.16 0.00 0.00 NA 0.00 0.00 0.00
Oakland-Fremont- Haywood
10 5.13 5.70 0.00 16.05 20.00 38.08 20.00 40.17 60.00 0.00 0.00 0.00 0.00 0.00
Oxnard-Thousand Oaks- Ventura
4 2.05 4.08 0.00 20.68 0.00 54.25 100.0 20.99 0.00 1.26 0.00 0.00 2.04 0.00
Redding 6 3.08 NA NA 13.30 16.67 73.23 83.33 13.47 0.00 6.06 NA 0.00 6.67 0.00
Riverside- San Bernardino-Ontario
6 3.08 1.81 0.00 24.07 16.67 41.84 33.33 32.26 50.00 0.00 0.00 0.00 0.00 0.00
Sacramento- Arden Arcade-Roseville
17 8.72 3.38 0.00 16.74 5.88 46.63 52.94 33.25 41.18 0.77 0.00 0.00 0.49 1.60
Salinas 2 1.03 NA NA 17.87 50.00 49.40 50.00 32.72 0.00 0.00 NA 0.00 0.00 0.00
San Diego-Carlsbad- San Marcos
6 3.08 3.47 0.00 16.73 0.00 40.79 66.67 38.99 33.33 0.41 0.00 0.00 1.02 0.00
San Francisco- San Mateo-Redwood City
10 5.13 6.21 10.00 14.85 0.00 42.91 20.00 36.03 70.00 1.32 0.00 0.00 0.00 3.08
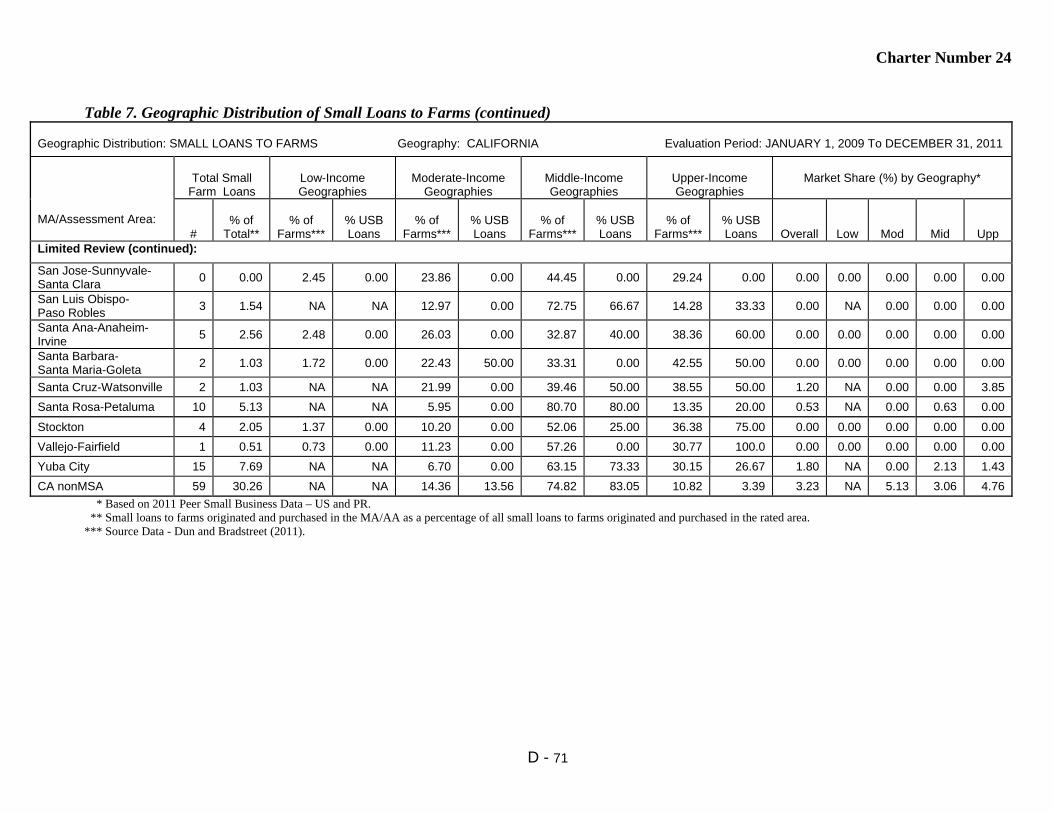
Charter Number 24
D - 71
Table 7. Geographic Distribution of Small Loans to Farms (continued)
Geographic Distribution: SMALL LOANS TO FARMS Geography: CALIFORNIA Evaluation Period: JANUARY 1, 2009 To DECEMBER 31, 2011
MA/Assessment Area:
Total Small
Farm Loans
Low-Income Geographies
Moderate-Income
Geographies
Middle-Income Geographies
Upper-Income Geographies
Market Share (%) by Geography*
#
% of
Total**
% of
Farms***
% USB Loans
% of
Farms***
% USB Loans
% of
Farms***
% USB Loans
% of
Farms***
% USB Loans
Overall
Low
Mod
Mid
Upp
Limited Review (continued):
San Jose-Sunnyvale- Santa Clara
0 0.00 2.45 0.00 23.86 0.00 44.45 0.00 29.24 0.00 0.00 0.00 0.00 0.00 0.00
San Luis Obispo- Paso Robles
3 1.54 NA NA 12.97 0.00 72.75 66.67 14.28 33.33 0.00 NA 0.00 0.00 0.00
Santa Ana-Anaheim- Irvine
5 2.56 2.48 0.00 26.03 0.00 32.87 40.00 38.36 60.00 0.00 0.00 0.00 0.00 0.00
Santa Barbara- Santa Maria-Goleta
2 1.03 1.72 0.00 22.43 50.00 33.31 0.00 42.55 50.00 0.00 0.00 0.00 0.00 0.00
Santa Cruz-Watsonville 2 1.03 NA NA 21.99 0.00 39.46 50.00 38.55 50.00 1.20 NA 0.00 0.00 3.85
Santa Rosa-Petaluma 10 5.13 NA NA 5.95 0.00 80.70 80.00 13.35 20.00 0.53 NA 0.00 0.63 0.00
Stockton 4 2.05 1.37 0.00 10.20 0.00 52.06 25.00 36.38 75.00 0.00 0.00 0.00 0.00 0.00
Vallejo-Fairfield 1 0.51 0.73 0.00 11.23 0.00 57.26 0.00 30.77 100.0 0.00 0.00 0.00 0.00 0.00
Yuba City 15 7.69 NA NA 6.70 0.00 63.15 73.33 30.15 26.67 1.80 NA 0.00 2.13 1.43
CA nonMSA 59 30.26 NA NA 14.36 13.56 74.82 83.05 10.82 3.39 3.23 NA 5.13 3.06 4.76
* Based on 2011 Peer Small Business Data – US and PR. ** Small loans to farms originated and purchased in the MA/AA as a percentage of all small loans to farms originated and purchased in the rated area. *** Source Data - Dun and Bradstreet (2011).
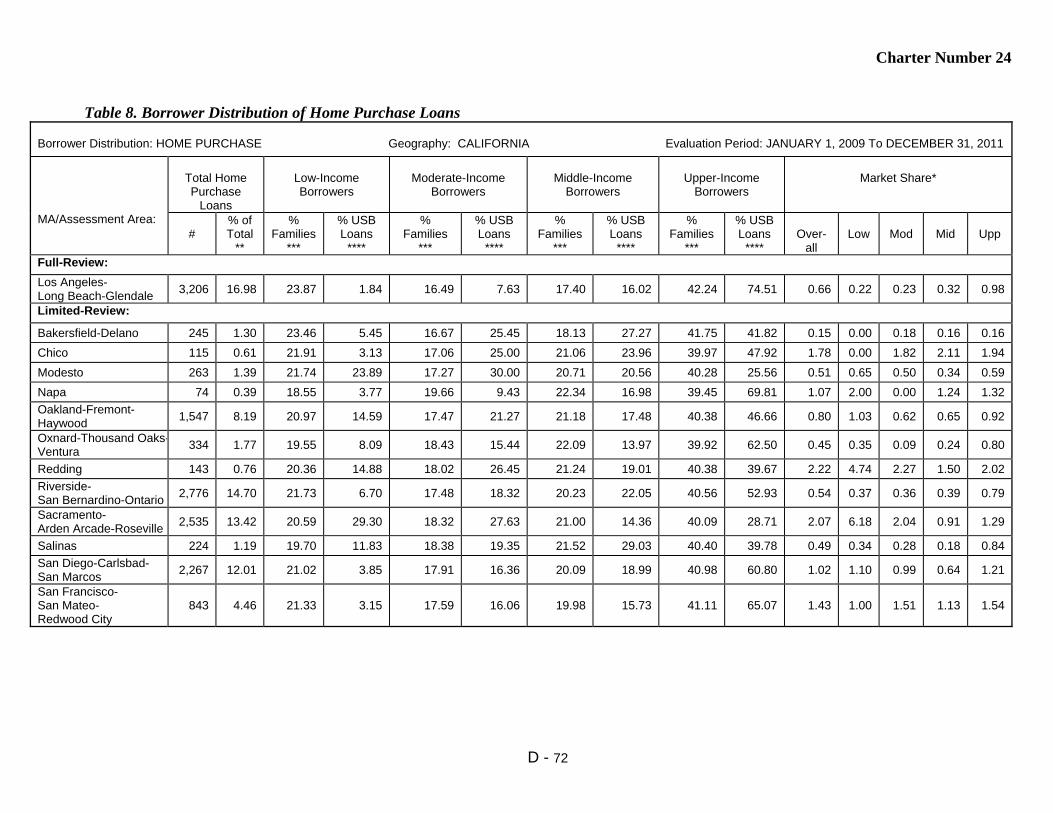
Charter Number 24
D - 72
Table 8. Borrower Distribution of Home Purchase Loans
Borrower Distribution: HOME PURCHASE Geography: CALIFORNIA Evaluation Period: JANUARY 1, 2009 To DECEMBER 31, 2011
MA/Assessment Area:
Total Home Purchase
Loans
Low-Income Borrowers
Moderate-Income
Borrowers
Middle-Income
Borrowers
Upper-Income
Borrowers
Market Share*
#
% of Total
**
% Families
***
% USB Loans
****
% Families
***
% USB Loans
****
% Families
***
% USB Loans
****
% Families
***
% USB Loans
****
Over-
all
Low
Mod
Mid
Upp
Full-Review:
Los Angeles- Long Beach-Glendale
3,206 16.98 23.87 1.84 16.49 7.63 17.40 16.02 42.24 74.51 0.66 0.22 0.23 0.32 0.98
Limited-Review:
Bakersfield-Delano 245 1.30 23.46 5.45 16.67 25.45 18.13 27.27 41.75 41.82 0.15 0.00 0.18 0.16 0.16
Chico 115 0.61 21.91 3.13 17.06 25.00 21.06 23.96 39.97 47.92 1.78 0.00 1.82 2.11 1.94
Modesto 263 1.39 21.74 23.89 17.27 30.00 20.71 20.56 40.28 25.56 0.51 0.65 0.50 0.34 0.59
Napa 74 0.39 18.55 3.77 19.66 9.43 22.34 16.98 39.45 69.81 1.07 2.00 0.00 1.24 1.32
Oakland-Fremont- Haywood
1,547 8.19 20.97 14.59 17.47 21.27 21.18 17.48 40.38 46.66 0.80 1.03 0.62 0.65 0.92
Oxnard-Thousand Oaks-Ventura
334 1.77 19.55 8.09 18.43 15.44 22.09 13.97 39.92 62.50 0.45 0.35 0.09 0.24 0.80
Redding 143 0.76 20.36 14.88 18.02 26.45 21.24 19.01 40.38 39.67 2.22 4.74 2.27 1.50 2.02
Riverside- San Bernardino-Ontario
2,776 14.70 21.73 6.70 17.48 18.32 20.23 22.05 40.56 52.93 0.54 0.37 0.36 0.39 0.79
Sacramento- Arden Arcade-Roseville
2,535 13.42 20.59 29.30 18.32 27.63 21.00 14.36 40.09 28.71 2.07 6.18 2.04 0.91 1.29
Salinas 224 1.19 19.70 11.83 18.38 19.35 21.52 29.03 40.40 39.78 0.49 0.34 0.28 0.18 0.84
San Diego-Carlsbad- San Marcos
2,267 12.01 21.02 3.85 17.91 16.36 20.09 18.99 40.98 60.80 1.02 1.10 0.99 0.64 1.21
San Francisco- San Mateo- Redwood City
843 4.46 21.33 3.15 17.59 16.06 19.98 15.73 41.11 65.07 1.43 1.00 1.51 1.13 1.54

Charter Number 24
D - 73
Table 8. Borrower Distribution of Home Purchase Loans (continued)
Borrower Distribution: HOME PURCHASE Geography: CALIFORNIA Evaluation Period: JANUARY 1, 2009 To DECEMBER 31, 2011
MA/Assessment Area:
Total Home Purchase
Loans
Low-Income Borrowers
Moderate-Income
Borrowers
Middle-Income
Borrowers
Upper-Income
Borrowers
Market Share*
#
% of Total
**
% Families
***
% USB Loans
****
% Families
***
% USB Loans
****
% Families
***
% USB Loans
****
% Families
***
% USB Loans
****
Over-
all
Low
Mod
Mid
Upp
Limited Review (continued):
San Jose-Sunnyvale- Santa Clara
1,085 5.75 20.21 8.17 17.95 17.26 21.63 19.63 40.21 54.94 1.43 2.15 1.10 1.05 1.67
San Luis Obispo- Paso Robles
111 0.59 18.57 2.22 18.88 15.56 22.65 17.78 39.90 64.44 0.61 0.00 0.80 0.00 0.89
Santa Ana-Anaheim- Irvine
1,267 6.71 20.69 4.78 17.97 14.48 20.68 19.57 40.65 61.17 0.73 0.38 0.46 0.53 0.95
Santa Barbara- Santa Maria-Goleta
185 0.98 20.00 10.53 18.61 21.05 20.45 22.37 40.95 46.05 0.37 0.00 0.13 0.12 0.67
Santa Cruz-Watsonville 105 0.56 19.96 8.93 17.98 21.43 21.23 14.29 40.83 55.36 1.02 1.52 0.62 0.68 1.29
Santa Rosa-Petaluma 243 1.29 17.73 3.55 18.87 23.40 24.32 22.70 39.08 50.35 0.73 0.41 0.41 0.57 1.08
Stockton 302 1.60 22.77 21.99 16.48 31.41 19.80 17.28 40.95 29.32 0.40 0.63 0.45 0.26 0.37
Vallejo-Fairfield 282 1.49 19.26 15.22 18.51 23.91 23.45 26.09 38.79 34.78 0.47 0.68 0.34 0.50 0.49
Yuba City 120 0.64 20.84 20.00 18.18 31.43 20.53 21.43 40.46 27.14 1.00 2.54 0.92 0.49 0.91
CA nonMSA 611 3.24 20.57 6.59 17.73 16.09 21.49 22.09 40.20 55.23 2.59 4.77 3.01 1.90 2.55
Data shown includes only one to four-family and manufactured housing (property type 1 or 2). * Based on 2011 Peer Mortgage Data (USPR). ** Home purchase loans originated and purchased in the MA/AA as a percentage of all home purchase loans originated and purchased in the rated area. *** Percentage of Families is based on the 2000 Census information. **** As a percentage of loans with borrower income information available. No information was available for 42.7% of loans originated and purchased by the bank.
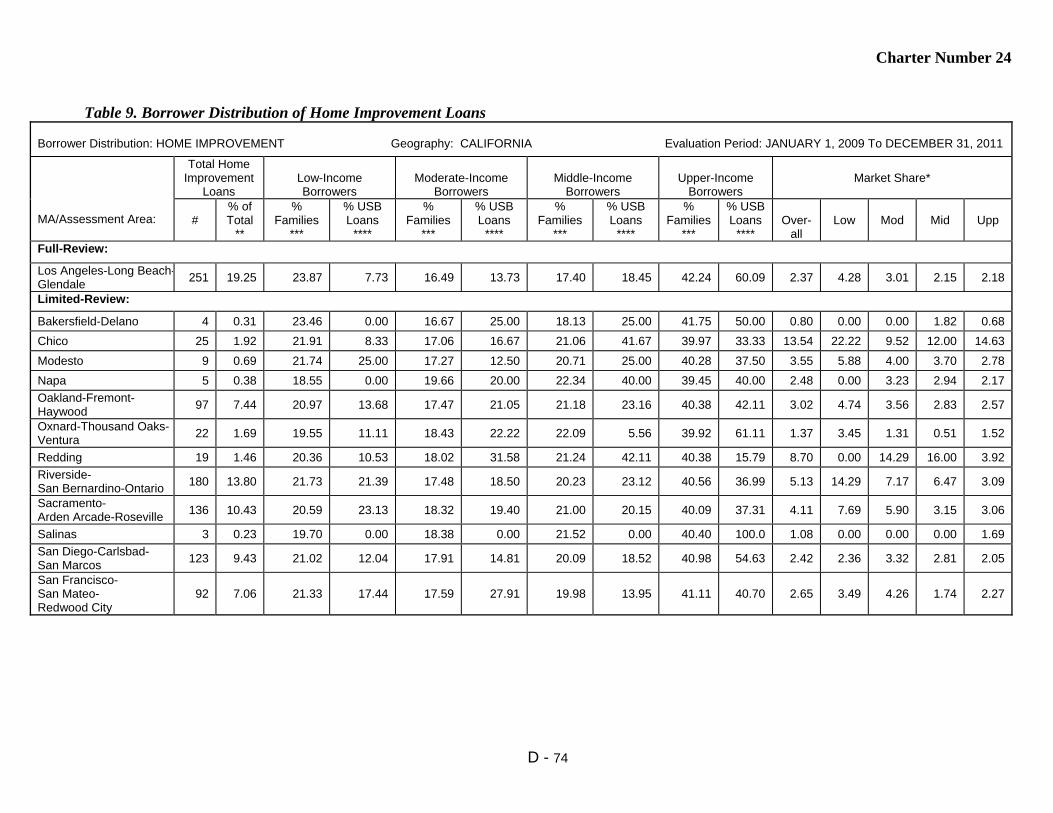
Charter Number 24
D - 74
Table 9. Borrower Distribution of Home Improvement Loans
Borrower Distribution: HOME IMPROVEMENT Geography: CALIFORNIA Evaluation Period: JANUARY 1, 2009 To DECEMBER 31, 2011
MA/Assessment Area:
Total Home Improvement
Loans
Low-Income Borrowers
Moderate-Income
Borrowers
Middle-Income
Borrowers
Upper-Income
Borrowers
Market Share*
#
% of Total
**
% Families
***
% USB Loans
****
% Families
***
% USB Loans
****
% Families
***
% USB Loans
****
% Families
***
% USB Loans
****
Over-
all
Low
Mod
Mid
Upp
Full-Review:
Los Angeles-Long Beach-Glendale
251 19.25 23.87 7.73 16.49 13.73 17.40 18.45 42.24 60.09 2.37 4.28 3.01 2.15 2.18
Limited-Review:
Bakersfield-Delano 4 0.31 23.46 0.00 16.67 25.00 18.13 25.00 41.75 50.00 0.80 0.00 0.00 1.82 0.68
Chico 25 1.92 21.91 8.33 17.06 16.67 21.06 41.67 39.97 33.33 13.54 22.22 9.52 12.00 14.63
Modesto 9 0.69 21.74 25.00 17.27 12.50 20.71 25.00 40.28 37.50 3.55 5.88 4.00 3.70 2.78
Napa 5 0.38 18.55 0.00 19.66 20.00 22.34 40.00 39.45 40.00 2.48 0.00 3.23 2.94 2.17
Oakland-Fremont- Haywood
97 7.44 20.97 13.68 17.47 21.05 21.18 23.16 40.38 42.11 3.02 4.74 3.56 2.83 2.57
Oxnard-Thousand Oaks- Ventura
22 1.69 19.55 11.11 18.43 22.22 22.09 5.56 39.92 61.11 1.37 3.45 1.31 0.51 1.52
Redding 19 1.46 20.36 10.53 18.02 31.58 21.24 42.11 40.38 15.79 8.70 0.00 14.29 16.00 3.92
Riverside- San Bernardino-Ontario
180 13.80 21.73 21.39 17.48 18.50 20.23 23.12 40.56 36.99 5.13 14.29 7.17 6.47 3.09
Sacramento- Arden Arcade-Roseville
136 10.43 20.59 23.13 18.32 19.40 21.00 20.15 40.09 37.31 4.11 7.69 5.90 3.15 3.06
Salinas 3 0.23 19.70 0.00 18.38 0.00 21.52 0.00 40.40 100.0 1.08 0.00 0.00 0.00 1.69
San Diego-Carlsbad- San Marcos
123 9.43 21.02 12.04 17.91 14.81 20.09 18.52 40.98 54.63 2.42 2.36 3.32 2.81 2.05
San Francisco- San Mateo- Redwood City
92 7.06 21.33 17.44 17.59 27.91 19.98 13.95 41.11 40.70 2.65 3.49 4.26 1.74 2.27
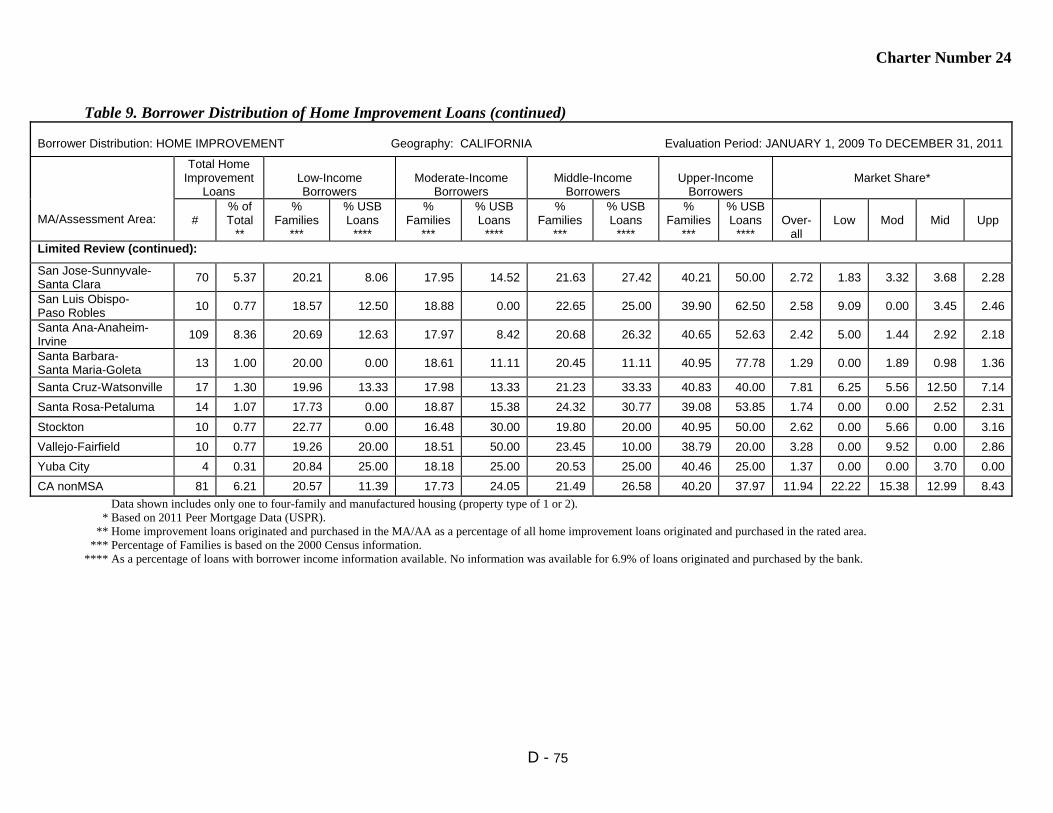
Charter Number 24
D - 75
Table 9. Borrower Distribution of Home Improvement Loans (continued)
Borrower Distribution: HOME IMPROVEMENT Geography: CALIFORNIA Evaluation Period: JANUARY 1, 2009 To DECEMBER 31, 2011
MA/Assessment Area:
Total Home Improvement
Loans
Low-Income Borrowers
Moderate-Income
Borrowers
Middle-Income
Borrowers
Upper-Income
Borrowers
Market Share*
#
% of Total
**
% Families
***
% USB Loans
****
% Families
***
% USB Loans
****
% Families
***
% USB Loans
****
% Families
***
% USB Loans
****
Over-
all
Low
Mod
Mid
Upp
Limited Review (continued):
San Jose-Sunnyvale- Santa Clara
70 5.37 20.21 8.06 17.95 14.52 21.63 27.42 40.21 50.00 2.72 1.83 3.32 3.68 2.28
San Luis Obispo- Paso Robles
10 0.77 18.57 12.50 18.88 0.00 22.65 25.00 39.90 62.50 2.58 9.09 0.00 3.45 2.46
Santa Ana-Anaheim- Irvine
109 8.36 20.69 12.63 17.97 8.42 20.68 26.32 40.65 52.63 2.42 5.00 1.44 2.92 2.18
Santa Barbara- Santa Maria-Goleta
13 1.00 20.00 0.00 18.61 11.11 20.45 11.11 40.95 77.78 1.29 0.00 1.89 0.98 1.36
Santa Cruz-Watsonville 17 1.30 19.96 13.33 17.98 13.33 21.23 33.33 40.83 40.00 7.81 6.25 5.56 12.50 7.14
Santa Rosa-Petaluma 14 1.07 17.73 0.00 18.87 15.38 24.32 30.77 39.08 53.85 1.74 0.00 0.00 2.52 2.31
Stockton 10 0.77 22.77 0.00 16.48 30.00 19.80 20.00 40.95 50.00 2.62 0.00 5.66 0.00 3.16
Vallejo-Fairfield 10 0.77 19.26 20.00 18.51 50.00 23.45 10.00 38.79 20.00 3.28 0.00 9.52 0.00 2.86
Yuba City 4 0.31 20.84 25.00 18.18 25.00 20.53 25.00 40.46 25.00 1.37 0.00 0.00 3.70 0.00
CA nonMSA 81 6.21 20.57 11.39 17.73 24.05 21.49 26.58 40.20 37.97 11.94 22.22 15.38 12.99 8.43
Data shown includes only one to four-family and manufactured housing (property type of 1 or 2). * Based on 2011 Peer Mortgage Data (USPR). ** Home improvement loans originated and purchased in the MA/AA as a percentage of all home improvement loans originated and purchased in the rated area. *** Percentage of Families is based on the 2000 Census information. **** As a percentage of loans with borrower income information available. No information was available for 6.9% of loans originated and purchased by the bank.

Charter Number 24
D - 76
Table 10. Borrower Distribution of Home Mortgage Refinance Loans
Borrower Distribution: HOME MORTGAGE REFINANCE Geography: CALIFORNIA Evaluation Period: JANUARY 1, 2009 To DECEMBER 31, 2011
MA/Assessment Area:
Total Home Mortgage Refinance
Loans
Low-Income Borrowers
Moderate-Income Borrowers
Middle-Income Borrowers
Upper-Income Borrowers
Market Share*
#
% of Total
**
% Families
***
% USB Loans
****
% Families
***
% USB Loans
****
% Families
***
% USB Loans
****
% Families
***
% USB Loans
****
Over-
all
Low
Mod
Mid
Upp
Full-Review:
Los Angeles- Long Beach-Glendale
7,738 19.20 23.87 3.41 16.49 10.11 17.40 16.98 42.24 69.49 1.54 1.40 1.74 1.58 1.52
Limited-Review:
Bakersfield-Delano 234 0.58 23.46 4.00 16.67 10.00 18.13 14.00 41.75 72.00 0.75 0.54 1.46 0.86 0.64
Chico 395 0.98 21.91 5.65 17.06 20.24 21.06 20.54 39.97 53.57 4.33 5.30 7.18 3.53 3.91
Modesto 229 0.57 21.74 8.00 17.27 13.71 20.71 22.86 40.28 55.43 1.77 2.01 1.99 2.17 1.53
Napa 229 0.57 18.55 5.58 19.66 17.77 22.34 26.90 39.45 49.75 2.54 2.25 3.50 3.29 2.03
Oakland-Fremont- Haywood
3,649 9.06 20.97 6.56 17.47 12.90 21.18 22.41 40.38 58.14 1.60 2.83 1.77 1.67 1.45
Oxnard-Thousand Oaks-Ventura
1,023 2.54 19.55 5.36 18.43 11.76 22.09 23.81 39.92 59.08 1.33 1.44 1.22 1.34 1.34
Redding 425 1.05 20.36 4.24 18.02 15.82 21.24 29.66 40.38 50.28 4.86 2.72 5.41 6.37 4.35
Riverside- San Bernardino-Ontario
3,388 8.41 21.73 8.28 17.48 15.53 20.23 23.55 40.56 52.65 2.27 3.78 3.01 2.58 1.91
Sacramento- Arden Arcade-Roseville
3,169 7.86 20.59 9.09 18.32 16.21 21.00 22.43 40.09 52.26 2.53 4.44 2.72 2.61 2.23
Salinas 195 0.48 19.70 1.98 18.38 6.93 21.52 13.86 40.40 77.23 0.90 0.50 0.79 0.92 0.94
San Diego-Carlsbad- San Marcos
4,783 11.87 21.02 4.14 17.91 10.50 20.09 19.63 40.98 65.72 1.89 2.18 1.95 1.78 1.89
San Francisco- San Mateo- Redwood City
3,447 8.55 21.33 5.95 17.59 16.45 19.98 22.54 41.11 55.06 2.31 2.93 3.39 2.43 2.02
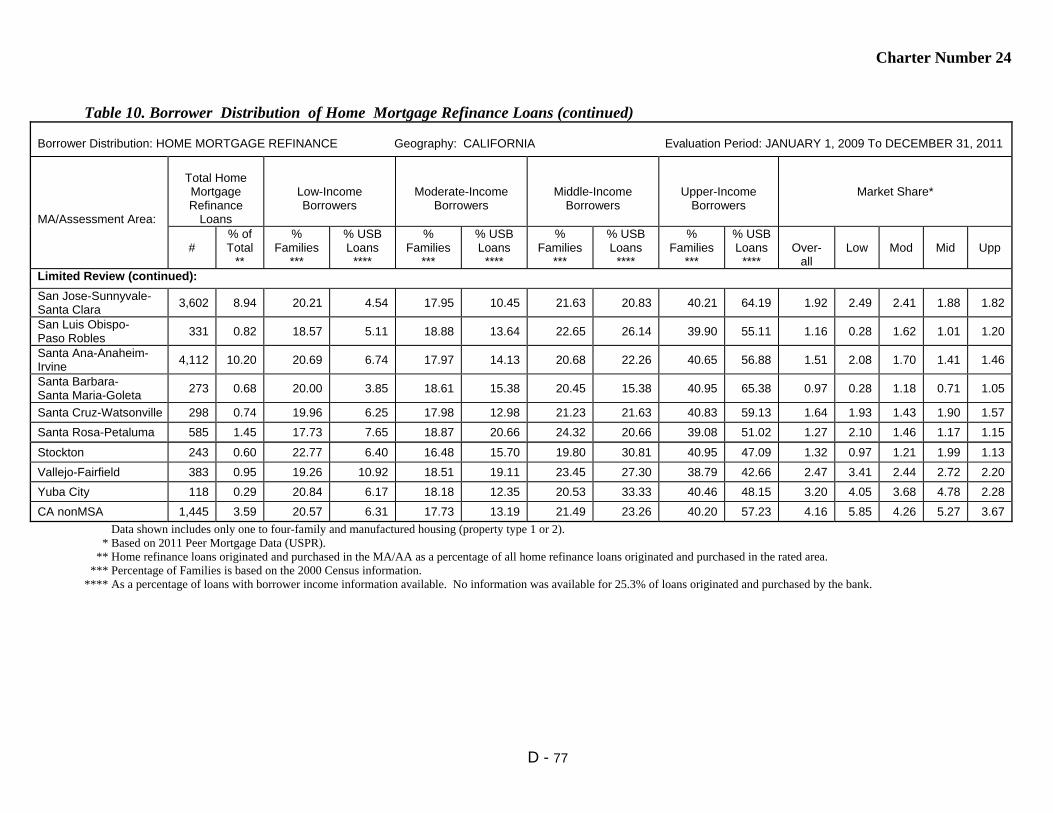
Charter Number 24
D - 77
Table 10. Borrower Distribution of Home Mortgage Refinance Loans (continued)
Borrower Distribution: HOME MORTGAGE REFINANCE Geography: CALIFORNIA Evaluation Period: JANUARY 1, 2009 To DECEMBER 31, 2011
MA/Assessment Area:
Total Home Mortgage Refinance
Loans
Low-Income Borrowers
Moderate-Income Borrowers
Middle-Income Borrowers
Upper-Income Borrowers
Market Share*
#
% of Total
**
% Families
***
% USB Loans
****
% Families
***
% USB Loans
****
% Families
***
% USB Loans
****
% Families
***
% USB Loans
****
Over-
all
Low
Mod
Mid
Upp
Limited Review (continued):
San Jose-Sunnyvale- Santa Clara
3,602 8.94 20.21 4.54 17.95 10.45 21.63 20.83 40.21 64.19 1.92 2.49 2.41 1.88 1.82
San Luis Obispo- Paso Robles
331 0.82 18.57 5.11 18.88 13.64 22.65 26.14 39.90 55.11 1.16 0.28 1.62 1.01 1.20
Santa Ana-Anaheim- Irvine
4,112 10.20 20.69 6.74 17.97 14.13 20.68 22.26 40.65 56.88 1.51 2.08 1.70 1.41 1.46
Santa Barbara- Santa Maria-Goleta
273 0.68 20.00 3.85 18.61 15.38 20.45 15.38 40.95 65.38 0.97 0.28 1.18 0.71 1.05
Santa Cruz-Watsonville 298 0.74 19.96 6.25 17.98 12.98 21.23 21.63 40.83 59.13 1.64 1.93 1.43 1.90 1.57
Santa Rosa-Petaluma 585 1.45 17.73 7.65 18.87 20.66 24.32 20.66 39.08 51.02 1.27 2.10 1.46 1.17 1.15
Stockton 243 0.60 22.77 6.40 16.48 15.70 19.80 30.81 40.95 47.09 1.32 0.97 1.21 1.99 1.13
Vallejo-Fairfield 383 0.95 19.26 10.92 18.51 19.11 23.45 27.30 38.79 42.66 2.47 3.41 2.44 2.72 2.20
Yuba City 118 0.29 20.84 6.17 18.18 12.35 20.53 33.33 40.46 48.15 3.20 4.05 3.68 4.78 2.28
CA nonMSA 1,445 3.59 20.57 6.31 17.73 13.19 21.49 23.26 40.20 57.23 4.16 5.85 4.26 5.27 3.67
Data shown includes only one to four-family and manufactured housing (property type 1 or 2). * Based on 2011 Peer Mortgage Data (USPR). ** Home refinance loans originated and purchased in the MA/AA as a percentage of all home refinance loans originated and purchased in the rated area. *** Percentage of Families is based on the 2000 Census information. **** As a percentage of loans with borrower income information available. No information was available for 25.3% of loans originated and purchased by the bank.
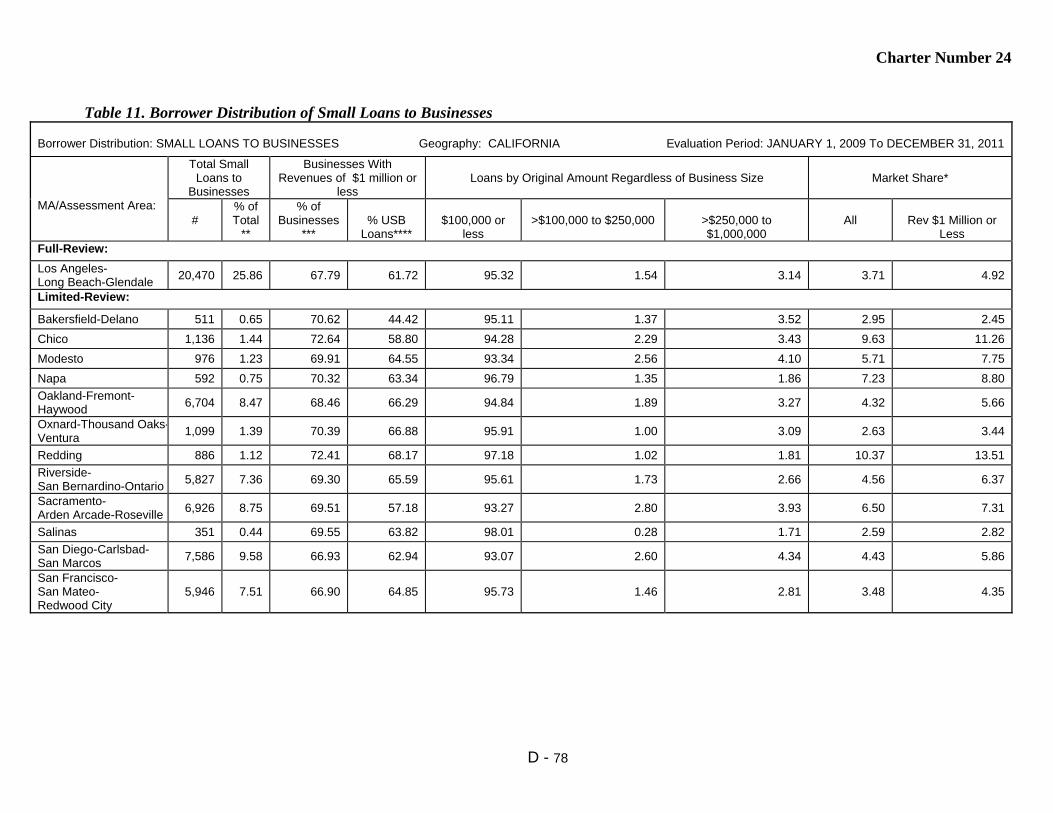
Charter Number 24
D - 78
Table 11. Borrower Distribution of Small Loans to Businesses
Borrower Distribution: SMALL LOANS TO BUSINESSES Geography: CALIFORNIA Evaluation Period: JANUARY 1, 2009 To DECEMBER 31, 2011
MA/Assessment Area:
Total Small Loans to
Businesses
Businesses With Revenues of $1 million or
less
Loans by Original Amount Regardless of Business Size
Market Share*
#
% of Total
**
% of Businesses
***
% USB
Loans****
$100,000 or
less
>$100,000 to $250,000
>$250,000 to $1,000,000
All
Rev $1 Million or
Less Full-Review:
Los Angeles- Long Beach-Glendale
20,470 25.86 67.79 61.72 95.32 1.54 3.14 3.71 4.92
Limited-Review:
Bakersfield-Delano 511 0.65 70.62 44.42 95.11 1.37 3.52 2.95 2.45
Chico 1,136 1.44 72.64 58.80 94.28 2.29 3.43 9.63 11.26
Modesto 976 1.23 69.91 64.55 93.34 2.56 4.10 5.71 7.75
Napa 592 0.75 70.32 63.34 96.79 1.35 1.86 7.23 8.80
Oakland-Fremont- Haywood
6,704 8.47 68.46 66.29 94.84 1.89 3.27 4.32 5.66
Oxnard-Thousand Oaks-Ventura
1,099 1.39 70.39 66.88 95.91 1.00 3.09 2.63 3.44
Redding 886 1.12 72.41 68.17 97.18 1.02 1.81 10.37 13.51
Riverside- San Bernardino-Ontario
5,827 7.36 69.30 65.59 95.61 1.73 2.66 4.56 6.37
Sacramento- Arden Arcade-Roseville
6,926 8.75 69.51 57.18 93.27 2.80 3.93 6.50 7.31
Salinas 351 0.44 69.55 63.82 98.01 0.28 1.71 2.59 2.82
San Diego-Carlsbad- San Marcos
7,586 9.58 66.93 62.94 93.07 2.60 4.34 4.43 5.86
San Francisco- San Mateo- Redwood City
5,946 7.51 66.90 64.85 95.73 1.46 2.81 3.48 4.35
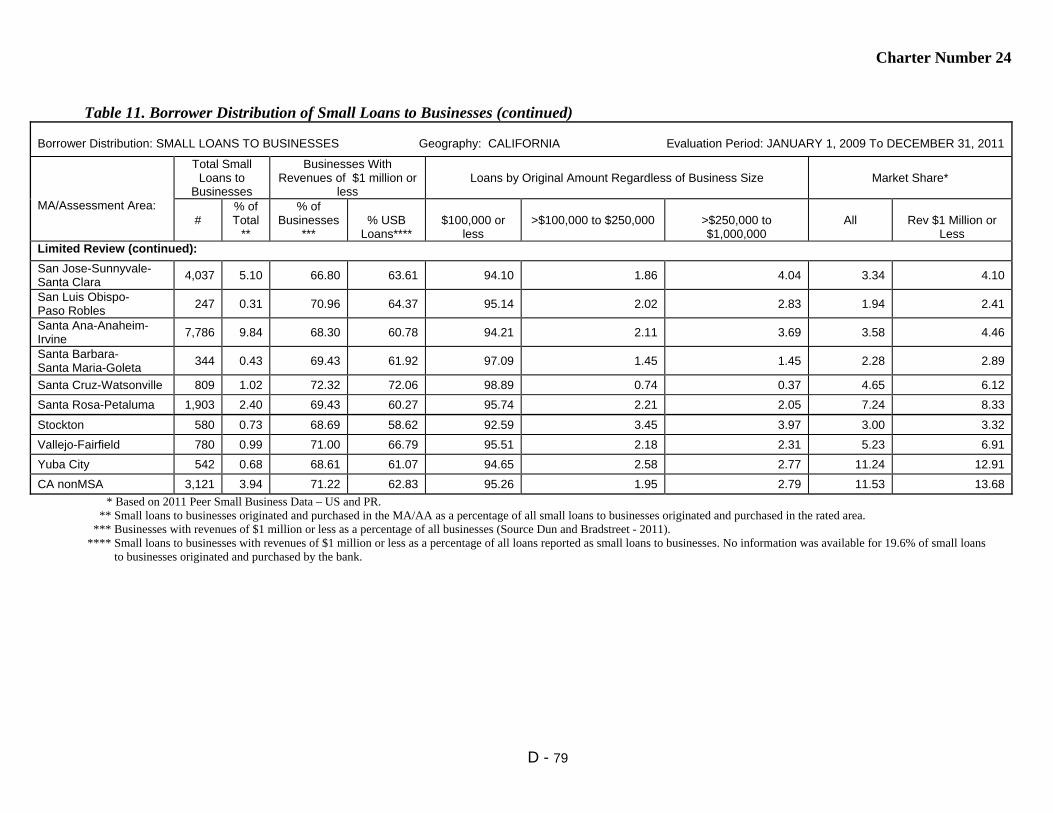
Charter Number 24
D - 79
Table 11. Borrower Distribution of Small Loans to Businesses (continued)
Borrower Distribution: SMALL LOANS TO BUSINESSES Geography: CALIFORNIA Evaluation Period: JANUARY 1, 2009 To DECEMBER 31, 2011
MA/Assessment Area:
Total Small Loans to
Businesses
Businesses With Revenues of $1 million or
less
Loans by Original Amount Regardless of Business Size
Market Share*
#
% of Total
**
% of Businesses
***
% USB
Loans****
$100,000 or
less
>$100,000 to $250,000
>$250,000 to $1,000,000
All
Rev $1 Million or
Less Limited Review (continued):
San Jose-Sunnyvale- Santa Clara
4,037 5.10 66.80 63.61 94.10 1.86 4.04 3.34 4.10
San Luis Obispo- Paso Robles
247 0.31 70.96 64.37 95.14 2.02 2.83 1.94 2.41
Santa Ana-Anaheim- Irvine
7,786 9.84 68.30 60.78 94.21 2.11 3.69 3.58 4.46
Santa Barbara- Santa Maria-Goleta
344 0.43 69.43 61.92 97.09 1.45 1.45 2.28 2.89
Santa Cruz-Watsonville 809 1.02 72.32 72.06 98.89 0.74 0.37 4.65 6.12
Santa Rosa-Petaluma 1,903 2.40 69.43 60.27 95.74 2.21 2.05 7.24 8.33
Stockton 580 0.73 68.69 58.62 92.59 3.45 3.97 3.00 3.32
Vallejo-Fairfield 780 0.99 71.00 66.79 95.51 2.18 2.31 5.23 6.91
Yuba City 542 0.68 68.61 61.07 94.65 2.58 2.77 11.24 12.91
CA nonMSA 3,121 3.94 71.22 62.83 95.26 1.95 2.79 11.53 13.68
* Based on 2011 Peer Small Business Data – US and PR. ** Small loans to businesses originated and purchased in the MA/AA as a percentage of all small loans to businesses originated and purchased in the rated area. *** Businesses with revenues of $1 million or less as a percentage of all businesses (Source Dun and Bradstreet - 2011). **** Small loans to businesses with revenues of $1 million or less as a percentage of all loans reported as small loans to businesses. No information was available for 19.6% of small loans to businesses originated and purchased by the bank.

Charter Number 24
D - 80
Table 12. Borrower Distribution of Small Loans to Farms
Borrower Distribution: SMALL LOANS TO FARMS Geography: CALIFORNIA Evaluation Period: JANUARY 1, 2009 To DECEMBER 31, 2011
MA/Assessment Area:
Total Small Loans to Farms
Farms With Revenues of $1 million or less
Loans by Original Amount Regardless of Farm Size
Market Share*
#
% of
Total**
% of
Farms***
% USB
Loans****
$100,000 or
less
>$100,000 to $250,000
>$250,000 to $500,000
All
Rev $1 Million or
Less Full-Review:
Los Angeles- Long Beach-Glendale
18 9.23 95.03 44.44 77.78 5.56 16.67 1.06 1.48
Limited-Review:
Bakersfield-Delano 1 0.51 88.58 0.00 100.0 0.00 0.00 0.00 0.00
Chico 10 5.13 95.76 80.00 90.00 10.00 0.00 0.68 1.03
Modesto 4 2.05 92.95 75.00 100.0 0.00 0.00 0.00 0.00
Napa 0 0.00 92.91 0.00 0.00 0.00 0.00 0.00 0.00
Oakland-Fremont- Haywood
10 5.13 94.67 50.00 90.00 10.00 0.00 0.00 0.00
Oxnard-Thousand Oaks-Ventura
4 2.05 90.79 50.00 25.00 75.00 0.00 1.26 0.00
Redding 6 3.08 96.13 66.67 100.0 0.00 0.00 6.06 5.00
Riverside- San Bernardino-Ontario
6 3.08 93.95 83.33 100.0 0.00 0.00 0.00 0.00
Sacramento- Arden Arcade-Roseville
17 8.72 95.31 70.59 70.59 29.41 0.00 0.77 1.11
Salinas 2 1.03 84.19 50.00 100.0 0.00 0.00 0.00 0.00
San Diego-Carlsbad- San Marcos
6 3.08 94.81 83.33 100.0 0.00 0.00 0.41 0.78
San Francisco- San Mateo- Redwood City
10 5.13 94.37 80.00 80.00 0.00 20.00 1.32 2.15
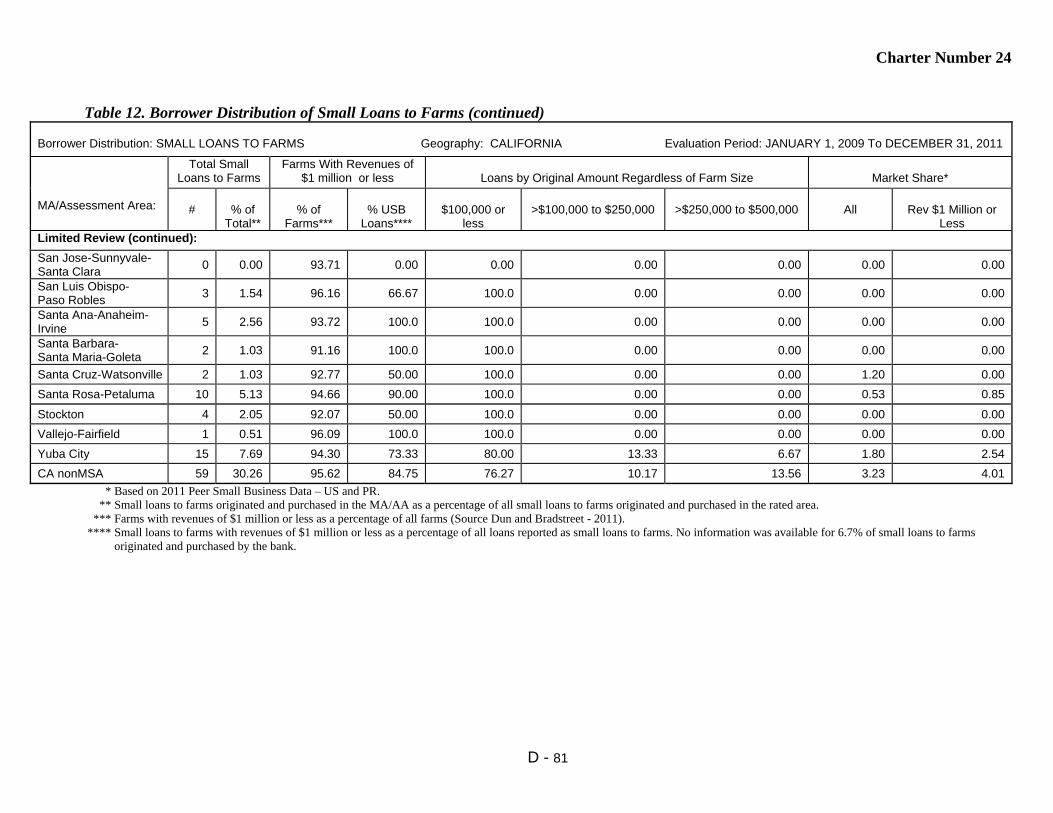
Charter Number 24
D - 81
Table 12. Borrower Distribution of Small Loans to Farms (continued)
Borrower Distribution: SMALL LOANS TO FARMS Geography: CALIFORNIA Evaluation Period: JANUARY 1, 2009 To DECEMBER 31, 2011
MA/Assessment Area:
Total Small Loans to Farms
Farms With Revenues of $1 million or less
Loans by Original Amount Regardless of Farm Size
Market Share*
#
% of
Total**
% of
Farms***
% USB
Loans****
$100,000 or
less
>$100,000 to $250,000
>$250,000 to $500,000
All
Rev $1 Million or
Less Limited Review (continued):
San Jose-Sunnyvale- Santa Clara
0 0.00 93.71 0.00 0.00 0.00 0.00 0.00 0.00
San Luis Obispo- Paso Robles
3 1.54 96.16 66.67 100.0 0.00 0.00 0.00 0.00
Santa Ana-Anaheim- Irvine
5 2.56 93.72 100.0 100.0 0.00 0.00 0.00 0.00
Santa Barbara- Santa Maria-Goleta
2 1.03 91.16 100.0 100.0 0.00 0.00 0.00 0.00
Santa Cruz-Watsonville 2 1.03 92.77 50.00 100.0 0.00 0.00 1.20 0.00
Santa Rosa-Petaluma 10 5.13 94.66 90.00 100.0 0.00 0.00 0.53 0.85
Stockton 4 2.05 92.07 50.00 100.0 0.00 0.00 0.00 0.00
Vallejo-Fairfield 1 0.51 96.09 100.0 100.0 0.00 0.00 0.00 0.00
Yuba City 15 7.69 94.30 73.33 80.00 13.33 6.67 1.80 2.54
CA nonMSA 59 30.26 95.62 84.75 76.27 10.17 13.56 3.23 4.01
* Based on 2011 Peer Small Business Data – US and PR. ** Small loans to farms originated and purchased in the MA/AA as a percentage of all small loans to farms originated and purchased in the rated area. *** Farms with revenues of $1 million or less as a percentage of all farms (Source Dun and Bradstreet - 2011). **** Small loans to farms with revenues of $1 million or less as a percentage of all loans reported as small loans to farms. No information was available for 6.7% of small loans to farms originated and purchased by the bank.

Charter Number 24
D - 82
Table 14. Qualified Investments
QUALIFIED INVESTMENTS Geography: CALIFORNIA Evaluation Period: JANUARY 1, 2009 To MARCH 31, 2012 MA/Assessment Area:
Prior Period Investments* Current Period Investments** Total Investments Unfunded Commitments***
# $(000’s) # $(000’s) # $(000’s) % of Total # $(000’s) Full-Review: Los Angeles-Long Beach- Glendale
33 26,020 653 156,427 686 182,447 17.09 14 43,615
Limited-Review:
Bakersfield-Delano 0 0 41 28,606 41 28,606 2.68 0 0
Chico 8 429 17 6,480 25 6,909 0.65 0 0
Modesto 11 396 41 3,440 52 3,836 0.36 0 0
Napa 4 126 6 1,682 10 1,808 0.17 0 0
Oakland-Fremont- Haywood
40 31,391 250 104,569 290 135,960 12.74 2 1,043
Oxnard-Thousand Oaks- Ventura
7 299 58 9,671 65 9,970 0.93 1 10,831
Redding 14 496 33 2,635 47 3,131 0.29 1 67
Riverside-San Bernardino -Ontario
14 17,917 260 65,513 274 83,431 7.82 2 13,371
Sacramento-Arden Arcade- Roseville
68 22,757 286 91,836 354 114,593 10.74 5 15,488
Salinas 2 34 61 18,162 63 18,196 1.70 3 14,230
San Diego-Carlsbad- San Marcos
44 12.462 337 107,365 381 119,827 11.23 8 11,901
San Francisco-San Mateo- Redwood City
35 17,309 249 100,029 284 117,338 10.99 5 1,184
San Jose-Sunnyvale- Santa Clara
3 13,037 55 24,773 58 37,809 3.54 0 0
San Luis Obispo- Paso Robles
2 1,793 15 2,824 17 4,616 0.43 0 0
Santa Ana-Anaheim-Irvine 16 13,753 257 65,512 273 79,265 7.43 1 15,827
Santa Barbara-Santa Maria- Goleta
0 0 15 2,466 15 2,466 0.23 0 0
Santa Cruz-Watsonville 6 6,509 13 2,929 19 9,439 0.88 0 0
Santa Rosa-Petaluma 10 876 37 25,902 47 26,778 2.51 0 0
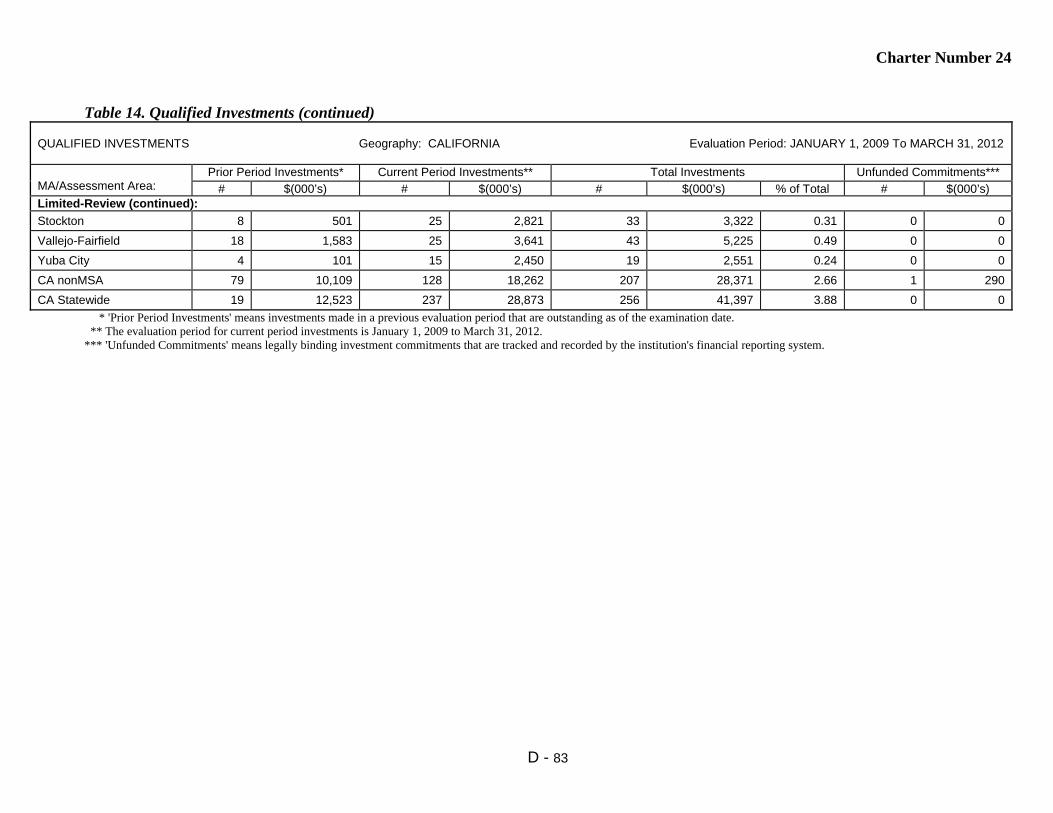
Charter Number 24
D - 83
Table 14. Qualified Investments (continued)
QUALIFIED INVESTMENTS Geography: CALIFORNIA Evaluation Period: JANUARY 1, 2009 To MARCH 31, 2012 MA/Assessment Area:
Prior Period Investments* Current Period Investments** Total Investments Unfunded Commitments***
# $(000’s) # $(000’s) # $(000’s) % of Total # $(000’s) Limited-Review (continued):
Stockton 8 501 25 2,821 33 3,322 0.31 0 0
Vallejo-Fairfield 18 1,583 25 3,641 43 5,225 0.49 0 0
Yuba City 4 101 15 2,450 19 2,551 0.24 0 0
CA nonMSA 79 10,109 128 18,262 207 28,371 2.66 1 290
CA Statewide 19 12,523 237 28,873 256 41,397 3.88 0 0
* 'Prior Period Investments' means investments made in a previous evaluation period that are outstanding as of the examination date. ** The evaluation period for current period investments is January 1, 2009 to March 31, 2012. *** 'Unfunded Commitments' means legally binding investment commitments that are tracked and recorded by the institution's financial reporting system.
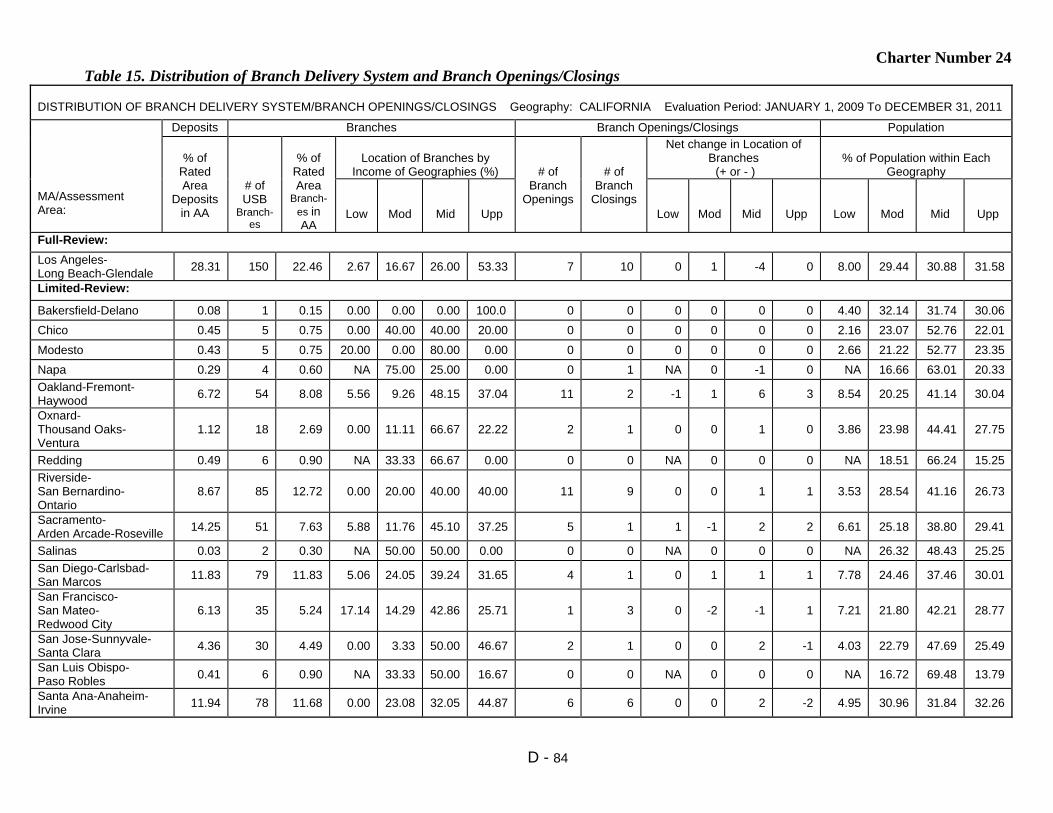
Charter Number 24
D - 84
Table 15. Distribution of Branch Delivery System and Branch Openings/Closings DISTRIBUTION OF BRANCH DELIVERY SYSTEM/BRANCH OPENINGS/CLOSINGS Geography: CALIFORNIA Evaluation Period: JANUARY 1, 2009 To DECEMBER 31, 2011
MA/Assessment Area:
Deposits Branches Branch Openings/Closings Population
% of
Rated Area
Deposits in AA
# of USB
Branch-es
% of
Rated Area
Branch-es in AA
Location of Branches by
Income of Geographies (%)
# of Branch
Openings
# of Branch
Closings
Net change in Location of Branches (+ or - )
% of Population within Each
Geography
Low
Mod
Mid
Upp
Low
Mod
Mid
Upp
Low
Mod
Mid
Upp
Full-Review:
Los Angeles- Long Beach-Glendale
28.31 150 22.46 2.67 16.67 26.00 53.33 7 10 0 1 -4 0 8.00 29.44 30.88 31.58
Limited-Review:
Bakersfield-Delano 0.08 1 0.15 0.00 0.00 0.00 100.0 0 0 0 0 0 0 4.40 32.14 31.74 30.06
Chico 0.45 5 0.75 0.00 40.00 40.00 20.00 0 0 0 0 0 0 2.16 23.07 52.76 22.01
Modesto 0.43 5 0.75 20.00 0.00 80.00 0.00 0 0 0 0 0 0 2.66 21.22 52.77 23.35
Napa 0.29 4 0.60 NA 75.00 25.00 0.00 0 1 NA 0 -1 0 NA 16.66 63.01 20.33
Oakland-Fremont- Haywood
6.72 54 8.08 5.56 9.26 48.15 37.04 11 2 -1 1 6 3 8.54 20.25 41.14 30.04
Oxnard- Thousand Oaks- Ventura
1.12 18 2.69 0.00 11.11 66.67 22.22 2 1 0 0 1 0 3.86 23.98 44.41 27.75
Redding 0.49 6 0.90 NA 33.33 66.67 0.00 0 0 NA 0 0 0 NA 18.51 66.24 15.25
Riverside- San Bernardino- Ontario
8.67 85 12.72 0.00 20.00 40.00 40.00 11 9 0 0 1 1 3.53 28.54 41.16 26.73
Sacramento- Arden Arcade-Roseville
14.25 51 7.63 5.88 11.76 45.10 37.25 5 1 1 -1 2 2 6.61 25.18 38.80 29.41
Salinas 0.03 2 0.30 NA 50.00 50.00 0.00 0 0 NA 0 0 0 NA 26.32 48.43 25.25
San Diego-Carlsbad- San Marcos
11.83 79 11.83 5.06 24.05 39.24 31.65 4 1 0 1 1 1 7.78 24.46 37.46 30.01
San Francisco- San Mateo- Redwood City
6.13 35 5.24 17.14 14.29 42.86 25.71 1 3 0 -2 -1 1 7.21 21.80 42.21 28.77
San Jose-Sunnyvale- Santa Clara
4.36 30 4.49 0.00 3.33 50.00 46.67 2 1 0 0 2 -1 4.03 22.79 47.69 25.49
San Luis Obispo- Paso Robles
0.41 6 0.90 NA 33.33 50.00 16.67 0 0 NA 0 0 0 NA 16.72 69.48 13.79
Santa Ana-Anaheim- Irvine
11.94 78 11.68 0.00 23.08 32.05 44.87 6 6 0 0 2 -2 4.95 30.96 31.84 32.26

Charter Number 24
D - 85
Table 15. Distribution of Branch Delivery System and Branch Openings/Closings (continued)
DISTRIBUTION OF BRANCH DELIVERY SYSTEM/BRANCH OPENINGS/CLOSINGS Geography: CALIFORNIA Evaluation Period: JANUARY 1, 2009 To DECEMBER 31, 2011
MA/Assessment Area:
Deposits Branches Branch Openings/Closings Population
% of
Rated Area
Deposits in AA
# of USB
Branches
% of
Rated Area
Branches in AA
Location of Branches by
Income of Geographies (%)
# of Branch
Openings
# of Branch
Closings
Net change in Location of Branches (+ or - )
% of Population within Each
Geography
Low
Mod
Mid
Upp
Low
Mod
Mid
Upp
Low
Mod
Mid
Upp
Limited Review (continued):
Santa Barbara- Santa Maria-Goleta
0.19 3 0.45 0.00 33.33 33.33 33.33 1 0 0 1 0 0 6.08 31.57 33.18 29.18
Santa Cruz- Watsonville
0.32 6 0.90 NA 16.67 33.33 50.00 2 0 NA 0 0 2 NA 31.25 39.43 29.32
Santa Rosa- Petaluma
0.67 10 1.50 NA 30.00 70.00 0.00 0 1 NA 0 -1 0 NA 14.38 69.79 15.83
Stockton 0.29 7 1.05 0.00 14.29 28.57 57.14 1 0 0 0 0 1 5.88 25.65 38.34 30.13
Vallejo-Fairfield 0.75 7 1.05 0.00 28.57 57.14 14.29 0 0 0 0 0 0 1.55 22.77 47.80 27.02
Yuba City 0.21 1 0.15 NA 100.0 0.00 0.00 0 0 NA 0 0 0 NA 25.62 51.20 23.18
CA nonMSA 2.08 25 3.74 NA 28.00 60.00 12.00 0 0 NA 0 0 0 NA 13.52 69.78 16.71
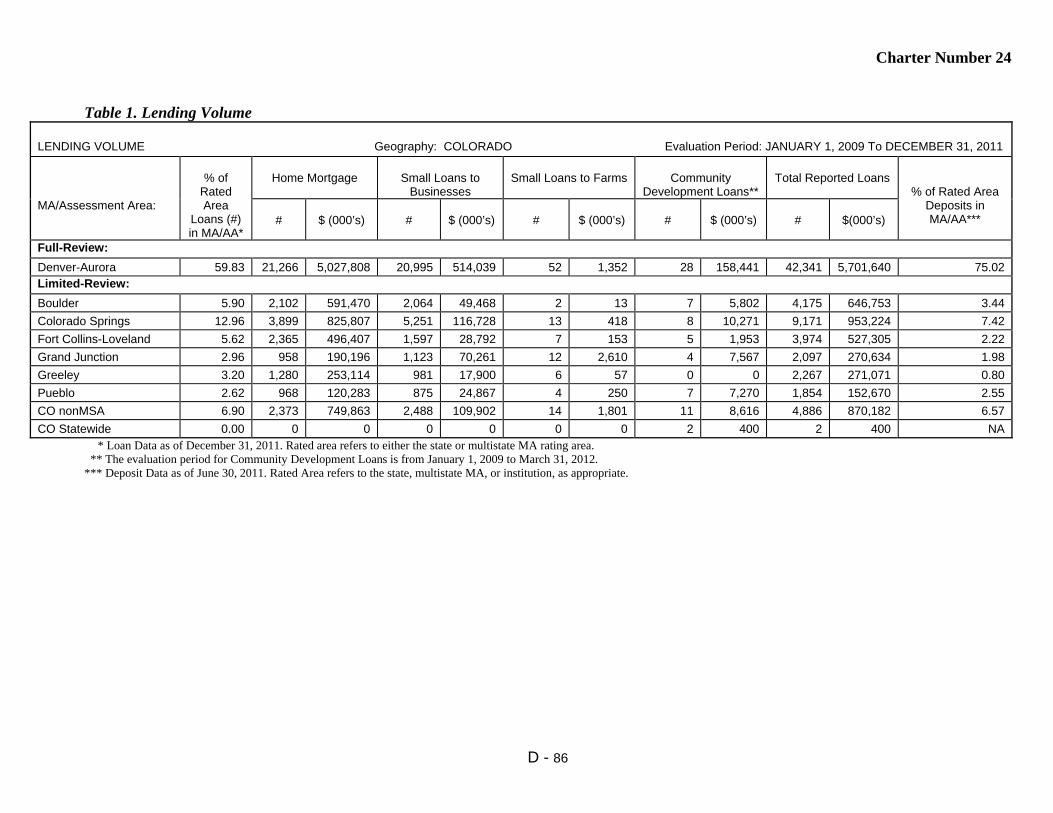
Charter Number 24
D - 86
Table 1. Lending Volume
LENDING VOLUME Geography: COLORADO Evaluation Period: JANUARY 1, 2009 To DECEMBER 31, 2011
MA/Assessment Area:
% of
Rated Area
Loans (#) in MA/AA*
Home Mortgage
Small Loans to
Businesses
Small Loans to Farms
Community
Development Loans**
Total Reported Loans
% of Rated Area Deposits in MA/AA***
#
$ (000’s)
#
$ (000’s)
#
$ (000’s)
#
$ (000’s)
#
$(000’s)
Full-Review:
Denver-Aurora 59.83 21,266 5,027,808 20,995 514,039 52 1,352 28 158,441 42,341 5,701,640 75.02 Limited-Review:
Boulder 5.90 2,102 591,470 2,064 49,468 2 13 7 5,802 4,175 646,753 3.44
Colorado Springs 12.96 3,899 825,807 5,251 116,728 13 418 8 10,271 9,171 953,224 7.42
Fort Collins-Loveland 5.62 2,365 496,407 1,597 28,792 7 153 5 1,953 3,974 527,305 2.22
Grand Junction 2.96 958 190,196 1,123 70,261 12 2,610 4 7,567 2,097 270,634 1.98
Greeley 3.20 1,280 253,114 981 17,900 6 57 0 0 2,267 271,071 0.80
Pueblo 2.62 968 120,283 875 24,867 4 250 7 7,270 1,854 152,670 2.55
CO nonMSA 6.90 2,373 749,863 2,488 109,902 14 1,801 11 8,616 4,886 870,182 6.57
CO Statewide 0.00 0 0 0 0 0 0 2 400 2 400 NA * Loan Data as of December 31, 2011. Rated area refers to either the state or multistate MA rating area. ** The evaluation period for Community Development Loans is from January 1, 2009 to March 31, 2012. *** Deposit Data as of June 30, 2011. Rated Area refers to the state, multistate MA, or institution, as appropriate.
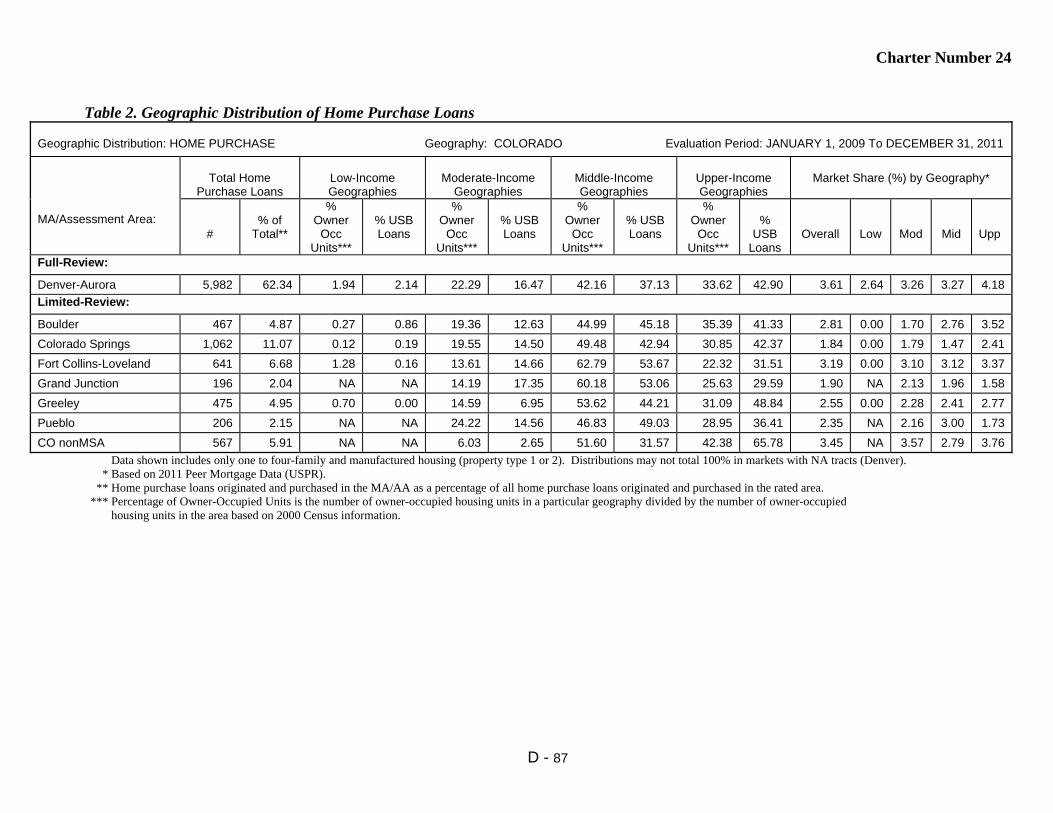
Charter Number 24
D - 87
Table 2. Geographic Distribution of Home Purchase Loans
Geographic Distribution: HOME PURCHASE Geography: COLORADO Evaluation Period: JANUARY 1, 2009 To DECEMBER 31, 2011
MA/Assessment Area:
Total Home
Purchase Loans
Low-Income Geographies
Moderate-Income
Geographies
Middle-Income Geographies
Upper-Income Geographies
Market Share (%) by Geography*
#
% of
Total**
% Owner
Occ Units***
% USB Loans
% Owner
Occ Units***
% USB Loans
% Owner
Occ Units***
% USB Loans
% Owner
Occ Units***
%
USB Loans
Overall
Low
Mod
Mid
Upp
Full-Review:
Denver-Aurora 5,982 62.34 1.94 2.14 22.29 16.47 42.16 37.13 33.62 42.90 3.61 2.64 3.26 3.27 4.18
Limited-Review:
Boulder 467 4.87 0.27 0.86 19.36 12.63 44.99 45.18 35.39 41.33 2.81 0.00 1.70 2.76 3.52
Colorado Springs 1,062 11.07 0.12 0.19 19.55 14.50 49.48 42.94 30.85 42.37 1.84 0.00 1.79 1.47 2.41
Fort Collins-Loveland 641 6.68 1.28 0.16 13.61 14.66 62.79 53.67 22.32 31.51 3.19 0.00 3.10 3.12 3.37
Grand Junction 196 2.04 NA NA 14.19 17.35 60.18 53.06 25.63 29.59 1.90 NA 2.13 1.96 1.58
Greeley 475 4.95 0.70 0.00 14.59 6.95 53.62 44.21 31.09 48.84 2.55 0.00 2.28 2.41 2.77
Pueblo 206 2.15 NA NA 24.22 14.56 46.83 49.03 28.95 36.41 2.35 NA 2.16 3.00 1.73
CO nonMSA 567 5.91 NA NA 6.03 2.65 51.60 31.57 42.38 65.78 3.45 NA 3.57 2.79 3.76
Data shown includes only one to four-family and manufactured housing (property type 1 or 2). Distributions may not total 100% in markets with NA tracts (Denver). * Based on 2011 Peer Mortgage Data (USPR). ** Home purchase loans originated and purchased in the MA/AA as a percentage of all home purchase loans originated and purchased in the rated area. *** Percentage of Owner-Occupied Units is the number of owner-occupied housing units in a particular geography divided by the number of owner-occupied housing units in the area based on 2000 Census information.
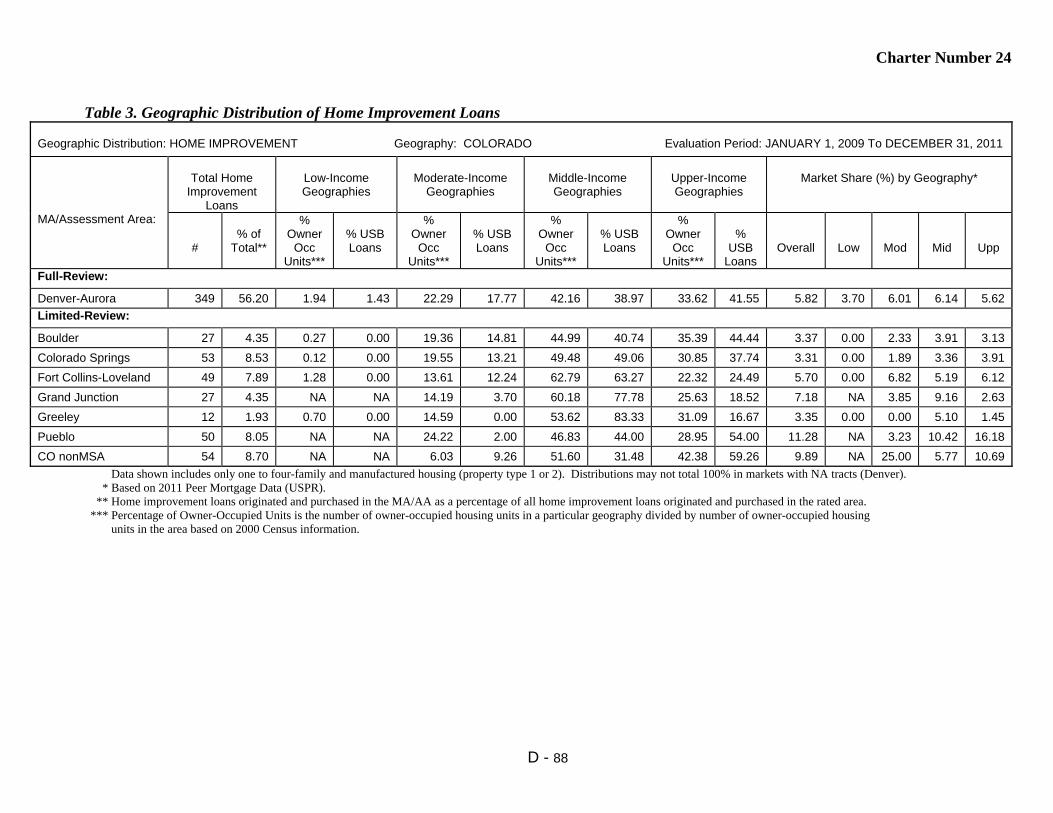
Charter Number 24
D - 88
Table 3. Geographic Distribution of Home Improvement Loans
Geographic Distribution: HOME IMPROVEMENT Geography: COLORADO Evaluation Period: JANUARY 1, 2009 To DECEMBER 31, 2011
MA/Assessment Area:
Total Home
Improvement Loans
Low-Income Geographies
Moderate-Income
Geographies
Middle-Income Geographies
Upper-Income Geographies
Market Share (%) by Geography*
#
% of
Total**
% Owner
Occ Units***
% USB Loans
% Owner
Occ Units***
% USB Loans
% Owner
Occ Units***
% USB Loans
% Owner
Occ Units***
%
USB Loans
Overall
Low
Mod
Mid
Upp
Full-Review:
Denver-Aurora 349 56.20 1.94 1.43 22.29 17.77 42.16 38.97 33.62 41.55 5.82 3.70 6.01 6.14 5.62
Limited-Review:
Boulder 27 4.35 0.27 0.00 19.36 14.81 44.99 40.74 35.39 44.44 3.37 0.00 2.33 3.91 3.13
Colorado Springs 53 8.53 0.12 0.00 19.55 13.21 49.48 49.06 30.85 37.74 3.31 0.00 1.89 3.36 3.91
Fort Collins-Loveland 49 7.89 1.28 0.00 13.61 12.24 62.79 63.27 22.32 24.49 5.70 0.00 6.82 5.19 6.12
Grand Junction 27 4.35 NA NA 14.19 3.70 60.18 77.78 25.63 18.52 7.18 NA 3.85 9.16 2.63
Greeley 12 1.93 0.70 0.00 14.59 0.00 53.62 83.33 31.09 16.67 3.35 0.00 0.00 5.10 1.45
Pueblo 50 8.05 NA NA 24.22 2.00 46.83 44.00 28.95 54.00 11.28 NA 3.23 10.42 16.18
CO nonMSA 54 8.70 NA NA 6.03 9.26 51.60 31.48 42.38 59.26 9.89 NA 25.00 5.77 10.69
Data shown includes only one to four-family and manufactured housing (property type 1 or 2). Distributions may not total 100% in markets with NA tracts (Denver). * Based on 2011 Peer Mortgage Data (USPR). ** Home improvement loans originated and purchased in the MA/AA as a percentage of all home improvement loans originated and purchased in the rated area. *** Percentage of Owner-Occupied Units is the number of owner-occupied housing units in a particular geography divided by number of owner-occupied housing units in the area based on 2000 Census information.

Charter Number 24
D - 89
Table 4. Geographic Distribution of Home Mortgage Refinance Loans
Geographic Distribution: HOME MORTGAGE REFINANCE Geography: COLORADO Evaluation Period: JANUARY 1, 2009 To DECEMBER 31, 2011
MA/Assessment Area:
Total Home Mortgage
Refinance Loans
Low-Income Geographies
Moderate-Income Geographies
Middle-Income Geographies
Upper-Income Geographies
Market Share (%) by Geography*
#
% of
Total**
% Owner
Occ Units***
% USB Loans
% Owner Occ
Units***
% USB Loans
% Owner Occ
Units***
% USB Loans
% Owner Occ
Units***
% USB Loans
Overall
Low
Mod
Mid
Upp
Full-Review:
Denver-Aurora 14,908 59.74 1.94 1.50 22.29 10.02 42.16 34.89 33.62 52.64 5.78 6.11 5.27 5.63 6.02
Limited-Review:
Boulder 1,605 6.43 0.27 0.12 19.36 12.71 44.99 45.11 35.39 42.06 3.72 2.63 3.85 3.72 3.69
Colorado Springs 2,781 11.14 0.12 0.11 19.55 8.27 49.48 43.19 30.85 48.44 3.62 0.00 2.81 3.52 3.90
Fort Collins-Loveland 1,673 6.70 1.28 0.00 13.61 8.43 62.79 56.66 22.32 34.91 4.24 0.00 3.36 4.39 4.29
Grand Junction 734 2.94 NA NA 14.19 11.31 60.18 53.41 25.63 35.29 4.09 NA 4.17 3.80 4.64
Greeley 793 3.18 0.70 0.00 14.59 2.65 53.62 45.02 31.09 52.33 3.54 0.00 2.07 3.30 3.88
Pueblo 707 2.83 NA NA 24.22 8.20 46.83 37.20 28.95 54.60 7.30 NA 7.76 6.53 7.84
CO nonMSA 1,752 7.02 NA NA 6.03 2.17 51.60 29.22 42.38 68.61 4.61 NA 3.43 4.26 4.80
Data shown includes only one to four-family and manufactured housing (property type 1 or 2). Distributions may not total 100% in markets with NA tracts (Denver). * Based on 2011 Peer Mortgage Data (USPR). ** Home mortgage refinance loans originated and purchased in the MA/AA as a percentage of all home mortgage refinance loans originated and purchased in the rated area. *** Percentage of Owner-Occupied Units is the number of owner-occupied housing units in a particular geography divided by number of owner-occupied housing units in the area based on 2000 Census information.

Charter Number 24
D - 90
Table 5. Geographic Distribution of Multifamily Loans
Geographic Distribution: MULTIFAMILY Geography: COLORADO Evaluation Period: JANUARY 1, 2009 To DECEMBER 31, 2011
MA/Assessment Area:
Total Multifamily
Loans
Low-Income Geographies
Moderate-Income
Geographies
Middle-Income Geographies
Upper-Income Geographies
Market Share (%) by Geography*
#
% of Total**
% of MF Units***
% USB Loans
% MF Units***
% USB Loans
% MF Units***
% USB Loans
% MF Units***
% USB Loans
Overall
Low
Mod
Mid
Upp
Full-Review:
Denver-Aurora 27 65.85 8.56 11.11 40.77 44.44 41.87 29.63 8.80 7.41 1.63 0.00 1.38 1.52 0.00
Limited-Review:
Boulder 3 7.32 5.73 0.00 38.53 66.67 42.03 33.33 13.71 0.00 0.00 0.00 0.00 0.00 0.00
Colorado Springs 3 7.32 0.76 0.00 43.58 100.0 44.09 0.00 11.57 0.00 0.00 0.00 0.00 0.00 0.00
Fort Collins-Loveland 2 4.88 3.99 0.00 39.68 0.00 46.38 100.0 9.95 0.00 0.00 0.00 0.00 0.00 0.00
Grand Junction 1 2.44 NA NA 21.50 100.0 52.56 0.00 25.94 0.00 10.00 NA 20.00 0.00 0.00
Greeley 0 0.00 9.66 0.00 49.21 0.00 27.61 0.00 13.52 0.00 0.00 0.00 0.00 0.00 0.00
Pueblo 5 12.20 NA NA 46.91 60.00 48.33 0.00 4.76 40.00 13.33 NA 14.29 0.00 50.00
CO nonMSA 0 0.00 NA NA 2.15 0.00 8.89 0.00 88.97 0.00 0.00 NA 0.00 0.00 0.00
Multifamily loan distribution includes Home Purchases, Home Improvement and Refinances. Distributions may not total 100% in markets with NA tracts (Denver). * Based on 2011 Peer Mortgage Data (USPR). ** Multifamily loans originated and purchased in the MA/AA as a percentage of all multifamily loans originated and purchased in the rated area. *** Percentage of multifamily units is the number of multifamily housing units in a particular geography divided by number of multifamily housing units in the area based on 2000 Census information.
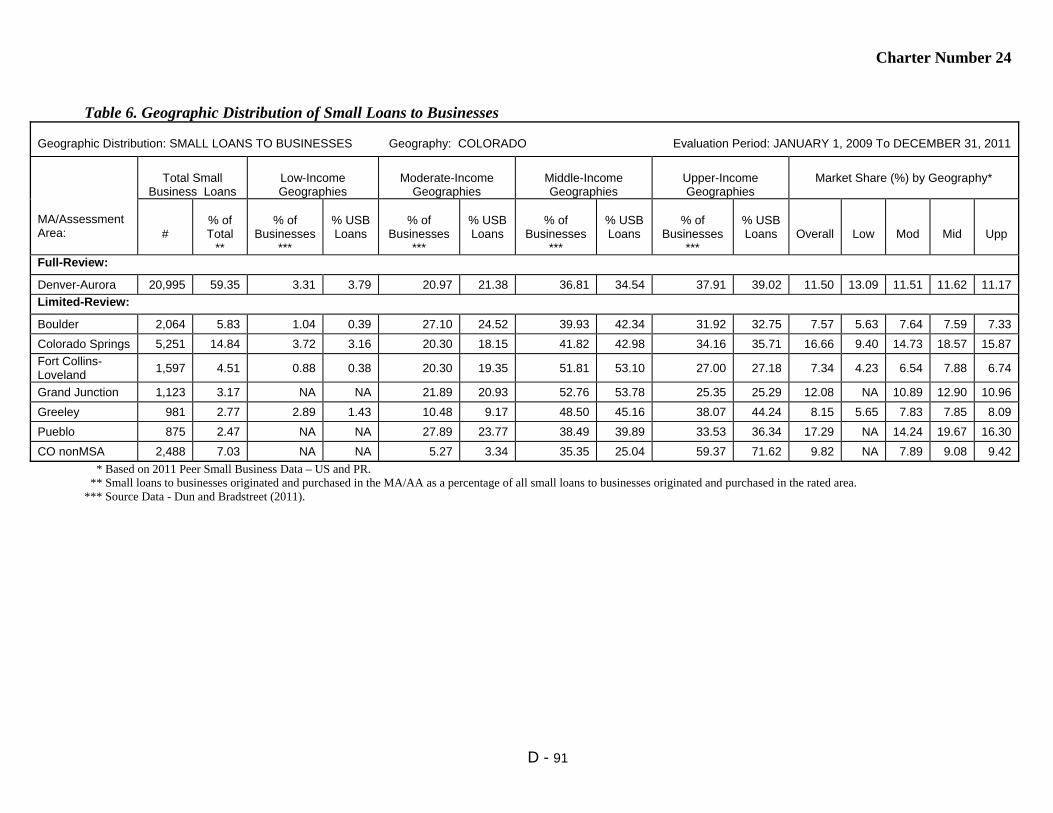
Charter Number 24
D - 91
Table 6. Geographic Distribution of Small Loans to Businesses
Geographic Distribution: SMALL LOANS TO BUSINESSES Geography: COLORADO Evaluation Period: JANUARY 1, 2009 To DECEMBER 31, 2011
MA/Assessment Area:
Total Small
Business Loans
Low-Income Geographies
Moderate-Income
Geographies
Middle-Income Geographies
Upper-Income Geographies
Market Share (%) by Geography*
#
% of Total
**
% of
Businesses ***
% USB Loans
% of
Businesses ***
% USB Loans
% of
Businesses ***
% USB Loans
% of
Businesses ***
% USB Loans
Overall
Low
Mod
Mid
Upp
Full-Review:
Denver-Aurora 20,995 59.35 3.31 3.79 20.97 21.38 36.81 34.54 37.91 39.02 11.50 13.09 11.51 11.62 11.17
Limited-Review:
Boulder 2,064 5.83 1.04 0.39 27.10 24.52 39.93 42.34 31.92 32.75 7.57 5.63 7.64 7.59 7.33
Colorado Springs 5,251 14.84 3.72 3.16 20.30 18.15 41.82 42.98 34.16 35.71 16.66 9.40 14.73 18.57 15.87
Fort Collins- Loveland
1,597 4.51 0.88 0.38 20.30 19.35 51.81 53.10 27.00 27.18 7.34 4.23 6.54 7.88 6.74
Grand Junction 1,123 3.17 NA NA 21.89 20.93 52.76 53.78 25.35 25.29 12.08 NA 10.89 12.90 10.96
Greeley 981 2.77 2.89 1.43 10.48 9.17 48.50 45.16 38.07 44.24 8.15 5.65 7.83 7.85 8.09
Pueblo 875 2.47 NA NA 27.89 23.77 38.49 39.89 33.53 36.34 17.29 NA 14.24 19.67 16.30
CO nonMSA 2,488 7.03 NA NA 5.27 3.34 35.35 25.04 59.37 71.62 9.82 NA 7.89 9.08 9.42
* Based on 2011 Peer Small Business Data – US and PR. ** Small loans to businesses originated and purchased in the MA/AA as a percentage of all small loans to businesses originated and purchased in the rated area. *** Source Data - Dun and Bradstreet (2011).
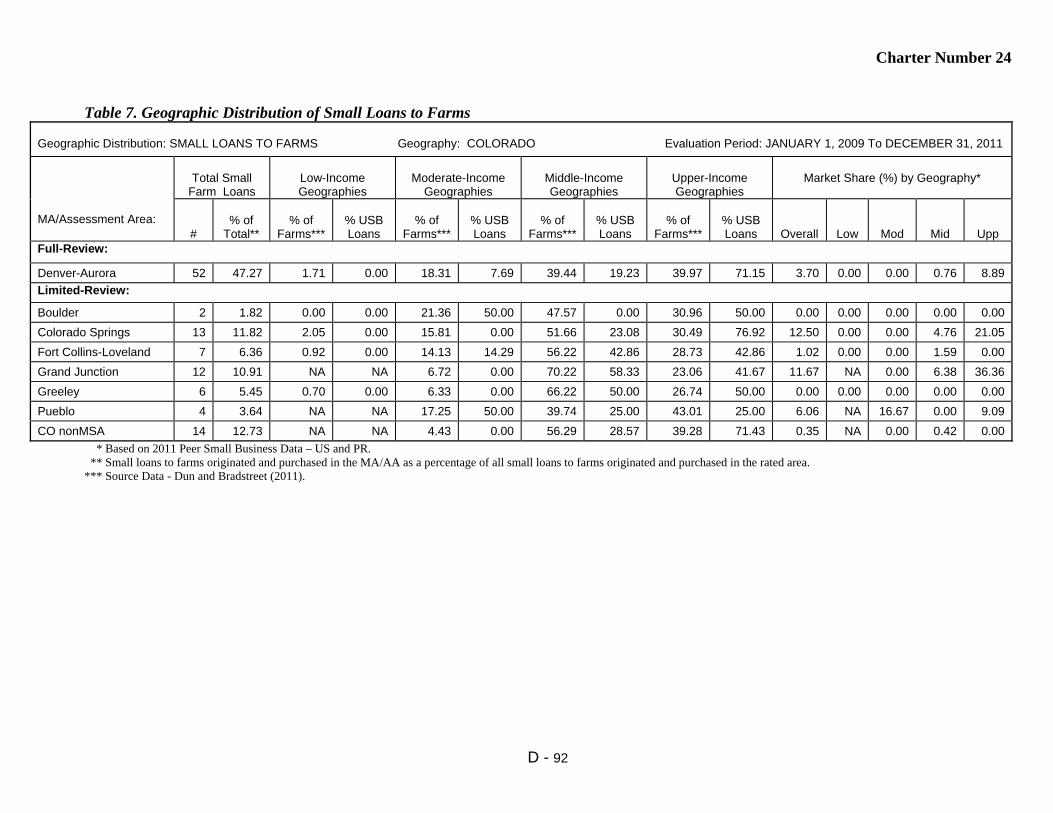
Charter Number 24
D - 92
Table 7. Geographic Distribution of Small Loans to Farms
Geographic Distribution: SMALL LOANS TO FARMS Geography: COLORADO Evaluation Period: JANUARY 1, 2009 To DECEMBER 31, 2011
MA/Assessment Area:
Total Small
Farm Loans
Low-Income Geographies
Moderate-Income
Geographies
Middle-Income Geographies
Upper-Income Geographies
Market Share (%) by Geography*
#
% of
Total**
% of
Farms***
% USB Loans
% of
Farms***
% USB Loans
% of
Farms***
% USB Loans
% of
Farms***
% USB Loans
Overall
Low
Mod
Mid
Upp
Full-Review:
Denver-Aurora 52 47.27 1.71 0.00 18.31 7.69 39.44 19.23 39.97 71.15 3.70 0.00 0.00 0.76 8.89
Limited-Review:
Boulder 2 1.82 0.00 0.00 21.36 50.00 47.57 0.00 30.96 50.00 0.00 0.00 0.00 0.00 0.00
Colorado Springs 13 11.82 2.05 0.00 15.81 0.00 51.66 23.08 30.49 76.92 12.50 0.00 0.00 4.76 21.05
Fort Collins-Loveland 7 6.36 0.92 0.00 14.13 14.29 56.22 42.86 28.73 42.86 1.02 0.00 0.00 1.59 0.00
Grand Junction 12 10.91 NA NA 6.72 0.00 70.22 58.33 23.06 41.67 11.67 NA 0.00 6.38 36.36
Greeley 6 5.45 0.70 0.00 6.33 0.00 66.22 50.00 26.74 50.00 0.00 0.00 0.00 0.00 0.00
Pueblo 4 3.64 NA NA 17.25 50.00 39.74 25.00 43.01 25.00 6.06 NA 16.67 0.00 9.09
CO nonMSA 14 12.73 NA NA 4.43 0.00 56.29 28.57 39.28 71.43 0.35 NA 0.00 0.42 0.00
* Based on 2011 Peer Small Business Data – US and PR. ** Small loans to farms originated and purchased in the MA/AA as a percentage of all small loans to farms originated and purchased in the rated area. *** Source Data - Dun and Bradstreet (2011).
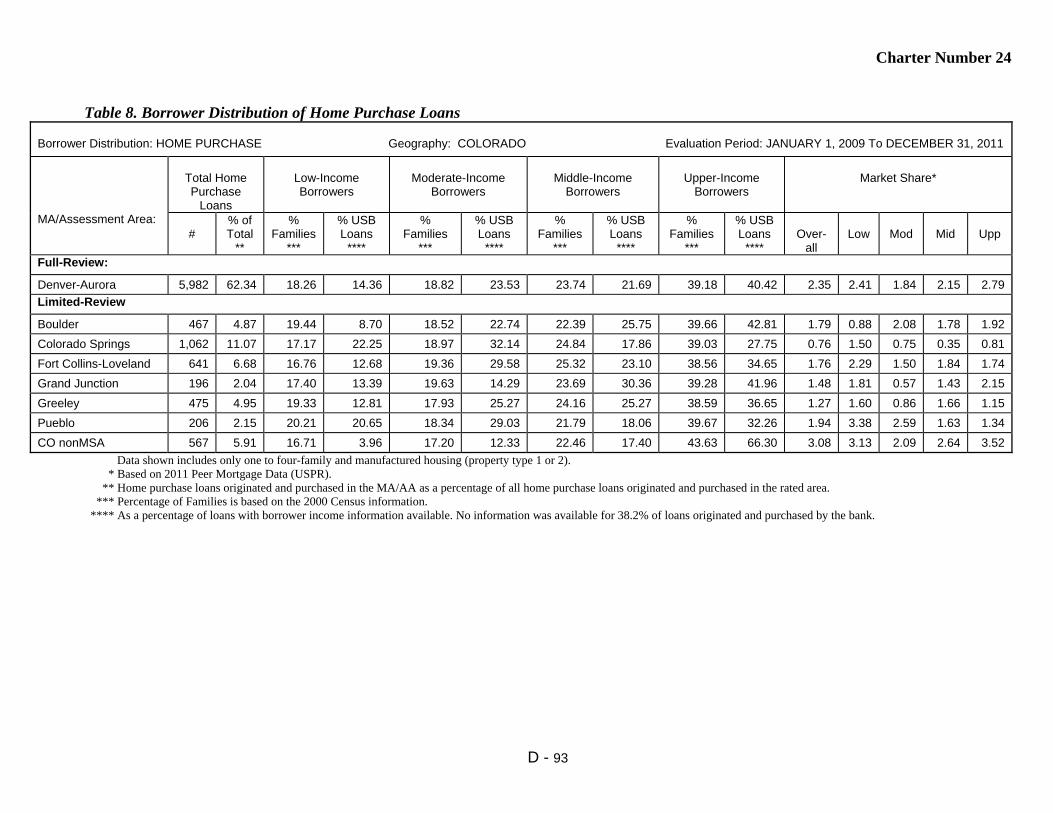
Charter Number 24
D - 93
Table 8. Borrower Distribution of Home Purchase Loans
Borrower Distribution: HOME PURCHASE Geography: COLORADO Evaluation Period: JANUARY 1, 2009 To DECEMBER 31, 2011
MA/Assessment Area:
Total Home Purchase
Loans
Low-Income Borrowers
Moderate-Income
Borrowers
Middle-Income
Borrowers
Upper-Income
Borrowers
Market Share*
#
% of Total
**
% Families
***
% USB Loans
****
% Families
***
% USB Loans
****
% Families
***
% USB Loans
****
% Families
***
% USB Loans
****
Over-
all
Low
Mod
Mid
Upp
Full-Review:
Denver-Aurora 5,982 62.34 18.26 14.36 18.82 23.53 23.74 21.69 39.18 40.42 2.35 2.41 1.84 2.15 2.79
Limited-Review
Boulder 467 4.87 19.44 8.70 18.52 22.74 22.39 25.75 39.66 42.81 1.79 0.88 2.08 1.78 1.92
Colorado Springs 1,062 11.07 17.17 22.25 18.97 32.14 24.84 17.86 39.03 27.75 0.76 1.50 0.75 0.35 0.81
Fort Collins-Loveland 641 6.68 16.76 12.68 19.36 29.58 25.32 23.10 38.56 34.65 1.76 2.29 1.50 1.84 1.74
Grand Junction 196 2.04 17.40 13.39 19.63 14.29 23.69 30.36 39.28 41.96 1.48 1.81 0.57 1.43 2.15
Greeley 475 4.95 19.33 12.81 17.93 25.27 24.16 25.27 38.59 36.65 1.27 1.60 0.86 1.66 1.15
Pueblo 206 2.15 20.21 20.65 18.34 29.03 21.79 18.06 39.67 32.26 1.94 3.38 2.59 1.63 1.34
CO nonMSA 567 5.91 16.71 3.96 17.20 12.33 22.46 17.40 43.63 66.30 3.08 3.13 2.09 2.64 3.52
Data shown includes only one to four-family and manufactured housing (property type 1 or 2). * Based on 2011 Peer Mortgage Data (USPR). ** Home purchase loans originated and purchased in the MA/AA as a percentage of all home purchase loans originated and purchased in the rated area. *** Percentage of Families is based on the 2000 Census information. **** As a percentage of loans with borrower income information available. No information was available for 38.2% of loans originated and purchased by the bank.

Charter Number 24
D - 94
Table 9. Borrower Distribution of Home Improvement Loans
Borrower Distribution: HOME IMPROVEMENT Geography: COLORADO Evaluation Period: JANUARY 1, 2009 To DECEMBER 31, 2011
MA/Assessment Area:
Total Home Improvement
Loans
Low-Income Borrowers
Moderate-Income
Borrowers
Middle-Income
Borrowers
Upper-Income
Borrowers
Market Share*
#
% of Total
**
% Families
***
% USB Loans
****
% Families
***
% USB Loans
****
% Families
***
% USB Loans
****
% Families
***
% USB Loans
****
Over-
all
Low
Mod
Mid
Upp
Full-Review:
Denver-Aurora 349 56.20 18.26 13.98 18.82 22.80 23.74 27.05 39.18 36.17 6.15 9.66 5.59 5.63 5.81
Limited-Review:
Boulder 27 4.35 19.44 10.00 18.52 0.00 22.39 25.00 39.66 65.00 3.29 4.00 0.00 1.41 6.25
Colorado Springs 53 8.53 17.17 15.09 18.97 26.42 24.84 32.08 39.03 26.42 3.44 1.47 5.70 4.41 2.02
Fort Collins-Loveland 49 7.89 16.76 20.45 19.36 15.91 25.32 18.18 38.56 45.45 6.14 5.56 6.35 3.85 7.14
Grand Junction 27 4.35 17.40 22.22 19.63 22.22 23.69 29.63 39.28 25.93 8.05 13.64 11.76 5.88 5.97
Greeley 12 1.93 19.33 10.00 17.93 20.00 24.16 50.00 38.59 20.00 2.84 0.00 2.56 6.82 1.33
Pueblo 50 8.05 20.21 6.00 18.34 16.00 21.79 26.00 39.67 52.00 12.09 5.88 12.50 13.04 12.64
CO nonMSA 54 8.70 16.71 10.42 17.20 18.75 22.46 29.17 43.63 41.67 10.28 23.81 9.68 11.86 7.75
Data shown includes only one to four-family and manufactured housing (property type of 1 or 2). * Based on 2011 Peer Mortgage Data (USPR). ** Home improvement loans originated and purchased in the MA/AA as a percentage of all home improvement loans originated and purchased in the rated area. *** Percentage of Families is based on the 2000 Census information. **** As a percentage of loans with borrower income information available. No information was available for 6.4% of loans originated and purchased by the bank.

Charter Number 24
D - 95
Table 10. Borrower Distribution of Home Mortgage Refinance Loans
Borrower Distribution: HOME MORTGAGE REFINANCE Geography: COLORADO Evaluation Period: JANUARY 1, 2009 To DECEMBER 31, 2011
MA/Assessment Area:
Total Home Mortgage Refinance
Loans
Low-Income Borrowers
Moderate-Income Borrowers
Middle-Income Borrowers
Upper-Income Borrowers
Market Share*
#
% of Total
**
% Families
***
% USB Loans
****
% Families
***
% USB Loans
****
% Families
***
% USB Loans
****
% Families
***
% USB Loans
****
Over-
all
Low
Mod
Mid
Upp
Full-Review:
Denver-Aurora 14,908 59.74 18.26 8.49 18.82 17.11 23.74 23.48 39.18 50.92 5.96 8.00 6.63 5.87 5.51
Limited-Review:
Boulder 1,605 6.43 19.44 9.12 18.52 16.45 22.39 26.38 39.66 48.05 3.51 3.38 3.32 3.85 3.42
Colorado Springs 2,781 11.14 17.17 9.58 18.97 18.94 24.84 22.48 39.03 49.01 3.44 3.89 4.30 2.70 3.45
Fort Collins-Loveland 1,673 6.70 16.76 8.84 19.36 18.70 25.32 26.23 38.56 46.23 3.54 4.04 3.54 3.16 3.67
Grand Junction 734 2.94 17.40 7.88 19.63 16.60 23.69 24.27 39.28 51.24 4.88 4.44 3.31 5.22 5.50
Greeley 793 3.18 19.33 6.70 17.93 14.94 24.16 25.10 38.59 53.26 3.37 3.93 3.21 3.29 3.40
Pueblo 707 2.83 20.21 8.11 18.34 18.92 21.79 22.42 39.67 50.56 9.04 15.19 9.29 7.22 9.07
CO nonMSA 1,752 7.02 16.71 3.11 17.20 9.48 22.46 16.34 43.63 71.07 4.83 4.61 5.09 4.78 4.82
Data shown includes only one to four-family and manufactured housing (property type 1 or 2). * Based on 2011 Peer Mortgage Data (USPR). ** Home refinance loans originated and purchased in the MA/AA as a percentage of all home refinance loans originated and purchased in the rated area. *** Percentage of Families is based on the 2000 Census information. **** As a percentage of loans with borrower income information available. No information was available for 29.2% of loans originated and purchased by the bank.

Charter Number 24
D - 96
Table 11. Borrower Distribution of Small Loans to Businesses
Borrower Distribution: SMALL LOANS TO BUSINESSES Geography: COLORADO Evaluation Period: JANUARY 1, 2009 To DECEMBER 31, 2011
MA/Assessment Area:
Total Small Loans to Businesses
Businesses With Revenues of $1 million or
less
Loans by Original Amount Regardless of Business Size
Market Share*
#
% of
Total**
% of Businesses
***
% USB
Loans****
$100,000 or
less
>$100,000 to $250,000
>$250,000 to $1,000,000
All
Rev $1 Million or
Less Full-Review:
Denver-Aurora 20,995 59.35 68.49 62.84 96.49 1.43 2.08 11.50 13.91
Limited-Review:
Boulder 2,064 5.83 68.45 64.44 96.80 0.97 2.23 7.57 9.55
Colorado Springs 5,251 14.84 70.60 72.81 97.28 1.05 1.68 16.66 23.31
Fort Collins-Loveland 1,597 4.51 72.53 59.74 98.00 0.88 1.13 7.34 8.47
Grand Junction 1,123 3.17 74.29 61.44 85.75 6.68 7.57 12.08 12.62
Greeley 981 2.77 72.84 63.91 97.45 1.33 1.22 8.15 9.88
Pueblo 875 2.47 70.78 66.86 94.29 3.89 1.83 17.29 21.69
CO nonMSA 2,488 7.03 70.32 63.55 90.76 4.14 5.10 9.82 11.19
* Based on 2011 Peer Small Business Data – US and PR. ** Small loans to businesses originated and purchased in the MA/AA as a percentage of all small loans to businesses originated and purchased in the rated area. *** Businesses with revenues of $1 million or less as a percentage of all businesses (Source Dun and Bradstreet - 2011). **** Small loans to businesses with revenues of $1 million or less as a percentage of all loans reported as small loans to businesses. No information was available for 23.6% of small loans to businesses originated and purchased by the bank.

Charter Number 24
D - 97
Table 12. Borrower Distribution of Small Loans to Farms
Borrower Distribution: SMALL LOANS TO FARMS Geography: COLORADO Evaluation Period: JANUARY 1, 2009 To DECEMBER 31, 2011
MA/Assessment Area:
Total Small Loans to Farms
Farms With Revenues of $1 million or less
Loans by Original Amount Regardless of Farm Size
Market Share*
#
% of
Total**
% of
Farms***
% USB
Loans****
$100,000 or
less
>$100,000 to $250,000
>$250,000 to $500,000
All
Rev $1 Million or
Less Full-Review:
Denver-Aurora 52 47.27 96.10 69.23 100.0 0.00 0.00 3.70 4.35
Limited-Review:
Boulder 2 1.82 97.09 50.00 100.0 0.00 0.00 0.00 0.00
Colorado Springs 13 11.82 96.82 92.31 100.0 0.00 0.00 12.50 16.13
Fort Collins-Loveland 7 6.36 97.62 100.0 100.0 0.00 0.00 1.02 1.52
Grand Junction 12 10.91 98.81 58.33 33.33 33.33 33.33 11.67 12.50
Greeley 6 5.45 94.96 50.00 100.0 0.00 0.00 0.00 0.00
Pueblo 4 3.64 98.03 100.0 75.00 25.00 0.00 6.06 8.70
CO nonMSA 14 12.73 97.84 92.86 57.14 21.43 21.43 0.35 0.54
* Based on 2011 Peer Small Business Data – US and PR. ** Small loans to farms originated and purchased in the MA/AA as a percentage of all small loans to farms originated and purchased in the rated area. *** Farms with revenues of $1 million or less as a percentage of all farms (Source Dun and Bradstreet - 2011). **** Small loans to farms with revenues of $1 million or less as a percentage of all loans reported as small loans to farms. No information was available for 12.7% of small loans to farms originated and purchased by the bank.

Charter Number 24
D - 98
Table 14. Qualified Investments
QUALIFIED INVESTMENTS Geography: COLORADO Evaluation Period: JANUARY 1, 2009 To MARCH 31, 2012
MA/Assessment Area:
Prior Period Investments* Current Period Investments** Total Investments Unfunded Commitments***
# $(000’s) # $(000’s) # $(000’s) % of Total # $(000’s) Full-Review:
Denver-Aurora 23 17,267 343 88,152 366 105,419 76.41 8 9,969
Limited-Review:
Boulder 16 1,670 87 5,141 103 6,810 4.94 1 5
Colorado Springs 31 1,445 75 2,492 106 3,937 2.85 0 0
Fort Collins-Loveland 6 641 33 5,028 39 5,669 4.11 0 0
Grand Junction 6 190 39 2,973 45 3,163 2.29 1 2,797
Greeley 5 113 12 553 17 666 0.48 0 0
Pueblo 10 2,482 36 2,336 46 4,818 3.49 0 0
CO nonMSA 12 2,082 58 3,870 70 5,952 4.31 0 0
CO Statewide 4 1,200 35 327 39 1,527 1.11 0 0
* 'Prior Period Investments' means investments made in a previous evaluation period that are outstanding as of the examination date. ** The evaluation period for current period investments is January 1, 2009 to March 31, 2012. *** 'Unfunded Commitments' means legally binding investment commitments that are tracked and recorded by the institution's financial reporting system.

Charter Number 24
D - 99
Table 15. Distribution of Branch Delivery System and Branch Openings/Closings
DISTRIBUTION OF BRANCH DELIVERY SYSTEM/BRANCH OPENINGS/CLOSINGS Geography: COLORADO Evaluation Period: JANUARY 1, 2009 To DECEMBER 31, 2011
MA/Assessment Area:
Deposits Branches Branch Openings/Closings Population
% of
Rated Area
Deposits in AA
# of USB
Branches
% of
Rated Area
Branches in AA
Location of Branches by
Income of Geographies (%)
# of Branch
Openings
# of Branch
Closings
Net change in Location of Branches (+ or - )
% of Population within Each
Geography
Low
Mod
Mid
Upp
Low
Mod
Mid
Upp
Low
Mod
Mid
Upp
Full-Review:
Denver-Aurora 75.02 79 52.67 3.80 20.25 39.24 35.44 2 0 1 0 1 0 4.67 28.17 39.55 27.49
Limited-Review:
Boulder 3.44 9 6.00 0.00 33.33 44.44 22.22 2 1 0 1 0 0 3.35 25.38 41.56 29.70
Colorado Springs 7.42 16 10.67 6.25 12.50 56.25 25.00 2 0 0 1 0 1 0.34 26.24 47.96 25.46
Fort Collins-Loveland 2.22 9 6.00 0.00 22.22 44.44 33.33 1 0 0 1 0 0 3.28 19.05 59.01 18.66
Grand Junction 1.98 4 2.67 NA 50.00 50.00 0.00 0 0 NA 0 0 0 NA 17.70 60.49 21.81
Greeley 0.80 6 4.00 0.00 0.00 33.33 66.67 1 0 0 0 0 1 2.21 21.67 49.61 25.28
Pueblo 2.55 6 4.00 NA 16.67 50.00 33.33 0 0 NA 0 0 0 NA 30.02 43.31 25.47
CO nonMSA 6.57 21 14.00 NA 4.76 23.81 71.43 0 0 NA 0 0 0 NA 6.18 47.05 44.87
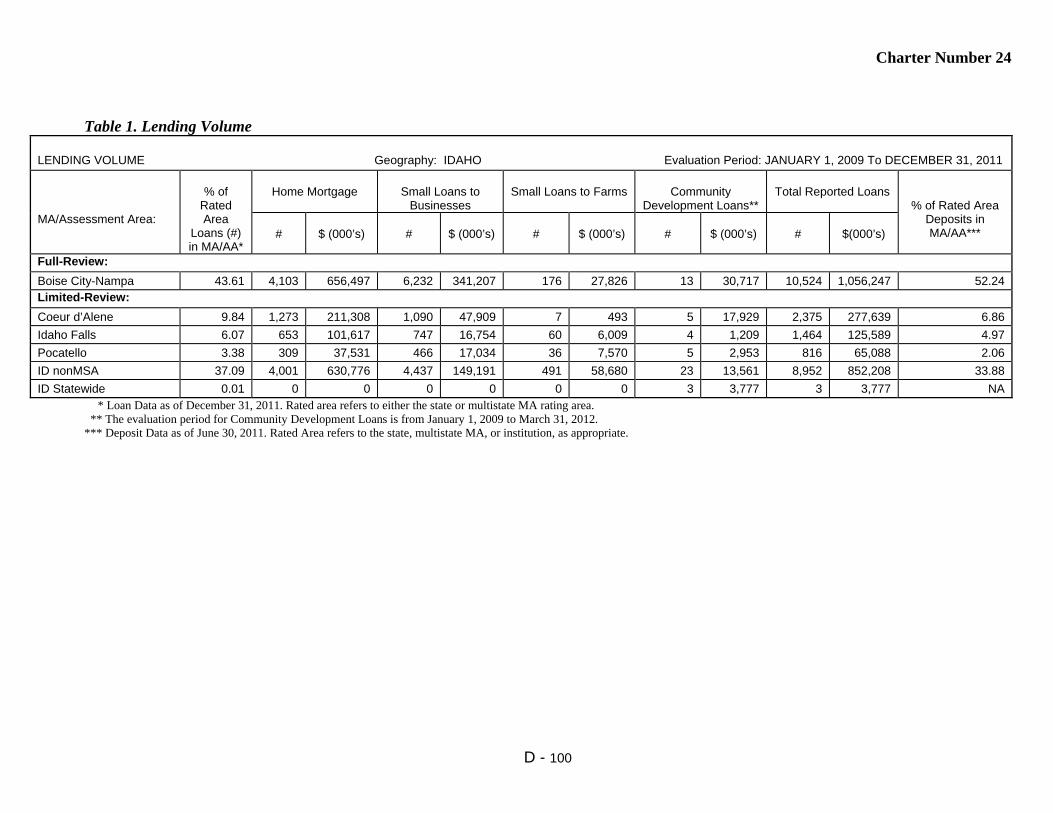
Charter Number 24
D - 100
Table 1. Lending Volume
LENDING VOLUME Geography: IDAHO Evaluation Period: JANUARY 1, 2009 To DECEMBER 31, 2011
MA/Assessment Area:
% of
Rated Area
Loans (#) in MA/AA*
Home Mortgage
Small Loans to
Businesses
Small Loans to Farms
Community
Development Loans**
Total Reported Loans
% of Rated Area Deposits in MA/AA***
#
$ (000’s)
#
$ (000’s)
#
$ (000’s)
#
$ (000’s)
#
$(000’s)
Full-Review:
Boise City-Nampa 43.61 4,103 656,497 6,232 341,207 176 27,826 13 30,717 10,524 1,056,247 52.24 Limited-Review:
Coeur d’Alene 9.84 1,273 211,308 1,090 47,909 7 493 5 17,929 2,375 277,639 6.86
Idaho Falls 6.07 653 101,617 747 16,754 60 6,009 4 1,209 1,464 125,589 4.97
Pocatello 3.38 309 37,531 466 17,034 36 7,570 5 2,953 816 65,088 2.06
ID nonMSA 37.09 4,001 630,776 4,437 149,191 491 58,680 23 13,561 8,952 852,208 33.88
ID Statewide 0.01 0 0 0 0 0 0 3 3,777 3 3,777 NA * Loan Data as of December 31, 2011. Rated area refers to either the state or multistate MA rating area. ** The evaluation period for Community Development Loans is from January 1, 2009 to March 31, 2012. *** Deposit Data as of June 30, 2011. Rated Area refers to the state, multistate MA, or institution, as appropriate.
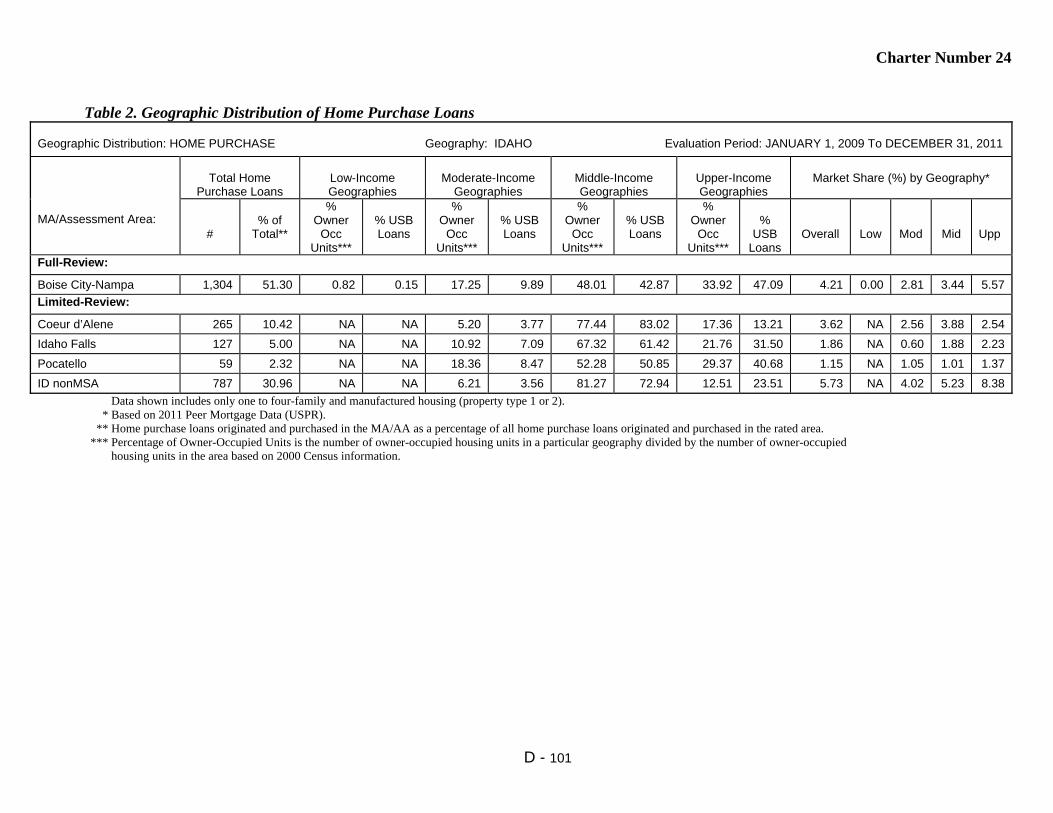
Charter Number 24
D - 101
Table 2. Geographic Distribution of Home Purchase Loans
Geographic Distribution: HOME PURCHASE Geography: IDAHO Evaluation Period: JANUARY 1, 2009 To DECEMBER 31, 2011
MA/Assessment Area:
Total Home
Purchase Loans
Low-Income Geographies
Moderate-Income
Geographies
Middle-Income Geographies
Upper-Income Geographies
Market Share (%) by Geography*
#
% of
Total**
% Owner
Occ Units***
% USB Loans
% Owner
Occ Units***
% USB Loans
% Owner
Occ Units***
% USB Loans
% Owner
Occ Units***
%
USB Loans
Overall
Low
Mod
Mid
Upp
Full-Review:
Boise City-Nampa 1,304 51.30 0.82 0.15 17.25 9.89 48.01 42.87 33.92 47.09 4.21 0.00 2.81 3.44 5.57
Limited-Review:
Coeur d’Alene 265 10.42 NA NA 5.20 3.77 77.44 83.02 17.36 13.21 3.62 NA 2.56 3.88 2.54
Idaho Falls 127 5.00 NA NA 10.92 7.09 67.32 61.42 21.76 31.50 1.86 NA 0.60 1.88 2.23
Pocatello 59 2.32 NA NA 18.36 8.47 52.28 50.85 29.37 40.68 1.15 NA 1.05 1.01 1.37
ID nonMSA 787 30.96 NA NA 6.21 3.56 81.27 72.94 12.51 23.51 5.73 NA 4.02 5.23 8.38
Data shown includes only one to four-family and manufactured housing (property type 1 or 2). * Based on 2011 Peer Mortgage Data (USPR). ** Home purchase loans originated and purchased in the MA/AA as a percentage of all home purchase loans originated and purchased in the rated area. *** Percentage of Owner-Occupied Units is the number of owner-occupied housing units in a particular geography divided by the number of owner-occupied housing units in the area based on 2000 Census information.
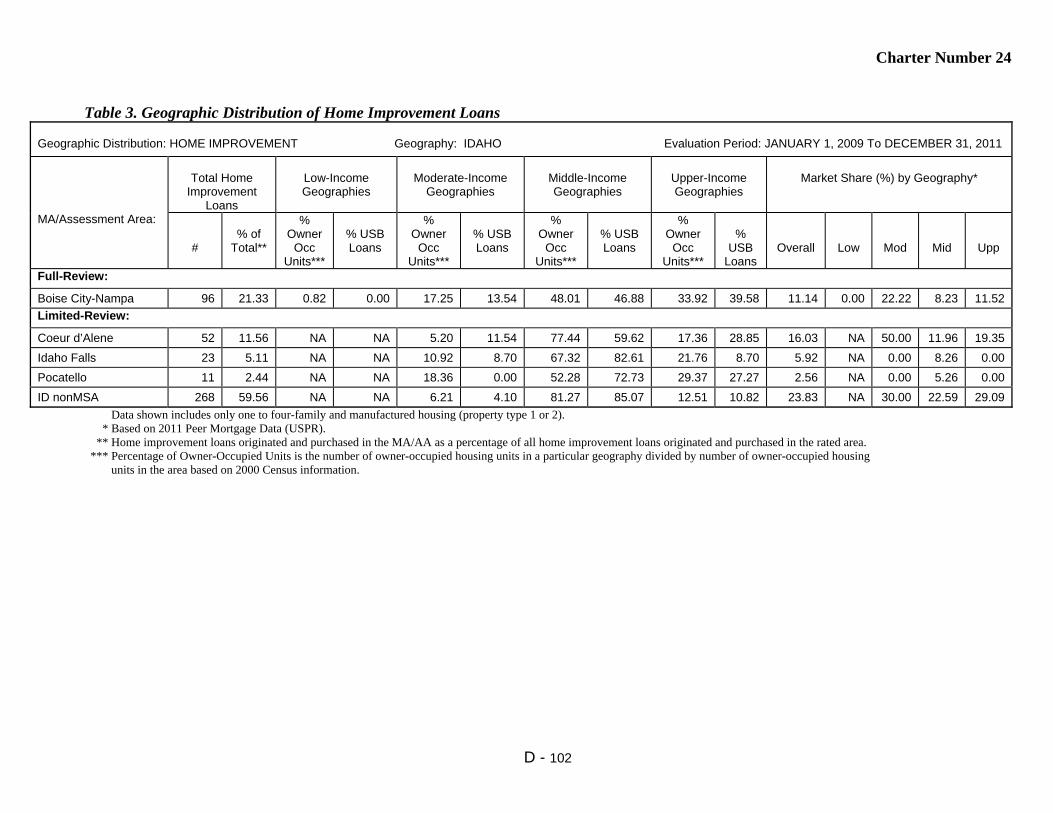
Charter Number 24
D - 102
Table 3. Geographic Distribution of Home Improvement Loans
Geographic Distribution: HOME IMPROVEMENT Geography: IDAHO Evaluation Period: JANUARY 1, 2009 To DECEMBER 31, 2011
MA/Assessment Area:
Total Home
Improvement Loans
Low-Income Geographies
Moderate-Income
Geographies
Middle-Income Geographies
Upper-Income Geographies
Market Share (%) by Geography*
#
% of
Total**
% Owner
Occ Units***
% USB Loans
% Owner
Occ Units***
% USB Loans
% Owner
Occ Units***
% USB Loans
% Owner
Occ Units***
%
USB Loans
Overall
Low
Mod
Mid
Upp
Full-Review:
Boise City-Nampa 96 21.33 0.82 0.00 17.25 13.54 48.01 46.88 33.92 39.58 11.14 0.00 22.22 8.23 11.52
Limited-Review:
Coeur d’Alene 52 11.56 NA NA 5.20 11.54 77.44 59.62 17.36 28.85 16.03 NA 50.00 11.96 19.35
Idaho Falls 23 5.11 NA NA 10.92 8.70 67.32 82.61 21.76 8.70 5.92 NA 0.00 8.26 0.00
Pocatello 11 2.44 NA NA 18.36 0.00 52.28 72.73 29.37 27.27 2.56 NA 0.00 5.26 0.00
ID nonMSA 268 59.56 NA NA 6.21 4.10 81.27 85.07 12.51 10.82 23.83 NA 30.00 22.59 29.09
Data shown includes only one to four-family and manufactured housing (property type 1 or 2). * Based on 2011 Peer Mortgage Data (USPR). ** Home improvement loans originated and purchased in the MA/AA as a percentage of all home improvement loans originated and purchased in the rated area. *** Percentage of Owner-Occupied Units is the number of owner-occupied housing units in a particular geography divided by number of owner-occupied housing units in the area based on 2000 Census information.

Charter Number 24
D - 103
Table 4. Geographic Distribution of Home Mortgage Refinance Loans
Geographic Distribution: HOME MORTGAGE REFINANCE Geography: IDAHO Evaluation Period: JANUARY 1, 2009 To DECEMBER 31, 2011
MA/Assessment Area:
Total Home Mortgage
Refinance Loans
Low-Income Geographies
Moderate-Income Geographies
Middle-Income Geographies
Upper-Income Geographies
Market Share (%) by Geography*
#
% of
Total**
% Owner
Occ Units***
% USB Loans
% Owner Occ
Units***
% USB Loans
% Owner Occ
Units***
% USB Loans
% Owner Occ
Units***
% USB Loans
Over-
all
Low
Mod
Mid
Upp
Full-Review:
Boise City-Nampa 2,701 36.84 0.82 0.04 17.25 9.00 48.01 41.02 33.92 49.94 7.24 0.00 7.25 6.63 7.81
Limited-Review:
Coeur d’Alene 953 13.00 NA NA 5.20 2.62 77.44 76.92 17.36 20.46 9.07 NA 16.42 8.97 8.68
Idaho Falls 503 6.86 NA NA 10.92 4.17 67.32 73.56 21.76 22.27 4.66 NA 4.14 4.63 4.90
Pocatello 239 3.26 NA NA 18.36 10.46 52.28 52.72 29.37 36.82 4.35 NA 3.68 5.40 3.34
ID nonMSA 2,935 40.04 NA NA 6.21 3.34 81.27 79.93 12.51 16.73 10.64 NA 9.39 10.72 10.60
Data shown includes only one to four-family and manufactured housing (property type 1 or 2). * Based on 2011 Peer Mortgage Data (USPR). ** Home mortgage refinance loans originated and purchased in the MA/AA as a percentage of all home mortgage refinance loans originated and purchased in the rated area. *** Percentage of Owner-Occupied Units is the number of owner-occupied housing units in a particular geography divided by number of owner-occupied housing units in the area based on 2000 Census information.

Charter Number 24
D - 104
Table 5. Geographic Distribution of Multifamily Loans
Geographic Distribution: MULTIFAMILY Geography: IDAHO Evaluation Period: JANUARY 1, 2009 To DECEMBER 31, 2011
MA/Assessment Area:
Total Multifamily
Loans
Low-Income Geographies
Moderate-Income
Geographies
Middle-Income Geographies
Upper-Income Geographies
Market Share (%) by Geography*
#
% of Total**
% of MF Units***
% USB Loans
% MF Units***
% USB Loans
% MF Units***
% USB Loans
% MF Units***
% USB Loans
Overall
Low
Mod
Mid
Upp
Full-Review:
Boise City-Nampa 2 12.50 1.79 0.00 38.65 50.00 32.72 50.00 26.84 0.00 4.35 0.00 0.00 14.29 0.00
Limited-Review:
Coeur d’Alene 3 18.75 NA NA 24.85 33.33 61.21 66.67 13.94 0.00 16.67 NA 0.00 33.33 0.00
Idaho Falls 0 0.00 NA NA 36.24 0.00 53.48 0.00 10.29 0.00 0.00 NA 0.00 0.00 0.00
Pocatello 0 0.00 NA NA 48.34 0.00 43.72 0.00 7.95 0.00 0.00 NA 0.00 0.00 0.00
ID nonMSA 11 68.75 NA NA 10.35 0.00 67.09 90.91 22.57 9.09 38.89 NA 0.00 37.50 100.0
Multifamily loan distribution includes Home Purchases, Home Improvement and Refinances. * Based on 2011 Peer Mortgage Data (USPR). ** Multifamily loans originated and purchased in the MA/AA as a percentage of all multifamily loans originated and purchased in the rated area. *** Percentage of multifamily units is the number of multifamily housing units in a particular geography divided by number of multifamily housing units in the area based on 2000 Census information.

Charter Number 24
D - 105
Table 6. Geographic Distribution of Small Loans to Businesses
Geographic Distribution: SMALL LOANS TO BUSINESSES Geography: IDAHO Evaluation Period: JANUARY 1, 2009 To DECEMBER 31, 2011
MA/Assessment Area:
Total Small Business
Loans
Low-Income Geographies
Moderate-Income
Geographies
Middle-Income Geographies
Upper-Income Geographies
Market Share (%) by Geography*
#
% of Total
**
% of
Businesses ***
%
USB Loans
% of
Businesses ***
%
USB Loans
% of
Businesses ***
%
USB Loans
% of
Businesses ***
%
USB Loans
Overall
Low
Mod
Mid
Upp
Full-Review:
Boise City-Nampa 6,232 48.04 0.72 0.48 21.09 24.02 41.75 38.14 36.44 37.36 17.44 12.00 18.34 16.01 17.82
Limited-Review:
Coeur d’Alene 1,090 8.40 NA NA 12.55 9.91 74.13 75.41 13.32 14.68 11.40 NA 11.14 11.27 10.85
Idaho Falls 747 5.76 NA NA 15.82 20.21 61.96 58.37 22.22 21.42 9.11 NA 14.51 8.65 6.85
Pocatello 466 3.59 NA NA 28.09 31.12 46.33 47.42 25.59 21.46 11.52 NA 10.43 12.03 10.70
ID nonMSA 4,437 34.20 NA NA 6.57 4.26 77.35 76.97 16.07 18.77 16.96 NA 12.96 16.74 15.44
* Based on 2011 Peer Small Business Data – US and PR. ** Small loans to businesses originated and purchased in the MA/AA as a percentage of all small loans to businesses originated and purchased in the rated area. *** Source Data - Dun and Bradstreet (2011).

Charter Number 24
D - 106
Table 7. Geographic Distribution of Small Loans to Farms
Geographic Distribution: SMALL LOANS TO FARMS Geography: IDAHO Evaluation Period: JANUARY 1, 2009 To DECEMBER 31, 2011
MA/Assessment Area:
Total Small Farm
Loans
Low-Income Geographies
Moderate-Income
Geographies
Middle-Income Geographies
Upper-Income Geographies
Market Share (%) by Geography*
#
% of
Total**
% of
Farms***
% USB Loans
% of
Farms***
% USB Loans
% of
Farms***
% USB Loans
% of
Farms***
% USB Loans
Overall
Low
Mod
Mid
Upp
Full-Review:
Boise City-Nampa 176 22.86 0.29 0.57 19.89 44.32 57.25 48.86 22.57 6.25 14.00 0.00 18.75 11.16 12.50
Limited-Review:
Coeur d’Alene 7 0.91 NA NA 5.45 0.00 80.00 100.0 14.55 0.00 5.41 NA 0.00 6.06 0.00
Idaho Falls 60 7.79 NA NA 5.05 0.00 79.95 100.0 15.01 0.00 3.53 NA 0.00 3.92 0.00
Pocatello 36 4.68 NA NA 7.66 0.00 73.78 94.44 18.56 5.56 13.33 NA 0.00 14.10 10.00
ID nonMSA 491 63.77 NA NA 5.07 3.67 85.29 89.21 9.64 7.13 9.48 NA 3.39 9.68 8.79
* Based on 2011 Peer Small Business Data – US and PR. ** Small loans to farms originated and purchased in the MA/AA as a percentage of all small loans to farms originated and purchased in the rated area. *** Source Data - Dun and Bradstreet (2011).

Charter Number 24
D - 107
Table 8. Borrower Distribution of Home Purchase Loans
Borrower Distribution: HOME PURCHASE Geography: IDAHO Evaluation Period: JANUARY 1, 2009 To DECEMBER 31, 2011
MA/Assessment Area:
Total Home Purchase
Loans
Low-Income Borrowers
Moderate-Income
Borrowers
Middle-Income
Borrowers
Upper-Income
Borrowers
Market Share*
#
% of Total
**
% Families
***
% USB Loans
****
% Families
***
% USB Loans
****
% Families
***
% USB Loans
****
% Families
***
% USB Loans
****
Over-
all
Low
Mod
Mid
Upp
Full-Review:
Boise City-Nampa 1,304 51.30 17.83 15.87 19.15 24.27 23.65 22.27 39.38 37.60 2.65 2.83 2.12 2.41 3.03
Limited-Review:
Coeur d’Alene 265 10.42 17.20 10.00 19.03 23.33 25.04 22.78 38.73 43.89 2.99 4.02 3.70 2.51 2.62
Idaho Falls 127 5.00 18.07 16.98 18.91 16.98 23.84 24.53 39.18 41.51 1.04 1.51 0.45 0.89 1.41
Pocatello 59 2.32 19.76 9.09 18.53 40.91 22.10 18.18 39.62 31.82 0.55 0.69 0.75 0.68 0.26
ID nonMSA 787 30.96 17.90 6.74 19.09 17.34 24.04 25.24 38.97 50.67 4.80 4.53 4.19 5.52 4.71
Data shown includes only one to four-family and manufactured housing (property type 1 or 2). * Based on 2011 Peer Mortgage Data (USPR). ** Home purchase loans originated and purchased in the MA/AA as a percentage of all home purchase loans originated and purchased in the rated area. *** Percentage of Families is based on the 2000 Census information. **** As a percentage of loans with borrower income information available. No information was available for 40.1% of loans originated and purchased by the bank.
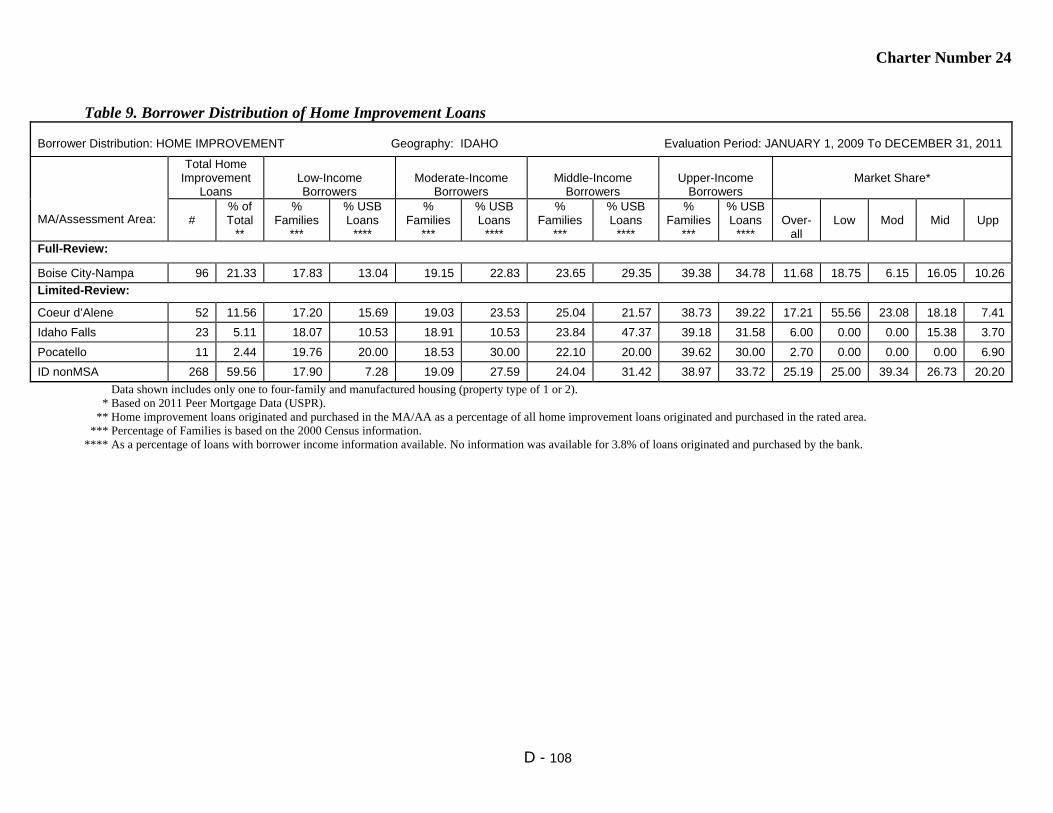
Charter Number 24
D - 108
Table 9. Borrower Distribution of Home Improvement Loans
Borrower Distribution: HOME IMPROVEMENT Geography: IDAHO Evaluation Period: JANUARY 1, 2009 To DECEMBER 31, 2011
MA/Assessment Area:
Total Home Improvement
Loans
Low-Income Borrowers
Moderate-Income
Borrowers
Middle-Income
Borrowers
Upper-Income
Borrowers
Market Share*
#
% of Total
**
% Families
***
% USB Loans
****
% Families
***
% USB Loans
****
% Families
***
% USB Loans
****
% Families
***
% USB Loans
****
Over-
all
Low
Mod
Mid
Upp
Full-Review:
Boise City-Nampa 96 21.33 17.83 13.04 19.15 22.83 23.65 29.35 39.38 34.78 11.68 18.75 6.15 16.05 10.26
Limited-Review:
Coeur d’Alene 52 11.56 17.20 15.69 19.03 23.53 25.04 21.57 38.73 39.22 17.21 55.56 23.08 18.18 7.41
Idaho Falls 23 5.11 18.07 10.53 18.91 10.53 23.84 47.37 39.18 31.58 6.00 0.00 0.00 15.38 3.70
Pocatello 11 2.44 19.76 20.00 18.53 30.00 22.10 20.00 39.62 30.00 2.70 0.00 0.00 0.00 6.90
ID nonMSA 268 59.56 17.90 7.28 19.09 27.59 24.04 31.42 38.97 33.72 25.19 25.00 39.34 26.73 20.20
Data shown includes only one to four-family and manufactured housing (property type of 1 or 2). * Based on 2011 Peer Mortgage Data (USPR). ** Home improvement loans originated and purchased in the MA/AA as a percentage of all home improvement loans originated and purchased in the rated area. *** Percentage of Families is based on the 2000 Census information. **** As a percentage of loans with borrower income information available. No information was available for 3.8% of loans originated and purchased by the bank.

Charter Number 24
D - 109
Table 10. Borrower Distribution of Home Mortgage Refinance Loans
Borrower Distribution: HOME MORTGAGE REFINANCE Geography: IDAHO Evaluation Period: JANUARY 1, 2009 To DECEMBER 31, 2011
MA/Assessment Area:
Total Home Mortgage Refinance
Loans
Low-Income Borrowers
Moderate-Income Borrowers
Middle-Income Borrowers
Upper-Income Borrowers
Market Share*
#
% of Total
**
% Families
***
% USB Loans
****
% Families
***
% USB Loans
****
% Families
***
% USB Loans
****
% Families
***
% USB Loans
****
Over-
all
Low
Mod
Mid
Upp
Full-Review:
Boise City-Nampa 2,701 36.84 17.83 10.69 19.15 19.80 23.65 24.40 39.38 45.10 7.81 8.89 8.36 8.14 7.23
Limited-Review:
Coeur d’Alene 953 13.00 17.20 8.71 19.03 23.26 25.04 24.25 38.73 43.78 10.20 14.20 14.85 9.19 8.56
Idaho Falls 503 6.86 18.07 6.37 18.91 17.23 23.84 30.71 39.18 45.69 3.81 3.47 3.38 5.52 3.06
Pocatello 239 3.26 19.76 10.07 18.53 24.83 22.10 29.53 39.62 35.57 4.04 6.36 5.92 4.42 2.88
ID nonMSA 2,935 40.04 17.90 6.88 19.09 16.30 24.04 26.74 38.97 50.07 11.48 13.86 14.32 13.94 9.73
Data shown includes only one to four-family and manufactured housing (property type 1 or 2). * Based on 2011 Peer Mortgage Data (USPR). ** Home refinance loans originated and purchased in the MA/AA as a percentage of all home refinance loans originated and purchased in the rated area. *** Percentage of Families is based on the 2000 Census information. **** As a percentage of loans with borrower income information available. No information was available for 28.1% of loans originated and purchased by the bank.
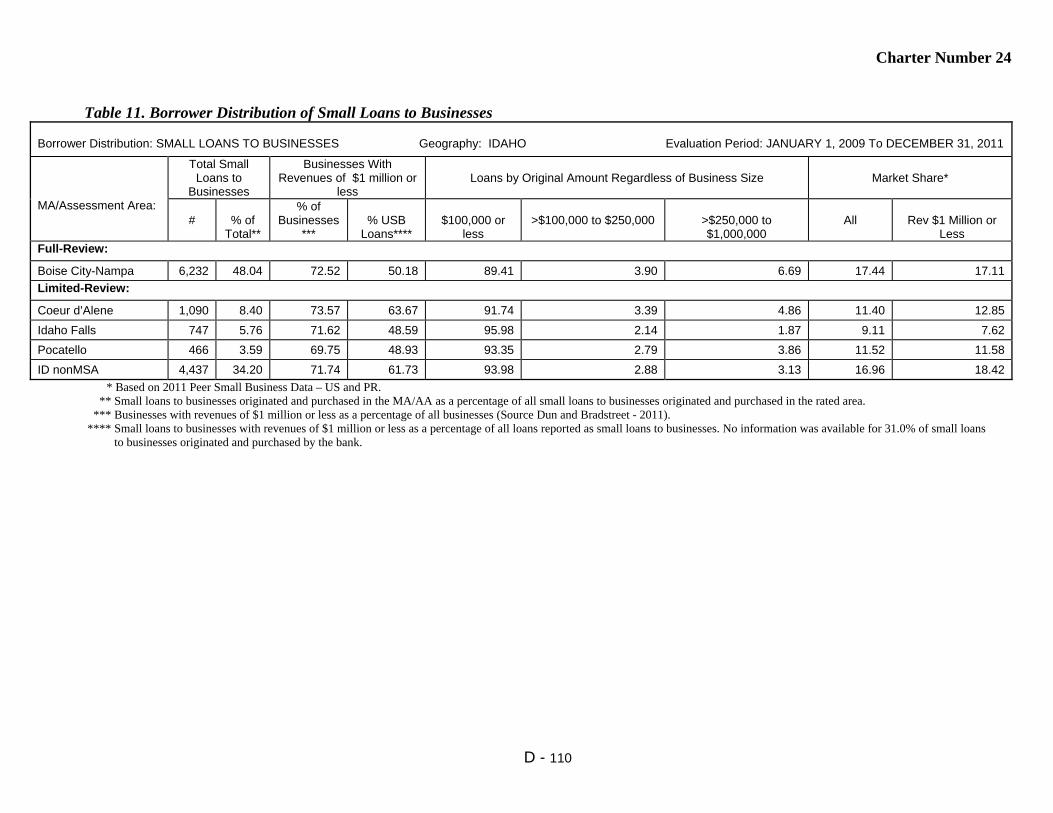
Charter Number 24
D - 110
Table 11. Borrower Distribution of Small Loans to Businesses
Borrower Distribution: SMALL LOANS TO BUSINESSES Geography: IDAHO Evaluation Period: JANUARY 1, 2009 To DECEMBER 31, 2011
MA/Assessment Area:
Total Small Loans to
Businesses
Businesses With Revenues of $1 million or
less
Loans by Original Amount Regardless of Business Size
Market Share*
#
% of
Total**
% of Businesses
***
% USB
Loans****
$100,000 or
less
>$100,000 to $250,000
>$250,000 to $1,000,000
All
Rev $1 Million or
Less Full-Review:
Boise City-Nampa 6,232 48.04 72.52 50.18 89.41 3.90 6.69 17.44 17.11
Limited-Review:
Coeur d’Alene 1,090 8.40 73.57 63.67 91.74 3.39 4.86 11.40 12.85
Idaho Falls 747 5.76 71.62 48.59 95.98 2.14 1.87 9.11 7.62
Pocatello 466 3.59 69.75 48.93 93.35 2.79 3.86 11.52 11.58
ID nonMSA 4,437 34.20 71.74 61.73 93.98 2.88 3.13 16.96 18.42
* Based on 2011 Peer Small Business Data – US and PR. ** Small loans to businesses originated and purchased in the MA/AA as a percentage of all small loans to businesses originated and purchased in the rated area. *** Businesses with revenues of $1 million or less as a percentage of all businesses (Source Dun and Bradstreet - 2011). **** Small loans to businesses with revenues of $1 million or less as a percentage of all loans reported as small loans to businesses. No information was available for 31.0% of small loans to businesses originated and purchased by the bank.

Charter Number 24
D - 111
Table 12. Borrower Distribution of Small Loans to Farms
Borrower Distribution: SMALL LOANS TO FARMS Geography: IDAHO Evaluation Period: JANUARY 1, 2009 To DECEMBER 31, 2011
MA/Assessment Area:
Total Small Loans to Farms
Farms With Revenues of $1 million or less
Loans by Original Amount Regardless of Farm Size
Market Share*
#
% of
Total**
% of
Farms***
% USB
Loans****
$100,000 or
less
>$100,000 to $250,000
>$250,000 to $500,000
All
Rev $1 Million or
Less Full-Review:
Boise City-Nampa 176 22.86 96.50 81.25 50.00 21.02 28.98 14.00 13.98
Limited-Review:
Coeur d’Alene 7 0.91 97.98 42.86 100.0 0.00 0.00 5.41 3.85
Idaho Falls 60 7.79 95.22 85.00 80.00 5.00 15.00 3.53 3.59
Pocatello 36 4.68 95.82 61.11 27.78 36.11 36.11 13.33 10.81
ID nonMSA 491 63.77 95.66 83.30 65.78 18.74 15.48 9.48 9.83
* Based on 2011 Peer Small Business Data – US and PR. ** Small loans to farms originated and purchased in the MA/AA as a percentage of all small loans to farms originated and purchased in the rated area. *** Farms with revenues of $1 million or less as a percentage of all farms (Source Dun and Bradstreet - 2011). **** Small loans to farms with revenues of $1 million or less as a percentage of all loans reported as small loans to farms. No information was available for 6.2% of small loans to farms originated and purchased by the bank.
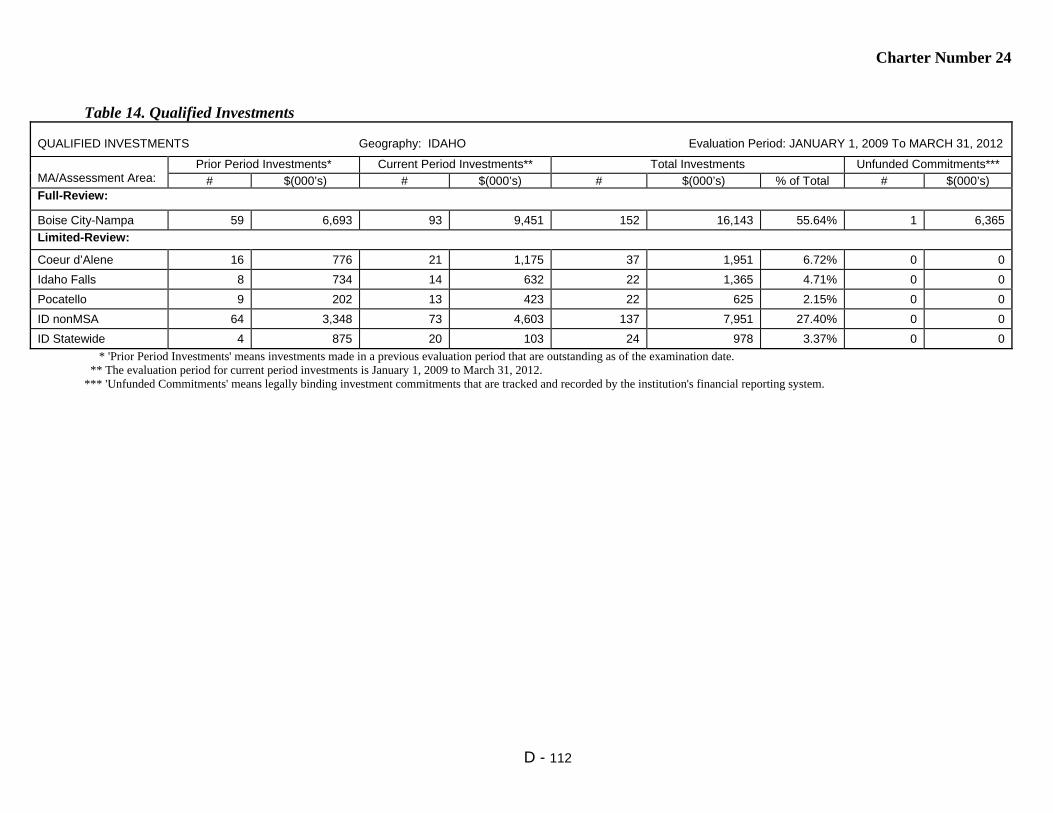
Charter Number 24
D - 112
Table 14. Qualified Investments
QUALIFIED INVESTMENTS Geography: IDAHO Evaluation Period: JANUARY 1, 2009 To MARCH 31, 2012
MA/Assessment Area:
Prior Period Investments* Current Period Investments** Total Investments Unfunded Commitments***
# $(000’s) # $(000’s) # $(000’s) % of Total # $(000’s) Full-Review:
Boise City-Nampa 59 6,693 93 9,451 152 16,143 55.64% 1 6,365
Limited-Review:
Coeur d’Alene 16 776 21 1,175 37 1,951 6.72% 0 0
Idaho Falls 8 734 14 632 22 1,365 4.71% 0 0
Pocatello 9 202 13 423 22 625 2.15% 0 0
ID nonMSA 64 3,348 73 4,603 137 7,951 27.40% 0 0
ID Statewide 4 875 20 103 24 978 3.37% 0 0
* 'Prior Period Investments' means investments made in a previous evaluation period that are outstanding as of the examination date. ** The evaluation period for current period investments is January 1, 2009 to March 31, 2012. *** 'Unfunded Commitments' means legally binding investment commitments that are tracked and recorded by the institution's financial reporting system.

Charter Number 24
D - 113
Table 15. Distribution of Branch Delivery System and Branch Openings/Closings
DISTRIBUTION OF BRANCH DELIVERY SYSTEM/BRANCH OPENINGS/CLOSINGS Geography: IDAHO Evaluation Period: JANUARY 1, 2009 To DECEMBER 31, 2011
MA/Assessment Area:
Deposits Branches Branch Openings/Closings Population
% of
Rated Area
Deposits in AA
# of USB
Branch-es
% of
Rated Area
Branch-es in AA
Location of Branches by
Income of Geographies (%)
# of Branch
Openings
# of Branch
Closings
Net change in Location of Branches (+ or - )
% of Population within Each
Geography
Low
Mod
Mid
Upp
Low
Mod
Mid
Upp
Low
Mod
Mid
Upp
Full-Review:
Boise City-Nampa 52.24% 37 40.22 0.00 35.14 29.73 35.14 2 0 0 0 1 1 1.58 21.28 46.43 30.71
Limited-Review:
Coeur d’Alene 6.86% 5 5.43 NA 20.00 80.00 0.00 0 0 NA 0 0 0 NA 7.82 76.03 16.15
Idaho Falls 4.97% 4 4.35 NA 50.00 25.00 25.00 0 0 NA 0 0 0 NA 13.54 66.55 19.91
Pocatello 2.06% 3 3.26 NA 66.67 33.33 0.00 0 0 NA 0 0 0 NA 21.77 51.13 27.10
ID nonMSA 33.88% 43 46.74 NA 4.65 76.74 18.60 0 0 NA 0 0 0 NA 7.72 80.39 11.89

Charter Number 24
D - 114
Table 1. Lending Volume
LENDING VOLUME Geography: ILLINOIS Evaluation Period: JANUARY 1, 2009 To DECEMBER 31, 2011
MA/Assessment Area:
% of
Rated Area
Loans (#) in MA/AA*
Home Mortgage
Small Loans to
Businesses
Small Loans to Farms
Community
Development Loans**
Total Reported Loans
% of Rated Area Deposits in MA/AA***
#
$ (000’s)
#
$ (000’s)
#
$ (000’s)
#
$ (000’s)
#
$(000’s)
Full-Review:
Springfield 19.72 1,665 212,907 1,168 70,113 125 14,898 6 4,779 2,964 302,697 24.46 Limited-Review:
Bloomington-Normal 11.58 1,139 207,735 581 20,838 21 2,795 0 0 1,741 231,368 3.47
Rockford 15.22 1,006 111,728 1,273 25,679 4 291 4 16,100 2,287 153,798 15.61
IL nonMSA 53.44 4,517 447,901 2,810 128,696 704 75,328 1 52 8,032 651,977 56.45
IL Statewide 0.03 0 0 0 0 0 0 5 3,600 5 3,600 NA * Loan Data as of December 31, 2011. Rated area refers to either the state or multistate MA rating area. ** The evaluation period for Community Development Loans is from January 1, 2009 to March 31, 2012. *** Deposit Data as of June 30, 2011. Rated Area refers to the state, multistate MA, or institution, as appropriate.

Charter Number 24
D - 115
Table 2. Geographic Distribution of Home Purchase Loans
Geographic Distribution: HOME PURCHASE Geography: ILLINOIS Evaluation Period: JANUARY 1, 2009 To DECEMBER 31, 2011
MA/Assessment Area:
Total Home
Purchase Loans
Low-Income Geographies
Moderate-Income
Geographies
Middle-Income Geographies
Upper-Income Geographies
Market Share (%) by Geography*
#
% of
Total**
% Owner Occ
Units***
% USB Loans
% Owner Occ
Units***
% USB Loans
% Owner Occ
Units***
% USB Loans
% Owner Occ
Units***
% USB Loans
Overall
Low
Mod
Mid
Upp
Full-Review:
Springfield 814 25.98 2.60 1.72 20.47 19.66 40.90 43.73 36.04 34.89 10.30 14.71 14.79 11.19 7.87
Limited-Review:
Bloomington- Normal
326 10.41 0.00 0.31 21.24 21.78 55.27 46.93 23.49 30.98 4.55 33.33 4.74 5.04 3.72
Rockford 336 10.72 1.61 0.00 17.05 7.74 56.27 62.50 25.07 29.76 5.49 0.00 4.21 6.18 4.66
IL nonMSA 1,657 52.89 NA NA 14.92 15.15 73.14 73.51 11.95 11.35 14.57 NA 16.91 14.34 14.06
Data shown includes only one to four-family and manufactured housing (property type 1 or 2). * Based on 2011 Peer Mortgage Data (USPR). ** Home purchase loans originated and purchased in the MA/AA as a percentage of all home purchase loans originated and purchased in the rated area. *** Percentage of Owner-Occupied Units is the number of owner-occupied housing units in a particular geography divided by the number of owner-occupied housing units in the area based on 2000 Census information.
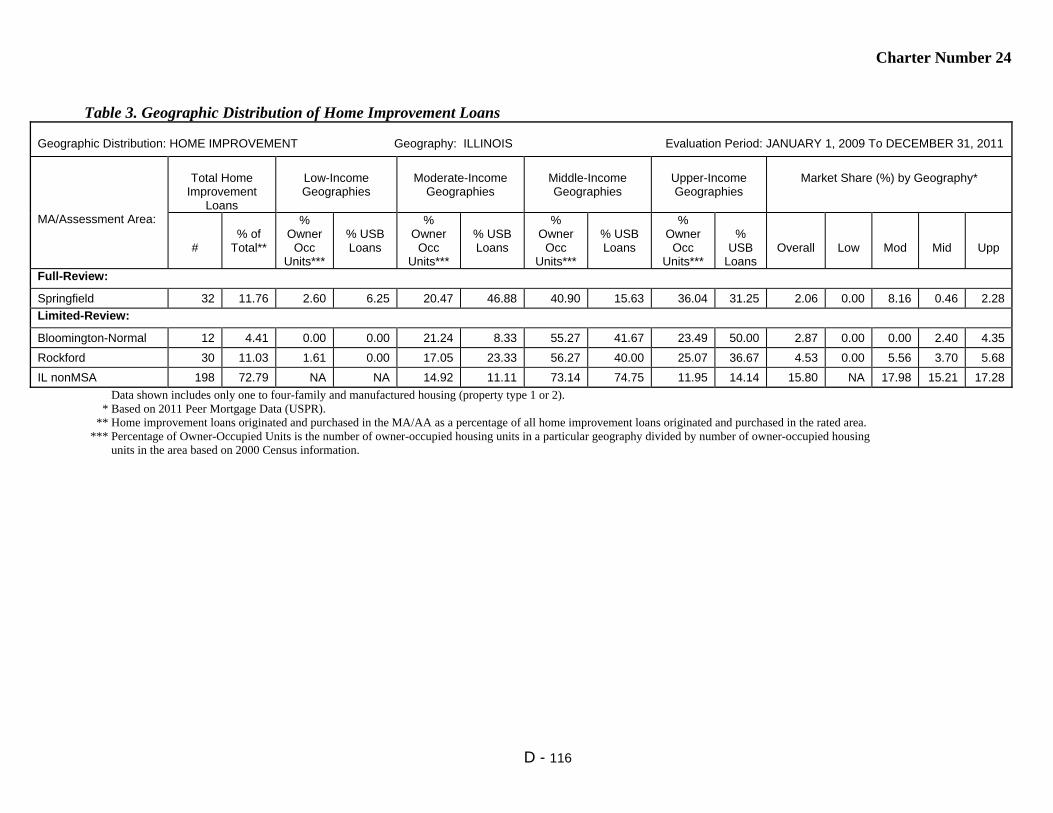
Charter Number 24
D - 116
Table 3. Geographic Distribution of Home Improvement Loans
Geographic Distribution: HOME IMPROVEMENT Geography: ILLINOIS Evaluation Period: JANUARY 1, 2009 To DECEMBER 31, 2011
MA/Assessment Area:
Total Home
Improvement Loans
Low-Income Geographies
Moderate-Income
Geographies
Middle-Income Geographies
Upper-Income Geographies
Market Share (%) by Geography*
#
% of
Total**
% Owner
Occ Units***
% USB Loans
% Owner
Occ Units***
% USB Loans
% Owner
Occ Units***
% USB Loans
% Owner
Occ Units***
%
USB Loans
Overall
Low
Mod
Mid
Upp
Full-Review:
Springfield 32 11.76 2.60 6.25 20.47 46.88 40.90 15.63 36.04 31.25 2.06 0.00 8.16 0.46 2.28
Limited-Review:
Bloomington-Normal 12 4.41 0.00 0.00 21.24 8.33 55.27 41.67 23.49 50.00 2.87 0.00 0.00 2.40 4.35
Rockford 30 11.03 1.61 0.00 17.05 23.33 56.27 40.00 25.07 36.67 4.53 0.00 5.56 3.70 5.68
IL nonMSA 198 72.79 NA NA 14.92 11.11 73.14 74.75 11.95 14.14 15.80 NA 17.98 15.21 17.28
Data shown includes only one to four-family and manufactured housing (property type 1 or 2). * Based on 2011 Peer Mortgage Data (USPR). ** Home improvement loans originated and purchased in the MA/AA as a percentage of all home improvement loans originated and purchased in the rated area. *** Percentage of Owner-Occupied Units is the number of owner-occupied housing units in a particular geography divided by number of owner-occupied housing units in the area based on 2000 Census information.
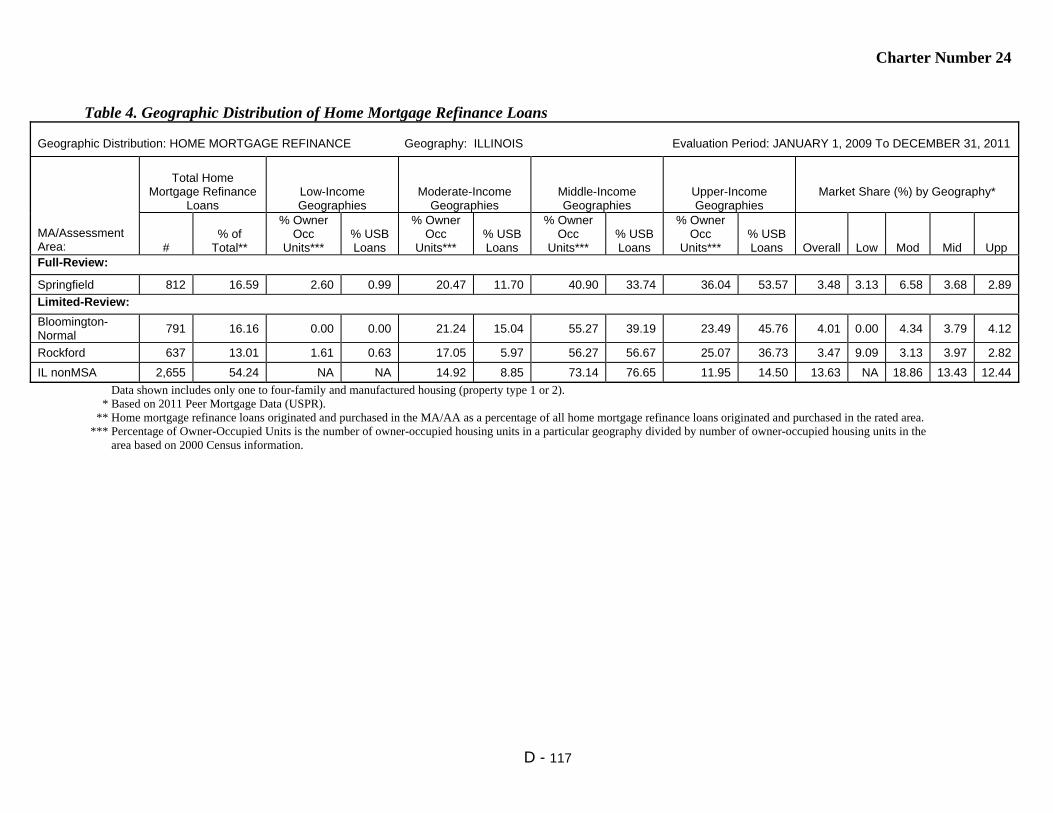
Charter Number 24
D - 117
Table 4. Geographic Distribution of Home Mortgage Refinance Loans
Geographic Distribution: HOME MORTGAGE REFINANCE Geography: ILLINOIS Evaluation Period: JANUARY 1, 2009 To DECEMBER 31, 2011
MA/Assessment Area:
Total Home
Mortgage Refinance Loans
Low-Income Geographies
Moderate-Income Geographies
Middle-Income Geographies
Upper-Income Geographies
Market Share (%) by Geography*
#
% of
Total**
% Owner Occ
Units***
% USB Loans
% Owner Occ
Units***
% USB Loans
% Owner Occ
Units***
% USB Loans
% Owner Occ
Units***
% USB Loans
Overall
Low
Mod
Mid
Upp
Full-Review:
Springfield 812 16.59 2.60 0.99 20.47 11.70 40.90 33.74 36.04 53.57 3.48 3.13 6.58 3.68 2.89
Limited-Review:
Bloomington- Normal
791 16.16 0.00 0.00 21.24 15.04 55.27 39.19 23.49 45.76 4.01 0.00 4.34 3.79 4.12
Rockford 637 13.01 1.61 0.63 17.05 5.97 56.27 56.67 25.07 36.73 3.47 9.09 3.13 3.97 2.82
IL nonMSA 2,655 54.24 NA NA 14.92 8.85 73.14 76.65 11.95 14.50 13.63 NA 18.86 13.43 12.44
Data shown includes only one to four-family and manufactured housing (property type 1 or 2). * Based on 2011 Peer Mortgage Data (USPR). ** Home mortgage refinance loans originated and purchased in the MA/AA as a percentage of all home mortgage refinance loans originated and purchased in the rated area. *** Percentage of Owner-Occupied Units is the number of owner-occupied housing units in a particular geography divided by number of owner-occupied housing units in the area based on 2000 Census information.
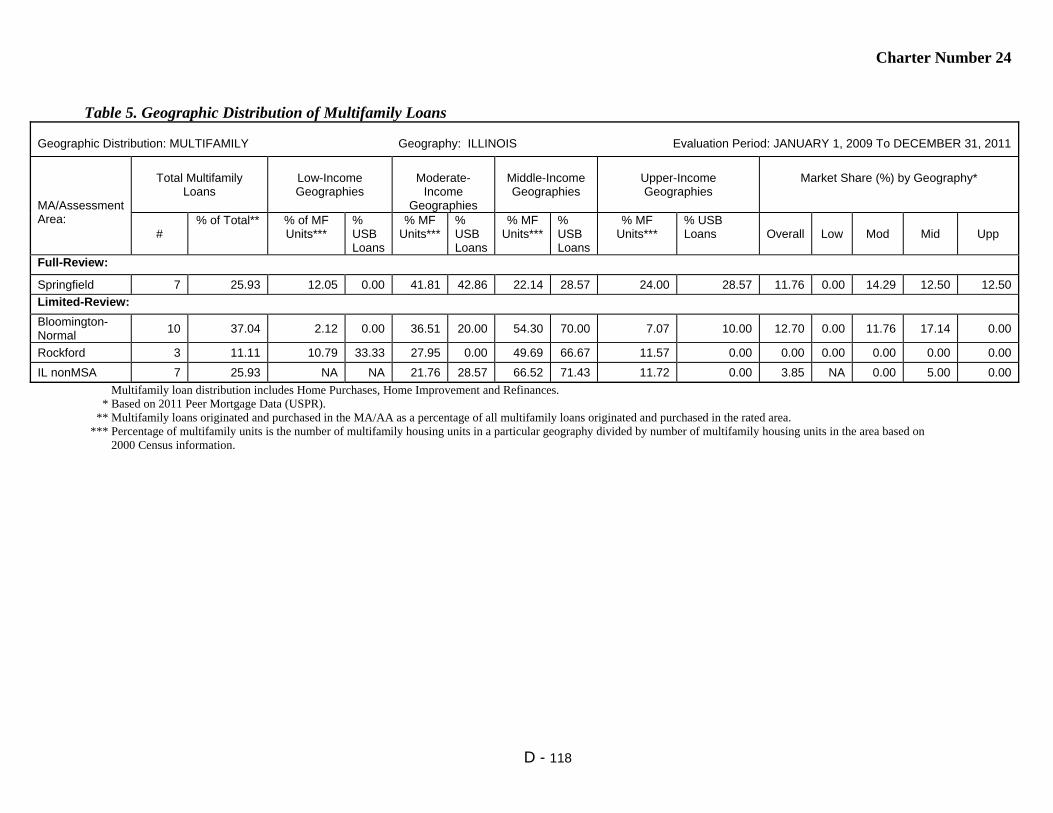
Charter Number 24
D - 118
Table 5. Geographic Distribution of Multifamily Loans
Geographic Distribution: MULTIFAMILY Geography: ILLINOIS Evaluation Period: JANUARY 1, 2009 To DECEMBER 31, 2011
MA/Assessment Area:
Total Multifamily
Loans
Low-Income Geographies
Moderate-
Income Geographies
Middle-Income Geographies
Upper-Income Geographies
Market Share (%) by Geography*
#
% of Total** % of MF Units***
% USB Loans
% MF Units***
% USB Loans
% MF Units***
% USB Loans
% MF Units***
% USB Loans
Overall
Low
Mod
Mid
Upp
Full-Review:
Springfield 7 25.93 12.05 0.00 41.81 42.86 22.14 28.57 24.00 28.57 11.76 0.00 14.29 12.50 12.50
Limited-Review:
Bloomington- Normal
10 37.04 2.12 0.00 36.51 20.00 54.30 70.00 7.07 10.00 12.70 0.00 11.76 17.14 0.00
Rockford 3 11.11 10.79 33.33 27.95 0.00 49.69 66.67 11.57 0.00 0.00 0.00 0.00 0.00 0.00
IL nonMSA 7 25.93 NA NA 21.76 28.57 66.52 71.43 11.72 0.00 3.85 NA 0.00 5.00 0.00
Multifamily loan distribution includes Home Purchases, Home Improvement and Refinances. * Based on 2011 Peer Mortgage Data (USPR). ** Multifamily loans originated and purchased in the MA/AA as a percentage of all multifamily loans originated and purchased in the rated area. *** Percentage of multifamily units is the number of multifamily housing units in a particular geography divided by number of multifamily housing units in the area based on 2000 Census information.
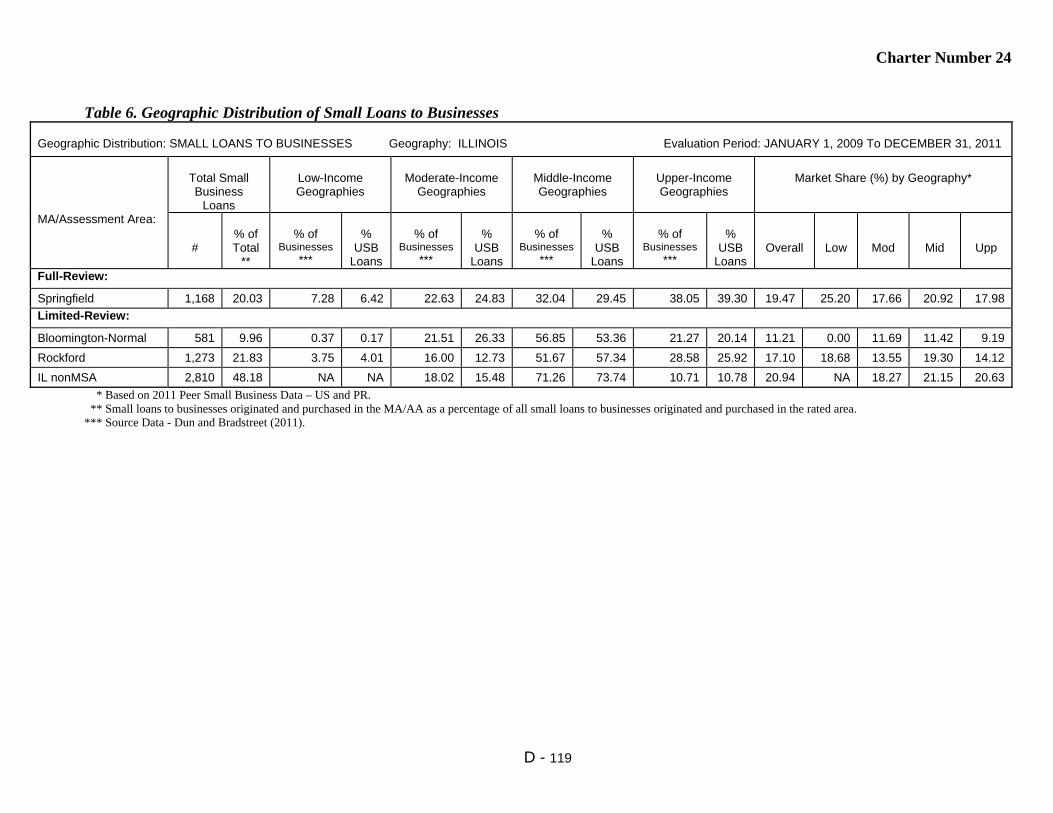
Charter Number 24
D - 119
Table 6. Geographic Distribution of Small Loans to Businesses
Geographic Distribution: SMALL LOANS TO BUSINESSES Geography: ILLINOIS Evaluation Period: JANUARY 1, 2009 To DECEMBER 31, 2011
MA/Assessment Area:
Total Small Business
Loans
Low-Income Geographies
Moderate-Income
Geographies
Middle-Income Geographies
Upper-Income Geographies
Market Share (%) by Geography*
#
% of Total
**
% of
Businesses ***
%
USB Loans
% of
Businesses ***
%
USB Loans
% of
Businesses ***
%
USB Loans
% of
Businesses ***
%
USB Loans
Overall
Low
Mod
Mid
Upp
Full-Review:
Springfield 1,168 20.03 7.28 6.42 22.63 24.83 32.04 29.45 38.05 39.30 19.47 25.20 17.66 20.92 17.98
Limited-Review:
Bloomington-Normal 581 9.96 0.37 0.17 21.51 26.33 56.85 53.36 21.27 20.14 11.21 0.00 11.69 11.42 9.19
Rockford 1,273 21.83 3.75 4.01 16.00 12.73 51.67 57.34 28.58 25.92 17.10 18.68 13.55 19.30 14.12
IL nonMSA 2,810 48.18 NA NA 18.02 15.48 71.26 73.74 10.71 10.78 20.94 NA 18.27 21.15 20.63
* Based on 2011 Peer Small Business Data – US and PR. ** Small loans to businesses originated and purchased in the MA/AA as a percentage of all small loans to businesses originated and purchased in the rated area. *** Source Data - Dun and Bradstreet (2011).
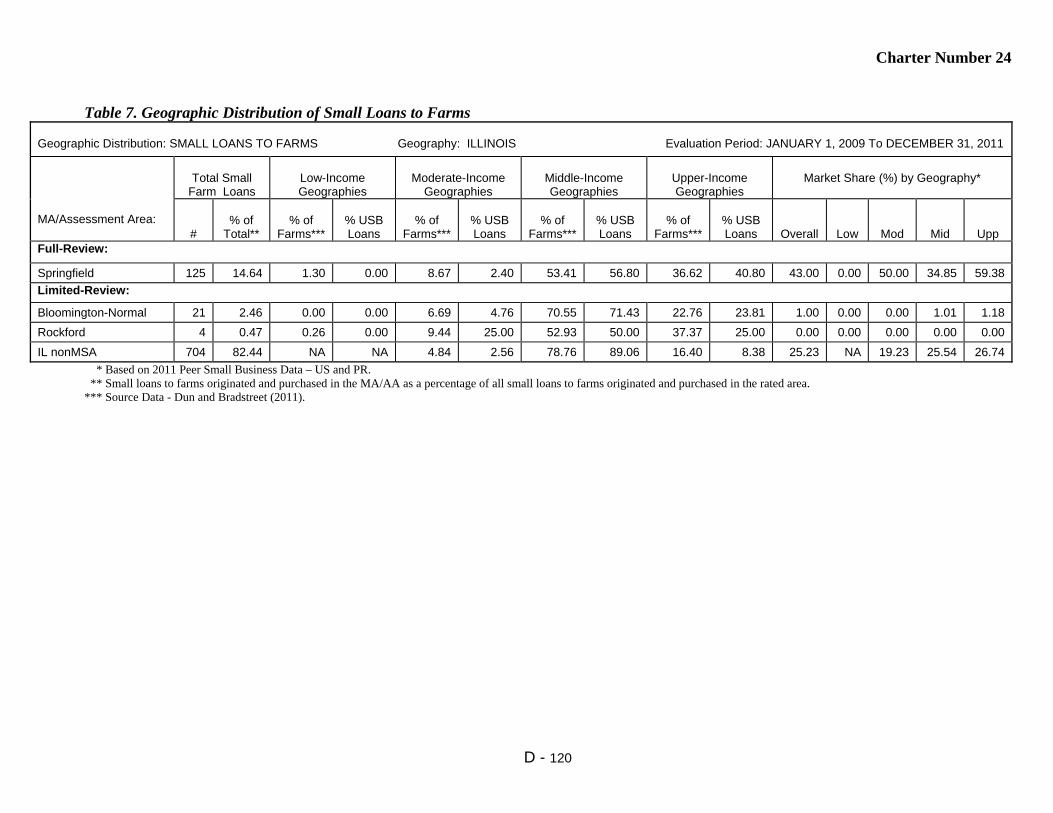
Charter Number 24
D - 120
Table 7. Geographic Distribution of Small Loans to Farms
Geographic Distribution: SMALL LOANS TO FARMS Geography: ILLINOIS Evaluation Period: JANUARY 1, 2009 To DECEMBER 31, 2011
MA/Assessment Area:
Total Small
Farm Loans
Low-Income Geographies
Moderate-Income
Geographies
Middle-Income Geographies
Upper-Income Geographies
Market Share (%) by Geography*
#
% of
Total**
% of
Farms***
% USB Loans
% of
Farms***
% USB Loans
% of
Farms***
% USB Loans
% of
Farms***
% USB Loans
Overall
Low
Mod
Mid
Upp
Full-Review:
Springfield 125 14.64 1.30 0.00 8.67 2.40 53.41 56.80 36.62 40.80 43.00 0.00 50.00 34.85 59.38
Limited-Review:
Bloomington-Normal 21 2.46 0.00 0.00 6.69 4.76 70.55 71.43 22.76 23.81 1.00 0.00 0.00 1.01 1.18
Rockford 4 0.47 0.26 0.00 9.44 25.00 52.93 50.00 37.37 25.00 0.00 0.00 0.00 0.00 0.00
IL nonMSA 704 82.44 NA NA 4.84 2.56 78.76 89.06 16.40 8.38 25.23 NA 19.23 25.54 26.74
* Based on 2011 Peer Small Business Data – US and PR. ** Small loans to farms originated and purchased in the MA/AA as a percentage of all small loans to farms originated and purchased in the rated area. *** Source Data - Dun and Bradstreet (2011).

Charter Number 24
D - 121
Table 8. Borrower Distribution of Home Purchase Loans
Borrower Distribution: HOME PURCHASE Geography: ILLINOIS Evaluation Period: JANUARY 1, 2009 To DECEMBER 31, 2011
MA/Assessment Area:
Total Home
Purchase Loans
Low-Income Borrowers
Moderate-Income
Borrowers
Middle-Income
Borrowers
Upper-Income
Borrowers
Market Share*
#
% of Total **
% Families
***
% USB Loans
****
% Families
***
% USB Loans
****
% Families
***
% USB Loans
****
% Families
***
% USB Loans
****
Over-
all
Low
Mod
Mid
Upp
Full-Review:
Springfield 814 25.98 18.59 19.55 18.94 24.77 23.76 27.27 38.71 28.41 5.11 4.57 4.75 6.70 4.52
Limited-Review:
Bloomington- Normal
326 10.41 17.41 14.97 18.87 27.27 26.57 33.69 37.15 24.06 2.51 1.88 2.18 2.88 2.80
Rockford 336 10.72 19.09 18.82 19.24 38.17 24.25 24.19 37.43 18.82 2.27 2.08 2.86 2.10 1.88
IL nonMSA 1,657 52.89 17.88 14.91 19.13 26.42 24.56 28.41 38.43 30.26 15.07 12.01 16.13 15.96 14.61
Data shown includes only one to four-family and manufactured housing (property type 1 or 2). * Based on 2011 Peer Mortgage Data (USPR). ** Home purchase loans originated and purchased in the MA/AA as a percentage of all home purchase loans originated and purchased in the rated area. *** Percentage of Families is based on the 2000 Census information. **** As a percentage of loans with borrower income information available. No information was available for 24.2% of loans originated and purchased by the bank.

Charter Number 24
D - 122
Table 9. Borrower Distribution of Home Improvement Loans
Borrower Distribution: HOME IMPROVEMENT Geography: ILLINOIS Evaluation Period: JANUARY 1, 2009 To DECEMBER 31, 2011
MA/Assessment Area:
Total Home Improvement
Loans
Low-Income Borrowers
Moderate-Income
Borrowers
Middle-Income
Borrowers
Upper-Income
Borrowers
Market Share*
#
% of Total
**
% Families
***
% USB Loans
****
% Families
***
% USB Loans
****
% Families
***
% USB Loans
****
% Families
***
% USB Loans
****
Over-
all
Low
Mod
Mid
Upp
Full-Review:
Springfield 32 11.76 18.59 19.23 18.94 26.92 23.76 7.69 38.71 46.15 1.55 5.00 2.13 0.00 1.63
Limited-Review:
Bloomington-Normal 12 4.41 17.41 25.00 18.87 0.00 26.57 62.50 37.15 12.50 3.03 6.25 0.00 8.33 0.92
Rockford 30 11.03 19.09 26.67 19.24 36.67 24.25 20.00 37.43 16.67 4.71 8.82 4.69 4.65 3.26
IL nonMSA 198 72.79 17.88 12.24 19.13 28.57 24.56 26.53 38.43 32.65 17.27 19.74 25.64 16.36 13.62
Data shown includes only one to four-family and manufactured housing (property type of 1 or 2). * Based on 2011 Peer Mortgage Data (USPR). ** Home improvement loans originated and purchased in the MA/AA as a percentage of all home improvement loans originated and purchased in the rated area. *** Percentage of Families is based on the 2000 Census information. **** As a percentage of loans with borrower income information available. No information was available for 4.4% of loans originated and purchased by the bank.

Charter Number 24
D - 123
Table 10. Borrower Distribution of Home Mortgage Refinance Loans
Borrower Distribution: HOME MORTGAGE REFINANCE Geography: ILLINOIS Evaluation Period: JANUARY 1, 2009 To DECEMBER 31, 2011
MA/Assessment Area:
Total Home Mortgage
Refinance Loans
Low-Income Borrowers
Moderate-Income
Borrowers
Middle-Income
Borrowers
Upper-Income
Borrowers
Market Share*
#
% of Total **
% Families
***
% USB Loans
****
% Families
***
% USB Loans
****
% Families
***
% USB Loans
****
% Families
***
% USB Loans
****
Over-
all
Low
Mod
Mid
Upp
Full-Review:
Springfield 812 16.59 18.59 7.41 18.94 18.76 23.76 26.78 38.71 47.05 3.09 3.99 4.27 3.68 2.31
Limited-Review:
Bloomington- Normal
791 16.16 17.41 9.63 18.87 21.48 26.57 34.57 37.15 34.32 2.57 5.33 3.36 2.84 1.61
Rockford 637 13.01 19.09 7.99 19.24 23.41 24.25 28.86 37.43 39.75 3.61 1.84 4.09 3.81 3.63
IL nonMSA 2,655 54.24 17.88 5.89 19.13 18.90 24.56 26.92 38.43 48.28 14.57 17.31 16.98 15.28 13.08
Data shown includes only one to four-family and manufactured housing (property type 1 or 2). * Based on 2011 Peer Mortgage Data (USPR). ** Home refinance loans originated and purchased in the MA/AA as a percentage of all home refinance loans originated and purchased in the rated area. *** Percentage of Families is based on the 2000 Census information. **** As a percentage of loans with borrower income information available. No information was available for 17.0% of loans originated and purchased by the bank.

Charter Number 24
D - 124
Table 11. Borrower Distribution of Small Loans to Businesses
Borrower Distribution: SMALL LOANS TO BUSINESSES Geography: ILLINOIS Evaluation Period: JANUARY 1, 2009 To DECEMBER 31, 2011
MA/Assessment Area:
Total Small Loans to
Businesses
Businesses With Revenues of $1 million or
less
Loans by Original Amount Regardless of Business Size
Market Share*
#
% of
Total**
% of Businesses
***
% USB
Loans****
$100,000 or
less
>$100,000 to $250,000
>$250,000 to $1,000,000
All
Rev $1 Million or
Less Full-Review:
Springfield 1,168 20.03 63.89 62.24 85.87 9.25 4.88 19.47 26.43
Limited-Review:
Bloomington-Normal 581 9.96 66.06 55.42 94.15 2.24 3.61 11.21 13.29
Rockford 1,273 21.83 67.94 47.05 96.47 2.28 1.26 17.10 20.12
IL nonMSA 2,810 48.18 69.55 62.53 91.21 4.48 4.31 20.94 27.55
* Based on 2011 Peer Small Business Data – US and PR. ** Small loans to businesses originated and purchased in the MA/AA as a percentage of all small loans to businesses originated and purchased in the rated area. *** Businesses with revenues of $1 million or less as a percentage of all businesses (Source Dun and Bradstreet - 2011). **** Small loans to businesses with revenues of $1 million or less as a percentage of all loans reported as small loans to businesses. No information was available for 26.0% of small loans to businesses originated and purchased by the bank.

Charter Number 24
D - 125
Table 12. Borrower Distribution of Small Loans to Farms
Borrower Distribution: SMALL LOANS TO FARMS Geography: ILLINOIS Evaluation Period: JANUARY 1, 2009 To DECEMBER 31, 2011
MA/Assessment Area:
Total Small Loans to Farms
Farms With Revenues of $1 million or less
Loans by Original Amount Regardless of Farm Size
Market Share*
#
% of
Total**
% of
Farms***
% USB
Loans****
$100,000 or
less
>$100,000 to $250,000
>$250,000 to $500,000
All
Rev $1 Million or
Less Full-Review:
Springfield 125 14.64 98.05 86.40 65.60 19.20 15.20 43.00 48.00
Limited-Review:
Bloomington-Normal 21 2.46 97.95 42.86 38.10 47.62 14.29 1.00 1.22
Rockford 4 0.47 97.45 100.00 50.00 50.00 0.00 0.00 0.00
IL nonMSA 704 82.44 98.96 92.05 67.05 22.30 10.65 25.23 27.20
* Based on 2011 Peer Small Business Data – US and PR. ** Small loans to farms originated and purchased in the MA/AA as a percentage of all small loans to farms originated and purchased in the rated area. *** Farms with revenues of $1 million or less as a percentage of all farms (Source Dun and Bradstreet - 2011). **** Small loans to farms with revenues of $1 million or less as a percentage of all loans reported as small loans to farms. No information was available for 5.0% of small loans to farms originated and purchased by the bank.

Charter Number 24
D - 126
Table 14. Qualified Investments
QUALIFIED INVESTMENTS Geography: ILLINOIS Evaluation Period: JANUARY 1, 2009 To MARCH 31, 2012
MA/Assessment Area:
Prior Period Investments* Current Period Investments** Total Investments Unfunded Commitments***
# $(000’s) # $(000’s) # $(000’s) % of Total # $(000’s) Full-Review:
Springfield 16 470 21 2,293 37 2,763 0.94% 0 0
Limited-Review:
Bloomington-Normal 4 166 5 144 9 310 0.11% 0 0
Rockford 25 1,224 84 1,606 109 2,830 0.96% 2 489
IL nonMSA 34 3,265 118 9,743 152 13,009 4.43% 0 0
IL Statewide 1 30 14 55,007 15 55,037 18.75% 0 0
* 'Prior Period Investments' means investments made in a previous evaluation period that are outstanding as of the examination date. ** The evaluation period for current period investments is January 1, 2009 to March 31, 2012. *** 'Unfunded Commitments' means legally binding investment commitments that are tracked and recorded by the institution's financial reporting system.

Charter Number 24
D - 127
Table 15. Distribution of Branch Delivery System and Branch Openings/Closings
DISTRIBUTION OF BRANCH DELIVERY SYSTEM/BRANCH OPENINGS/CLOSINGS Geography: ILLINOIS Evaluation Period: JANUARY 1, 2009 To DECEMBER 31, 2011
MA/Assessment Area:
Deposits Branches Branch Openings/Closings Population
% of Rated
Area Deposits in
AA
# of USB Branches
% of Rated
Area Branches in
AA
Location of Branches by
Income of Geographies (%)
# of Branch
Openings
# of Branch
Closings
Net change in Location of Branches (+ or - )
% of Population within Each
Geography
Low
Mod
Mid
Upp
Low
Mod
Mid
Upp
Low
Mod
Mid
Upp
Full-Review:
Springfield 24.46 6 16.22 33.33 16.67 0.00 50.00 0 0 0 0 0 0 5.38 23.74 38.50 32.38
Limited-Review:
Bloomington- Normal
3.47 2 5.41 0.00 0.00 100.00 0.00 0 0 0 0 0 0 5.16 22.68 53.48 18.67
Rockford 15.61 8 21.62 12.50 25.00 25.00 37.50 0 0 0 0 0 0 4.28 22.43 51.50 21.79
IL nonMSA 56.45 21 56.76 NA 19.05 71.43 9.52 0 1 NA 0 -1 0 NA 16.27 72.74 10.99
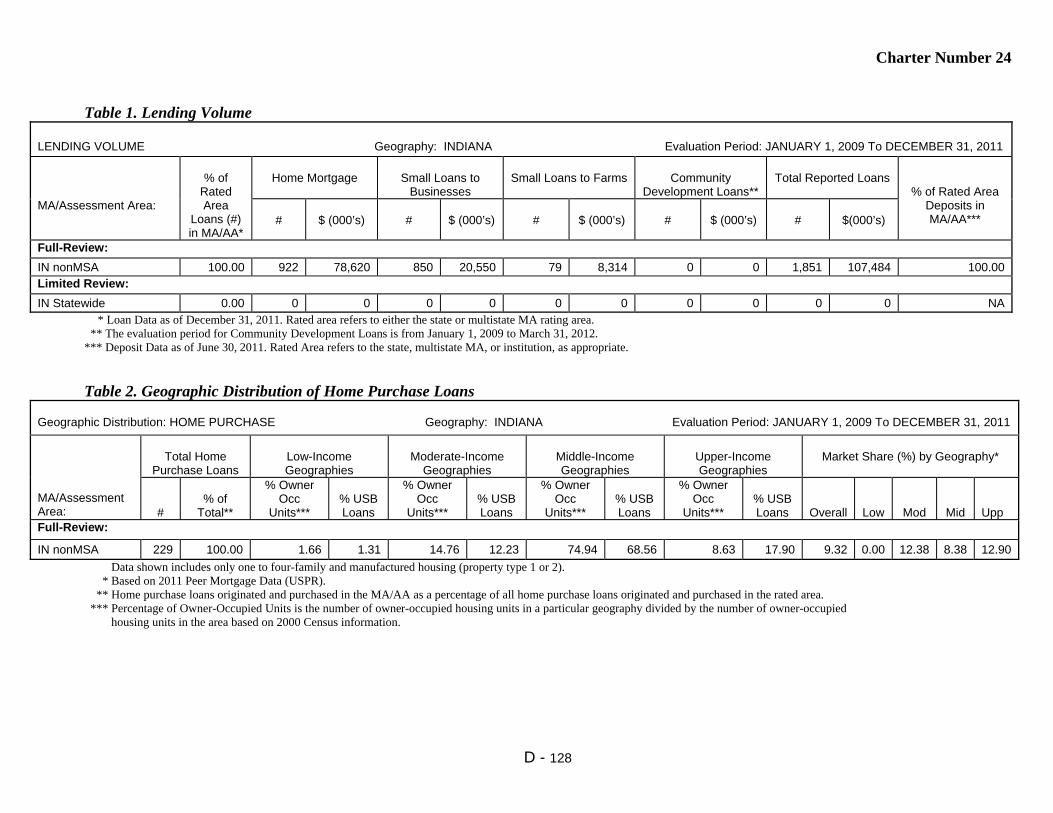
Charter Number 24
D - 128
Table 1. Lending Volume
LENDING VOLUME Geography: INDIANA Evaluation Period: JANUARY 1, 2009 To DECEMBER 31, 2011
MA/Assessment Area:
% of
Rated Area
Loans (#) in MA/AA*
Home Mortgage
Small Loans to
Businesses
Small Loans to Farms
Community
Development Loans**
Total Reported Loans
% of Rated Area Deposits in MA/AA***
#
$ (000’s)
#
$ (000’s)
#
$ (000’s)
#
$ (000’s)
#
$(000’s)
Full-Review:
IN nonMSA 100.00 922 78,620 850 20,550 79 8,314 0 0 1,851 107,484 100.00 Limited Review:
IN Statewide 0.00 0 0 0 0 0 0 0 0 0 0 NA * Loan Data as of December 31, 2011. Rated area refers to either the state or multistate MA rating area. ** The evaluation period for Community Development Loans is from January 1, 2009 to March 31, 2012. *** Deposit Data as of June 30, 2011. Rated Area refers to the state, multistate MA, or institution, as appropriate.
Table 2. Geographic Distribution of Home Purchase Loans Geographic Distribution: HOME PURCHASE Geography: INDIANA Evaluation Period: JANUARY 1, 2009 To DECEMBER 31, 2011
MA/Assessment Area:
Total Home
Purchase Loans
Low-Income Geographies
Moderate-Income
Geographies
Middle-Income Geographies
Upper-Income Geographies
Market Share (%) by Geography*
#
% of
Total**
% Owner Occ
Units***
% USB Loans
% Owner Occ
Units***
% USB Loans
% Owner Occ
Units***
% USB Loans
% Owner Occ
Units***
% USB Loans
Overall
Low
Mod
Mid
Upp
Full-Review:
IN nonMSA 229 100.00 1.66 1.31 14.76 12.23 74.94 68.56 8.63 17.90 9.32 0.00 12.38 8.38 12.90
Data shown includes only one to four-family and manufactured housing (property type 1 or 2). * Based on 2011 Peer Mortgage Data (USPR). ** Home purchase loans originated and purchased in the MA/AA as a percentage of all home purchase loans originated and purchased in the rated area. *** Percentage of Owner-Occupied Units is the number of owner-occupied housing units in a particular geography divided by the number of owner-occupied housing units in the area based on 2000 Census information.

Charter Number 24
D - 129
Table 3. Geographic Distribution of Home Improvement Loans
Geographic Distribution: HOME IMPROVEMENT Geography: INDIANA Evaluation Period: JANUARY 1, 2009 To DECEMBER 31, 2011
MA/Assessment Area:
Total Home
Improvement Loans
Low-Income Geographies
Moderate-Income
Geographies
Middle-Income Geographies
Upper-Income Geographies
Market Share (%) by Geography*
#
% of
Total**
% Owner
Occ Units***
% USB Loans
% Owner
Occ Units***
% USB Loans
% Owner
Occ Units***
% USB Loans
% Owner
Occ Units***
%
USB Loans
Overall
Low
Mod
Mid
Upp
Full-Review:
IN nonMSA 49 100.00 1.66 0.00 14.76 16.33 74.94 81.63 8.63 2.04 18.25 0.00 8.00 22.34 0.00
Data shown includes only one to four-family and manufactured housing (property type 1 or 2). * Based on 2011 Peer Mortgage Data (USPR). ** Home improvement loans originated and purchased in the MA/AA as a percentage of all home improvement loans originated and purchased in the rated area. *** Percentage of Owner-Occupied Units is the number of owner-occupied housing units in a particular geography divided by number of owner-occupied housing units in the area based on 2000 Census information.
Table 4. Geographic Distribution of Home Mortgage Refinance Loans Geographic Distribution: HOME MORTGAGE REFINANCE Geography: INDIANA Evaluation Period: JANUARY 1, 2009 To DECEMBER 31, 2011
MA/Assessment Area:
Total Home Mortgage
Refinance Loans
Low-Income Geographies
Moderate-Income Geographies
Middle-Income Geographies
Upper-Income Geographies
Market Share (%) by Geography*
#
% of
Total**
% Owner Occ
Units***
% USB Loans
% Owner Occ
Units***
% USB Loans
% Owner Occ
Units***
% USB Loans
% Owner Occ
Units***
% USB Loans
Overall
Low
Mod
Mid
Upp
Full-Review:
IN nonMSA 644 100.00 1.66 1.55 14.76 7.14 74.94 76.24 8.63 15.06 15.96 50.00 12.12 16.14 15.52
Data shown includes only one to four-family and manufactured housing (property type 1 or 2). * Based on 2011 Peer Mortgage Data (USPR). ** Home mortgage refinance loans originated and purchased in the MA/AA as a percentage of all home mortgage refinance loans originated and purchased in the rated area. *** Percentage of Owner-Occupied Units is the number of owner-occupied housing units in a particular geography divided by number of owner-occupied housing units in the area based on 2000 Census information.

Charter Number 24
D - 130
Table 5. Geographic Distribution of Multifamily Loans
Geographic Distribution: MULTIFAMILY Geography: INDIANA Evaluation Period: JANUARY 1, 2009 To DECEMBER 31, 2011
MA/Assessment Area:
Total Multifamily
Loans
Low-Income Geographies
Moderate-Income
Geographies
Middle-Income Geographies
Upper-Income Geographies
Market Share (%) by Geography*
#
% of Total**
% of MF Units***
% USB Loans
% MF Units***
% USB Loans
% MF Units***
% USB Loans
% MF Units***
% USB Loans
Overall
Low
Mod
Mid
Upp
Full-Review:
IN nonMSA 0 0.00 13.54 0.00 20.56 0.00 48.16 0.00 17.74 0.00 0.00 0.00 0.00 0.00 0.00
Multifamily loan distribution includes Home Purchases, Home Improvement and Refinances. * Based on 2011 Peer Mortgage Data (USPR). ** Multifamily loans originated and purchased in the MA/AA as a percentage of all multifamily loans originated and purchased in the rated area. *** Percentage of multifamily units is the number of multifamily housing units in a particular geography divided by number of multifamily housing units in the area based on 2000 Census information.
Table 6. Geographic Distribution of Small Loans to Businesses Geographic Distribution: SMALL LOANS TO BUSINESSES Geography: INDIANA Evaluation Period: JANUARY 1, 2009 To DECEMBER 31, 2011
MA/Assessment Area:
Total Small
Business Loans
Low-Income Geographies
Moderate-Income
Geographies
Middle-Income Geographies
Upper-Income Geographies
Market Share (%) by Geography*
#
% of Total
**
% of
Businesses ***
% USB Loans
% of
Businesses ***
% USB Loans
% of
Businesses ***
% USB Loans
% of
Businesses ***
% USB Loans
Overall
Low
Mod
Mid
Upp
Full-Review:
IN nonMSA 850 100.00 6.65 5.29 14.38 16.24 68.34 69.06 10.63 9.41 25.46 27.59 25.12 26.25 20.00
* Based on 2011 Peer Small Business Data – US and PR. ** Small loans to businesses originated and purchased in the MA/AA as a percentage of all small loans to businesses originated and purchased in the rated area. *** Source Data - Dun and Bradstreet (2011).
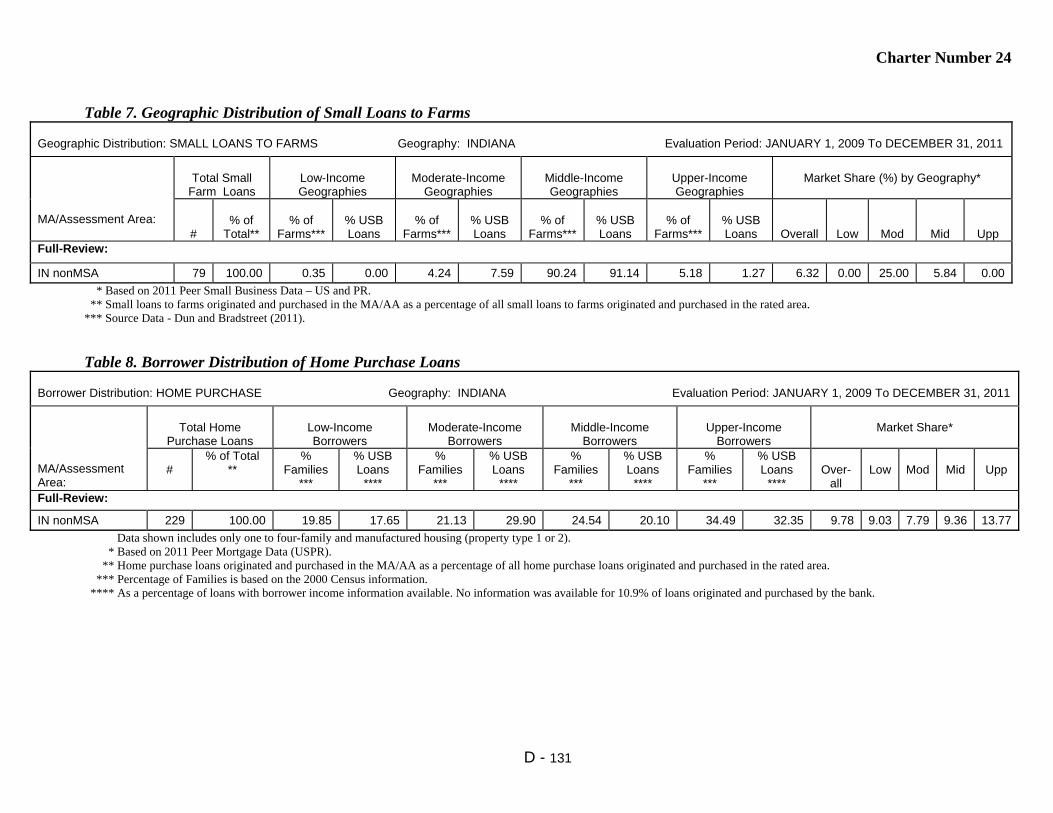
Charter Number 24
D - 131
Table 7. Geographic Distribution of Small Loans to Farms
Geographic Distribution: SMALL LOANS TO FARMS Geography: INDIANA Evaluation Period: JANUARY 1, 2009 To DECEMBER 31, 2011
MA/Assessment Area:
Total Small
Farm Loans
Low-Income Geographies
Moderate-Income
Geographies
Middle-Income Geographies
Upper-Income Geographies
Market Share (%) by Geography*
#
% of
Total**
% of
Farms***
% USB Loans
% of
Farms***
% USB Loans
% of
Farms***
% USB Loans
% of
Farms***
% USB Loans
Overall
Low
Mod
Mid
Upp
Full-Review:
IN nonMSA 79 100.00 0.35 0.00 4.24 7.59 90.24 91.14 5.18 1.27 6.32 0.00 25.00 5.84 0.00
* Based on 2011 Peer Small Business Data – US and PR. ** Small loans to farms originated and purchased in the MA/AA as a percentage of all small loans to farms originated and purchased in the rated area. *** Source Data - Dun and Bradstreet (2011).
Table 8. Borrower Distribution of Home Purchase Loans Borrower Distribution: HOME PURCHASE Geography: INDIANA Evaluation Period: JANUARY 1, 2009 To DECEMBER 31, 2011
MA/Assessment Area:
Total Home
Purchase Loans
Low-Income Borrowers
Moderate-Income
Borrowers
Middle-Income
Borrowers
Upper-Income
Borrowers
Market Share*
#
% of Total **
% Families
***
% USB Loans
****
% Families
***
% USB Loans
****
% Families
***
% USB Loans
****
% Families
***
% USB Loans
****
Over-
all
Low
Mod
Mid
Upp
Full-Review:
IN nonMSA 229 100.00 19.85 17.65 21.13 29.90 24.54 20.10 34.49 32.35 9.78 9.03 7.79 9.36 13.77
Data shown includes only one to four-family and manufactured housing (property type 1 or 2). * Based on 2011 Peer Mortgage Data (USPR). ** Home purchase loans originated and purchased in the MA/AA as a percentage of all home purchase loans originated and purchased in the rated area. *** Percentage of Families is based on the 2000 Census information. **** As a percentage of loans with borrower income information available. No information was available for 10.9% of loans originated and purchased by the bank.

Charter Number 24
D - 132
Table 9. Borrower Distribution of Home Improvement Loans
Borrower Distribution: HOME IMPROVEMENT Geography: INDIANA Evaluation Period: JANUARY 1, 2009 To DECEMBER 31, 2011
MA/Assessment Area:
Total Home Improvement
Loans
Low-Income Borrowers
Moderate-Income
Borrowers
Middle-Income
Borrowers
Upper-Income
Borrowers
Market Share*
#
% of Total
**
% Families
***
% USB Loans
****
% Families
***
% USB Loans
****
% Families
***
% USB Loans
****
% Families
***
% USB Loans
****
Over-
all
Low
Mod
Mid
Upp
Full-Review:
IN nonMSA 49 100.00 19.85 38.78 21.13 20.41 24.54 18.37 34.49 22.45 19.01 27.59 17.86 20.00 11.76
Data shown includes only one to four-family and manufactured housing (property type of 1 or 2). * Based on 2011 Peer Mortgage Data (USPR). ** Home improvement loans originated and purchased in the MA/AA as a percentage of all home improvement loans originated and purchased in the rated area. *** Percentage of Families is based on the 2000 Census information. **** As a percentage of loans with borrower income information available. No information was available for 0.0% of loans originated and purchased by the bank.
Table 10. Borrower Distribution of Home Mortgage Refinance Loans Borrower Distribution: HOME MORTGAGE REFINANCE Geography: INDIANA Evaluation Period: JANUARY 1, 2009 To DECEMBER 31, 2011
MA/Assessment Area:
Total Home Mortgage
Refinance Loans
Low-Income Borrowers
Moderate-Income Borrowers
Middle-Income Borrowers
Upper-Income Borrowers
Market Share*
#
% of Total **
% Families
***
% USB Loans
****
% Families
***
% USB Loans
****
% Families
***
% USB Loans
****
% Families
***
% USB Loans
****
Over-
all
Low
Mod
Mid
Upp
Full-Review:
IN nonMSA 644 100.00 19.85 13.43 21.13 27.96 24.54 27.80 34.49 30.81 18.36 13.51 22.49 20.92 15.58
Data shown includes only one to four-family and manufactured housing (property type 1 or 2). * Based on 2011 Peer Mortgage Data (USPR). ** Home refinance loans originated and purchased in the MA/AA as a percentage of all home refinance loans originated and purchased in the rated area. *** Percentage of Families is based on the 2000 Census information. **** As a percentage of loans with borrower income information available. No information was available for 1.7% of loans originated and purchased by the bank.
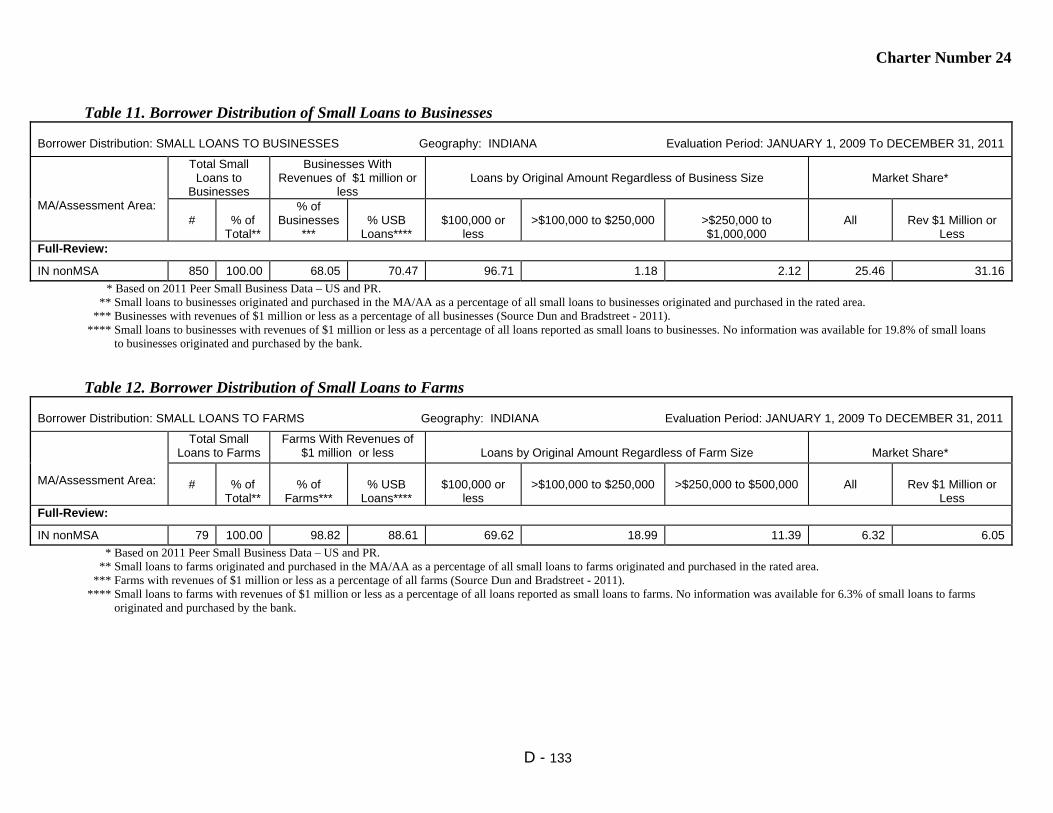
Charter Number 24
D - 133
Table 11. Borrower Distribution of Small Loans to Businesses
Borrower Distribution: SMALL LOANS TO BUSINESSES Geography: INDIANA Evaluation Period: JANUARY 1, 2009 To DECEMBER 31, 2011
MA/Assessment Area:
Total Small Loans to
Businesses
Businesses With Revenues of $1 million or
less
Loans by Original Amount Regardless of Business Size
Market Share*
#
% of
Total**
% of Businesses
***
% USB
Loans****
$100,000 or
less
>$100,000 to $250,000
>$250,000 to $1,000,000
All
Rev $1 Million or
Less Full-Review:
IN nonMSA 850 100.00 68.05 70.47 96.71 1.18 2.12 25.46 31.16
* Based on 2011 Peer Small Business Data – US and PR. ** Small loans to businesses originated and purchased in the MA/AA as a percentage of all small loans to businesses originated and purchased in the rated area. *** Businesses with revenues of $1 million or less as a percentage of all businesses (Source Dun and Bradstreet - 2011). **** Small loans to businesses with revenues of $1 million or less as a percentage of all loans reported as small loans to businesses. No information was available for 19.8% of small loans to businesses originated and purchased by the bank.
Table 12. Borrower Distribution of Small Loans to Farms Borrower Distribution: SMALL LOANS TO FARMS Geography: INDIANA Evaluation Period: JANUARY 1, 2009 To DECEMBER 31, 2011
MA/Assessment Area:
Total Small Loans to Farms
Farms With Revenues of $1 million or less
Loans by Original Amount Regardless of Farm Size
Market Share*
#
% of
Total**
% of
Farms***
% USB
Loans****
$100,000 or
less
>$100,000 to $250,000
>$250,000 to $500,000
All
Rev $1 Million or
Less Full-Review:
IN nonMSA 79 100.00 98.82 88.61 69.62 18.99 11.39 6.32 6.05
* Based on 2011 Peer Small Business Data – US and PR. ** Small loans to farms originated and purchased in the MA/AA as a percentage of all small loans to farms originated and purchased in the rated area. *** Farms with revenues of $1 million or less as a percentage of all farms (Source Dun and Bradstreet - 2011). **** Small loans to farms with revenues of $1 million or less as a percentage of all loans reported as small loans to farms. No information was available for 6.3% of small loans to farms originated and purchased by the bank.
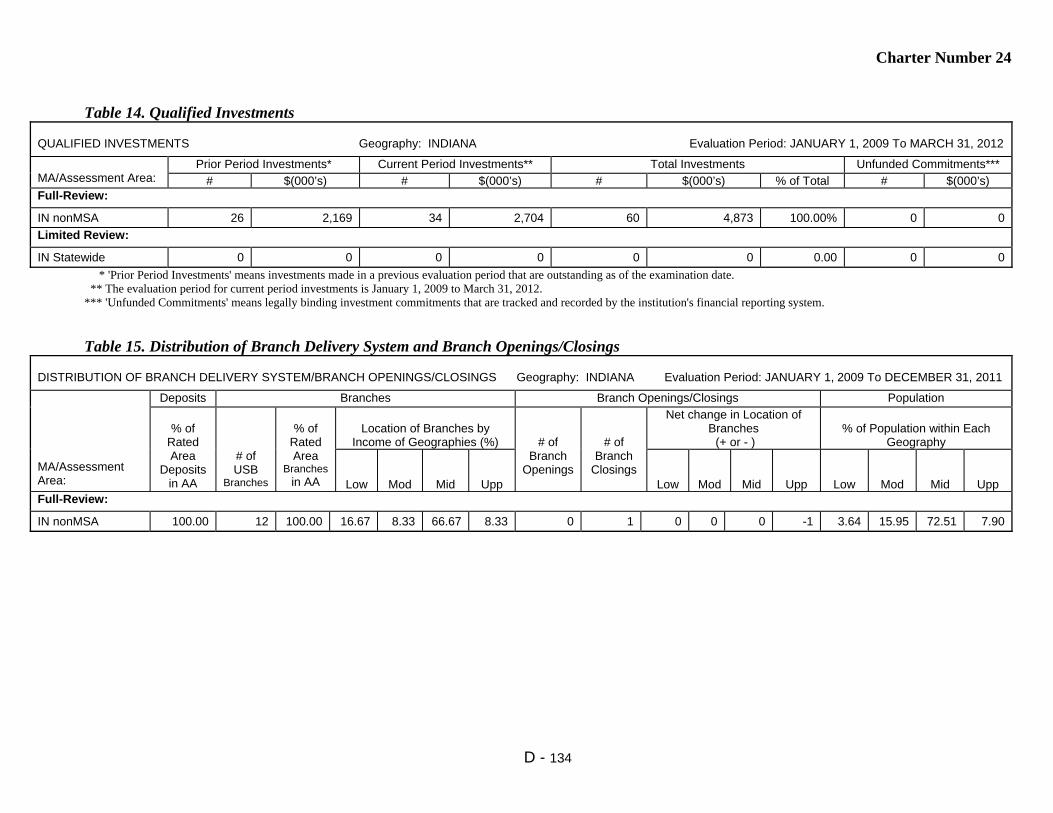
Charter Number 24
D - 134
Table 14. Qualified Investments
QUALIFIED INVESTMENTS Geography: INDIANA Evaluation Period: JANUARY 1, 2009 To MARCH 31, 2012
MA/Assessment Area:
Prior Period Investments* Current Period Investments** Total Investments Unfunded Commitments***
# $(000’s) # $(000’s) # $(000’s) % of Total # $(000’s) Full-Review:
IN nonMSA 26 2,169 34 2,704 60 4,873 100.00% 0 0
Limited Review:
IN Statewide 0 0 0 0 0 0 0.00 0 0
* 'Prior Period Investments' means investments made in a previous evaluation period that are outstanding as of the examination date. ** The evaluation period for current period investments is January 1, 2009 to March 31, 2012. *** 'Unfunded Commitments' means legally binding investment commitments that are tracked and recorded by the institution's financial reporting system.
Table 15. Distribution of Branch Delivery System and Branch Openings/Closings DISTRIBUTION OF BRANCH DELIVERY SYSTEM/BRANCH OPENINGS/CLOSINGS Geography: INDIANA Evaluation Period: JANUARY 1, 2009 To DECEMBER 31, 2011
MA/Assessment Area:
Deposits Branches Branch Openings/Closings Population
% of
Rated Area
Deposits in AA
# of USB
Branches
% of
Rated Area
Branches in AA
Location of Branches by
Income of Geographies (%)
# of Branch
Openings
# of Branch
Closings
Net change in Location of Branches (+ or - )
% of Population within Each
Geography
Low
Mod
Mid
Upp
Low
Mod
Mid
Upp
Low
Mod
Mid
Upp
Full-Review:
IN nonMSA 100.00 12 100.00 16.67 8.33 66.67 8.33 0 1 0 0 0 -1 3.64 15.95 72.51 7.90

Charter Number 24
D - 135
Table 1. Lending Volume
LENDING VOLUME Geography: IOWA Evaluation Period: JANUARY 1, 2009 To DECEMBER 31, 2011
MA/Assessment Area:
% of
Rated Area
Loans (#) in MA/AA*
Home Mortgage
Small Loans to
Businesses
Small Loans to Farms
Community
Development Loans**
Total Reported Loans
% of Rated Area Deposits in MA/AA***
#
$ (000’s)
#
$ (000’s)
#
$ (000’s)
#
$ (000’s)
#
$(000’s)
Full-Review:
Des Moines-West Des Moines
26.46 7,124 1,126,463 2,775 144,324 91 10,292 4 127,700 9,994 1,408,779 19.78
Limited-Review:
Ames 3.59 728 117,154 489 18,198 139 20,970 0 0 1,356 156,322 5.02
Cedar Rapids 13.27 3,033 427,487 1,523 102,184 450 50,651 7 46,875 5,013 627,197 18.41
Dubuque 3.67 741 88,854 570 27,649 76 6,751 1 9,798 1,388 133,052 8.09
Iowa City 6.35 1,310 249,010 806 48,981 276 24,418 5 5,162 2,397 327,571 6.72
Sioux City 4.40 875 88,480 696 25,223 89 12,329 0 0 1,660 126,032 3.95
Waterloo-Cedar Falls 7.99 1,629 214,163 1,202 110,917 183 25,196 4 2,868 3,018 353,144 8.17
IA nonMSA 34.25 5,289 540,565 4,112 174,747 3,524 394,797 13 26,192 12,938 1,136,301 29.87
IA Statewide 0.02 0 0 0 0 0 0 6 2,600 6 2,600 NA * Loan Data as of December 31, 2011. Rated area refers to either the state or multistate MA rating area. ** The evaluation period for Community Development Loans is from January 1, 2009 to March 31, 2012. *** Deposit Data as of June 30, 2011. Rated Area refers to the state, multistate MA, or institution, as appropriate.

Charter Number 24
D - 136
Table 2. Geographic Distribution of Home Purchase Loans
Geographic Distribution: HOME PURCHASE Geography: IOWA Evaluation Period: JANUARY 1, 2009 To DECEMBER 31, 2011
MA/Assessment Area:
Total Home
Purchase Loans
Low-Income Geographies
Moderate-Income
Geographies
Middle-Income Geographies
Upper-Income Geographies
Market Share (%) by Geography*
#
% of
Total**
% Owner Occ
Units***
% USB Loans
% Owner Occ
Units***
% USB Loans
% Owner Occ
Units***
% USB Loans
% Owner Occ
Units***
% USB Loans
Overall
Low
Mod
Mid
Upp
Full-Review:
Des Moines- West Des Moines
2,457 31.40 1.78 0.90 17.64 7.33 54.64 47.54 25.94 44.24 9.63 2.94 7.94 9.52 10.27
Limited-Review:
Ames 274 3.50 4.12 1.82 NA NA 74.25 82.85 21.63 15.33 8.36 10.00 NA 9.54 5.00
Cedar Rapids 1,151 14.71 0.47 0.61 9.14 8.43 66.14 60.64 24.25 30.32 6.45 7.69 7.82 6.66 5.78
Dubuque 292 3.73 NA NA 4.59 6.85 91.12 90.41 4.29 2.74 8.74 NA 14.29 8.65 6.35
Iowa City 415 5.30 0.00 0.24 17.87 11.08 49.67 62.17 32.46 26.51 4.29 16.67 3.23 4.39 4.46
Sioux City 442 5.65 0.00 0.00 12.81 9.95 54.83 53.62 32.35 36.43 12.55 0.00 11.25 13.80 11.35
Waterloo-Cedar Fa 741 9.47 1.04 0.94 25.33 20.38 49.34 52.23 24.29 26.45 12.37 2.78 14.58 13.22 9.79
IA nonMSA 2,053 26.24 NA NA 6.19 4.68 82.39 83.00 11.42 12.32 15.06 NA 13.79 15.96 11.43
Data shown includes only one to four-family and manufactured housing (property type 1 or 2). * Based on 2011 Peer Mortgage Data (USPR). ** Home purchase loans originated and purchased in the MA/AA as a percentage of all home purchase loans originated and purchased in the rated area. *** Percentage of Owner-Occupied Units is the number of owner-occupied housing units in a particular geography divided by the number of owner-occupied housing units in the area based on 2000 Census information.
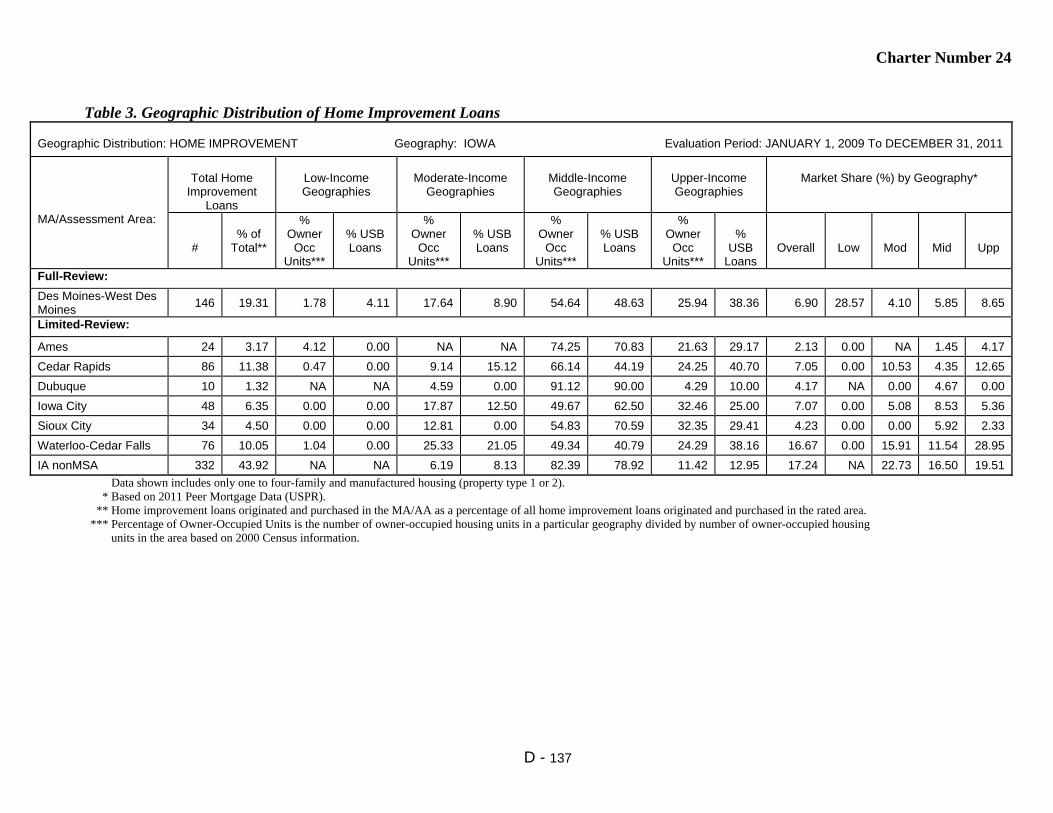
Charter Number 24
D - 137
Table 3. Geographic Distribution of Home Improvement Loans
Geographic Distribution: HOME IMPROVEMENT Geography: IOWA Evaluation Period: JANUARY 1, 2009 To DECEMBER 31, 2011
MA/Assessment Area:
Total Home
Improvement Loans
Low-Income Geographies
Moderate-Income
Geographies
Middle-Income Geographies
Upper-Income Geographies
Market Share (%) by Geography*
#
% of
Total**
% Owner
Occ Units***
% USB Loans
% Owner
Occ Units***
% USB Loans
% Owner
Occ Units***
% USB Loans
% Owner
Occ Units***
%
USB Loans
Overall
Low
Mod
Mid
Upp
Full-Review:
Des Moines-West Des Moines
146 19.31 1.78 4.11 17.64 8.90 54.64 48.63 25.94 38.36 6.90 28.57 4.10 5.85 8.65
Limited-Review:
Ames 24 3.17 4.12 0.00 NA NA 74.25 70.83 21.63 29.17 2.13 0.00 NA 1.45 4.17
Cedar Rapids 86 11.38 0.47 0.00 9.14 15.12 66.14 44.19 24.25 40.70 7.05 0.00 10.53 4.35 12.65
Dubuque 10 1.32 NA NA 4.59 0.00 91.12 90.00 4.29 10.00 4.17 NA 0.00 4.67 0.00
Iowa City 48 6.35 0.00 0.00 17.87 12.50 49.67 62.50 32.46 25.00 7.07 0.00 5.08 8.53 5.36
Sioux City 34 4.50 0.00 0.00 12.81 0.00 54.83 70.59 32.35 29.41 4.23 0.00 0.00 5.92 2.33
Waterloo-Cedar Falls 76 10.05 1.04 0.00 25.33 21.05 49.34 40.79 24.29 38.16 16.67 0.00 15.91 11.54 28.95
IA nonMSA 332 43.92 NA NA 6.19 8.13 82.39 78.92 11.42 12.95 17.24 NA 22.73 16.50 19.51
Data shown includes only one to four-family and manufactured housing (property type 1 or 2). * Based on 2011 Peer Mortgage Data (USPR). ** Home improvement loans originated and purchased in the MA/AA as a percentage of all home improvement loans originated and purchased in the rated area. *** Percentage of Owner-Occupied Units is the number of owner-occupied housing units in a particular geography divided by number of owner-occupied housing units in the area based on 2000 Census information.

Charter Number 24
D - 138
Table 4. Geographic Distribution of Home Mortgage Refinance Loans
Geographic Distribution: HOME MORTGAGE REFINANCE Geography: IOWA Evaluation Period: JANUARY 1, 2009 To DECEMBER 31, 2011
MA/Assessment Area:
Total Home
Mortgage Refinance Loans
Low-Income Geographies
Moderate-Income Geographies
Middle-Income Geographies
Upper-Income Geographies
Market Share (%) by Geography*
#
% of
Total**
% Owner Occ
Units***
% USB Loans
% Owner Occ
Units***
% USB Loans
% Owner Occ
Units***
% USB Loans
% Owner Occ
Units***
% USB Loans
Overall
Low
Mod
Mid
Upp
Full-Review:
Des Moines- West Des Moines
4,503 37.36 1.78 0.78 17.64 5.02 54.64 45.26 25.94 48.95 9.91 13.57 9.09 9.03 10.86
Limited-Review:
Ames 425 3.53 4.12 1.41 NA NA 74.25 63.06 21.63 35.53 8.15 14.81 NA 7.57 9.06
Cedar Rapids 1,782 14.78 0.47 0.34 9.14 6.79 66.14 53.20 24.25 39.67 6.79 5.26 12.50 6.46 6.69
Dubuque 438 3.63 NA NA 4.59 1.83 91.12 89.27 4.29 8.90 6.74 NA 6.25 6.49 11.31
Iowa City 829 6.88 0.00 0.00 17.87 9.17 49.67 50.30 32.46 40.53 6.65 0.00 7.26 6.55 6.63
Sioux City 396 3.29 0.00 0.00 12.81 3.03 54.83 44.95 32.35 52.02 9.13 0.00 6.38 9.60 8.95
Waterloo-Cedar Fa 797 6.61 1.04 0.13 25.33 8.91 49.34 50.56 24.29 40.40 9.89 0.00 9.09 9.94 10.44
IA nonMSA 2,884 23.93 NA NA 6.19 4.92 82.39 75.73 11.42 19.35 11.33 NA 22.71 11.19 10.18
Data shown includes only one to four-family and manufactured housing (property type 1 or 2). * Based on 2011 Peer Mortgage Data (USPR). ** Home mortgage refinance loans originated and purchased in the MA/AA as a percentage of all home mortgage refinance loans originated and purchased in the rated area. *** Percentage of Owner-Occupied Units is the number of owner-occupied housing units in a particular geography divided by number of owner-occupied housing units in the area based on 2000 Census information.

Charter Number 24
D - 139
Table 5. Geographic Distribution of Multifamily Loans
Geographic Distribution: MULTIFAMILY Geography: IOWA Evaluation Period: JANUARY 1, 2009 To DECEMBER 31, 2011
MA/Assessment Area:
Total Multifamily
Loans
Low-Income Geographies
Moderate-
Income Geographies
Middle-Income Geographies
Upper-Income Geographies
Market Share (%) by Geography*
#
% of Total**
% of MF Units***
% USB Loans
% MF Units***
% USB Loans
% MF Units***
% USB
Loans
% MF Units***
% USB Loans
Overall
Low
Mod
Mid
Upp
Full-Review:
Des Moines-West Des Moines
18 19.15 13.42 27.78 15.25 16.67 47.89 38.89 23.44 16.67 11.65 11.76 6.25 11.54 16.67
Limited-Review:
Ames 5 5.32 18.70 20.00 NA NA 62.64 60.00 18.44 20.00 5.00 0.00 NA 8.00 0.00
Cedar Rapids 14 14.89 3.39 0.00 16.23 7.14 64.38 92.86 16.00 0.00 20.00 0.00 0.00 29.63 0.00
Dubuque 1 1.06 NA NA 25.04 0.00 72.85 100.00 2.12 0.00 0.00 NA 0.00 0.00 0.00
Iowa City 18 19.15 4.22 22.22 45.39 38.89 30.77 22.22 19.62 16.67 6.56 0.00 3.03 10.00 14.29
Sioux City 3 3.19 0.07 0.00 28.29 33.33 47.97 33.33 23.67 33.33 10.53 0.00 14.29 10.00 0.00
Waterloo-Cedar Falls 15 15.96 12.44 6.67 13.68 0.00 43.93 46.67 29.95 46.67 12.20 25.00 0.00 15.79 6.67
IA nonMSA 20 21.28 NA NA 10.11 5.00 76.02 95.00 13.87 0.00 24.00 NA 20.00 27.50 0.00
Multifamily loan distribution includes Home Purchases, Home Improvement and Refinances. * Based on 2011 Peer Mortgage Data (USPR). ** Multifamily loans originated and purchased in the MA/AA as a percentage of all multifamily loans originated and purchased in the rated area. *** Percentage of multifamily units is the number of multifamily housing units in a particular geography divided by number of multifamily housing units in the area based on 2000 Census information.

Charter Number 24
D - 140
Table 6. Geographic Distribution of Small Loans to Businesses
Geographic Distribution: SMALL LOANS TO BUSINESSES Geography: IOWA Evaluation Period: JANUARY 1, 2009 To DECEMBER 31, 2011
MA/Assessment Area:
Total Small
Business Loans
Low-Income Geographies
Moderate-Income
Geographies
Middle-Income Geographies
Upper-Income Geographies
Market Share (%) by Geography*
#
% of Total
**
% of
Businesses ***
% USB Loans
% of
Businesses ***
% USB Loans
% of
Businesses ***
% USB Loans
% of
Businesses ***
% USB Loans
Overall
Low
Mod
Mid
Upp
Full-Review:
Des Moines- West Des Moines
2,775 22.80 8.93 10.85 9.24 8.86 48.64 47.71 33.19 32.58 11.39 14.47 13.04 12.44 9.71
Limited-Review:
Ames 489 4.02 9.63 9.41 NA NA 59.44 56.85 28.81 32.52 18.61 17.05 NA 18.15 18.80
Cedar Rapids 1,523 12.51 2.37 3.74 11.61 22.72 60.59 49.70 25.44 23.83 16.68 18.56 29.64 15.01 13.94
Dubuque 570 4.68 NA NA 14.74 15.44 80.34 78.60 4.93 5.96 22.34 NA 26.80 21.82 20.27
Iowa City 806 6.62 4.53 1.86 20.11 22.08 49.17 45.29 26.19 30.77 10.81 2.80 11.44 10.21 13.19
Sioux City 696 5.72 2.16 2.59 23.87 26.58 41.97 34.48 32.00 36.35 20.54 13.33 20.33 21.07 20.96
Waterloo-Cedar Falls
1,202 9.87 10.27 12.23 18.04 16.22 47.56 42.10 24.14 29.45 28.71 20.38 29.34 26.56 33.41
IA nonMSA 4,112 33.78 NA NA 6.28 8.22 82.64 80.59 11.08 11.19 22.66 NA 29.83 22.33 21.11
* Based on 2011 Peer Small Business Data – US and PR. ** Small loans to businesses originated and purchased in the MA/AA as a percentage of all small loans to businesses originated and purchased in the rated area. *** Source Data - Dun and Bradstreet (2011).
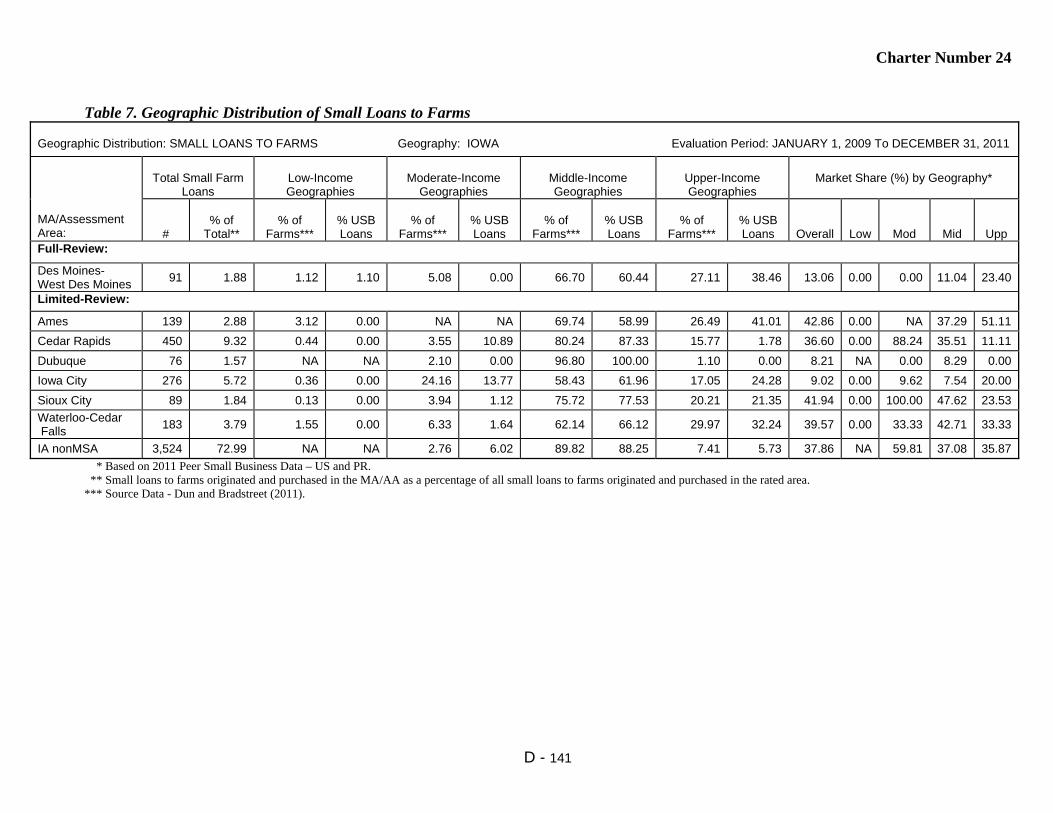
Charter Number 24
D - 141
Table 7. Geographic Distribution of Small Loans to Farms
Geographic Distribution: SMALL LOANS TO FARMS Geography: IOWA Evaluation Period: JANUARY 1, 2009 To DECEMBER 31, 2011
MA/Assessment Area:
Total Small Farm
Loans
Low-Income Geographies
Moderate-Income
Geographies
Middle-Income Geographies
Upper-Income Geographies
Market Share (%) by Geography*
#
% of
Total**
% of
Farms***
% USB Loans
% of
Farms***
% USB Loans
% of
Farms***
% USB Loans
% of
Farms***
% USB Loans
Overall
Low
Mod
Mid
Upp
Full-Review:
Des Moines- West Des Moines
91 1.88 1.12 1.10 5.08 0.00 66.70 60.44 27.11 38.46 13.06 0.00 0.00 11.04 23.40
Limited-Review:
Ames 139 2.88 3.12 0.00 NA NA 69.74 58.99 26.49 41.01 42.86 0.00 NA 37.29 51.11
Cedar Rapids 450 9.32 0.44 0.00 3.55 10.89 80.24 87.33 15.77 1.78 36.60 0.00 88.24 35.51 11.11
Dubuque 76 1.57 NA NA 2.10 0.00 96.80 100.00 1.10 0.00 8.21 NA 0.00 8.29 0.00
Iowa City 276 5.72 0.36 0.00 24.16 13.77 58.43 61.96 17.05 24.28 9.02 0.00 9.62 7.54 20.00
Sioux City 89 1.84 0.13 0.00 3.94 1.12 75.72 77.53 20.21 21.35 41.94 0.00 100.00 47.62 23.53
Waterloo-Cedar Falls
183 3.79 1.55 0.00 6.33 1.64 62.14 66.12 29.97 32.24 39.57 0.00 33.33 42.71 33.33
IA nonMSA 3,524 72.99 NA NA 2.76 6.02 89.82 88.25 7.41 5.73 37.86 NA 59.81 37.08 35.87
* Based on 2011 Peer Small Business Data – US and PR. ** Small loans to farms originated and purchased in the MA/AA as a percentage of all small loans to farms originated and purchased in the rated area. *** Source Data - Dun and Bradstreet (2011).
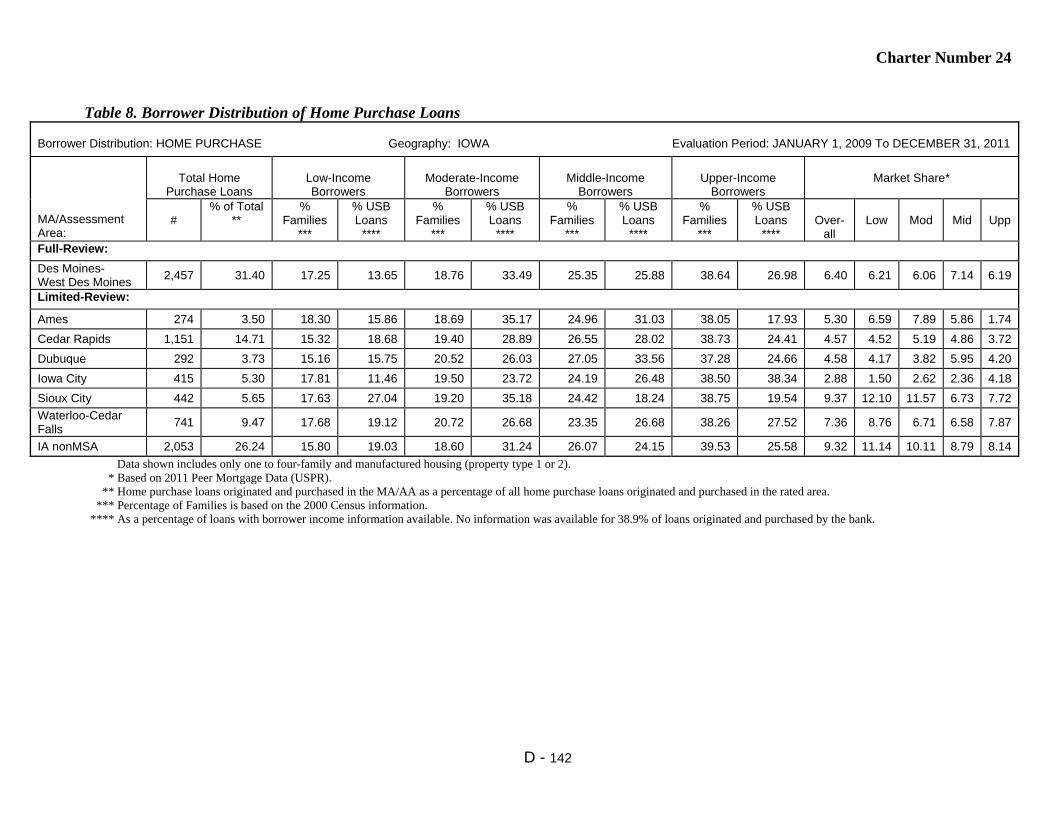
Charter Number 24
D - 142
Table 8. Borrower Distribution of Home Purchase Loans
Borrower Distribution: HOME PURCHASE Geography: IOWA Evaluation Period: JANUARY 1, 2009 To DECEMBER 31, 2011
MA/Assessment Area:
Total Home
Purchase Loans
Low-Income Borrowers
Moderate-Income
Borrowers
Middle-Income
Borrowers
Upper-Income
Borrowers
Market Share*
#
% of Total **
% Families
***
% USB Loans
****
% Families
***
% USB Loans
****
% Families
***
% USB Loans
****
% Families
***
% USB Loans
****
Over-
all
Low
Mod
Mid
Upp
Full-Review:
Des Moines- West Des Moines
2,457 31.40 17.25 13.65 18.76 33.49 25.35 25.88 38.64 26.98 6.40 6.21 6.06 7.14 6.19
Limited-Review:
Ames 274 3.50 18.30 15.86 18.69 35.17 24.96 31.03 38.05 17.93 5.30 6.59 7.89 5.86 1.74
Cedar Rapids 1,151 14.71 15.32 18.68 19.40 28.89 26.55 28.02 38.73 24.41 4.57 4.52 5.19 4.86 3.72
Dubuque 292 3.73 15.16 15.75 20.52 26.03 27.05 33.56 37.28 24.66 4.58 4.17 3.82 5.95 4.20
Iowa City 415 5.30 17.81 11.46 19.50 23.72 24.19 26.48 38.50 38.34 2.88 1.50 2.62 2.36 4.18
Sioux City 442 5.65 17.63 27.04 19.20 35.18 24.42 18.24 38.75 19.54 9.37 12.10 11.57 6.73 7.72
Waterloo-Cedar Falls
741 9.47 17.68 19.12 20.72 26.68 23.35 26.68 38.26 27.52 7.36 8.76 6.71 6.58 7.87
IA nonMSA 2,053 26.24 15.80 19.03 18.60 31.24 26.07 24.15 39.53 25.58 9.32 11.14 10.11 8.79 8.14
Data shown includes only one to four-family and manufactured housing (property type 1 or 2). * Based on 2011 Peer Mortgage Data (USPR). ** Home purchase loans originated and purchased in the MA/AA as a percentage of all home purchase loans originated and purchased in the rated area. *** Percentage of Families is based on the 2000 Census information. **** As a percentage of loans with borrower income information available. No information was available for 38.9% of loans originated and purchased by the bank.

Charter Number 24
D - 143
Table 9. Borrower Distribution of Home Improvement Loans
Borrower Distribution: HOME IMPROVEMENT Geography: IOWA Evaluation Period: JANUARY 1, 2009 To DECEMBER 31, 2011
MA/Assessment Area:
Total Home Improvement
Loans
Low-Income Borrowers
Moderate-Income
Borrowers
Middle-Income
Borrowers
Upper-Income
Borrowers
Market Share*
#
% of Total
**
% Families
***
% USB Loans
****
% Families
***
% USB Loans
****
% Families
***
% USB Loans
****
% Families
***
% USB Loans
****
Over-
all
Low
Mod
Mid
Upp
Full-Review:
Des Moines-West Des Moines
146 19.31 17.25 17.46 18.76 23.81 25.35 21.43 38.64 37.30 6.09 8.90 5.35 5.42 5.88
Limited-Review:
Ames 24 3.17 18.30 14.29 18.69 33.33 24.96 23.81 38.05 28.57 2.22 0.00 4.00 2.22 1.83
Cedar Rapids 86 11.38 15.32 20.25 19.40 16.46 26.55 21.52 38.73 41.77 7.01 7.04 2.70 5.81 10.05
Dubuque 10 1.32 15.16 20.00 20.52 20.00 27.05 20.00 37.28 40.00 5.00 6.67 8.00 4.76 2.56
Iowa City 48 6.35 17.81 15.22 19.50 23.91 24.19 23.91 38.50 36.96 7.62 8.70 6.67 4.65 9.92
Sioux City 34 4.50 17.63 9.09 19.20 12.12 24.42 45.45 38.75 33.33 4.58 2.63 4.00 7.84 3.96
Waterloo-Cedar Falls 76 10.05 17.68 17.11 20.72 21.05 23.35 23.68 38.26 38.16 18.37 20.00 18.60 16.28 19.57
IA nonMSA 332 43.92 15.80 14.20 18.60 21.30 26.07 29.01 39.53 35.49 17.71 21.78 15.52 20.10 16.18
Data shown includes only one to four-family and manufactured housing (property type of 1 or 2). * Based on 2011 Peer Mortgage Data (USPR). ** Home improvement loans originated and purchased in the MA/AA as a percentage of all home improvement loans originated and purchased in the rated area. *** Percentage of Families is based on the 2000 Census information. **** As a percentage of loans with borrower income information available. No information was available for 5.4% of loans originated and purchased by the bank.

Charter Number 24
D - 144
Table 10. Borrower Distribution of Home Mortgage Refinance Loans
Borrower Distribution: HOME MORTGAGE REFINANCE Geography: IOWA Evaluation Period: JANUARY 1, 2009 To DECEMBER 31, 2011
MA/Assessment Area:
Total Home Mortgage
Refinance Loans
Low-Income Borrowers
Moderate-Income Borrowers
Middle-Income Borrowers
Upper-Income Borrowers
Market Share*
#
% of Total **
% Families
***
% USB Loans
****
% Families
***
% USB Loans
****
% Families
***
% USB Loans
****
% Families
***
% USB Loans
****
Over-
all
Low
Mod
Mid
Upp
Full-Review:
Des Moines- West Des Moines
4,503 37.36 17.25 8.34 18.76 19.26 25.35 26.24 38.64 46.15 8.35 10.36 8.83 8.27 7.89
Limited-Review:
Ames 425 3.53 18.30 7.98 18.69 26.62 24.96 27.76 38.05 37.64 5.52 7.97 8.92 5.52 3.23
Cedar Rapids 1,782 14.78 15.32 8.49 19.40 19.24 26.55 21.43 38.73 50.83 6.21 7.06 6.79 5.76 6.05
Dubuque 438 3.63 15.16 10.12 20.52 22.96 27.05 26.17 37.28 40.74 7.22 7.69 8.52 6.87 6.67
Iowa City 829 6.88 17.81 5.61 19.50 17.58 24.19 21.52 38.50 55.30 5.68 4.87 6.78 4.47 5.99
Sioux City 396 3.29 17.63 10.76 19.20 19.94 24.42 25.00 38.75 44.30 9.08 9.17 9.94 9.84 8.30
Waterloo-Cedar Falls
797 6.61 17.68 8.02 20.72 16.33 23.35 24.49 38.26 51.17 9.94 11.32 7.59 10.93 10.03
IA nonMSA 2,884 23.93 15.80 7.35 18.60 19.35 26.07 27.18 39.53 46.13 11.37 13.88 11.19 11.87 10.77
Data shown includes only one to four-family and manufactured housing (property type 1 or 2). * Based on 2011 Peer Mortgage Data (USPR). ** Home refinance loans originated and purchased in the MA/AA as a percentage of all home refinance loans originated and purchased in the rated area. *** Percentage of Families is based on the 2000 Census information. **** As a percentage of loans with borrower income information available. No information was available for 20.8% of loans originated and purchased by the bank.
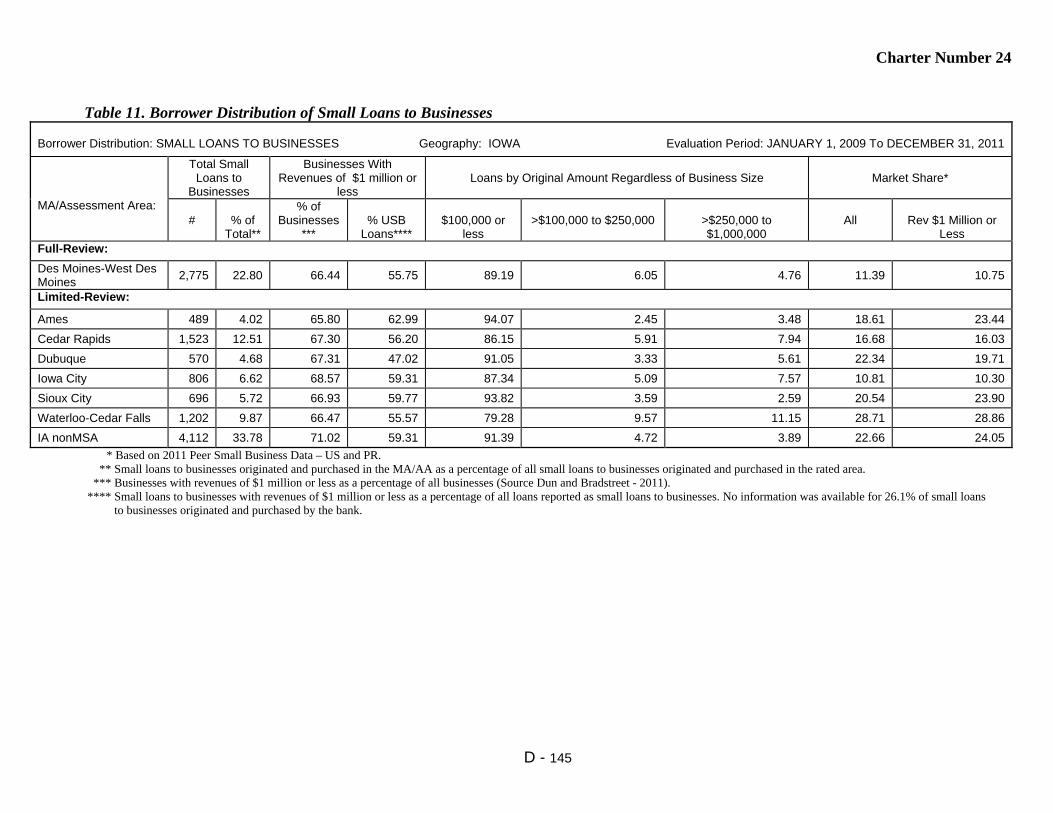
Charter Number 24
D - 145
Table 11. Borrower Distribution of Small Loans to Businesses
Borrower Distribution: SMALL LOANS TO BUSINESSES Geography: IOWA Evaluation Period: JANUARY 1, 2009 To DECEMBER 31, 2011
MA/Assessment Area:
Total Small Loans to
Businesses
Businesses With Revenues of $1 million or
less
Loans by Original Amount Regardless of Business Size
Market Share*
#
% of
Total**
% of Businesses
***
% USB
Loans****
$100,000 or
less
>$100,000 to $250,000
>$250,000 to $1,000,000
All
Rev $1 Million or
Less Full-Review:
Des Moines-West Des Moines
2,775 22.80 66.44 55.75 89.19 6.05 4.76 11.39 10.75
Limited-Review:
Ames 489 4.02 65.80 62.99 94.07 2.45 3.48 18.61 23.44
Cedar Rapids 1,523 12.51 67.30 56.20 86.15 5.91 7.94 16.68 16.03
Dubuque 570 4.68 67.31 47.02 91.05 3.33 5.61 22.34 19.71
Iowa City 806 6.62 68.57 59.31 87.34 5.09 7.57 10.81 10.30
Sioux City 696 5.72 66.93 59.77 93.82 3.59 2.59 20.54 23.90
Waterloo-Cedar Falls 1,202 9.87 66.47 55.57 79.28 9.57 11.15 28.71 28.86
IA nonMSA 4,112 33.78 71.02 59.31 91.39 4.72 3.89 22.66 24.05
* Based on 2011 Peer Small Business Data – US and PR. ** Small loans to businesses originated and purchased in the MA/AA as a percentage of all small loans to businesses originated and purchased in the rated area. *** Businesses with revenues of $1 million or less as a percentage of all businesses (Source Dun and Bradstreet - 2011). **** Small loans to businesses with revenues of $1 million or less as a percentage of all loans reported as small loans to businesses. No information was available for 26.1% of small loans to businesses originated and purchased by the bank.

Charter Number 24
D - 146
Table 12. Borrower Distribution of Small Loans to Farms
Borrower Distribution: SMALL LOANS TO FARMS Geography: IOWA Evaluation Period: JANUARY 1, 2009 To DECEMBER 31, 2011
MA/Assessment Area:
Total Small Loans to Farms
Farms With Revenues of $1 million or less
Loans by Original Amount Regardless of Farm Size
Market Share*
#
% of
Total**
% of
Farms***
% USB
Loans****
$100,000 or
less
>$100,000 to $250,000
>$250,000 to $500,000
All
Rev $1 Million or
Less Full-Review:
Des Moines- West Des Moines
91 1.88 97.59 83.52 61.54 29.67 8.79 13.06 15.29
Limited-Review:
Ames 139 2.88 97.92 78.42 46.76 35.25 17.99 42.86 47.89
Cedar Rapids 450 9.32 98.88 94.67 63.78 24.44 11.78 36.60 41.59
Dubuque 76 1.57 98.80 97.37 69.74 27.63 2.63 8.21 9.40
Iowa City 276 5.72 97.90 89.86 69.93 25.72 4.35 9.02 12.77
Sioux City 89 1.84 98.29 91.01 52.81 30.34 16.85 41.94 58.97
Waterloo-Cedar Falls 183 3.79 98.06 95.63 54.10 27.87 18.03 39.57 47.12
IA nonMSA 3,524 72.99 98.89 88.51 64.81 25.20 9.99 37.86 39.99
* Based on 2011 Peer Small Business Data – US and PR. ** Small loans to farms originated and purchased in the MA/AA as a percentage of all small loans to farms originated and purchased in the rated area. *** Farms with revenues of $1 million or less as a percentage of all farms (Source Dun and Bradstreet - 2011). **** Small loans to farms with revenues of $1 million or less as a percentage of all loans reported as small loans to farms. No information was available for 4.8% of small loans to farms originated and purchased by the bank.
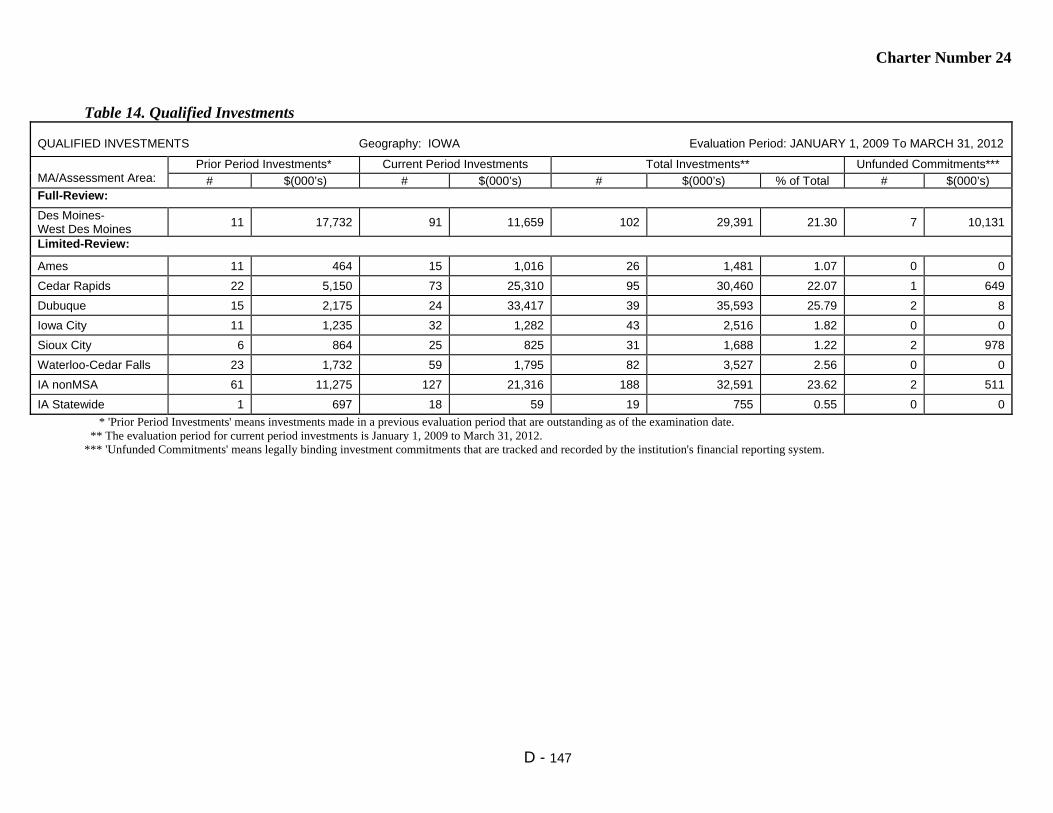
Charter Number 24
D - 147
Table 14. Qualified Investments
QUALIFIED INVESTMENTS Geography: IOWA Evaluation Period: JANUARY 1, 2009 To MARCH 31, 2012
MA/Assessment Area:
Prior Period Investments* Current Period Investments Total Investments** Unfunded Commitments***
# $(000’s) # $(000’s) # $(000’s) % of Total # $(000’s) Full-Review:
Des Moines- West Des Moines
11 17,732 91 11,659 102 29,391 21.30 7 10,131
Limited-Review:
Ames 11 464 15 1,016 26 1,481 1.07 0 0
Cedar Rapids 22 5,150 73 25,310 95 30,460 22.07 1 649
Dubuque 15 2,175 24 33,417 39 35,593 25.79 2 8
Iowa City 11 1,235 32 1,282 43 2,516 1.82 0 0
Sioux City 6 864 25 825 31 1,688 1.22 2 978
Waterloo-Cedar Falls 23 1,732 59 1,795 82 3,527 2.56 0 0
IA nonMSA 61 11,275 127 21,316 188 32,591 23.62 2 511
IA Statewide 1 697 18 59 19 755 0.55 0 0
* 'Prior Period Investments' means investments made in a previous evaluation period that are outstanding as of the examination date. ** The evaluation period for current period investments is January 1, 2009 to March 31, 2012. *** 'Unfunded Commitments' means legally binding investment commitments that are tracked and recorded by the institution's financial reporting system.

Charter Number 24
D - 148
Table 15. Distribution of Branch Delivery System and Branch Openings/Closings
DISTRIBUTION OF BRANCH DELIVERY SYSTEM/BRANCH OPENINGS/CLOSINGS Geography: IOWA Evaluation Period: JANUARY 1, 2009 To DECEMBER 31, 2011
MA/Assessment Area:
Deposits Branches Branch Openings/Closings Population
% of
Rated Area
Deposits in AA
# of USB
Branches
% of
Rated Area
Branches in AA
Location of Branches by
Income of Geographies (%)
# of Branch
Openings
# of Branch
Closings
Net change in Location of Branches (+ or - )
% of Population within Each
Geography
Low
Mod
Mid
Upp
Low
Mod
Mid
Upp
Low
Mod
Mid
Upp
Full-Review:
Des Moines-West Des Moines
19.78 15 17.44 13.33 20.00 60.00 6.67 0 0 0 0 0 0 4.47 19.02 52.29 24.21
Limited-Review:
Ames 5.02 4 4.65 0.00 NA 75.00 25.00 0 0 0 NA 0 0 7.09 NA 64.15 22.80
Cedar Rapids 18.41 10 11.63 0.00 30.00 50.00 20.00 1 0 0 0 1 0 0.85 11.31 65.17 22.67
Dubuque 8.09 5 5.81 NA 40.00 60.00 0.00 0 0 NA 0 0 0 NA 7.77 88.54 3.69
Iowa City 6.72 6 6.98 16.67 16.67 50.00 16.67 0 0 0 0 0 0 2.75 24.53 43.36 29.35
Sioux City 3.95 3 3.49 0.00 33.33 33.33 33.33 0 0 0 0 0 0 0.05 19.36 52.57 28.01
Waterloo-Cedar Falls 8.17 5 5.81 20.00 0.00 40.00 40.00 0 0 0 0 0 0 2.96 25.75 49.38 21.91
IA nonMSA 29.87 38 44.19 NA 7.89 78.95 13.16 0 2 NA -1 -1 0 NA 6.87 82.32 10.81

Charter Number 24
D - 149
Table 1. Lending Volume
LENDING VOLUME Geography: KANSAS Evaluation Period: JANUARY 1, 2009 To DECEMBER 31, 2011
MA/Assessment Area:
% of
Rated Area
Loans (#) in MA/AA*
Home Mortgage
Small Loans to
Businesses
Small Loans to Farms
Community
Development Loans**
Total Reported Loans
% of Rated Area Deposits in MA/AA***
#
$ (000’s)
#
$ (000’s)
#
$ (000’s)
#
$ (000’s)
#
$(000’s)
Full-Review:
Lawrence 43.70 824 132,618 730 31,387 7 629 3 2,408 1,564 167,042 63.28 Limited-Review:
Topeka 49.79 1,164 145,414 606 26,372 8 761 4 4,807 1,782 177,354 32.72
KS nonMSA 6.43 130 11,670 95 5,878 5 450 0 0 230 17,998 3.99
KS Statewide 0.08 0 0 0 0 0 0 3 4,000 3 4,000 NA * Loan Data as of December 31, 2011. Rated area refers to either the state or multistate MA rating area. ** The evaluation period for Community Development Loans is from January 1, 2009 to March 31, 2012. *** Deposit Data as of June 30, 2011. Rated Area refers to the state, multistate MA, or institution, as appropriate.
Table 2. Geographic Distribution of Home Purchase Loans Geographic Distribution: HOME PURCHASE Geography: KANSAS Evaluation Period: JANUARY 1, 2009 To DECEMBER 31, 2011
MA/Assessment Area:
Total Home
Purchase Loans
Low-Income Geographies
Moderate-Income
Geographies
Middle-Income Geographies
Upper-Income Geographies
Market Share (%) by Geography*
#
% of
Total**
% Owner Occ
Units***
% USB Loans
% Owner Occ
Units***
% USB Loans
% Owner Occ
Units***
% USB Loans
% Owner Occ
Units***
% USB Loans
Overall
Low
Mod
Mid
Upp
Full-Review:
Lawrence 232 26.30 0.11 0.00 19.97 20.69 49.84 44.40 30.08 34.91 5.86 0.00 4.58 6.67 5.61
Limited-Review:
Topeka 607 68.82 0.65 0.16 21.77 13.51 41.36 46.95 36.23 39.37 8.58 0.00 10.98 9.05 7.50
KS nonMSA 43 4.88 NA NA 9.69 13.95 77.61 69.77 12.70 16.28 4.34 NA 6.00 3.67 5.41
Data shown includes only one to four-family and manufactured housing (property type 1 or 2). * Based on 2011 Peer Mortgage Data (USPR). ** Home purchase loans originated and purchased in the MA/AA as a percentage of all home purchase loans originated and purchased in the rated area. *** Percentage of Owner-Occupied Units is the number of owner-occupied housing units in a particular geography divided by the number of owner-occupied housing units in the area based on 2000 Census information.

Charter Number 24
D - 150
Table 3. Geographic Distribution of Home Improvement Loans
Geographic Distribution: HOME IMPROVEMENT Geography: KANSAS Evaluation Period: JANUARY 1, 2009 To DECEMBER 31, 2011
MA/Assessment Area:
Total Home
Improvement Loans
Low-Income Geographies
Moderate-Income
Geographies
Middle-Income Geographies
Upper-Income Geographies
Market Share (%) by Geography*
#
% of
Total**
% Owner
Occ Units***
% USB Loans
% Owner
Occ Units***
% USB Loans
% Owner
Occ Units***
% USB Loans
% Owner
Occ Units***
%
USB Loans
Overall
Low
Mod
Mid
Upp
Full-Review:
Lawrence 16 29.63 0.11 0.00 19.97 12.50 49.84 43.75 30.08 43.75 3.81 0.00 0.00 4.26 5.00
Limited-Review:
Topeka 25 46.30 0.65 0.00 21.77 12.00 41.36 36.00 36.23 52.00 4.46 0.00 0.00 2.83 8.18
KS nonMSA 13 24.07 NA NA 9.69 7.69 77.61 61.54 12.70 30.77 6.12 NA 0.00 7.69 0.00
Data shown includes only one to four-family and manufactured housing (property type 1 or 2). * Based on 2011 Peer Mortgage Data (USPR). ** Home improvement loans originated and purchased in the MA/AA as a percentage of all home improvement loans originated and purchased in the rated area. *** Percentage of Owner-Occupied Units is the number of owner-occupied housing units in a particular geography divided by number of owner-occupied housing units in the area based on 2000 Census information.

Charter Number 24
D - 151
Table 4. Geographic Distribution of Home Mortgage Refinance Loans
Geographic Distribution: HOME MORTGAGE REFINANCE Geography: KANSAS Evaluation Period: JANUARY 1, 2009 To DECEMBER 31, 2011
MA/Assessment Area:
Total Home Mortgage
Refinance Loans
Low-Income Geographies
Moderate-Income Geographies
Middle-Income Geographies
Upper-Income Geographies
Market Share (%) by Geography*
#
% of
Total**
% Owner
Occ Units***
% USB Loans
% Owner Occ
Units***
% USB Loans
% Owner Occ
Units***
% USB Loans
% Owner Occ
Units***
% USB Loans
Overall
Low
Mod
Mid
Upp
Full-Review:
Lawrence 573 48.64 0.11 0.00 19.97 13.96 49.84 45.38 30.08 40.66 8.18 0.00 8.40 8.61 7.60
Limited-Review:
Topeka 531 45.08 0.65 0.00 21.77 11.30 41.36 45.76 36.23 42.94 6.72 0.00 7.32 9.29 4.83
KS nonMSA 74 6.28 NA NA 9.69 13.51 77.61 62.16 12.70 24.32 5.34 NA 2.33 4.36 9.62
Data shown includes only one to four-family and manufactured housing (property type 1 or 2). * Based on 2011 Peer Mortgage Data (USPR). ** Home mortgage refinance loans originated and purchased in the MA/AA as a percentage of all home mortgage refinance loans originated and purchased in the rated area. *** Percentage of Owner-Occupied Units is the number of owner-occupied housing units in a particular geography divided by number of owner-occupied housing units in the area based on 2000 Census information.
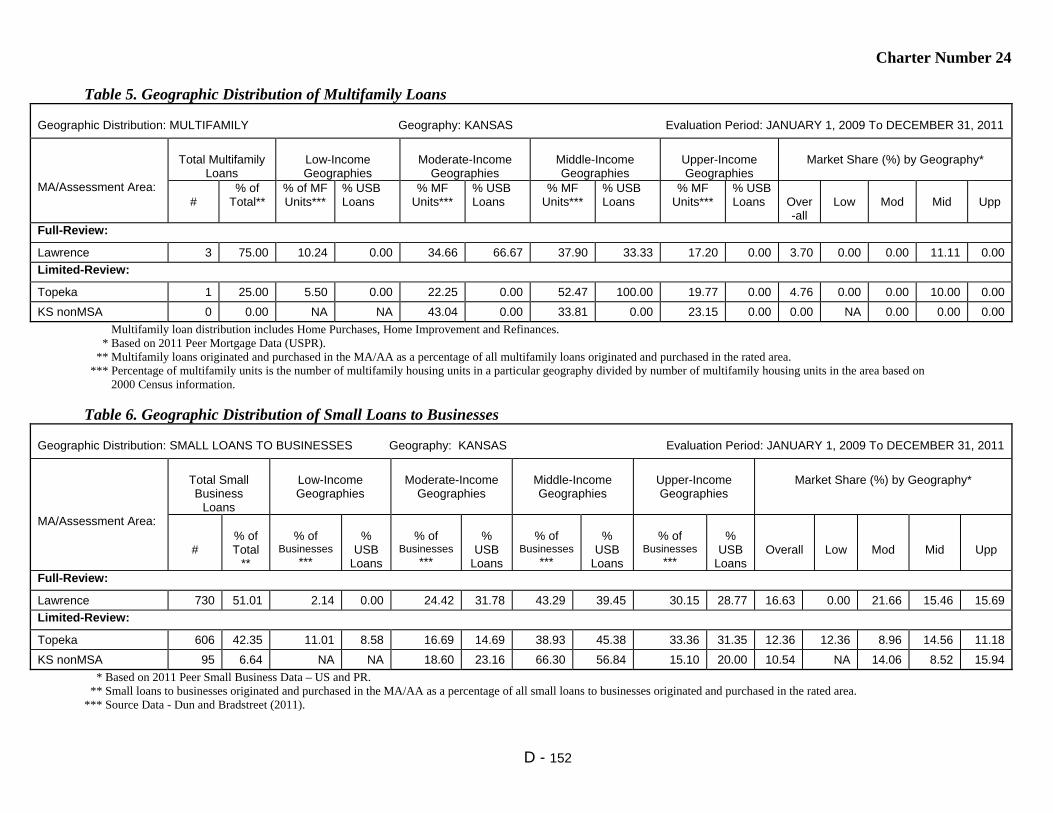
Charter Number 24
D - 152
Table 5. Geographic Distribution of Multifamily Loans
Geographic Distribution: MULTIFAMILY Geography: KANSAS Evaluation Period: JANUARY 1, 2009 To DECEMBER 31, 2011
MA/Assessment Area:
Total Multifamily
Loans
Low-Income Geographies
Moderate-Income
Geographies
Middle-Income Geographies
Upper-Income Geographies
Market Share (%) by Geography*
#
% of Total**
% of MF Units***
% USB Loans
% MF Units***
% USB Loans
% MF Units***
% USB Loans
% MF Units***
% USB Loans
Over-all
Low
Mod
Mid
Upp
Full-Review:
Lawrence 3 75.00 10.24 0.00 34.66 66.67 37.90 33.33 17.20 0.00 3.70 0.00 0.00 11.11 0.00
Limited-Review:
Topeka 1 25.00 5.50 0.00 22.25 0.00 52.47 100.00 19.77 0.00 4.76 0.00 0.00 10.00 0.00
KS nonMSA 0 0.00 NA NA 43.04 0.00 33.81 0.00 23.15 0.00 0.00 NA 0.00 0.00 0.00
Multifamily loan distribution includes Home Purchases, Home Improvement and Refinances. * Based on 2011 Peer Mortgage Data (USPR). ** Multifamily loans originated and purchased in the MA/AA as a percentage of all multifamily loans originated and purchased in the rated area. *** Percentage of multifamily units is the number of multifamily housing units in a particular geography divided by number of multifamily housing units in the area based on 2000 Census information.
Table 6. Geographic Distribution of Small Loans to Businesses Geographic Distribution: SMALL LOANS TO BUSINESSES Geography: KANSAS Evaluation Period: JANUARY 1, 2009 To DECEMBER 31, 2011
MA/Assessment Area:
Total Small Business
Loans
Low-Income Geographies
Moderate-Income
Geographies
Middle-Income Geographies
Upper-Income Geographies
Market Share (%) by Geography*
#
% of Total
**
% of
Businesses ***
%
USB Loans
% of
Businesses ***
%
USB Loans
% of
Businesses ***
%
USB Loans
% of
Businesses ***
%
USB Loans
Overall
Low
Mod
Mid
Upp
Full-Review:
Lawrence 730 51.01 2.14 0.00 24.42 31.78 43.29 39.45 30.15 28.77 16.63 0.00 21.66 15.46 15.69
Limited-Review:
Topeka 606 42.35 11.01 8.58 16.69 14.69 38.93 45.38 33.36 31.35 12.36 12.36 8.96 14.56 11.18
KS nonMSA 95 6.64 NA NA 18.60 23.16 66.30 56.84 15.10 20.00 10.54 NA 14.06 8.52 15.94
* Based on 2011 Peer Small Business Data – US and PR. ** Small loans to businesses originated and purchased in the MA/AA as a percentage of all small loans to businesses originated and purchased in the rated area. *** Source Data - Dun and Bradstreet (2011).

Charter Number 24
D - 153
Table 7. Geographic Distribution of Small Loans to Farms
Geographic Distribution: SMALL LOANS TO FARMS Geography: KANSAS Evaluation Period: JANUARY 1, 2009 To DECEMBER 31, 2011
MA/Assessment Area:
Total Small
Farm Loans
Low-Income Geographies
Moderate-Income
Geographies
Middle-Income Geographies
Upper-Income Geographies
Market Share (%) by Geography*
#
% of
Total**
% of
Farms***
% USB Loans
% of
Farms***
% USB Loans
% of
Farms***
% USB Loans
% of
Farms***
% USB Loans
Over-all
Low
Mod
Mid
Upp
Full-Review:
Lawrence 7 35.00 0.28 0.00 13.93 0.00 52.65 57.14 33.15 42.86 6.25 0.00 0.00 8.33 7.69
Limited-Review:
Topeka 8 40.00 2.68 0.00 7.04 0.00 49.92 50.00 40.37 50.00 8.33 0.00 0.00 0.00 25.00
KS nonMSA 5 25.00 NA NA 4.85 0.00 85.90 80.00 9.25 20.00 8.33 NA 0.00 4.76 100.00
* Based on 2011 Peer Small Business Data – US and PR. ** Small loans to farms originated and purchased in the MA/AA as a percentage of all small loans to farms originated and purchased in the rated area. *** Source Data - Dun and Bradstreet (2011).
Table 8. Borrower Distribution of Home Purchase Loans Borrower Distribution: HOME PURCHASE Geography: KANSAS Evaluation Period: JANUARY 1, 2009 To DECEMBER 31, 2011
MA/Assessment Area:
Total Home Purchase
Loans
Low-Income Borrowers
Moderate-Income
Borrowers
Middle-Income
Borrowers
Upper-Income
Borrowers
Market Share*
#
% of Total
**
% Families
***
% USB Loans
****
% Families
***
% USB Loans
****
% Families
***
% USB Loans
****
% Families
***
% USB Loans
****
Over-
all
Low
Mod
Mid
Upp
Full-Review:
Lawrence 232 26.30 18.17 13.82 18.89 25.66 24.70 24.34 38.24 36.18 4.47 3.82 6.51 3.35 4.10
Limited-Review:
Topeka 607 68.82 13.32 17.09 15.07 29.65 21.62 27.64 49.99 25.63 4.39 4.74 5.53 5.87 2.40
KS nonMSA 43 4.88 20.88 9.52 20.19 23.81 23.71 23.81 35.22 42.86 2.32 2.44 2.70 1.19 2.91
Data shown includes only one to four-family and manufactured housing (property type 1 or 2). * Based on 2011 Peer Mortgage Data (USPR). ** Home purchase loans originated and purchased in the MA/AA as a percentage of all home purchase loans originated and purchased in the rated area. *** Percentage of Families is based on the 2000 Census information. **** As a percentage of loans with borrower income information available. No information was available for 57.8% of loans originated and purchased by the bank.
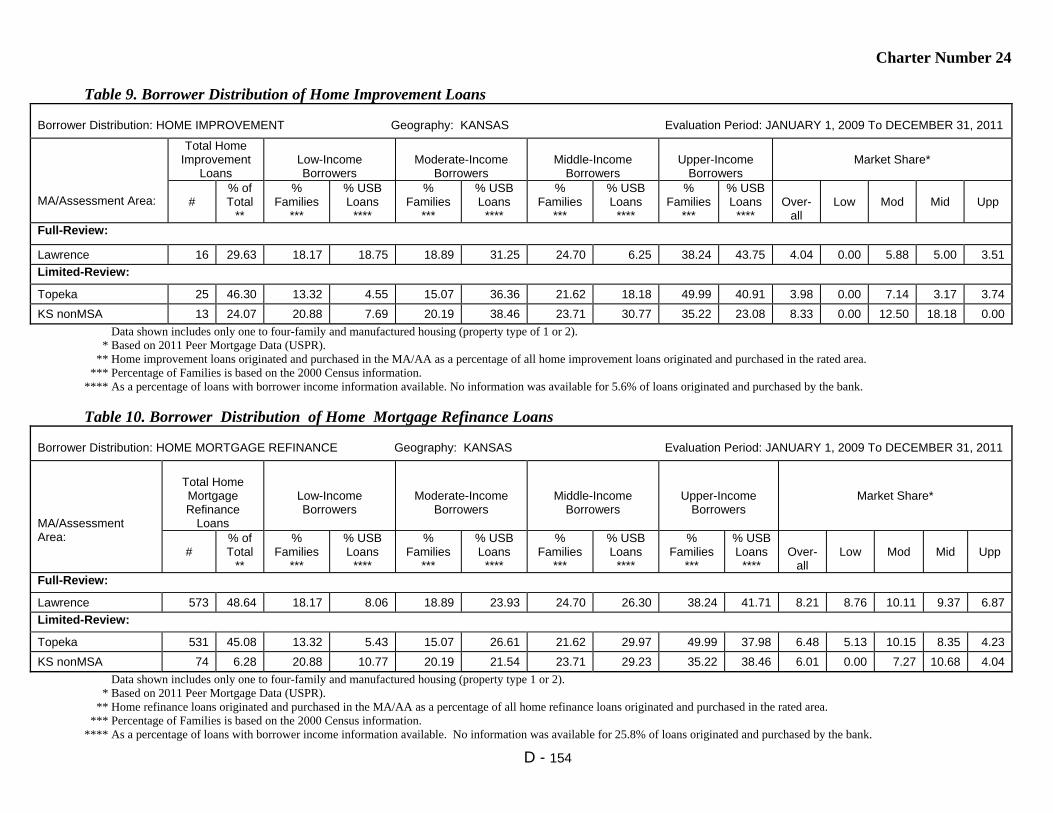
Charter Number 24
D - 154
Table 9. Borrower Distribution of Home Improvement Loans
Borrower Distribution: HOME IMPROVEMENT Geography: KANSAS Evaluation Period: JANUARY 1, 2009 To DECEMBER 31, 2011
MA/Assessment Area:
Total Home Improvement
Loans
Low-Income Borrowers
Moderate-Income
Borrowers
Middle-Income
Borrowers
Upper-Income
Borrowers
Market Share*
#
% of Total
**
% Families
***
% USB Loans
****
% Families
***
% USB Loans
****
% Families
***
% USB Loans
****
% Families
***
% USB Loans
****
Over-
all
Low
Mod
Mid
Upp
Full-Review:
Lawrence 16 29.63 18.17 18.75 18.89 31.25 24.70 6.25 38.24 43.75 4.04 0.00 5.88 5.00 3.51
Limited-Review:
Topeka 25 46.30 13.32 4.55 15.07 36.36 21.62 18.18 49.99 40.91 3.98 0.00 7.14 3.17 3.74
KS nonMSA 13 24.07 20.88 7.69 20.19 38.46 23.71 30.77 35.22 23.08 8.33 0.00 12.50 18.18 0.00
Data shown includes only one to four-family and manufactured housing (property type of 1 or 2). * Based on 2011 Peer Mortgage Data (USPR). ** Home improvement loans originated and purchased in the MA/AA as a percentage of all home improvement loans originated and purchased in the rated area. *** Percentage of Families is based on the 2000 Census information. **** As a percentage of loans with borrower income information available. No information was available for 5.6% of loans originated and purchased by the bank.
Table 10. Borrower Distribution of Home Mortgage Refinance Loans Borrower Distribution: HOME MORTGAGE REFINANCE Geography: KANSAS Evaluation Period: JANUARY 1, 2009 To DECEMBER 31, 2011
MA/Assessment Area:
Total Home Mortgage Refinance
Loans
Low-Income Borrowers
Moderate-Income Borrowers
Middle-Income Borrowers
Upper-Income Borrowers
Market Share*
#
% of Total
**
% Families
***
% USB Loans
****
% Families
***
% USB Loans
****
% Families
***
% USB Loans
****
% Families
***
% USB Loans
****
Over-
all
Low
Mod
Mid
Upp
Full-Review:
Lawrence 573 48.64 18.17 8.06 18.89 23.93 24.70 26.30 38.24 41.71 8.21 8.76 10.11 9.37 6.87
Limited-Review:
Topeka 531 45.08 13.32 5.43 15.07 26.61 21.62 29.97 49.99 37.98 6.48 5.13 10.15 8.35 4.23
KS nonMSA 74 6.28 20.88 10.77 20.19 21.54 23.71 29.23 35.22 38.46 6.01 0.00 7.27 10.68 4.04
Data shown includes only one to four-family and manufactured housing (property type 1 or 2). * Based on 2011 Peer Mortgage Data (USPR). ** Home refinance loans originated and purchased in the MA/AA as a percentage of all home refinance loans originated and purchased in the rated area. *** Percentage of Families is based on the 2000 Census information. **** As a percentage of loans with borrower income information available. No information was available for 25.8% of loans originated and purchased by the bank.

Charter Number 24
D - 155
Table 11. Borrower Distribution of Small Loans to Businesses
Borrower Distribution: SMALL LOANS TO BUSINESSES Geography: KANSAS Evaluation Period: JANUARY 1, 2009 To DECEMBER 31, 2011
MA/Assessment Area:
Total Small Loans to
Businesses
Businesses With Revenues of $1 million or
less
Loans by Original Amount Regardless of Business Size
Market Share*
#
% of
Total**
% of Businesses
***
% USB
Loans****
$100,000 or
less
>$100,000 to $250,000
>$250,000 to $1,000,000
All
Rev $1 Million or
Less Full-Review:
Lawrence 730 51.01 68.75 65.75 90.27 4.38 5.34 16.63 20.74
Limited-Review:
Topeka 606 42.35 64.92 67.16 91.09 4.62 4.29 12.36 20.50
KS nonMSA 95 6.64 70.48 53.68 89.47 2.11 8.42 10.54 15.65
* Based on 2011 Peer Small Business Data – US and PR. ** Small loans to businesses originated and purchased in the MA/AA as a percentage of all small loans to businesses originated and purchased in the rated area. *** Businesses with revenues of $1 million or less as a percentage of all businesses (Source Dun and Bradstreet - 2011). **** Small loans to businesses with revenues of $1 million or less as a percentage of all loans reported as small loans to businesses. No information was available for 22.1% of small loans to businesses originated and purchased by the bank.
Table 12. Borrower Distribution of Small Loans to Farms Borrower Distribution: SMALL LOANS TO FARMS Geography: KANSAS Evaluation Period: JANUARY 1, 2009 To DECEMBER 31, 2011
MA/Assessment Area:
Total Small Loans to Farms
Farms With Revenues of $1 million or less
Loans by Original Amount Regardless of Farm Size
Market Share*
#
% of
Total**
% of
Farms***
% USB
Loans****
$100,000 or
less
>$100,000 to $250,000
>$250,000 to $500,000
All
Rev $1 Million or
Less Full-Review:
Lawrence 7 35.00 98.33 100.00 57.14 42.86 0.00 6.25 11.76
Limited-Review:
Topeka 8 40.00 98.66 100.00 37.50 62.50 0.00 8.33 20.00
KS nonMSA 5 25.00 98.68 80.00 80.00 20.00 0.00 8.33 6.67
* Based on 2011 Peer Small Business Data – US and PR. ** Small loans to farms originated and purchased in the MA/AA as a percentage of all small loans to farms originated and purchased in the rated area. *** Farms with revenues of $1 million or less as a percentage of all farms (Source Dun and Bradstreet - 2011). **** Small loans to farms with revenues of $1 million or less as a percentage of all loans reported as small loans to farms. No information was available for 5.0% of small loans to farms originated and purchased by the bank.
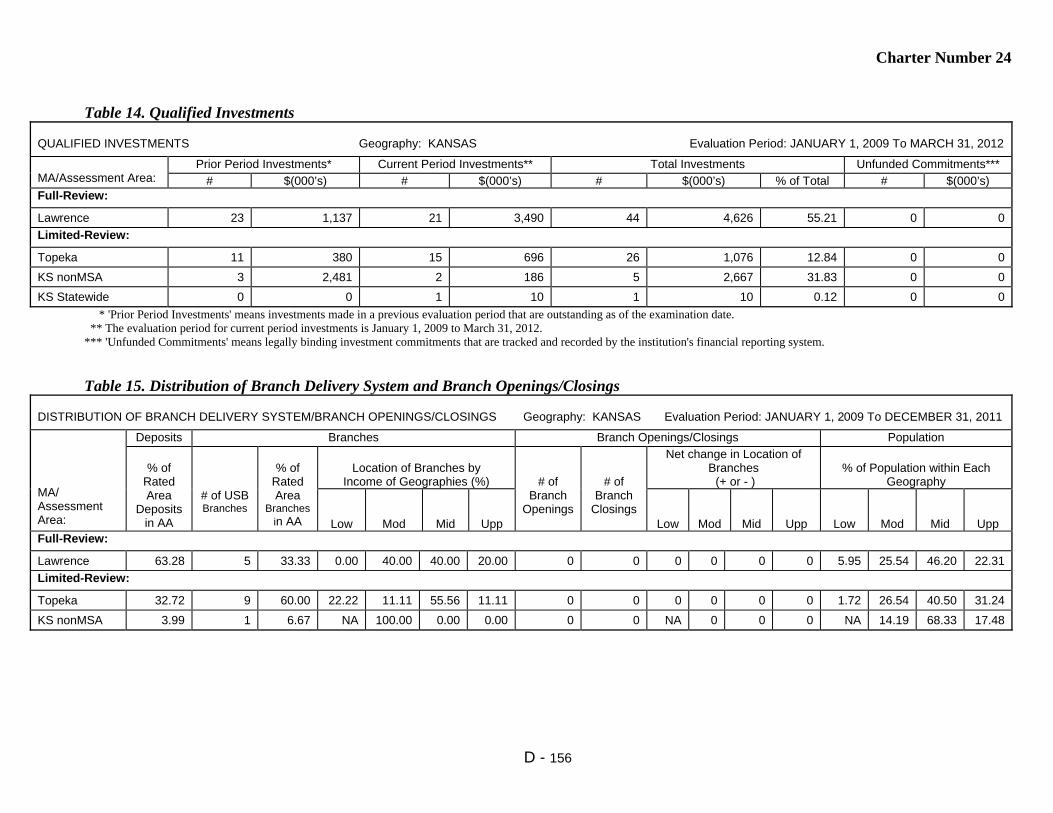
Charter Number 24
D - 156
Table 14. Qualified Investments
QUALIFIED INVESTMENTS Geography: KANSAS Evaluation Period: JANUARY 1, 2009 To MARCH 31, 2012
MA/Assessment Area:
Prior Period Investments* Current Period Investments** Total Investments Unfunded Commitments***
# $(000’s) # $(000’s) # $(000’s) % of Total # $(000’s) Full-Review:
Lawrence 23 1,137 21 3,490 44 4,626 55.21 0 0
Limited-Review:
Topeka 11 380 15 696 26 1,076 12.84 0 0
KS nonMSA 3 2,481 2 186 5 2,667 31.83 0 0
KS Statewide 0 0 1 10 1 10 0.12 0 0
* 'Prior Period Investments' means investments made in a previous evaluation period that are outstanding as of the examination date. ** The evaluation period for current period investments is January 1, 2009 to March 31, 2012. *** 'Unfunded Commitments' means legally binding investment commitments that are tracked and recorded by the institution's financial reporting system.
Table 15. Distribution of Branch Delivery System and Branch Openings/Closings DISTRIBUTION OF BRANCH DELIVERY SYSTEM/BRANCH OPENINGS/CLOSINGS Geography: KANSAS Evaluation Period: JANUARY 1, 2009 To DECEMBER 31, 2011
MA/ Assessment Area:
Deposits Branches Branch Openings/Closings Population
% of
Rated Area
Deposits in AA
# of USB Branches
% of
Rated Area
Branches in AA
Location of Branches by
Income of Geographies (%)
# of Branch
Openings
# of Branch
Closings
Net change in Location of Branches (+ or - )
% of Population within Each
Geography
Low
Mod
Mid
Upp
Low
Mod
Mid
Upp
Low
Mod
Mid
Upp
Full-Review:
Lawrence 63.28 5 33.33 0.00 40.00 40.00 20.00 0 0 0 0 0 0 5.95 25.54 46.20 22.31
Limited-Review:
Topeka 32.72 9 60.00 22.22 11.11 55.56 11.11 0 0 0 0 0 0 1.72 26.54 40.50 31.24
KS nonMSA 3.99 1 6.67 NA 100.00 0.00 0.00 0 0 NA 0 0 0 NA 14.19 68.33 17.48

Charter Number 24
D - 157
Table 1. Lending Volume
LENDING VOLUME Geography: KENTUCKY Evaluation Period: JANUARY 1, 2009 To DECEMBER 31, 2011
MA/Assessment Area:
% of
Rated Area
Loans (#) in MA/AA*
Home Mortgage
Small Loans to
Businesses
Small Loans to Farms
Community
Development Loans**
Total Reported Loans
% of Rated Area Deposits in MA/AA***
#
$ (000’s)
#
$ (000’s)
#
$ (000’s)
#
$ (000’s)
#
$(000’s)
Full-Review:
Owensboro 10.25 1,293 138,639 548 29,589 3 30 2 3,838 1,846 172,096 21.14 Limited-Review:
Bowling Green 16.09 1,875 279,005 977 99,021 43 5,567 2 4,650 2,897 388,243 12.47
Evansville 0.73 63 6,750 68 1,004 0 0 1 1,116 132 8,870 0.47
Lexington-Fayette 10.93 1,069 190,258 889 31,856 10 1,883 0 0 1,968 223,997 5.50
KY nonMSA 61.98 5,892 615,159 4,858 203,171 402 22,489 6 4,050 11,158 844,869 60.43
KY Statewide 0.01 0 0 0 0 0 0 1 23 1 23 NA * Loan Data as of December 31, 2011. Rated area refers to either the state or multistate MA rating area. ** The evaluation period for Community Development Loans is from January 1, 2009 to March 31, 2012. *** Deposit Data as of June 30, 2011. Rated Area refers to the state, multistate MA, or institution, as appropriate.
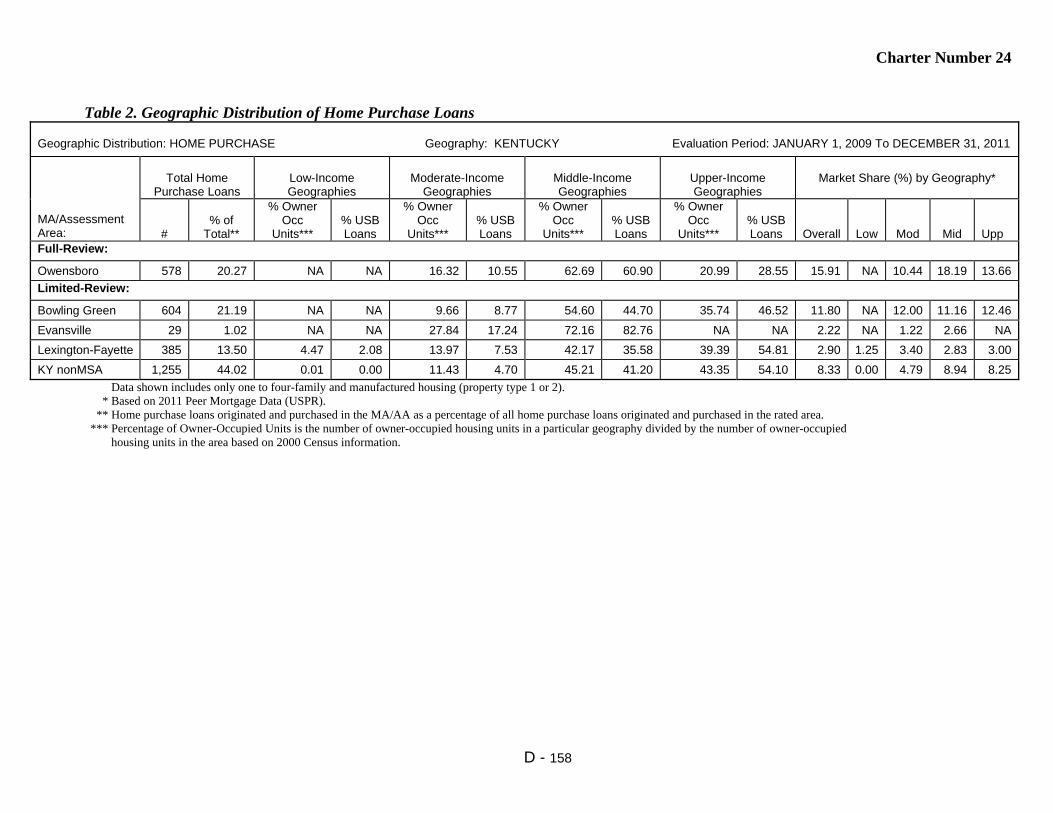
Charter Number 24
D - 158
Table 2. Geographic Distribution of Home Purchase Loans
Geographic Distribution: HOME PURCHASE Geography: KENTUCKY Evaluation Period: JANUARY 1, 2009 To DECEMBER 31, 2011
MA/Assessment Area:
Total Home
Purchase Loans
Low-Income Geographies
Moderate-Income
Geographies
Middle-Income Geographies
Upper-Income Geographies
Market Share (%) by Geography*
#
% of
Total**
% Owner Occ
Units***
% USB Loans
% Owner Occ
Units***
% USB Loans
% Owner Occ
Units***
% USB Loans
% Owner Occ
Units***
% USB Loans
Overall
Low
Mod
Mid
Upp
Full-Review:
Owensboro 578 20.27 NA NA 16.32 10.55 62.69 60.90 20.99 28.55 15.91 NA 10.44 18.19 13.66
Limited-Review:
Bowling Green 604 21.19 NA NA 9.66 8.77 54.60 44.70 35.74 46.52 11.80 NA 12.00 11.16 12.46
Evansville 29 1.02 NA NA 27.84 17.24 72.16 82.76 NA NA 2.22 NA 1.22 2.66 NA
Lexington-Fayette 385 13.50 4.47 2.08 13.97 7.53 42.17 35.58 39.39 54.81 2.90 1.25 3.40 2.83 3.00
KY nonMSA 1,255 44.02 0.01 0.00 11.43 4.70 45.21 41.20 43.35 54.10 8.33 0.00 4.79 8.94 8.25
Data shown includes only one to four-family and manufactured housing (property type 1 or 2). * Based on 2011 Peer Mortgage Data (USPR). ** Home purchase loans originated and purchased in the MA/AA as a percentage of all home purchase loans originated and purchased in the rated area. *** Percentage of Owner-Occupied Units is the number of owner-occupied housing units in a particular geography divided by the number of owner-occupied housing units in the area based on 2000 Census information.

Charter Number 24
D - 159
Table 3. Geographic Distribution of Home Improvement Loans
Geographic Distribution: HOME IMPROVEMENT Geography: KENTUCKY Evaluation Period: JANUARY 1, 2009 To DECEMBER 31, 2011
MA/Assessment Area:
Total Home
Improvement Loans
Low-Income Geographies
Moderate-Income
Geographies
Middle-Income Geographies
Upper-Income Geographies
Market Share (%) by Geography*
#
% of
Total**
% Owner
Occ Units***
% USB Loans
% Owner
Occ Units***
% USB Loans
% Owner
Occ Units***
% USB Loans
% Owner
Occ Units***
%
USB Loans
Overall
Low
Mod
Mid
Upp
Full-Review:
Owensboro 52 8.71 NA NA 16.32 5.77 62.69 73.08 20.99 21.15 10.50 NA 5.13 13.10 7.41
Limited-Review:
Bowling Green 52 8.71 NA NA 9.66 3.85 54.60 57.69 35.74 38.46 13.29 NA 22.22 10.11 16.00
Evansville 2 0.34 NA NA 27.84 50.00 72.16 50.00 NA NA 1.18 NA 5.56 0.00 NA
Lexington-Fayette 19 3.18 4.47 5.26 13.97 10.53 42.17 47.37 39.39 36.84 1.05 0.00 0.00 1.83 0.74
KY nonMSA 472 79.06 0.01 0.00 11.43 15.04 45.21 51.06 43.35 33.90 11.71 0.00 11.76 11.07 12.43
Data shown includes only one to four-family and manufactured housing (property type 1 or 2). * Based on 2011 Peer Mortgage Data (USPR). ** Home improvement loans originated and purchased in the MA/AA as a percentage of all home improvement loans originated and purchased in the rated area. *** Percentage of Owner-Occupied Units is the number of owner-occupied housing units in a particular geography divided by number of owner-occupied housing units in the area based on 2000 Census information.

Charter Number 24
D - 160
Table 4. Geographic Distribution of Home Mortgage Refinance Loans
Geographic Distribution: HOME MORTGAGE REFINANCE Geography: KENTUCKY Evaluation Period: JANUARY 1, 2009 To DECEMBER 31, 2011
MA/Assessment Area:
Total Home
Mortgage Refinance Loans
Low-Income Geographies
Moderate-Income Geographies
Middle-Income Geographies
Upper-Income Geographies
Market Share (%) by Geography*
#
% of
Total**
% Owner Occ
Units***
% USB Loans
% Owner Occ
Units***
% USB Loans
% Owner Occ
Units***
% USB Loans
% Owner Occ
Units***
% USB Loans
Overall
Low
Mod
Mid
Upp
Full-Review:
Owensboro 663 9.87 NA NA 16.32 7.54 62.69 59.58 20.99 32.88 12.96 NA 10.45 13.76 12.31
Limited-Review:
Bowling Green 1,215 18.08 NA NA 9.66 4.69 54.60 41.73 35.74 53.58 14.28 NA 11.17 13.25 15.71
Evansville 31 0.46 NA NA 27.84 16.13 72.16 83.87 NA NA 0.93 NA 1.10 0.89 NA
Lexington-Fayette 654 9.73 4.47 2.45 13.97 6.42 42.17 34.25 39.39 56.88 3.15 1.99 2.85 3.86 2.88
KY nonMSA 4,157 61.86 0.01 0.00 11.43 6.23 45.21 43.20 43.35 50.57 17.43 0.00 25.73 19.86 15.31
Data shown includes only one to four-family and manufactured housing (property type 1 or 2). * Based on 2011 Peer Mortgage Data (USPR). ** Home mortgage refinance loans originated and purchased in the MA/AA as a percentage of all home mortgage refinance loans originated and purchased in the rated area. *** Percentage of Owner-Occupied Units is the number of owner-occupied housing units in a particular geography divided by number of owner-occupied housing units in the area based on 2000 Census information.

Charter Number 24
D - 161
Table 5. Geographic Distribution of Multifamily Loans
Geographic Distribution: MULTIFAMILY Geography: KENTUCKY Evaluation Period: JANUARY 1, 2009 To DECEMBER 31, 2011
MA/Assessment Area:
Total Multifamily
Loans
Low-Income Geographies
Moderate-Income
Geographies
Middle-Income Geographies
Upper-Income Geographies
Market Share (%) by Geography*
#
% of Total**
% of MF Units***
% USB Loans
% MF Units***
% USB Loans
% MF Units***
% USB Loans
% MF Units***
% USB Loans
Overall
Low
Mod
Mid
Upp
Full-Review:
Owensboro 0 0.00 NA NA 25.00 0.00 69.55 0.00 5.45 0.00 0.00 NA 0.00 0.00 0.00
Limited-Review:
Bowling Green 4 16.67 NA NA 41.81 25.00 47.25 75.00 10.94 0.00 7.41 NA 5.56 14.29 0.00
Evansville 1 4.17 NA NA 40.17 100.00 59.83 0.00 NA NA 12.50 NA 25.00 0.00 NA
Lexington-Fayette 11 45.83 18.78 45.45 21.51 0.00 40.87 27.27 18.84 27.27 9.80 16.67 0.00 9.09 10.00
KY nonMSA 8 33.33 0.97 0.00 17.60 25.00 48.11 75.00 33.31 0.00 8.82 0.00 0.00 14.29 0.00
Multifamily loan distribution includes Home Purchases, Home Improvement and Refinances. * Based on 2011 Peer Mortgage Data (USPR). ** Multifamily loans originated and purchased in the MA/AA as a percentage of all multifamily loans originated and purchased in the rated area. *** Percentage of multifamily units is the number of multifamily housing units in a particular geography divided by number of multifamily housing units in the area based on 2000 Census information.
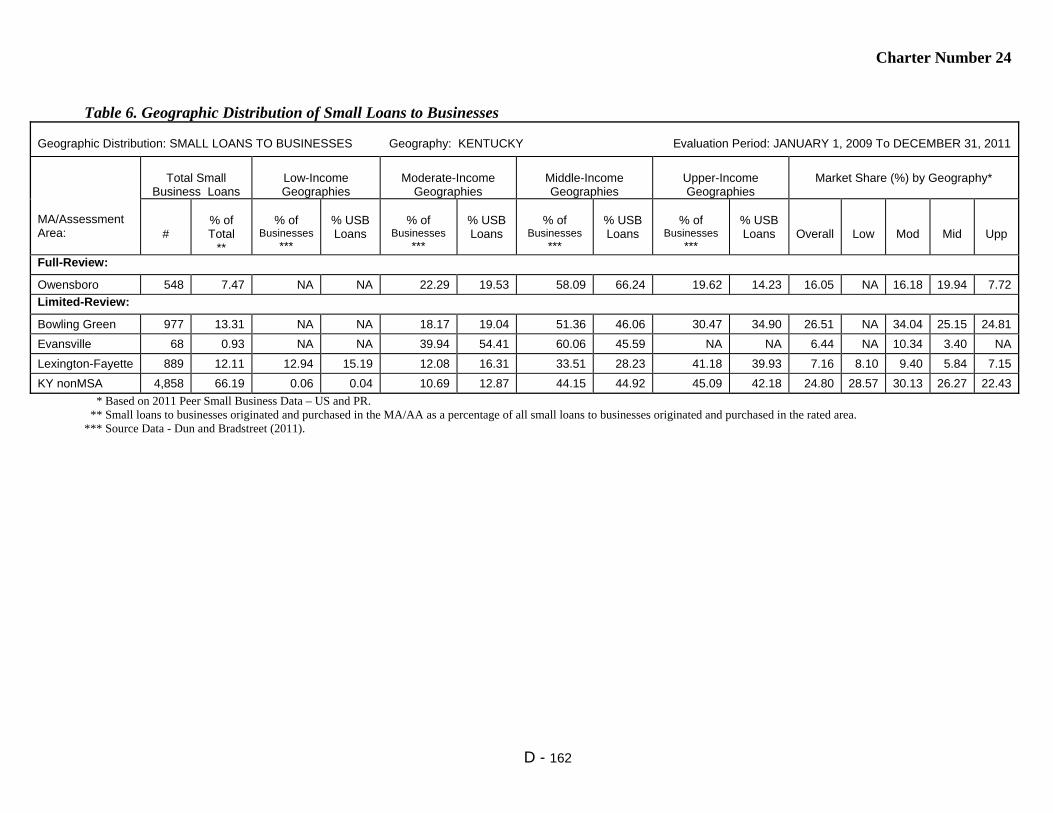
Charter Number 24
D - 162
Table 6. Geographic Distribution of Small Loans to Businesses
Geographic Distribution: SMALL LOANS TO BUSINESSES Geography: KENTUCKY Evaluation Period: JANUARY 1, 2009 To DECEMBER 31, 2011
MA/Assessment Area:
Total Small
Business Loans
Low-Income Geographies
Moderate-Income
Geographies
Middle-Income Geographies
Upper-Income Geographies
Market Share (%) by Geography*
#
% of Total
**
% of
Businesses ***
% USB Loans
% of
Businesses ***
% USB Loans
% of
Businesses ***
% USB Loans
% of
Businesses ***
% USB Loans
Overall
Low
Mod
Mid
Upp
Full-Review:
Owensboro 548 7.47 NA NA 22.29 19.53 58.09 66.24 19.62 14.23 16.05 NA 16.18 19.94 7.72
Limited-Review:
Bowling Green 977 13.31 NA NA 18.17 19.04 51.36 46.06 30.47 34.90 26.51 NA 34.04 25.15 24.81
Evansville 68 0.93 NA NA 39.94 54.41 60.06 45.59 NA NA 6.44 NA 10.34 3.40 NA
Lexington-Fayette 889 12.11 12.94 15.19 12.08 16.31 33.51 28.23 41.18 39.93 7.16 8.10 9.40 5.84 7.15
KY nonMSA 4,858 66.19 0.06 0.04 10.69 12.87 44.15 44.92 45.09 42.18 24.80 28.57 30.13 26.27 22.43
* Based on 2011 Peer Small Business Data – US and PR. ** Small loans to businesses originated and purchased in the MA/AA as a percentage of all small loans to businesses originated and purchased in the rated area. *** Source Data - Dun and Bradstreet (2011).

Charter Number 24
D - 163
Table 7. Geographic Distribution of Small Loans to Farms
Geographic Distribution: SMALL LOANS TO FARMS Geography: KENTUCKY Evaluation Period: JANUARY 1, 2009 To DECEMBER 31, 2011
MA/Assessment Area:
Total Small
Farm Loans
Low-Income Geographies
Moderate-Income
Geographies
Middle-Income Geographies
Upper-Income Geographies
Market Share (%) by Geography*
#
% of
Total**
% of
Farms***
% USB Loans
% of
Farms***
% USB Loans
% of
Farms***
% USB Loans
% of
Farms***
% USB Loans
Overall
Low
Mod
Mid
Upp
Full-Review:
Owensboro 3 0.66 NA NA 15.18 0.00 69.48 100.00 15.34 0.00 0.00 NA 0.00 0.00 0.00
Limited-Review:
Bowling Green 43 9.39 NA NA 5.04 0.00 53.43 65.12 41.53 34.88 25.00 NA 0.00 23.08 30.77
Evansville 0 0.00 NA NA 12.45 0.00 87.55 0.00 NA NA 0.00 NA 0.00 0.00 NA
Lexington-Fayette 10 2.18 6.90 0.00 8.27 10.00 35.24 0.00 49.59 90.00 3.03 0.00 0.00 0.00 5.13
KY nonMSA 402 87.77 0.00 0.00 3.36 4.48 42.36 59.95 54.28 35.57 18.83 0.00 33.33 20.93 16.06
* Based on 2011 Peer Small Business Data – US and PR. ** Small loans to farms originated and purchased in the MA/AA as a percentage of all small loans to farms originated and purchased in the rated area. *** Source Data - Dun and Bradstreet (2011).

Charter Number 24
D - 164
Table 8. Borrower Distribution of Home Purchase Loans
Borrower Distribution: HOME PURCHASE Geography: KENTUCKY Evaluation Period: JANUARY 1, 2009 To DECEMBER 31, 2011
MA/Assessment Area:
Total Home
Purchase Loans
Low-Income Borrowers
Moderate-Income
Borrowers
Middle-Income
Borrowers
Upper-Income
Borrowers
Market Share*
#
% of Total **
% Families
***
% USB Loans
****
% Families
***
% USB Loans
****
% Families
***
% USB Loans
****
% Families
***
% USB Loans
****
Over-
all
Low
Mod
Mid
Upp
Full-Review:
Owensboro 578 20.27 19.92 17.01 17.72 30.06 23.36 24.95 39.00 27.98 16.59 17.11 17.45 17.03 15.29
Limited-Review:
Bowling Green 604 21.19 19.59 9.07 16.71 27.42 20.88 22.38 42.83 41.13 11.71 14.66 10.75 10.48 12.45
Evansville 29 1.02 24.22 18.52 17.91 37.04 23.57 29.63 34.30 14.81 2.76 1.67 5.45 4.20 0.00
Lexington-Fayette 385 13.50 20.53 10.07 16.68 23.74 21.17 28.78 41.62 37.41 1.36 0.41 0.63 1.99 1.77
KY nonMSA 1,255 44.02 19.39 5.16 15.27 16.19 19.07 26.51 46.28 52.14 8.38 5.35 6.37 7.16 10.10
Data shown includes only one to four-family and manufactured housing (property type 1 or 2). * Based on 2011 Peer Mortgage Data (USPR). ** Home purchase loans originated and purchased in the MA/AA as a percentage of all home purchase loans originated and purchased in the rated area. *** Percentage of Families is based on the 2000 Census information. **** As a percentage of loans with borrower income information available. No information was available for 18.8% of loans originated and purchased by the bank.

Charter Number 24
D - 165
Table 9. Borrower Distribution of Home Improvement Loans
Borrower Distribution: HOME IMPROVEMENT Geography: KENTUCKY Evaluation Period: JANUARY 1, 2009 To DECEMBER 31, 2011
MA/Assessment Area:
Total Home Improvement
Loans
Low-Income Borrowers
Moderate-Income
Borrowers
Middle-Income
Borrowers
Upper-Income
Borrowers
Market Share*
#
% of Total
**
% Families
***
% USB Loans
****
% Families
***
% USB Loans
****
% Families
***
% USB Loans
****
% Families
***
% USB Loans
****
Over-
all
Low
Mod
Mid
Upp
Full-Review:
Owensboro 52 8.71 19.92 9.80 17.72 31.37 23.36 25.49 39.00 33.33 10.48 8.57 15.91 5.45 11.58
Limited-Review:
Bowling Green 52 8.71 19.59 17.31 16.71 25.00 20.88 28.85 42.83 28.85 14.65 10.53 20.59 13.95 13.11
Evansville 2 0.34 24.22 0.00 17.91 0.00 23.57 50.00 34.30 50.00 1.45 0.00 0.00 3.33 0.00
Lexington-Fayette 19 3.18 20.53 11.11 16.68 11.11 21.17 11.11 41.62 66.67 1.16 2.78 0.00 1.56 0.93
KY nonMSA 472 79.06 19.39 8.96 15.27 17.27 19.07 25.16 46.28 48.61 12.25 8.33 11.61 12.41 13.32
Data shown includes only one to four-family and manufactured housing (property type of 1 or 2). * Based on 2011 Peer Mortgage Data (USPR). ** Home improvement loans originated and purchased in the MA/AA as a percentage of all home improvement loans originated and purchased in the rated area. *** Percentage of Families is based on the 2000 Census information. **** As a percentage of loans with borrower income information available. No information was available for 0.8% of loans originated and purchased by the bank.

Charter Number 24
D - 166
Table 10. Borrower Distribution of Home Mortgage Refinance Loans
Borrower Distribution: HOME MORTGAGE REFINANCE Geography: KENTUCKY Evaluation Period: JANUARY 1, 2009 To DECEMBER 31, 2011
MA/Assessment Area:
Total Home Mortgage
Refinance Loans
Low-Income Borrowers
Moderate-Income Borrowers
Middle-Income Borrowers
Upper-Income Borrowers
Market Share*
#
% of Total **
% Families
***
% USB Loans
****
% Families
***
% USB Loans
****
% Families
***
% USB Loans
****
% Families
***
% USB Loans
****
Over-
all
Low
Mod
Mid
Upp
Full-Review:
Owensboro 663 9.87 19.92 8.86 17.72 20.27 23.36 29.47 39.00 41.40 13.52 11.88 15.38 17.54 10.75
Limited-Review:
Bowling Green 1,215 18.08 19.59 7.73 16.71 19.89 20.88 24.43 42.83 47.95 14.39 13.11 19.52 12.80 13.59
Evansville 31 0.46 24.22 10.34 17.91 17.24 23.57 44.83 34.30 27.59 0.97 1.32 0.64 1.55 0.68
Lexington-Fayette 654 9.73 20.53 12.90 16.68 18.86 21.17 20.60 41.62 47.64 2.23 4.10 2.28 1.87 2.08
KY nonMSA 4,157 61.86 19.39 3.21 15.27 12.26 19.07 24.43 46.28 60.10 19.54 16.80 21.39 23.59 18.02
Data shown includes only one to four-family and manufactured housing (property type 1 or 2). * Based on 2011 Peer Mortgage Data (USPR). ** Home refinance loans originated and purchased in the MA/AA as a percentage of all home refinance loans originated and purchased in the rated area. *** Percentage of Families is based on the 2000 Census information. **** As a percentage of loans with borrower income information available. No information was available for 13.4% of loans originated and purchased by the bank.

Charter Number 24
D - 167
Table 11. Borrower Distribution of Small Loans to Businesses
Borrower Distribution: SMALL LOANS TO BUSINESSES Geography: KENTUCKY Evaluation Period: JANUARY 1, 2009 To DECEMBER 31, 2011
MA/Assessment Area:
Total Small Loans to
Businesses
Businesses With Revenues of $1 million or
less
Loans by Original Amount Regardless of Business Size
Market Share*
#
% of
Total**
% of Businesses
***
% USB
Loans****
$100,000 or
less
>$100,000 to $250,000
>$250,000 to $1,000,000
All
Rev $1 Million or
Less Full-Review:
Owensboro 548 7.47 67.56 72.63 91.06 2.37 6.57 16.05 22.76
Limited-Review:
Bowling Green 977 13.31 68.65 65.40 80.04 6.86 13.10 26.51 31.90
Evansville 68 0.93 70.01 70.59 98.53 1.47 0.00 6.44 6.98
Lexington-Fayette 889 12.11 65.66 58.27 92.69 3.71 3.60 7.16 8.40
KY nonMSA 4,858 66.19 70.49 66.92 91.46 4.65 3.89 24.80 32.49
* Based on 2011 Peer Small Business Data – US and PR. ** Small loans to businesses originated and purchased in the MA/AA as a percentage of all small loans to businesses originated and purchased in the rated area. *** Businesses with revenues of $1 million or less as a percentage of all businesses (Source Dun and Bradstreet - 2011). **** Small loans to businesses with revenues of $1 million or less as a percentage of all loans reported as small loans to businesses. No information was available for 19.4% of small loans to businesses originated and purchased by the bank.

Charter Number 24
D - 168
Table 12. Borrower Distribution of Small Loans to Farms
Borrower Distribution: SMALL LOANS TO FARMS Geography: KENTUCKY Evaluation Period: JANUARY 1, 2009 To DECEMBER 31, 2011
MA/Assessment Area:
Total Small Loans to Farms
Farms With Revenues of $1 million or less
Loans by Original Amount Regardless of Farm Size
Market Share*
#
% of
Total**
% of
Farms***
% USB
Loans****
$100,000 or
less
>$100,000 to $250,000
>$250,000 to $500,000
All
Rev $1 Million or
Less Full-Review:
Owensboro 3 0.66 99.37 100.00 100.00 0.00 0.00 0.00 0.00
Limited-Review:
Bowling Green 43 9.39 98.99 83.72 60.47 20.93 18.60 25.00 28.57
Evansville 0 0.00 98.71 0.00 0.00 0.00 0.00 0.00 0.00
Lexington-Fayette 10 2.18 95.73 90.00 40.00 20.00 40.00 3.03 4.00
KY nonMSA 402 87.77 99.27 93.78 83.58 13.68 2.74 18.83 20.00
* Based on 2011 Peer Small Business Data – US and PR. ** Small loans to farms originated and purchased in the MA/AA as a percentage of all small loans to farms originated and purchased in the rated area. *** Farms with revenues of $1 million or less as a percentage of all farms (Source Dun and Bradstreet - 2011). **** Small loans to farms with revenues of $1 million or less as a percentage of all loans reported as small loans to farms. No information was available for 2.6% of small loans to farms originated and purchased by the bank.

Charter Number 24
D - 169
Table 14. Qualified Investments
QUALIFIED INVESTMENTS Geography: KENTUCKY Evaluation Period: JANUARY 1, 2009 To MARCH 31, 2012
MA/Assessment Area:
Prior Period Investments* Current Period Investments** Total Investments Unfunded Commitments***
# $(000’s) # $(000’s) # $(000’s) % of Total # $(000’s) Full-Review:
Owensboro 15 2,045 29 2,667 44 4,712 6.96 0 0
Limited-Review:
Bowling Green 13 1,463 17 22,606 30 24,069 35.53 0 0
Evansville 2 37 5 161 7 198 0.29 0 0
Lexington-Fayette 14 468 44 2,092 58 2,560 3.78 0 0
KY nonMSA 55 8,516 86 27,073 141 35,589 52.54 0 0
KY Statewide 2 277 7 335 9 612 0.90 0 0
* 'Prior Period Investments' means investments made in a previous evaluation period that are outstanding as of the examination date. ** The evaluation period for current period investments is January 1, 2009 to March 31, 2012. *** 'Unfunded Commitments' means legally binding investment commitments that are tracked and recorded by the institution's financial reporting system.
Table 15. Distribution of Branch Delivery System and Branch Openings/Closings DISTRIBUTION OF BRANCH DELIVERY SYSTEM/BRANCH OPENINGS/CLOSINGS Geography: KENTUCKY Evaluation Period: JANUARY 1, 2009 To DECEMBER 31, 2011
MA/Assessment Area:
Deposits Branches Branch Openings/Closings Population
% of
Rated Area
Deposits in AA
# of USB
Branches
% of
Rated Area
Branches in AA
Location of Branches by
Income of Geographies (%)
# of Branch
Openings
# of Branch
Closings
Net change in Location of Branches (+ or - )
% of Population within Each
Geography
Low
Mod
Mid
Upp
Low
Mod
Mid
Upp
Low
Mod
Mid
Upp
Full-Review:
Owensboro 21.14 9 12.33 NA 11.11 77.78 11.11 0 0 NA 0 0 0 NA 19.40 61.61 18.99
Limited-Review:
Bowling Green 12.47 6 8.22 NA 16.67 66.67 16.67 0 0 NA 0 0 0 NA 18.05 54.35 27.60
Evansville 0.47 1 1.37 NA 0.00 100.00 NA 0 0 NA 0 0 NA NA 33.51 66.49 NA
Lexington-Fayette 5.50 6 8.22 0.00 33.33 33.33 33.33 0 0 0 0 0 0 11.25 17.22 39.42 31.95
KY nonMSA 60.43 51 69.86 0.00 21.57 41.18 37.25 1 0 0 0 0 1 0.67 12.05 46.01 41.27

Charter Number 24
D - 170
Table 1. Lending Volume
LENDING VOLUME Geography: MINNESOTA Evaluation Period: JANUARY 1, 2009 To DECEMBER 31, 2011
MA/Assessment Area:
% of Rated Area
Loans (#) in MA/AA*
Home Mortgage
Small Loans to
Businesses
Small Loans to Farms
Community
Development Loans**
Total Reported Loans
% of Rated Area
Deposits in MA/AA***
# $ (000’s)
#
$ (000’s)
#
$ (000’s)
#
$ (000’s)
#
$(000’s)
Full-Review:
Duluth 22.38 3,259 442,490 2,073 46,312 3 67 4 6,407 5,339 495,276 27.45 Limited-Review:
Mankato-North Mankato 6.00 584 97,069 833 60,529 10 1,943 5 16,064 1,432 175,605 9.46
Rochester 11.22 1,674 298,971 997 55,480 5 623 1 25 2,677 355,099 19.76
St. Cloud 15.60 1,813 276,188 1,898 73,914 11 132 1 1,009 3,723 351,243 12.56
MN nonMSA 44.77 6,225 993,036 4,254 110,918 194 30,787 8 5,174 10,681 1,139,915 30.78
MN Statewide 0.03 0 0 0 0 0 0 8 13,272 8 13,272 NA * Loan Data as of December 31, 2011. Rated area refers to either the state or multistate MA rating area. ** The evaluation period for Community Development Loans is from January 1, 2009 to March 31, 2012. *** Deposit Data as of June 30, 2011. Rated Area refers to the state, multistate MA, or institution, as appropriate.
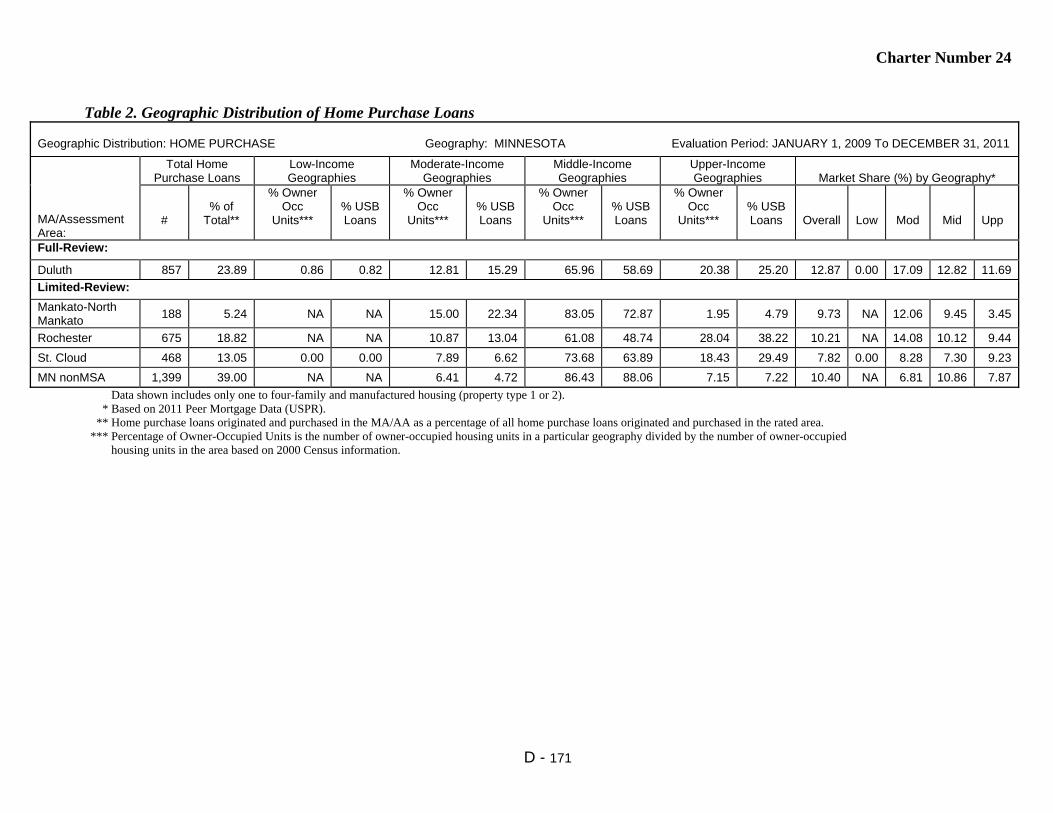
Charter Number 24
D - 171
Table 2. Geographic Distribution of Home Purchase Loans
Geographic Distribution: HOME PURCHASE Geography: MINNESOTA Evaluation Period: JANUARY 1, 2009 To DECEMBER 31, 2011
MA/Assessment Area:
Total Home Purchase Loans
Low-Income Geographies
Moderate-Income Geographies
Middle-Income Geographies
Upper-Income Geographies
Market Share (%) by Geography*
#
% of
Total**
% Owner Occ
Units***
% USB Loans
% Owner Occ
Units***
% USB Loans
% Owner Occ
Units***
% USB Loans
% Owner Occ
Units***
% USB Loans
Overall
Low
Mod
Mid
Upp
Full-Review:
Duluth 857 23.89 0.86 0.82 12.81 15.29 65.96 58.69 20.38 25.20 12.87 0.00 17.09 12.82 11.69
Limited-Review:
Mankato-North Mankato
188 5.24 NA NA 15.00 22.34 83.05 72.87 1.95 4.79 9.73 NA 12.06 9.45 3.45
Rochester 675 18.82 NA NA 10.87 13.04 61.08 48.74 28.04 38.22 10.21 NA 14.08 10.12 9.44
St. Cloud 468 13.05 0.00 0.00 7.89 6.62 73.68 63.89 18.43 29.49 7.82 0.00 8.28 7.30 9.23
MN nonMSA 1,399 39.00 NA NA 6.41 4.72 86.43 88.06 7.15 7.22 10.40 NA 6.81 10.86 7.87
Data shown includes only one to four-family and manufactured housing (property type 1 or 2). * Based on 2011 Peer Mortgage Data (USPR). ** Home purchase loans originated and purchased in the MA/AA as a percentage of all home purchase loans originated and purchased in the rated area. *** Percentage of Owner-Occupied Units is the number of owner-occupied housing units in a particular geography divided by the number of owner-occupied housing units in the area based on 2000 Census information.

Charter Number 24
D - 172
Table 3. Geographic Distribution of Home Improvement Loans
Geographic Distribution: HOME IMPROVEMENT Geography: MINNESOTA Evaluation Period: JANUARY 1, 2009 To DECEMBER 31, 2011
MA/Assessment Area:
Total Home
Improvement Loans
Low-Income Geographies
Moderate-Income
Geographies
Middle-Income Geographies
Upper-Income Geographies
Market Share (%) by Geography*
#
% of
Total**
% Owner
Occ Units***
% USB Loans
% Owner
Occ Units***
% USB Loans
% Owner
Occ Units***
% USB Loans
% Owner
Occ Units***
%
USB Loans
Overall
Low
Mod
Mid
Upp
Full-Review:
Duluth 177 41.26 0.86 0.00 12.81 10.73 65.96 66.10 20.38 23.16 12.27 0.00 5.13 14.29 10.00
Limited-Review:
Mankato-North Mankato 20 4.66 NA NA 15.00 15.00 83.05 85.00 1.95 0.00 13.89 NA 6.25 16.07 0.00
Rochester 24 5.59 NA NA 10.87 0.00 61.08 58.33 28.04 41.67 2.76 NA 0.00 2.74 3.45
St. Cloud 25 5.83 0.00 0.00 7.89 4.00 73.68 68.00 18.43 28.00 3.96 0.00 4.76 3.09 6.82
MN nonMSA 183 42.66 NA NA 6.41 8.20 86.43 81.97 7.15 9.84 11.73 NA 8.51 12.03 11.11
Data shown includes only one to four-family and manufactured housing (property type 1 or 2). * Based on 2011 Peer Mortgage Data (USPR). ** Home improvement loans originated and purchased in the MA/AA as a percentage of all home improvement loans originated and purchased in the rated area. *** Percentage of Owner-Occupied Units is the number of owner-occupied housing units in a particular geography divided by number of owner-occupied housing units in the area based on 2000 Census information.

Charter Number 24
D - 173
Table 4. Geographic Distribution of Home Mortgage Refinance Loans
Geographic Distribution: HOME MORTGAGE REFINANCE Geography: MINNESOTA E valuation Period: JANUARY 1, 2009 To DECEMBER 31, 2011
MA/Assessment Area:
Total Home
Mortgage Refinance Loans
Low-Income Geographies
Moderate-Income Geographies
Middle-Income Geographies
Upper-Income Geographies
Market Share (%) by Geography*
#
% of
Total**
% Owner Occ
Units***
% USB Loans
% Owner Occ
Units***
% USB Loans
% Owner Occ
Units***
% USB Loans
% Owner Occ
Units***
% USB Loans
Overall
Low
Mod
Mid
Upp
Full-Review:
Duluth 2,222 23.33 0.86 0.68 12.81 8.33 65.96 61.43 20.38 29.57 13.86 10.20 12.34 13.97 14.17
Limited-Review:
Mankato-North Mankato
373 3.92 NA NA 15.00 15.01 83.05 80.43 1.95 4.56 8.72 NA 10.94 8.26 9.72
Rochester 973 10.22 NA NA 10.87 5.45 61.08 51.08 28.04 43.47 7.06 NA 7.61 6.88 7.22
St. Cloud 1,320 13.86 0.00 0.15 7.89 3.26 73.68 66.44 18.43 30.15 11.97 16.67 10.19 11.31 13.81
MN nonMSA 4,636 48.68 NA NA 6.41 5.26 86.43 89.30 7.15 5.44 15.16 NA 17.88 15.42 10.68
Data shown includes only one to four-family and manufactured housing (property type 1 or 2). * Based on 2011 Peer Mortgage Data (USPR). ** Home mortgage refinance loans originated and purchased in the MA/AA as a percentage of all home mortgage refinance loans originated and purchased in the rated area. *** Percentage of Owner-Occupied Units is the number of owner-occupied housing units in a particular geography divided by number of owner-occupied housing units in the area based on 2000 Census information.

Charter Number 24
D - 174
Table 5. Geographic Distribution of Multifamily Loans
Geographic Distribution: MULTIFAMILY Geography: MINNESOTA Evaluation Period: JANUARY 1, 2009 To DECEMBER 31, 2011
MA/Assessment Area:
Total
Multifamily Loans
Low-Income Geographies
Moderate-Income
Geographies
Middle-Income Geographies
Upper-Income Geographies
Market Share (%) by Geography*
#
% of Total**
% of MF Units***
% USB Loans
% MF Units***
% USB Loans
% MF Units***
% USB Loans
% MF Units***
% USB Loans
Overall
Low
Mod
Mid
Upp
Full-Review:
Duluth 3 20.00 24.32 66.67 25.27 0.00 40.24 0.00 10.17 33.33 7.14 28.57 0.00 0.00 0.00
Limited-Review:
Mankato-North Mankato
3 20.00 NA NA 31.71 0.00 65.67 100.00 2.63 0.00 0.00 NA 0.00 0.00 0.00
Rochester 2 13.33 NA NA 34.28 100.00 54.30 0.00 11.42 0.00 8.33 NA 20.00 0.00 0.00
St. Cloud 0 0.00 1.91 0.00 17.24 0.00 66.46 0.00 14.39 0.00 0.00 0.00 0.00 0.00 0.00
MN nonMSA 7 46.67 NA NA 10.03 0.00 83.06 85.71 6.91 14.29 3.70 NA 0.00 0.00 100.00
Multifamily loan distribution includes Home Purchases, Home Improvement and Refinances. * Based on 2011 Peer Mortgage Data (USPR). ** Multifamily loans originated and purchased in the MA/AA as a percentage of all multifamily loans originated and purchased in the rated area. *** Percentage of multifamily units is the number of multifamily housing units in a particular geography divided by number of multifamily housing units in the area based on 2000 Census information.
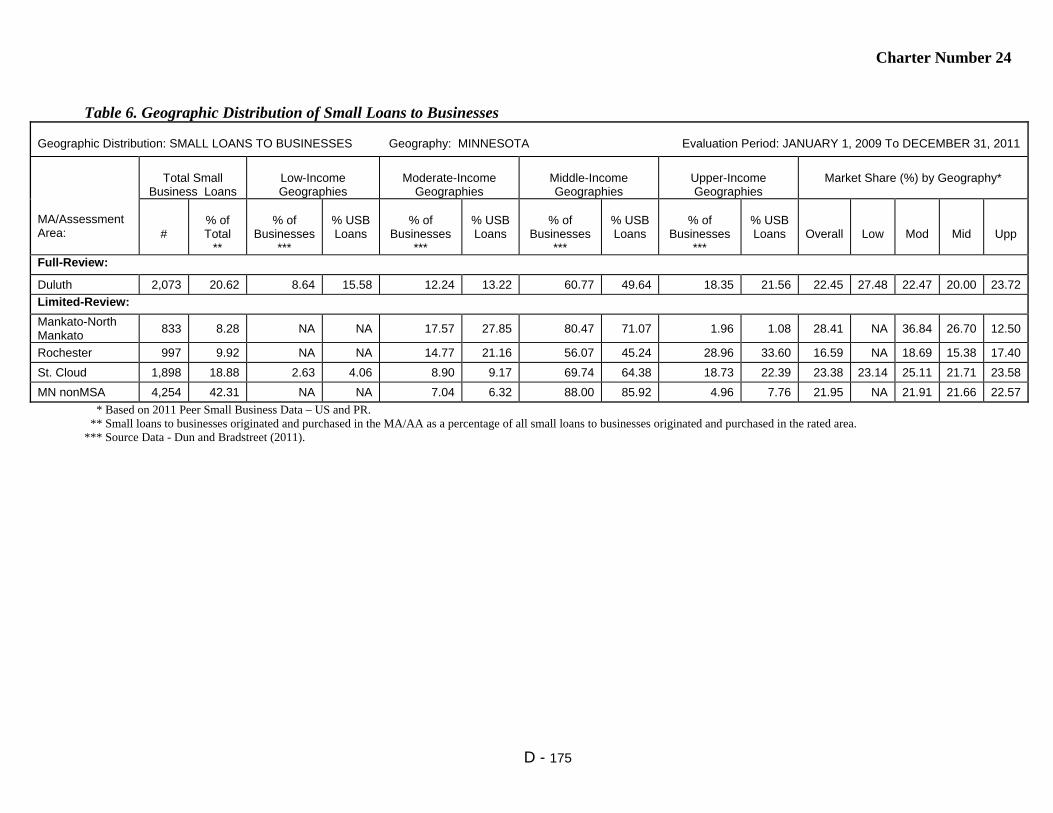
Charter Number 24
D - 175
Table 6. Geographic Distribution of Small Loans to Businesses
Geographic Distribution: SMALL LOANS TO BUSINESSES Geography: MINNESOTA Evaluation Period: JANUARY 1, 2009 To DECEMBER 31, 2011
MA/Assessment Area:
Total Small
Business Loans
Low-Income Geographies
Moderate-Income
Geographies
Middle-Income Geographies
Upper-Income Geographies
Market Share (%) by Geography*
#
% of Total
**
% of
Businesses ***
% USB Loans
% of
Businesses ***
% USB Loans
% of
Businesses ***
% USB Loans
% of
Businesses ***
% USB Loans
Overall
Low
Mod
Mid
Upp
Full-Review:
Duluth 2,073 20.62 8.64 15.58 12.24 13.22 60.77 49.64 18.35 21.56 22.45 27.48 22.47 20.00 23.72
Limited-Review:
Mankato-North Mankato
833 8.28 NA NA 17.57 27.85 80.47 71.07 1.96 1.08 28.41 NA 36.84 26.70 12.50
Rochester 997 9.92 NA NA 14.77 21.16 56.07 45.24 28.96 33.60 16.59 NA 18.69 15.38 17.40
St. Cloud 1,898 18.88 2.63 4.06 8.90 9.17 69.74 64.38 18.73 22.39 23.38 23.14 25.11 21.71 23.58
MN nonMSA 4,254 42.31 NA NA 7.04 6.32 88.00 85.92 4.96 7.76 21.95 NA 21.91 21.66 22.57
* Based on 2011 Peer Small Business Data – US and PR. ** Small loans to businesses originated and purchased in the MA/AA as a percentage of all small loans to businesses originated and purchased in the rated area. *** Source Data - Dun and Bradstreet (2011).

Charter Number 24
D - 176
Table 7. Geographic Distribution of Small Loans to Farms
Geographic Distribution: SMALL LOANS TO FARMS Geography: MINNESOTA E valuation Period: JANUARY 1, 2009 To DECEMBER 31, 2011
MA/Assessment Area:
Total Small
Farm Loans
Low-Income Geographies
Moderate-Income
Geographies
Middle-Income Geographies
Upper-Income Geographies
Market Share (%) by Geography*
#
% of
Total**
% of
Farms***
% USB Loans
% of
Farms***
% USB Loans
% of
Farms***
% USB Loans
% of
Farms***
% USB Loans
Overall
Low
Mod
Mid
Upp Full-Review:
Duluth 3 1.35 3.44 0.00 5.08 0.00 72.46 33.33 19.02 66.67 3.45 0.00 0.00 0.00 16.67
Limited-Review:
Mankato-North Mankato 10 4.48 NA NA 5.23 50.00 94.40 50.00 0.36 0.00 7.14 NA 50.00 4.84 0.00
Rochester 5 2.24 NA NA 3.03 0.00 80.18 60.00 16.79 40.00 4.76 NA 0.00 3.33 8.33
St. Cloud 11 4.93 0.17 0.00 11.33 9.09 81.40 90.91 7.11 0.00 0.00 0.00 0.00 0.00 0.00
MN nonMSA 194 87.00 NA NA 1.52 0.00 93.18 81.44 5.31 18.56 5.13 NA 0.00 4.65 11.49
* Based on 2011 Peer Small Business Data – US and PR. ** Small loans to farms originated and purchased in the MA/AA as a percentage of all small loans to farms originated and purchased in the rated area. *** Source Data - Dun and Bradstreet (2011).

Charter Number 24
D - 177
Table 8. Borrower Distribution of Home Purchase Loans
Borrower Distribution: HOME PURCHASE Geography: MINNESOTA Evaluation Period: JANUARY 1, 2009 To DECEMBER 31, 2011
MA/Assessment Area:
Total Home Purchase
Loans
Low-Income Borrowers
Moderate-Income
Borrowers
Middle-Income
Borrowers
Upper-Income
Borrowers
Market Share*
#
% of Total
**
% Families
***
% USB Loans
****
% Families
***
% USB Loans
****
% Families
***
% USB Loans
****
% Families
***
% USB Loans
****
Over-
all
Low
Mod
Mid
Upp
Full-Review:
Duluth 857 23.89 18.14 20.58 18.58 30.79 23.82 20.86 39.46 27.77 11.94 20.34 14.07 10.74 8.10
Limited-Review:
Mankato-North Mankato 188 5.24 14.87 14.62 16.73 29.23 25.66 25.38 42.74 30.77 9.48 6.25 9.68 7.24 13.91
Rochester 675 18.82 14.78 23.59 18.03 34.20 26.74 18.83 40.45 23.38 7.56 8.79 7.93 8.23 5.66
St. Cloud 468 13.05 16.15 20.63 19.14 26.01 27.52 26.01 37.19 27.35 3.26 3.96 2.42 2.77 4.19
MN nonMSA 1,399 39.00 17.79 14.89 19.62 23.63 25.35 19.13 37.23 42.35 5.28 4.12 4.60 4.76 6.54
Data shown includes only one to four-family and manufactured housing (property type 1 or 2). * Based on 2011 Peer Mortgage Data (USPR). ** Home purchase loans originated and purchased in the MA/AA as a percentage of all home purchase loans originated and purchased in the rated area. *** Percentage of Families is based on the 2000 Census information. **** As a percentage of loans with borrower income information available. No information was available for 37.5% of loans originated and purchased by the bank.
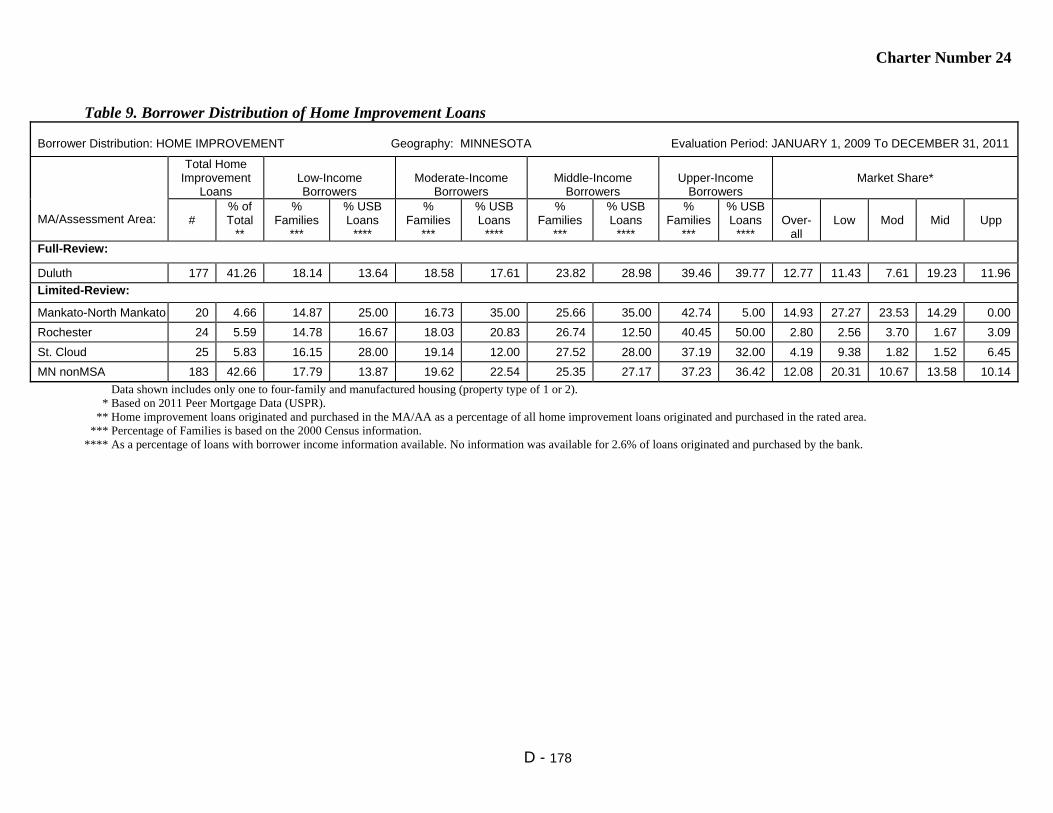
Charter Number 24
D - 178
Table 9. Borrower Distribution of Home Improvement Loans
Borrower Distribution: HOME IMPROVEMENT Geography: MINNESOTA Evaluation Period: JANUARY 1, 2009 To DECEMBER 31, 2011
MA/Assessment Area:
Total Home Improvement
Loans
Low-Income Borrowers
Moderate-Income
Borrowers
Middle-Income
Borrowers
Upper-Income
Borrowers
Market Share*
#
% of Total
**
% Families
***
% USB Loans
****
% Families
***
% USB Loans
****
% Families
***
% USB Loans
****
% Families
***
% USB Loans
****
Over-
all
Low
Mod
Mid
Upp
Full-Review:
Duluth 177 41.26 18.14 13.64 18.58 17.61 23.82 28.98 39.46 39.77 12.77 11.43 7.61 19.23 11.96
Limited-Review:
Mankato-North Mankato 20 4.66 14.87 25.00 16.73 35.00 25.66 35.00 42.74 5.00 14.93 27.27 23.53 14.29 0.00
Rochester 24 5.59 14.78 16.67 18.03 20.83 26.74 12.50 40.45 50.00 2.80 2.56 3.70 1.67 3.09
St. Cloud 25 5.83 16.15 28.00 19.14 12.00 27.52 28.00 37.19 32.00 4.19 9.38 1.82 1.52 6.45
MN nonMSA 183 42.66 17.79 13.87 19.62 22.54 25.35 27.17 37.23 36.42 12.08 20.31 10.67 13.58 10.14
Data shown includes only one to four-family and manufactured housing (property type of 1 or 2). * Based on 2011 Peer Mortgage Data (USPR). ** Home improvement loans originated and purchased in the MA/AA as a percentage of all home improvement loans originated and purchased in the rated area. *** Percentage of Families is based on the 2000 Census information. **** As a percentage of loans with borrower income information available. No information was available for 2.6% of loans originated and purchased by the bank.

Charter Number 24
D - 179
Table 10. Borrower Distribution of Home Mortgage Refinance Loans
Borrower Distribution: HOME MORTGAGE REFINANCE Geography: MINNESOTA Evaluation Period: JANUARY 1, 2009 To DECEMBER 31, 2011
MA/Assessment Area:
Total Home Mortgage Refinance
Loans
Low-Income Borrowers
Moderate-Income Borrowers
Middle-Income Borrowers
Upper-Income Borrowers
Market Share*
#
% of Total
**
% Families
***
% USB Loans
****
% Families
***
% USB Loans
****
% Families
***
% USB Loans
****
% Families
***
% USB
Loans ****
Over-
all
Low
Mod
Mid
Upp
Full-Review:
Duluth 2,222 23.33 18.14 7.88 18.58 20.28 23.82 25.97 39.46 45.87 15.15 17.78 18.33 13.74 14.29
Limited-Review:
Mankato-North Mankato 373 3.92 14.87 10.80 16.73 20.56 25.66 25.09 42.74 43.55 9.04 10.68 8.18 9.28 8.91
Rochester 973 10.22 14.78 11.60 18.03 23.43 26.74 24.97 40.45 40.00 7.06 6.90 8.74 7.57 6.08
St. Cloud 1,320 13.86 16.15 9.16 19.14 21.62 27.52 31.95 37.19 37.27 9.59 9.71 9.84 10.07 9.00
MN nonMSA 4,636 48.68 17.79 7.03 19.62 19.18 25.35 25.60 37.23 48.20 13.51 16.73 15.05 14.29 12.25
Data shown includes only one to four-family and manufactured housing (property type 1 or 2). * Based on 2011 Peer Mortgage Data (USPR). ** Home refinance loans originated and purchased in the MA/AA as a percentage of all home refinance loans originated and purchased in the rated area. *** Percentage of Families is based on the 2000 Census information. **** As a percentage of loans with borrower income information available. No information was available for 18.6% of loans originated and purchased by the bank.

Charter Number 24
D - 180
Table 11. Borrower Distribution of Small Loans to Businesses
Borrower Distribution: SMALL LOANS TO BUSINESSES Geography: MINNESOTA Evaluation Period: JANUARY 1, 2009 To DECEMBER 31, 2011
MA/Assessment Area:
Total Small Loans to
Businesses
Businesses With Revenues of $1 million or
less
Loans by Original Amount Regardless of Business Size
Market Share*
#
% of
Total**
% of Businesses
***
% USB
Loans****
$100,000 or
less
>$100,000 to $250,000
>$250,000 to $1,000,000
All
Rev $1 Million or
Less Full-Review:
Duluth 2,073 20.62 70.38 50.84 96.24 2.12 1.64 22.45 18.28
Limited-Review:
Mankato-North Mankato 833 8.28 67.92 42.02 85.11 5.76 9.12 28.41 23.78
Rochester 997 9.92 70.62 48.85 89.47 4.51 6.02 16.59 12.88
St. Cloud 1,898 18.88 71.23 40.41 92.73 2.95 4.32 23.38 17.62
MN nonMSA 4,254 42.31 73.18 51.43 95.32 2.42 2.26 21.95 19.27
* Based on 2011 Peer Small Business Data – US and PR. ** Small loans to businesses originated and purchased in the MA/AA as a percentage of all small loans to businesses originated and purchased in the rated area. *** Businesses with revenues of $1 million or less as a percentage of all businesses (Source Dun and Bradstreet - 2011). **** Small loans to businesses with revenues of $1 million or less as a percentage of all loans reported as small loans to businesses. No information was available for 33.2% of small loans to businesses originated and purchased by the bank.

Charter Number 24
D - 181
Table 12. Borrower Distribution of Small Loans to Farms
Borrower Distribution: SMALL LOANS TO FARMS Geography: MINNESOTA Evaluation Period: JANUARY 1, 2009 To DECEMBER 31, 2011
MA/Assessment Area:
Total Small Loans to Farms
Farms With Revenues of $1 million or less
Loans by Original Amount Regardless of Farm Size
Market Share*
#
% of
Total**
% of
Farms***
% USB
Loans****
$100,000 or
less
>$100,000 to $250,000
>$250,000 to $500,000
All
Rev $1 Million or
Less Full-Review:
Duluth 3 1.35 99.02 100.00 100.00 0.00 0.00 3.45 4.17
Limited-Review:
Mankato-North 10 4.48 98.19 90.00 30.00 40.00 30.00 7.14 11.76
Rochester 5 2.24 97.85 100.00 20.00 80.00 0.00 4.76 7.14
St. Cloud 11 4.93 98.45 27.27 100.00 0.00 0.00 0.00 0.00
MN nonMSA 194 87.00 98.53 71.65 45.36 35.57 19.07 5.13 5.89
* Based on 2011 Peer Small Business Data – US and PR. ** Small loans to farms originated and purchased in the MA/AA as a percentage of all small loans to farms originated and purchased in the rated area. *** Farms with revenues of $1 million or less as a percentage of all farms (Source Dun and Bradstreet - 2011). **** Small loans to farms with revenues of $1 million or less as a percentage of all loans reported as small loans to farms. No information was available for 4.0% of small loans to farms originated and purchased by the bank.

Charter Number 24
D - 182
Table 14. Qualified Investments
QUALIFIED INVESTMENTS Geography: MINNESOTA Evaluation Period: JANUARY 1, 2009 To MARCH 31, 2012
MA/Assessment Area:
Prior Period Investments* Current Period Investments** Total Investments Unfunded Commitments***
# $(000’s) # $(000’s) # $(000’s) % of Total # $(000’s) Full-Review:
Duluth 13 4,793 70 12,515 83 17,308 40.76 3 6,567
Limited-Review:
Mankato-North Mankato 2 147 13 1,618 15 1,765 4.16 0 0
Rochester 13 1,377 28 1,697 41 3,075 7.24 0 0
St. Cloud 12 855 44 864 56 1,719 4.05 0 0
MN nonMSA 30 7,566 89 6,616 119 14,182 33.40 5 1,556
MN Statewide 8 4,288 22 122 30 4,410 10.39 0 0
* 'Prior Period Investments' means investments made in a previous evaluation period that are outstanding as of the examination date. ** The evaluation period for current period investments is January 1, 2009 to March 31, 2012. *** 'Unfunded Commitments' means legally binding investment commitments that are tracked and recorded by the institution's financial reporting system.
Table 15. Distribution of Branch Delivery System and Branch Openings/Closings DISTRIBUTION OF BRANCH DELIVERY SYSTEM/BRANCH OPENINGS/CLOSINGS Geography: MINNESOTA Evaluation Period: JANUARY 1, 2009 To DECEMBER 31, 2011
MA/Assessment Area:
Deposits Branches Branch Openings/Closings Population
% of
Rated Area
Deposits in AA
# of USB
Branches
% of
Rated Area
Branches in AA
Location of Branches by
Income of Geographies (%)
# of Branch
Openings
# of Branch
Closings
Net change in Location of Branches (+ or - )
% of Population within Each
Geography
Low
Mod
Mid
Upp
Low
Mod
Mid
Upp
Low
Mod
Mid
Upp
Full-Review:
Duluth 27.45 10 25.64 20.00 20.00 40.00 20.00 0 0 0 0 0 0 3.40 15.13 61.82 19.66
Limited-Review:
Mankato-North Mankato
9.46 3 7.69 NA 0.00 100.0 0.00 0 0 NA 0 0 0 NA 19.00 76.72 4.28
Rochester 19.76 4 10.26 NA 50.00 25.00 25.00 0 0 NA 0 0 0 NA 15.00 58.83 25.96
St. Cloud 12.56 5 12.82 20.00 20.00 40.00 20.00 0 0 0 0 0 0 0.66 9.93 71.05 18.36
MN nonMSA 30.78 17 43.59 NA 23.53 76.47 0.00 0 0 NA 0 0 0 NA 7.09 85.77 7.14

Charter Number 24
D - 183
Table 1. Lending Volume
LENDING VOLUME Geography: MISSOURI Evaluation Period: JANUARY 1, 2009 To DECEMBER 31, 2011
MA/Assessment Area:
% of
Rated Area
Loans (#) in MA/AA*
Home Mortgage
Small Loans to
Businesses
Small Loans to Farms
Community
Development Loans**
Total Reported Loans
% of Rated Area Deposits in MA/AA***
#
$ (000’s)
#
$ (000’s)
#
$ (000’s)
#
$ (000’s)
#
$(000’s)
Full-Review:
Joplin 8.07 1,225 124,597 1,049 60,683 85 8,887 8 9,759 2,367 203,926 14.65 Limited-Review
Cape Girardeau-Jackson 5.91 1,026 131,062 667 50,098 42 6,297 0 0 1,735 187,457 6.71
Columbia 4.84 970 163,647 425 26,148 21 4,036 3 16,275 1,419 210,106 3.48 Fayetteville-Springdale- Rogers
0.57 66 6,158 78 2,329 23 1,828 0 0 167 10,315 1.11
Jefferson City 1.10 259 31,159 62 2,315 1 18 2 3,040 324 36,532 0.75
Springfield 18.36 3,690 457,482 1,642 50,068 52 4,659 2 5,240 5,386 517,449 10.17
St. Joseph 5.54 766 86,161 791 32,332 67 6,625 0 0 1,624 125,118 7.64
MO nonMSA 55.60 8,498 989,430 5,746 262,923 2,055 219,352 10 25,570 16,309 1,497,275 55.49
MO Statewide 0.01 0 0 0 0 0 0 4 183,998 4 183,998 NA * Loan Data as of December 31, 2011. Rated area refers to either the state or multistate MA rating area. ** The evaluation period for Community Development Loans is from January 1, 2009 to March 31, 2012. *** Deposit Data as of June 30, 2011. Rated Area refers to the state, multistate MA, or institution, as appropriate.

Charter Number 24
D - 184
Table 2. Geographic Distribution of Home Purchase Loans
Geographic Distribution: HOME PURCHASE Geography: MISSOURI Evaluation Period: JANUARY 1, 2009 To DECEMBER 31, 2011
MA/Assessment Area:
Total Home
Purchase Loans
Low-Income Geographies
Moderate-Income
Geographies
Middle-Income Geographies
Upper-Income Geographies
Market Share (%) by Geography*
#
% of
Total**
% Owner Occ
Units***
% USB Loans
% Owner Occ
Units***
% USB Loans
% Owner Occ
Units***
% USB Loans
% Owner Occ
Units***
% USB Loans
Overall
Low
Mod
Mid
Upp
Full-Review:
Joplin 519 8.51 NA NA 8.10 11.95 84.22 77.65 7.68 10.40 6.75 NA 7.98 6.53 8.06
Limited-Review
Cape Girardeau- Jackson
414 6.79 NA NA 10.92 6.04 74.50 76.33 14.58 17.63 14.59 NA 12.99 14.37 16.56
Columbia 411 6.74 1.83 2.92 10.60 11.92 59.18 63.26 28.39 21.90 5.27 0.00 5.02 5.97 4.03
Fayetteville- Springdale- Rogers
19 0.31 NA NA 70.73 63.16 29.27 36.84 NA NA 7.26 NA 4.85 19.05 NA
Jefferson City 144 2.36 1.13 0.69 7.40 9.72 62.91 70.14 28.55 19.44 5.91 0.00 10.67 6.33 3.87
Springfield 1,706 27.99 0.04 0.00 16.16 18.05 56.80 57.62 27.01 24.33 8.19 0.00 12.99 7.57 7.94
St. Joseph 247 4.05 NA NA 8.35 5.26 61.89 56.28 29.76 38.46 6.03 NA 4.44 5.11 7.67
MO nonMSA 2,636 43.24 0.00 0.00 5.56 5.73 79.08 71.66 15.36 22.61 8.51 0.00 11.56 8.46 8.17
Data shown includes only one to four-family and manufactured housing (property type 1 or 2). * Based on 2011 Peer Mortgage Data (USPR). ** Home purchase loans originated and purchased in the MA/AA as a percentage of all home purchase loans originated and purchased in the rated area. *** Percentage of Owner-Occupied Units is the number of owner-occupied housing units in a particular geography divided by the number of owner-occupied housing units in the area based on 2000 Census information.
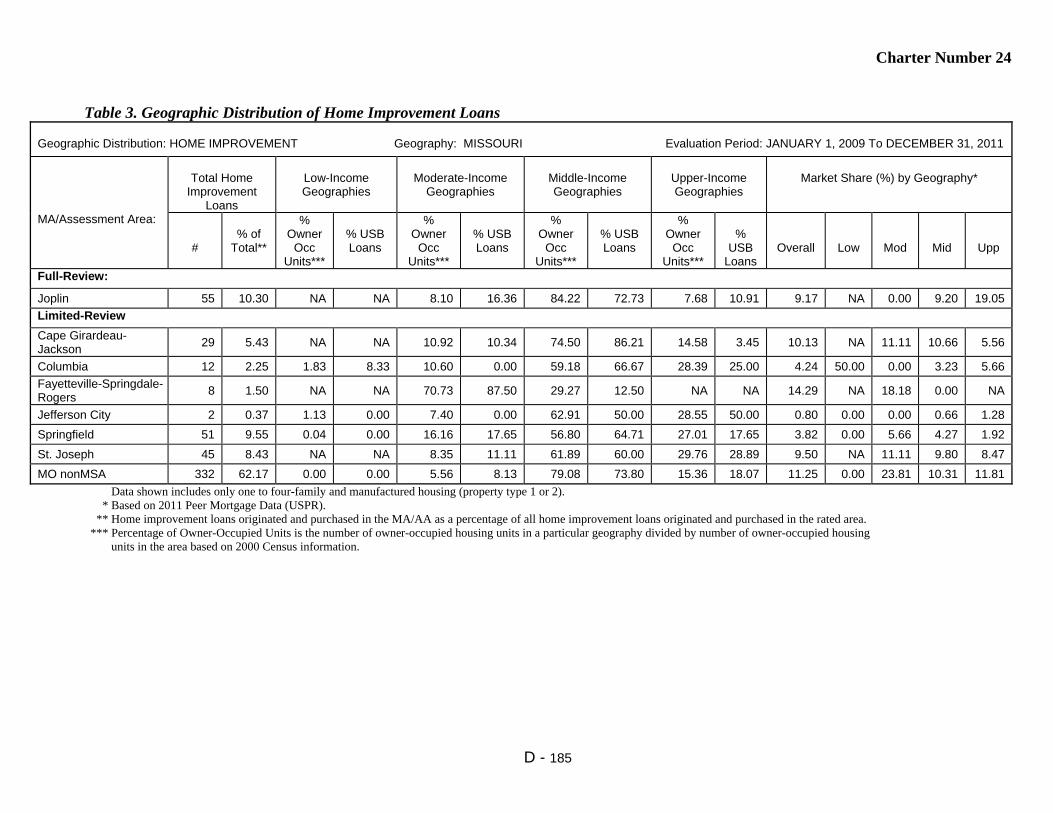
Charter Number 24
D - 185
Table 3. Geographic Distribution of Home Improvement Loans
Geographic Distribution: HOME IMPROVEMENT Geography: MISSOURI Evaluation Period: JANUARY 1, 2009 To DECEMBER 31, 2011
MA/Assessment Area:
Total Home
Improvement Loans
Low-Income Geographies
Moderate-Income
Geographies
Middle-Income Geographies
Upper-Income Geographies
Market Share (%) by Geography*
#
% of
Total**
% Owner
Occ Units***
% USB Loans
% Owner
Occ Units***
% USB Loans
% Owner
Occ Units***
% USB Loans
% Owner
Occ Units***
%
USB Loans
Overall
Low
Mod
Mid
Upp
Full-Review:
Joplin 55 10.30 NA NA 8.10 16.36 84.22 72.73 7.68 10.91 9.17 NA 0.00 9.20 19.05
Limited-Review
Cape Girardeau- Jackson
29 5.43 NA NA 10.92 10.34 74.50 86.21 14.58 3.45 10.13 NA 11.11 10.66 5.56
Columbia 12 2.25 1.83 8.33 10.60 0.00 59.18 66.67 28.39 25.00 4.24 50.00 0.00 3.23 5.66
Fayetteville-Springdale- Rogers
8 1.50 NA NA 70.73 87.50 29.27 12.50 NA NA 14.29 NA 18.18 0.00 NA
Jefferson City 2 0.37 1.13 0.00 7.40 0.00 62.91 50.00 28.55 50.00 0.80 0.00 0.00 0.66 1.28
Springfield 51 9.55 0.04 0.00 16.16 17.65 56.80 64.71 27.01 17.65 3.82 0.00 5.66 4.27 1.92
St. Joseph 45 8.43 NA NA 8.35 11.11 61.89 60.00 29.76 28.89 9.50 NA 11.11 9.80 8.47
MO nonMSA 332 62.17 0.00 0.00 5.56 8.13 79.08 73.80 15.36 18.07 11.25 0.00 23.81 10.31 11.81
Data shown includes only one to four-family and manufactured housing (property type 1 or 2). * Based on 2011 Peer Mortgage Data (USPR). ** Home improvement loans originated and purchased in the MA/AA as a percentage of all home improvement loans originated and purchased in the rated area. *** Percentage of Owner-Occupied Units is the number of owner-occupied housing units in a particular geography divided by number of owner-occupied housing units in the area based on 2000 Census information.
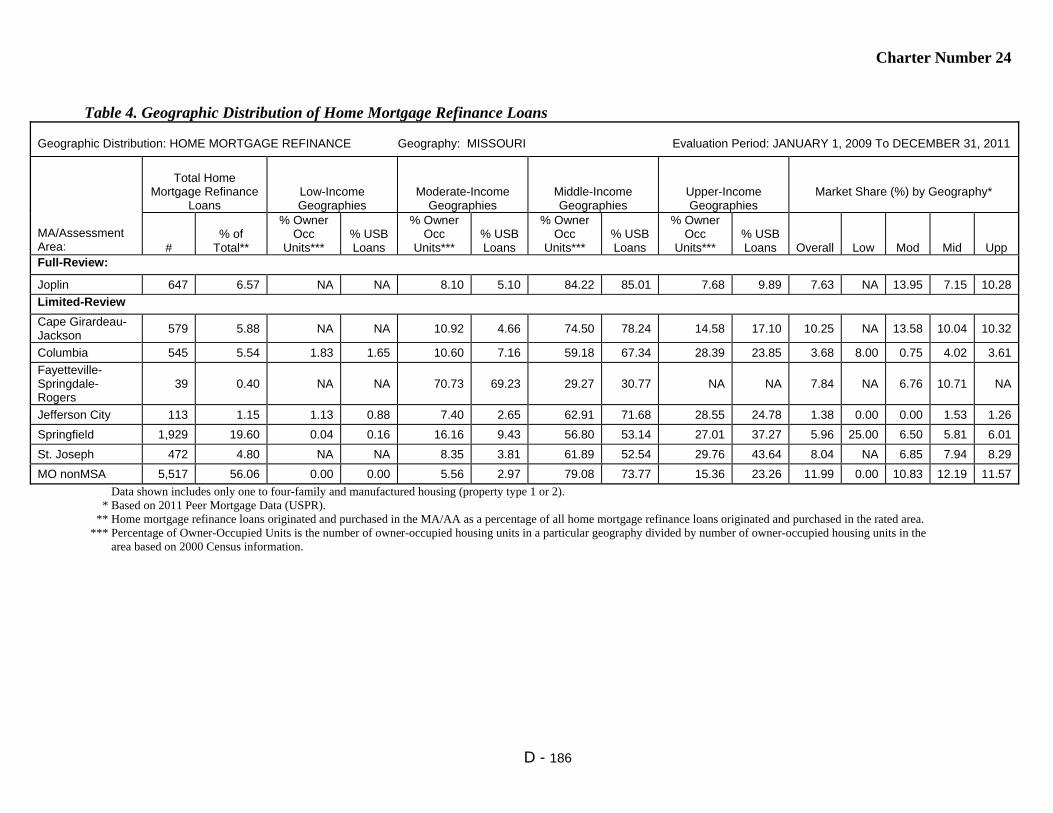
Charter Number 24
D - 186
Table 4. Geographic Distribution of Home Mortgage Refinance Loans
Geographic Distribution: HOME MORTGAGE REFINANCE Geography: MISSOURI Evaluation Period: JANUARY 1, 2009 To DECEMBER 31, 2011
MA/Assessment Area:
Total Home
Mortgage Refinance Loans
Low-Income Geographies
Moderate-Income Geographies
Middle-Income Geographies
Upper-Income Geographies
Market Share (%) by Geography*
#
% of
Total**
% Owner Occ
Units***
% USB Loans
% Owner Occ
Units***
% USB Loans
% Owner Occ
Units***
% USB Loans
% Owner Occ
Units***
% USB Loans
Overall
Low
Mod
Mid
Upp
Full-Review:
Joplin 647 6.57 NA NA 8.10 5.10 84.22 85.01 7.68 9.89 7.63 NA 13.95 7.15 10.28
Limited-Review
Cape Girardeau-Jackson 579 5.88 NA NA 10.92 4.66 74.50 78.24 14.58 17.10 10.25 NA 13.58 10.04 10.32
Columbia 545 5.54 1.83 1.65 10.60 7.16 59.18 67.34 28.39 23.85 3.68 8.00 0.75 4.02 3.61
Fayetteville- Springdale- Rogers
39 0.40 NA NA 70.73 69.23 29.27 30.77 NA NA 7.84 NA 6.76 10.71 NA
Jefferson City 113 1.15 1.13 0.88 7.40 2.65 62.91 71.68 28.55 24.78 1.38 0.00 0.00 1.53 1.26
Springfield 1,929 19.60 0.04 0.16 16.16 9.43 56.80 53.14 27.01 37.27 5.96 25.00 6.50 5.81 6.01
St. Joseph 472 4.80 NA NA 8.35 3.81 61.89 52.54 29.76 43.64 8.04 NA 6.85 7.94 8.29
MO nonMSA 5,517 56.06 0.00 0.00 5.56 2.97 79.08 73.77 15.36 23.26 11.99 0.00 10.83 12.19 11.57
Data shown includes only one to four-family and manufactured housing (property type 1 or 2). * Based on 2011 Peer Mortgage Data (USPR). ** Home mortgage refinance loans originated and purchased in the MA/AA as a percentage of all home mortgage refinance loans originated and purchased in the rated area. *** Percentage of Owner-Occupied Units is the number of owner-occupied housing units in a particular geography divided by number of owner-occupied housing units in the area based on 2000 Census information.

Charter Number 24
D - 187
Table 5. Geographic Distribution of Multifamily Loans
Geographic Distribution: MULTIFAMILY Geography: MISSOURI Evaluation Period: JANUARY 1, 2009 To DECEMBER 31, 2011
MA/Assessment Area:
Total Multifamily
Loans
Low-Income Geographies
Moderate-Income
Geographies
Middle-Income Geographies
Upper-Income Geographies
Market Share (%) by Geography*
#
% of Total**
% of MF
Units***
% USB Loans
% MF Units***
% USB Loans
% MF Units***
% USB Loans
% MF Units***
% USB Loans
Over-
all
Low
Mod
Mid
Upp
Full-Review:
Joplin 4 13.79 NA NA 33.32 25.00 59.26 75.00 7.41 0.00 12.00 NA 0.00 15.79 0.00
Limited-Review
Cape Girardeau-Jackson 4 13.79 NA NA 20.24 25.00 67.92 75.00 11.85 0.00 4.17 NA 0.00 6.25 0.00
Columbia 2 6.90 26.68 50.00 30.14 0.00 16.38 0.00 26.79 50.00 2.94 16.67 0.00 0.00 0.00
Fayetteville- Springdale-Rogers
0 0.00 NA NA 100.00 0.00 0.00 0.00 NA NA 0.00 NA 0.00 0.00 NA
Jefferson City 0 0.00 17.28 0.00 39.17 0.00 26.05 0.00 17.50 0.00 0.00 0.00 0.00 0.00 0.00
Springfield 4 13.79 7.78 25.00 20.58 0.00 53.39 75.00 18.25 0.00 4.35 20.00 0.00 5.26 0.00
St. Joseph 2 6.90 NA NA 27.60 50.00 32.97 50.00 39.43 0.00 6.67 NA 0.00 20.00 0.00
MO nonMSA 13 44.83 0.34 0.00 8.70 15.38 62.89 38.46 28.07 46.15 6.06 0.00 0.00 4.76 14.29
Multifamily loan distribution includes Home Purchases, Home Improvement and Refinances. * Based on 2011 Peer Mortgage Data (USPR). ** Multifamily loans originated and purchased in the MA/AA as a percentage of all multifamily loans originated and purchased in the rated area. *** Percentage of multifamily units is the number of multifamily housing units in a particular geography divided by number of multifamily housing units in the area based on 2000 Census information.
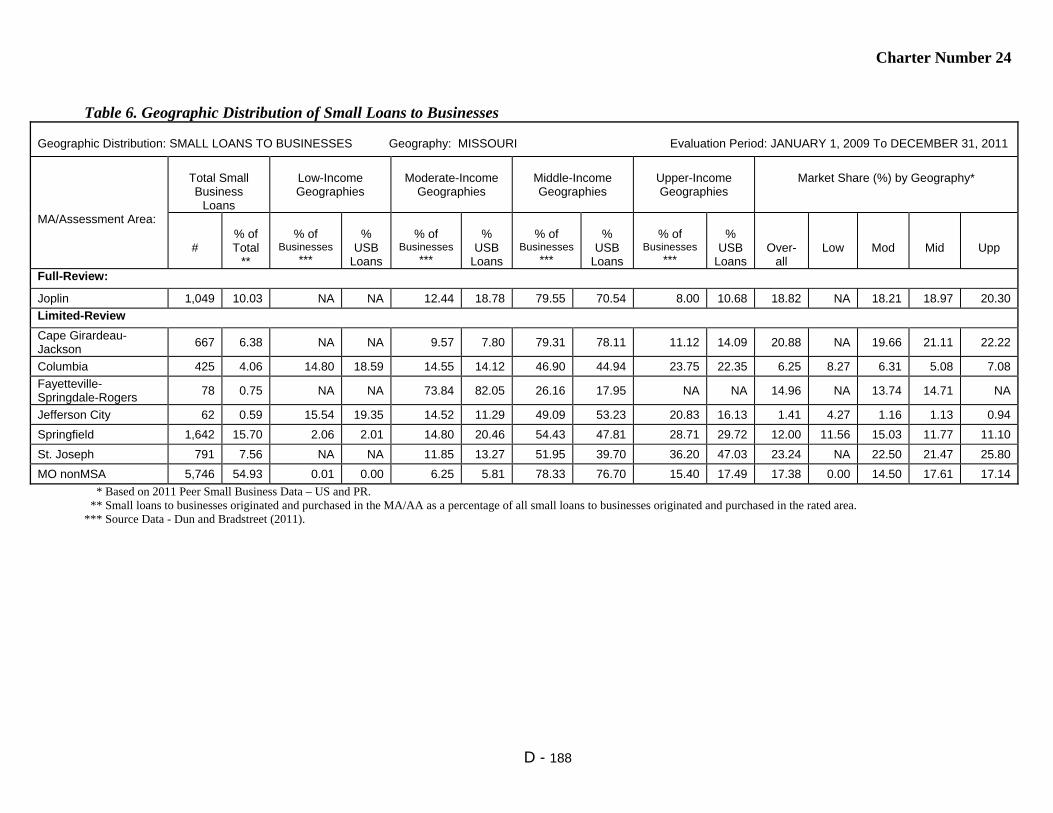
Charter Number 24
D - 188
Table 6. Geographic Distribution of Small Loans to Businesses
Geographic Distribution: SMALL LOANS TO BUSINESSES Geography: MISSOURI Evaluation Period: JANUARY 1, 2009 To DECEMBER 31, 2011
MA/Assessment Area:
Total Small Business
Loans
Low-Income Geographies
Moderate-Income
Geographies
Middle-Income Geographies
Upper-Income Geographies
Market Share (%) by Geography*
#
% of Total
**
% of
Businesses ***
%
USB Loans
% of
Businesses ***
%
USB Loans
% of
Businesses ***
%
USB Loans
% of
Businesses ***
%
USB Loans
Over-
all
Low
Mod
Mid
Upp
Full-Review:
Joplin 1,049 10.03 NA NA 12.44 18.78 79.55 70.54 8.00 10.68 18.82 NA 18.21 18.97 20.30
Limited-Review
Cape Girardeau- Jackson 667 6.38 NA NA 9.57 7.80 79.31 78.11 11.12 14.09 20.88 NA 19.66 21.11 22.22
Columbia 425 4.06 14.80 18.59 14.55 14.12 46.90 44.94 23.75 22.35 6.25 8.27 6.31 5.08 7.08
Fayetteville- Springdale-Rogers
78 0.75 NA NA 73.84 82.05 26.16 17.95 NA NA 14.96 NA 13.74 14.71 NA
Jefferson City 62 0.59 15.54 19.35 14.52 11.29 49.09 53.23 20.83 16.13 1.41 4.27 1.16 1.13 0.94
Springfield 1,642 15.70 2.06 2.01 14.80 20.46 54.43 47.81 28.71 29.72 12.00 11.56 15.03 11.77 11.10
St. Joseph 791 7.56 NA NA 11.85 13.27 51.95 39.70 36.20 47.03 23.24 NA 22.50 21.47 25.80
MO nonMSA 5,746 54.93 0.01 0.00 6.25 5.81 78.33 76.70 15.40 17.49 17.38 0.00 14.50 17.61 17.14
* Based on 2011 Peer Small Business Data – US and PR. ** Small loans to businesses originated and purchased in the MA/AA as a percentage of all small loans to businesses originated and purchased in the rated area. *** Source Data - Dun and Bradstreet (2011).

Charter Number 24
D - 189
Table 7. Geographic Distribution of Small Loans to Farms
Geographic Distribution: SMALL LOANS TO FARMS Geography: MISSOURI Evaluation Period: JANUARY 1, 2009 To DECEMBER 31, 2011
MA/Assessment Area:
Total Small
Farm Loans
Low-Income Geographies
Moderate-Income
Geographies
Middle-Income Geographies
Upper-Income Geographies
Market Share (%) by Geography*
#
% of
Total**
% of
Farms***
% USB Loans
% of
Farms***
% USB Loans
% of
Farms***
% USB Loans
% of
Farms***
% USB Loans
Overall
Low
Mod
Mid
Upp Full-Review:
Joplin 85 3.62 NA NA 3.22 0.00 93.41 100.00 3.37 0.00 14.29 NA 0.00 14.71 0.00
Limited-Review
Cape Girardeau-Jackson 42 1.79 NA NA 2.42 2.38 92.74 97.62 4.84 0.00 18.42 NA 100.00 17.39 0.00
Columbia 21 0.90 1.52 0.00 7.59 4.76 77.93 85.71 12.97 9.52 5.98 0.00 0.00 7.45 0.00
Fayetteville- Springdale-Rogers
23 0.98 NA NA 65.55 60.87 34.45 39.13 NA NA 19.70 NA 14.00 40.00 NA
Jefferson City 1 0.04 2.43 0.00 4.51 0.00 62.50 0.00 30.56 100.00 0.00 0.00 0.00 0.00 0.00
Springfield 52 2.22 0.10 0.00 13.09 28.85 66.73 63.46 20.08 7.69 3.23 0.00 6.25 2.29 4.17
St. Joseph 67 2.86 NA NA 1.50 0.00 70.04 59.70 28.46 40.30 10.66 NA 0.00 6.58 18.60
MO nonMSA 2,055 87.60 0.00 0.00 2.79 1.61 80.57 84.04 16.64 14.36 17.34 0.00 8.60 17.71 11.92
* Based on 2011 Peer Small Business Data – US and PR. ** Small loans to farms originated and purchased in the MA/AA as a percentage of all small loans to farms originated and purchased in the rated area. *** Source Data - Dun and Bradstreet (2011).

Charter Number 24
D - 190
Table 8. Borrower Distribution of Home Purchase Loans
Borrower Distribution: HOME PURCHASE Geography: MISSOURI Evaluation Period: JANUARY 1, 2009 To DECEMBER 31, 2011
MA/Assessment Area:
Total Home
Purchase Loans
Low-Income Borrowers
Moderate-Income
Borrowers
Middle-Income
Borrowers
Upper-Income
Borrowers
Market Share*
#
% of Total **
% Families
***
% USB Loans
****
% Families
***
% USB Loans
****
% Families
***
% USB Loans
****
% Families
***
% USB Loans
****
Over-
all
Low
Mod
Mid
Upp
Full-Review:
Joplin 519 8.51 17.53 12.28 19.46 22.46 24.59 28.07 38.41 37.19 4.93 2.49 4.44 5.74 5.25
Limited-Review
Cape Girardeau- Jackson
414 6.79 13.49 13.01 14.46 22.96 21.81 30.10 50.24 33.93 16.24 16.13 20.10 17.97 13.30
Columbia 411 6.74 19.11 11.71 17.92 27.48 22.87 23.87 40.10 36.94 2.96 2.46 3.79 1.99 3.19
Fayetteville- Springdale-Rogers
19 0.31 29.84 12.50 24.80 18.75 22.72 25.00 22.63 43.75 7.84 11.76 9.09 0.00 12.12
Jefferson City 144 2.36 15.40 18.87 15.13 28.30 25.63 33.96 43.85 18.87 1.15 0.00 0.96 3.02 0.36
Springfield 1,706 27.99 17.54 17.67 19.69 30.58 24.11 24.56 38.66 27.19 3.88 3.70 4.33 3.63 3.75
St. Joseph 247 4.05 18.18 16.67 18.63 33.33 23.95 25.98 39.24 24.02 5.04 3.74 6.08 5.06 4.49
MO nonMSA 2,636 43.24 18.33 7.59 18.37 23.16 23.26 24.65 40.04 44.60 7.63 8.59 8.46 7.14 7.39
Data shown includes only one to four-family and manufactured housing (property type 1 or 2). * Based on 2011 Peer Mortgage Data (USPR). ** Home purchase loans originated and purchased in the MA/AA as a percentage of all home purchase loans originated and purchased in the rated area. *** Percentage of Families is based on the 2000 Census information. **** As a percentage of loans with borrower income information available. No information was available for 37.0% of loans originated and purchased by the bank.
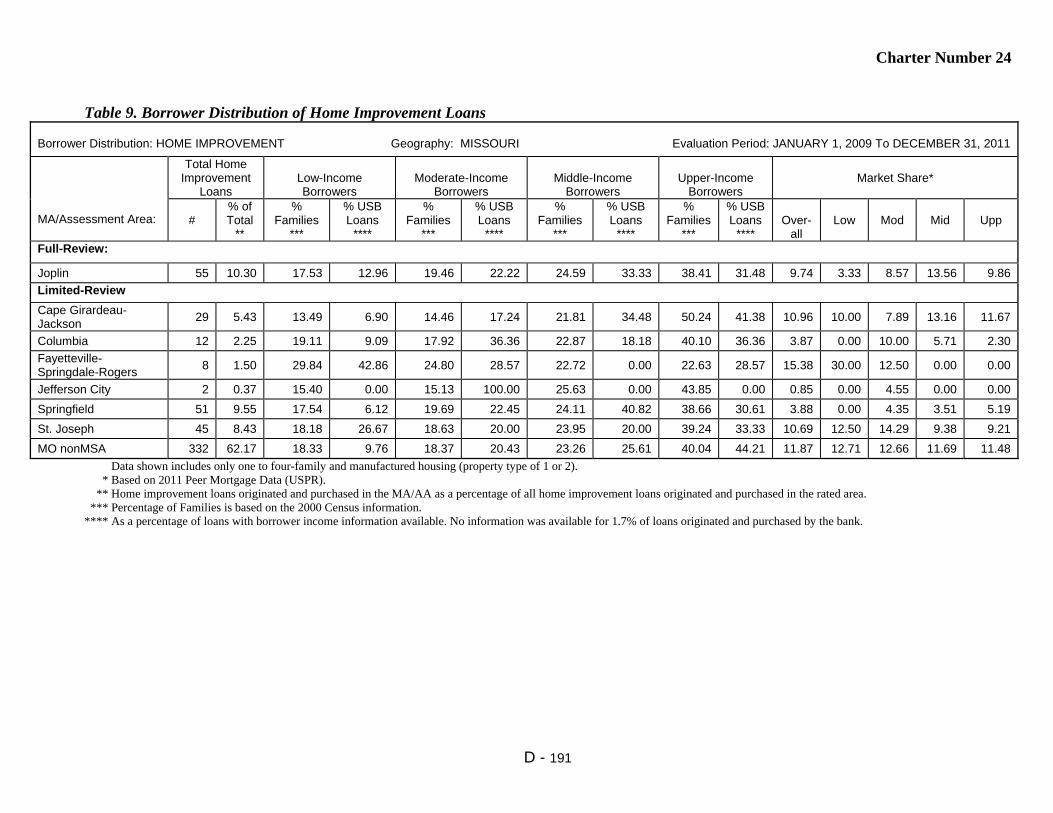
Charter Number 24
D - 191
Table 9. Borrower Distribution of Home Improvement Loans
Borrower Distribution: HOME IMPROVEMENT Geography: MISSOURI Evaluation Period: JANUARY 1, 2009 To DECEMBER 31, 2011
MA/Assessment Area:
Total Home Improvement
Loans
Low-Income Borrowers
Moderate-Income
Borrowers
Middle-Income
Borrowers
Upper-Income
Borrowers
Market Share*
#
% of Total
**
% Families
***
% USB Loans
****
% Families
***
% USB Loans
****
% Families
***
% USB Loans
****
% Families
***
% USB Loans
****
Over-
all
Low
Mod
Mid
Upp
Full-Review:
Joplin 55 10.30 17.53 12.96 19.46 22.22 24.59 33.33 38.41 31.48 9.74 3.33 8.57 13.56 9.86
Limited-Review
Cape Girardeau- Jackson
29 5.43 13.49 6.90 14.46 17.24 21.81 34.48 50.24 41.38 10.96 10.00 7.89 13.16 11.67
Columbia 12 2.25 19.11 9.09 17.92 36.36 22.87 18.18 40.10 36.36 3.87 0.00 10.00 5.71 2.30
Fayetteville- Springdale-Rogers
8 1.50 29.84 42.86 24.80 28.57 22.72 0.00 22.63 28.57 15.38 30.00 12.50 0.00 0.00
Jefferson City 2 0.37 15.40 0.00 15.13 100.00 25.63 0.00 43.85 0.00 0.85 0.00 4.55 0.00 0.00
Springfield 51 9.55 17.54 6.12 19.69 22.45 24.11 40.82 38.66 30.61 3.88 0.00 4.35 3.51 5.19
St. Joseph 45 8.43 18.18 26.67 18.63 20.00 23.95 20.00 39.24 33.33 10.69 12.50 14.29 9.38 9.21
MO nonMSA 332 62.17 18.33 9.76 18.37 20.43 23.26 25.61 40.04 44.21 11.87 12.71 12.66 11.69 11.48
Data shown includes only one to four-family and manufactured housing (property type of 1 or 2). * Based on 2011 Peer Mortgage Data (USPR). ** Home improvement loans originated and purchased in the MA/AA as a percentage of all home improvement loans originated and purchased in the rated area. *** Percentage of Families is based on the 2000 Census information. **** As a percentage of loans with borrower income information available. No information was available for 1.7% of loans originated and purchased by the bank.

Charter Number 24
D - 192
Table 10. Borrower Distribution of Home Mortgage Refinance Loans
Borrower Distribution: HOME MORTGAGE REFINANCE Geography: MISSOURI Evaluation Period: JANUARY 1, 2009 To DECEMBER 31, 2011
MA/Assessment Area:
Total Home Mortgage Refinance
Loans
Low-Income Borrowers
Moderate-Income Borrowers
Middle-Income Borrowers
Upper-Income Borrowers
Market Share*
#
% of Total
**
% Families
***
% USB Loans
****
% Families
***
% USB Loans
****
% Families
***
% USB Loans
****
% Families
***
% USB
Loans ****
Over-
all
Low
Mod
Mid
Upp
Full-Review:
Joplin 647 6.57 17.53 5.50 19.46 16.50 24.59 25.67 38.41 52.33 9.40 8.85 8.93 11.86 8.61
Limited-Review
Cape Girardeau-Jackson 579 5.88 13.49 7.09 14.46 16.79 21.81 26.68 50.24 49.44 11.17 18.42 12.75 11.56 9.79
Columbia 545 5.54 19.11 11.06 17.92 17.44 22.87 25.31 40.10 46.19 3.30 6.48 2.88 2.70 3.29
Fayetteville- Springdale-Rogers
39 0.40 29.84 8.33 24.80 25.00 22.72 30.56 22.63 36.11 8.70 8.00 7.14 10.00 8.96
Jefferson City 113 1.15 15.40 8.24 15.13 15.29 25.63 34.12 43.85 42.35 1.15 2.46 1.01 1.16 0.99
Springfield 1,929 19.60 17.54 7.22 19.69 19.22 24.11 26.04 38.66 47.53 4.67 4.40 5.51 5.49 4.03
St. Joseph 472 4.80 18.18 8.33 18.63 18.57 23.95 26.67 39.24 46.43 9.01 8.97 9.13 10.82 8.03
MO nonMSA 5,517 56.06 18.33 5.01 18.37 15.52 23.26 22.96 40.04 56.51 13.56 15.06 17.02 14.39 12.38
Data shown includes only one to four-family and manufactured housing (property type 1 or 2). * Based on 2011 Peer Mortgage Data (USPR). ** Home refinance loans originated and purchased in the MA/AA as a percentage of all home refinance loans originated and purchased in the rated area. *** Percentage of Families is based on the 2000 Census information. **** As a percentage of loans with borrower income information available. No information was available for 17.8% of loans originated and purchased by the bank.
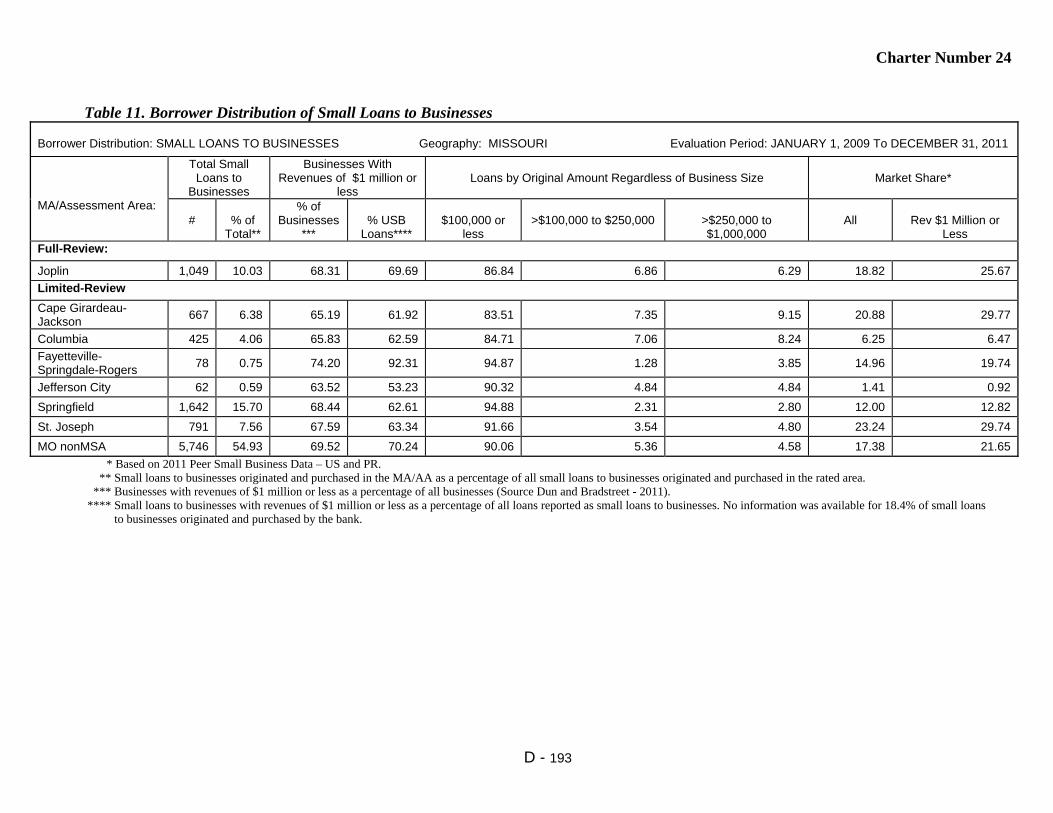
Charter Number 24
D - 193
Table 11. Borrower Distribution of Small Loans to Businesses
Borrower Distribution: SMALL LOANS TO BUSINESSES Geography: MISSOURI Evaluation Period: JANUARY 1, 2009 To DECEMBER 31, 2011
MA/Assessment Area:
Total Small Loans to
Businesses
Businesses With Revenues of $1 million or
less
Loans by Original Amount Regardless of Business Size
Market Share*
#
% of
Total**
% of Businesses
***
% USB
Loans****
$100,000 or
less
>$100,000 to $250,000
>$250,000 to $1,000,000
All
Rev $1 Million or
Less Full-Review:
Joplin 1,049 10.03 68.31 69.69 86.84 6.86 6.29 18.82 25.67
Limited-Review
Cape Girardeau- Jackson
667 6.38 65.19 61.92 83.51 7.35 9.15 20.88 29.77
Columbia 425 4.06 65.83 62.59 84.71 7.06 8.24 6.25 6.47
Fayetteville- Springdale-Rogers
78 0.75 74.20 92.31 94.87 1.28 3.85 14.96 19.74
Jefferson City 62 0.59 63.52 53.23 90.32 4.84 4.84 1.41 0.92
Springfield 1,642 15.70 68.44 62.61 94.88 2.31 2.80 12.00 12.82
St. Joseph 791 7.56 67.59 63.34 91.66 3.54 4.80 23.24 29.74
MO nonMSA 5,746 54.93 69.52 70.24 90.06 5.36 4.58 17.38 21.65
* Based on 2011 Peer Small Business Data – US and PR. ** Small loans to businesses originated and purchased in the MA/AA as a percentage of all small loans to businesses originated and purchased in the rated area. *** Businesses with revenues of $1 million or less as a percentage of all businesses (Source Dun and Bradstreet - 2011). **** Small loans to businesses with revenues of $1 million or less as a percentage of all loans reported as small loans to businesses. No information was available for 18.4% of small loans to businesses originated and purchased by the bank.
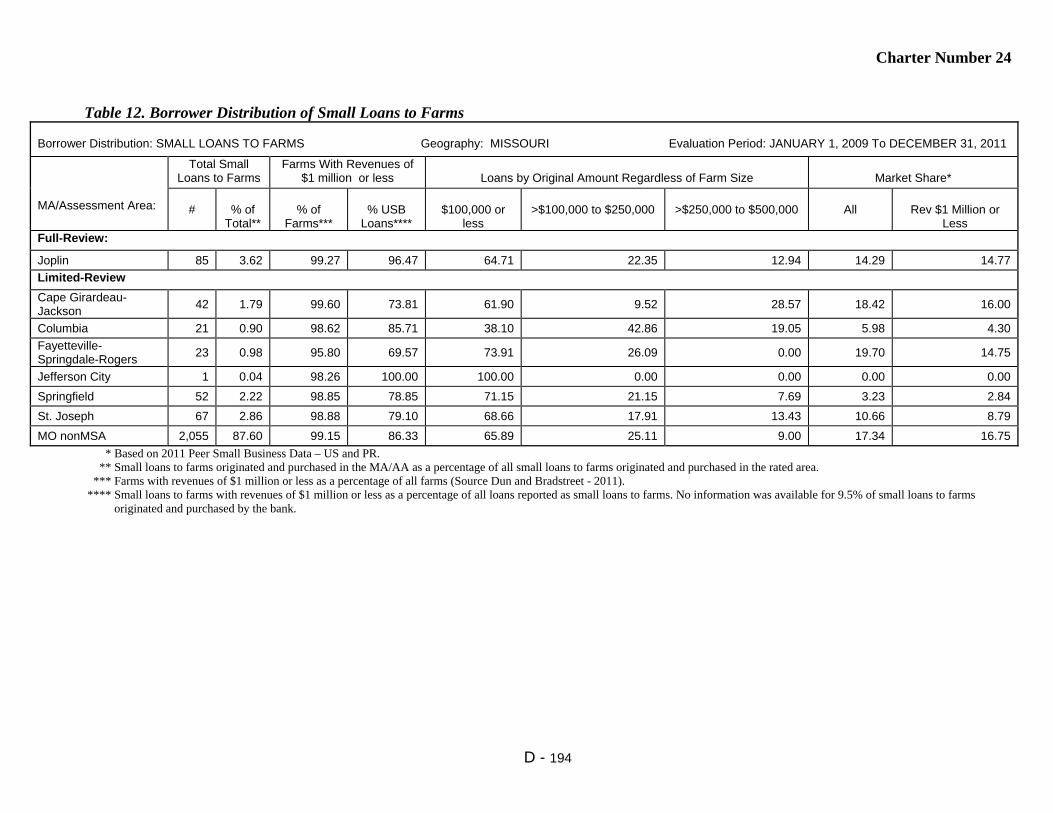
Charter Number 24
D - 194
Table 12. Borrower Distribution of Small Loans to Farms
Borrower Distribution: SMALL LOANS TO FARMS Geography: MISSOURI Evaluation Period: JANUARY 1, 2009 To DECEMBER 31, 2011
MA/Assessment Area:
Total Small Loans to Farms
Farms With Revenues of $1 million or less
Loans by Original Amount Regardless of Farm Size
Market Share*
#
% of
Total**
% of
Farms***
% USB
Loans****
$100,000 or
less
>$100,000 to $250,000
>$250,000 to $500,000
All
Rev $1 Million or
Less Full-Review:
Joplin 85 3.62 99.27 96.47 64.71 22.35 12.94 14.29 14.77
Limited-Review
Cape Girardeau- Jackson
42 1.79 99.60 73.81 61.90 9.52 28.57 18.42 16.00
Columbia 21 0.90 98.62 85.71 38.10 42.86 19.05 5.98 4.30
Fayetteville- Springdale-Rogers
23 0.98 95.80 69.57 73.91 26.09 0.00 19.70 14.75
Jefferson City 1 0.04 98.26 100.00 100.00 0.00 0.00 0.00 0.00
Springfield 52 2.22 98.85 78.85 71.15 21.15 7.69 3.23 2.84
St. Joseph 67 2.86 98.88 79.10 68.66 17.91 13.43 10.66 8.79
MO nonMSA 2,055 87.60 99.15 86.33 65.89 25.11 9.00 17.34 16.75
* Based on 2011 Peer Small Business Data – US and PR. ** Small loans to farms originated and purchased in the MA/AA as a percentage of all small loans to farms originated and purchased in the rated area. *** Farms with revenues of $1 million or less as a percentage of all farms (Source Dun and Bradstreet - 2011). **** Small loans to farms with revenues of $1 million or less as a percentage of all loans reported as small loans to farms. No information was available for 9.5% of small loans to farms originated and purchased by the bank.
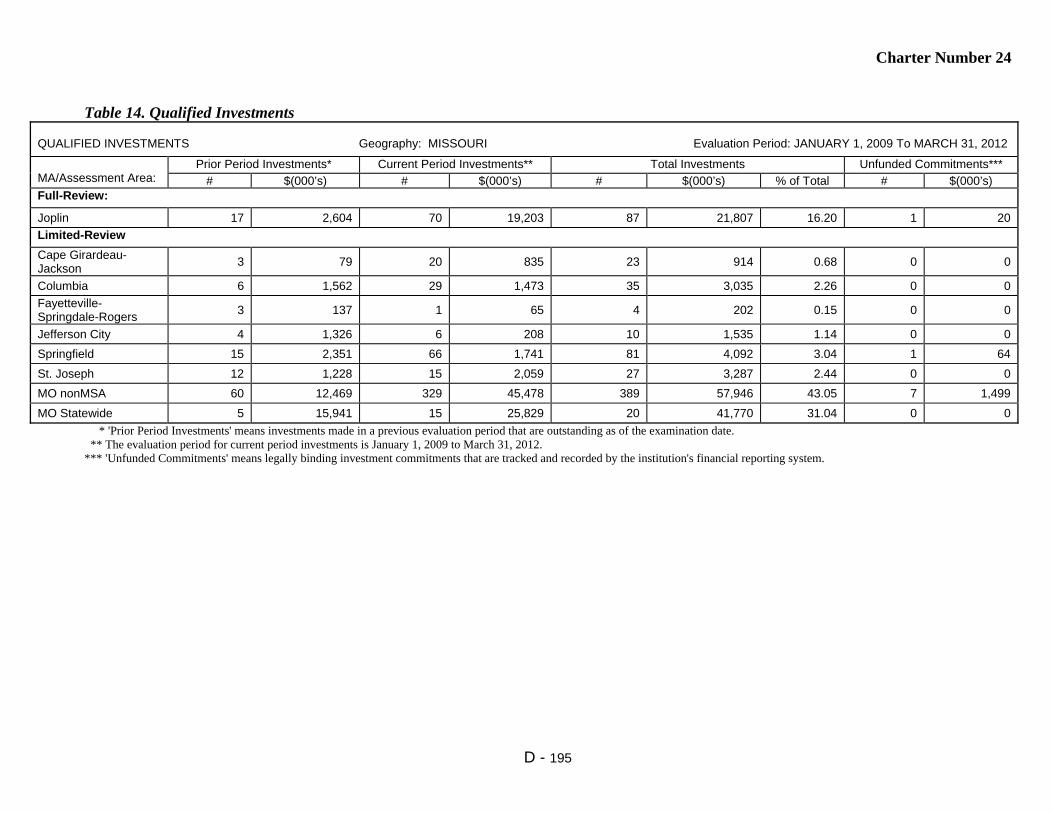
Charter Number 24
D - 195
Table 14. Qualified Investments
QUALIFIED INVESTMENTS Geography: MISSOURI Evaluation Period: JANUARY 1, 2009 To MARCH 31, 2012
MA/Assessment Area:
Prior Period Investments* Current Period Investments** Total Investments Unfunded Commitments***
# $(000’s) # $(000’s) # $(000’s) % of Total # $(000’s) Full-Review:
Joplin 17 2,604 70 19,203 87 21,807 16.20 1 20
Limited-Review
Cape Girardeau- Jackson
3 79 20 835 23 914 0.68 0 0
Columbia 6 1,562 29 1,473 35 3,035 2.26 0 0
Fayetteville- Springdale-Rogers
3 137 1 65 4 202 0.15 0 0
Jefferson City 4 1,326 6 208 10 1,535 1.14 0 0
Springfield 15 2,351 66 1,741 81 4,092 3.04 1 64
St. Joseph 12 1,228 15 2,059 27 3,287 2.44 0 0
MO nonMSA 60 12,469 329 45,478 389 57,946 43.05 7 1,499
MO Statewide 5 15,941 15 25,829 20 41,770 31.04 0 0
* 'Prior Period Investments' means investments made in a previous evaluation period that are outstanding as of the examination date. ** The evaluation period for current period investments is January 1, 2009 to March 31, 2012. *** 'Unfunded Commitments' means legally binding investment commitments that are tracked and recorded by the institution's financial reporting system.

Charter Number 24
D - 196
Table 15. Distribution of Branch Delivery System and Branch Openings/Closings
DISTRIBUTION OF BRANCH DELIVERY SYSTEM/BRANCH OPENINGS/CLOSINGS Geography: MISSOURI Evaluation Period: JANUARY 1, 2009 To DECEMBER 31, 2011
MA/Assessment Area:
Deposits Branches Branch Openings/Closings Population
% of
Rated Area
Deposits in AA
# of USB Branches
% of
Rated Area
Branches in AA
Location of Branches by
Income of Geographies (%)
# of Branch Open-ings
# of Branch
Closings
Net change in Location of Branches (+ or - )
% of Population within Each
Geography
Low
Mod
Mid
Upp
Low
Mod
Mid
Upp
Low
Mod
Mid
Upp Full-Review:
Joplin 14.65 10 9.71 NA 20.00 70.00 10.00 0 0 NA 0 0 0 NA 11.30 81.76 6.94
Limited-Review
Cape Girardeau- Jackson
6.71 4 3.88 NA 0.00 100.0 0.00 0 1 NA -1 0 0 NA 13.54 73.72 12.75
Columbia 3.48 5 4.85 60.00 0.00 20.00 20.00 1 0 1 0 0 0 7.49 17.95 50.57 23.99
Fayetteville- Springdale- Rogers
1.11 1 0.97 NA 100.0 0.00 NA 0 0 NA 0 0 NA NA 74.84 25.16 NA
Jefferson City 0.75 1 0.97 100.00 0.00 0.00 0.00 0 0 0 0 0 0 5.62 11.52 56.24 23.97
Springfield 10.17 13 12.62 7.69 23.08 53.85 15.38 0 0 0 0 0 0 1.64 19.56 55.52 23.28
St. Joseph 7.64 6 5.83 NA 16.67 50.00 33.33 0 0 NA 0 0 0 NA 11.62 58.75 29.62
MO nonMSA 55.49 63 61.17 0.00 9.52 77.78 12.70 0 0 0 0 0 0 0.25 6.43 78.29 15.02
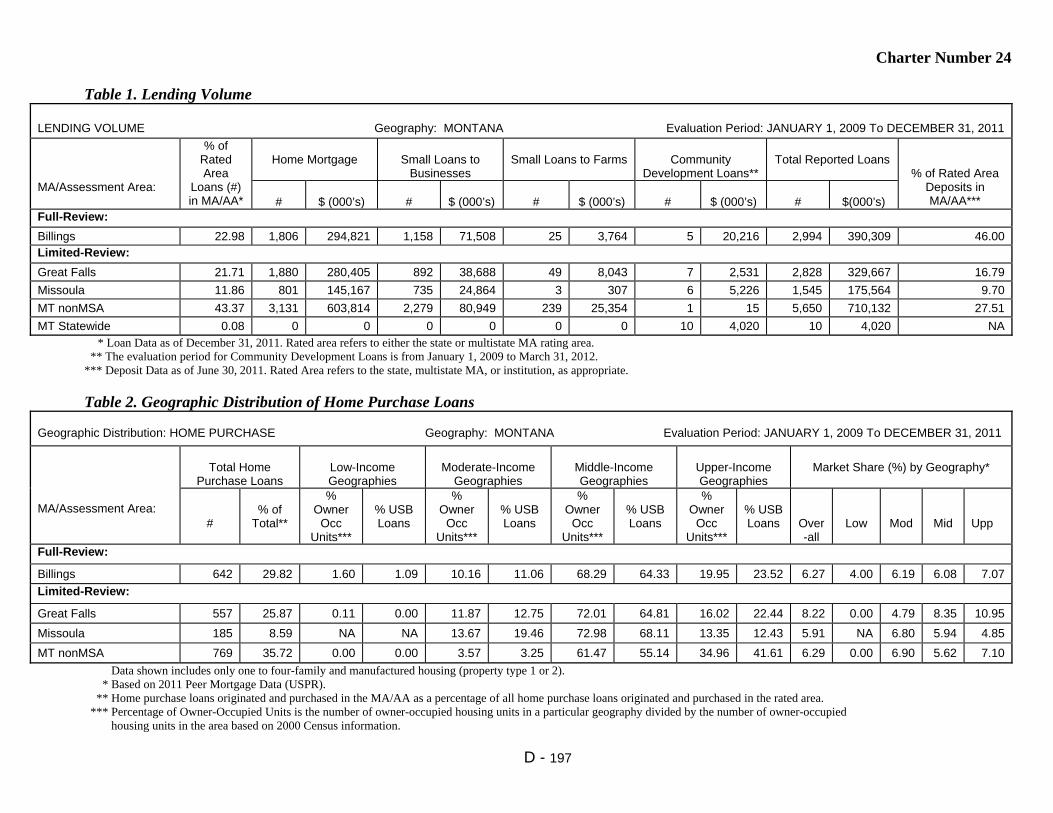
Charter Number 24
D - 197
Table 1. Lending Volume
LENDING VOLUME Geography: MONTANA Evaluation Period: JANUARY 1, 2009 To DECEMBER 31, 2011
MA/Assessment Area:
% of Rated Area
Loans (#) in MA/AA*
Home Mortgage
Small Loans to
Businesses
Small Loans to Farms
Community
Development Loans**
Total Reported Loans
% of Rated Area Deposits in MA/AA***
#
$ (000’s)
#
$ (000’s)
#
$ (000’s)
#
$ (000’s)
#
$(000’s)
Full-Review:
Billings 22.98 1,806 294,821 1,158 71,508 25 3,764 5 20,216 2,994 390,309 46.00 Limited-Review:
Great Falls 21.71 1,880 280,405 892 38,688 49 8,043 7 2,531 2,828 329,667 16.79
Missoula 11.86 801 145,167 735 24,864 3 307 6 5,226 1,545 175,564 9.70
MT nonMSA 43.37 3,131 603,814 2,279 80,949 239 25,354 1 15 5,650 710,132 27.51
MT Statewide 0.08 0 0 0 0 0 0 10 4,020 10 4,020 NA * Loan Data as of December 31, 2011. Rated area refers to either the state or multistate MA rating area. ** The evaluation period for Community Development Loans is from January 1, 2009 to March 31, 2012. *** Deposit Data as of June 30, 2011. Rated Area refers to the state, multistate MA, or institution, as appropriate. Table 2. Geographic Distribution of Home Purchase Loans
Geographic Distribution: HOME PURCHASE Geography: MONTANA Evaluation Period: JANUARY 1, 2009 To DECEMBER 31, 2011
MA/Assessment Area:
Total Home
Purchase Loans
Low-Income Geographies
Moderate-Income
Geographies
Middle-Income Geographies
Upper-Income Geographies
Market Share (%) by Geography*
#
% of
Total**
% Owner
Occ Units***
% USB Loans
% Owner
Occ Units***
% USB Loans
% Owner
Occ Units***
% USB Loans
% Owner
Occ Units***
% USB Loans
Over-all
Low
Mod
Mid
Upp
Full-Review:
Billings 642 29.82 1.60 1.09 10.16 11.06 68.29 64.33 19.95 23.52 6.27 4.00 6.19 6.08 7.07
Limited-Review:
Great Falls 557 25.87 0.11 0.00 11.87 12.75 72.01 64.81 16.02 22.44 8.22 0.00 4.79 8.35 10.95
Missoula 185 8.59 NA NA 13.67 19.46 72.98 68.11 13.35 12.43 5.91 NA 6.80 5.94 4.85
MT nonMSA 769 35.72 0.00 0.00 3.57 3.25 61.47 55.14 34.96 41.61 6.29 0.00 6.90 5.62 7.10
Data shown includes only one to four-family and manufactured housing (property type 1 or 2). * Based on 2011 Peer Mortgage Data (USPR). ** Home purchase loans originated and purchased in the MA/AA as a percentage of all home purchase loans originated and purchased in the rated area. *** Percentage of Owner-Occupied Units is the number of owner-occupied housing units in a particular geography divided by the number of owner-occupied housing units in the area based on 2000 Census information.
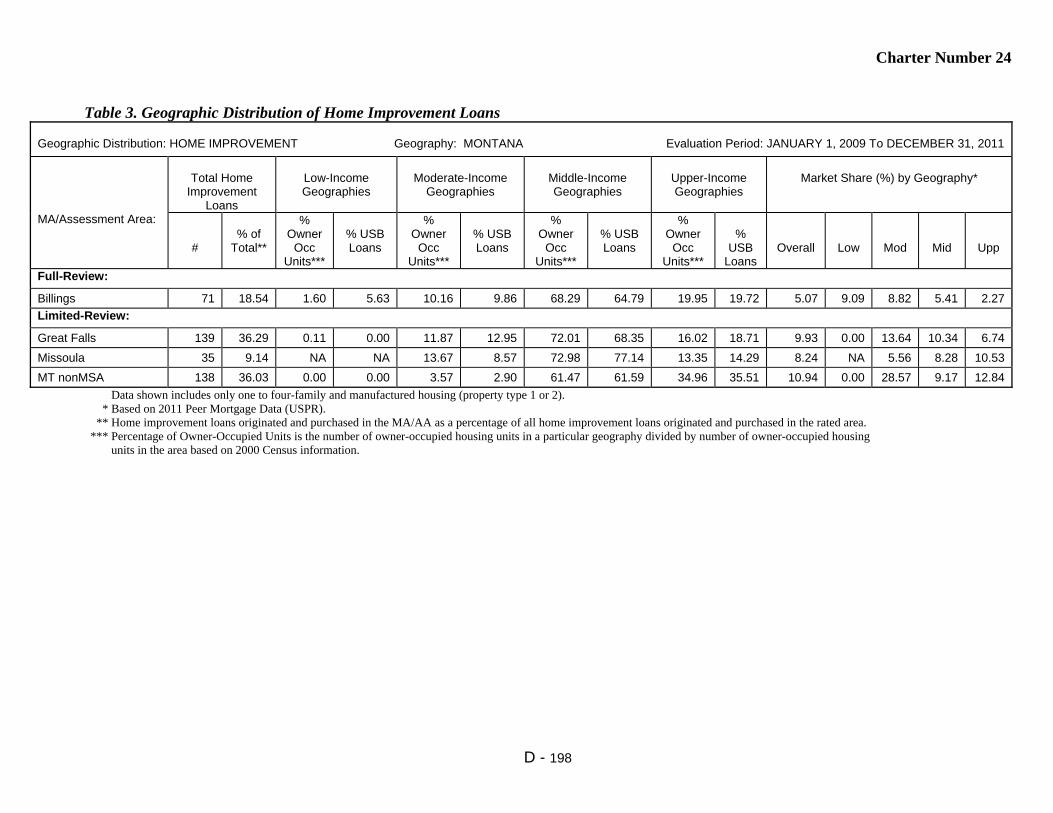
Charter Number 24
D - 198
Table 3. Geographic Distribution of Home Improvement Loans
Geographic Distribution: HOME IMPROVEMENT Geography: MONTANA Evaluation Period: JANUARY 1, 2009 To DECEMBER 31, 2011
MA/Assessment Area:
Total Home
Improvement Loans
Low-Income Geographies
Moderate-Income
Geographies
Middle-Income Geographies
Upper-Income Geographies
Market Share (%) by Geography*
#
% of
Total**
% Owner
Occ Units***
% USB Loans
% Owner
Occ Units***
% USB Loans
% Owner
Occ Units***
% USB Loans
% Owner
Occ Units***
%
USB Loans
Overall
Low
Mod
Mid
Upp
Full-Review:
Billings 71 18.54 1.60 5.63 10.16 9.86 68.29 64.79 19.95 19.72 5.07 9.09 8.82 5.41 2.27
Limited-Review:
Great Falls 139 36.29 0.11 0.00 11.87 12.95 72.01 68.35 16.02 18.71 9.93 0.00 13.64 10.34 6.74
Missoula 35 9.14 NA NA 13.67 8.57 72.98 77.14 13.35 14.29 8.24 NA 5.56 8.28 10.53
MT nonMSA 138 36.03 0.00 0.00 3.57 2.90 61.47 61.59 34.96 35.51 10.94 0.00 28.57 9.17 12.84
Data shown includes only one to four-family and manufactured housing (property type 1 or 2). * Based on 2011 Peer Mortgage Data (USPR). ** Home improvement loans originated and purchased in the MA/AA as a percentage of all home improvement loans originated and purchased in the rated area. *** Percentage of Owner-Occupied Units is the number of owner-occupied housing units in a particular geography divided by number of owner-occupied housing units in the area based on 2000 Census information.

Charter Number 24
D - 199
Table 4. Geographic Distribution of Home Mortgage Refinance Loans
Geographic Distribution: HOME MORTGAGE REFINANCE Geography: MONTANA Evaluation Period: JANUARY 1, 2009 To DECEMBER 31, 2011
MA/Assessment Area:
Total Home Mortgage Refinance
Loans
Low-Income Geographies
Moderate-Income Geographies
Middle-Income Geographies
Upper-Income Geographies
Market Share (%) by Geography*
#
% of
Total**
% Owner
Occ Units***
% USB Loans
% Owner
Occ Units***
% USB Loans
% Owner
Occ Units***
% USB Loans
% Owner
Occ Units***
%
USB Loans
Overall
Low
Mod
Mid
Upp
Full-Review:
Billings 1,090 21.49 1.60 0.83 10.16 7.80 68.29 65.23 19.95 26.15 7.67 11.63 9.96 6.92 9.05
Limited-Review:
Great Falls 1,182 23.30 0.11 0.00 11.87 10.15 72.01 68.10 16.02 21.74 14.61 0.00 23.17 13.61 14.75
Missoula 577 11.37 NA NA 13.67 8.84 72.98 73.14 13.35 18.02 7.38 NA 5.99 7.46 8.27
MT nonMSA 2,224 43.84 0.00 0.00 3.57 2.34 61.47 55.80 34.96 41.86 7.89 0.00 11.18 7.29 8.51
Data shown includes only one to four-family and manufactured housing (property type 1 or 2). * Based on 2011 Peer Mortgage Data (USPR). ** Home mortgage refinance loans originated and purchased in the MA/AA as a percentage of all home mortgage refinance loans originated and purchased in the rated area. *** Percentage of Owner-Occupied Units is the number of owner-occupied housing units in a particular geography divided by number of owner-occupied housing units in the area based on 2000 Census information.
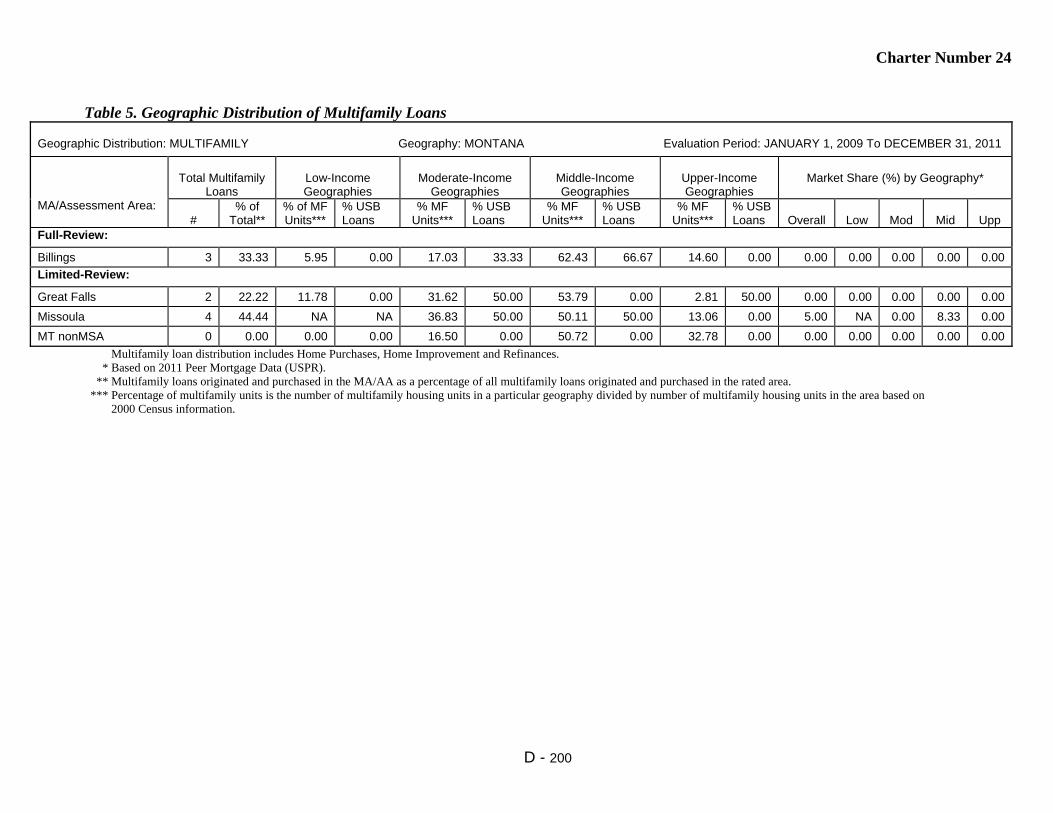
Charter Number 24
D - 200
Table 5. Geographic Distribution of Multifamily Loans
Geographic Distribution: MULTIFAMILY Geography: MONTANA Evaluation Period: JANUARY 1, 2009 To DECEMBER 31, 2011
MA/Assessment Area:
Total Multifamily
Loans
Low-Income Geographies
Moderate-Income
Geographies
Middle-Income Geographies
Upper-Income Geographies
Market Share (%) by Geography*
#
% of Total**
% of MF Units***
% USB Loans
% MF Units***
% USB Loans
% MF Units***
% USB Loans
% MF Units***
% USB Loans
Overall
Low
Mod
Mid
Upp
Full-Review:
Billings 3 33.33 5.95 0.00 17.03 33.33 62.43 66.67 14.60 0.00 0.00 0.00 0.00 0.00 0.00
Limited-Review:
Great Falls 2 22.22 11.78 0.00 31.62 50.00 53.79 0.00 2.81 50.00 0.00 0.00 0.00 0.00 0.00
Missoula 4 44.44 NA NA 36.83 50.00 50.11 50.00 13.06 0.00 5.00 NA 0.00 8.33 0.00
MT nonMSA 0 0.00 0.00 0.00 16.50 0.00 50.72 0.00 32.78 0.00 0.00 0.00 0.00 0.00 0.00
Multifamily loan distribution includes Home Purchases, Home Improvement and Refinances. * Based on 2011 Peer Mortgage Data (USPR). ** Multifamily loans originated and purchased in the MA/AA as a percentage of all multifamily loans originated and purchased in the rated area. *** Percentage of multifamily units is the number of multifamily housing units in a particular geography divided by number of multifamily housing units in the area based on 2000 Census information.

Charter Number 24
D - 201
Table 6. Geographic Distribution of Small Loans to Businesses
Geographic Distribution: SMALL LOANS TO BUSINESSES Geography: MONTANA Evaluation Period: JANUARY 1, 2009 To DECEMBER 31, 2011
MA/Assessment Area:
Total Small Business Loans
Low-Income Geographies
Moderate-Income
Geographies
Middle-Income Geographies
Upper-Income Geographies
Market Share (%) by Geography*
#
% of Total
**
% of
Businesses ***
%
USB Loans
% of
Businesses***
%
USB Loans
% of
Businesses ***
%
USB Loans
% of
Businesses ***
%
USB Loans
Overall
Low
Mod
Mid
Upp
Full-Review:
Billings 1,158 22.87 3.09 3.63 10.83 10.28 70.74 70.21 15.34 15.89 12.98 21.15 9.04 13.23 12.71
Limited-Review:
Great Falls 892 17.61 8.24 8.18 17.25 23.09 61.58 55.49 12.94 13.23 22.79 28.45 24.27 21.30 21.46
Missoula 735 14.51 NA NA 30.86 35.10 60.64 54.29 8.50 10.61 9.92 NA 9.71 9.34 12.16
MT nonMSA 2,279 45.00 0.00 0.00 4.95 7.81 58.08 54.59 36.97 37.60 9.67 0.00 15.50 8.69 9.75
* Based on 2011 Peer Small Business Data – US and PR. ** Small loans to businesses originated and purchased in the MA/AA as a percentage of all small loans to businesses originated and purchased in the rated area. *** Source Data - Dun and Bradstreet (2011).
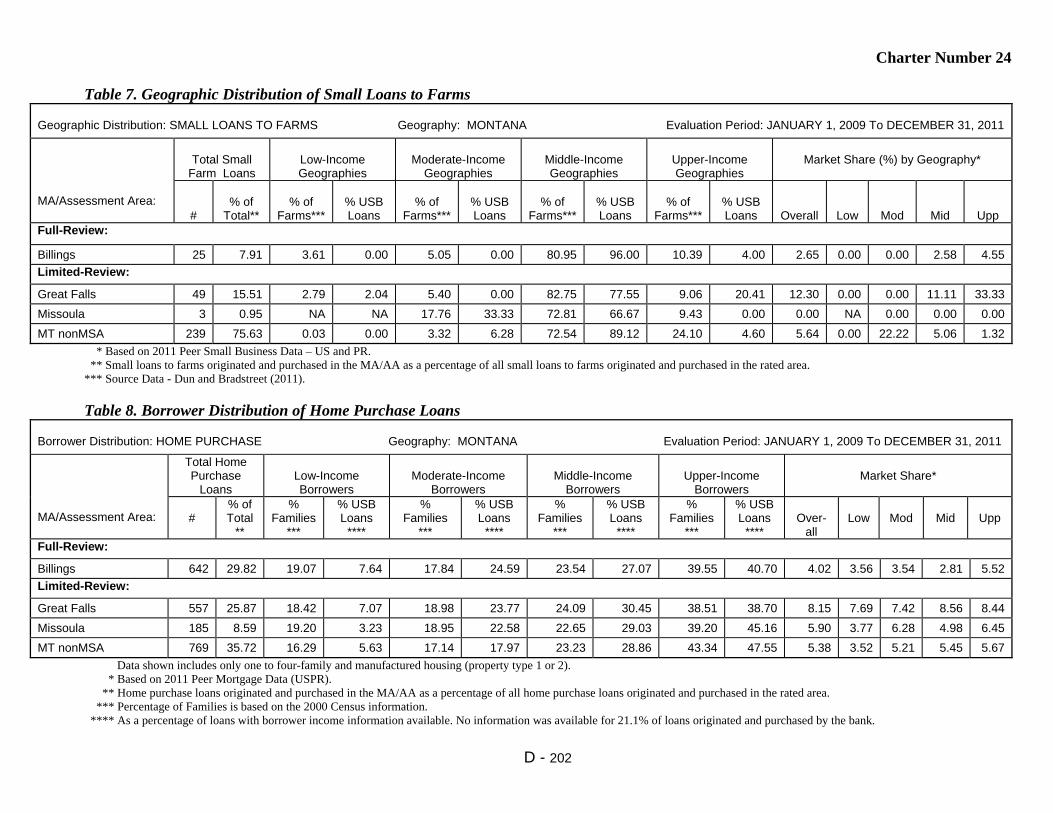
Charter Number 24
D - 202
Table 7. Geographic Distribution of Small Loans to Farms
Geographic Distribution: SMALL LOANS TO FARMS Geography: MONTANA Evaluation Period: JANUARY 1, 2009 To DECEMBER 31, 2011
MA/Assessment Area:
Total Small
Farm Loans
Low-Income Geographies
Moderate-Income
Geographies
Middle-Income Geographies
Upper-Income Geographies
Market Share (%) by Geography*
#
% of
Total**
% of
Farms***
% USB Loans
% of
Farms***
% USB Loans
% of
Farms***
% USB Loans
% of
Farms***
% USB Loans
Overall
Low
Mod
Mid
Upp
Full-Review:
Billings 25 7.91 3.61 0.00 5.05 0.00 80.95 96.00 10.39 4.00 2.65 0.00 0.00 2.58 4.55
Limited-Review:
Great Falls 49 15.51 2.79 2.04 5.40 0.00 82.75 77.55 9.06 20.41 12.30 0.00 0.00 11.11 33.33
Missoula 3 0.95 NA NA 17.76 33.33 72.81 66.67 9.43 0.00 0.00 NA 0.00 0.00 0.00
MT nonMSA 239 75.63 0.03 0.00 3.32 6.28 72.54 89.12 24.10 4.60 5.64 0.00 22.22 5.06 1.32
* Based on 2011 Peer Small Business Data – US and PR. ** Small loans to farms originated and purchased in the MA/AA as a percentage of all small loans to farms originated and purchased in the rated area. *** Source Data - Dun and Bradstreet (2011). Table 8. Borrower Distribution of Home Purchase Loans
Borrower Distribution: HOME PURCHASE Geography: MONTANA Evaluation Period: JANUARY 1, 2009 To DECEMBER 31, 2011
MA/Assessment Area:
Total Home Purchase
Loans
Low-Income Borrowers
Moderate-Income
Borrowers
Middle-Income
Borrowers
Upper-Income
Borrowers
Market Share*
#
% of Total
**
% Families
***
% USB Loans
****
% Families
***
% USB Loans
****
% Families
***
% USB Loans
****
% Families
***
% USB Loans
****
Over-
all
Low
Mod
Mid
Upp
Full-Review:
Billings 642 29.82 19.07 7.64 17.84 24.59 23.54 27.07 39.55 40.70 4.02 3.56 3.54 2.81 5.52
Limited-Review:
Great Falls 557 25.87 18.42 7.07 18.98 23.77 24.09 30.45 38.51 38.70 8.15 7.69 7.42 8.56 8.44
Missoula 185 8.59 19.20 3.23 18.95 22.58 22.65 29.03 39.20 45.16 5.90 3.77 6.28 4.98 6.45
MT nonMSA 769 35.72 16.29 5.63 17.14 17.97 23.23 28.86 43.34 47.55 5.38 3.52 5.21 5.45 5.67
Data shown includes only one to four-family and manufactured housing (property type 1 or 2). * Based on 2011 Peer Mortgage Data (USPR). ** Home purchase loans originated and purchased in the MA/AA as a percentage of all home purchase loans originated and purchased in the rated area. *** Percentage of Families is based on the 2000 Census information. **** As a percentage of loans with borrower income information available. No information was available for 21.1% of loans originated and purchased by the bank.
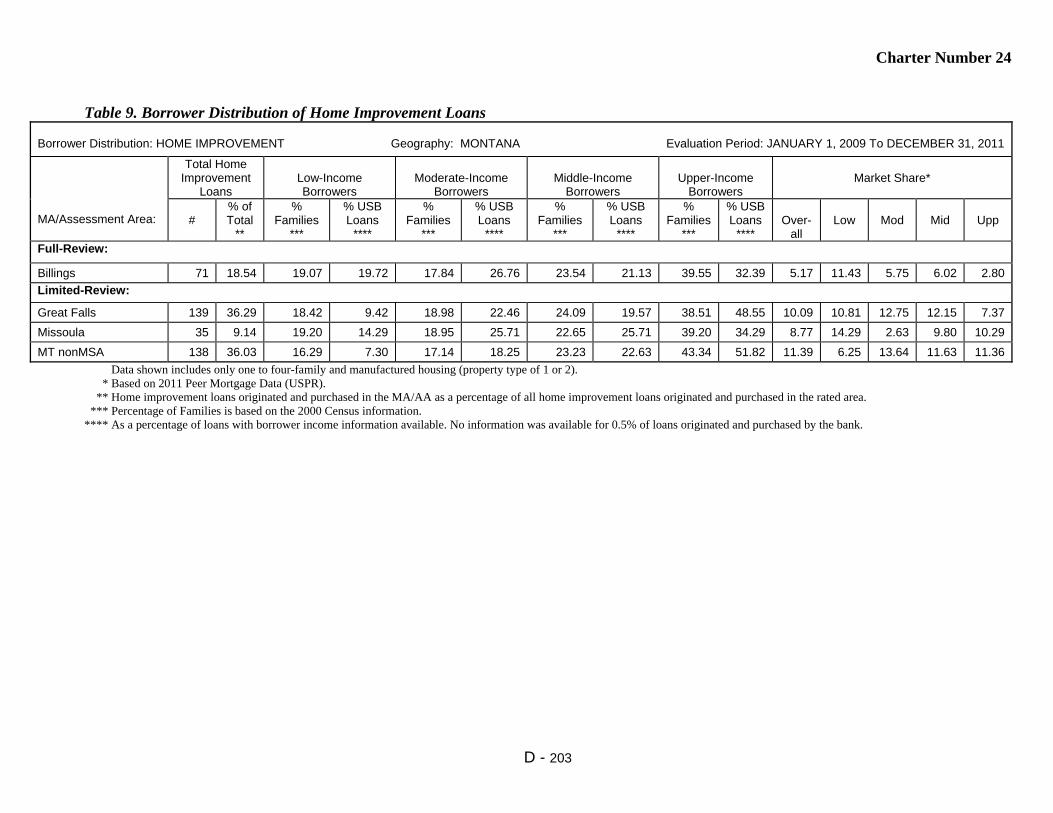
Charter Number 24
D - 203
Table 9. Borrower Distribution of Home Improvement Loans
Borrower Distribution: HOME IMPROVEMENT Geography: MONTANA Evaluation Period: JANUARY 1, 2009 To DECEMBER 31, 2011
MA/Assessment Area:
Total Home Improvement
Loans
Low-Income Borrowers
Moderate-Income
Borrowers
Middle-Income
Borrowers
Upper-Income
Borrowers
Market Share*
#
% of Total
**
% Families
***
% USB Loans
****
% Families
***
% USB Loans
****
% Families
***
% USB Loans
****
% Families
***
% USB Loans
****
Over-
all
Low
Mod
Mid
Upp
Full-Review:
Billings 71 18.54 19.07 19.72 17.84 26.76 23.54 21.13 39.55 32.39 5.17 11.43 5.75 6.02 2.80
Limited-Review:
Great Falls 139 36.29 18.42 9.42 18.98 22.46 24.09 19.57 38.51 48.55 10.09 10.81 12.75 12.15 7.37
Missoula 35 9.14 19.20 14.29 18.95 25.71 22.65 25.71 39.20 34.29 8.77 14.29 2.63 9.80 10.29
MT nonMSA 138 36.03 16.29 7.30 17.14 18.25 23.23 22.63 43.34 51.82 11.39 6.25 13.64 11.63 11.36
Data shown includes only one to four-family and manufactured housing (property type of 1 or 2). * Based on 2011 Peer Mortgage Data (USPR). ** Home improvement loans originated and purchased in the MA/AA as a percentage of all home improvement loans originated and purchased in the rated area. *** Percentage of Families is based on the 2000 Census information. **** As a percentage of loans with borrower income information available. No information was available for 0.5% of loans originated and purchased by the bank.

Charter Number 24
D - 204
Table 10. Borrower Distribution of Home Mortgage Refinance Loans
Borrower Distribution: HOME MORTGAGE REFINANCE Geography: MONTANA Evaluation Period: JANUARY 1, 2009 To DECEMBER 31, 2011
MA/Assessment Area:
Total Home Mortgage Refinance
Loans
Low-Income Borrowers
Moderate-Income Borrowers
Middle-Income Borrowers
Upper-Income Borrowers
Market Share*
#
% of Total
**
% Families
***
% USB Loans
****
% Families
***
% USB Loans
****
% Families
***
% USB Loans
****
% Families
***
% USB
Loans ****
Over-
all
Low
Mod
Mid
Upp
Full-Review:
Billings 1,090 21.49 19.07 5.81 17.84 17.80 23.54 27.90 39.55 48.48 6.71 6.10 7.60 5.72 7.02
Limited-Review:
Great Falls 1,182 23.30 18.42 5.14 18.98 18.11 24.09 24.01 38.51 52.73 15.21 13.19 20.60 12.33 15.21
Missoula 577 11.37 19.20 5.98 18.95 16.93 22.65 29.28 39.20 47.81 7.44 13.56 7.24 7.68 6.75
MT nonMSA 2,224 43.84 16.29 4.90 17.14 13.34 23.23 25.83 43.34 55.93 7.99 8.73 7.50 8.25 7.94
Data shown includes only one to four-family and manufactured housing (property type 1 or 2). * Based on 2011 Peer Mortgage Data (USPR). ** Home refinance loans originated and purchased in the MA/AA as a percentage of all home refinance loans originated and purchased in the rated area. *** Percentage of Families is based on the 2000 Census information. **** As a percentage of loans with borrower income information available. No information was available for 21.5% of loans originated and purchased by the bank.
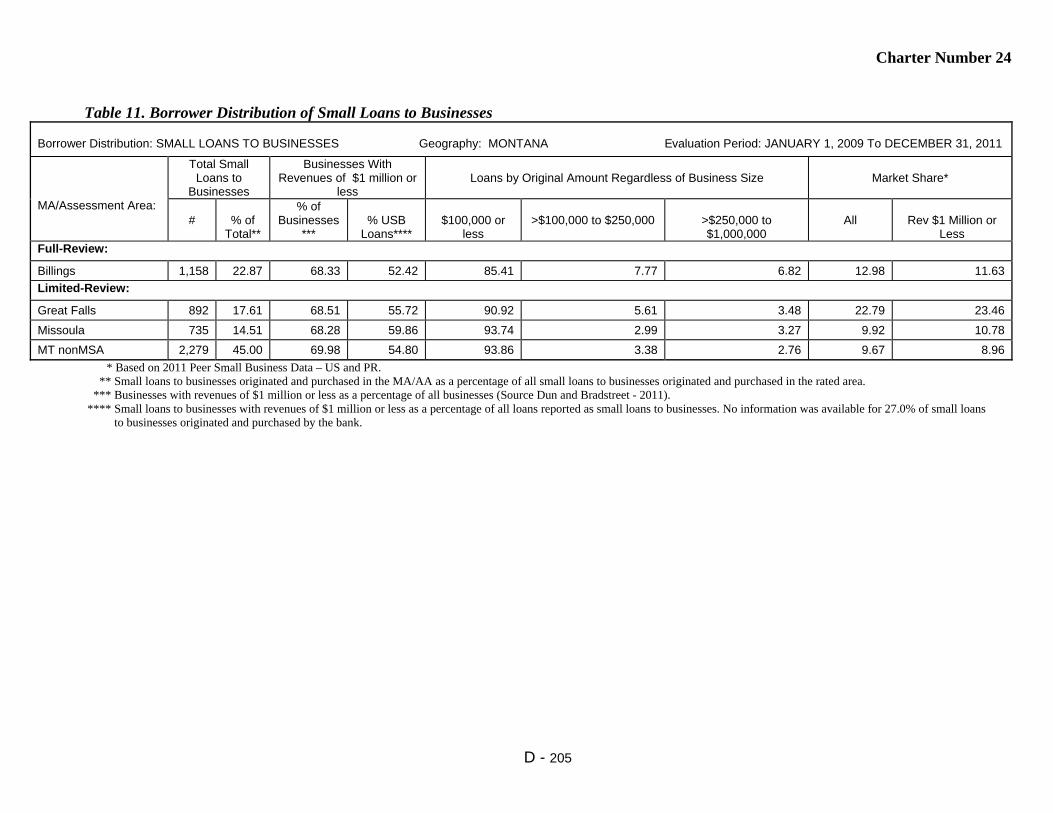
Charter Number 24
D - 205
Table 11. Borrower Distribution of Small Loans to Businesses
Borrower Distribution: SMALL LOANS TO BUSINESSES Geography: MONTANA Evaluation Period: JANUARY 1, 2009 To DECEMBER 31, 2011
MA/Assessment Area:
Total Small Loans to
Businesses
Businesses With Revenues of $1 million or
less
Loans by Original Amount Regardless of Business Size
Market Share*
#
% of
Total**
% of Businesses
***
% USB
Loans****
$100,000 or
less
>$100,000 to $250,000
>$250,000 to $1,000,000
All
Rev $1 Million or
Less Full-Review:
Billings 1,158 22.87 68.33 52.42 85.41 7.77 6.82 12.98 11.63
Limited-Review:
Great Falls 892 17.61 68.51 55.72 90.92 5.61 3.48 22.79 23.46
Missoula 735 14.51 68.28 59.86 93.74 2.99 3.27 9.92 10.78
MT nonMSA 2,279 45.00 69.98 54.80 93.86 3.38 2.76 9.67 8.96
* Based on 2011 Peer Small Business Data – US and PR. ** Small loans to businesses originated and purchased in the MA/AA as a percentage of all small loans to businesses originated and purchased in the rated area. *** Businesses with revenues of $1 million or less as a percentage of all businesses (Source Dun and Bradstreet - 2011). **** Small loans to businesses with revenues of $1 million or less as a percentage of all loans reported as small loans to businesses. No information was available for 27.0% of small loans to businesses originated and purchased by the bank.

Charter Number 24
D - 206
Table 12. Borrower Distribution of Small Loans to Farms
Borrower Distribution: SMALL LOANS TO FARMS Geography: MONTANA Evaluation Period: JANUARY 1, 2009 To DECEMBER 31, 2011
MA/Assessment Area:
Total Small Loans to Farms
Farms With Revenues of $1 million or less
Loans by Original Amount Regardless of Farm Size
Market Share*
#
% of
Total**
% of
Farms***
% USB
Loans****
$100,000 or
less
>$100,000 to $250,000
>$250,000 to $500,000
All
Rev $1 Million or
Less Full-Review:
Billings 25 7.91 97.84 92.00 48.00 28.00 24.00 2.65 2.78
Limited-Review:
Great Falls 49 15.51 97.56 87.76 48.98 30.61 20.41 12.30 11.22
Missoula 3 0.95 98.46 100.00 66.67 33.33 0.00 0.00 0.00
MT nonMSA 239 75.63 98.57 89.96 66.95 22.59 10.46 5.64 5.58
* Based on 2011 Peer Small Business Data – US and PR. ** Small loans to farms originated and purchased in the MA/AA as a percentage of all small loans to farms originated and purchased in the rated area. *** Farms with revenues of $1 million or less as a percentage of all farms (Source Dun and Bradstreet - 2011). **** Small loans to farms with revenues of $1 million or less as a percentage of all loans reported as small loans to farms. No information was available for 6.7% of small loans to farms originated and purchased by the bank.
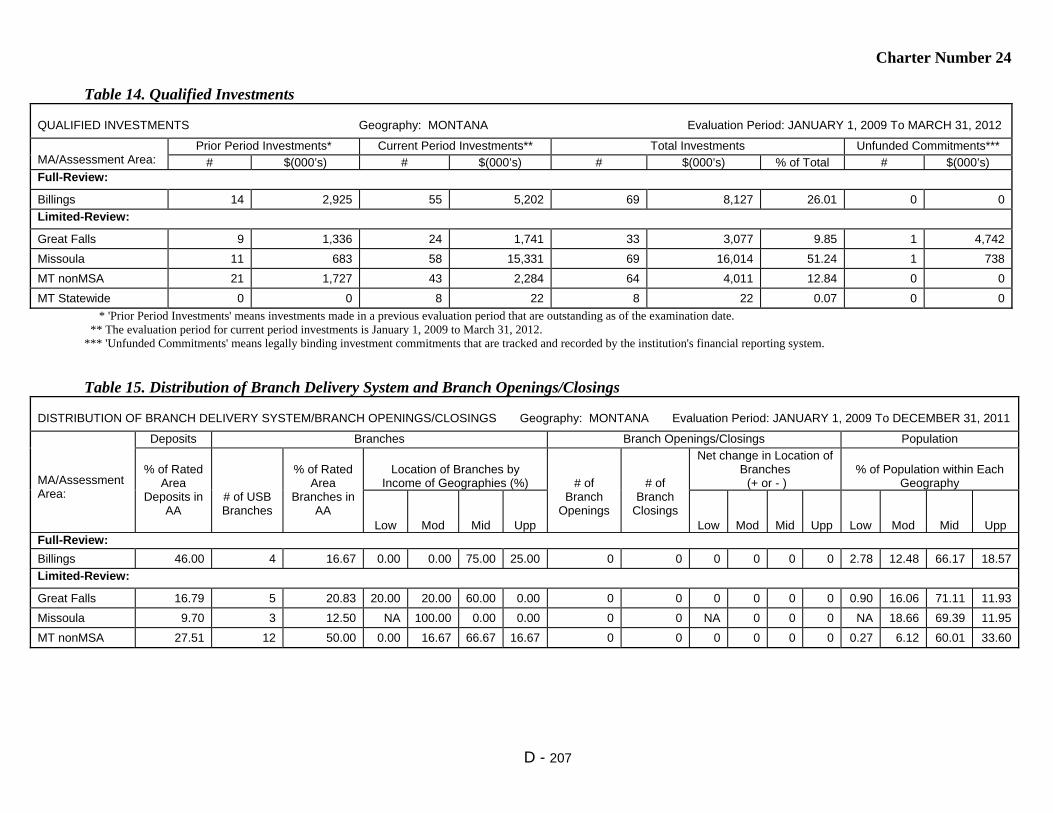
Charter Number 24
D - 207
Table 14. Qualified Investments
QUALIFIED INVESTMENTS Geography: MONTANA Evaluation Period: JANUARY 1, 2009 To MARCH 31, 2012
MA/Assessment Area:
Prior Period Investments* Current Period Investments** Total Investments Unfunded Commitments***
# $(000’s) # $(000’s) # $(000’s) % of Total # $(000’s) Full-Review:
Billings 14 2,925 55 5,202 69 8,127 26.01 0 0
Limited-Review:
Great Falls 9 1,336 24 1,741 33 3,077 9.85 1 4,742
Missoula 11 683 58 15,331 69 16,014 51.24 1 738
MT nonMSA 21 1,727 43 2,284 64 4,011 12.84 0 0
MT Statewide 0 0 8 22 8 22 0.07 0 0
* 'Prior Period Investments' means investments made in a previous evaluation period that are outstanding as of the examination date. ** The evaluation period for current period investments is January 1, 2009 to March 31, 2012. *** 'Unfunded Commitments' means legally binding investment commitments that are tracked and recorded by the institution's financial reporting system.
Table 15. Distribution of Branch Delivery System and Branch Openings/Closings DISTRIBUTION OF BRANCH DELIVERY SYSTEM/BRANCH OPENINGS/CLOSINGS Geography: MONTANA Evaluation Period: JANUARY 1, 2009 To DECEMBER 31, 2011
MA/Assessment Area:
Deposits Branches Branch Openings/Closings Population
% of Rated
Area Deposits in
AA
# of USB Branches
% of Rated
Area Branches in
AA
Location of Branches by
Income of Geographies (%)
# of Branch
Openings
# of Branch
Closings
Net change in Location of Branches (+ or - )
% of Population within Each
Geography
Low
Mod
Mid
Upp
Low
Mod
Mid
Upp
Low
Mod
Mid
Upp
Full-Review:
Billings 46.00 4 16.67 0.00 0.00 75.00 25.00 0 0 0 0 0 0 2.78 12.48 66.17 18.57
Limited-Review:
Great Falls 16.79 5 20.83 20.00 20.00 60.00 0.00 0 0 0 0 0 0 0.90 16.06 71.11 11.93
Missoula 9.70 3 12.50 NA 100.00 0.00 0.00 0 0 NA 0 0 0 NA 18.66 69.39 11.95
MT nonMSA 27.51 12 50.00 0.00 16.67 66.67 16.67 0 0 0 0 0 0 0.27 6.12 60.01 33.60

Charter Number 24
D - 208
Table 1. Lending Volume
LENDING VOLUME Geography: NEBRASKA Evaluation Period: JANUARY 1, 2009 To DECEMBER 31, 2011
MA/Assessment Area:
% of Rated Area
Loans (#) in MA/AA*
Home Mortgage
Small Loans to
Businesses
Small Loans to Farms
Community
Development Loans**
Total Reported Loans
% of Rated Area Deposits in MA/AA***
#
$ (000’s)
#
$ (000’s)
#
$ (000’s)
#
$ (000’s)
#
$(000’s)
Full-Review:
Lincoln 50.02 2,669 320,344 2,013 67,914 7 665 11 20,488 4,700 409,411 62.64 Limited-Review:
NE nonMSA 49.98 2,459 247,322 2,015 57,355 219 24,316 4 552 4,697 329,545 37.36
NE Statewide 0.00 0 0 0 0 0 0 0 0 0 0 NA * Loan Data as of December 31, 2011. Rated area refers to either the state or multistate MA rating area. ** The evaluation period for Community Development Loans is from January 1, 2009 to March 31, 2012. *** Deposit Data as of June 30, 2011. Rated Area refers to the state, multistate MA, or institution, as appropriate.
Table 2. Geographic Distribution of Home Purchase Loans Geographic Distribution: HOME PURCHASE Geography: NEBRASKA Evaluation Period: JANUARY 1, 2009 To DECEMBER 31, 2011
MA/Assessment Area:
Total Home
Purchase Loans
Low-Income Geographies
Moderate-Income
Geographies
Middle-Income Geographies
Upper-Income Geographies
Market Share (%) by Geography*
#
% of
Total**
% Owner Occ
Units***
% USB Loans
% Owner Occ
Units***
% USB Loans
% Owner Occ
Units***
% USB Loans
%Owner Occ
Units***
% USB Loans
Over-
all
Low
Mod
Mid
Upp
Full-Review:
Lincoln 1,305 50.41 0.63 1.15 13.30 17.01 55.94 62.22 30.13 19.46 9.70 25.00 14.81 12.02 4.80
Limited-Review:
NE nonMSA 1,284 49.59 NA NA 2.34 2.73 74.45 70.87 23.22 26.40 16.30 NA 25.37 17.13 13.94
Data shown includes only one to four-family and manufactured housing (property type 1 or 2). * Based on 2011 Peer Mortgage Data (USPR). ** Home purchase loans originated and purchased in the MA/AA as a percentage of all home purchase loans originated and purchased in the rated area. *** Percentage of Owner-Occupied Units is the number of owner-occupied housing units in a particular geography divided by the number of owner-occupied housing units in the area based on 2000 Census information.
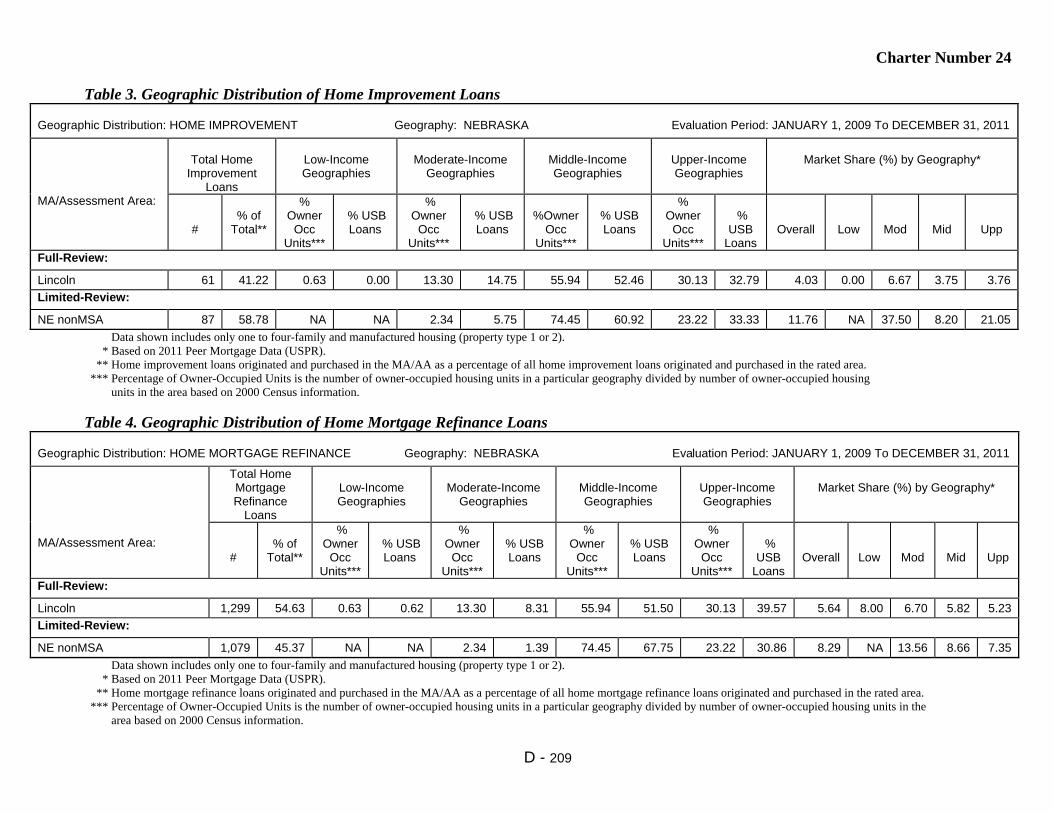
Charter Number 24
D - 209
Table 3. Geographic Distribution of Home Improvement Loans
Geographic Distribution: HOME IMPROVEMENT Geography: NEBRASKA Evaluation Period: JANUARY 1, 2009 To DECEMBER 31, 2011
MA/Assessment Area:
Total Home
Improvement Loans
Low-Income Geographies
Moderate-Income
Geographies
Middle-Income Geographies
Upper-Income Geographies
Market Share (%) by Geography*
#
% of
Total**
% Owner
Occ Units***
% USB Loans
% Owner
Occ Units***
% USB Loans
%Owner
Occ Units***
% USB Loans
% Owner
Occ Units***
%
USB Loans
Overall
Low
Mod
Mid
Upp
Full-Review:
Lincoln 61 41.22 0.63 0.00 13.30 14.75 55.94 52.46 30.13 32.79 4.03 0.00 6.67 3.75 3.76
Limited-Review:
NE nonMSA 87 58.78 NA NA 2.34 5.75 74.45 60.92 23.22 33.33 11.76 NA 37.50 8.20 21.05
Data shown includes only one to four-family and manufactured housing (property type 1 or 2). * Based on 2011 Peer Mortgage Data (USPR). ** Home improvement loans originated and purchased in the MA/AA as a percentage of all home improvement loans originated and purchased in the rated area. *** Percentage of Owner-Occupied Units is the number of owner-occupied housing units in a particular geography divided by number of owner-occupied housing units in the area based on 2000 Census information.
Table 4. Geographic Distribution of Home Mortgage Refinance Loans Geographic Distribution: HOME MORTGAGE REFINANCE Geography: NEBRASKA Evaluation Period: JANUARY 1, 2009 To DECEMBER 31, 2011
MA/Assessment Area:
Total Home Mortgage Refinance
Loans
Low-Income Geographies
Moderate-Income
Geographies
Middle-Income Geographies
Upper-Income Geographies
Market Share (%) by Geography*
#
% of
Total**
% Owner
Occ Units***
% USB Loans
% Owner
Occ Units***
% USB Loans
% Owner
Occ Units***
% USB Loans
% Owner
Occ Units***
%
USB Loans
Overall
Low
Mod
Mid
Upp
Full-Review:
Lincoln 1,299 54.63 0.63 0.62 13.30 8.31 55.94 51.50 30.13 39.57 5.64 8.00 6.70 5.82 5.23
Limited-Review:
NE nonMSA 1,079 45.37 NA NA 2.34 1.39 74.45 67.75 23.22 30.86 8.29 NA 13.56 8.66 7.35
Data shown includes only one to four-family and manufactured housing (property type 1 or 2). * Based on 2011 Peer Mortgage Data (USPR). ** Home mortgage refinance loans originated and purchased in the MA/AA as a percentage of all home mortgage refinance loans originated and purchased in the rated area. *** Percentage of Owner-Occupied Units is the number of owner-occupied housing units in a particular geography divided by number of owner-occupied housing units in the area based on 2000 Census information.
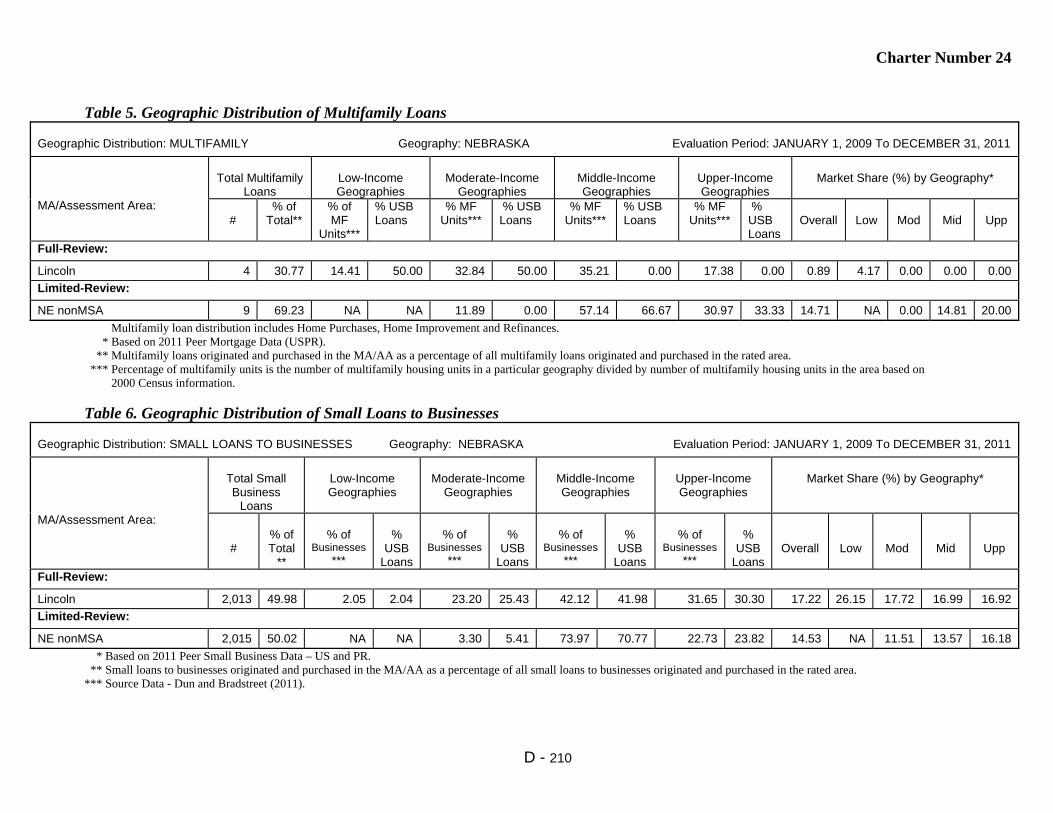
Charter Number 24
D - 210
Table 5. Geographic Distribution of Multifamily Loans
Geographic Distribution: MULTIFAMILY Geography: NEBRASKA Evaluation Period: JANUARY 1, 2009 To DECEMBER 31, 2011
MA/Assessment Area:
Total Multifamily
Loans
Low-Income Geographies
Moderate-Income
Geographies
Middle-Income Geographies
Upper-Income Geographies
Market Share (%) by Geography*
#
% of Total**
% of MF
Units***
% USB Loans
% MF Units***
% USB Loans
% MF Units***
% USB Loans
% MF Units***
% USB Loans
Overall
Low
Mod
Mid
Upp
Full-Review:
Lincoln 4 30.77 14.41 50.00 32.84 50.00 35.21 0.00 17.38 0.00 0.89 4.17 0.00 0.00 0.00
Limited-Review:
NE nonMSA 9 69.23 NA NA 11.89 0.00 57.14 66.67 30.97 33.33 14.71 NA 0.00 14.81 20.00
Multifamily loan distribution includes Home Purchases, Home Improvement and Refinances. * Based on 2011 Peer Mortgage Data (USPR). ** Multifamily loans originated and purchased in the MA/AA as a percentage of all multifamily loans originated and purchased in the rated area. *** Percentage of multifamily units is the number of multifamily housing units in a particular geography divided by number of multifamily housing units in the area based on 2000 Census information.
Table 6. Geographic Distribution of Small Loans to Businesses Geographic Distribution: SMALL LOANS TO BUSINESSES Geography: NEBRASKA Evaluation Period: JANUARY 1, 2009 To DECEMBER 31, 2011
MA/Assessment Area:
Total Small Business
Loans
Low-Income Geographies
Moderate-Income
Geographies
Middle-Income Geographies
Upper-Income Geographies
Market Share (%) by Geography*
#
% of Total
**
% of
Businesses ***
%
USB Loans
% of
Businesses ***
%
USB Loans
% of
Businesses ***
%
USB Loans
% of
Businesses ***
%
USB Loans
Overall
Low
Mod
Mid
Upp
Full-Review:
Lincoln 2,013 49.98 2.05 2.04 23.20 25.43 42.12 41.98 31.65 30.30 17.22 26.15 17.72 16.99 16.92
Limited-Review:
NE nonMSA 2,015 50.02 NA NA 3.30 5.41 73.97 70.77 22.73 23.82 14.53 NA 11.51 13.57 16.18
* Based on 2011 Peer Small Business Data – US and PR. ** Small loans to businesses originated and purchased in the MA/AA as a percentage of all small loans to businesses originated and purchased in the rated area. *** Source Data - Dun and Bradstreet (2011).

Charter Number 24
D - 211
Table 7. Geographic Distribution of Small Loans to Farms
Geographic Distribution: SMALL LOANS TO FARMS Geography: NEBRASKA Evaluation Period: JANUARY 1, 2009 To DECEMBER 31, 2011
MA/Assessment Area:
Total Small
Farm Loans
Low-Income Geographies
Moderate-Income
Geographies
Middle-Income Geographies
Upper-Income Geographies
Market Share (%) by Geography*
#
% of
Total**
% of
Farms***
% USB Loans
% of
Farms***
% USB Loans
% of
Farms***
% USB Loans
% of
Farms***
% USB Loans
Overall
Low
Mod
Mid
Upp
Full-Review:
Lincoln 7 3.10 0.16 0.00 7.15 28.57 67.56 14.29 25.06 57.14 0.92 0.00 16.67 0.00 1.89
Limited-Review:
NE nonMSA 219 96.90 NA NA 0.85 0.00 84.17 86.30 14.98 13.70 3.10 NA 0.00 3.27 2.41
* Based on 2011 Peer Small Business Data – US and PR. ** Small loans to farms originated and purchased in the MA/AA as a percentage of all small loans to farms originated and purchased in the rated area. *** Source Data - Dun and Bradstreet (2011).
Table 8. Borrower Distribution of Home Purchase Loans Borrower Distribution: HOME PURCHASE Geography: NEBRASKA Evaluation Period: JANUARY 1, 2009 To DECEMBER 31, 2011
MA/Assessment Area:
Total Home Purchase
Loans
Low-Income Borrowers
Moderate-Income
Borrowers
Middle-Income
Borrowers
Upper-Income
Borrowers
Market Share*
#
% of Total
**
% Families
***
% USB Loans
****
% Families
***
% USB Loans
****
% Families
***
% USB Loans
****
% Families
***
% USB Loans
****
Over-
all
Low
Mod
Mid
Upp
Full-Review:
Lincoln 1,305 50.41 17.18 35.23 19.02 33.03 26.09 20.55 37.71 11.19 4.88 10.27 6.02 4.14 1.88
Limited-Review:
NE nonMSA 1,284 49.59 15.43 14.44 17.71 27.20 24.38 27.20 42.47 31.17 6.47 11.91 6.63 5.25 5.90
Data shown includes only one to four-family and manufactured housing (property type 1 or 2). * Based on 2011 Peer Mortgage Data (USPR). ** Home purchase loans originated and purchased in the MA/AA as a percentage of all home purchase loans originated and purchased in the rated area. *** Percentage of Families is based on the 2000 Census information. **** As a percentage of loans with borrower income information available. No information was available for 60.5% of loans originated and purchased by the bank.
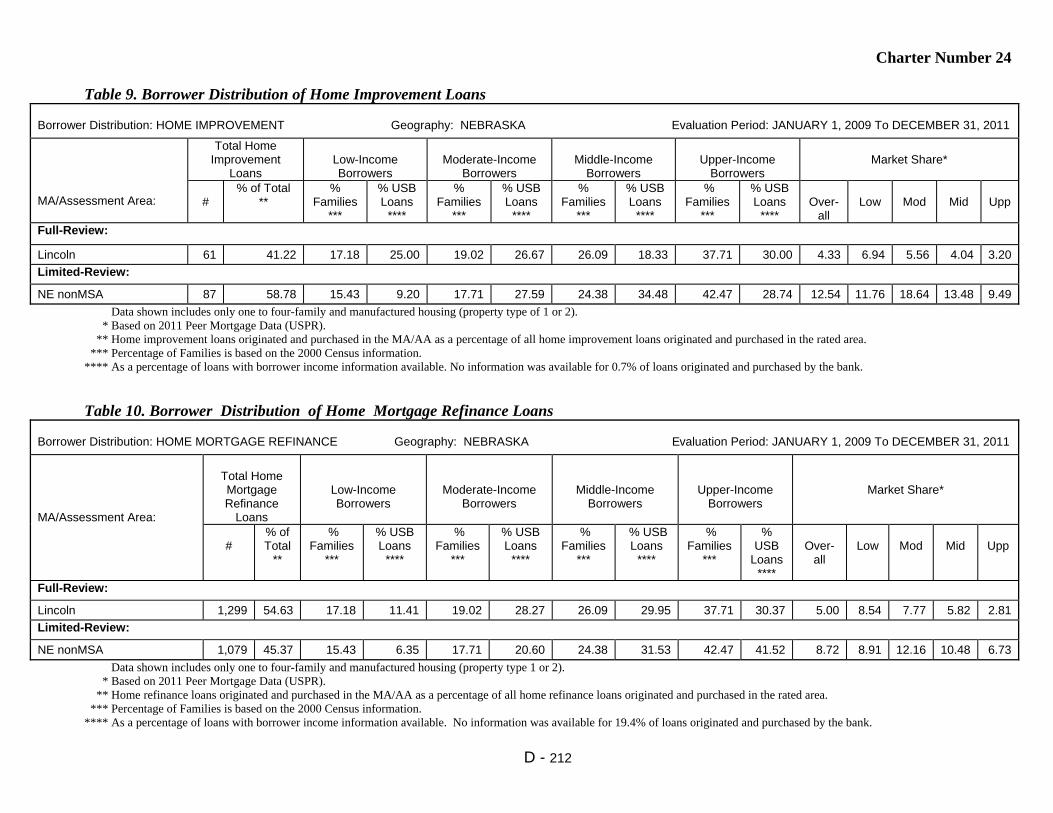
Charter Number 24
D - 212
Table 9. Borrower Distribution of Home Improvement Loans
Borrower Distribution: HOME IMPROVEMENT Geography: NEBRASKA Evaluation Period: JANUARY 1, 2009 To DECEMBER 31, 2011
MA/Assessment Area:
Total Home Improvement
Loans
Low-Income Borrowers
Moderate-Income
Borrowers
Middle-Income
Borrowers
Upper-Income
Borrowers
Market Share*
#
% of Total **
% Families
***
% USB Loans
****
% Families
***
% USB Loans
****
% Families
***
% USB Loans
****
% Families
***
% USB Loans
****
Over-
all
Low
Mod
Mid
Upp
Full-Review:
Lincoln 61 41.22 17.18 25.00 19.02 26.67 26.09 18.33 37.71 30.00 4.33 6.94 5.56 4.04 3.20
Limited-Review:
NE nonMSA 87 58.78 15.43 9.20 17.71 27.59 24.38 34.48 42.47 28.74 12.54 11.76 18.64 13.48 9.49
Data shown includes only one to four-family and manufactured housing (property type of 1 or 2). * Based on 2011 Peer Mortgage Data (USPR). ** Home improvement loans originated and purchased in the MA/AA as a percentage of all home improvement loans originated and purchased in the rated area. *** Percentage of Families is based on the 2000 Census information. **** As a percentage of loans with borrower income information available. No information was available for 0.7% of loans originated and purchased by the bank.
Table 10. Borrower Distribution of Home Mortgage Refinance Loans Borrower Distribution: HOME MORTGAGE REFINANCE Geography: NEBRASKA Evaluation Period: JANUARY 1, 2009 To DECEMBER 31, 2011
MA/Assessment Area:
Total Home Mortgage Refinance
Loans
Low-Income Borrowers
Moderate-Income Borrowers
Middle-Income Borrowers
Upper-Income Borrowers
Market Share*
#
% of Total
**
% Families
***
% USB Loans
****
% Families
***
% USB Loans
****
% Families
***
% USB Loans
****
% Families
***
% USB
Loans ****
Over-
all
Low
Mod
Mid
Upp
Full-Review:
Lincoln 1,299 54.63 17.18 11.41 19.02 28.27 26.09 29.95 37.71 30.37 5.00 8.54 7.77 5.82 2.81
Limited-Review:
NE nonMSA 1,079 45.37 15.43 6.35 17.71 20.60 24.38 31.53 42.47 41.52 8.72 8.91 12.16 10.48 6.73
Data shown includes only one to four-family and manufactured housing (property type 1 or 2). * Based on 2011 Peer Mortgage Data (USPR). ** Home refinance loans originated and purchased in the MA/AA as a percentage of all home refinance loans originated and purchased in the rated area. *** Percentage of Families is based on the 2000 Census information. **** As a percentage of loans with borrower income information available. No information was available for 19.4% of loans originated and purchased by the bank.

Charter Number 24
D - 213
Table 11. Borrower Distribution of Small Loans to Businesses
Borrower Distribution: SMALL LOANS TO BUSINESSES Geography: NEBRASKA Evaluation Period: JANUARY 1, 2009 To DECEMBER 31, 2011
MA/Assessment Area:
Total Small Loans to
Businesses
Businesses With Revenues of $1 million or
less
Loans by Original Amount Regardless of Business Size
Market Share*
#
% of
Total**
% of Businesses
***
% USB
Loans****
$100,000 or
less
>$100,000 to $250,000
>$250,000 to $1,000,000
All
Rev $1 Million or
Less Full-Review:
Lincoln 2,013 49.98 66.87 68.80 94.88 2.48 2.63 17.22 20.59
Limited-Review:
NE nonMSA 2,015 50.02 69.70 61.99 94.94 3.18 1.89 14.53 17.47
* Based on 2011 Peer Small Business Data – US and PR. ** Small loans to businesses originated and purchased in the MA/AA as a percentage of all small loans to businesses originated and purchased in the rated area. *** Businesses with revenues of $1 million or less as a percentage of all businesses (Source Dun and Bradstreet - 2011). **** Small loans to businesses with revenues of $1 million or less as a percentage of all loans reported as small loans to businesses. No information was available for 21.1% of small loans to businesses originated and purchased by the bank.
Table 12. Borrower Distribution of Small Loans to Farms Borrower Distribution: SMALL LOANS TO FARMS Geography: NEBRASKA Evaluation Period: JANUARY 1, 2009 To DECEMBER 31, 2011
MA/Assessment Area:
Total Small Loans to Farms
Farms With Revenues of $1 million or less
Loans by Original Amount Regardless of Farm Size
Market Share*
#
% of
Total**
% of
Farms***
% USB
Loans****
$100,000 or
less
>$100,000 to $250,000
>$250,000 to $500,000
All
Rev $1 Million or
Less Full-Review:
Lincoln 7 3.10 98.90 71.43 71.43 14.29 14.29 0.92 0.57
Limited-Review:
NE nonMSA 219 96.90 98.11 89.50 67.58 16.89 15.53 3.10 3.68
* Based on 2011 Peer Small Business Data – US and PR. ** Small loans to farms originated and purchased in the MA/AA as a percentage of all small loans to farms originated and purchased in the rated area. *** Farms with revenues of $1 million or less as a percentage of all farms (Source Dun and Bradstreet - 2011). **** Small loans to farms with revenues of $1 million or less as a percentage of all loans reported as small loans to farms. No information was available for 8.0% of small loans to farms originated and purchased by the bank.

Charter Number 24
D - 214
Table 14. Qualified Investments
QUALIFIED INVESTMENTS Geography: NEBRASKA Evaluation Period: JANUARY 1, 2009 To MARCH 31, 2012
MA/Assessment Area:
Prior Period Investments* Current Period Investments** Total Investments Unfunded Commitments***
# $(000’s) # $(000’s) # $(000’s) of Total # $(000’s) Full-Review:
Lincoln 32 2,487 54 5,888 86 8,374 40.50 0 0
Limited-Review:
NE nonMSA 29 10,262 119 1,406 148 11,668 56.43 0 0
NE Statewide 3 600 12 33 15 633 3.06 0 0
* 'Prior Period Investments' means investments made in a previous evaluation period that are outstanding as of the examination date. ** The evaluation period for current period investments is January 1, 2009 to March 31, 2012. *** 'Unfunded Commitments' means legally binding investment commitments that are tracked and recorded by the institution's financial reporting system.
Table 15. Distribution of Branch Delivery System and Branch Openings/Closings DISTRIBUTION OF BRANCH DELIVERY SYSTEM/BRANCH OPENINGS/CLOSINGS Geography: NEBRASKA Evaluation Period: JANUARY 1, 2009 To DECEMBER 31, 2011
MA/Assessment Area:
Deposits Branches Branch Openings/Closings Population
% of
Rated Area
Deposits in AA
# of USB
Branches
% of
Rated Area
Branches in AA
Location of Branches by
Income of Geographies (%)
# of Branch
Openings
# of Branch
Closings
Net change in Location of Branches (+ or - )
% of Population within Each
Geography
Low
Mod
Mid
Upp
Low
Mod
Mid
Upp
Low
Mod
Mid
Upp
Full-Review:
Lincoln 62.64 12 44.44 0.00 25.00 50.00 25.00 0 0 0 0 0 0 3.32 21.12 49.31 24.05
Limited-Review:
NE nonMSA 37.36 15 55.56 NA 6.67 80.00 13.33 0 1 NA 0 -1 0 NA 3.73 74.53 21.74
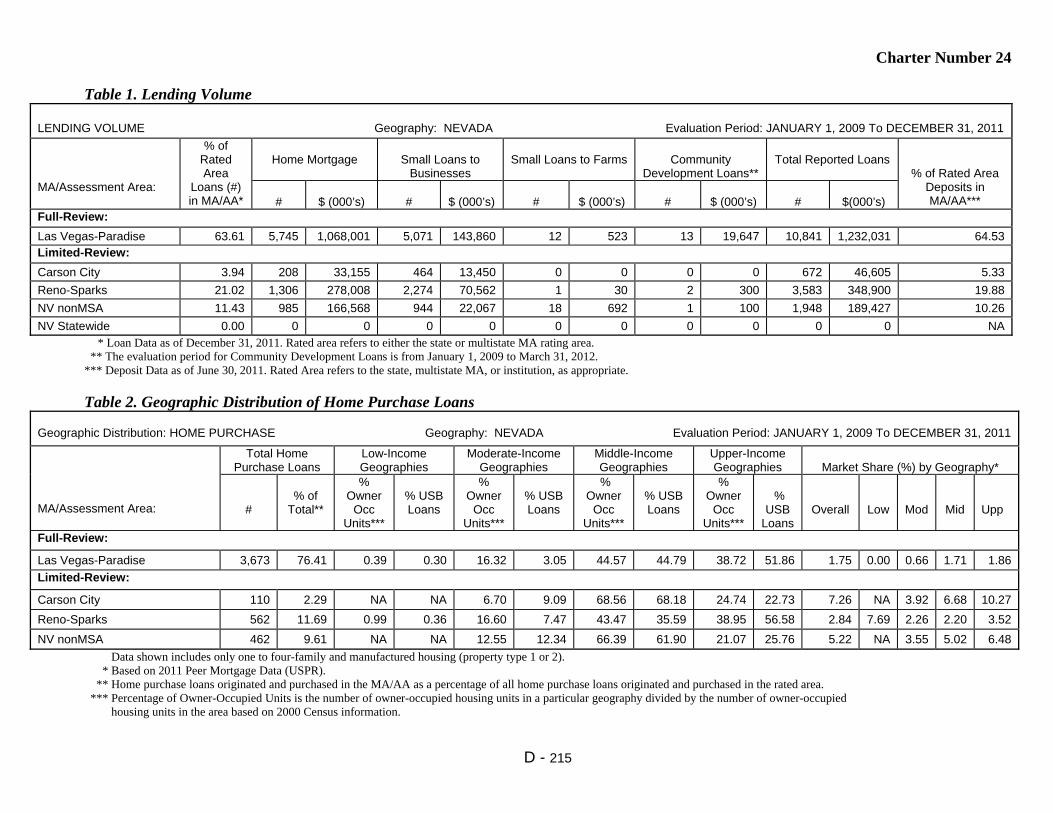
Charter Number 24
D - 215
Table 1. Lending Volume
LENDING VOLUME Geography: NEVADA Evaluation Period: JANUARY 1, 2009 To DECEMBER 31, 2011
MA/Assessment Area:
% of Rated Area
Loans (#) in MA/AA*
Home Mortgage
Small Loans to
Businesses
Small Loans to Farms
Community
Development Loans**
Total Reported Loans
% of Rated Area Deposits in MA/AA***
#
$ (000’s)
#
$ (000’s)
#
$ (000’s)
#
$ (000’s)
#
$(000’s)
Full-Review:
Las Vegas-Paradise 63.61 5,745 1,068,001 5,071 143,860 12 523 13 19,647 10,841 1,232,031 64.53 Limited-Review:
Carson City 3.94 208 33,155 464 13,450 0 0 0 0 672 46,605 5.33
Reno-Sparks 21.02 1,306 278,008 2,274 70,562 1 30 2 300 3,583 348,900 19.88
NV nonMSA 11.43 985 166,568 944 22,067 18 692 1 100 1,948 189,427 10.26
NV Statewide 0.00 0 0 0 0 0 0 0 0 0 0 NA * Loan Data as of December 31, 2011. Rated area refers to either the state or multistate MA rating area. ** The evaluation period for Community Development Loans is from January 1, 2009 to March 31, 2012. *** Deposit Data as of June 30, 2011. Rated Area refers to the state, multistate MA, or institution, as appropriate. Table 2. Geographic Distribution of Home Purchase Loans
Geographic Distribution: HOME PURCHASE Geography: NEVADA Evaluation Period: JANUARY 1, 2009 To DECEMBER 31, 2011
MA/Assessment Area:
Total Home Purchase Loans
Low-Income Geographies
Moderate-Income Geographies
Middle-Income Geographies
Upper-Income Geographies
Market Share (%) by Geography*
#
% of
Total**
% Owner
Occ Units***
% USB Loans
% Owner
Occ Units***
% USB Loans
% Owner
Occ Units***
% USB Loans
% Owner
Occ Units***
%
USB Loans
Overall
Low
Mod
Mid
Upp
Full-Review:
Las Vegas-Paradise 3,673 76.41 0.39 0.30 16.32 3.05 44.57 44.79 38.72 51.86 1.75 0.00 0.66 1.71 1.86
Limited-Review:
Carson City 110 2.29 NA NA 6.70 9.09 68.56 68.18 24.74 22.73 7.26 NA 3.92 6.68 10.27
Reno-Sparks 562 11.69 0.99 0.36 16.60 7.47 43.47 35.59 38.95 56.58 2.84 7.69 2.26 2.20 3.52
NV nonMSA 462 9.61 NA NA 12.55 12.34 66.39 61.90 21.07 25.76 5.22 NA 3.55 5.02 6.48
Data shown includes only one to four-family and manufactured housing (property type 1 or 2). * Based on 2011 Peer Mortgage Data (USPR). ** Home purchase loans originated and purchased in the MA/AA as a percentage of all home purchase loans originated and purchased in the rated area. *** Percentage of Owner-Occupied Units is the number of owner-occupied housing units in a particular geography divided by the number of owner-occupied housing units in the area based on 2000 Census information.

Charter Number 24
D - 216
Table 3. Geographic Distribution of Home Improvement Loans
Geographic Distribution: HOME IMPROVEMENT Geography: NEVADA Evaluation Period: JANUARY 1, 2009 To DECEMBER 31, 2011
MA/Assessment Area:
Total Home
Improvement Loans
Low-Income Geographies
Moderate-Income
Geographies
Middle-Income Geographies
Upper-Income Geographies
Market Share (%) by Geography*
#
% of
Total**
% Owner
Occ Units***
% USB Loans
% Owner
Occ Units***
% USB Loans
% Owner
Occ Units***
% USB Loans
% Owner
Occ Units***
%
USB Loans
Overall
Low
Mod
Mid
Upp
Full-Review:
Las Vegas-Paradise 50 40.65 0.39 0.00 16.32 8.00 44.57 40.00 38.72 52.00 6.29 0.00 3.23 6.32 6.73
Limited-Review:
Carson City 8 6.50 NA NA 6.70 12.50 68.56 87.50 24.74 0.00 14.29 NA 100.00 0.00 0.00
Reno-Sparks 28 22.76 0.99 0.00 16.60 14.29 43.47 14.29 38.95 71.43 7.33 0.00 9.09 1.96 10.34
NV nonMSA 37 30.08 NA NA 12.55 0.00 66.39 62.16 21.07 37.84 11.59 NA 0.00 15.28 8.93
Data shown includes only one to four-family and manufactured housing (property type 1 or 2). * Based on 2011 Peer Mortgage Data (USPR). ** Home improvement loans originated and purchased in the MA/AA as a percentage of all home improvement loans originated and purchased in the rated area. *** Percentage of Owner-Occupied Units is the number of owner-occupied housing units in a particular geography divided by number of owner-occupied housing units in the area based on 2000 Census information.
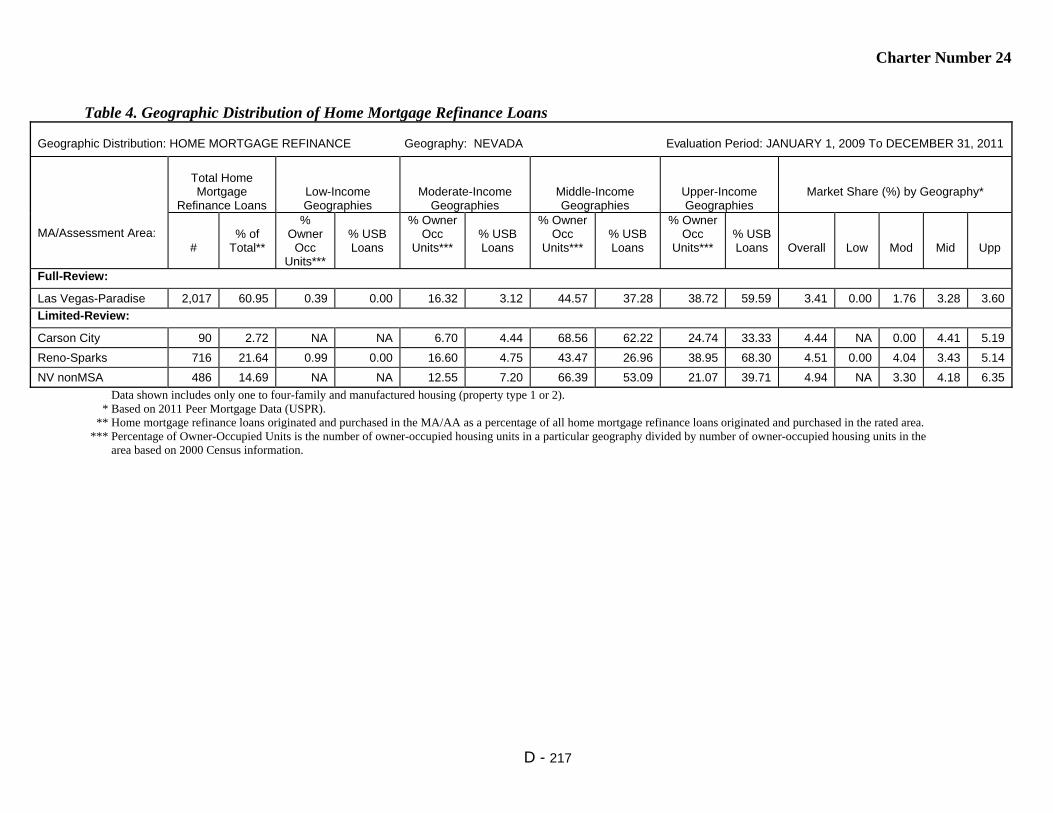
Charter Number 24
D - 217
Table 4. Geographic Distribution of Home Mortgage Refinance Loans
Geographic Distribution: HOME MORTGAGE REFINANCE Geography: NEVADA Evaluation Period: JANUARY 1, 2009 To DECEMBER 31, 2011
MA/Assessment Area:
Total Home Mortgage
Refinance Loans
Low-Income Geographies
Moderate-Income Geographies
Middle-Income Geographies
Upper-Income Geographies
Market Share (%) by Geography*
#
% of
Total**
% Owner
Occ Units***
% USB Loans
% Owner Occ
Units***
% USB Loans
% Owner Occ
Units***
% USB Loans
% Owner Occ
Units***
% USB Loans
Overall
Low
Mod
Mid
Upp
Full-Review:
Las Vegas-Paradise 2,017 60.95 0.39 0.00 16.32 3.12 44.57 37.28 38.72 59.59 3.41 0.00 1.76 3.28 3.60
Limited-Review:
Carson City 90 2.72 NA NA 6.70 4.44 68.56 62.22 24.74 33.33 4.44 NA 0.00 4.41 5.19
Reno-Sparks 716 21.64 0.99 0.00 16.60 4.75 43.47 26.96 38.95 68.30 4.51 0.00 4.04 3.43 5.14
NV nonMSA 486 14.69 NA NA 12.55 7.20 66.39 53.09 21.07 39.71 4.94 NA 3.30 4.18 6.35
Data shown includes only one to four-family and manufactured housing (property type 1 or 2). * Based on 2011 Peer Mortgage Data (USPR). ** Home mortgage refinance loans originated and purchased in the MA/AA as a percentage of all home mortgage refinance loans originated and purchased in the rated area. *** Percentage of Owner-Occupied Units is the number of owner-occupied housing units in a particular geography divided by number of owner-occupied housing units in the area based on 2000 Census information.

Charter Number 24
D - 218
Table 5. Geographic Distribution of Multifamily Loans
Geographic Distribution: MULTIFAMILY Geography: NEVADA Evaluation Period: JANUARY 1, 2009 To DECEMBER 31, 2011
MA/Assessment Area:
Total Multifamily
Loans
Low-Income Geographies
Moderate-Income
Geographies
Middle-Income Geographies
Upper-Income Geographies
Market Share (%) by Geography*
#
% of Total**
% of MF Units***
USB Loans
% MF Units***
% USB Loans
% MF Units***
% USB Loans
% MF Units***
% USB Loans
Overall
Low
Mod
Mid
Upp
Full-Review:
Las Vegas-Paradise 5 100.00 5.43 20.00 45.22 60.00 37.62 0.00 11.50 20.00 2.70 0.00 7.14 0.00 0.00
Limited-Review:
Carson City 0 0.00 NA NA 23.09 0.00 63.04 0.00 13.87 0.00 0.00 NA 0.00 0.00 0.00
Reno-Sparks 0 0.00 11.65 0.00 53.61 0.00 24.69 0.00 10.05 0.00 0.00 0.00 0.00 0.00 0.00
NV nonMSA 0 0.00 NA NA 9.13 0.00 65.74 0.00 25.12 0.00 0.00 NA 0.00 0.00 0.00
Multifamily loan distribution includes Home Purchases, Home Improvement and Refinances. * Based on 2011 Peer Mortgage Data (USPR). ** Multifamily loans originated and purchased in the MA/AA as a percentage of all multifamily loans originated and purchased in the rated area. *** Percentage of multifamily units is the number of multifamily housing units in a particular geography divided by number of multifamily housing units in the area based on 2000 Census information.
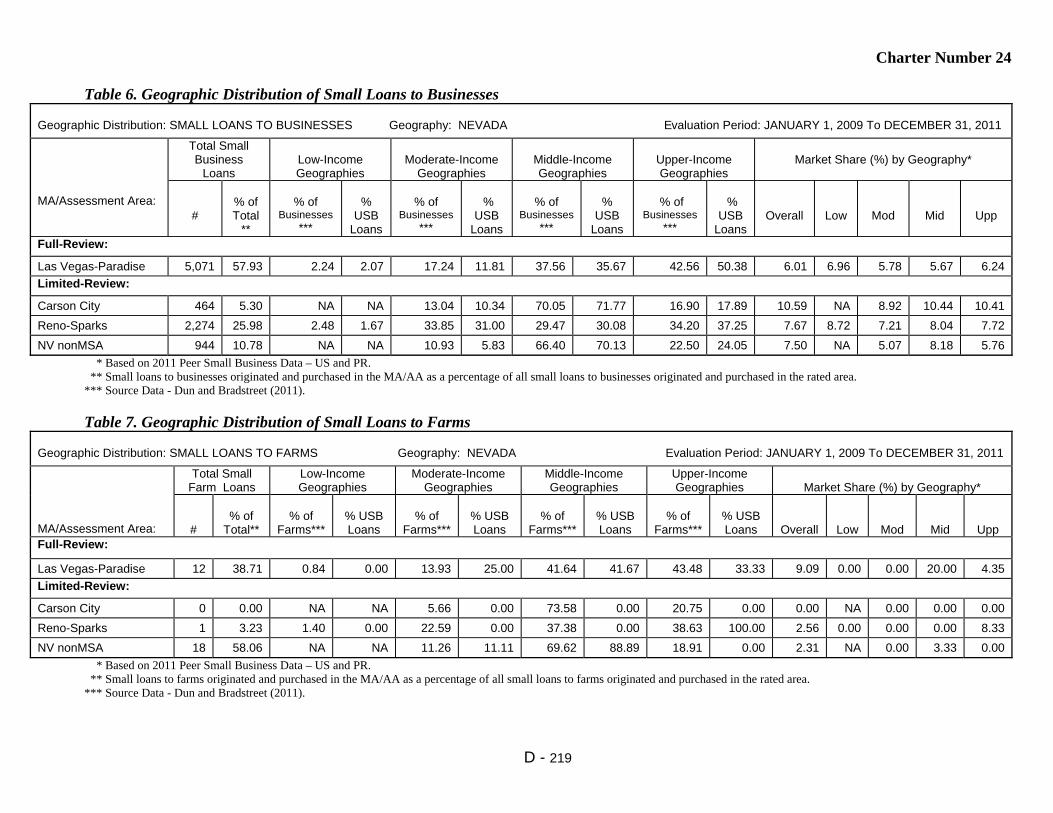
Charter Number 24
D - 219
Table 6. Geographic Distribution of Small Loans to Businesses
Geographic Distribution: SMALL LOANS TO BUSINESSES Geography: NEVADA Evaluation Period: JANUARY 1, 2009 To DECEMBER 31, 2011
MA/Assessment Area:
Total Small Business
Loans
Low-Income Geographies
Moderate-Income
Geographies
Middle-Income Geographies
Upper-Income Geographies
Market Share (%) by Geography*
#
% of Total
**
% of
Businesses ***
%
USB Loans
% of
Businesses ***
%
USB Loans
% of
Businesses ***
%
USB Loans
% of
Businesses ***
%
USB Loans
Overall
Low
Mod
Mid
Upp
Full-Review:
Las Vegas-Paradise 5,071 57.93 2.24 2.07 17.24 11.81 37.56 35.67 42.56 50.38 6.01 6.96 5.78 5.67 6.24
Limited-Review:
Carson City 464 5.30 NA NA 13.04 10.34 70.05 71.77 16.90 17.89 10.59 NA 8.92 10.44 10.41
Reno-Sparks 2,274 25.98 2.48 1.67 33.85 31.00 29.47 30.08 34.20 37.25 7.67 8.72 7.21 8.04 7.72
NV nonMSA 944 10.78 NA NA 10.93 5.83 66.40 70.13 22.50 24.05 7.50 NA 5.07 8.18 5.76
* Based on 2011 Peer Small Business Data – US and PR. ** Small loans to businesses originated and purchased in the MA/AA as a percentage of all small loans to businesses originated and purchased in the rated area. *** Source Data - Dun and Bradstreet (2011). Table 7. Geographic Distribution of Small Loans to Farms
Geographic Distribution: SMALL LOANS TO FARMS Geography: NEVADA Evaluation Period: JANUARY 1, 2009 To DECEMBER 31, 2011
MA/Assessment Area:
Total Small Farm Loans
Low-Income Geographies
Moderate-Income Geographies
Middle-Income Geographies
Upper-Income Geographies
Market Share (%) by Geography*
#
% of
Total**
% of
Farms***
% USB Loans
% of
Farms***
% USB Loans
% of
Farms***
% USB Loans
% of
Farms***
% USB Loans
Overall
Low
Mod
Mid
Upp
Full-Review:
Las Vegas-Paradise 12 38.71 0.84 0.00 13.93 25.00 41.64 41.67 43.48 33.33 9.09 0.00 0.00 20.00 4.35
Limited-Review:
Carson City 0 0.00 NA NA 5.66 0.00 73.58 0.00 20.75 0.00 0.00 NA 0.00 0.00 0.00
Reno-Sparks 1 3.23 1.40 0.00 22.59 0.00 37.38 0.00 38.63 100.00 2.56 0.00 0.00 0.00 8.33
NV nonMSA 18 58.06 NA NA 11.26 11.11 69.62 88.89 18.91 0.00 2.31 NA 0.00 3.33 0.00
* Based on 2011 Peer Small Business Data – US and PR. ** Small loans to farms originated and purchased in the MA/AA as a percentage of all small loans to farms originated and purchased in the rated area. *** Source Data - Dun and Bradstreet (2011).

Charter Number 24
D - 220
Table 8. Borrower Distribution of Home Purchase Loans
Borrower Distribution: HOME PURCHASE Geography: NEVADA Evaluation Period: JANUARY 1, 2009 To DECEMBER 31, 2011
MA/Assessment Area:
Total Home Purchase
Loans
Low-Income Borrowers
Moderate-Income
Borrowers
Middle-Income
Borrowers
Upper-Income
Borrowers
Market Share*
#
% of Total
**
% Families
***
% USB Loans
****
% Families
***
% USB Loans
****
% Families
***
% USB Loans
****
% Families
***
% USB Loans
****
Over-
all
Low
Mod
Mid
Upp
Full-Review:
Las Vegas-Paradise 3,673 76.41 18.69 14.39 18.74 26.41 23.47 23.71 39.10 35.49 1.18 0.92 0.90 1.13 1.52
Limited-Review:
Carson City 110 2.29 18.53 8.57 18.74 22.86 22.28 34.29 40.45 34.29 2.01 1.48 2.55 2.11 1.83
Reno-Sparks 562 11.69 19.17 8.80 18.84 23.20 23.06 19.60 38.94 48.40 1.37 0.40 1.24 1.18 2.15
NV nonMSA 462 9.61 17.63 9.13 18.93 19.50 25.10 25.31 38.34 46.06 2.87 1.25 1.84 2.14 4.87
Data shown includes only one to four-family and manufactured housing (property type 1 or 2). * Based on 2011 Peer Mortgage Data (USPR). ** Home purchase loans originated and purchased in the MA/AA as a percentage of all home purchase loans originated and purchased in the rated area. *** Percentage of Families is based on the 2000 Census information. **** As a percentage of loans with borrower income information available. No information was available for 42.8% of loans originated and purchased by the bank.
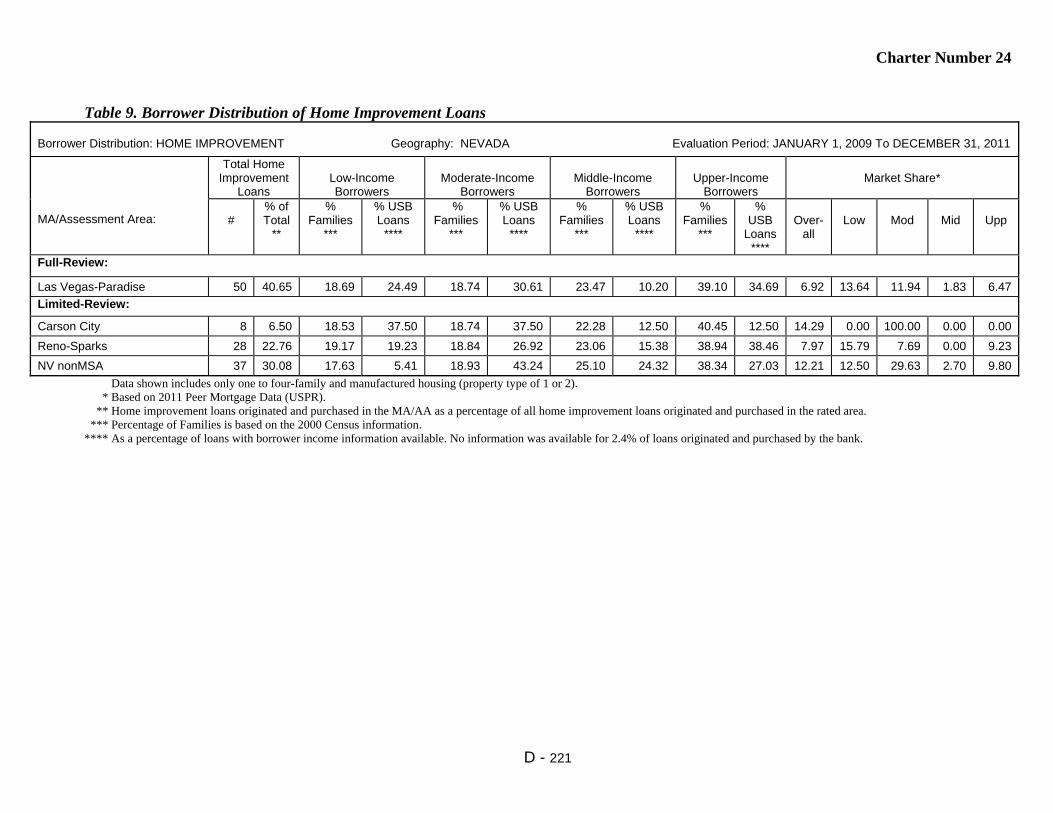
Charter Number 24
D - 221
Table 9. Borrower Distribution of Home Improvement Loans
Borrower Distribution: HOME IMPROVEMENT Geography: NEVADA Evaluation Period: JANUARY 1, 2009 To DECEMBER 31, 2011
MA/Assessment Area:
Total Home Improvement
Loans
Low-Income Borrowers
Moderate-Income
Borrowers
Middle-Income
Borrowers
Upper-Income
Borrowers
Market Share*
#
% of Total
**
% Families
***
% USB Loans
****
% Families
***
% USB Loans
****
% Families
***
% USB Loans
****
% Families
***
% USB
Loans ****
Over-
all
Low
Mod
Mid
Upp
Full-Review:
Las Vegas-Paradise 50 40.65 18.69 24.49 18.74 30.61 23.47 10.20 39.10 34.69 6.92 13.64 11.94 1.83 6.47
Limited-Review:
Carson City 8 6.50 18.53 37.50 18.74 37.50 22.28 12.50 40.45 12.50 14.29 0.00 100.00 0.00 0.00
Reno-Sparks 28 22.76 19.17 19.23 18.84 26.92 23.06 15.38 38.94 38.46 7.97 15.79 7.69 0.00 9.23
NV nonMSA 37 30.08 17.63 5.41 18.93 43.24 25.10 24.32 38.34 27.03 12.21 12.50 29.63 2.70 9.80
Data shown includes only one to four-family and manufactured housing (property type of 1 or 2). * Based on 2011 Peer Mortgage Data (USPR). ** Home improvement loans originated and purchased in the MA/AA as a percentage of all home improvement loans originated and purchased in the rated area. *** Percentage of Families is based on the 2000 Census information. **** As a percentage of loans with borrower income information available. No information was available for 2.4% of loans originated and purchased by the bank.

Charter Number 24
D - 222
Table 10. Borrower Distribution of Home Mortgage Refinance Loans
Borrower Distribution: HOME MORTGAGE REFINANCE Geography: NEVADA Evaluation Period: JANUARY 1, 2009 To DECEMBER 31, 2011
MA/Assessment Area:
Total Home Mortgage Refinance
Loans
Low-Income Borrowers
Moderate-Income Borrowers
Middle-Income Borrowers
Upper-Income Borrowers
Market Share*
#
% of Total
**
% Families
***
% USB Loans
****
% Families
***
% USB Loans
****
% Families
***
% USB Loans
****
% Families
***
% USB
Loans ****
Over-
all
Low
Mod
Mid
Upp
Full-Review:
Las Vegas-Paradise 2,017 60.95 18.69 7.89 18.74 19.04 23.47 19.22 39.10 53.85 3.84 4.17 4.66 2.97 3.90
Limited-Review:
Carson City 90 2.72 18.53 5.33 18.74 33.33 22.28 25.33 40.45 36.00 5.27 4.65 11.11 4.80 3.56
Reno-Sparks 716 21.64 19.17 9.04 18.84 17.49 23.06 22.40 38.94 51.08 4.69 5.94 5.11 4.26 4.57
NV nonMSA 486 14.69 17.63 5.41 18.93 18.92 25.10 28.83 38.34 46.85 5.14 4.26 6.36 4.79 5.07
Data shown includes only one to four-family and manufactured housing (property type 1 or 2). * Based on 2011 Peer Mortgage Data (USPR). ** Home refinance loans originated and purchased in the MA/AA as a percentage of all home refinance loans originated and purchased in the rated area. *** Percentage of Families is based on the 2000 Census information. **** As a percentage of loans with borrower income information available. No information was available for 39.0% of loans originated and purchased by the bank.

Charter Number 24
D - 223
Table 11. Borrower Distribution of Small Loans to Businesses
Borrower Distribution: SMALL LOANS TO BUSINESSES Geography: NEVADA Evaluation Period: JANUARY 1, 2009 To DECEMBER 31, 2011
MA/Assessment Area:
Total Small Loans to
Businesses
Businesses With Revenues of $1 million or
less
Loans by Original Amount Regardless of Business Size
Market Share*
#
% of
Total**
% of Businesses
***
% USB
Loans****
$100,000 or
less
>$100,000 to $250,000
>$250,000 to $1,000,000
All
Rev $1 Million or
Less Full-Review:
Las Vegas-Paradise 5,071 57.93 67.00 63.85 95.60 1.58 2.82 6.01 7.65
Limited-Review:
Carson City 464 5.30 67.07 75.22 95.26 2.16 2.59 10.59 13.65
Reno-Sparks 2,274 25.98 68.20 67.11 94.81 1.85 3.34 7.67 9.24
NV nonMSA 944 10.78 69.98 63.14 96.40 1.80 1.80 7.50 8.98
* Based on 2011 Peer Small Business Data – US and PR. ** Small loans to businesses originated and purchased in the MA/AA as a percentage of all small loans to businesses originated and purchased in the rated area. *** Businesses with revenues of $1 million or less as a percentage of all businesses (Source Dun and Bradstreet - 2011). **** Small loans to businesses with revenues of $1 million or less as a percentage of all loans reported as small loans to businesses. No information was available for 22.2% of small loans to businesses originated and purchased by the bank. Table 12. Borrower Distribution of Small Loans to Farms
Borrower Distribution: SMALL LOANS TO FARMS Geography: NEVADA Evaluation Period: JANUARY 1, 2009 To DECEMBER 31, 2011
MA/Assessment Area:
Total Small Loans to Farms
Farms With Revenues of $1 million or less
Loans by Original Amount Regardless of Farm Size
Market Share*
# % of Total**
% of Farms***
% USB Loans****
$100,000 or less
>$100,000 to $250,000 >$250,000 to $500,000 All Rev $1 Million or Less
Full-Review:
Las Vegas-Paradise 12 38.71 93.32 75.00 91.67 8.33 0.00 9.09 9.52
Limited-Review:
Carson City 0 0.00 96.23 0.00 0.00 0.00 0.00 0.00 0.00
Reno-Sparks 1 3.23 93.61 100.00 100.00 0.00 0.00 2.56 5.00
NV nonMSA 18 58.06 94.43 66.67 94.44 5.56 0.00 2.31 1.54
* Based on 2011 Peer Small Business Data – US and PR. ** Small loans to farms originated and purchased in the MA/AA as a percentage of all small loans to farms originated and purchased in the rated area. *** Farms with revenues of $1 million or less as a percentage of all farms (Source Dun and Bradstreet - 2011). **** Small loans to farms with revenues of $1 million or less as a percentage of all loans reported as small loans to farms. No information was available for 25.8% of small loans to farms originated and purchased by the bank.

Charter Number 24
D - 224
Table 14. Qualified Investments
QUALIFIED INVESTMENTS Geography: NEVADA Evaluation Period: JANUARY 1, 2009 To MARCH 31, 2012
MA/Assessment Area:
Prior Period Investments* Current Period Investments** Total Investments Unfunded Commitments***
# $(000’s) # $(000’s) # $(000’s) % of Total # $(000’s) Full-Review:
Las Vegas-Paradise 44 15,555 101 17,281 145 32,836 72.95 0 0
Limited-Review:
Carson City 7 545 4 1,409 11 1,954 4.34 1 12,673
Reno-Sparks 13 2,233 41 4,403 54 6,636 14.74 0 0
NV nonMSA 13 801 12 2,704 25 3,505 7.79 0 0
NV Statewide 0 0 17 79 17 79 0.18 0 0
* 'Prior Period Investments' means investments made in a previous evaluation period that are outstanding as of the examination date. ** The evaluation period for current period investments is January 1, 2009 to March 31, 2012. *** 'Unfunded Commitments' means legally binding investment commitments that are tracked and recorded by the institution's financial reporting system.
Table 15. Distribution of Branch Delivery System and Branch Openings/Closings DISTRIBUTION OF BRANCH DELIVERY SYSTEM/BRANCH OPENINGS/CLOSINGS Geography: NEVADA Evaluation Period: JANUARY 1, 2009 To DECEMBER 31, 2011
MA/Assessment Area:
Deposits Branches Branch Openings/Closings Population
% of Rated Area
Deposits in AA
# of USB
Branches
% of
Rated Area
Branches in AA
Location of Branches by
Income of Geographies (%)
# of Branch
Openings
# of Branch
Closings
Net change in Location of Branches (+ or - )
% of Population within Each
Geography
Low
Mod
Mid
Upp
Low
Mod
Mid
Upp
Low
Mod
Mid
Upp
Full-Review:
Las Vegas-Paradise 64.53 73 69.52 4.11 12.33 34.25 49.32 29 7 1 4 8 9 2.05 27.84 41.73 28.38
Limited-Review:
Carson City 5.33 4 3.81 NA 25.00 50.00 25.00 2 0 NA 1 1 0 NA 11.55 66.93 21.52
Reno-Sparks 19.88 20 19.05 5.00 30.00 25.00 40.00 4 0 0 0 2 2 3.65 29.63 39.48 27.25
NV nonMSA 10.26 8 7.62 NA 12.50 75.00 12.50 3 0 NA 1 2 0 NA 13.23 67.37 19.40
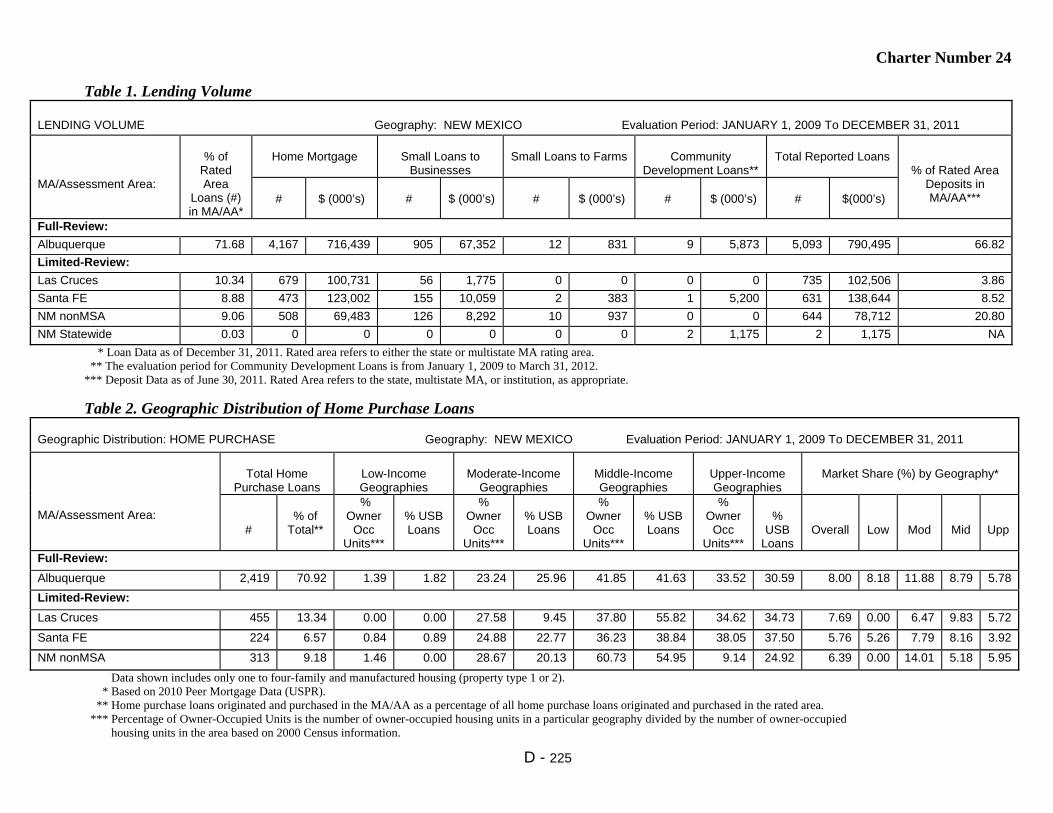
Charter Number 24
D - 225
Table 1. Lending Volume
LENDING VOLUME Geography: NEW MEXICO Evaluation Period: JANUARY 1, 2009 To DECEMBER 31, 2011
MA/Assessment Area:
% of
Rated Area
Loans (#) in MA/AA*
Home Mortgage
Small Loans to
Businesses
Small Loans to Farms
Community
Development Loans**
Total Reported Loans
% of Rated Area Deposits in MA/AA***
#
$ (000’s)
#
$ (000’s)
#
$ (000’s)
#
$ (000’s)
#
$(000’s)
Full-Review:
Albuquerque 71.68 4,167 716,439 905 67,352 12 831 9 5,873 5,093 790,495 66.82
Limited-Review:
Las Cruces 10.34 679 100,731 56 1,775 0 0 0 0 735 102,506 3.86
Santa FE 8.88 473 123,002 155 10,059 2 383 1 5,200 631 138,644 8.52
NM nonMSA 9.06 508 69,483 126 8,292 10 937 0 0 644 78,712 20.80
NM Statewide 0.03 0 0 0 0 0 0 2 1,175 2 1,175 NA
* Loan Data as of December 31, 2011. Rated area refers to either the state or multistate MA rating area. ** The evaluation period for Community Development Loans is from January 1, 2009 to March 31, 2012. *** Deposit Data as of June 30, 2011. Rated Area refers to the state, multistate MA, or institution, as appropriate.
Table 2. Geographic Distribution of Home Purchase Loans Geographic Distribution: HOME PURCHASE Geography: NEW MEXICO Evaluation Period: JANUARY 1, 2009 To DECEMBER 31, 2011
MA/Assessment Area:
Total Home
Purchase Loans
Low-Income Geographies
Moderate-Income
Geographies
Middle-Income Geographies
Upper-Income Geographies
Market Share (%) by Geography*
#
% of
Total**
% Owner
Occ Units***
% USB Loans
% Owner
Occ Units***
% USB Loans
% Owner
Occ Units***
% USB Loans
% Owner
Occ Units***
%
USB Loans
Overall
Low
Mod
Mid
Upp
Full-Review:
Albuquerque 2,419 70.92 1.39 1.82 23.24 25.96 41.85 41.63 33.52 30.59 8.00 8.18 11.88 8.79 5.78
Limited-Review:
Las Cruces 455 13.34 0.00 0.00 27.58 9.45 37.80 55.82 34.62 34.73 7.69 0.00 6.47 9.83 5.72
Santa FE 224 6.57 0.84 0.89 24.88 22.77 36.23 38.84 38.05 37.50 5.76 5.26 7.79 8.16 3.92
NM nonMSA 313 9.18 1.46 0.00 28.67 20.13 60.73 54.95 9.14 24.92 6.39 0.00 14.01 5.18 5.95
Data shown includes only one to four-family and manufactured housing (property type 1 or 2). * Based on 2010 Peer Mortgage Data (USPR). ** Home purchase loans originated and purchased in the MA/AA as a percentage of all home purchase loans originated and purchased in the rated area. *** Percentage of Owner-Occupied Units is the number of owner-occupied housing units in a particular geography divided by the number of owner-occupied housing units in the area based on 2000 Census information.

Charter Number 24
D - 226
Table 3. Geographic Distribution of Home Improvement Loans
Geographic Distribution: HOME IMPROVEMENT Geography: NEW MEXICO Evaluation Period: JANUARY 1, 2009 To DECEMBER 31, 2011
MA/Assessment Area:
Total Home
Improvement Loans
Low-Income Geographies
Moderate-Income
Geographies
Middle-Income Geographies
Upper-Income Geographies
Market Share (%) by Geography*
#
% of
Total**
% Owner
Occ Units***
% USB Loans
% Owner
Occ Units***
% USB Loans
% Owner
Occ Units***
% USB Loans
% Owner
Occ Units***
%
USB Loans
Overall
Low
Mod
Mid
Upp
Full-Review:
Albuquerque 32 46.38 1.39 0.00 23.24 25.00 41.85 37.50 33.52 37.50 2.36 0.00 4.82 1.67 2.15
Limited-Review:
Las Cruces 3 4.35 0.00 0.00 27.58 33.33 37.80 0.00 34.62 66.67 1.38 0.00 3.33 0.00 1.45
Santa FE 12 17.39 0.84 0.00 24.88 16.67 36.23 66.67 38.05 16.67 7.19 0.00 10.00 12.50 1.59
NM nonMSA 22 31.88 1.46 0.00 28.67 4.55 60.73 81.82 9.14 13.64 18.27 0.00 5.00 25.81 9.09
Data shown includes only one to four-family and manufactured housing (property type 1 or 2). * Based on 2010 Peer Mortgage Data (USPR). ** Home improvement loans originated and purchased in the MA/AA as a percentage of all home improvement loans originated and purchased in the rated area. *** Percentage of Owner-Occupied Units is the number of owner-occupied housing units in a particular geography divided by number of owner-occupied housing units in the area based on 2000 Census information.

Charter Number 24
D - 227
Table 4. Geographic Distribution of Home Mortgage Refinance Loans
Geographic Distribution: HOME MORTGAGE REFINANCE Geography: NEW MEXICO Evaluation Period: JANUARY 1, 2009 To DECEMBER 31, 2011
MA/Assessment Area:
Total Home Mortgage
Refinance Loans
Low-Income Geographies
Moderate-Income Geographies
Middle-Income Geographies
Upper-Income Geographies
Market Share (%) by Geography*
#
% of
Total**
% Owner
Occ Units***
% USB Loans
% Owner Occ
Units***
% USB Loans
% Owner
Occ Units***
% USB Loans
% Owner
Occ Units***
%
USB Loans
Overall
Low
Mod
Mid
Upp
Full-Review:
Albuquerque 1,714 73.12 1.39 0.99 23.24 9.33 41.85 31.97 33.52 57.70 2.33 2.15 1.71 1.93 2.79
Limited-Review:
Las Cruces 221 9.43 0.00 0.00 27.58 5.43 37.80 36.20 34.62 58.37 2.51 0.00 2.02 2.42 2.64
Santa FE 236 10.07 0.84 2.12 24.88 9.75 36.23 29.66 38.05 58.47 1.73 4.76 1.55 1.16 2.05
NM nonMSA 173 7.38 1.46 0.00 28.67 6.94 60.73 65.32 9.14 27.75 3.93 0.00 5.26 3.87 3.76
Data shown includes only one to four-family and manufactured housing (property type 1 or 2). * Based on 2010 Peer Mortgage Data (USPR). ** Home mortgage refinance loans originated and purchased in the MA/AA as a percentage of all home mortgage refinance loans originated and purchased in the rated area. *** Percentage of Owner-Occupied Units is the number of owner-occupied housing units in a particular geography divided by number of owner-occupied housing units in the area based on 2000 Census information.

Charter Number 24
D - 228
Table 5. Geographic Distribution of Multifamily Loans
Geographic Distribution: MULTIFAMILY Geography: NEW MEXICO Evaluation Period: JANUARY 1, 2009 To DECEMBER 31, 2011
MA/Assessment Area:
Total Multifamily
Loans
Low-Income Geographies
Moderate-Income
Geographies
Middle-Income Geographies
Upper-Income Geographies
Market Share (%) by Geography*
#
% of Total**
% of MF
Units***
% USB Loans
% MF Units***
% USB Loans
% MF Units***
% USB Loans
% MF Units***
% USB Loans
Overall
Low
Mod
Mid
Upp
Full-Review:
Albuquerque 2 66.67 3.74 0.00 27.16 50.00 46.31 50.00 22.79 0.00 0.00 0.00 0.00 0.00 0.00
Limited-Review:
Las Cruces 0 0.00 2.29 0.00 25.45 0.00 33.41 0.00 38.84 0.00 0.00 0.00 0.00 0.00 0.00
Santa FE 1 33.33 2.34 0.00 35.29 100.00 30.73 0.00 31.65 0.00 0.00 0.00 0.00 0.00 0.00
NM nonMSA 0 0.00 0.57 0.00 18.37 0.00 67.67 0.00 13.39 0.00 0.00 0.00 0.00 0.00 0.00
Multifamily loan distribution includes Home Purchases, Home Improvement and Refinances. * Based on 2010 Peer Mortgage Data (USPR). ** Multifamily loans originated and purchased in the MA/AA as a percentage of all multifamily loans originated and purchased in the rated area. *** Percentage of multifamily units is the number of multifamily housing units in a particular geography divided by number of multifamily housing units in the area based on 2000 Census information.
Table 6. Geographic Distribution of Small Loans to Businesses Geographic Distribution: SMALL LOANS TO BUSINESSES Geography: NEW MEXICO Evaluation Period: JANUARY 1, 2009 To DECEMBER 31, 2011
MA/Assessment Area:
Total Small Business
Loans
Low-Income Geographies
Moderate-Income
Geographies
Middle-Income Geographies
Upper-Income Geographies
Market Share (%) by Geography*
#
% of Total
**
% of Businesses
***
% USB
Loans
% of Businesses
***
% USB
Loans
% of Businesses
***
% USB
Loans
% of Businesses
***
% USB
Loans
Overall
Low
Mod
Mid
Upp Full-Review:
Albuquerque 905 72.87 1.63 1.66 21.60 26.41 43.69 42.76 33.08 29.17 5.34 6.03 6.92 5.20 3.99
Limited-Review:
Las Cruces 56 4.51 0.88 0.00 17.25 17.86 39.49 39.29 42.39 42.86 1.84 0.00 1.03 1.65 1.62
Santa FE 155 12.48 1.78 0.00 17.57 18.06 28.60 29.03 52.06 52.90 3.48 0.00 4.35 3.82 3.02
NM nonMSA 126 10.14 0.11 0.00 14.60 11.90 72.71 75.40 12.56 12.70 6.57 0.00 2.69 7.50 4.68
* Based on 2010 Peer Small Business Data – US and PR. ** Small loans to businesses originated and purchased in the MA/AA as a percentage of all small loans to businesses originated and purchased in the rated area. *** Source Data - Dun and Bradstreet (2010).
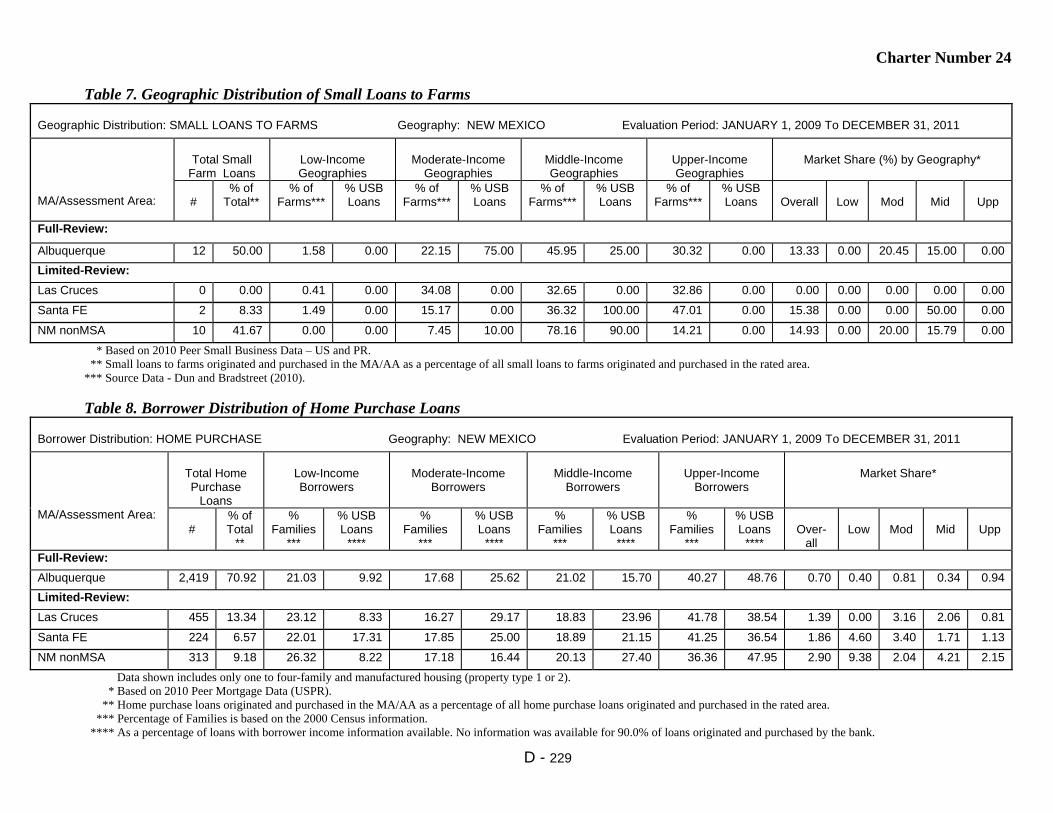
Charter Number 24
D - 229
Table 7. Geographic Distribution of Small Loans to Farms
Geographic Distribution: SMALL LOANS TO FARMS Geography: NEW MEXICO Evaluation Period: JANUARY 1, 2009 To DECEMBER 31, 2011
MA/Assessment Area:
Total Small
Farm Loans
Low-Income Geographies
Moderate-Income
Geographies
Middle-Income Geographies
Upper-Income Geographies
Market Share (%) by Geography*
#
% of Total**
% of Farms***
% USB Loans
% of Farms***
% USB Loans
% of Farms***
% USB Loans
% of Farms***
% USB Loans
Overall
Low
Mod
Mid
Upp
Full-Review:
Albuquerque 12 50.00 1.58 0.00 22.15 75.00 45.95 25.00 30.32 0.00 13.33 0.00 20.45 15.00 0.00
Limited-Review:
Las Cruces 0 0.00 0.41 0.00 34.08 0.00 32.65 0.00 32.86 0.00 0.00 0.00 0.00 0.00 0.00
Santa FE 2 8.33 1.49 0.00 15.17 0.00 36.32 100.00 47.01 0.00 15.38 0.00 0.00 50.00 0.00
NM nonMSA 10 41.67 0.00 0.00 7.45 10.00 78.16 90.00 14.21 0.00 14.93 0.00 20.00 15.79 0.00
* Based on 2010 Peer Small Business Data – US and PR. ** Small loans to farms originated and purchased in the MA/AA as a percentage of all small loans to farms originated and purchased in the rated area. *** Source Data - Dun and Bradstreet (2010).
Table 8. Borrower Distribution of Home Purchase Loans Borrower Distribution: HOME PURCHASE Geography: NEW MEXICO Evaluation Period: JANUARY 1, 2009 To DECEMBER 31, 2011
MA/Assessment Area:
Total Home Purchase
Loans
Low-Income Borrowers
Moderate-Income
Borrowers
Middle-Income
Borrowers
Upper-Income
Borrowers
Market Share*
#
% of Total
**
% Families
***
% USB Loans
****
% Families
***
% USB Loans
****
% Families
***
% USB Loans
****
% Families
***
% USB Loans
****
Over-
all
Low
Mod
Mid
Upp
Full-Review:
Albuquerque 2,419 70.92 21.03 9.92 17.68 25.62 21.02 15.70 40.27 48.76 0.70 0.40 0.81 0.34 0.94
Limited-Review:
Las Cruces 455 13.34 23.12 8.33 16.27 29.17 18.83 23.96 41.78 38.54 1.39 0.00 3.16 2.06 0.81
Santa FE 224 6.57 22.01 17.31 17.85 25.00 18.89 21.15 41.25 36.54 1.86 4.60 3.40 1.71 1.13
NM nonMSA 313 9.18 26.32 8.22 17.18 16.44 20.13 27.40 36.36 47.95 2.90 9.38 2.04 4.21 2.15
Data shown includes only one to four-family and manufactured housing (property type 1 or 2). * Based on 2010 Peer Mortgage Data (USPR). ** Home purchase loans originated and purchased in the MA/AA as a percentage of all home purchase loans originated and purchased in the rated area. *** Percentage of Families is based on the 2000 Census information. **** As a percentage of loans with borrower income information available. No information was available for 90.0% of loans originated and purchased by the bank.

Charter Number 24
D - 230
Table 9. Borrower Distribution of Home Improvement Loans
Borrower Distribution: HOME IMPROVEMENT Geography: NEW MEXICO Evaluation Period: JANUARY 1, 2009 To DECEMBER 31, 2011
MA/Assessment Area:
Total Home Improvement
Loans
Low-Income Borrowers
Moderate-Income
Borrowers
Middle-Income
Borrowers
Upper-Income
Borrowers
Market Share*
#
% of Total
**
% Families
***
% USB Loans
****
% Families
***
% USB Loans
****
% Families
***
% USB Loans
****
% Families
***
% USB Loans
****
Over-
all
Low
Mod
Mid
Upp
Full-Review:
Albuquerque 32 46.38 21.03 13.64 17.68 13.64 21.02 22.73 40.27 50.00 1.88 1.85 1.60 1.49 2.25
Limited-Review:
Las Cruces 3 4.35 23.12 0.00 16.27 0.00 18.83 0.00 41.78 100.00 1.45 0.00 0.00 0.00 2.74
Santa FE 12 17.39 22.01 0.00 17.85 40.00 18.89 40.00 41.25 20.00 6.72 0.00 12.50 11.76 1.75
ND nonMSA 22 31.88 26.32 22.22 17.18 5.56 20.13 38.89 36.36 33.33 20.45 57.14 9.09 31.82 12.50
Data shown includes only one to four-family and manufactured housing (property type of 1 or 2). * Based on 2010 Peer Mortgage Data (USPR). ** Home improvement loans originated and purchased in the MA/AA as a percentage of all home improvement loans originated and purchased in the rated area. *** Percentage of Families is based on the 2000 Census information. **** As a percentage of loans with borrower income information available. No information was available for 23.2% of loans originated and purchased by the bank.
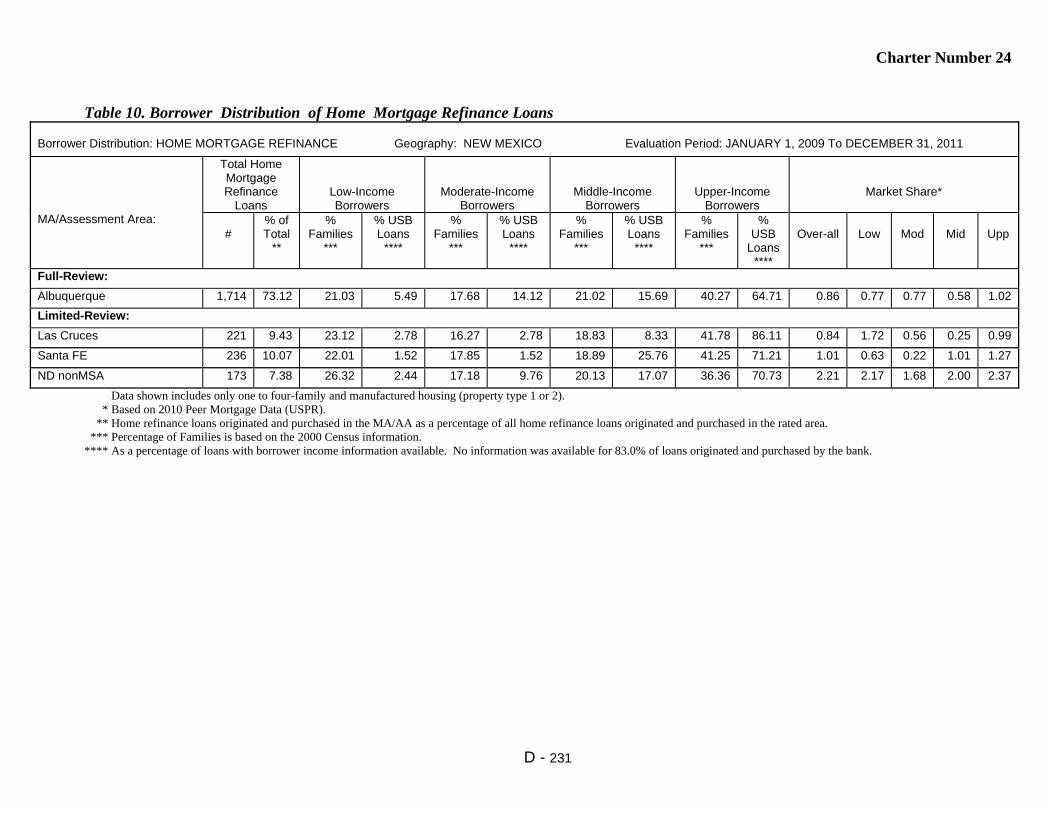
Charter Number 24
D - 231
Table 10. Borrower Distribution of Home Mortgage Refinance Loans
Borrower Distribution: HOME MORTGAGE REFINANCE Geography: NEW MEXICO Evaluation Period: JANUARY 1, 2009 To DECEMBER 31, 2011
MA/Assessment Area:
Total Home Mortgage Refinance
Loans
Low-Income Borrowers
Moderate-Income Borrowers
Middle-Income Borrowers
Upper-Income Borrowers
Market Share*
#
% of Total
**
% Families
***
% USB Loans
****
% Families
***
% USB Loans
****
% Families
***
% USB Loans
****
% Families
***
% USB
Loans ****
Over-all
Low
Mod
Mid
Upp
Full-Review:
Albuquerque 1,714 73.12 21.03 5.49 17.68 14.12 21.02 15.69 40.27 64.71 0.86 0.77 0.77 0.58 1.02
Limited-Review:
Las Cruces 221 9.43 23.12 2.78 16.27 2.78 18.83 8.33 41.78 86.11 0.84 1.72 0.56 0.25 0.99
Santa FE 236 10.07 22.01 1.52 17.85 1.52 18.89 25.76 41.25 71.21 1.01 0.63 0.22 1.01 1.27
ND nonMSA 173 7.38 26.32 2.44 17.18 9.76 20.13 17.07 36.36 70.73 2.21 2.17 1.68 2.00 2.37
Data shown includes only one to four-family and manufactured housing (property type 1 or 2). * Based on 2010 Peer Mortgage Data (USPR). ** Home refinance loans originated and purchased in the MA/AA as a percentage of all home refinance loans originated and purchased in the rated area. *** Percentage of Families is based on the 2000 Census information. **** As a percentage of loans with borrower income information available. No information was available for 83.0% of loans originated and purchased by the bank.

Charter Number 24
D - 232
Table 11. Borrower Distribution of Small Loans to Businesses
Borrower Distribution: SMALL LOANS TO BUSINESSES Geography: NEW MEXICO Evaluation Period: JANUARY 1, 2009 To DECEMBER 31, 2011
MA/ Assessment Area:
Total Small Loans to
Businesses
Businesses With Revenues of $1 million or less
Loans by Original Amount Regardless of Business Size
Market Share*
#
% of
Total**
% of Businesses*
**
% USB
Loans****
$100,000 or
less
>$100,000 to $250,000
>$250,000 to $1,000,000
All
Rev $1 Million or
Less Full-Review:
Albuquerque 905 72.87% 69.25% 58.67% 82.98% 10.39% 6.63% 5.34% 5.76%
Limited-Review:
Las Cruces 56 4.51% 65.31% 44.64% 92.86% 7.14% 0.00% 1.84% 1.63%
Santa FE 155 12.48% 66.63% 65.16% 88.39% 5.81% 5.81% 3.48% 4.34%
ND nonMSA 126 10.14% 63.12% 55.56% 88.89% 5.56% 5.56% 6.57% 9.08%
* Based on 2010 Peer Small Business Data – US and PR. ** Small loans to businesses originated and purchased in the MA/AA as a percentage of all small loans to businesses originated and purchased in the rated area. *** Businesses with revenues of $1 million or less as a percentage of all businesses (Source Dun and Bradstreet - 2010). **** Small loans to businesses with revenues of $1 million or less as a percentage of all loans reported as small loans to businesses. No information was available for 17.8% of small loans to businesses originated and purchased by the bank.
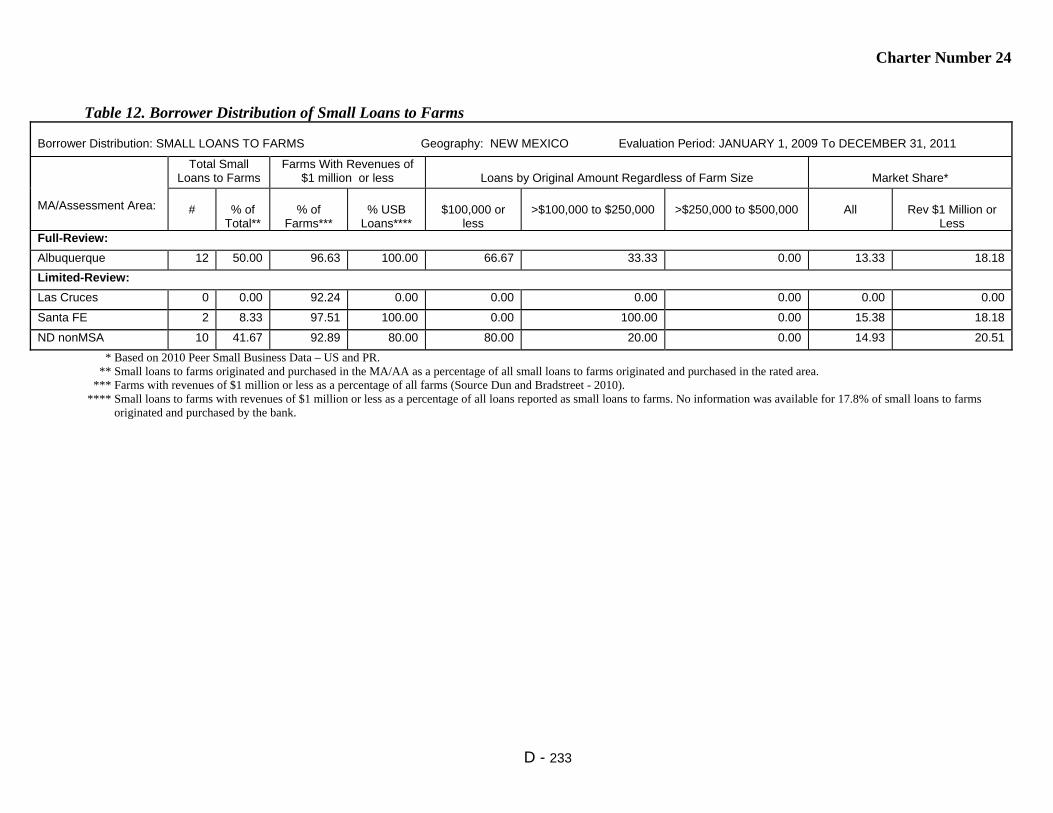
Charter Number 24
D - 233
Table 12. Borrower Distribution of Small Loans to Farms
Borrower Distribution: SMALL LOANS TO FARMS Geography: NEW MEXICO Evaluation Period: JANUARY 1, 2009 To DECEMBER 31, 2011
MA/Assessment Area:
Total Small Loans to Farms
Farms With Revenues of $1 million or less
Loans by Original Amount Regardless of Farm Size
Market Share*
#
% of
Total**
% of
Farms***
% USB
Loans****
$100,000 or
less
>$100,000 to $250,000
>$250,000 to $500,000
All
Rev $1 Million or
Less Full-Review:
Albuquerque 12 50.00 96.63 100.00 66.67 33.33 0.00 13.33 18.18
Limited-Review:
Las Cruces 0 0.00 92.24 0.00 0.00 0.00 0.00 0.00 0.00
Santa FE 2 8.33 97.51 100.00 0.00 100.00 0.00 15.38 18.18
ND nonMSA 10 41.67 92.89 80.00 80.00 20.00 0.00 14.93 20.51
* Based on 2010 Peer Small Business Data – US and PR. ** Small loans to farms originated and purchased in the MA/AA as a percentage of all small loans to farms originated and purchased in the rated area. *** Farms with revenues of $1 million or less as a percentage of all farms (Source Dun and Bradstreet - 2010). **** Small loans to farms with revenues of $1 million or less as a percentage of all loans reported as small loans to farms. No information was available for 17.8% of small loans to farms originated and purchased by the bank.

Charter Number 24
D - 234
Table 14. Qualified Investments
QUALIFIED INVESTMENTS Geography: NEW MEXICO Evaluation Period: JANUARY 1, 2009 To MARCH 31, 2012
MA/Assessment Area:
Prior Period Investments* Current Period Investments** Total Investments Unfunded Commitments***
# $(000’s) # $(000’s) # $(000’s) % of Total # $(000’s) Full-Review:
Albuquerque 0 0 47 15,056 47 15,056 63.88% 4 3,938
Limited-Review:
Las Cruces 0 0 3 3,330 3 3,330 14.13% 0 0
Santa FE 0 0 14 1,197 14 1,197 5.08% 1 5,919
NM nonMSA 0 0 7 2,482 7 2,482 10.53% 0 0
NM Statewide 2 1,408 9 95 11 1,503 6.38% 0 0
* 'Prior Period Investments' means investments made in a previous evaluation period that are outstanding as of the examination date. ** The evaluation period for current period investments is January 1, 2009 to March 31, 2012. *** 'Unfunded Commitments' means legally binding investment commitments that are tracked and recorded by the institution's financial reporting system.
Table 15. Distribution of Branch Delivery System and Branch Openings/Closings DISTRIBUTION OF BRANCH DELIVERY SYSTEM/BRANCH OPENINGS/CLOSINGS Geography: NEW MEXICO Evaluation Period: JANUARY 1, 2009 To DECEMBER 31, 2011
MA/Assessment Area:
Deposits Branches Branch Openings/Closings Population
% of
Rated Area
Deposits in AA
# of USB
Branches
% of
Rated Area
Branches in AA
Location of Branches by
Income of Geographies (%)
# of Branch
Openings
# of Branch
Closings
Net change in Location of Branches (+ or - )
% of Population within Each
Geography
Low
Mod
Mid
Upp
Low
Mod
Mid
Upp
Low
Mod
Mid
Upp
Full-Review:
Albuquerque 66.82 18 58.06 0.00 27.78 38.89 33.33 0 0 0 0 0 0 2.77 28.03 40.78 28.41
Limited-Review:
Las Cruces 3.86 2 6.45 0.00 50.00 50.00 0.00 0 0 0 0 0 0 1.59 32.86 35.36 30.20
Santa FE 8.52 4 12.90 0.00 50.00 25.00 25.00 0 0 0 0 0 0 1.40 29.81 35.71 33.08
NM nonMSA 20.80 7 22.58 0.00 0.00 85.71 14.29 0 0 0 0 0 0 2.03 32.54 57.77 7.65
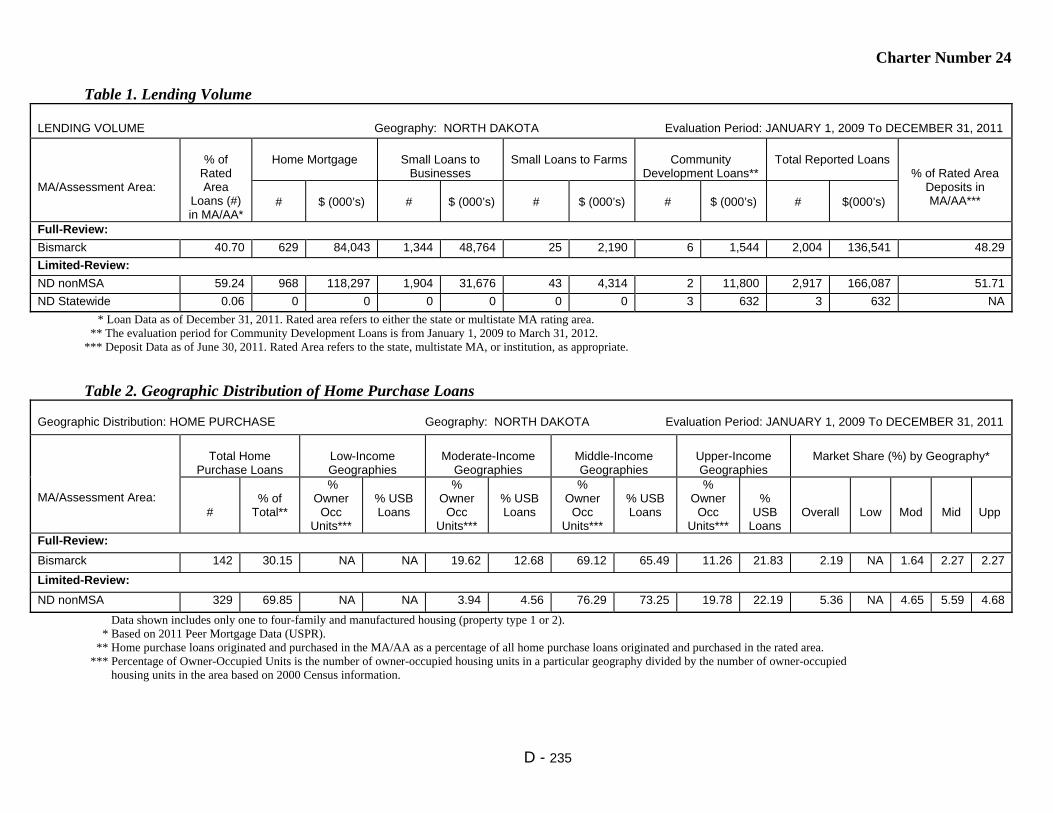
Charter Number 24
D - 235
Table 1. Lending Volume
LENDING VOLUME Geography: NORTH DAKOTA Evaluation Period: JANUARY 1, 2009 To DECEMBER 31, 2011
MA/Assessment Area:
% of
Rated Area
Loans (#) in MA/AA*
Home Mortgage
Small Loans to
Businesses
Small Loans to Farms
Community
Development Loans**
Total Reported Loans
% of Rated Area Deposits in MA/AA***
#
$ (000’s)
#
$ (000’s)
#
$ (000’s)
#
$ (000’s)
#
$(000’s)
Full-Review:
Bismarck 40.70 629 84,043 1,344 48,764 25 2,190 6 1,544 2,004 136,541 48.29
Limited-Review:
ND nonMSA 59.24 968 118,297 1,904 31,676 43 4,314 2 11,800 2,917 166,087 51.71
ND Statewide 0.06 0 0 0 0 0 0 3 632 3 632 NA
* Loan Data as of December 31, 2011. Rated area refers to either the state or multistate MA rating area. ** The evaluation period for Community Development Loans is from January 1, 2009 to March 31, 2012. *** Deposit Data as of June 30, 2011. Rated Area refers to the state, multistate MA, or institution, as appropriate.
Table 2. Geographic Distribution of Home Purchase Loans Geographic Distribution: HOME PURCHASE Geography: NORTH DAKOTA Evaluation Period: JANUARY 1, 2009 To DECEMBER 31, 2011
MA/Assessment Area:
Total Home
Purchase Loans
Low-Income Geographies
Moderate-Income
Geographies
Middle-Income Geographies
Upper-Income Geographies
Market Share (%) by Geography*
#
% of
Total**
% Owner
Occ Units***
% USB Loans
% Owner
Occ Units***
% USB Loans
% Owner
Occ Units***
% USB Loans
% Owner
Occ Units***
%
USB Loans
Overall
Low
Mod
Mid
Upp
Full-Review:
Bismarck 142 30.15 NA NA 19.62 12.68 69.12 65.49 11.26 21.83 2.19 NA 1.64 2.27 2.27
Limited-Review:
ND nonMSA 329 69.85 NA NA 3.94 4.56 76.29 73.25 19.78 22.19 5.36 NA 4.65 5.59 4.68
Data shown includes only one to four-family and manufactured housing (property type 1 or 2). * Based on 2011 Peer Mortgage Data (USPR). ** Home purchase loans originated and purchased in the MA/AA as a percentage of all home purchase loans originated and purchased in the rated area. *** Percentage of Owner-Occupied Units is the number of owner-occupied housing units in a particular geography divided by the number of owner-occupied housing units in the area based on 2000 Census information.
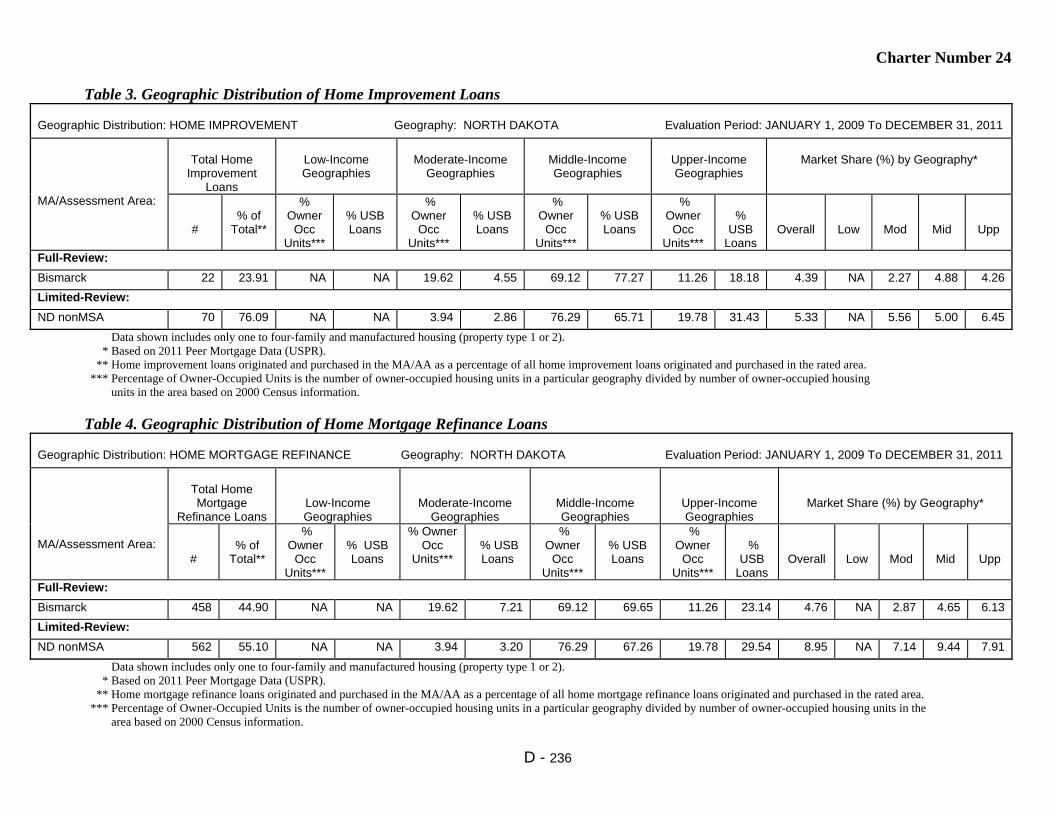
Charter Number 24
D - 236
Table 3. Geographic Distribution of Home Improvement Loans
Geographic Distribution: HOME IMPROVEMENT Geography: NORTH DAKOTA Evaluation Period: JANUARY 1, 2009 To DECEMBER 31, 2011
MA/Assessment Area:
Total Home
Improvement Loans
Low-Income Geographies
Moderate-Income
Geographies
Middle-Income Geographies
Upper-Income Geographies
Market Share (%) by Geography*
#
% of
Total**
% Owner
Occ Units***
% USB Loans
% Owner
Occ Units***
% USB Loans
% Owner
Occ Units***
% USB Loans
% Owner
Occ Units***
%
USB Loans
Overall
Low
Mod
Mid
Upp
Full-Review:
Bismarck 22 23.91 NA NA 19.62 4.55 69.12 77.27 11.26 18.18 4.39 NA 2.27 4.88 4.26
Limited-Review:
ND nonMSA 70 76.09 NA NA 3.94 2.86 76.29 65.71 19.78 31.43 5.33 NA 5.56 5.00 6.45
Data shown includes only one to four-family and manufactured housing (property type 1 or 2). * Based on 2011 Peer Mortgage Data (USPR). ** Home improvement loans originated and purchased in the MA/AA as a percentage of all home improvement loans originated and purchased in the rated area. *** Percentage of Owner-Occupied Units is the number of owner-occupied housing units in a particular geography divided by number of owner-occupied housing units in the area based on 2000 Census information. Table 4. Geographic Distribution of Home Mortgage Refinance Loans
Geographic Distribution: HOME MORTGAGE REFINANCE Geography: NORTH DAKOTA Evaluation Period: JANUARY 1, 2009 To DECEMBER 31, 2011
MA/Assessment Area:
Total Home Mortgage
Refinance Loans
Low-Income Geographies
Moderate-Income Geographies
Middle-Income Geographies
Upper-Income Geographies
Market Share (%) by Geography*
#
% of
Total**
% Owner
Occ Units***
% USB Loans
% Owner Occ
Units***
% USB Loans
% Owner
Occ Units***
% USB Loans
% Owner
Occ Units***
%
USB Loans
Overall
Low
Mod
Mid
Upp
Full-Review:
Bismarck 458 44.90 NA NA 19.62 7.21 69.12 69.65 11.26 23.14 4.76 NA 2.87 4.65 6.13
Limited-Review:
ND nonMSA 562 55.10 NA NA 3.94 3.20 76.29 67.26 19.78 29.54 8.95 NA 7.14 9.44 7.91
Data shown includes only one to four-family and manufactured housing (property type 1 or 2). * Based on 2011 Peer Mortgage Data (USPR). ** Home mortgage refinance loans originated and purchased in the MA/AA as a percentage of all home mortgage refinance loans originated and purchased in the rated area. *** Percentage of Owner-Occupied Units is the number of owner-occupied housing units in a particular geography divided by number of owner-occupied housing units in the area based on 2000 Census information.

Charter Number 24
D - 237
Table 5. Geographic Distribution of Multifamily Loans
Geographic Distribution: MULTIFAMILY Geography: NORTH DAKOTA Evaluation Period: JANUARY 1, 2009 To DECEMBER 31, 2011
MA/Assessment Area:
Total Multifamily
Loans
Low-Income Geographies
Moderate-Income
Geographies
Middle-Income Geographies
Upper-Income Geographies
Market Share (%) by Geography*
#
% of Total**
% of MF
Units***
% USB Loans
% MF Units***
% USB Loans
% MF Units***
% USB Loans
% MF Units***
% USB Loans
Overall
Low
Mod
Mid
Upp
Full-Review:
Bismarck 7 50.00 NA NA 4.08 0.00 84.44 100.00 11.48 0.00 5.71 NA 0.00 7.41 0.00
Limited-Review:
ND nonMSA 7 50.00 NA NA 8.72 0.00 80.86 100.00 10.41 0.00 6.52 NA 0.00 7.50 0.00
Multifamily loan distribution includes Home Purchases, Home Improvement and Refinances. * Based on 2011 Peer Mortgage Data (USPR). ** Multifamily loans originated and purchased in the MA/AA as a percentage of all multifamily loans originated and purchased in the rated area. *** Percentage of multifamily units is the number of multifamily housing units in a particular geography divided by number of multifamily housing units in the area based on 2000 Census information.
Table 6. Geographic Distribution of Small Loans to Businesses Geographic Distribution: SMALL LOANS TO BUSINESSES Geography: NORTH DAKOTA Evaluation Period: JANUARY 1, 2009 To DECEMBER 31, 2011
MA/Assessment Area:
Total Small Business
Loans
Low-Income Geographies
Moderate-Income
Geographies
Middle-Income Geographies
Upper-Income Geographies
Market Share (%) by Geography*
#
% of Total
**
% of Businesses
***
% USB
Loans
% of Businesses
***
% USB
Loans
% of Businesses
***
% USB
Loans
% of Businesses
***
% USB
Loans
Overall
Low
Mod
Mid
Upp Full-Review:
Bismarck 1,344 41.38 NA NA 19.30 18.08 68.43 66.59 12.27 15.33 29.20 NA 27.84 27.66 40.00
Limited-Review:
ND nonMSA 1,904 58.62 NA NA 3.77 4.83 78.72 74.37 17.51 20.80 22.45 NA 22.58 19.94 24.89
* Based on 2011 Peer Small Business Data – US and PR. ** Small loans to businesses originated and purchased in the MA/AA as a percentage of all small loans to businesses originated and purchased in the rated area. *** Source Data - Dun and Bradstreet (2011).

Charter Number 24
D - 238
Table 7. Geographic Distribution of Small Loans to Farms
Geographic Distribution: SMALL LOANS TO FARMS Geography: NORTH DAKOTA Evaluation Period: JANUARY 1, 2009 To DECEMBER 31, 2011
MA/Assessment Area:
Total Small
Farm Loans
Low-Income Geographies
Moderate-Income
Geographies
Middle-Income Geographies
Upper-Income Geographies
Market Share (%) by Geography*
#
% of Total**
% of Farms***
% USB Loans
% of Farms***
% USB Loans
% of Farms***
% USB Loans
% of Farms***
% USB Loans
Overall
Low
Mod
Mid
Upp
Full-Review:
Bismarck 25 36.76 NA NA 29.84 16.00 62.20 84.00 7.96 0.00 4.59 NA 4.17 5.48 0.00
Limited-Review:
ND nonMSA 43 63.24 NA NA 0.93 0.00 80.82 58.14 18.24 41.86 0.64 NA 0.00 0.33 1.69
* Based on 2011 Peer Small Business Data – US and PR. ** Small loans to farms originated and purchased in the MA/AA as a percentage of all small loans to farms originated and purchased in the rated area. *** Source Data - Dun and Bradstreet (2011).
Table 8. Borrower Distribution of Home Purchase Loans Borrower Distribution: HOME PURCHASE Geography: NORTH DAKOTA Evaluation Period: JANUARY 1, 2009 To DECEMBER 31, 2011
MA/Assessment Area:
Total Home Purchase
Loans
Low-Income Borrowers
Moderate-Income
Borrowers
Middle-Income
Borrowers
Upper-Income
Borrowers
Market Share*
#
% of Total
**
% Families
***
% USB Loans
****
% Families
***
% USB Loans
****
% Families
***
% USB Loans
****
% Families
***
% USB Loans
****
Over-
all
Low
Mod
Mid
Upp
Full-Review:
Bismarck 142 30.15 17.38 14.78 18.54 23.48 27.27 30.43 36.81 31.30 1.84 1.70 2.42 2.07 1.13
Limited-Review:
ND nonMSA 329 69.85 15.66 7.05 17.30 27.39 24.90 28.63 42.14 36.93 4.87 8.00 5.29 5.05 4.05
Data shown includes only one to four-family and manufactured housing (property type 1 or 2). * Based on 2011 Peer Mortgage Data (USPR). ** Home purchase loans originated and purchased in the MA/AA as a percentage of all home purchase loans originated and purchased in the rated area. *** Percentage of Families is based on the 2000 Census information. **** As a percentage of loans with borrower income information available. No information was available for 24.4% of loans originated and purchased by the bank.
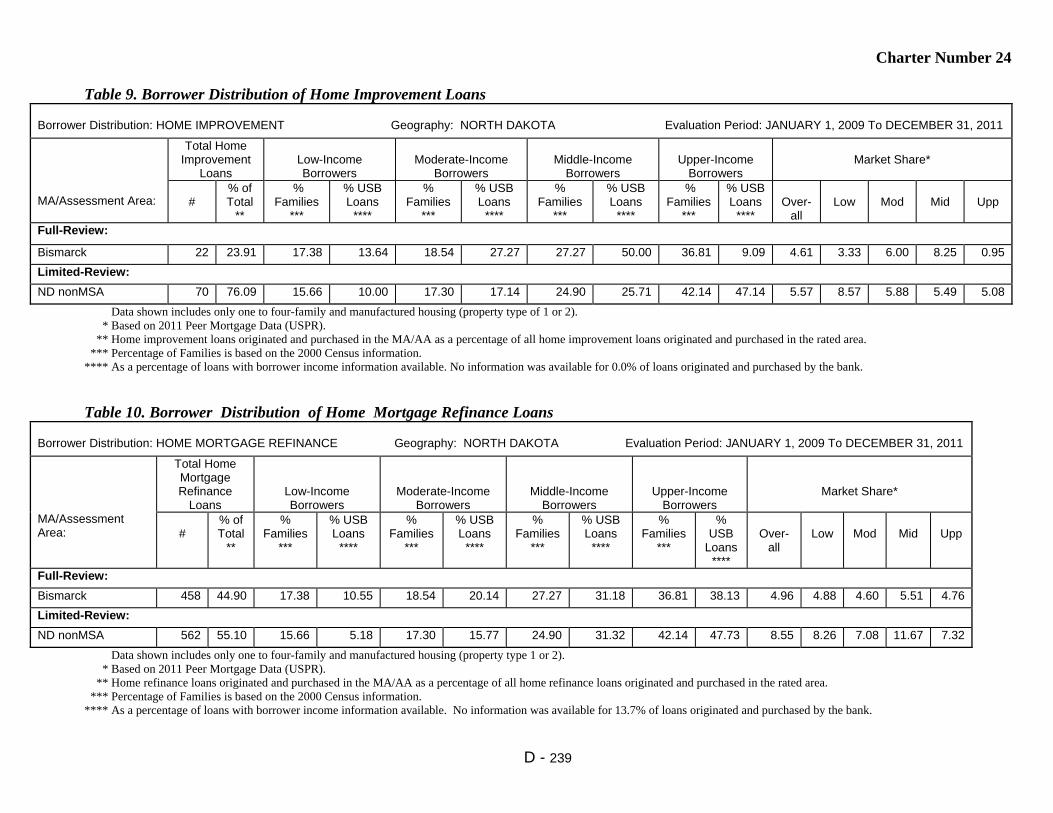
Charter Number 24
D - 239
Table 9. Borrower Distribution of Home Improvement Loans
Borrower Distribution: HOME IMPROVEMENT Geography: NORTH DAKOTA Evaluation Period: JANUARY 1, 2009 To DECEMBER 31, 2011
MA/Assessment Area:
Total Home Improvement
Loans
Low-Income Borrowers
Moderate-Income
Borrowers
Middle-Income
Borrowers
Upper-Income
Borrowers
Market Share*
#
% of Total
**
% Families
***
% USB Loans
****
% Families
***
% USB Loans
****
% Families
***
% USB Loans
****
% Families
***
% USB Loans
****
Over-
all
Low
Mod
Mid
Upp
Full-Review:
Bismarck 22 23.91 17.38 13.64 18.54 27.27 27.27 50.00 36.81 9.09 4.61 3.33 6.00 8.25 0.95
Limited-Review:
ND nonMSA 70 76.09 15.66 10.00 17.30 17.14 24.90 25.71 42.14 47.14 5.57 8.57 5.88 5.49 5.08
Data shown includes only one to four-family and manufactured housing (property type of 1 or 2). * Based on 2011 Peer Mortgage Data (USPR). ** Home improvement loans originated and purchased in the MA/AA as a percentage of all home improvement loans originated and purchased in the rated area. *** Percentage of Families is based on the 2000 Census information. **** As a percentage of loans with borrower income information available. No information was available for 0.0% of loans originated and purchased by the bank.
Table 10. Borrower Distribution of Home Mortgage Refinance Loans Borrower Distribution: HOME MORTGAGE REFINANCE Geography: NORTH DAKOTA Evaluation Period: JANUARY 1, 2009 To DECEMBER 31, 2011
MA/Assessment Area:
Total Home Mortgage Refinance
Loans
Low-Income Borrowers
Moderate-Income Borrowers
Middle-Income Borrowers
Upper-Income Borrowers
Market Share*
#
% of Total
**
% Families
***
% USB Loans
****
% Families
***
% USB Loans
****
% Families
***
% USB Loans
****
% Families
***
% USB
Loans ****
Over-
all
Low
Mod
Mid
Upp
Full-Review:
Bismarck 458 44.90 17.38 10.55 18.54 20.14 27.27 31.18 36.81 38.13 4.96 4.88 4.60 5.51 4.76
Limited-Review:
ND nonMSA 562 55.10 15.66 5.18 17.30 15.77 24.90 31.32 42.14 47.73 8.55 8.26 7.08 11.67 7.32
Data shown includes only one to four-family and manufactured housing (property type 1 or 2). * Based on 2011 Peer Mortgage Data (USPR). ** Home refinance loans originated and purchased in the MA/AA as a percentage of all home refinance loans originated and purchased in the rated area. *** Percentage of Families is based on the 2000 Census information. **** As a percentage of loans with borrower income information available. No information was available for 13.7% of loans originated and purchased by the bank.

Charter Number 24
D - 240
Table 11. Borrower Distribution of Small Loans to Businesses
Borrower Distribution: SMALL LOANS TO BUSINESSES Geography: NORTH DAKOTA Evaluation Period: JANUARY 1, 2009 To DECEMBER 31, 2011
MA/Assessment Area:
Total Small Loans to
Businesses
Businesses With Revenues of $1 million or
less
Loans by Original Amount Regardless of Business Size
Market Share*
#
% of
Total**
% of Businesses
***
% USB
Loans****
$100,000 or
less
>$100,000 to $250,000
>$250,000 to $1,000,000
All
Rev $1 Million or
Less Full-Review:
Bismarck 1,344 41.38 70.11 51.41 95.31 1.71 2.98 29.20 28.94
Limited-Review:
ND nonMSA 1,904 58.62 70.32 45.12 97.95 1.16 0.89 22.45 18.96
* Based on 2011 Peer Small Business Data – US and PR. ** Small loans to businesses originated and purchased in the MA/AA as a percentage of all small loans to businesses originated and purchased in the rated area. *** Businesses with revenues of $1 million or less as a percentage of all businesses (Source Dun and Bradstreet - 2011). **** Small loans to businesses with revenues of $1 million or less as a percentage of all loans reported as small loans to businesses. No information was available for 36.1% of small loans to businesses originated and purchased by the bank.
Table 12. Borrower Distribution of Small Loans to Farms Borrower Distribution: SMALL LOANS TO FARMS Geography: NORTH DAKOTA Evaluation Period: JANUARY 1, 2009 To DECEMBER 31, 2011
MA/Assessment Area:
Total Small Loans to Farms
Farms With Revenues of $1 million or less
Loans by Original Amount Regardless of Farm Size
Market Share*
#
% of
Total**
% of
Farms***
% USB
Loans****
$100,000 or
less
>$100,000 to $250,000
>$250,000 to $500,000
All
Rev $1 Million or
Less Full-Review:
Bismarck 25 36.76 99.07 80.00 76.00 20.00 4.00 4.59 4.94
Limited-Review:
ND nonMSA 43 63.24 98.58 79.07 67.44 13.95 18.60 0.64 0.94
* Based on 2011 Peer Small Business Data – US and PR. ** Small loans to farms originated and purchased in the MA/AA as a percentage of all small loans to farms originated and purchased in the rated area. *** Farms with revenues of $1 million or less as a percentage of all farms (Source Dun and Bradstreet - 2011). **** Small loans to farms with revenues of $1 million or less as a percentage of all loans reported as small loans to farms. No information was available for 11.8% of small loans to farms originated and purchased by the bank.
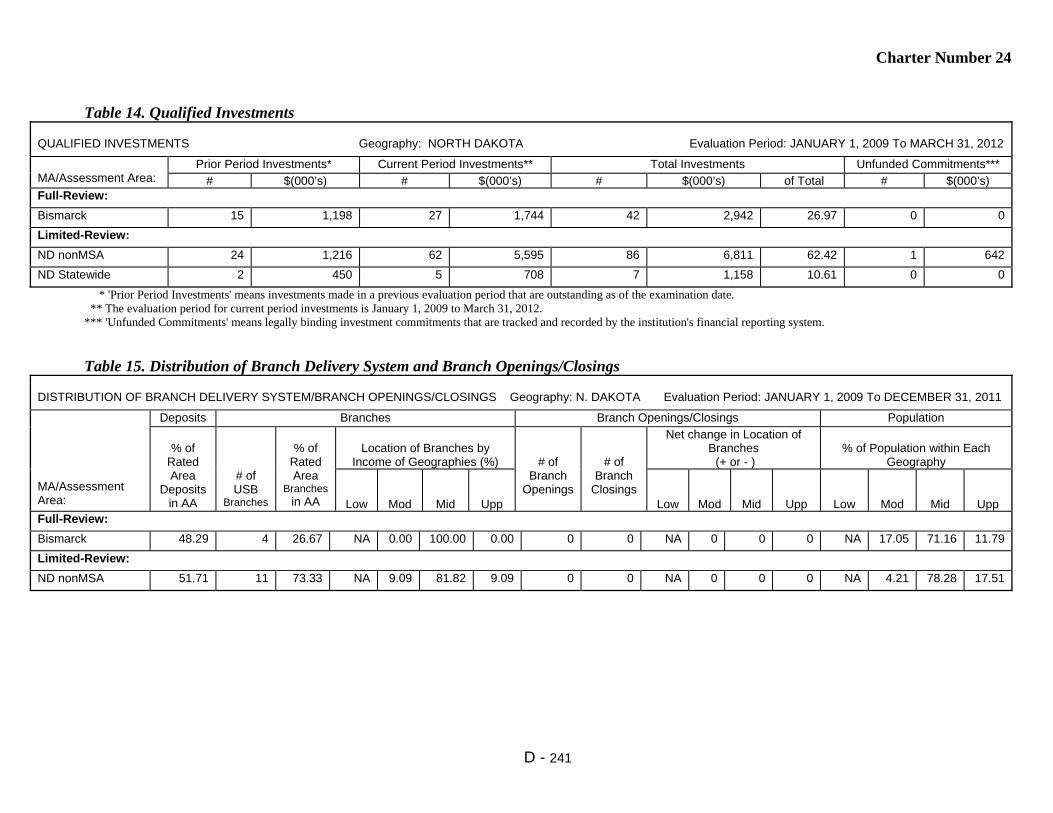
Charter Number 24
D - 241
Table 14. Qualified Investments
QUALIFIED INVESTMENTS Geography: NORTH DAKOTA Evaluation Period: JANUARY 1, 2009 To MARCH 31, 2012
MA/Assessment Area:
Prior Period Investments* Current Period Investments** Total Investments Unfunded Commitments***
# $(000’s) # $(000’s) # $(000’s) of Total # $(000’s) Full-Review:
Bismarck 15 1,198 27 1,744 42 2,942 26.97 0 0
Limited-Review:
ND nonMSA 24 1,216 62 5,595 86 6,811 62.42 1 642
ND Statewide 2 450 5 708 7 1,158 10.61 0 0
* 'Prior Period Investments' means investments made in a previous evaluation period that are outstanding as of the examination date. ** The evaluation period for current period investments is January 1, 2009 to March 31, 2012. *** 'Unfunded Commitments' means legally binding investment commitments that are tracked and recorded by the institution's financial reporting system.
Table 15. Distribution of Branch Delivery System and Branch Openings/Closings DISTRIBUTION OF BRANCH DELIVERY SYSTEM/BRANCH OPENINGS/CLOSINGS Geography: N. DAKOTA Evaluation Period: JANUARY 1, 2009 To DECEMBER 31, 2011
MA/Assessment Area:
Deposits Branches Branch Openings/Closings Population
% of
Rated Area
Deposits in AA
# of USB
Branches
% of
Rated Area
Branches in AA
Location of Branches by
Income of Geographies (%)
# of Branch
Openings
# of Branch
Closings
Net change in Location of Branches (+ or - )
% of Population within Each
Geography
Low
Mod
Mid
Upp
Low
Mod
Mid
Upp
Low
Mod
Mid
Upp
Full-Review:
Bismarck 48.29 4 26.67 NA 0.00 100.00 0.00 0 0 NA 0 0 0 NA 17.05 71.16 11.79
Limited-Review:
ND nonMSA 51.71 11 73.33 NA 9.09 81.82 9.09 0 0 NA 0 0 0 NA 4.21 78.28 17.51
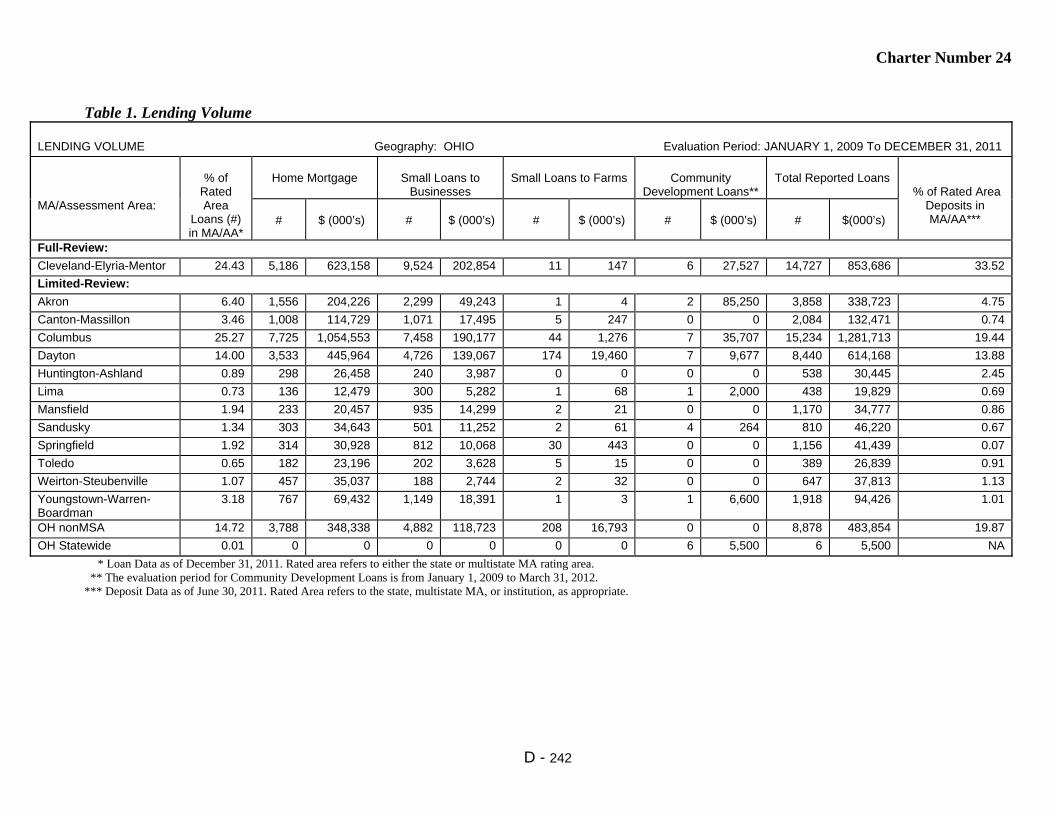
Charter Number 24
D - 242
Table 1. Lending Volume
LENDING VOLUME Geography: OHIO Evaluation Period: JANUARY 1, 2009 To DECEMBER 31, 2011
MA/Assessment Area:
% of
Rated Area
Loans (#) in MA/AA*
Home Mortgage
Small Loans to
Businesses
Small Loans to Farms
Community
Development Loans**
Total Reported Loans
% of Rated Area Deposits in MA/AA***
#
$ (000’s)
#
$ (000’s)
#
$ (000’s)
#
$ (000’s)
#
$(000’s)
Full-Review:
Cleveland-Elyria-Mentor 24.43 5,186 623,158 9,524 202,854 11 147 6 27,527 14,727 853,686 33.52
Limited-Review:
Akron 6.40 1,556 204,226 2,299 49,243 1 4 2 85,250 3,858 338,723 4.75
Canton-Massillon 3.46 1,008 114,729 1,071 17,495 5 247 0 0 2,084 132,471 0.74
Columbus 25.27 7,725 1,054,553 7,458 190,177 44 1,276 7 35,707 15,234 1,281,713 19.44
Dayton 14.00 3,533 445,964 4,726 139,067 174 19,460 7 9,677 8,440 614,168 13.88
Huntington-Ashland 0.89 298 26,458 240 3,987 0 0 0 0 538 30,445 2.45
Lima 0.73 136 12,479 300 5,282 1 68 1 2,000 438 19,829 0.69
Mansfield 1.94 233 20,457 935 14,299 2 21 0 0 1,170 34,777 0.86
Sandusky 1.34 303 34,643 501 11,252 2 61 4 264 810 46,220 0.67
Springfield 1.92 314 30,928 812 10,068 30 443 0 0 1,156 41,439 0.07
Toledo 0.65 182 23,196 202 3,628 5 15 0 0 389 26,839 0.91
Weirton-Steubenville 1.07 457 35,037 188 2,744 2 32 0 0 647 37,813 1.13
Youngstown-Warren- Boardman
3.18 767 69,432 1,149 18,391 1 3 1 6,600 1,918 94,426 1.01
OH nonMSA 14.72 3,788 348,338 4,882 118,723 208 16,793 0 0 8,878 483,854 19.87
OH Statewide 0.01 0 0 0 0 0 0 6 5,500 6 5,500 NA
* Loan Data as of December 31, 2011. Rated area refers to either the state or multistate MA rating area. ** The evaluation period for Community Development Loans is from January 1, 2009 to March 31, 2012. *** Deposit Data as of June 30, 2011. Rated Area refers to the state, multistate MA, or institution, as appropriate.
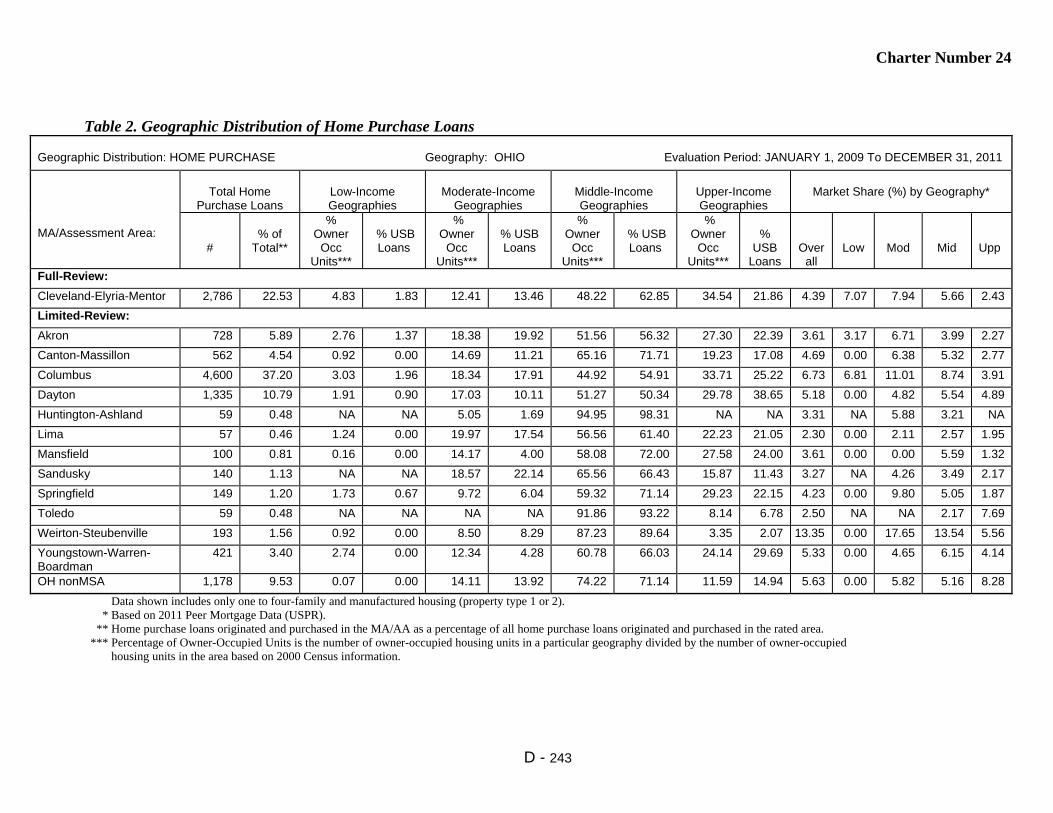
Charter Number 24
D - 243
Table 2. Geographic Distribution of Home Purchase Loans
Geographic Distribution: HOME PURCHASE Geography: OHIO Evaluation Period: JANUARY 1, 2009 To DECEMBER 31, 2011
MA/Assessment Area:
Total Home
Purchase Loans
Low-Income Geographies
Moderate-Income
Geographies
Middle-Income Geographies
Upper-Income Geographies
Market Share (%) by Geography*
#
% of
Total**
% Owner
Occ Units***
% USB Loans
% Owner
Occ Units***
% USB Loans
% Owner
Occ Units***
% USB Loans
% Owner
Occ Units***
%
USB Loans
Over
all
Low
Mod
Mid
Upp
Full-Review:
Cleveland-Elyria-Mentor 2,786 22.53 4.83 1.83 12.41 13.46 48.22 62.85 34.54 21.86 4.39 7.07 7.94 5.66 2.43
Limited-Review:
Akron 728 5.89 2.76 1.37 18.38 19.92 51.56 56.32 27.30 22.39 3.61 3.17 6.71 3.99 2.27
Canton-Massillon 562 4.54 0.92 0.00 14.69 11.21 65.16 71.71 19.23 17.08 4.69 0.00 6.38 5.32 2.77
Columbus 4,600 37.20 3.03 1.96 18.34 17.91 44.92 54.91 33.71 25.22 6.73 6.81 11.01 8.74 3.91
Dayton 1,335 10.79 1.91 0.90 17.03 10.11 51.27 50.34 29.78 38.65 5.18 0.00 4.82 5.54 4.89
Huntington-Ashland 59 0.48 NA NA 5.05 1.69 94.95 98.31 NA NA 3.31 NA 5.88 3.21 NA
Lima 57 0.46 1.24 0.00 19.97 17.54 56.56 61.40 22.23 21.05 2.30 0.00 2.11 2.57 1.95
Mansfield 100 0.81 0.16 0.00 14.17 4.00 58.08 72.00 27.58 24.00 3.61 0.00 0.00 5.59 1.32
Sandusky 140 1.13 NA NA 18.57 22.14 65.56 66.43 15.87 11.43 3.27 NA 4.26 3.49 2.17
Springfield 149 1.20 1.73 0.67 9.72 6.04 59.32 71.14 29.23 22.15 4.23 0.00 9.80 5.05 1.87
Toledo 59 0.48 NA NA NA NA 91.86 93.22 8.14 6.78 2.50 NA NA 2.17 7.69
Weirton-Steubenville 193 1.56 0.92 0.00 8.50 8.29 87.23 89.64 3.35 2.07 13.35 0.00 17.65 13.54 5.56
Youngstown-Warren- Boardman
421 3.40 2.74 0.00 12.34 4.28 60.78 66.03 24.14 29.69 5.33 0.00 4.65 6.15 4.14
OH nonMSA 1,178 9.53 0.07 0.00 14.11 13.92 74.22 71.14 11.59 14.94 5.63 0.00 5.82 5.16 8.28
Data shown includes only one to four-family and manufactured housing (property type 1 or 2). * Based on 2011 Peer Mortgage Data (USPR). ** Home purchase loans originated and purchased in the MA/AA as a percentage of all home purchase loans originated and purchased in the rated area. *** Percentage of Owner-Occupied Units is the number of owner-occupied housing units in a particular geography divided by the number of owner-occupied housing units in the area based on 2000 Census information.
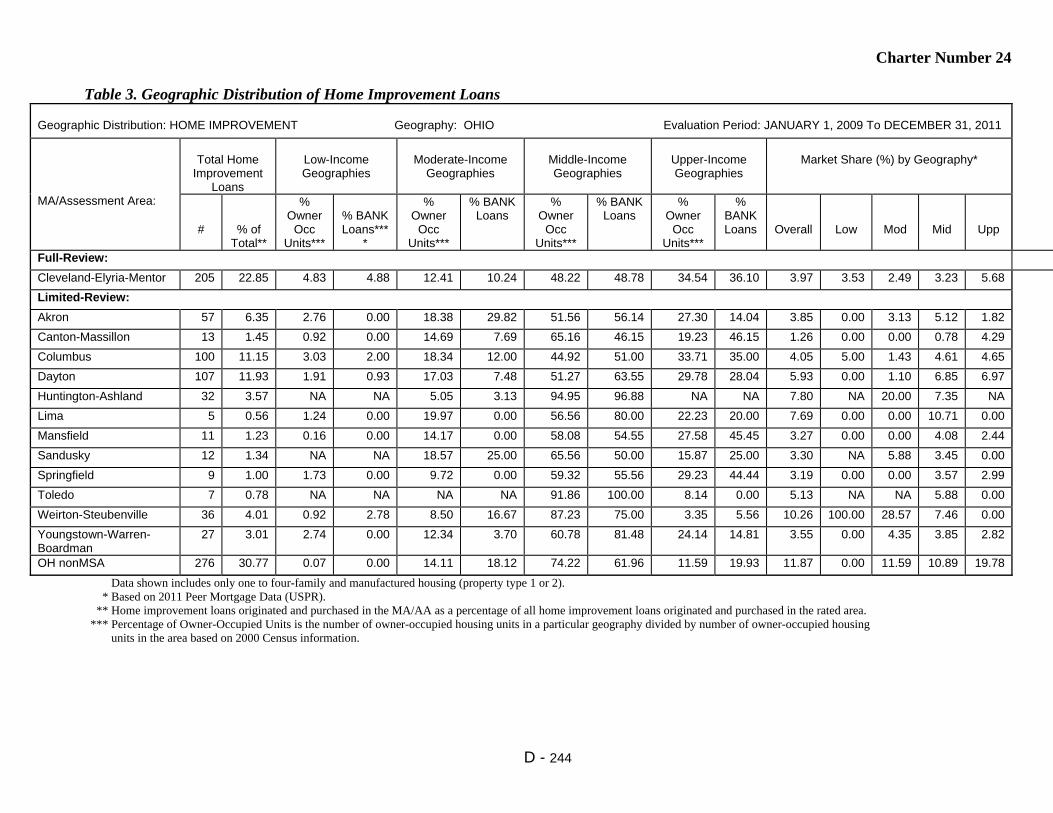
Charter Number 24
D - 244
Table 3. Geographic Distribution of Home Improvement Loans
Geographic Distribution: HOME IMPROVEMENT Geography: OHIO Evaluation Period: JANUARY 1, 2009 To DECEMBER 31, 2011
MA/Assessment Area:
Total Home
Improvement Loans
Low-Income Geographies
Moderate-Income
Geographies
Middle-Income Geographies
Upper-Income Geographies
Market Share (%) by Geography*
# % of
Total**
% Owner
Occ Units***
% BANK Loans***
*
% Owner
Occ Units***
% BANK Loans
% Owner
Occ Units***
% BANK Loans
% Owner
Occ Units***
% BANK Loans
Overall
Low
Mod
Mid
Upp
Full-Review: Cleveland-Elyria-Mentor 205 22.85 4.83 4.88 12.41 10.24 48.22 48.78 34.54 36.10 3.97 3.53 2.49 3.23 5.68
Limited-Review:
Akron 57 6.35 2.76 0.00 18.38 29.82 51.56 56.14 27.30 14.04 3.85 0.00 3.13 5.12 1.82
Canton-Massillon 13 1.45 0.92 0.00 14.69 7.69 65.16 46.15 19.23 46.15 1.26 0.00 0.00 0.78 4.29
Columbus 100 11.15 3.03 2.00 18.34 12.00 44.92 51.00 33.71 35.00 4.05 5.00 1.43 4.61 4.65
Dayton 107 11.93 1.91 0.93 17.03 7.48 51.27 63.55 29.78 28.04 5.93 0.00 1.10 6.85 6.97
Huntington-Ashland 32 3.57 NA NA 5.05 3.13 94.95 96.88 NA NA 7.80 NA 20.00 7.35 NA
Lima 5 0.56 1.24 0.00 19.97 0.00 56.56 80.00 22.23 20.00 7.69 0.00 0.00 10.71 0.00
Mansfield 11 1.23 0.16 0.00 14.17 0.00 58.08 54.55 27.58 45.45 3.27 0.00 0.00 4.08 2.44
Sandusky 12 1.34 NA NA 18.57 25.00 65.56 50.00 15.87 25.00 3.30 NA 5.88 3.45 0.00
Springfield 9 1.00 1.73 0.00 9.72 0.00 59.32 55.56 29.23 44.44 3.19 0.00 0.00 3.57 2.99
Toledo 7 0.78 NA NA NA NA 91.86 100.00 8.14 0.00 5.13 NA NA 5.88 0.00
Weirton-Steubenville 36 4.01 0.92 2.78 8.50 16.67 87.23 75.00 3.35 5.56 10.26 100.00 28.57 7.46 0.00
Youngstown-Warren- Boardman
27 3.01 2.74 0.00 12.34 3.70 60.78 81.48 24.14 14.81 3.55 0.00 4.35 3.85 2.82
OH nonMSA 276 30.77 0.07 0.00 14.11 18.12 74.22 61.96 11.59 19.93 11.87 0.00 11.59 10.89 19.78
Data shown includes only one to four-family and manufactured housing (property type 1 or 2). * Based on 2011 Peer Mortgage Data (USPR). ** Home improvement loans originated and purchased in the MA/AA as a percentage of all home improvement loans originated and purchased in the rated area. *** Percentage of Owner-Occupied Units is the number of owner-occupied housing units in a particular geography divided by number of owner-occupied housing units in the area based on 2000 Census information.
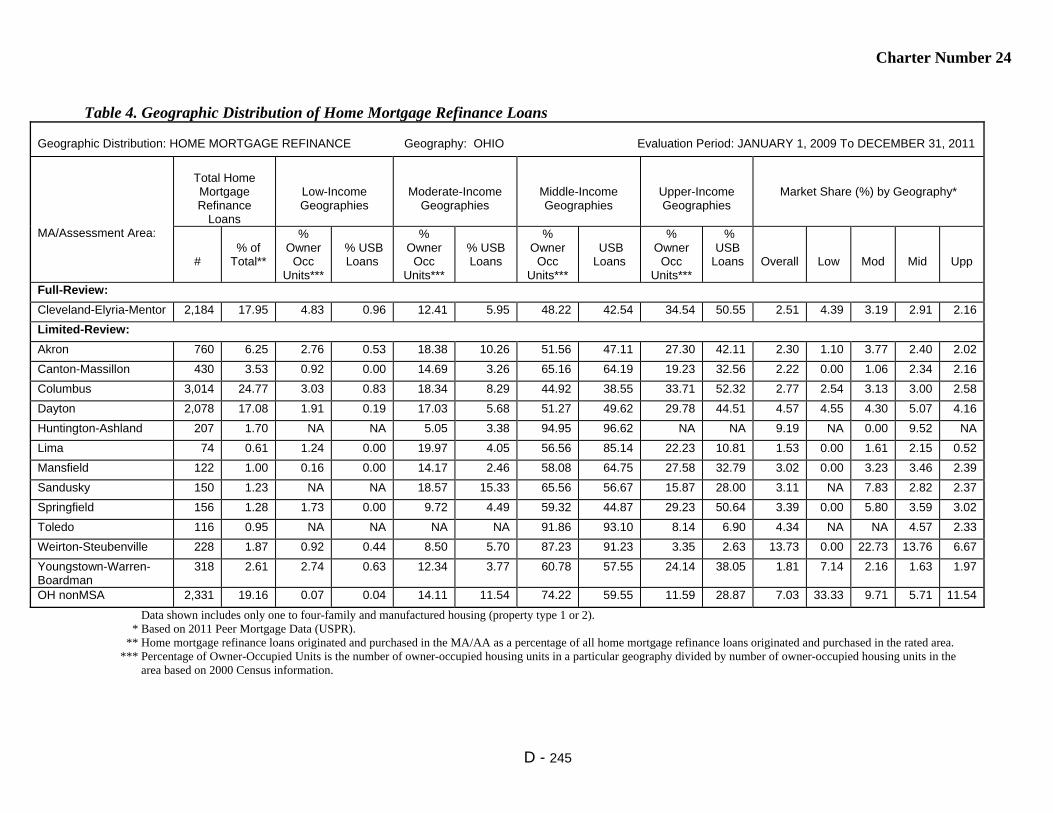
Charter Number 24
D - 245
Table 4. Geographic Distribution of Home Mortgage Refinance Loans
Geographic Distribution: HOME MORTGAGE REFINANCE Geography: OHIO Evaluation Period: JANUARY 1, 2009 To DECEMBER 31, 2011
MA/Assessment Area:
Total Home Mortgage Refinance
Loans
Low-Income Geographies
Moderate-Income Geographies
Middle-Income Geographies
Upper-Income Geographies
Market Share (%) by Geography*
#
% of
Total**
% Owner
Occ Units***
% USB Loans
% Owner
Occ Units***
% USB Loans
% Owner
Occ Units***
USB Loans
% Owner
Occ Units***
% USB
Loans
Overall
Low
Mod
Mid
Upp
Full-Review:
Cleveland-Elyria-Mentor 2,184 17.95 4.83 0.96 12.41 5.95 48.22 42.54 34.54 50.55 2.51 4.39 3.19 2.91 2.16
Limited-Review:
Akron 760 6.25 2.76 0.53 18.38 10.26 51.56 47.11 27.30 42.11 2.30 1.10 3.77 2.40 2.02
Canton-Massillon 430 3.53 0.92 0.00 14.69 3.26 65.16 64.19 19.23 32.56 2.22 0.00 1.06 2.34 2.16
Columbus 3,014 24.77 3.03 0.83 18.34 8.29 44.92 38.55 33.71 52.32 2.77 2.54 3.13 3.00 2.58
Dayton 2,078 17.08 1.91 0.19 17.03 5.68 51.27 49.62 29.78 44.51 4.57 4.55 4.30 5.07 4.16
Huntington-Ashland 207 1.70 NA NA 5.05 3.38 94.95 96.62 NA NA 9.19 NA 0.00 9.52 NA
Lima 74 0.61 1.24 0.00 19.97 4.05 56.56 85.14 22.23 10.81 1.53 0.00 1.61 2.15 0.52
Mansfield 122 1.00 0.16 0.00 14.17 2.46 58.08 64.75 27.58 32.79 3.02 0.00 3.23 3.46 2.39
Sandusky 150 1.23 NA NA 18.57 15.33 65.56 56.67 15.87 28.00 3.11 NA 7.83 2.82 2.37
Springfield 156 1.28 1.73 0.00 9.72 4.49 59.32 44.87 29.23 50.64 3.39 0.00 5.80 3.59 3.02
Toledo 116 0.95 NA NA NA NA 91.86 93.10 8.14 6.90 4.34 NA NA 4.57 2.33
Weirton-Steubenville 228 1.87 0.92 0.44 8.50 5.70 87.23 91.23 3.35 2.63 13.73 0.00 22.73 13.76 6.67
Youngstown-Warren- Boardman
318 2.61 2.74 0.63 12.34 3.77 60.78 57.55 24.14 38.05 1.81 7.14 2.16 1.63 1.97
OH nonMSA 2,331 19.16 0.07 0.04 14.11 11.54 74.22 59.55 11.59 28.87 7.03 33.33 9.71 5.71 11.54
Data shown includes only one to four-family and manufactured housing (property type 1 or 2). * Based on 2011 Peer Mortgage Data (USPR). ** Home mortgage refinance loans originated and purchased in the MA/AA as a percentage of all home mortgage refinance loans originated and purchased in the rated area. *** Percentage of Owner-Occupied Units is the number of owner-occupied housing units in a particular geography divided by number of owner-occupied housing units in the area based on 2000 Census information.

Charter Number 24
D - 246
Table 5. Geographic Distribution of Multifamily Loans
Geographic Distribution: MULTIFAMILY Geography: OHIO Evaluation Period: JANUARY 1, 2009 To DECEMBER 31, 2011
MA/Assessment Area:
Total Multifamily
Loans
Low-Income Geographies
Moderate-Income
Geographies
Middle-Income Geographies
Upper-Income Geographies
Market Share (%) by Geography*
#
% of Total**
% of MF Units***
% USB Loans
% MF Units***
% USB Loans
% MF Units***
% USB Loans
% MF Units***
% USB Loans
Overall
Low
Mod
Mid
Upp
Full-Review:
Cleveland-Elyria- Mentor
11 20.37 12.81 27.27 25.25 18.18 44.28 18.18 17.65 36.36 2.60 16.67 5.56 0.00 0.00
Limited-Review:
Akron 11 20.37 12.03 18.18 24.76 45.45 44.88 36.36 18.33 0.00 18.92 33.33 66.67 9.52 0.00
Canton-Massillon 3 5.56 6.01 0.00 15.88 0.00 49.84 33.33 28.27 66.67 8.33 0.00 0.00 0.00 20.00
Columbus 11 20.37 12.38 27.27 32.01 9.09 34.58 27.27 21.03 36.36 1.46 0.00 0.00 3.13 1.92
Dayton 13 24.07 8.55 0.00 21.41 15.38 48.98 84.62 21.05 0.00 12.50 0.00 28.57 9.09 0.00
Huntington- Ashland
0 0.00 NA NA 25.55 0.00 74.45 0.00 NA NA 0.00 NA 0.00 0.00 NA
Lima 0 0.00 10.31 0.00 43.37 0.00 37.90 0.00 8.43 0.00 0.00 0.00 0.00 0.00 0.00
Mansfield 0 0.00 1.06 0.00 25.75 0.00 53.27 0.00 19.92 0.00 0.00 0.00 0.00 0.00 0.00
Sandusky 1 1.85 NA NA 31.32 100.00 48.15 0.00 20.53 0.00 0.00 NA 0.00 0.00 0.00
Springfield 0 0.00 4.16 0.00 21.72 0.00 70.62 0.00 3.49 0.00 0.00 0.00 0.00 0.00 0.00
Toledo 0 0.00 NA NA NA NA 100.00 NA 0.00 NA 0.00 NA NA 0.00 0.00
Weirton- Steubenville
0 0.00 1.32 0.00 49.89 0.00 41.78 0.00 7.01 0.00 0.00 0.00 0.00 0.00 0.00
Youngstown- Warren-Boardman
1 1.85 7.90 0.00 14.86 0.00 59.75 100.00 17.50 0.00 7.14 0.00 0.00 14.29 0.00
OH nonMSA 3 5.56 2.71 0.00 19.51 33.33 70.05 33.33 7.72 33.33 3.33 0.00 0.00 5.56 0.00
Multifamily loan distribution includes Home Purchases, Home Improvement and Refinances. * Based on 2011 Peer Mortgage Data (USPR). ** Multifamily loans originated and purchased in the MA/AA as a percentage of all multifamily loans originated and purchased in the rated area. *** Percentage of multifamily units is the number of multifamily housing units in a particular geography divided by number of multifamily housing units in the area based on 2000 Census information.
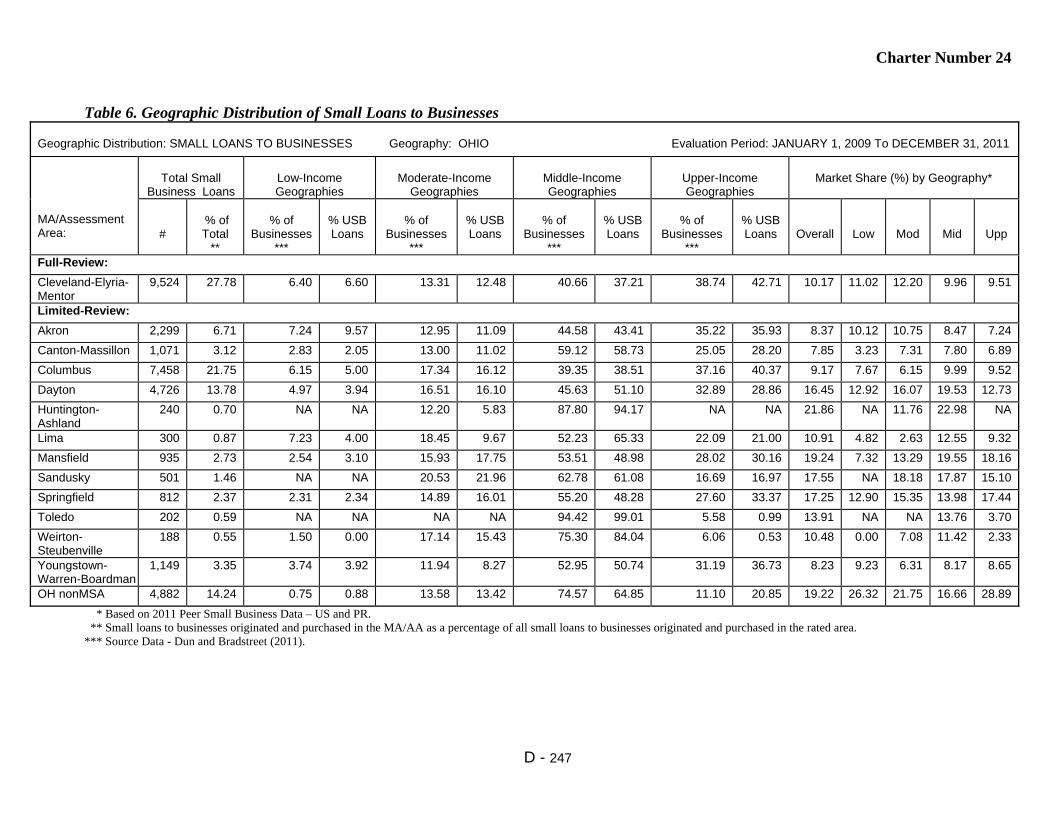
Charter Number 24
D - 247
Table 6. Geographic Distribution of Small Loans to Businesses
Geographic Distribution: SMALL LOANS TO BUSINESSES Geography: OHIO Evaluation Period: JANUARY 1, 2009 To DECEMBER 31, 2011
MA/Assessment Area:
Total Small
Business Loans
Low-Income Geographies
Moderate-Income
Geographies
Middle-Income Geographies
Upper-Income Geographies
Market Share (%) by Geography*
#
% of Total
**
% of
Businesses ***
% USB Loans
% of
Businesses ***
% USB Loans
% of
Businesses ***
% USB Loans
% of
Businesses ***
% USB Loans
Overall
Low
Mod
Mid
Upp
Full-Review:
Cleveland-Elyria- Mentor
9,524 27.78 6.40 6.60 13.31 12.48 40.66 37.21 38.74 42.71 10.17 11.02 12.20 9.96 9.51
Limited-Review:
Akron 2,299 6.71 7.24 9.57 12.95 11.09 44.58 43.41 35.22 35.93 8.37 10.12 10.75 8.47 7.24
Canton-Massillon 1,071 3.12 2.83 2.05 13.00 11.02 59.12 58.73 25.05 28.20 7.85 3.23 7.31 7.80 6.89
Columbus 7,458 21.75 6.15 5.00 17.34 16.12 39.35 38.51 37.16 40.37 9.17 7.67 6.15 9.99 9.52
Dayton 4,726 13.78 4.97 3.94 16.51 16.10 45.63 51.10 32.89 28.86 16.45 12.92 16.07 19.53 12.73
Huntington- Ashland
240 0.70 NA NA 12.20 5.83 87.80 94.17 NA NA 21.86 NA 11.76 22.98 NA
Lima 300 0.87 7.23 4.00 18.45 9.67 52.23 65.33 22.09 21.00 10.91 4.82 2.63 12.55 9.32
Mansfield 935 2.73 2.54 3.10 15.93 17.75 53.51 48.98 28.02 30.16 19.24 7.32 13.29 19.55 18.16
Sandusky 501 1.46 NA NA 20.53 21.96 62.78 61.08 16.69 16.97 17.55 NA 18.18 17.87 15.10
Springfield 812 2.37 2.31 2.34 14.89 16.01 55.20 48.28 27.60 33.37 17.25 12.90 15.35 13.98 17.44
Toledo 202 0.59 NA NA NA NA 94.42 99.01 5.58 0.99 13.91 NA NA 13.76 3.70
Weirton- Steubenville
188 0.55 1.50 0.00 17.14 15.43 75.30 84.04 6.06 0.53 10.48 0.00 7.08 11.42 2.33
Youngstown- Warren-Boardman
1,149 3.35 3.74 3.92 11.94 8.27 52.95 50.74 31.19 36.73 8.23 9.23 6.31 8.17 8.65
OH nonMSA 4,882 14.24 0.75 0.88 13.58 13.42 74.57 64.85 11.10 20.85 19.22 26.32 21.75 16.66 28.89
* Based on 2011 Peer Small Business Data – US and PR. ** Small loans to businesses originated and purchased in the MA/AA as a percentage of all small loans to businesses originated and purchased in the rated area. *** Source Data - Dun and Bradstreet (2011).
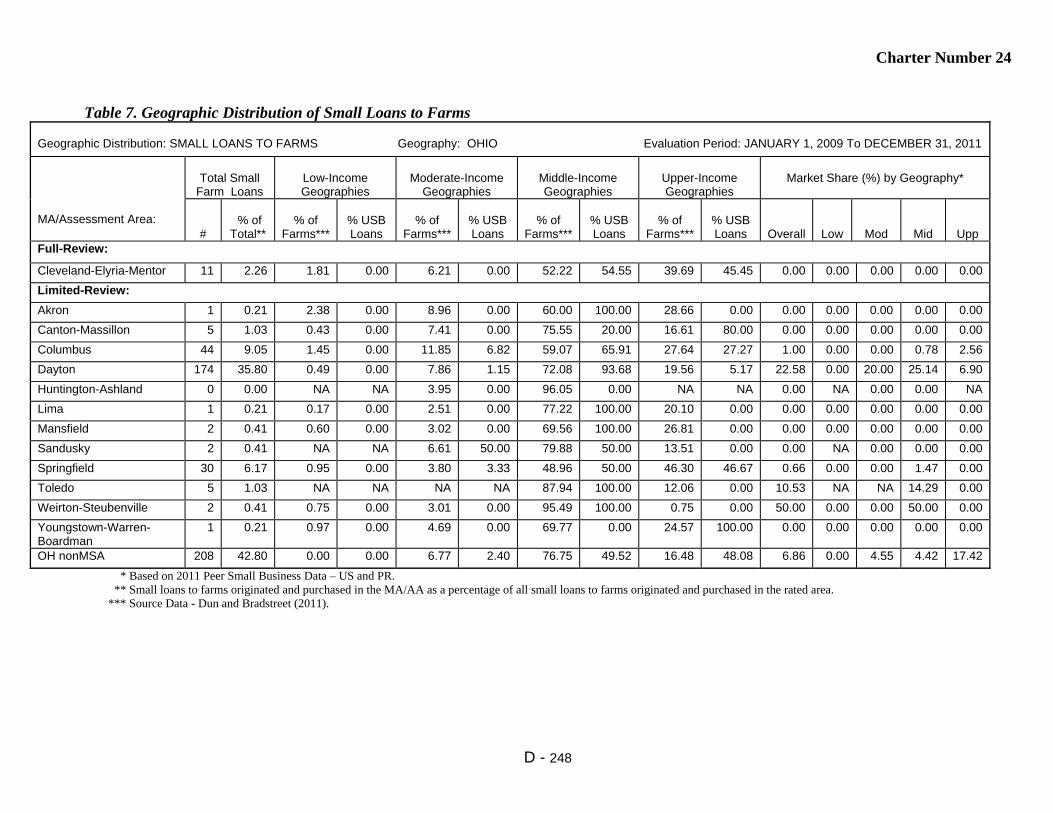
Charter Number 24
D - 248
Table 7. Geographic Distribution of Small Loans to Farms
Geographic Distribution: SMALL LOANS TO FARMS Geography: OHIO Evaluation Period: JANUARY 1, 2009 To DECEMBER 31, 2011
MA/Assessment Area:
Total Small
Farm Loans
Low-Income Geographies
Moderate-Income
Geographies
Middle-Income Geographies
Upper-Income Geographies
Market Share (%) by Geography*
#
% of
Total**
% of
Farms***
% USB Loans
% of
Farms***
% USB Loans
% of
Farms***
% USB Loans
% of
Farms***
% USB Loans
Overall
Low
Mod
Mid
Upp
Full-Review:
Cleveland-Elyria-Mentor 11 2.26 1.81 0.00 6.21 0.00 52.22 54.55 39.69 45.45 0.00 0.00 0.00 0.00 0.00
Limited-Review:
Akron 1 0.21 2.38 0.00 8.96 0.00 60.00 100.00 28.66 0.00 0.00 0.00 0.00 0.00 0.00
Canton-Massillon 5 1.03 0.43 0.00 7.41 0.00 75.55 20.00 16.61 80.00 0.00 0.00 0.00 0.00 0.00
Columbus 44 9.05 1.45 0.00 11.85 6.82 59.07 65.91 27.64 27.27 1.00 0.00 0.00 0.78 2.56
Dayton 174 35.80 0.49 0.00 7.86 1.15 72.08 93.68 19.56 5.17 22.58 0.00 20.00 25.14 6.90
Huntington-Ashland 0 0.00 NA NA 3.95 0.00 96.05 0.00 NA NA 0.00 NA 0.00 0.00 NA
Lima 1 0.21 0.17 0.00 2.51 0.00 77.22 100.00 20.10 0.00 0.00 0.00 0.00 0.00 0.00
Mansfield 2 0.41 0.60 0.00 3.02 0.00 69.56 100.00 26.81 0.00 0.00 0.00 0.00 0.00 0.00
Sandusky 2 0.41 NA NA 6.61 50.00 79.88 50.00 13.51 0.00 0.00 NA 0.00 0.00 0.00
Springfield 30 6.17 0.95 0.00 3.80 3.33 48.96 50.00 46.30 46.67 0.66 0.00 0.00 1.47 0.00
Toledo 5 1.03 NA NA NA NA 87.94 100.00 12.06 0.00 10.53 NA NA 14.29 0.00
Weirton-Steubenville 2 0.41 0.75 0.00 3.01 0.00 95.49 100.00 0.75 0.00 50.00 0.00 0.00 50.00 0.00
Youngstown-Warren- Boardman
1 0.21 0.97 0.00 4.69 0.00 69.77 0.00 24.57 100.00 0.00 0.00 0.00 0.00 0.00
OH nonMSA 208 42.80 0.00 0.00 6.77 2.40 76.75 49.52 16.48 48.08 6.86 0.00 4.55 4.42 17.42
* Based on 2011 Peer Small Business Data – US and PR. ** Small loans to farms originated and purchased in the MA/AA as a percentage of all small loans to farms originated and purchased in the rated area. *** Source Data - Dun and Bradstreet (2011).
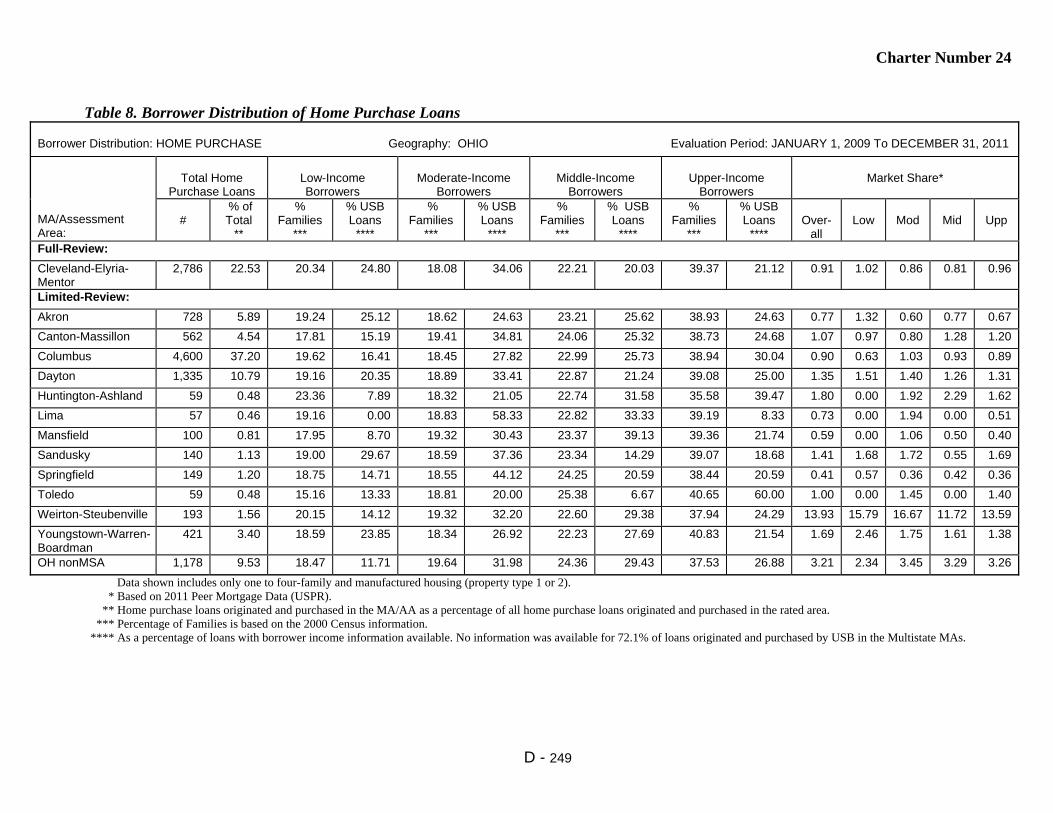
Charter Number 24
D - 249
Table 8. Borrower Distribution of Home Purchase Loans
Borrower Distribution: HOME PURCHASE Geography: OHIO Evaluation Period: JANUARY 1, 2009 To DECEMBER 31, 2011
MA/Assessment Area:
Total Home
Purchase Loans
Low-Income Borrowers
Moderate-Income
Borrowers
Middle-Income
Borrowers
Upper-Income
Borrowers
Market Share*
#
% of Total
**
% Families
***
% USB Loans
****
% Families
***
% USB Loans
****
% Families
***
% USB Loans
****
% Families
***
% USB Loans
****
Over-
all
Low
Mod
Mid
Upp
Full-Review:
Cleveland-Elyria- Mentor
2,786 22.53 20.34 24.80 18.08 34.06 22.21 20.03 39.37 21.12 0.91 1.02 0.86 0.81 0.96
Limited-Review:
Akron 728 5.89 19.24 25.12 18.62 24.63 23.21 25.62 38.93 24.63 0.77 1.32 0.60 0.77 0.67
Canton-Massillon 562 4.54 17.81 15.19 19.41 34.81 24.06 25.32 38.73 24.68 1.07 0.97 0.80 1.28 1.20
Columbus 4,600 37.20 19.62 16.41 18.45 27.82 22.99 25.73 38.94 30.04 0.90 0.63 1.03 0.93 0.89
Dayton 1,335 10.79 19.16 20.35 18.89 33.41 22.87 21.24 39.08 25.00 1.35 1.51 1.40 1.26 1.31
Huntington-Ashland 59 0.48 23.36 7.89 18.32 21.05 22.74 31.58 35.58 39.47 1.80 0.00 1.92 2.29 1.62
Lima 57 0.46 19.16 0.00 18.83 58.33 22.82 33.33 39.19 8.33 0.73 0.00 1.94 0.00 0.51
Mansfield 100 0.81 17.95 8.70 19.32 30.43 23.37 39.13 39.36 21.74 0.59 0.00 1.06 0.50 0.40
Sandusky 140 1.13 19.00 29.67 18.59 37.36 23.34 14.29 39.07 18.68 1.41 1.68 1.72 0.55 1.69
Springfield 149 1.20 18.75 14.71 18.55 44.12 24.25 20.59 38.44 20.59 0.41 0.57 0.36 0.42 0.36
Toledo 59 0.48 15.16 13.33 18.81 20.00 25.38 6.67 40.65 60.00 1.00 0.00 1.45 0.00 1.40
Weirton-Steubenville 193 1.56 20.15 14.12 19.32 32.20 22.60 29.38 37.94 24.29 13.93 15.79 16.67 11.72 13.59
Youngstown-Warren-Boardman
421 3.40 18.59 23.85 18.34 26.92 22.23 27.69 40.83 21.54 1.69 2.46 1.75 1.61 1.38
OH nonMSA 1,178 9.53 18.47 11.71 19.64 31.98 24.36 29.43 37.53 26.88 3.21 2.34 3.45 3.29 3.26
Data shown includes only one to four-family and manufactured housing (property type 1 or 2). * Based on 2011 Peer Mortgage Data (USPR). ** Home purchase loans originated and purchased in the MA/AA as a percentage of all home purchase loans originated and purchased in the rated area. *** Percentage of Families is based on the 2000 Census information. **** As a percentage of loans with borrower income information available. No information was available for 72.1% of loans originated and purchased by USB in the Multistate MAs.
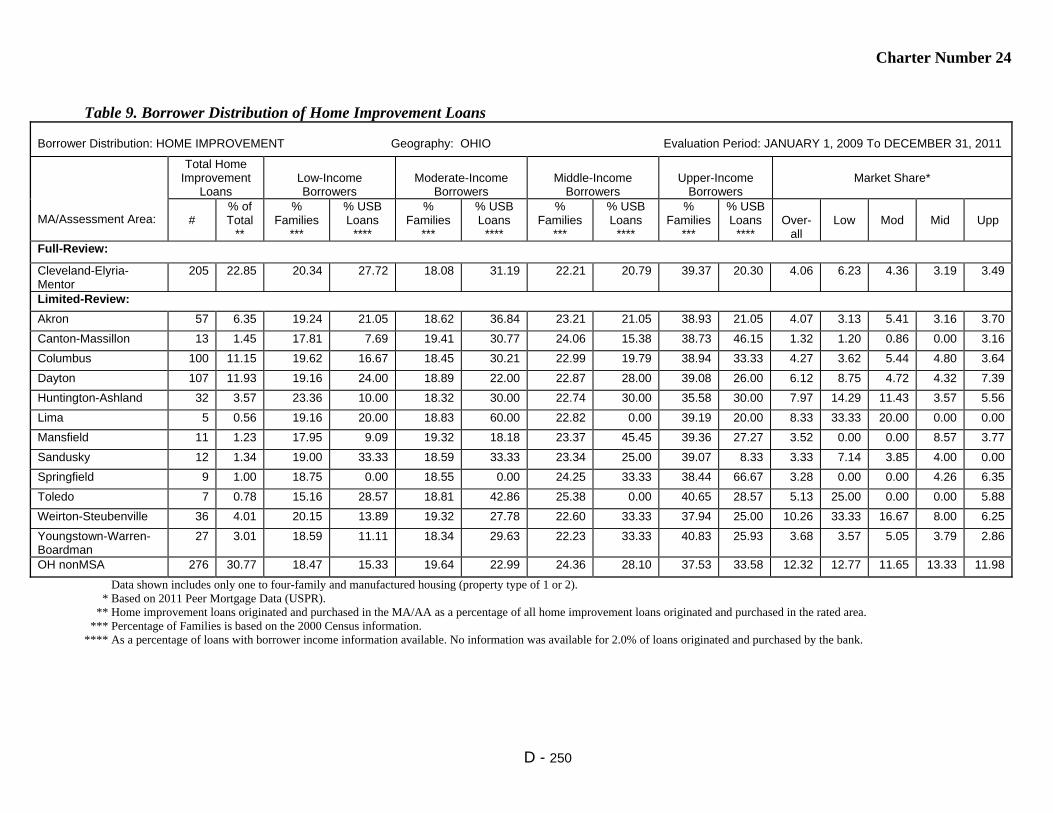
Charter Number 24
D - 250
Table 9. Borrower Distribution of Home Improvement Loans
Borrower Distribution: HOME IMPROVEMENT Geography: OHIO Evaluation Period: JANUARY 1, 2009 To DECEMBER 31, 2011
MA/Assessment Area:
Total Home Improvement
Loans
Low-Income Borrowers
Moderate-Income
Borrowers
Middle-Income
Borrowers
Upper-Income
Borrowers
Market Share*
#
% of Total
**
% Families
***
% USB Loans
****
% Families
***
% USB Loans
****
% Families
***
% USB Loans
****
% Families
***
% USB Loans
****
Over-
all
Low
Mod
Mid
Upp
Full-Review:
Cleveland-Elyria- Mentor
205 22.85 20.34 27.72 18.08 31.19 22.21 20.79 39.37 20.30 4.06 6.23 4.36 3.19 3.49
Limited-Review:
Akron 57 6.35 19.24 21.05 18.62 36.84 23.21 21.05 38.93 21.05 4.07 3.13 5.41 3.16 3.70
Canton-Massillon 13 1.45 17.81 7.69 19.41 30.77 24.06 15.38 38.73 46.15 1.32 1.20 0.86 0.00 3.16
Columbus 100 11.15 19.62 16.67 18.45 30.21 22.99 19.79 38.94 33.33 4.27 3.62 5.44 4.80 3.64
Dayton 107 11.93 19.16 24.00 18.89 22.00 22.87 28.00 39.08 26.00 6.12 8.75 4.72 4.32 7.39
Huntington-Ashland 32 3.57 23.36 10.00 18.32 30.00 22.74 30.00 35.58 30.00 7.97 14.29 11.43 3.57 5.56
Lima 5 0.56 19.16 20.00 18.83 60.00 22.82 0.00 39.19 20.00 8.33 33.33 20.00 0.00 0.00
Mansfield 11 1.23 17.95 9.09 19.32 18.18 23.37 45.45 39.36 27.27 3.52 0.00 0.00 8.57 3.77
Sandusky 12 1.34 19.00 33.33 18.59 33.33 23.34 25.00 39.07 8.33 3.33 7.14 3.85 4.00 0.00
Springfield 9 1.00 18.75 0.00 18.55 0.00 24.25 33.33 38.44 66.67 3.28 0.00 0.00 4.26 6.35
Toledo 7 0.78 15.16 28.57 18.81 42.86 25.38 0.00 40.65 28.57 5.13 25.00 0.00 0.00 5.88
Weirton-Steubenville 36 4.01 20.15 13.89 19.32 27.78 22.60 33.33 37.94 25.00 10.26 33.33 16.67 8.00 6.25
Youngstown-Warren- Boardman
27 3.01 18.59 11.11 18.34 29.63 22.23 33.33 40.83 25.93 3.68 3.57 5.05 3.79 2.86
OH nonMSA 276 30.77 18.47 15.33 19.64 22.99 24.36 28.10 37.53 33.58 12.32 12.77 11.65 13.33 11.98
Data shown includes only one to four-family and manufactured housing (property type of 1 or 2). * Based on 2011 Peer Mortgage Data (USPR). ** Home improvement loans originated and purchased in the MA/AA as a percentage of all home improvement loans originated and purchased in the rated area. *** Percentage of Families is based on the 2000 Census information. **** As a percentage of loans with borrower income information available. No information was available for 2.0% of loans originated and purchased by the bank.

Charter Number 24
D - 251
Table 10. Borrower Distribution of Home Mortgage Refinance Loans
Borrower Distribution: HOME MORTGAGE REFINANCE Geography: OHIO Evaluation Period: JANUARY 1, 2009 To DECEMBER 31, 2011
MA/Assessment Area:
Total Home Mortgage Refinance
Loans
Low-Income Borrowers
Moderate-Income Borrowers
Middle-Income Borrowers
Upper-Income Borrowers
Market Share*
#
% of Total
**
% Families
***
% USB Loans
****
% Families
***
% USB Loans
****
% Families
***
% USB Loans
****
% Families
***
% USB Loans
****
Over-
all
Low
Mod
Mid
Upp
Full-Review:
Cleveland-Elyria- Mentor
2,184 17.95 20.34 10.44 18.08 20.30 22.21 24.37 39.37 44.88 2.63 4.29 3.75 2.96 2.03
Limited-Review:
Akron 760 6.25 19.24 9.11 18.62 21.04 23.21 24.96 38.93 44.90 2.41 3.12 2.91 2.68 2.02
Canton-Massillon 430 3.53 17.81 8.31 19.41 19.93 24.06 30.23 38.73 41.53 2.01 1.52 2.14 2.31 1.87
Columbus 3,014 24.77 19.62 9.04 18.45 21.41 22.99 24.70 38.94 44.85 2.68 4.35 3.86 2.96 2.13
Dayton 2,078 17.08 19.16 11.39 18.89 20.84 22.87 26.93 39.08 40.84 4.34 7.66 4.84 5.03 3.38
Huntington-Ashland 207 1.70 23.36 10.34 18.32 16.09 22.74 22.99 35.58 50.57 9.67 14.52 9.09 10.38 8.65
Lima 74 0.61 19.16 9.52 18.83 14.29 22.82 36.51 39.19 39.68 1.30 2.68 0.63 1.68 1.14
Mansfield 122 1.00 17.95 11.21 19.32 27.10 23.37 31.78 39.36 29.91 3.24 5.71 3.37 3.46 2.56
Sandusky 150 1.23 19.00 10.29 18.59 30.88 23.34 19.12 39.07 39.71 3.16 2.27 3.28 3.15 3.26
Springfield 156 1.28 18.75 11.83 18.55 21.51 24.25 25.81 38.44 40.86 3.03 6.56 2.87 2.53 2.84
Toledo 116 0.95 15.16 5.81 18.81 18.60 25.38 27.91 40.65 47.67 3.68 2.78 3.70 3.49 3.82
Weirton-Steubenville 228 1.87 20.15 8.26 19.32 20.18 22.60 31.19 37.94 40.37 13.90 21.43 14.71 13.38 13.03
Youngstown-Warren- Boardman
318 2.61 18.59 10.00 18.34 30.00 22.23 27.20 40.83 32.80 1.64 1.84 3.07 1.58 1.08
OH nonMSA 2,331 19.16 18.47 8.15 19.64 22.31 24.36 27.78 37.53 41.76 7.51 10.09 8.03 8.12 6.60
Data shown includes only one to four-family and manufactured housing (property type 1 or 2). * Based on 2011 Peer Mortgage Data (USPR). ** Home refinance loans originated and purchased in the MA/AA as a percentage of all home refinance loans originated and purchased in the rated area. *** Percentage of Families is based on the 2000 Census information. **** As a percentage of loans with borrower income information available. No information was available for 18.2% of loans originated and purchased by the bank.

Charter Number 24
D - 252
Table 11. Borrower Distribution of Small Loans to Businesses
Borrower Distribution: SMALL LOANS TO BUSINESSES Geography: OHIO Evaluation Period: JANUARY 1, 2009 To DECEMBER 31, 2011
MA/Assessment Area:
Total Small Loans to
Businesses
Businesses With Revenues of $1 million or
less
Loans by Original Amount Regardless of Business Size
Market Share*
#
% of
Total**
% of Businesses
***
% USB
Loans****
$100,000 or
less
>$100,000 to $250,000
>$250,000 to $1,000,000
All
Rev $1 Million or
Less Full-Review:
Cleveland-Elyria- Mentor
9,524 27.78 64.75 43.12 96.86 1.71 1.43 10.17 11.60
Limited-Review:
Akron 2,299 6.71 65.28 45.72 96.65 2.00 1.35 8.37 10.10
Canton-Massillon 1,071 3.12 67.56 31.47 98.04 1.31 0.65 7.85 7.52
Columbus 7,458 21.75 63.31 44.46 95.56 2.35 2.09 9.17 12.47
Dayton 4,726 13.78 68.51 49.64 94.73 2.77 2.50 16.45 20.11
Huntington-Ashland 240 0.70 69.95 73.33 97.92 1.67 0.42 21.86 26.92
Lima 300 0.87 65.08 53.67 98.33 0.67 1.00 10.91 14.02
Mansfield 935 2.73 65.68 31.76 98.50 1.07 0.43 19.24 18.96
Sandusky 501 1.46 64.01 50.50 96.21 2.59 1.20 17.55 23.23
Springfield 812 2.37 69.58 24.63 98.77 0.86 0.37 17.25 13.35
Toledo 202 0.59 68.61 60.89 97.03 2.48 0.50 13.91 17.02
Weirton-Steubenville 188 0.55 66.61 76.60 98.40 1.60 0.00 10.48 16.93
Youngstown-Warren- Boardman
1,149 3.35 66.45 63.10 99.04 0.26 0.70 8.23 12.82
OH nonMSA 4,882 14.24 69.07 57.23 96.27 2.03 1.70 19.22 24.35
* Based on 2011 Peer Small Business Data – US and PR. ** Small loans to businesses originated and purchased in the MA/AA as a percentage of all small loans to businesses originated and purchased in the rated area. *** Businesses with revenues of $1 million or less as a percentage of all businesses (Source Dun and Bradstreet - 2011). **** Small loans to businesses with revenues of $1 million or less as a percentage of all loans reported as small loans to businesses. No information was available for 42.7% of small loans to businesses originated and purchased by the bank.

Charter Number 24
D - 253
Table 12. Borrower Distribution of Small Loans to Farms
Borrower Distribution: SMALL LOANS TO FARMS Geography: OHIO Evaluation Period: JANUARY 1, 2009 To DECEMBER 31, 2011
MA/Assessment Area:
Total Small Loans to Farms
Farms With Revenues of $1 million or less
Loans by Original Amount Regardless of Farm Size
Market Share*
#
% of
Total**
% of
Farms***
% USB
Loans****
$100,000 or
less
>$100,000 to $250,000
>$250,000 to $500,000
All
Rev $1 Million or
Less Full-Review:
Cleveland-Elyria- Mentor
11 2.26 97.38 36.36 100.00 0.00 0.00 0.00 0.00
Limited-Review:
Akron 1 0.21 97.68 0.00 100.00 0.00 0.00 0.00 0.00
Canton-Massillon 5 1.03 98.65 40.00 80.00 20.00 0.00 0.00 0.00
Columbus 44 9.05 97.38 27.27 93.18 6.82 0.00 1.00 1.40
Dayton 174 35.80 98.23 86.21 58.62 28.74 12.64 22.58 26.51
Huntington-Ashland 0 0.00 99.44 0.00 0.00 0.00 0.00 0.00 0.00
Lima 1 0.21 98.49 100.00 100.00 0.00 0.00 0.00 0.00
Mansfield 2 0.41 98.99 50.00 100.00 0.00 0.00 0.00 0.00
Sandusky 2 0.41 98.20 0.00 100.00 0.00 0.00 0.00 0.00
Springfield 30 6.17 98.67 26.67 100.00 0.00 0.00 0.66 0.00
Toledo 5 1.03 97.87 100.00 100.00 0.00 0.00 10.53 12.50
Weirton-Steubenville 2 0.41 97.74 100.00 100.00 0.00 0.00 50.00 50.00
Youngstown-Warren- Boardman
1 0.21 98.69 100.00 100.00 0.00 0.00 0.00 0.00
OH nonMSA 208 42.80 98.87 82.21 76.92 16.83 6.25 6.86 8.74
* Based on 2011 Peer Small Business Data – US and PR. ** Small loans to farms originated and purchased in the MA/AA as a percentage of all small loans to farms originated and purchased in the rated area. *** Farms with revenues of $1 million or less as a percentage of all farms (Source Dun and Bradstreet - 2011). **** Small loans to farms with revenues of $1 million or less as a percentage of all loans reported as small loans to farms. No information was available for 20.8% of small loans to farms originated and purchased by the bank.

Charter Number 24
D - 254
Table 14. Qualified Investments
QUALIFIED INVESTMENTS Geography: OHIO E valuation Period: JANUARY 1, 2009 To MARCH 31, 2012
MA/Assessment Area:
Prior Period Investments* Current Period Investments** Total Investments Unfunded Commitments***
# $(000’s) # $(000’s) # $(000’s) % of Total # $(000’s) Full-Review:
Cleveland-Elyria- Mentor
33 27,460 371 70,932 404 98,392 57.09 6 29,820
Limited-Review:
Akron 4 105 85 2,674 89 2,779 1.61 1 22,234
Canton-Massillon 8 2,521 59 9,778 67 12,298 7.14 2 100
Columbus 28 5,321 288 8,621 316 13,941 8.09 1 130
Dayton 32 3,565 125 4,874 157 8,439 4.90 1 6,867
Huntington-Ashland 7 495 18 504 25 999 0.58 0 0
Lima 5 140 9 401 14 541 0.31 0 0
Mansfield 2 61 22 350 24 411 0.24 0 0
Sandusky 4 128 12 283 16 411 0.24 0 0
Springfield 5 76 17 362 22 438 0.25 1 1,119
Toledo 5 367 7 312 12 679 0.39 0 0
Weirton-Steubenville 6 235 15 259 21 494 0.29 1 133
Youngstown-Warren- Boardman
8 117 43 2,009 51 2,125 1.23 1 7,864
OH nonMSA 39 8,603 245 11,675 284 20,277 11.77 5 5,792
OH Statewide 1 500 20 9,619 21 10,119 5.87 0 0
* 'Prior Period Investments' means investments made in a previous evaluation period that are outstanding as of the examination date. ** The evaluation period for current period investments is January 1, 2009 to March 31, 2012. *** 'Unfunded Commitments' means legally binding investment commitments that are tracked and recorded by the institution's financial reporting system.

Charter Number 24
D - 255
Table 15. Distribution of Branch Delivery System and Branch Openings/Closings
DISTRIBUTION OF BRANCH DELIVERY SYSTEM/BRANCH OPENINGS/CLOSINGS Geography: OHIO Evaluation Period: JANUARY 1, 2009 To DECEMBER 31, 2011
MA/Assessment Area:
Deposits Branches Branch Openings/Closings Population
% of Rated Area
Deposits in AA
# of USB
Branch-es
% of
Rated Area
Branches in AA
Location of Branches by
Income of Geographies (%)
# of Branch
Openings
# of Branch
Closings
Net change in Location of Branches (+ or - )
% of Population within Each
Geography
Low
Mod
Mid
Upp
Low
Mod
Mid
Upp
Low
Mod
Mid
Upp
Full-Review:
Cleveland-Elyria- Mentor
33.52 65 27.31 10.77 12.31 44.62 32.31 7 13 1 -2 -2 -2 9.74 16.77 43.79 29.67
Limited-Review:
Akron 4.75 20 8.40 15.00 5.00 50.00 30.00 2 1 1 0 1 -1 6.29 21.45 48.11 24.15
Canton-Massillon 0.74 6 2.52 0.00 16.67 50.00 33.33 0 0 0 0 0 0 1.88 17.09 62.40 18.63
Columbus 19.44 46 19.33 4.35 28.26 28.26 39.13 2 1 0 1 -1 1 6.81 23.47 41.03 28.45
Dayton 13.88 31 13.03 6.45 3.23 54.84 35.48 1 0 0 0 0 1 3.32 21.76 49.08 25.85
Huntington-Ashland 2.45 5 2.10 NA 20.00 80.00 NA 0 0 NA 0 0 NA NA 6.27 93.73 NA
Lima 0.69 2 0.84 0.00 0.00 100.0 0.00 0 0 0 0 0 0 2.94 24.02 53.54 19.50
Mansfield 0.86 3 1.26 0.00 0.00 66.67 33.33 0 0 0 0 0 0 2.08 17.95 56.06 23.91
Sandusky 0.67 2 0.84 NA 50.00 50.00 0.00 0 0 NA 0 0 0 NA 24.16 61.49 14.35
Springfield 0.07 1 0.42 0.00 0.00 100.00 0.00 0 0 0 0 0 0 3.37 15.18 57.07 24.38
Toledo 0.91 2 0.84 NA NA 100.00 0.00 0 0 NA NA 0 0 NA NA 91.24 8.76
Weirton-Steubenville 1.13 4 1.68 0.00 25.00 75.00 0.00 0 0 0 0 0 0 1.78 12.77 82.17 3.27
Youngstown-Warren- Boardman
1.01 9 3.78 0.00 22.22 44.44 33.33 0 0 0 0 0 0 4.61 15.87 58.03 21.49
OH nonMSA 19.87 42 17.65 4.76 14.29 54.76 26.19 0 1 0 0 -1 0 0.26 15.18 73.60 10.95

Charter Number 24
D - 256
Table 1. Lending Volume
LENDING VOLUME Geography: OREGON Evaluation Period: JANUARY 1, 2009 To DECEMBER 31, 2011
MA/Assessment Area:
% of Rated Area
Loans (#) in MA/AA*
Home Mortgage
Small Loans to
Businesses
Small Loans to Farms
Community
Development Loans**
Total Reported Loans
% of Rated Area Deposits in MA/AA***
#
$ (000’s)
#
$ (000’s)
#
$ (000’s)
#
$ (000’s)
#
$(000’s)
Full-Review:
Salem 20.18 2,232 343,711 3,541 101,361 84 15,132 11 13,876 5,868 474,080 21.54
Limited-Review:
Bend 9.88 994 230,407 1,857 75,235 18 1,973 5 3,829 2,874 311,444 9.09
Corvallis 3.55 500 99,733 526 12,332 6 1,159 0 0 1,032 113,224 3.46
Eugene-Springfield 15.73 1,557 276,563 2,992 77,625 22 1,919 3 470 4,574 356,577 13.87
Medford 9.01 607 101,425 1,980 84,055 25 576 8 4,898 2,620 190,954 9.76
OR nonMSA 41.61 4,393 652,866 7,326 209,745 359 33,667 24 34,318 12,102 930,596 42.28
OR Statewide 0.04 0 0 0 0 0 0 13 88,962 13 88,962 NA
* Loan Data as of December 31, 2011. Rated area refers to either the state or multistate MA rating area. ** The evaluation period for Community Development Loans is from January 1, 2009 to March 31, 2012. *** Deposit Data as of June 30, 2011. Rated Area refers to the state, multistate MA, or institution, as appropriate.

Charter Number 24
D - 257
Table 2. Geographic Distribution of Home Purchase Loans
Geographic Distribution: HOME PURCHASE Geography: OREGON Evaluation Period: JANUARY 1, 2009 To DECEMBER 31, 2011
MA/Assessment Area:
Total Home
Purchase Loans
Low-Income Geographies
Moderate-Income
Geographies
Middle-Income Geographies
Upper-Income Geographies
Market Share (%) by Geography*
#
% of
Total**
% Owner
Occ Units***
% USB Loans
% Owner
Occ Units***
% USB Loans
% Owner
Occ Units***
% USB Loans
% Owner
Occ Units***
% USB
Loans
Overall
Low
Mod
Mid
Upp
Full-Review:
Salem 465 20.55 0.09 0.00 14.36 14.41 59.70 53.33 25.85 32.26 4.04 0.00 4.10 4.06 3.99
Limited-Review:
Bend 334 14.76 NA NA 18.64 15.57 48.92 43.71 32.44 40.72 3.22 NA 4.13 2.49 3.84
Corvallis 128 5.66 NA NA 26.55 25.00 28.42 27.34 45.02 47.66 4.93 NA 4.53 8.12 3.90
Eugene-Springfield 312 13.79 0.53 0.64 10.64 10.90 65.10 60.90 23.73 27.56 2.54 5.56 3.21 2.61 2.06
Medford 123 5.44 0.31 0.00 15.60 13.82 56.76 55.28 27.33 30.89 2.02 0.00 1.32 1.81 2.98
OR nonMSA 901 39.81 NA NA 8.70 6.10 75.56 74.14 15.74 19.76 3.27 NA 3.07 2.98 4.73
Data shown includes only one to four-family and manufactured housing (property type 1 or 2). * Based on 2011 Peer Mortgage Data (USPR). ** Home purchase loans originated and purchased in the MA/AA as a percentage of all home purchase loans originated and purchased in the rated area. *** Percentage of Owner-Occupied Units is the number of owner-occupied housing units in a particular geography divided by the number of owner-occupied housing units in the area based on 2000 Census information.

Charter Number 24
D - 258
Table 3. Geographic Distribution of Home Improvement Loans
Geographic Distribution: HOME IMPROVEMENT Geography: OREGON Evaluation Period: JANUARY 1, 2009 To DECEMBER 31, 2011
MA/Assessment Area:
Total Home
Improvement Loans
Low-Income Geographies
Moderate-Income
Geographies
Middle-Income Geographies
Upper-Income Geographies
Market Share (%) by Geography*
#
% of
Total**
% Owner Occ
Units***
% USB Loans
% Owner Occ
Units***
% USB Loans
% Owner Occ
Units***
% USB Loans
% Owner Occ
Units***
% USB Loans
Overall
Low
Mod
Mid
Upp Full-Review:
Salem 90 16.27 0.09 0.00 14.36 11.11 59.70 61.11 25.85 27.78 13.84 0.00 11.76 14.40 13.85%
Limited-Review:
Bend 31 5.61 NA NA 18.64 54.84 48.92 22.58 32.44 22.58 11.11 NA 21.43 7.69 8.70%
Corvallis 22 3.98 NA NA 26.55 27.27 28.42 27.27 45.02 45.45 21.82 NA 30.77 18.18 19.35%
Eugene- Springfield
64 11.57 0.53 0.00 10.64 12.50 65.10 67.19 23.73 20.31 9.09 0.00 11.11 9.85 6.00%
Medford 29 5.24 0.31 0.00 15.60 13.79 56.76 62.07 27.33 24.14 9.43 0.00 13.64 5.45 13.79%
OR nonMSA 317 57.32 NA NA 8.70 3.79 75.56 81.70 15.74 14.51 17.29 NA 3.57 18.92 14.29%
Data shown includes only one to four-family and manufactured housing (property type 1 or 2). * Based on 2011 Peer Mortgage Data (USPR). ** Home improvement loans originated and purchased in the MA/AA as a percentage of all home improvement loans originated and purchased in the rated area. *** Percentage of Owner-Occupied Units is the number of owner-occupied housing units in a particular geography divided by number of owner-occupied housing units in the area based on 2000 Census information.

Charter Number 24
D - 259
Table 4. Geographic Distribution of Home Mortgage Refinance Loans
Geographic Distribution: HOME MORTGAGE REFINANCE Geography: OREGON Evaluation Period: JANUARY 1, 2009 To DECEMBER 31, 2011
MA/Assessment Area:
Total Home Mortgage Refinance
Loans
Low-Income Geographies
Moderate-Income Geographies
Middle-Income Geographies
Upper-Income Geographies
Market Share (%) by Geography*
#
% of
Total**
% Owner
Occ Units***
% USB Loans
%
Owner Occ
Units***
% USB Loans
%
Owner Occ
Units***
% USB Loans
% Owner
Occ Units***
%
USB Loans
Overall
Low
Mod
Mid
Upp
Full-Review:
Salem 1,666 22.40 0.09 0.12 14.36 11.04 59.70 58.10 25.85 30.73 7.63 14.29 7.05 8.00 7.14
Limited-Review:
Bend 628 8.44 NA NA 18.64 17.36 48.92 37.42 32.44 45.22 5.55 NA 7.86 4.76 5.61
Corvallis 349 4.69 NA NA 26.55 21.78 28.42 28.08 45.02 50.14 5.96 NA 5.87 8.09 4.95
Eugene-Springfield 1,179 15.85 0.53 0.17 10.64 7.29 65.10 63.10 23.73 29.43 5.05 0.00 4.94 4.99 5.28
Medford 453 6.09 0.31 0.00 15.60 8.61 56.76 53.64 27.33 37.75 4.36 0.00 3.63 4.41 4.55
OR nonMSA 3,164 42.53 NA NA 8.70 3.95 75.56 76.14 15.74 19.91 7.03 NA 5.33 7.25 6.73
Data shown includes only one to four-family and manufactured housing (property type 1 or 2). * Based on 2011 Peer Mortgage Data (USPR). ** Home mortgage refinance loans originated and purchased in the MA/AA as a percentage of all home mortgage refinance loans originated and purchased in the rated area. *** Percentage of Owner-Occupied Units is the number of owner-occupied housing units in a particular geography divided by number of owner-occupied housing units in the area based on 2000 Census information.

Charter Number 24
D - 260
Table 5. Geographic Distribution of Multifamily Loans
Geographic Distribution: MULTIFAMILY Geography: OREGON Evaluation Period: JANUARY 1, 2009 To DECEMBER 31, 2011
MA/Assessment Area:
Total Multifamily
Loans
Low-Income Geographies
Moderate-Income
Geographies
Middle-Income Geographies
Upper-Income Geographies
Market Share (%) by Geography*
#
% of Total**
% of MF Units***
% USB Loans
% MF Units***
% USB Loans
% MF Units***
% USB Loans
% MF Units***
% USB Loans
Overall
Low
Mod
Mid
Upp
Full-Review:
Salem 11 39.29 0.46 0.00 40.27 27.27 41.61 54.55 17.66 18.18 5.36 0.00 5.56 6.67 0.00
Limited-Review:
Bend 1 3.57 NA NA 27.32 0.00 57.45 100.00 15.23 0.00 0.00 NA 0.00 0.00 0.00
Corvallis 1 3.57 NA NA 69.50 100.00 11.08 0.00 19.41 0.00 0.00 NA 0.00 0.00 0.00
Eugene-Springfield 2 7.14 14.02 0.00 28.02 0.00 42.14 50.00 15.82 50.00 4.55 0.00 0.00 8.33 20.00
Medford 2 7.14 4.18 0.00 38.22 0.00 32.71 100.00 24.89 0.00 5.88 0.00 0.00 33.33 0.00
OR nonMSA 11 39.29 NA NA 11.11 0.00 75.25 90.91 13.64 9.09 16.22 NA 0.00 20.00 0.00
Multifamily loan distribution includes Home Purchases, Home Improvement and Refinances. * Based on 2011 Peer Mortgage Data (USPR). ** Multifamily loans originated and purchased in the MA/AA as a percentage of all multifamily loans originated and purchased in the rated area. *** Percentage of multifamily units is the number of multifamily housing units in a particular geography divided by number of multifamily housing units in the area based on 2000 Census information.

Charter Number 24
D - 261
Table 6. Geographic Distribution of Small Loans to Businesses
Geographic Distribution: SMALL LOANS TO BUSINESSES Geography: OREGON Evaluation Period: JANUARY 1, 2009 To DECEMBER 31, 2011
MA/Assessment Area:
Total Small
Business Loans
Low-Income Geographies
Moderate-Income
Geographies
Middle-Income Geographies
Upper-Income Geographies
Market Share (%) by Geography*
#
% of Total
**
% of
Businesses ***
% USB Loans
% of
Businesses ***
% USB Loans
% of
Businesses ***
% USB Loans
% of
Businesses ***
% USB Loans
Overall
Low
Mod
Mid
Upp
Full-Review:
Salem 3,541 19.43 0.24 0.11 20.52 18.61 56.65 57.27 22.58 24.00 21.42 25.00 22.22 20.55 18.75
Limited-Review:
Bend 1,857 10.19 NA NA 20.66 18.85 44.06 38.56 35.28 42.60 15.21 NA 15.48 14.83 14.34
Corvallis 526 2.89 NA NA 41.84 37.64 23.27 29.09 34.89 33.27 16.28 NA 15.78 16.30 16.11
Eugene-Springfield 2,992 16.42 4.10 6.38 16.15 17.58 57.63 51.87 22.12 24.16 18.29 25.34 19.69 16.22 16.86
Medford 1,980 10.87 5.09 7.32 21.11 26.87 49.48 42.17 24.32 23.64 15.89 21.46 18.70 13.36 15.37
OR nonMSA 7,326 40.20 NA NA 9.17 7.41 74.97 77.82 15.85 14.77 19.82 NA 17.70 19.75 16.53
* Based on 2011 Peer Small Business Data – US and PR. ** Small loans to businesses originated and purchased in the MA/AA as a percentage of all small loans to businesses originated and purchased in the rated area. *** Source Data - Dun and Bradstreet (2011).
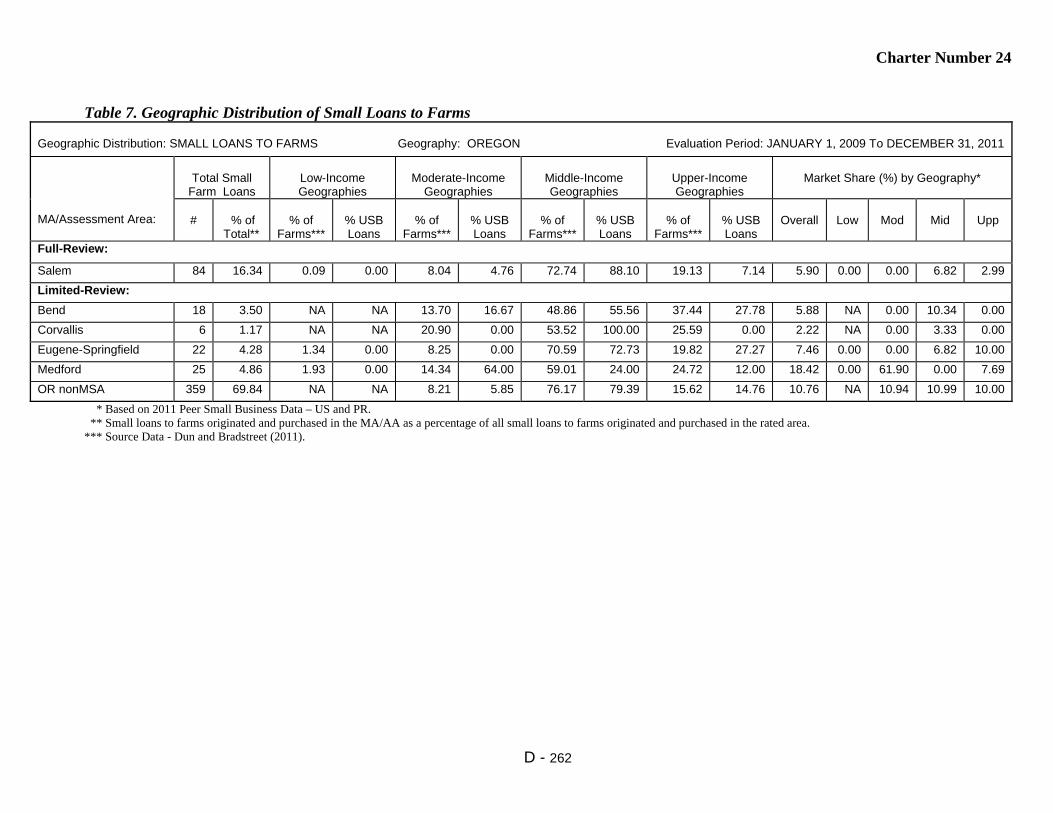
Charter Number 24
D - 262
Table 7. Geographic Distribution of Small Loans to Farms
Geographic Distribution: SMALL LOANS TO FARMS Geography: OREGON Evaluation Period: JANUARY 1, 2009 To DECEMBER 31, 2011
MA/Assessment Area:
Total Small
Farm Loans
Low-Income Geographies
Moderate-Income
Geographies
Middle-Income Geographies
Upper-Income Geographies
Market Share (%) by Geography*
#
% of
Total**
% of
Farms***
% USB Loans
% of
Farms***
% USB Loans
% of
Farms***
% USB Loans
% of
Farms***
% USB Loans
Overall
Low
Mod
Mid
Upp
Full-Review:
Salem 84 16.34 0.09 0.00 8.04 4.76 72.74 88.10 19.13 7.14 5.90 0.00 0.00 6.82 2.99
Limited-Review:
Bend 18 3.50 NA NA 13.70 16.67 48.86 55.56 37.44 27.78 5.88 NA 0.00 10.34 0.00
Corvallis 6 1.17 NA NA 20.90 0.00 53.52 100.00 25.59 0.00 2.22 NA 0.00 3.33 0.00
Eugene-Springfield 22 4.28 1.34 0.00 8.25 0.00 70.59 72.73 19.82 27.27 7.46 0.00 0.00 6.82 10.00
Medford 25 4.86 1.93 0.00 14.34 64.00 59.01 24.00 24.72 12.00 18.42 0.00 61.90 0.00 7.69
OR nonMSA 359 69.84 NA NA 8.21 5.85 76.17 79.39 15.62 14.76 10.76 NA 10.94 10.99 10.00
* Based on 2011 Peer Small Business Data – US and PR. ** Small loans to farms originated and purchased in the MA/AA as a percentage of all small loans to farms originated and purchased in the rated area. *** Source Data - Dun and Bradstreet (2011).

Charter Number 24
D - 263
Table 8. Borrower Distribution of Home Purchase Loans
Borrower Distribution: HOME PURCHASE Geography: OREGON Evaluation Period: JANUARY 1, 2009 To DECEMBER 31, 2011
MA/Assessment Area:
Total Home Purchase
Loans
Low-Income Borrowers
Moderate-Income
Borrowers
Middle-Income
Borrowers
Upper-Income
Borrowers
Market Share*
#
% of Total
**
% Families
***
% USB Loans
****
% Families
***
% USB Loans
****
% Families
***
% USB Loans
****
% Families
***
% USB Loans
****
Over-
all
Low
Mod
Mid
Upp
Full-Review:
Salem 465 20.55 18.49 10.91 18.97 25.63 23.62 25.38 38.92 38.07 3.58 4.44 3.03 2.56 4.68
Limited-Review:
Bend 334 14.76 17.37 9.58 20.54 14.94 22.66 18.39 39.43 57.09 2.74 2.87 1.61 2.22 3.49
Corvallis 128 5.66 19.62 8.62 18.42 19.83 22.30 21.55 39.65 50.00 4.99 6.00 5.26 4.62 5.00
Eugene-Springfield 312 13.79 19.02 5.37 18.57 23.55 22.91 25.21 39.49 45.87 1.89 2.64 1.46 1.49 2.30
Medford 123 5.44 19.34 7.23 18.89 26.51 21.45 26.51 40.32 39.76 1.39 1.36 1.46 1.52 1.26
OR nonMSA 901 39.81 19.07 5.75 18.75 21.60 22.80 24.82 39.38 47.83 2.98 2.74 2.57 2.73 3.43
Data shown includes only one to four-family and manufactured housing (property type 1 or 2). * Based on 2011 Peer Mortgage Data (USPR). ** Home purchase loans originated and purchased in the MA/AA as a percentage of all home purchase loans originated and purchased in the rated area. *** Percentage of Families is based on the 2000 Census information. **** As a percentage of loans with borrower income information available. No information was available for 20.1% of loans originated and purchased by USB in the Multistate MAs.

Charter Number 24
D - 264
Table 9. Borrower Distribution of Home Improvement Loans
Borrower Distribution: HOME IMPROVEMENT Geography: OREGON Evaluation Period: JANUARY 1, 2009 To DECEMBER 31, 2011
MA/Assessment Area:
Total Home Improvement
Loans
Low-Income Borrowers
Moderate-Income
Borrowers
Middle-Income
Borrowers
Upper-Income
Borrowers
Market Share*
#
% of Total
**
% Families
***
% USB Loans
****
% Families
***
% USB Loans
****
% Families
***
% USB Loans
****
% Families
***
% USB Loans
****
Over-
all
Low
Mod
Mid
Upp
Full-Review:
Salem 90 16.27 18.49 7.78 18.97 21.11 23.62 28.89 38.92 42.22 14.49 18.75 15.38 16.07 12.62
Limited-Review:
Bend 31 5.61 17.37 19.35 20.54 32.26 22.66 12.90 39.43 35.48 12.50 28.57 28.57 8.33 6.67
Corvallis 22 3.98 19.62 13.64 18.42 31.82 22.30 22.73 39.65 31.82 22.22 66.67 30.77 0.00 19.35
Eugene-Springfield 64 11.57 19.02 25.00 18.57 26.56 22.91 18.75 39.49 29.69 9.64 23.53 10.00 2.17 10.71
Medford 29 5.24 19.34 20.69 18.89 24.14 21.45 13.79 40.32 41.38 10.31 12.50 15.00 8.00 9.09
OR nonMSA 317 57.32 19.07 16.77 18.75 21.84 22.80 23.42 39.38 37.97 18.18 34.09 18.92 16.90 15.81
Data shown includes only one to four-family and manufactured housing (property type of 1 or 2). * Based on 2011 Peer Mortgage Data (USPR). ** Home improvement loans originated and purchased in the MA/AA as a percentage of all home improvement loans originated and purchased in the rated area. *** Percentage of Families is based on the 2000 Census information. **** As a percentage of loans with borrower income information available. No information was available for 0.2% of loans originated and purchased by the bank.
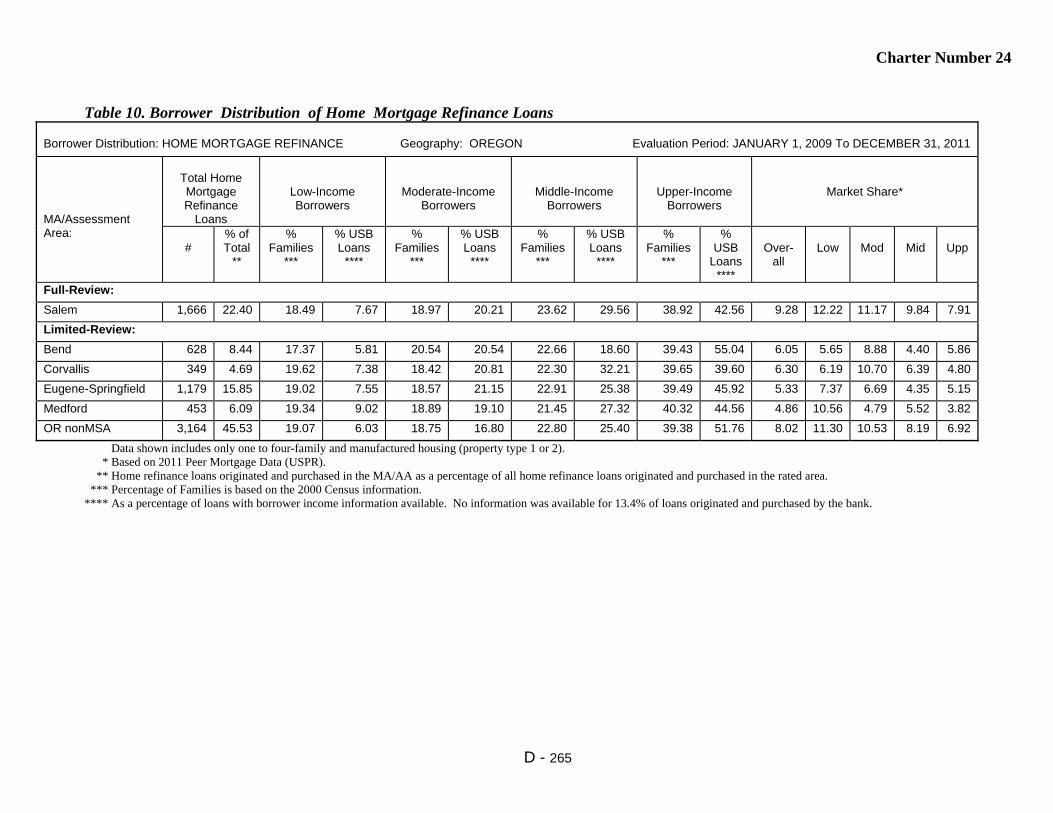
Charter Number 24
D - 265
Table 10. Borrower Distribution of Home Mortgage Refinance Loans
Borrower Distribution: HOME MORTGAGE REFINANCE Geography: OREGON Evaluation Period: JANUARY 1, 2009 To DECEMBER 31, 2011
MA/Assessment Area:
Total Home Mortgage Refinance
Loans
Low-Income Borrowers
Moderate-Income Borrowers
Middle-Income Borrowers
Upper-Income Borrowers
Market Share*
#
% of Total
**
% Families
***
% USB Loans
****
% Families
***
% USB Loans
****
% Families
***
% USB Loans
****
% Families
***
% USB
Loans ****
Over-
all
Low
Mod
Mid
Upp
Full-Review:
Salem 1,666 22.40 18.49 7.67 18.97 20.21 23.62 29.56 38.92 42.56 9.28 12.22 11.17 9.84 7.91
Limited-Review:
Bend 628 8.44 17.37 5.81 20.54 20.54 22.66 18.60 39.43 55.04 6.05 5.65 8.88 4.40 5.86
Corvallis 349 4.69 19.62 7.38 18.42 20.81 22.30 32.21 39.65 39.60 6.30 6.19 10.70 6.39 4.80
Eugene-Springfield 1,179 15.85 19.02 7.55 18.57 21.15 22.91 25.38 39.49 45.92 5.33 7.37 6.69 4.35 5.15
Medford 453 6.09 19.34 9.02 18.89 19.10 21.45 27.32 40.32 44.56 4.86 10.56 4.79 5.52 3.82
OR nonMSA 3,164 45.53 19.07 6.03 18.75 16.80 22.80 25.40 39.38 51.76 8.02 11.30 10.53 8.19 6.92
Data shown includes only one to four-family and manufactured housing (property type 1 or 2). * Based on 2011 Peer Mortgage Data (USPR). ** Home refinance loans originated and purchased in the MA/AA as a percentage of all home refinance loans originated and purchased in the rated area. *** Percentage of Families is based on the 2000 Census information. **** As a percentage of loans with borrower income information available. No information was available for 13.4% of loans originated and purchased by the bank.
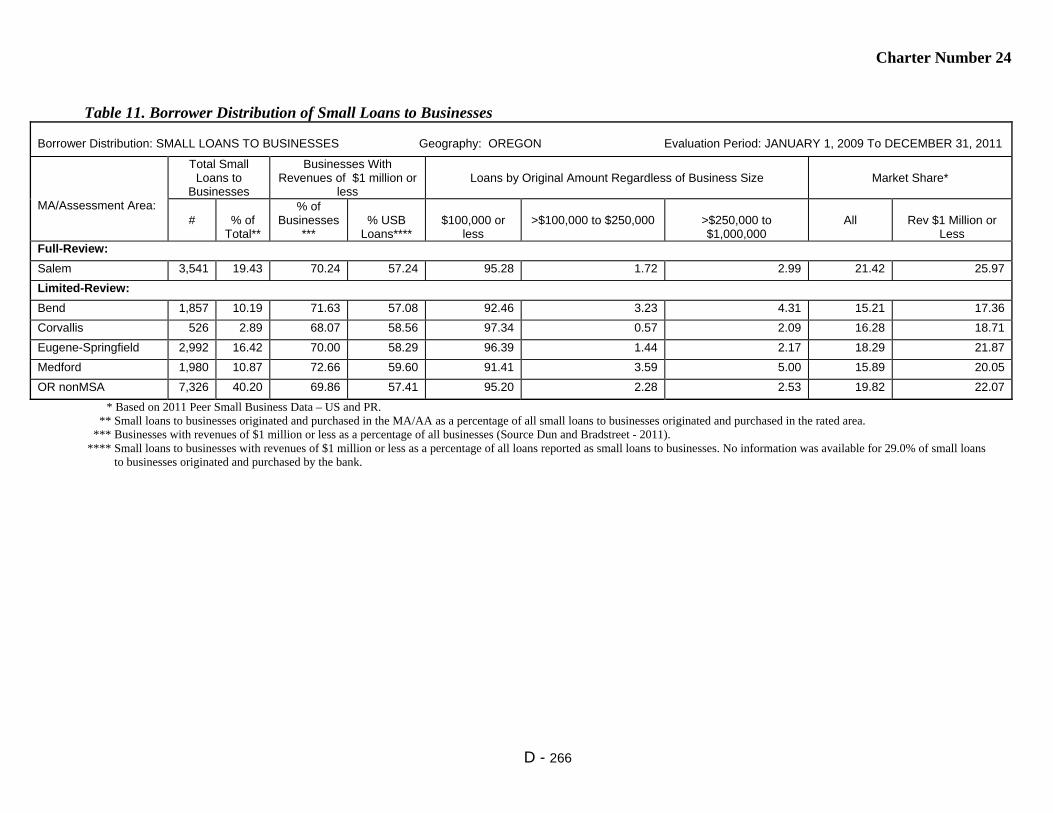
Charter Number 24
D - 266
Table 11. Borrower Distribution of Small Loans to Businesses
Borrower Distribution: SMALL LOANS TO BUSINESSES Geography: OREGON Evaluation Period: JANUARY 1, 2009 To DECEMBER 31, 2011
MA/Assessment Area:
Total Small Loans to
Businesses
Businesses With Revenues of $1 million or
less
Loans by Original Amount Regardless of Business Size
Market Share*
#
% of
Total**
% of Businesses
***
% USB
Loans****
$100,000 or
less
>$100,000 to $250,000
>$250,000 to $1,000,000
All
Rev $1 Million or
Less Full-Review:
Salem 3,541 19.43 70.24 57.24 95.28 1.72 2.99 21.42 25.97
Limited-Review:
Bend 1,857 10.19 71.63 57.08 92.46 3.23 4.31 15.21 17.36
Corvallis 526 2.89 68.07 58.56 97.34 0.57 2.09 16.28 18.71
Eugene-Springfield 2,992 16.42 70.00 58.29 96.39 1.44 2.17 18.29 21.87
Medford 1,980 10.87 72.66 59.60 91.41 3.59 5.00 15.89 20.05
OR nonMSA 7,326 40.20 69.86 57.41 95.20 2.28 2.53 19.82 22.07
* Based on 2011 Peer Small Business Data – US and PR. ** Small loans to businesses originated and purchased in the MA/AA as a percentage of all small loans to businesses originated and purchased in the rated area. *** Businesses with revenues of $1 million or less as a percentage of all businesses (Source Dun and Bradstreet - 2011). **** Small loans to businesses with revenues of $1 million or less as a percentage of all loans reported as small loans to businesses. No information was available for 29.0% of small loans to businesses originated and purchased by the bank.

Charter Number 24
D - 267
Table 12. Borrower Distribution of Small Loans to Farms
Borrower Distribution: SMALL LOANS TO FARMS Geography: OREGON Evaluation Period: JANUARY 1, 2009 To DECEMBER 31, 2011
MA/Assessment Area:
Total Small Loans to Farms
Farms With Revenues of $1 million or less
Loans by Original Amount Regardless of Farm Size
Market Share*
#
% of
Total**
% of
Farms***
% USB
Loans****
$100,000 or
less
>$100,000 to $250,000
>$250,000 to $500,000
All
Rev $1 Million or
Less Full-Review:
Salem 84 16.34 93.39 44.05 55.95 9.52 34.52 5.90 5.52
Limited-Review:
Bend 18 3.50 97.95 61.11 61.11 33.33 5.56 5.88 5.88
Corvallis 6 1.17 96.48 83.33 50.00 0.00 50.00 2.22 3.70
Eugene-Springfield 22 4.28 97.25 77.27 68.18 22.73 9.09 7.46 6.98
Medford 25 4.86 97.61 24.00 100.00 0.00 0.00 18.42 2.78
OR nonMSA 359 69.84 96.74 73.54 75.21 13.09 11.70 10.76 12.16
* Based on 2011 Peer Small Business Data – US and PR. ** Small loans to farms originated and purchased in the MA/AA as a percentage of all small loans to farms originated and purchased in the rated area. *** Farms with revenues of $1 million or less as a percentage of all farms (Source Dun and Bradstreet - 2011). **** Small loans to farms with revenues of $1 million or less as a percentage of all loans reported as small loans to farms. No information was available for 13.8% of small loans to farms originated and purchased by the bank.

Charter Number 24
D - 268
Table 14. Qualified Investments
QUALIFIED INVESTMENTS Geography: OREGON Evaluation Period: JANUARY 1, 2009 To MARCH 31, 2012
MA/Assessment Area:
Prior Period Investments* Current Period Investments** Total Investments Unfunded Commitments***
# $(000’s) # $(000’s) # $(000’s) % of Total # $(000’s) Full-Review:
Salem 19 1,423 43 4,478 62 5,901 5.79 0 0
Limited-Review:
Bend 14 848 46 2,561 60 3,409 3.34 0 0
Corvallis 5 579 10 765 15 1,344 1.32 0 0
Eugene-Springfield 17 1,064 49 2,441 66 3,505 3.44 1 1,039
Medford 18 1,444 27 1,282 45 2,726 2.67 0 0
OR nonMSA 71 5,702 116 77,742 187 83,443 81.80 0 0
OR Statewide 5 1,371 54 310 59 1,681 1.65 0 0
* 'Prior Period Investments' means investments made in a previous evaluation period that are outstanding as of the examination date. ** The evaluation period for current period investments is January 1, 2009 to March 31, 2012. *** 'Unfunded Commitments' means legally binding investment commitments that are tracked and recorded by the institution's financial reporting system.

Charter Number 24
D - 269
Table 15. Distribution of Branch Delivery System and Branch Openings/Closings
DISTRIBUTION OF BRANCH DELIVERY SYSTEM/BRANCH OPENINGS/CLOSINGS Geography: OREGON Evaluation Period: JANUARY 1, 2009 To DECEMBER 31, 2011
MA/Assessment Area:
Deposits Branches Branch Openings/Closings Population
% of Rated
Area Deposits in
AA
# of USB Branches
% of Rated
Area Branches in
AA
Location of Branches by
Income of Geographies (%)
# of Branch
Openings
# of Branch
Closings
Net change in Location of Branches (+ or - )
% of Population within Each
Geography
Low
Mod
Mid
Upp
Low
Mod
Mid
Upp
Low
Mod
Mid
Upp
Full-Review:
Salem 21.54 17 17.00 0.00 23.53 52.94 23.53 1 0 0 0 0 1 0.98 21.38 56.75 20.89
Limited-Review:
Bend 9.09 9 9.00 NA 33.33 44.44 22.22 1 0 NA 0 0 1 NA 21.19 49.23 29.58
Corvallis 3.46 2 2.00 NA 100.00 0.00 0.00 0 0 NA 0 0 0 NA 43.47 23.14 33.39
Eugene- Springfield
13.87 18 18.00 16.67 11.11 61.11 11.11 1 0 0 0 1 0 2.90 14.69 61.85 20.56
Medford 9.76 10 10.00 30.00 10.00 30.00 30.00 0 0 0 0 0 0 1.16 22.53 52.66 23.65
OR nonMSA 42.28 44 44.00 NA 13.64 77.27 9.09 0 0 NA 0 0 0 NA 9.37 75.80 14.83
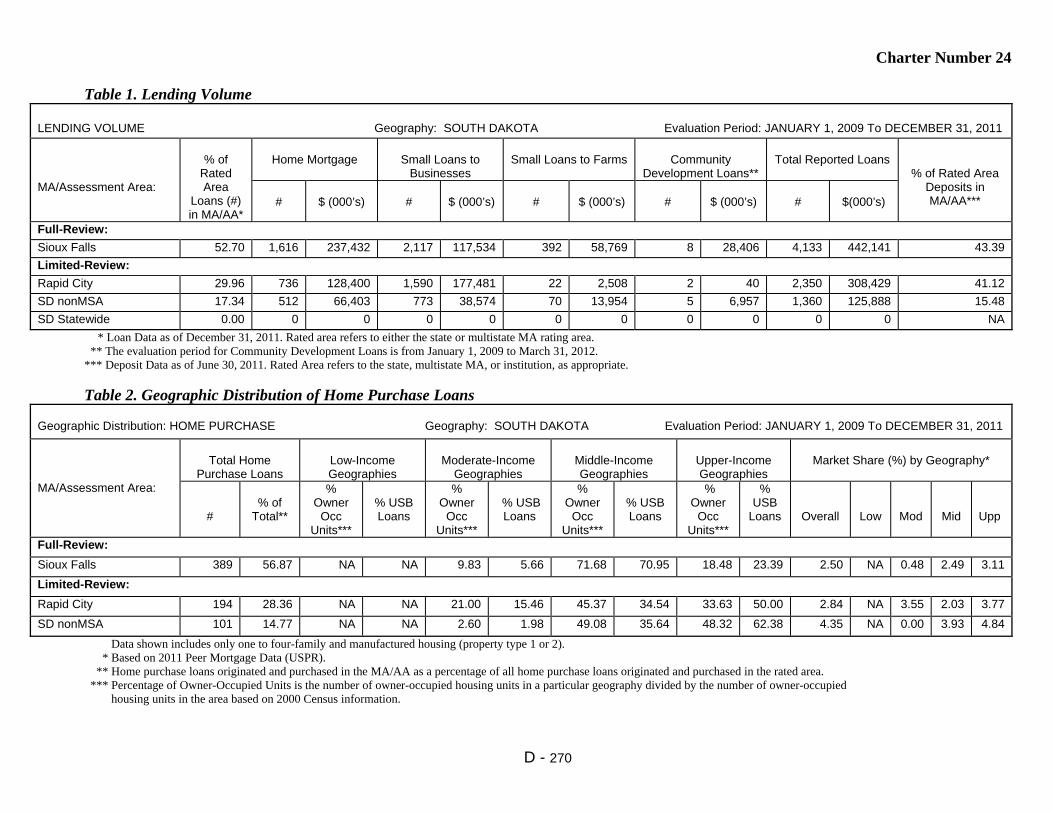
Charter Number 24
D - 270
Table 1. Lending Volume
LENDING VOLUME Geography: SOUTH DAKOTA Evaluation Period: JANUARY 1, 2009 To DECEMBER 31, 2011
MA/Assessment Area:
% of
Rated Area
Loans (#) in MA/AA*
Home Mortgage
Small Loans to
Businesses
Small Loans to Farms
Community
Development Loans**
Total Reported Loans
% of Rated Area Deposits in MA/AA***
#
$ (000’s)
#
$ (000’s)
#
$ (000’s)
#
$ (000’s)
#
$(000’s)
Full-Review:
Sioux Falls 52.70 1,616 237,432 2,117 117,534 392 58,769 8 28,406 4,133 442,141 43.39
Limited-Review:
Rapid City 29.96 736 128,400 1,590 177,481 22 2,508 2 40 2,350 308,429 41.12
SD nonMSA 17.34 512 66,403 773 38,574 70 13,954 5 6,957 1,360 125,888 15.48
SD Statewide 0.00 0 0 0 0 0 0 0 0 0 0 NA
* Loan Data as of December 31, 2011. Rated area refers to either the state or multistate MA rating area. ** The evaluation period for Community Development Loans is from January 1, 2009 to March 31, 2012. *** Deposit Data as of June 30, 2011. Rated Area refers to the state, multistate MA, or institution, as appropriate.
Table 2. Geographic Distribution of Home Purchase Loans Geographic Distribution: HOME PURCHASE Geography: SOUTH DAKOTA Evaluation Period: JANUARY 1, 2009 To DECEMBER 31, 2011
MA/Assessment Area:
Total Home
Purchase Loans
Low-Income Geographies
Moderate-Income
Geographies
Middle-Income Geographies
Upper-Income Geographies
Market Share (%) by Geography*
#
% of
Total**
% Owner
Occ Units***
% USB Loans
% Owner
Occ Units***
% USB Loans
% Owner
Occ Units***
% USB Loans
% Owner
Occ Units***
% USB
Loans
Overall
Low
Mod
Mid
Upp
Full-Review:
Sioux Falls 389 56.87 NA NA 9.83 5.66 71.68 70.95 18.48 23.39 2.50 NA 0.48 2.49 3.11
Limited-Review:
Rapid City 194 28.36 NA NA 21.00 15.46 45.37 34.54 33.63 50.00 2.84 NA 3.55 2.03 3.77
SD nonMSA 101 14.77 NA NA 2.60 1.98 49.08 35.64 48.32 62.38 4.35 NA 0.00 3.93 4.84
Data shown includes only one to four-family and manufactured housing (property type 1 or 2). * Based on 2011 Peer Mortgage Data (USPR). ** Home purchase loans originated and purchased in the MA/AA as a percentage of all home purchase loans originated and purchased in the rated area. *** Percentage of Owner-Occupied Units is the number of owner-occupied housing units in a particular geography divided by the number of owner-occupied housing units in the area based on 2000 Census information.
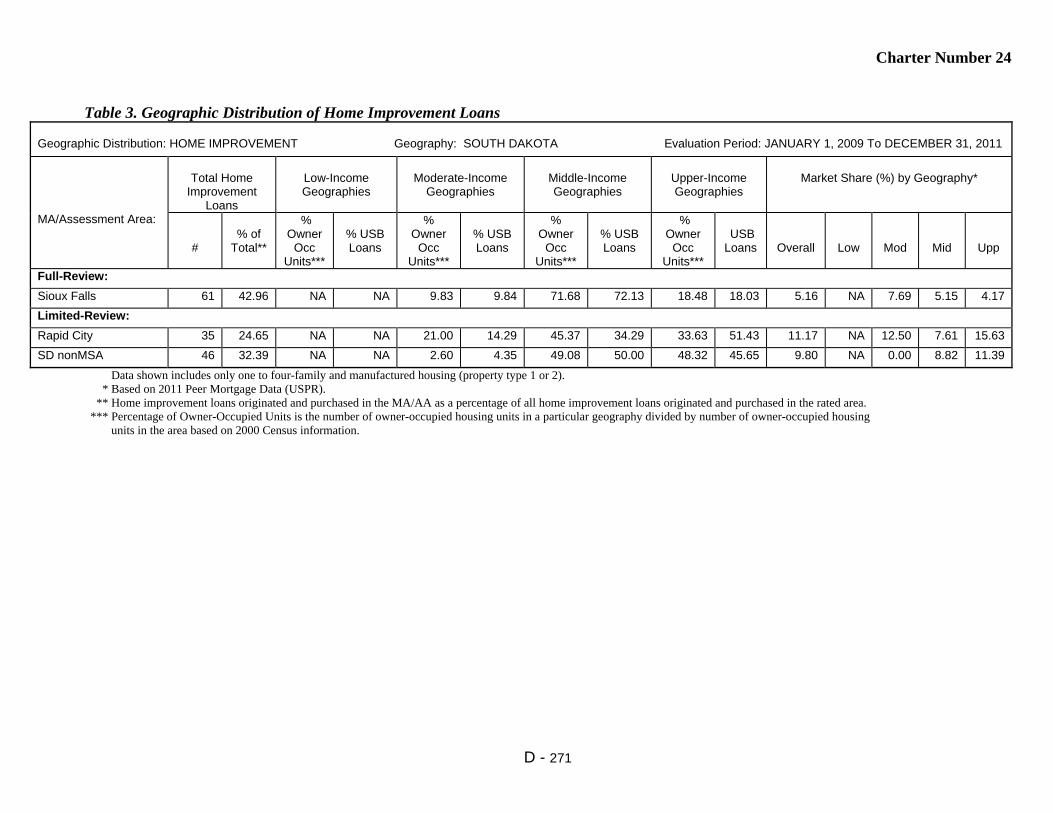
Charter Number 24
D - 271
Table 3. Geographic Distribution of Home Improvement Loans
Geographic Distribution: HOME IMPROVEMENT Geography: SOUTH DAKOTA Evaluation Period: JANUARY 1, 2009 To DECEMBER 31, 2011
MA/Assessment Area:
Total Home
Improvement Loans
Low-Income Geographies
Moderate-Income
Geographies
Middle-Income Geographies
Upper-Income Geographies
Market Share (%) by Geography*
#
% of
Total**
% Owner
Occ Units***
% USB Loans
% Owner
Occ Units***
% USB Loans
% Owner
Occ Units***
% USB Loans
% Owner
Occ Units***
USB Loans
Overall
Low
Mod
Mid
Upp
Full-Review:
Sioux Falls 61 42.96 NA NA 9.83 9.84 71.68 72.13 18.48 18.03 5.16 NA 7.69 5.15 4.17
Limited-Review:
Rapid City 35 24.65 NA NA 21.00 14.29 45.37 34.29 33.63 51.43 11.17 NA 12.50 7.61 15.63
SD nonMSA 46 32.39 NA NA 2.60 4.35 49.08 50.00 48.32 45.65 9.80 NA 0.00 8.82 11.39
Data shown includes only one to four-family and manufactured housing (property type 1 or 2). * Based on 2011 Peer Mortgage Data (USPR). ** Home improvement loans originated and purchased in the MA/AA as a percentage of all home improvement loans originated and purchased in the rated area. *** Percentage of Owner-Occupied Units is the number of owner-occupied housing units in a particular geography divided by number of owner-occupied housing units in the area based on 2000 Census information.

Charter Number 24
D - 272
Table 4. Geographic Distribution of Home Mortgage Refinance Loans
Geographic Distribution: HOME MORTGAGE REFINANCE Geography: SOUTH DAKOTA Evaluation Period: JANUARY 1, 2009 To DECEMBER 31, 2011
MA/Assessment Area:
Total Home Mortgage Refinance
Loans
Low-Income Geographies
Moderate-Income Geographies
Middle-Income Geographies
Upper-Income Geographies
Market Share (%) by Geography*
#
% of
Total**
% Owner
Occ Units***
% USB Loans
% Owner
Occ Units***
% USB Loans
% Owner
Occ Units***
% USB Loans
% Owner
Occ Units***
%
USB Loans
Overall
Low
Mod
Mid
Upp
Full-Review:
Sioux Falls 1,164 57.28 NA NA 9.83 4.47 71.68 71.99 18.48 23.54 5.38 NA 5.79 5.64 4.45
Limited-Review:
Rapid City 503 24.75 NA NA 21.00 8.75 45.37 32.01 33.63 59.24 6.94 NA 2.90 5.91 9.09
SD nonMSA 365 17.96 NA NA 2.60 1.37 49.08 46.03 48.32 52.60 7.96 NA 12.50 10.49 5.91
Data shown includes only one to four-family and manufactured housing (property type 1 or 2). * Based on 2011 Peer Mortgage Data (USPR). ** Home mortgage refinance loans originated and purchased in the MA/AA as a percentage of all home mortgage refinance loans originated and purchased in the rated area. *** Percentage of Owner-Occupied Units is the number of owner-occupied housing units in a particular geography divided by number of owner-occupied housing units in the area based on 2000 Census information.

Charter Number 24
D - 273
Table 5. Geographic Distribution of Multifamily Loans
Geographic Distribution: MULTIFAMILY Geography: SOUTH DAKOTA Evaluation Period: JANUARY 1, 2009 To DECEMBER 31, 2011
MA/Assessment Area:
Total Multifamily
Loans
Low-Income Geographies
Moderate-Income
Geographies
Middle-Income Geographies
Upper-Income Geographies
Market Share (%) by Geography*
#
% of Total**
% of MF Units***
% USB Loans
% MF Units***
% USB Loans
% MF Units***
% USB Loans
% MF Units***
% USB Loans
Overall
Low
Mod
Mid
Upp
Full-Review:
Sioux Falls 2 33.33 NA NA 32.66 50.00 59.58 50.00 7.76 0.00 0.00 NA 0.00 0.00 0.00
Limited-Review:
Rapid City 4 66.67 NA NA 45.55 75.00 26.09 25.00 28.36 0.00 26.67 NA 60.00 16.67 0.00
SD nonMSA 0 0.00 NA NA 9.06 0.00 45.63 0.00 45.31 0.00 0.00 NA 0.00 0.00 0.00
Multifamily loan distribution includes Home Purchases, Home Improvement and Refinances. * Based on 2011 Peer Mortgage Data (USPR). ** Multifamily loans originated and purchased in the MA/AA as a percentage of all multifamily loans originated and purchased in the rated area. *** Percentage of multifamily units is the number of multifamily housing units in a particular geography divided by number of multifamily housing units in the area based on 2000 Census information.
Table 6. Geographic Distribution of Small Loans to Businesses Geographic Distribution: SMALL LOANS TO BUSINESSES Geography: SOUTH DAKOTA Evaluation Period: JANUARY 1, 2009 To DECEMBER 31, 2011
MA/Assessment Area:
Total Small
Business Loans
Low-Income Geographies
Moderate-Income
Geographies
Middle-Income Geographies
Upper-Income Geographies
Market Share (%) by Geography*
#
% of Total
**
% of
Businesses ***
% USB Loans
% of
Businesses ***
% USB Loans
% of
Businesses ***
% USB Loans
% of
Businesses ***
% USB Loans
Overall
Low
Mod
Mid
Upp
Full-Review:
Sioux Falls 2,117 47.25 NA NA 14.81 17.62 73.53 71.71 11.66 10.68 17.82 NA 21.64 17.09 17.23
Limited-Review:
Rapid City 1,590 35.49 NA NA 33.25 33.58 41.01 34.15 25.74 32.26 28.47 NA 29.00 24.88 33.81
SD nonMSA 773 17.25 NA NA 8.48 13.58 48.64 36.22 42.88 50.19 18.14 NA 18.59 15.31 19.42
* Based on 2011 Peer Small Business Data – US and PR. ** Small loans to businesses originated and purchased in the MA/AA as a percentage of all small loans to businesses originated and purchased in the rated area. *** Source Data - Dun and Bradstreet (2011).

Charter Number 24
D - 274
Table 7. Geographic Distribution of Small Loans to Farms
Geographic Distribution: SMALL LOANS TO FARMS Geography: SOUTH DAKOTA Evaluation Period: JANUARY 1, 2009 To DECEMBER 31, 2011
MA/Assessment Area:
Total Small
Farm Loans
Low-Income Geographies
Moderate-Income
Geographies
Middle-Income Geographies
Upper-Income Geographies
Market Share (%) by Geography*
#
% of
Total**
% of
Farms***
% USB Loans
% of
Farms***
% USB Loans
% of
Farms***
% USB Loans
% of
Farms***
% USB Loans
Overall
Low
Mod
Mid
Upp
Full-Review:
Sioux Falls 392 80.99 NA NA 3.78 1.02 88.80 94.64 7.41 4.34 22.32 NA 0.00 22.07 31.58
Limited-Review:
Rapid City 22 4.55 NA NA 16.38 0.00 61.79 59.09 21.84 40.91 3.10 NA 0.00 2.40 40.00
SD nonMSA 70 14.46 NA NA 1.43 4.29 54.86 68.57 43.71 27.14 5.10 NA 14.29 6.19 2.86
* Based on 2011 Peer Small Business Data – US and PR. ** Small loans to farms originated and purchased in the MA/AA as a percentage of all small loans to farms originated and purchased in the rated area. *** Source Data - Dun and Bradstreet (2011).
Table 8. Borrower Distribution of Home Purchase Loans Borrower Distribution: HOME PURCHASE Geography: SOUTH DAKOTA Evaluation Period: JANUARY 1, 2009 To DECEMBER 31, 2011
MA/Assessment Area:
Total Home Purchase
Loans
Low-Income Borrowers
Moderate-Income
Borrowers
Middle-Income
Borrowers
Upper-Income
Borrowers
Market Share*
#
% of Total
**
% Families
***
% USB Loans
****
% Families
***
% USB Loans
****
% Families
***
% USB Loans
****
% Families
***
% USB Loans
****
Over-
all
Low
Mod
Mid
Upp
Full-Review:
Sioux Falls 389 56.87 14.74 18.29 19.03 31.71 28.53 23.43 37.70 26.57 2.56 2.64 2.92 1.96 2.73
Limited-Review:
Rapid City 194 28.36 17.91 4.20 17.68 15.38 24.97 21.68 39.44 58.74 3.00 1.32 1.87 1.90 4.77
SD nonMSA 101 14.77 13.96 8.33 14.57 17.86 23.03 28.57 48.45 45.24 4.22 10.20 2.97 3.43 4.62
Data shown includes only one to four-family and manufactured housing (property type 1 or 2). * Based on 2011 Peer Mortgage Data (USPR). ** Home purchase loans originated and purchased in the MA/AA as a percentage of all home purchase loans originated and purchased in the rated area. *** Percentage of Families is based on the 2000 Census information. **** As a percentage of loans with borrower income information available. No information was available for 15.6% of loans originated and purchased by USB in the Multistate MAs.

Charter Number 24
D - 275
Table 9. Borrower Distribution of Home Improvement Loans
Borrower Distribution: HOME IMPROVEMENT Geography: SOUTH DAKOTA Evaluation Period: JANUARY 1, 2009 To DECEMBER 31, 2011
MA/Assessment Area:
Total Home Improvement
Loans
Low-Income Borrowers
Moderate-Income
Borrowers
Middle-Income
Borrowers
Upper-Income
Borrowers
Market Share*
#
% of Total
**
% Families
***
% USB Loans
****
% Families
***
% USB Loans
****
% Families
***
% USB Loans
****
% Families
***
% USB Loans
****
Over-
all
Low
Mod
Mid
Upp
Full-Review:
Sioux Falls 61 42.96 14.74 13.11 19.03 24.59 28.53 29.51 37.70 32.79 5.41 6.12 4.31 6.72 4.95
Limited-Review:
Rapid City 35 24.65 17.91 20.00 17.68 14.29 24.97 22.86 39.44 42.86 11.80 16.67 6.45 14.00 11.76
SD nonMSA 46 32.39 13.96 4.44 14.57 6.67 23.03 26.67 48.45 62.22 10.56 0.00 0.00 5.56 20.63
Data shown includes only one to four-family and manufactured housing (property type of 1 or 2). * Based on 2011 Peer Mortgage Data (USPR). ** Home improvement loans originated and purchased in the MA/AA as a percentage of all home improvement loans originated and purchased in the rated area. *** Percentage of Families is based on the 2000 Census information. **** As a percentage of loans with borrower income information available. No information was available for 0.7% of loans originated and purchased by the bank. Table 10. Borrower Distribution of Home Mortgage Refinance Loans
Borrower Distribution: HOME MORTGAGE REFINANCE Geography: SOUTH DAKOTA Evaluation Period: JANUARY 1, 2009 To DECEMBER 31, 2011
MA/Assessment Area:
Total Home Mortgage Refinance
Loans
Low-Income Borrowers
Moderate-Income Borrowers
Middle-Income Borrowers
Upper-Income Borrowers
Market Share*
#
% of Total
**
% Families
***
% USB Loans
****
% Families
***
% USB Loans
****
% Families
***
% USB Loans
****
% Families
***
% USB Loans
****
Over-
all
Low
Mod
Mid
Upp
Full-Review:
Sioux Falls 1,164 57.28 14.74 9.16 19.03 22.81 28.53 28.44 37.70 39.60 6.23 9.02 8.79 6.11 4.84
Limited-Review:
Rapid City 503 24.75 17.91 3.33 17.68 11.67 24.97 21.19 39.44 63.81 7.94 1.25 8.70 7.88 8.29
SD nonMSA 365 17.96 13.96 3.23 14.57 9.68 23.03 20.82 48.45 66.28 8.94 11.63 8.61 7.58 9.36
Data shown includes only one to four-family and manufactured housing (property type 1 or 2). * Based on 2011 Peer Mortgage Data (USPR). ** Home refinance loans originated and purchased in the MA/AA as a percentage of all home refinance loans originated and purchased in the rated area. *** Percentage of Families is based on the 2000 Census information. **** As a percentage of loans with borrower income information available. No information was available for 11.0% of loans originated and purchased by the bank.

Charter Number 24
D - 276
Table 11. Borrower Distribution of Small Loans to Businesses
Borrower Distribution: SMALL LOANS TO BUSINESSES Geography: SOUTH DAKOTA Evaluation Period: JANUARY 1, 2009 To DECEMBER 31, 2011
MA/Assessment Area:
Total Small Loans to
Businesses
Businesses With Revenues of $1 million or
less
Loans by Original Amount Regardless of Business Size
Market Share*
#
% of
Total**
% of Businesses
***
% USB
Loans****
$100,000 or
less
>$100,000 to $250,000
>$250,000 to $1,000,000
All
Rev $1 Million or
Less Full-Review:
Sioux Falls 2,117 47.25 67.22 52.67 90.79 3.02 6.19 17.82 15.96
Limited-Review:
Rapid City 1,590 35.49 67.56 45.91 74.28 11.76 13.96 28.47 23.36
SD nonMSA 773 17.25 68.05 57.96 89.00 4.92 6.08 18.14 17.30
* Based on 2011 Peer Small Business Data – US and PR. ** Small loans to businesses originated and purchased in the MA/AA as a percentage of all small loans to businesses originated and purchased in the rated area. *** Businesses with revenues of $1 million or less as a percentage of all businesses (Source Dun and Bradstreet - 2011). **** Small loans to businesses with revenues of $1 million or less as a percentage of all loans reported as small loans to businesses. No information was available for 27.1% of small loans to businesses originated and purchased by the bank.
Table 12. Borrower Distribution of Small Loans to Farms Borrower Distribution: SMALL LOANS TO FARMS Geography: SOUTH DAKOTA Evaluation Period: JANUARY 1, 2009 To DECEMBER 31, 2011
MA/Assessment Area:
Total Small Loans to Farms
Farms With Revenues of $1 million or less
Loans by Original Amount Regardless of Farm Size
Market Share*
#
% of
Total**
% of
Farms***
% USB
Loans****
$100,000 or
less
>$100,000 to $250,000
>$250,000 to $500,000
All
Rev $1 Million or
Less Full-Review:
Sioux Falls 392 80.99 98.79 96.43 52.30 30.10 17.60 22.32 24.10
Limited-Review:
Rapid City 22 4.55 99.26 81.82 63.64 18.18 18.18 3.10 3.40
SD nonMSA 70 14.46 98.23 84.29 34.29 37.14 28.57 5.10 5.16
* Based on 2011 Peer Small Business Data – US and PR. ** Small loans to farms originated and purchased in the MA/AA as a percentage of all small loans to farms originated and purchased in the rated area. *** Farms with revenues of $1 million or less as a percentage of all farms (Source Dun and Bradstreet - 2011). **** Small loans to farms with revenues of $1 million or less as a percentage of all loans reported as small loans to farms. No information was available for 0.6% of small loans to farms originated and purchased by the bank.
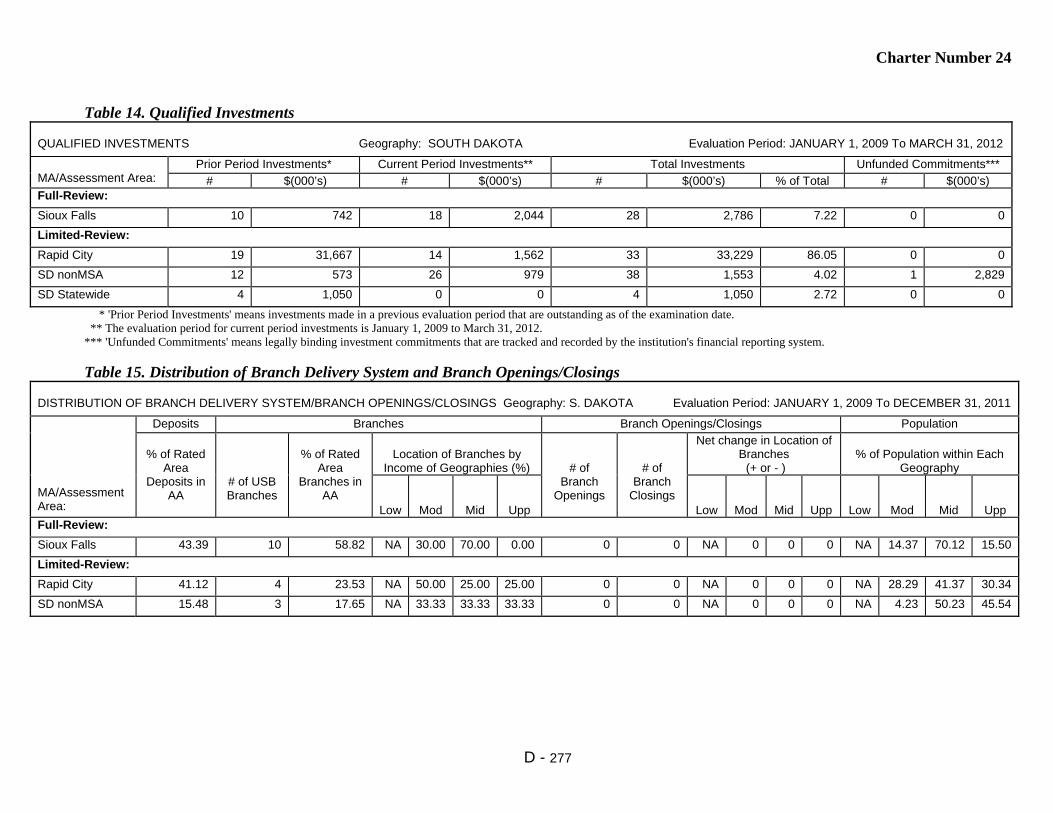
Charter Number 24
D - 277
Table 14. Qualified Investments
QUALIFIED INVESTMENTS Geography: SOUTH DAKOTA Evaluation Period: JANUARY 1, 2009 To MARCH 31, 2012
MA/Assessment Area:
Prior Period Investments* Current Period Investments** Total Investments Unfunded Commitments***
# $(000’s) # $(000’s) # $(000’s) % of Total # $(000’s) Full-Review:
Sioux Falls 10 742 18 2,044 28 2,786 7.22 0 0
Limited-Review:
Rapid City 19 31,667 14 1,562 33 33,229 86.05 0 0
SD nonMSA 12 573 26 979 38 1,553 4.02 1 2,829
SD Statewide 4 1,050 0 0 4 1,050 2.72 0 0
* 'Prior Period Investments' means investments made in a previous evaluation period that are outstanding as of the examination date. ** The evaluation period for current period investments is January 1, 2009 to March 31, 2012. *** 'Unfunded Commitments' means legally binding investment commitments that are tracked and recorded by the institution's financial reporting system.
Table 15. Distribution of Branch Delivery System and Branch Openings/Closings DISTRIBUTION OF BRANCH DELIVERY SYSTEM/BRANCH OPENINGS/CLOSINGS Geography: S. DAKOTA Evaluation Period: JANUARY 1, 2009 To DECEMBER 31, 2011
MA/Assessment Area:
Deposits Branches Branch Openings/Closings Population
% of Rated
Area Deposits in
AA
# of USB Branches
% of Rated
Area Branches in
AA
Location of Branches by
Income of Geographies (%)
# of Branch
Openings
# of Branch
Closings
Net change in Location of Branches (+ or - )
% of Population within Each
Geography
Low
Mod
Mid
Upp
Low
Mod
Mid
Upp
Low
Mod
Mid
Upp
Full-Review:
Sioux Falls 43.39 10 58.82 NA 30.00 70.00 0.00 0 0 NA 0 0 0 NA 14.37 70.12 15.50
Limited-Review:
Rapid City 41.12 4 23.53 NA 50.00 25.00 25.00 0 0 NA 0 0 0 NA 28.29 41.37 30.34
SD nonMSA 15.48 3 17.65 NA 33.33 33.33 33.33 0 0 NA 0 0 0 NA 4.23 50.23 45.54

Charter Number 24
D - 278
Table 1. Lending Volume
LENDING VOLUME Geography: TENNESSEE Evaluation Period: JANUARY 1, 2009 To DECEMBER 31, 2011
MA/Assessment Area:
%of
Rated Area
Loans (#) in MA/AA*
Home Mortgage
Small Loans to
Businesses
Small Loans to Farms
Community
Development Loans**
Total Reported Loans
% of Rated Area Deposits in MA/AA***
#
$ (000’s)
#
$ (000’s)
#
$ (000’s)
#
$ (000’s)
#
$(000’s)
Full-Review:
Nashville-Davidson- Murfreesboro-Franklin
74.70 7,553 1,311,878 5,414 156,624 25 1,061 6 13,503 12,998 1,483,066 64.18
Limited-Review:
Kingsport-Bristol-Bristol 3.32 348 34,581 219 4,712 10 690 1 700 578 40,683 5.96
Morristown 1.39 141 16,341 98 1,231 2 114 0 0 241 17,686 2.20
TN nonMSA 20.59 2,430 255,285 1,122 27,803 30 1,286 1 1,060 3,583 285,434 27.65
TN Statewide 0.00 0 0 0 0 0 0 0 0 0 0 NA
* Loan Data as of December 31, 2011. Rated area refers to either the state or multistate MA rating area. ** The evaluation period for Community Development Loans is from January 1, 2009 to March 31, 2012. *** Deposit Data as of June 30, 2011. Rated Area refers to the state, multistate MA, or institution, as appropriate.

Charter Number 24
D - 279
Table 2. Geographic Distribution of Home Purchase Loans
Geographic Distribution: HOME PURCHASE Geography: TENNESSEE Evaluation Period: JANUARY 1, 2009 To DECEMBER 31, 2011
MA/Assessment Area:
Total Home
Purchase Loans
Low-Income Geographies
Moderate-Income
Geographies
Middle-Income Geographies
Upper-Income Geographies
Market Share (%) by Geography*
#
% of
Total**
% Owner
Occ Units***
% USB Loans
% Owner
Occ Units***
% USB Loans
% Owner
Occ Units***
% USB Loans
% Owner
Occ Units***
%
USB Loans
Overall
Low
Mod
Mid
Upp
Full-Review:
Nashville-Davidson- Murfreesboro-Franklin
2,113 73.75 1.71 0.95 12.82 7.19 60.33 66.49 25.13 25.37 2.86 1.64 1.90 3.03 2.83
Limited-Review:
Kingsport-Bristol-Bristol 97 3.39 NA NA 6.94 4.12 93.06 95.88 NA NA 5.20 NA 4.00 5.28 NA
Morristown 22 0.77 NA NA NA NA 100.00 100.00 NA NA 1.23 NA NA 1.23 NA
TN nonMSA 633 22.09 NA NA 4.36 2.69 75.15 74.41 20.49 22.91 3.32 NA 0.85 3.58 2.90
Data shown includes only one to four-family and manufactured housing (property type 1 or 2). * Based on 2011 Peer Mortgage Data (USPR). ** Home purchase loans originated and purchased in the MA/AA as a percentage of all home purchase loans originated and purchased in the rated area. *** Percentage of Owner-Occupied Units is the number of owner-occupied housing units in a particular geography divided by the number of owner-occupied housing units in the area based on 2000 Census information.
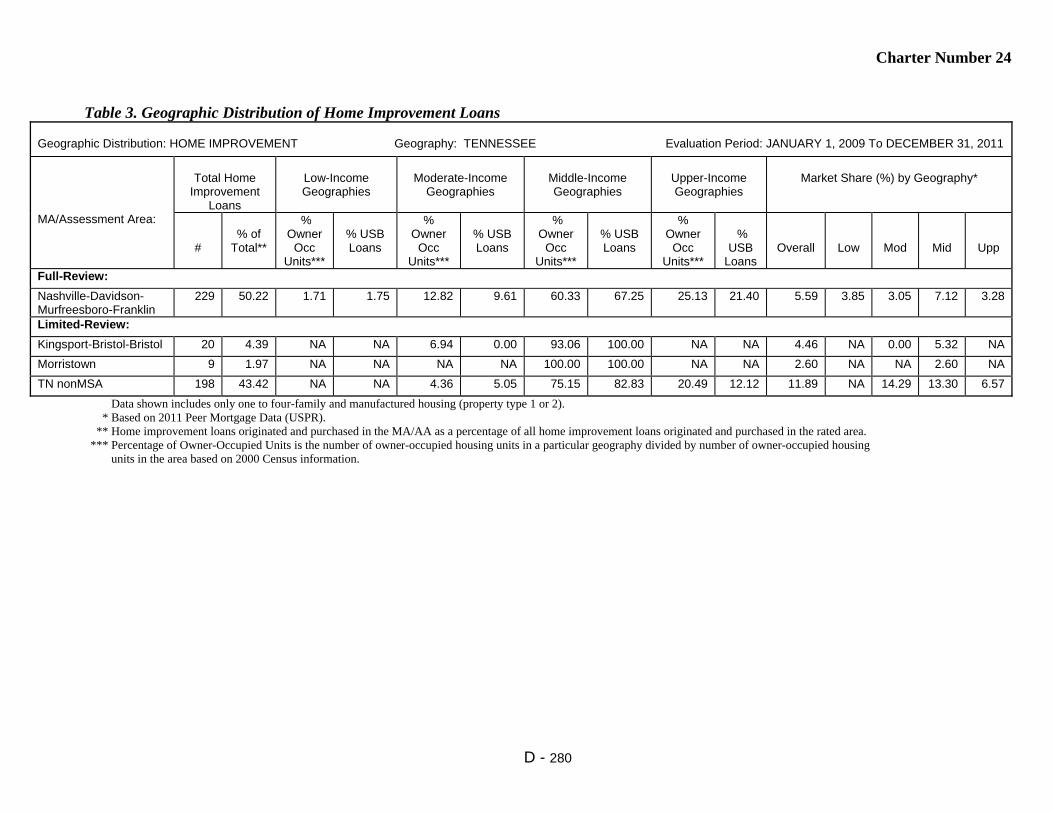
Charter Number 24
D - 280
Table 3. Geographic Distribution of Home Improvement Loans
Geographic Distribution: HOME IMPROVEMENT Geography: TENNESSEE Evaluation Period: JANUARY 1, 2009 To DECEMBER 31, 2011
MA/Assessment Area:
Total Home
Improvement Loans
Low-Income Geographies
Moderate-Income
Geographies
Middle-Income Geographies
Upper-Income Geographies
Market Share (%) by Geography*
#
% of
Total**
% Owner
Occ Units***
% USB Loans
% Owner
Occ Units***
% USB Loans
% Owner
Occ Units***
% USB Loans
% Owner
Occ Units***
%
USB Loans
Overall
Low
Mod
Mid
Upp
Full-Review:
Nashville-Davidson- Murfreesboro-Franklin
229 50.22 1.71 1.75 12.82 9.61 60.33 67.25 25.13 21.40 5.59 3.85 3.05 7.12 3.28
Limited-Review:
Kingsport-Bristol-Bristol 20 4.39 NA NA 6.94 0.00 93.06 100.00 NA NA 4.46 NA 0.00 5.32 NA
Morristown 9 1.97 NA NA NA NA 100.00 100.00 NA NA 2.60 NA NA 2.60 NA
TN nonMSA 198 43.42 NA NA 4.36 5.05 75.15 82.83 20.49 12.12 11.89 NA 14.29 13.30 6.57
Data shown includes only one to four-family and manufactured housing (property type 1 or 2). * Based on 2011 Peer Mortgage Data (USPR). ** Home improvement loans originated and purchased in the MA/AA as a percentage of all home improvement loans originated and purchased in the rated area. *** Percentage of Owner-Occupied Units is the number of owner-occupied housing units in a particular geography divided by number of owner-occupied housing units in the area based on 2000 Census information.

Charter Number 24
D - 281
Table 4. Geographic Distribution of Home Mortgage Refinance Loans
Geographic Distribution: HOME MORTGAGE REFINANCE Geography: TENNESSEE Evaluation Period: JANUARY 1, 2009 To DECEMBER 31, 2011
MA/Assessment Area:
Total Home Mortgage Refinance
Loans
Low-Income Geographies
Moderate-Income Geographies
Middle-Income Geographies
Upper-Income Geographies
Market Share (%) by Geography*
#
% of
Total**
% Owner
Occ Units***
% USB Loans
% Owner Occ
Units***
% USB Loans
% Owner
Occ Units***
% USB Loans
% Owner Occ
Units***
%
USB Loans
Overall
Low
Mod
Mid
Upp
Full-Review:
Nashville-Davidson- Murfreesboro-Franklin
5,204 72.84 1.71 0.50 12.82 7.63 60.33 60.09 25.13 31.78 4.70 3.72 4.53 4.79 4.61
Limited-Review:
Kingsport-Bristol-Bristol 231 3.23 NA NA 6.94 5.63 93.06 94.37 NA NA 9.70 NA 6.67 9.91 NA
Morristown 110 1.54 NA NA NA NA 100.00 100.00 NA NA 4.41 NA NA 4.41 NA
TN nonMSA 1,599 22.38 NA NA 4.36 2.88 75.15 75.36 20.49 21.76 6.51 NA 6.77 7.10 5.04
Data shown includes only one to four-family and manufactured housing (property type 1 or 2). * Based on 2011 Peer Mortgage Data (USPR). ** Home mortgage refinance loans originated and purchased in the MA/AA as a percentage of all home mortgage refinance loans originated and purchased in the rated area. *** Percentage of Owner-Occupied Units is the number of owner-occupied housing units in a particular geography divided by number of owner-occupied housing units in the area based on 2000 Census information.
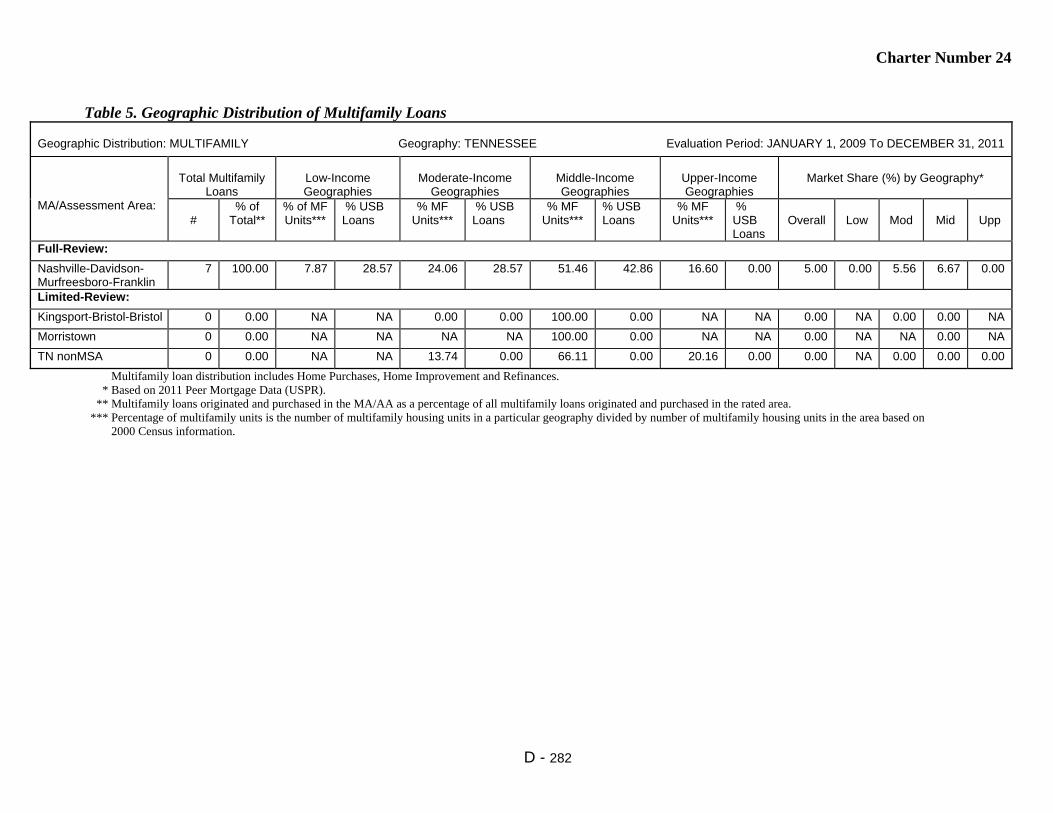
Charter Number 24
D - 282
Table 5. Geographic Distribution of Multifamily Loans
Geographic Distribution: MULTIFAMILY Geography: TENNESSEE Evaluation Period: JANUARY 1, 2009 To DECEMBER 31, 2011
MA/Assessment Area:
Total Multifamily
Loans
Low-Income Geographies
Moderate-Income
Geographies
Middle-Income Geographies
Upper-Income Geographies
Market Share (%) by Geography*
#
% of Total**
% of MF Units***
% USB Loans
% MF Units***
% USB Loans
% MF Units***
% USB Loans
% MF Units***
% USB Loans
Overall
Low
Mod
Mid
Upp
Full-Review:
Nashville-Davidson- Murfreesboro-Franklin
7 100.00 7.87 28.57 24.06 28.57 51.46 42.86 16.60 0.00 5.00 0.00 5.56 6.67 0.00
Limited-Review:
Kingsport-Bristol-Bristol 0 0.00 NA NA 0.00 0.00 100.00 0.00 NA NA 0.00 NA 0.00 0.00 NA
Morristown 0 0.00 NA NA NA NA 100.00 0.00 NA NA 0.00 NA NA 0.00 NA
TN nonMSA 0 0.00 NA NA 13.74 0.00 66.11 0.00 20.16 0.00 0.00 NA 0.00 0.00 0.00
Multifamily loan distribution includes Home Purchases, Home Improvement and Refinances. * Based on 2011 Peer Mortgage Data (USPR). ** Multifamily loans originated and purchased in the MA/AA as a percentage of all multifamily loans originated and purchased in the rated area. *** Percentage of multifamily units is the number of multifamily housing units in a particular geography divided by number of multifamily housing units in the area based on 2000 Census information.

Charter Number 24
D - 283
Table 6. Geographic Distribution of Small Loans to Businesses
Geographic Distribution: SMALL LOANS TO BUSINESSES Geography: TENNESSEE Evaluation Period: JANUARY 1, 2009 To DECEMBER 31, 2011
MA/Assessment Area:
Total Small Business
Loans
Low-Income Geographies
Moderate-Income
Geographies
Middle-Income Geographies
Upper-Income Geographies
Market Share (%) by Geography*
#
% of Total
**
% of
Businesses ***
% USB Loans
% of
Businesses ***
% USB Loans
% of
Businesses ***
% USB Loans
% of
Businesses ***
% USB Loans
Overall
Low
Mod
Mid
Upp
Full-Review:
Nashville-Davidson-Murfreesboro- Franklin
5,414 79.00 3.10 2.35 17.42 17.01 51.89 51.42 27.35 28.76 8.94 6.69 8.64 9.74 8.40
Limited-Review:
Kingsport-Bristol- Bristol
219 3.20 NA NA 6.62 3.65 93.38 96.35 NA NA 24.09 NA 22.22 24.57 NA
Morristown 98 1.43 NA NA NA NA 100.00 100.00 NA NA 9.11 NA NA 9.18 NA
TN nonMSA 1,122 16.37 NA NA 6.46 6.24 73.04 77.72 20.50 16.04 9.49 NA 7.87 11.11 6.06
* Based on 2011 Peer Small Business Data – US and PR. ** Small loans to businesses originated and purchased in the MA/AA as a percentage of all small loans to businesses originated and purchased in the rated area. *** Source Data - Dun and Bradstreet (2011).
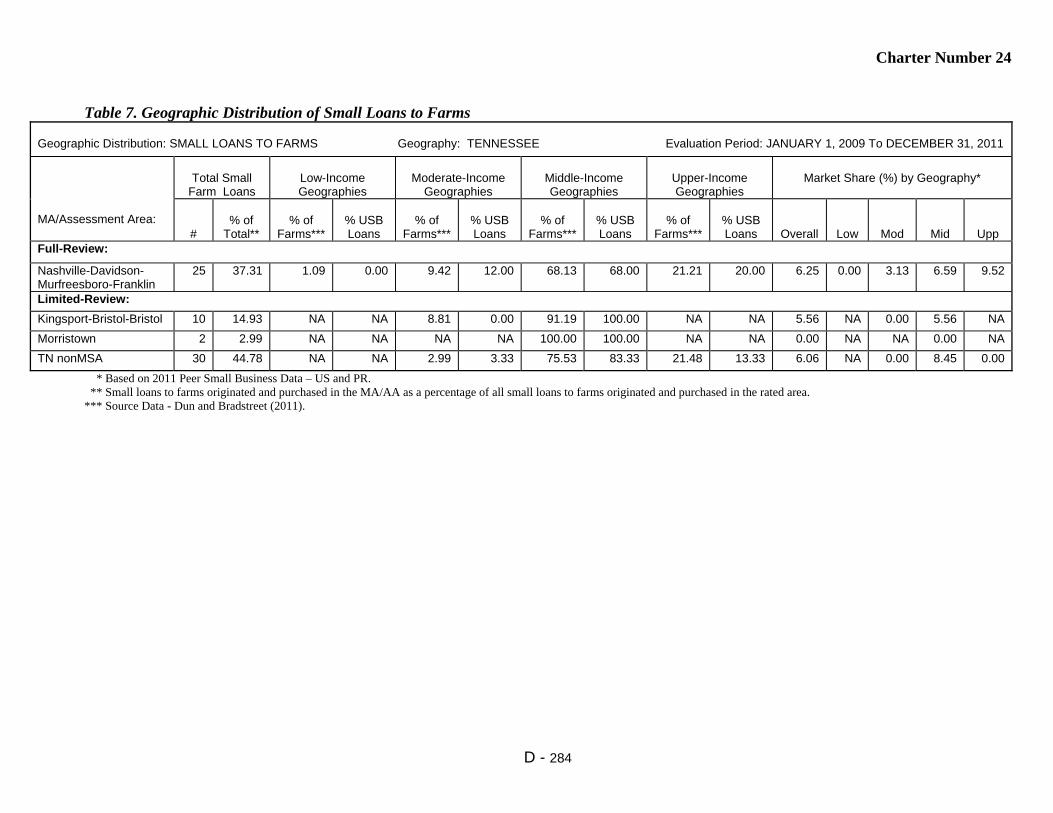
Charter Number 24
D - 284
Table 7. Geographic Distribution of Small Loans to Farms
Geographic Distribution: SMALL LOANS TO FARMS Geography: TENNESSEE Evaluation Period: JANUARY 1, 2009 To DECEMBER 31, 2011
MA/Assessment Area:
Total Small
Farm Loans
Low-Income Geographies
Moderate-Income
Geographies
Middle-Income Geographies
Upper-Income Geographies
Market Share (%) by Geography*
#
% of
Total**
% of
Farms***
% USB Loans
% of
Farms***
% USB Loans
% of
Farms***
% USB Loans
% of
Farms***
% USB Loans
Overall
Low
Mod
Mid
Upp
Full-Review:
Nashville-Davidson- Murfreesboro-Franklin
25 37.31 1.09 0.00 9.42 12.00 68.13 68.00 21.21 20.00 6.25 0.00 3.13 6.59 9.52
Limited-Review:
Kingsport-Bristol-Bristol 10 14.93 NA NA 8.81 0.00 91.19 100.00 NA NA 5.56 NA 0.00 5.56 NA
Morristown 2 2.99 NA NA NA NA 100.00 100.00 NA NA 0.00 NA NA 0.00 NA
TN nonMSA 30 44.78 NA NA 2.99 3.33 75.53 83.33 21.48 13.33 6.06 NA 0.00 8.45 0.00
* Based on 2011 Peer Small Business Data – US and PR. ** Small loans to farms originated and purchased in the MA/AA as a percentage of all small loans to farms originated and purchased in the rated area. *** Source Data - Dun and Bradstreet (2011).

Charter Number 24
D - 285
Table 8. Borrower Distribution of Home Purchase Loans
Borrower Distribution: HOME PURCHASE Geography: TENNESSEE Evaluation Period: JANUARY 1, 2009 To DECEMBER 31, 2011
MA/Assessment Area:
Total Home Purchase
Loans
Low-Income Borrowers
Moderate-Income
Borrowers
Middle-Income
Borrowers
Upper-Income
Borrowers
Market Share*
#
% of Total
**
% Families
***
% USB Loans
****
% Families
***
% USB Loans
****
% Families
***
% USB Loans
****
% Families
***
% USB Loans
****
Over-
all
Low
Mod
Mid
Upp
Full-Review:
Nashville-Davidson- Murfreesboro-Franklin
2,113 73.75 18.47 28.57 17.91 33.99 23.51 15.07 40.11 22.36 1.44 3.15 1.54 0.97 1.00
Limited-Review:
Kingsport-Bristol-Bristol 97 3.39 22.51 12.64 18.76 34.48 22.71 19.54 36.02 33.33 4.85 8.57 6.60 3.13 4.07
Morristown 22 0.77 18.02 0.00 18.32 38.46 23.98 7.69 39.69 53.85 0.67 0.00 0.90 0.00 1.10
TN nonMSA 633 22.09 18.10 10.81 16.74 31.32 21.72 26.56 43.43 31.32 3.16 4.00 4.26 2.86 2.55
Data shown includes only one to four-family and manufactured housing (property type 1 or 2). * Based on 2011 Peer Mortgage Data (USPR). ** Home purchase loans originated and purchased in the MA/AA as a percentage of all home purchase loans originated and purchased in the rated area. *** Percentage of Families is based on the 2000 Census information. **** As a percentage of loans with borrower income information available. No information was available for 42.0% of loans originated and purchased by USB in the Multistate MAs.
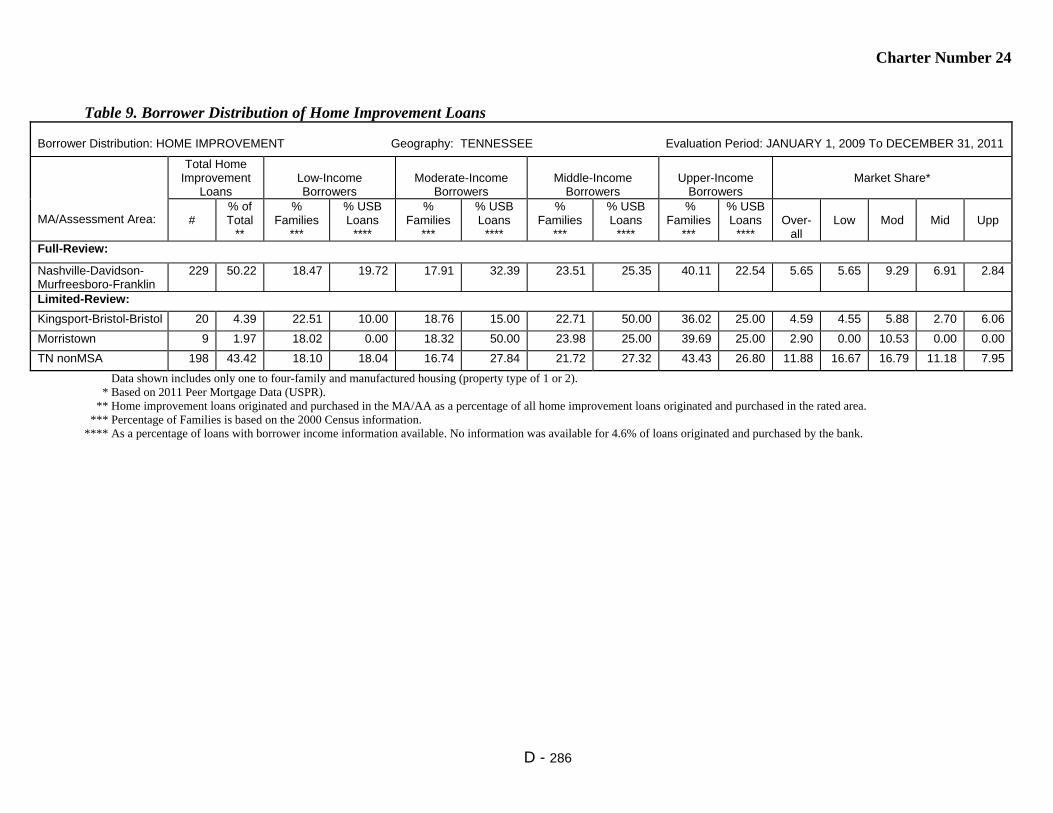
Charter Number 24
D - 286
Table 9. Borrower Distribution of Home Improvement Loans
Borrower Distribution: HOME IMPROVEMENT Geography: TENNESSEE Evaluation Period: JANUARY 1, 2009 To DECEMBER 31, 2011
MA/Assessment Area:
Total Home Improvement
Loans
Low-Income Borrowers
Moderate-Income
Borrowers
Middle-Income
Borrowers
Upper-Income
Borrowers
Market Share*
#
% of Total
**
% Families
***
% USB Loans
****
% Families
***
% USB Loans
****
% Families
***
% USB Loans
****
% Families
***
% USB Loans
****
Over-
all
Low
Mod
Mid
Upp
Full-Review:
Nashville-Davidson- Murfreesboro-Franklin
229 50.22 18.47 19.72 17.91 32.39 23.51 25.35 40.11 22.54 5.65 5.65 9.29 6.91 2.84
Limited-Review:
Kingsport-Bristol-Bristol 20 4.39 22.51 10.00 18.76 15.00 22.71 50.00 36.02 25.00 4.59 4.55 5.88 2.70 6.06
Morristown 9 1.97 18.02 0.00 18.32 50.00 23.98 25.00 39.69 25.00 2.90 0.00 10.53 0.00 0.00
TN nonMSA 198 43.42 18.10 18.04 16.74 27.84 21.72 27.32 43.43 26.80 11.88 16.67 16.79 11.18 7.95
Data shown includes only one to four-family and manufactured housing (property type of 1 or 2). * Based on 2011 Peer Mortgage Data (USPR). ** Home improvement loans originated and purchased in the MA/AA as a percentage of all home improvement loans originated and purchased in the rated area. *** Percentage of Families is based on the 2000 Census information. **** As a percentage of loans with borrower income information available. No information was available for 4.6% of loans originated and purchased by the bank.

Charter Number 24
D - 287
Table 10. Borrower Distribution of Home Mortgage Refinance Loans
Borrower Distribution: HOME MORTGAGE REFINANCE Geography: TENNESSEE Evaluation Period: JANUARY 1, 2009 To DECEMBER 31, 2011
MA/Assessment Area:
Total Home Mortgage Refinance
Loans
Low-Income Borrowers
Moderate-Income Borrowers
Middle-Income Borrowers
Upper-Income Borrowers
Market Share*
#
% of Total
**
% Families
***
% USB Loans
****
% Families
***
% USB Loans
****
% Families
***
% USB Loans
****
% Families
***
% USB
Loans ****
Over-
all
Low
Mod
Mid
Upp
Full-Review:
Nashville-Davidson- Murfreesboro-Franklin
5,204 72.84 18.47 11.82 17.91 22.69 23.51 24.41 40.11 41.07 3.78 5.80 4.14 3.89 3.27
Limited-Review:
Kingsport-Bristol-Bristo 231 3.23 22.51 13.82 18.76 27.65 22.71 27.65 36.02 30.88 11.06 17.07 13.64 10.75 8.91
Morristown 110 1.54 18.02 11.69 18.32 33.77 23.98 23.38 39.69 31.17 5.04 4.88 10.66 2.88 3.75
TN nonMSA 1,599 22.38 18.10 8.11 16.74 20.84 21.72 27.38 43.43 43.67 6.90 13.51 8.78 8.09 5.35
Data shown includes only one to four-family and manufactured housing (property type 1 or 2). * Based on 2011 Peer Mortgage Data (USPR). ** Home refinance loans originated and purchased in the MA/AA as a percentage of all home refinance loans originated and purchased in the rated area. *** Percentage of Families is based on the 2000 Census information. **** As a percentage of loans with borrower income information available. No information was available for 36.3% of loans originated and purchased by the bank.
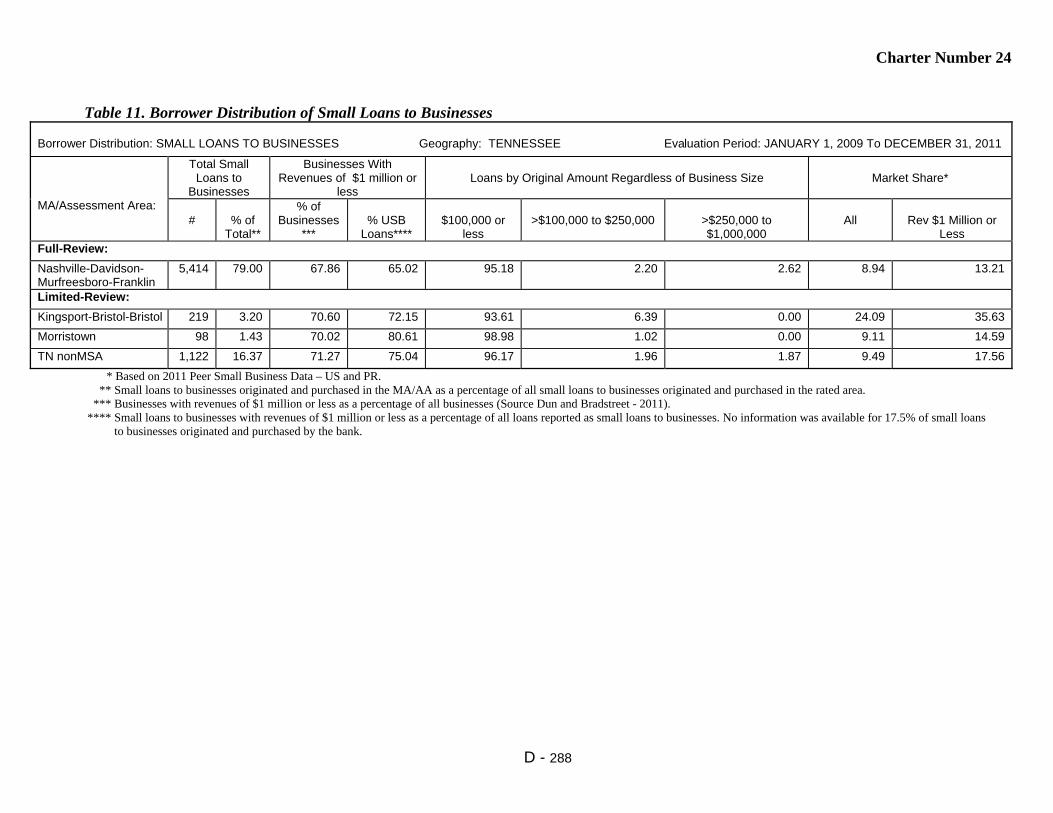
Charter Number 24
D - 288
Table 11. Borrower Distribution of Small Loans to Businesses
Borrower Distribution: SMALL LOANS TO BUSINESSES Geography: TENNESSEE Evaluation Period: JANUARY 1, 2009 To DECEMBER 31, 2011
MA/Assessment Area:
Total Small Loans to
Businesses
Businesses With Revenues of $1 million or
less
Loans by Original Amount Regardless of Business Size
Market Share*
#
% of
Total**
% of Businesses
***
% USB
Loans****
$100,000 or
less
>$100,000 to $250,000
>$250,000 to $1,000,000
All
Rev $1 Million or
Less Full-Review:
Nashville-Davidson- Murfreesboro-Franklin
5,414 79.00 67.86 65.02 95.18 2.20 2.62 8.94 13.21
Limited-Review:
Kingsport-Bristol-Bristol 219 3.20 70.60 72.15 93.61 6.39 0.00 24.09 35.63
Morristown 98 1.43 70.02 80.61 98.98 1.02 0.00 9.11 14.59
TN nonMSA 1,122 16.37 71.27 75.04 96.17 1.96 1.87 9.49 17.56
* Based on 2011 Peer Small Business Data – US and PR. ** Small loans to businesses originated and purchased in the MA/AA as a percentage of all small loans to businesses originated and purchased in the rated area. *** Businesses with revenues of $1 million or less as a percentage of all businesses (Source Dun and Bradstreet - 2011). **** Small loans to businesses with revenues of $1 million or less as a percentage of all loans reported as small loans to businesses. No information was available for 17.5% of small loans to businesses originated and purchased by the bank.

Charter Number 24
D - 289
Table 12. Borrower Distribution of Small Loans to Farms
Borrower Distribution: SMALL LOANS TO FARMS Geography: TENNESSEE Evaluation Period: JANUARY 1, 2009 To DECEMBER 31, 2011
MA/Assessment Area:
Total Small Loans to Farms
Farms With Revenues of $1 million or less
Loans by Original Amount Regardless of Farm Size
Market Share*
#
% of
Total**
% of
Farms***
USB
Loans****
$100,000 or
less
>$100,000 to $250,000
>$250,000 to $500,000
All
Rev $1 Million or
Less Full-Review:
Nashville-Davidson- Murfreesboro-Franklin
25 37.31 97.91 84.00 88.00 4.00 8.00 6.25 8.18
Limited-Review:
Kingsport-Bristol-Bristol 10 14.93 97.93 100.00 70.00 30.00 0.00 5.56 6.67
Morristown 2 2.99 98.12 50.00 50.00 50.00 0.00 0.00 0.00
TN nonMSA 30 44.78 98.45 93.33 83.33 16.67 0.00 6.06 9.68
* Based on 2011 Peer Small Business Data – US and PR. ** Small loans to farms originated and purchased in the MA/AA as a percentage of all small loans to farms originated and purchased in the rated area. *** Farms with revenues of $1 million or less as a percentage of all farms (Source Dun and Bradstreet - 2011). **** Small loans to farms with revenues of $1 million or less as a percentage of all loans reported as small loans to farms. No information was available for 7.5% of small loans to farms originated and purchased by the bank.
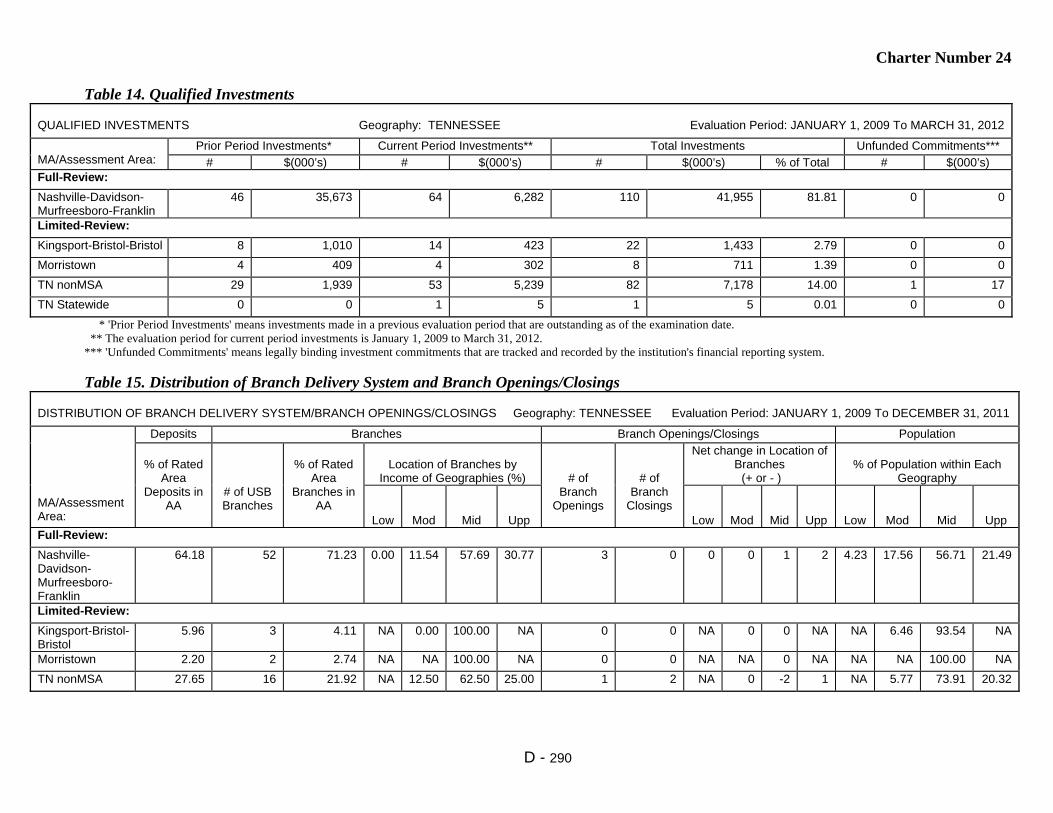
Charter Number 24
D - 290
Table 14. Qualified Investments
QUALIFIED INVESTMENTS Geography: TENNESSEE Evaluation Period: JANUARY 1, 2009 To MARCH 31, 2012
MA/Assessment Area:
Prior Period Investments* Current Period Investments** Total Investments Unfunded Commitments***
# $(000’s) # $(000’s) # $(000’s) % of Total # $(000’s) Full-Review:
Nashville-Davidson- Murfreesboro-Franklin
46 35,673 64 6,282 110 41,955 81.81 0 0
Limited-Review:
Kingsport-Bristol-Bristol 8 1,010 14 423 22 1,433 2.79 0 0
Morristown 4 409 4 302 8 711 1.39 0 0
TN nonMSA 29 1,939 53 5,239 82 7,178 14.00 1 17
TN Statewide 0 0 1 5 1 5 0.01 0 0
* 'Prior Period Investments' means investments made in a previous evaluation period that are outstanding as of the examination date. ** The evaluation period for current period investments is January 1, 2009 to March 31, 2012. *** 'Unfunded Commitments' means legally binding investment commitments that are tracked and recorded by the institution's financial reporting system.
Table 15. Distribution of Branch Delivery System and Branch Openings/Closings DISTRIBUTION OF BRANCH DELIVERY SYSTEM/BRANCH OPENINGS/CLOSINGS Geography: TENNESSEE Evaluation Period: JANUARY 1, 2009 To DECEMBER 31, 2011
MA/Assessment Area:
Deposits Branches Branch Openings/Closings Population
% of Rated
Area Deposits in
AA
# of USB Branches
% of Rated
Area Branches in
AA
Location of Branches by
Income of Geographies (%)
# of Branch
Openings
# of Branch
Closings
Net change in Location of Branches (+ or - )
% of Population within Each
Geography
Low
Mod
Mid
Upp
Low
Mod
Mid
Upp
Low
Mod
Mid
Upp
Full-Review:
Nashville- Davidson- Murfreesboro- Franklin
64.18 52 71.23 0.00 11.54 57.69 30.77 3 0 0 0 1 2 4.23 17.56 56.71 21.49
Limited-Review:
Kingsport-Bristol- Bristol
5.96 3 4.11 NA 0.00 100.00 NA 0 0 NA 0 0 NA NA 6.46 93.54 NA
Morristown 2.20 2 2.74 NA NA 100.00 NA 0 0 NA NA 0 NA NA NA 100.00 NA
TN nonMSA 27.65 16 21.92 NA 12.50 62.50 25.00 1 2 NA 0 -2 1 NA 5.77 73.91 20.32

Charter Number 24
D - 291
Table 1. Lending Volume
LENDING VOLUME Geography: UTAH Evaluation Period: JANUARY 1, 2009 To DECEMBER 31, 2011
MA/Assessment Area:
% of
Rated Area
Loans (#) in MA/AA*
Home Mortgage
Small Loans to
Businesses
Small Loans to Farms
Community
Development Loans**
Total Reported Loans
% of Rated Area Deposits in MA/AA***
#
$ (000’s)
#
$ (000’s)
#
$ (000’s)
#
$ (000’s)
#
$(000’s)
Full-Review:
Salt Lake City 50.52 6,391 1,492,185 4,163 190,890 8 64 8 27,324 10,570 1,710,463 84.46
Limited-Review:
Ogden-Clearfield 20.10 3,207 663,561 997 32,940 0 0 2 7,817 4,206 704,318 6.11
Provo-Orem 17.79 2,456 526,736 1,259 30,441 6 131 0 0 3,721 557,308 3.04
St. George 6.42 899 185,876 444 11,656 0 0 1 5 1,344 197,537 5.78
UT nonMSA 5.17 904 174,662 175 3,578 2 65 0 0 1,081 178,305 0.60
UT Statewide 0.00 0 0 0 0 0 0 0 0 0 0 NA
* Loan Data as of December 31, 2011. Rated area refers to either the state or multistate MA rating area. ** The evaluation period for Community Development Loans is from January 1, 2009 to March 31, 2012. *** Deposit Data as of June 30, 2011. Rated Area refers to the state, multistate MA, or institution, as appropriate.
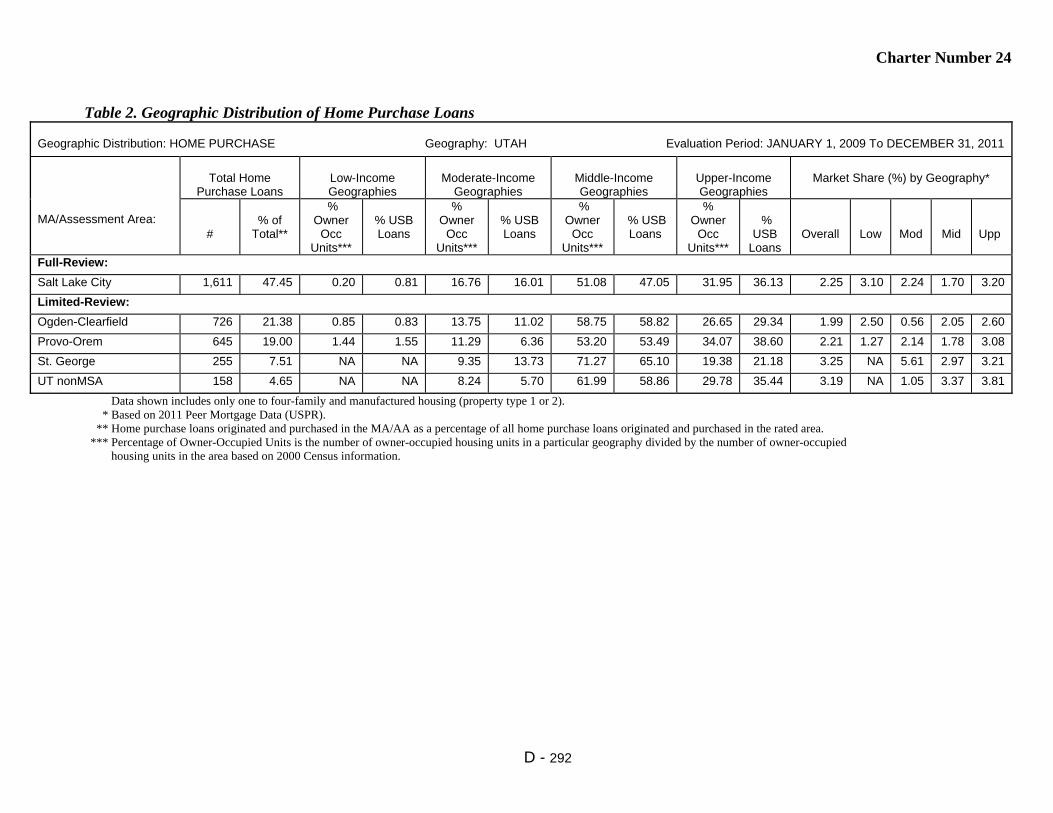
Charter Number 24
D - 292
Table 2. Geographic Distribution of Home Purchase Loans
Geographic Distribution: HOME PURCHASE Geography: UTAH Evaluation Period: JANUARY 1, 2009 To DECEMBER 31, 2011
MA/Assessment Area:
Total Home
Purchase Loans
Low-Income Geographies
Moderate-Income
Geographies
Middle-Income Geographies
Upper-Income Geographies
Market Share (%) by Geography*
#
% of
Total**
% Owner
Occ Units***
% USB Loans
% Owner
Occ Units***
% USB Loans
% Owner
Occ Units***
% USB Loans
% Owner
Occ Units***
%
USB Loans
Overall
Low
Mod
Mid
Upp
Full-Review:
Salt Lake City 1,611 47.45 0.20 0.81 16.76 16.01 51.08 47.05 31.95 36.13 2.25 3.10 2.24 1.70 3.20
Limited-Review:
Ogden-Clearfield 726 21.38 0.85 0.83 13.75 11.02 58.75 58.82 26.65 29.34 1.99 2.50 0.56 2.05 2.60
Provo-Orem 645 19.00 1.44 1.55 11.29 6.36 53.20 53.49 34.07 38.60 2.21 1.27 2.14 1.78 3.08
St. George 255 7.51 NA NA 9.35 13.73 71.27 65.10 19.38 21.18 3.25 NA 5.61 2.97 3.21
UT nonMSA 158 4.65 NA NA 8.24 5.70 61.99 58.86 29.78 35.44 3.19 NA 1.05 3.37 3.81
Data shown includes only one to four-family and manufactured housing (property type 1 or 2). * Based on 2011 Peer Mortgage Data (USPR). ** Home purchase loans originated and purchased in the MA/AA as a percentage of all home purchase loans originated and purchased in the rated area. *** Percentage of Owner-Occupied Units is the number of owner-occupied housing units in a particular geography divided by the number of owner-occupied housing units in the area based on 2000 Census information.

Charter Number 24
D - 293
Table 3. Geographic Distribution of Home Improvement Loans
Geographic Distribution: HOME IMPROVEMENT Geography: UTAH Evaluation Period: JANUARY 1, 2009 To DECEMBER 31, 2011
MA/Assessment Area:
Total Home
Improvement Loans
Low-Income Geographies
Moderate-Income
Geographies
Middle-Income Geographies
Upper-Income Geographies
Market Share (%) by Geography*
#
% of
Total**
% Owner
Occ Units***
% USB Loans
% Owner
Occ Units***
% USB Loans
% Owner
Occ Units***
% USB Loans
% Owner
Occ Units***
%
USB Loans
Overall
Low
Mod
Mid
Upp
Full-Review:
Salt Lake City 100 63.29 0.20 0.00 16.76 15.00 51.08 39.00 31.95 46.00 2.79 0.00 4.76 2.09 3.08
Limited-Review:
Ogden-Clearfield 32 20.25 0.85 0.00 13.75 3.13 58.75 62.50 26.65 34.38 1.22 0.00 1.75 1.32 0.90
Provo-Orem 19 12.03 1.44 0.00 11.29 15.79 53.20 42.11 34.07 42.11 2.78 0.00 7.14 2.86 2.29
St. George 4 2.53 NA NA 9.35 0.00 71.27 50.00 19.38 50.00 0.00 NA 0.00 0.00 0.00
UT nonMSA 3 1.90 NA NA 8.24 0.00 61.99 33.33 29.78 66.67 1.11 NA 0.00 0.00 2.56
Data shown includes only one to four-family and manufactured housing (property type 1 or 2). * Based on 2011 Peer Mortgage Data (USPR). ** Home improvement loans originated and purchased in the MA/AA as a percentage of all home improvement loans originated and purchased in the rated area. *** Percentage of Owner-Occupied Units is the number of owner-occupied housing units in a particular geography divided by number of owner-occupied housing units in the area based on 2000 Census information.

Charter Number 24
D - 294
Table 4. Geographic Distribution of Home Mortgage Refinance Loans
Geographic Distribution: HOME MORTGAGE REFINANCE Geography: UTAH Evaluation Period: JANUARY 1, 2009 To DECEMBER 31, 2011
MA/Assessment Area:
Total Home Mortgage
Refinance Loans
Low-Income Geographies
Moderate-Income Geographies
Middle-Income Geographies
Upper-Income Geographies
Market Share (%) by Geography*
#
% of
Total**
% Owner
Occ Units***
% USB Loans
% Owner Occ
Units***
% USB Loans
% Owner
Occ Units***
% USB Loans
% Owner Occ
Units***
%
USB Loans
Overall
Low
Mod
Mid
Upp
Full-Review:
Salt Lake City 4,674 45.41 0.20 0.15 16.76 10.53 51.08 49.34 31.95 39.99 4.18 2.78 3.66 4.06 4.48
Limited-Review:
Ogden-Clearfield 2,448 23.78 0.85 0.20 13.75 6.37 58.75 57.76 26.65 35.66 4.47 4.44 3.54 4.11 5.43
Provo-Orem 1,790 17.39 1.44 0.89 11.29 5.59 53.20 52.51 34.07 41.01 3.88 2.30 3.85 3.88 3.93
St. George 639 6.21 NA NA 9.35 7.82 71.27 66.35 19.38 25.82 6.71 NA 7.84 6.32 7.39
UT nonMSA 742 7.21 NA NA 8.24 5.12 61.99 51.35 29.78 43.53 6.81 NA 4.39 5.20 9.63
Data shown includes only one to four-family and manufactured housing (property type 1 or 2). * Based on 2011 Peer Mortgage Data (USPR). ** Home mortgage refinance loans originated and purchased in the MA/AA as a percentage of all home mortgage refinance loans originated and purchased in the rated area. *** Percentage of Owner-Occupied Units is the number of owner-occupied housing units in a particular geography divided by number of owner-occupied housing units in the area based on 2000 Census information.
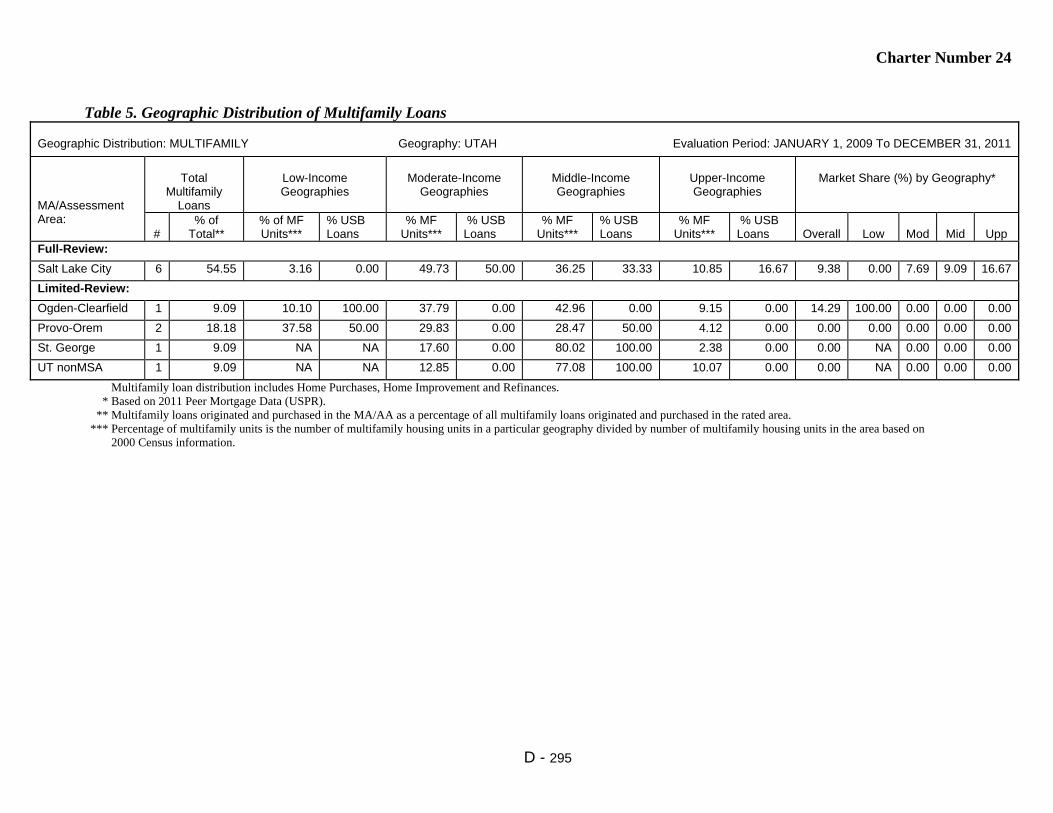
Charter Number 24
D - 295
Table 5. Geographic Distribution of Multifamily Loans
Geographic Distribution: MULTIFAMILY Geography: UTAH Evaluation Period: JANUARY 1, 2009 To DECEMBER 31, 2011
MA/Assessment Area:
Total
Multifamily Loans
Low-Income Geographies
Moderate-Income
Geographies
Middle-Income Geographies
Upper-Income Geographies
Market Share (%) by Geography*
#
% of Total**
% of MF Units***
% USB Loans
% MF Units***
% USB Loans
% MF Units***
% USB Loans
% MF Units***
% USB Loans
Overall
Low
Mod
Mid
Upp
Full-Review:
Salt Lake City 6 54.55 3.16 0.00 49.73 50.00 36.25 33.33 10.85 16.67 9.38 0.00 7.69 9.09 16.67
Limited-Review:
Ogden-Clearfield 1 9.09 10.10 100.00 37.79 0.00 42.96 0.00 9.15 0.00 14.29 100.00 0.00 0.00 0.00
Provo-Orem 2 18.18 37.58 50.00 29.83 0.00 28.47 50.00 4.12 0.00 0.00 0.00 0.00 0.00 0.00
St. George 1 9.09 NA NA 17.60 0.00 80.02 100.00 2.38 0.00 0.00 NA 0.00 0.00 0.00
UT nonMSA 1 9.09 NA NA 12.85 0.00 77.08 100.00 10.07 0.00 0.00 NA 0.00 0.00 0.00
Multifamily loan distribution includes Home Purchases, Home Improvement and Refinances. * Based on 2011 Peer Mortgage Data (USPR). ** Multifamily loans originated and purchased in the MA/AA as a percentage of all multifamily loans originated and purchased in the rated area. *** Percentage of multifamily units is the number of multifamily housing units in a particular geography divided by number of multifamily housing units in the area based on 2000 Census information.

Charter Number 24
D - 296
Table 6. Geographic Distribution of Small Loans to Businesses
Geographic Distribution: SMALL LOANS TO BUSINESSES Geography: UTAH Evaluation Period: JANUARY 1, 2009 To DECEMBER 31, 2011
MA/Assessment Area:
Total Small
Business Loans
Low-Income Geographies
Moderate-Income
Geographies
Middle-Income Geographies
Upper-Income Geographies
Market Share (%) by Geography*
#
% of Total
**
% of
Businesses ***
% USB Loans
% of
Businesses ***
% USB Loans
% of
Businesses ***
% USB Loans
% of
Businesses ***
% USB Loans
Overall
Low
Mod
Mid
Upp
Full-Review:
Salt Lake City 4,163 59.15 5.51 9.44 17.72 23.01 40.81 35.46 35.96 32.09 6.25 6.69 7.25 6.02 5.62
Limited-Review:
Ogden-Clearfield 997 14.17 3.71 6.82 13.87 18.25 53.12 48.45 29.31 26.48 4.90 5.73 4.48 4.39 4.32
Provo-Orem 1,259 17.89 2.62 4.77 10.00 12.47 48.65 49.48 38.71 33.28 4.70 8.74 5.30 4.61 4.03
St. George 444 6.31 NA NA 10.35 10.36 69.32 73.42 20.32 16.22 4.87 NA 4.41 4.78 4.37
UT nonMSA 175 2.49 NA NA 11.84 9.14 59.05 57.14 29.10 33.71 3.96 NA 3.17 3.63 3.98
* Based on 2011 Peer Small Business Data – US and PR. ** Small loans to businesses originated and purchased in the MA/AA as a percentage of all small loans to businesses originated and purchased in the rated area. *** Source Data - Dun and Bradstreet (2011).

Charter Number 24
D - 297
Table 7. Geographic Distribution of Small Loans to Farms
Geographic Distribution: SMALL LOANS TO FARMS Geography: UTAH Evaluation Period: JANUARY 1, 2009 To DECEMBER 31, 2011
MA/Assessment Area:
Total Small
Farm Loans
Low-Income Geographies
Moderate-Income
Geographies
Middle-Income Geographies
Upper-Income Geographies
Market Share (%) by Geography*
#
% of
Total**
% of
Farms***
% USB Loans
% of
Farms***
% USB Loans
% of
Farms***
% USB Loans
% of
Farms***
% USB Loans
Overall
Low
Mod
Mid
Upp
Full-Review:
Salt Lake City 8 50.00 2.53 0.00 14.50 0.00 45.67 62.50 37.31 37.50 1.22 0.00 0.00 2.22 0.00
Limited-Review:
Ogden-Clearfield 0 0.00 2.53 0.00 10.54 0.00 60.10 0.00 26.83 0.00 0.00 0.00 0.00 0.00 0.00
Provo-Orem 6 37.50 0.85 0.00 7.27 0.00 58.17 33.33 33.71 66.67 0.00 0.00 0.00 0.00 0.00
St. George 0 0.00 NA NA 4.68 0.00 74.24 0.00 21.08 0.00 0.00 NA 0.00 0.00 0.00
UT nonMSA 2 12.50 NA NA 6.71 0.00 57.19 0.00 36.10 100.00 0.00 NA 0.00 0.00 0.00
* Based on 2011 Peer Small Business Data – US and PR. ** Small loans to farms originated and purchased in the MA/AA as a percentage of all small loans to farms originated and purchased in the rated area. *** Source Data - Dun and Bradstreet (2011).
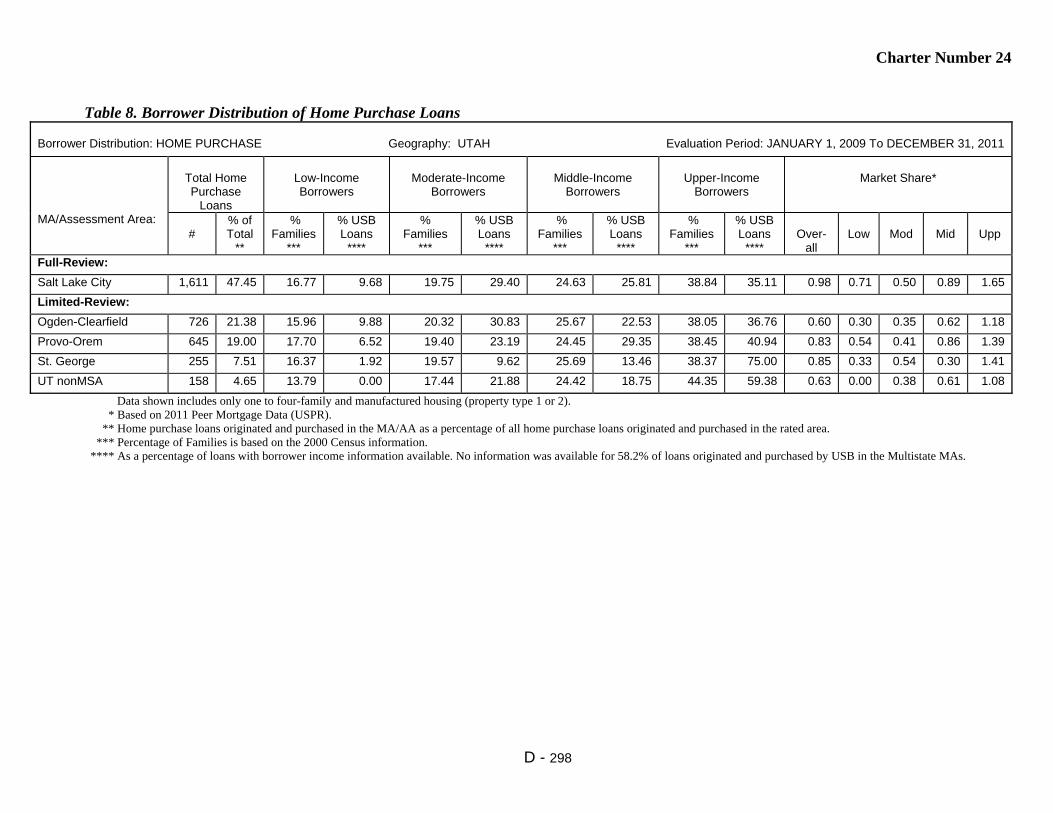
Charter Number 24
D - 298
Table 8. Borrower Distribution of Home Purchase Loans
Borrower Distribution: HOME PURCHASE Geography: UTAH Evaluation Period: JANUARY 1, 2009 To DECEMBER 31, 2011
MA/Assessment Area:
Total Home Purchase
Loans
Low-Income Borrowers
Moderate-Income
Borrowers
Middle-Income
Borrowers
Upper-Income
Borrowers
Market Share*
#
% of Total
**
% Families
***
% USB Loans
****
% Families
***
% USB Loans
****
% Families
***
% USB Loans
****
% Families
***
% USB Loans
****
Over-
all
Low
Mod
Mid
Upp
Full-Review:
Salt Lake City 1,611 47.45 16.77 9.68 19.75 29.40 24.63 25.81 38.84 35.11 0.98 0.71 0.50 0.89 1.65
Limited-Review:
Ogden-Clearfield 726 21.38 15.96 9.88 20.32 30.83 25.67 22.53 38.05 36.76 0.60 0.30 0.35 0.62 1.18
Provo-Orem 645 19.00 17.70 6.52 19.40 23.19 24.45 29.35 38.45 40.94 0.83 0.54 0.41 0.86 1.39
St. George 255 7.51 16.37 1.92 19.57 9.62 25.69 13.46 38.37 75.00 0.85 0.33 0.54 0.30 1.41
UT nonMSA 158 4.65 13.79 0.00 17.44 21.88 24.42 18.75 44.35 59.38 0.63 0.00 0.38 0.61 1.08
Data shown includes only one to four-family and manufactured housing (property type 1 or 2). * Based on 2011 Peer Mortgage Data (USPR). ** Home purchase loans originated and purchased in the MA/AA as a percentage of all home purchase loans originated and purchased in the rated area. *** Percentage of Families is based on the 2000 Census information. **** As a percentage of loans with borrower income information available. No information was available for 58.2% of loans originated and purchased by USB in the Multistate MAs.

Charter Number 24
D - 299
Table 9. Borrower Distribution of Home Improvement Loans
Borrower Distribution: HOME IMPROVEMENT Geography: UTAH Evaluation Period: JANUARY 1, 2009 To DECEMBER 31, 2011
MA/Assessment Area:
Total Home Improvement
Loans
Low-Income Borrowers
Moderate-Income
Borrowers
Middle-Income
Borrowers
Upper-Income
Borrowers
Market Share*
#
% of Total
**
% Families
***
% USB Loans
****
% Families
***
% USB Loans
****
% Families
***
% USB Loans
****
% Families
***
% USB Loans
****
Over-
all
Low
Mod
Mid
Upp
Full-Review:
Salt Lake City 100 63.29 16.77 9.21 19.75 18.42 24.63 30.26 38.84 42.11 2.91 3.57 2.69 3.42 2.46
Limited-Review:
Ogden-Clearfield 32 20.25 15.96 12.00 20.32 16.00 25.67 48.00 38.05 24.00 1.28 0.00 1.29 1.86 1.17
Provo-Orem 19 12.03 17.70 13.33 19.40 26.67 24.45 13.33 38.45 46.67 2.62 4.00 2.99 1.27 2.99
St. George 4 2.53 16.37 0.00 19.57 0.00 25.69 100.00 38.37 0.00 0.00 0.00 0.00 0.00 0.00
UT nonMSA 3 1.90 13.79 0.00 17.44 0.00 24.42 100.00 44.35 0.00 1.18 0.00 0.00 4.17 0.00
Data shown includes only one to four-family and manufactured housing (property type of 1 or 2). * Based on 2011 Peer Mortgage Data (USPR). ** Home improvement loans originated and purchased in the MA/AA as a percentage of all home improvement loans originated and purchased in the rated area. *** Percentage of Families is based on the 2000 Census information. **** As a percentage of loans with borrower income information available. No information was available for 24.7% of loans originated and purchased by the bank.
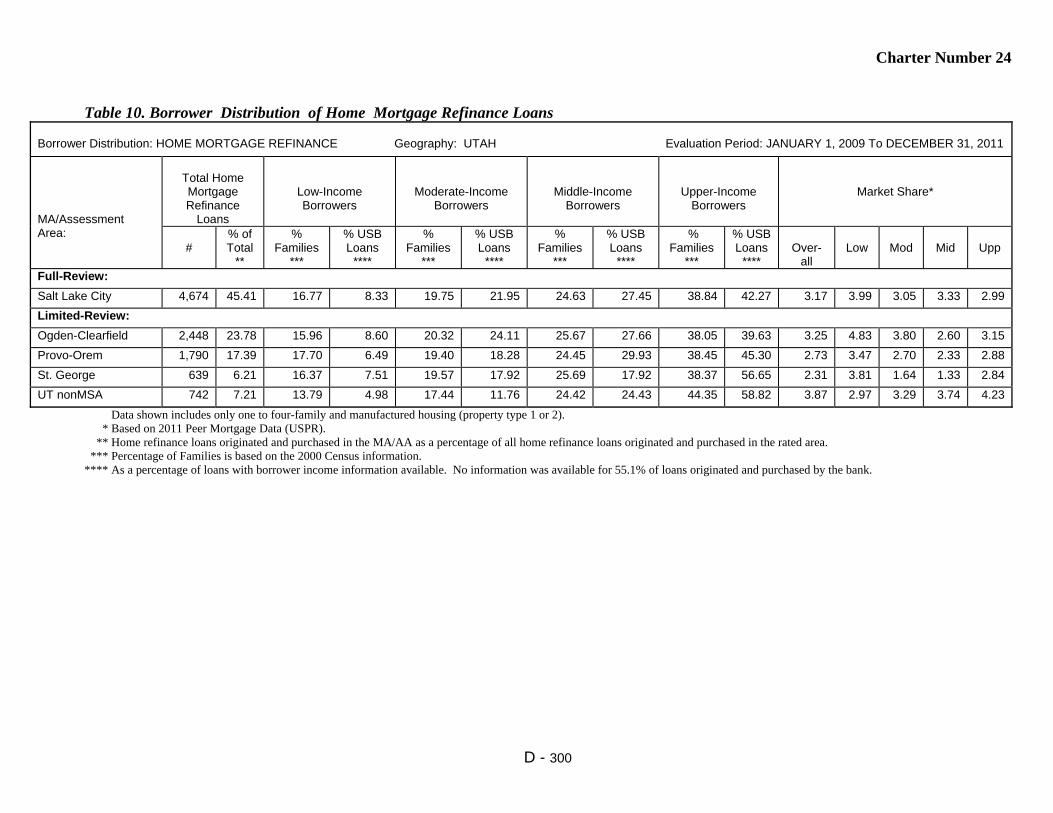
Charter Number 24
D - 300
Table 10. Borrower Distribution of Home Mortgage Refinance Loans
Borrower Distribution: HOME MORTGAGE REFINANCE Geography: UTAH Evaluation Period: JANUARY 1, 2009 To DECEMBER 31, 2011
MA/Assessment Area:
Total Home Mortgage Refinance
Loans
Low-Income Borrowers
Moderate-Income Borrowers
Middle-Income Borrowers
Upper-Income Borrowers
Market Share*
#
% of Total
**
% Families
***
% USB Loans
****
% Families
***
% USB Loans
****
% Families
***
% USB Loans
****
% Families
***
% USB Loans
****
Over-
all
Low
Mod
Mid
Upp
Full-Review:
Salt Lake City 4,674 45.41 16.77 8.33 19.75 21.95 24.63 27.45 38.84 42.27 3.17 3.99 3.05 3.33 2.99
Limited-Review:
Ogden-Clearfield 2,448 23.78 15.96 8.60 20.32 24.11 25.67 27.66 38.05 39.63 3.25 4.83 3.80 2.60 3.15
Provo-Orem 1,790 17.39 17.70 6.49 19.40 18.28 24.45 29.93 38.45 45.30 2.73 3.47 2.70 2.33 2.88
St. George 639 6.21 16.37 7.51 19.57 17.92 25.69 17.92 38.37 56.65 2.31 3.81 1.64 1.33 2.84
UT nonMSA 742 7.21 13.79 4.98 17.44 11.76 24.42 24.43 44.35 58.82 3.87 2.97 3.29 3.74 4.23
Data shown includes only one to four-family and manufactured housing (property type 1 or 2). * Based on 2011 Peer Mortgage Data (USPR). ** Home refinance loans originated and purchased in the MA/AA as a percentage of all home refinance loans originated and purchased in the rated area. *** Percentage of Families is based on the 2000 Census information. **** As a percentage of loans with borrower income information available. No information was available for 55.1% of loans originated and purchased by the bank.
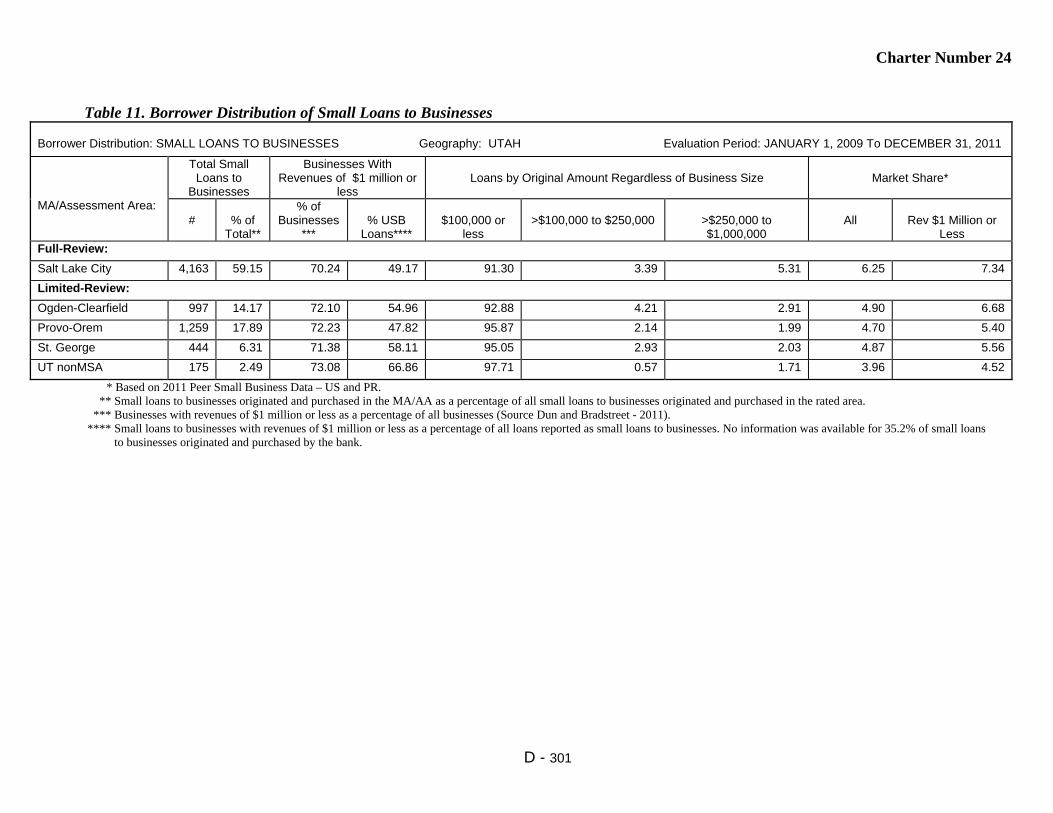
Charter Number 24
D - 301
Table 11. Borrower Distribution of Small Loans to Businesses
Borrower Distribution: SMALL LOANS TO BUSINESSES Geography: UTAH Evaluation Period: JANUARY 1, 2009 To DECEMBER 31, 2011
MA/Assessment Area:
Total Small Loans to
Businesses
Businesses With Revenues of $1 million or
less
Loans by Original Amount Regardless of Business Size
Market Share*
#
% of
Total**
% of Businesses
***
% USB
Loans****
$100,000 or
less
>$100,000 to $250,000
>$250,000 to $1,000,000
All
Rev $1 Million or
Less Full-Review:
Salt Lake City 4,163 59.15 70.24 49.17 91.30 3.39 5.31 6.25 7.34
Limited-Review:
Ogden-Clearfield 997 14.17 72.10 54.96 92.88 4.21 2.91 4.90 6.68
Provo-Orem 1,259 17.89 72.23 47.82 95.87 2.14 1.99 4.70 5.40
St. George 444 6.31 71.38 58.11 95.05 2.93 2.03 4.87 5.56
UT nonMSA 175 2.49 73.08 66.86 97.71 0.57 1.71 3.96 4.52
* Based on 2011 Peer Small Business Data – US and PR. ** Small loans to businesses originated and purchased in the MA/AA as a percentage of all small loans to businesses originated and purchased in the rated area. *** Businesses with revenues of $1 million or less as a percentage of all businesses (Source Dun and Bradstreet - 2011). **** Small loans to businesses with revenues of $1 million or less as a percentage of all loans reported as small loans to businesses. No information was available for 35.2% of small loans to businesses originated and purchased by the bank.
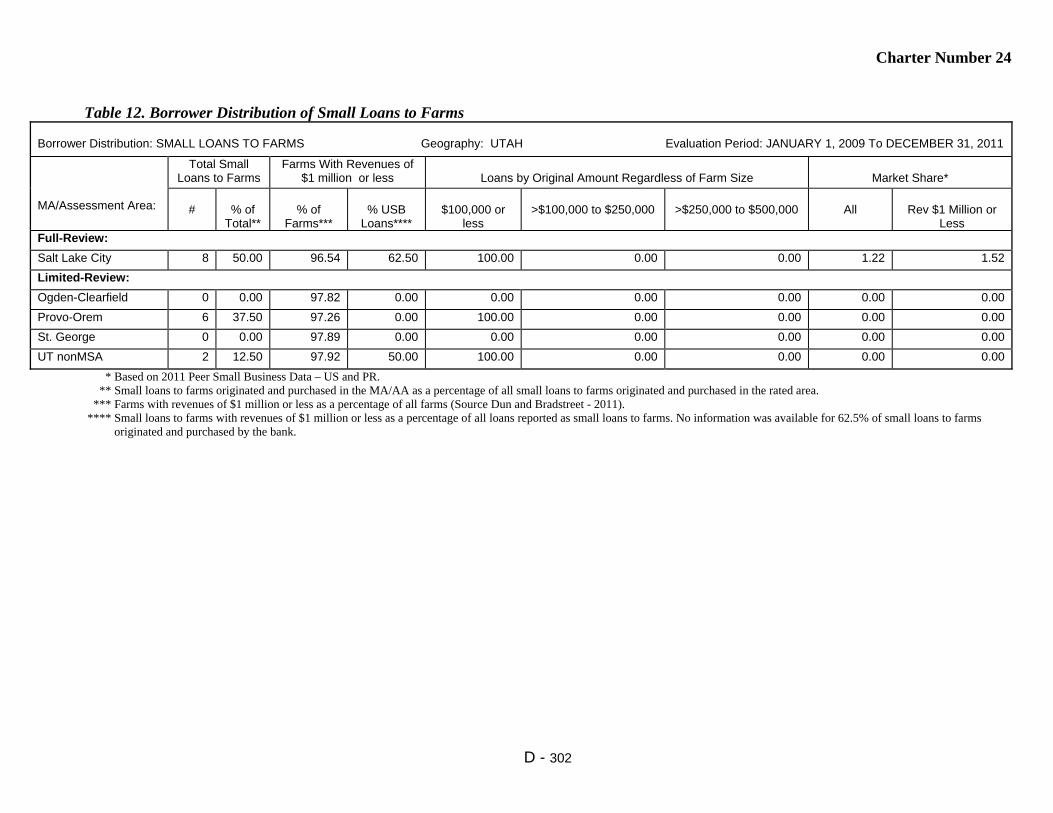
Charter Number 24
D - 302
Table 12. Borrower Distribution of Small Loans to Farms
Borrower Distribution: SMALL LOANS TO FARMS Geography: UTAH Evaluation Period: JANUARY 1, 2009 To DECEMBER 31, 2011
MA/Assessment Area:
Total Small Loans to Farms
Farms With Revenues of $1 million or less
Loans by Original Amount Regardless of Farm Size
Market Share*
#
% of
Total**
% of
Farms***
% USB
Loans****
$100,000 or
less
>$100,000 to $250,000
>$250,000 to $500,000
All
Rev $1 Million or
Less Full-Review:
Salt Lake City 8 50.00 96.54 62.50 100.00 0.00 0.00 1.22 1.52
Limited-Review:
Ogden-Clearfield 0 0.00 97.82 0.00 0.00 0.00 0.00 0.00 0.00
Provo-Orem 6 37.50 97.26 0.00 100.00 0.00 0.00 0.00 0.00
St. George 0 0.00 97.89 0.00 0.00 0.00 0.00 0.00 0.00
UT nonMSA 2 12.50 97.92 50.00 100.00 0.00 0.00 0.00 0.00
* Based on 2011 Peer Small Business Data – US and PR. ** Small loans to farms originated and purchased in the MA/AA as a percentage of all small loans to farms originated and purchased in the rated area. *** Farms with revenues of $1 million or less as a percentage of all farms (Source Dun and Bradstreet - 2011). **** Small loans to farms with revenues of $1 million or less as a percentage of all loans reported as small loans to farms. No information was available for 62.5% of small loans to farms originated and purchased by the bank.
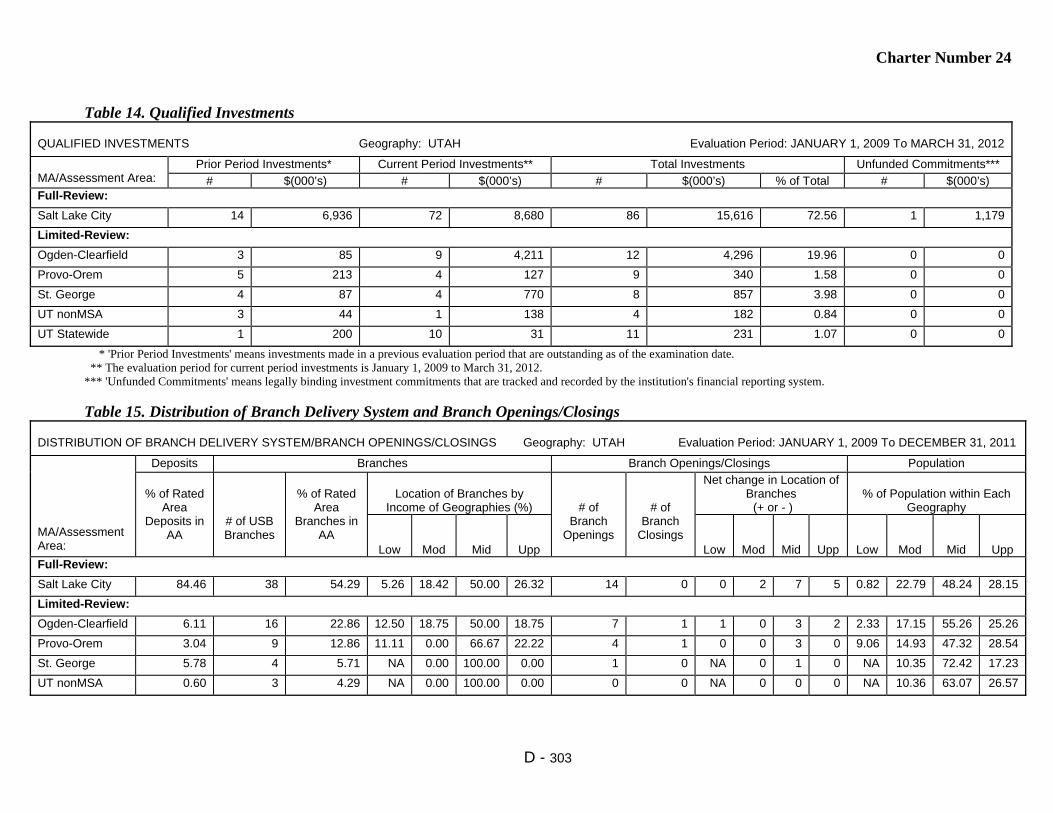
Charter Number 24
D - 303
Table 14. Qualified Investments
QUALIFIED INVESTMENTS Geography: UTAH Evaluation Period: JANUARY 1, 2009 To MARCH 31, 2012
MA/Assessment Area:
Prior Period Investments* Current Period Investments** Total Investments Unfunded Commitments***
# $(000’s) # $(000’s) # $(000’s) % of Total # $(000’s) Full-Review:
Salt Lake City 14 6,936 72 8,680 86 15,616 72.56 1 1,179
Limited-Review:
Ogden-Clearfield 3 85 9 4,211 12 4,296 19.96 0 0
Provo-Orem 5 213 4 127 9 340 1.58 0 0
St. George 4 87 4 770 8 857 3.98 0 0
UT nonMSA 3 44 1 138 4 182 0.84 0 0
UT Statewide 1 200 10 31 11 231 1.07 0 0
* 'Prior Period Investments' means investments made in a previous evaluation period that are outstanding as of the examination date. ** The evaluation period for current period investments is January 1, 2009 to March 31, 2012. *** 'Unfunded Commitments' means legally binding investment commitments that are tracked and recorded by the institution's financial reporting system.
Table 15. Distribution of Branch Delivery System and Branch Openings/Closings DISTRIBUTION OF BRANCH DELIVERY SYSTEM/BRANCH OPENINGS/CLOSINGS Geography: UTAH Evaluation Period: JANUARY 1, 2009 To DECEMBER 31, 2011
MA/Assessment Area:
Deposits Branches Branch Openings/Closings Population
% of Rated
Area Deposits in
AA
# of USB Branches
% of Rated
Area Branches in
AA
Location of Branches by
Income of Geographies (%)
# of Branch
Openings
# of Branch
Closings
Net change in Location of Branches (+ or - )
% of Population within Each
Geography
Low
Mod
Mid
Upp
Low
Mod
Mid
Upp
Low
Mod
Mid
Upp
Full-Review:
Salt Lake City 84.46 38 54.29 5.26 18.42 50.00 26.32 14 0 0 2 7 5 0.82 22.79 48.24 28.15
Limited-Review:
Ogden-Clearfield 6.11 16 22.86 12.50 18.75 50.00 18.75 7 1 1 0 3 2 2.33 17.15 55.26 25.26
Provo-Orem 3.04 9 12.86 11.11 0.00 66.67 22.22 4 1 0 0 3 0 9.06 14.93 47.32 28.54
St. George 5.78 4 5.71 NA 0.00 100.00 0.00 1 0 NA 0 1 0 NA 10.35 72.42 17.23
UT nonMSA 0.60 3 4.29 NA 0.00 100.00 0.00 0 0 NA 0 0 0 NA 10.36 63.07 26.57
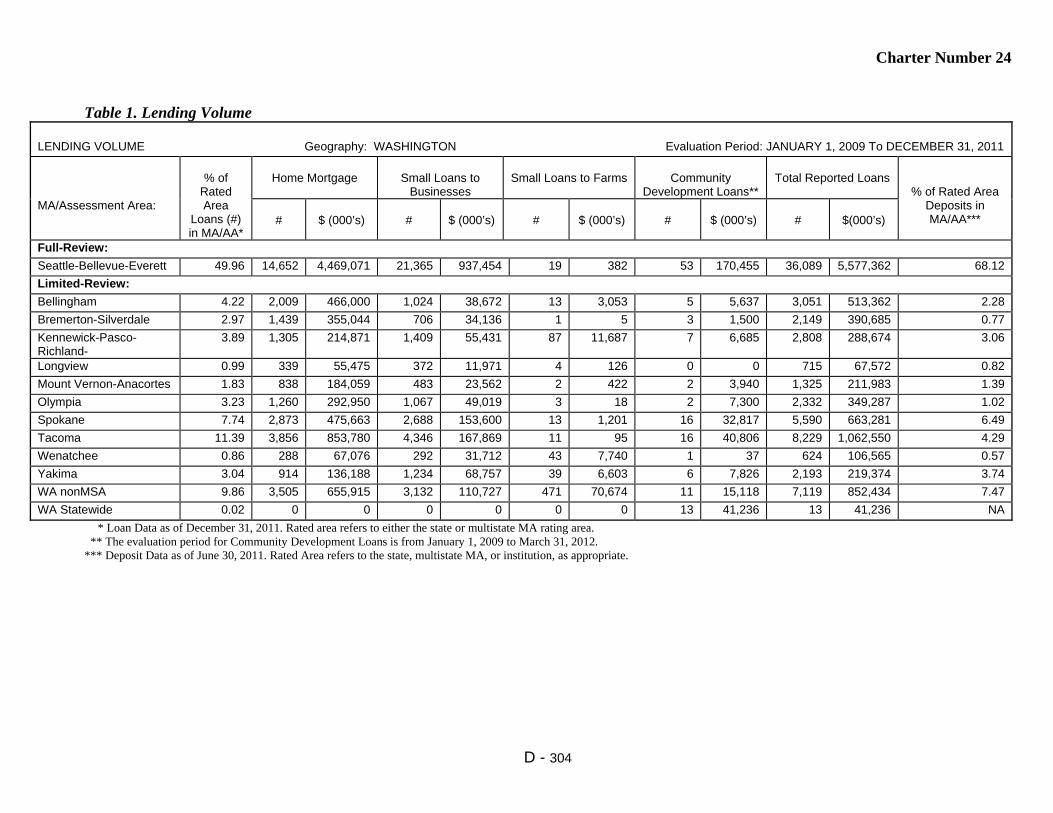
Charter Number 24
D - 304
Table 1. Lending Volume
LENDING VOLUME Geography: WASHINGTON Evaluation Period: JANUARY 1, 2009 To DECEMBER 31, 2011
MA/Assessment Area:
% of
Rated Area
Loans (#) in MA/AA*
Home Mortgage
Small Loans to
Businesses
Small Loans to Farms
Community
Development Loans**
Total Reported Loans
% of Rated Area Deposits in MA/AA***
#
$ (000’s)
#
$ (000’s)
#
$ (000’s)
#
$ (000’s)
#
$(000’s)
Full-Review:
Seattle-Bellevue-Everett 49.96 14,652 4,469,071 21,365 937,454 19 382 53 170,455 36,089 5,577,362 68.12
Limited-Review:
Bellingham 4.22 2,009 466,000 1,024 38,672 13 3,053 5 5,637 3,051 513,362 2.28
Bremerton-Silverdale 2.97 1,439 355,044 706 34,136 1 5 3 1,500 2,149 390,685 0.77
Kennewick-Pasco- Richland-
3.89 1,305 214,871 1,409 55,431 87 11,687 7 6,685 2,808 288,674 3.06
Longview 0.99 339 55,475 372 11,971 4 126 0 0 715 67,572 0.82
Mount Vernon-Anacortes 1.83 838 184,059 483 23,562 2 422 2 3,940 1,325 211,983 1.39
Olympia 3.23 1,260 292,950 1,067 49,019 3 18 2 7,300 2,332 349,287 1.02
Spokane 7.74 2,873 475,663 2,688 153,600 13 1,201 16 32,817 5,590 663,281 6.49
Tacoma 11.39 3,856 853,780 4,346 167,869 11 95 16 40,806 8,229 1,062,550 4.29
Wenatchee 0.86 288 67,076 292 31,712 43 7,740 1 37 624 106,565 0.57
Yakima 3.04 914 136,188 1,234 68,757 39 6,603 6 7,826 2,193 219,374 3.74
WA nonMSA 9.86 3,505 655,915 3,132 110,727 471 70,674 11 15,118 7,119 852,434 7.47
WA Statewide 0.02 0 0 0 0 0 0 13 41,236 13 41,236 NA
* Loan Data as of December 31, 2011. Rated area refers to either the state or multistate MA rating area. ** The evaluation period for Community Development Loans is from January 1, 2009 to March 31, 2012. *** Deposit Data as of June 30, 2011. Rated Area refers to the state, multistate MA, or institution, as appropriate.
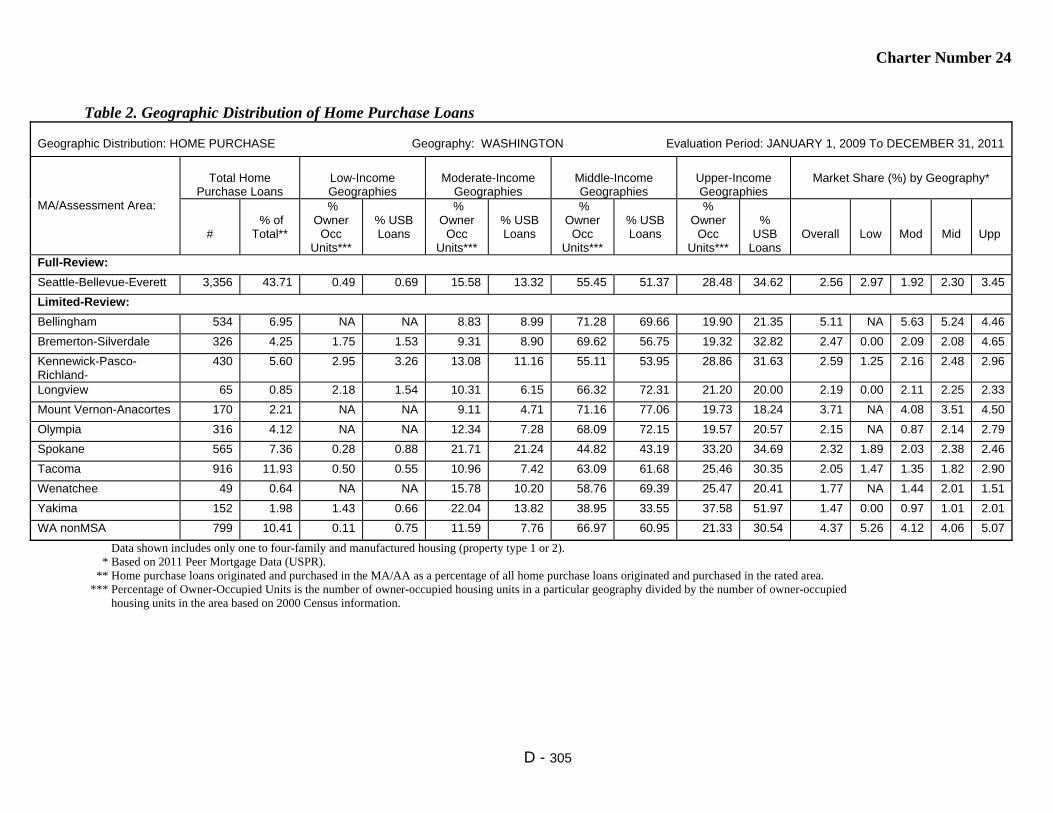
Charter Number 24
D - 305
Table 2. Geographic Distribution of Home Purchase Loans
Geographic Distribution: HOME PURCHASE Geography: WASHINGTON Evaluation Period: JANUARY 1, 2009 To DECEMBER 31, 2011
MA/Assessment Area:
Total Home
Purchase Loans
Low-Income Geographies
Moderate-Income
Geographies
Middle-Income Geographies
Upper-Income Geographies
Market Share (%) by Geography*
#
% of
Total**
% Owner
Occ Units***
% USB Loans
% Owner
Occ Units***
% USB Loans
% Owner
Occ Units***
% USB Loans
% Owner
Occ Units***
%
USB Loans
Overall
Low
Mod
Mid
Upp
Full-Review:
Seattle-Bellevue-Everett 3,356 43.71 0.49 0.69 15.58 13.32 55.45 51.37 28.48 34.62 2.56 2.97 1.92 2.30 3.45
Limited-Review:
Bellingham 534 6.95 NA NA 8.83 8.99 71.28 69.66 19.90 21.35 5.11 NA 5.63 5.24 4.46
Bremerton-Silverdale 326 4.25 1.75 1.53 9.31 8.90 69.62 56.75 19.32 32.82 2.47 0.00 2.09 2.08 4.65
Kennewick-Pasco- Richland-
430 5.60 2.95 3.26 13.08 11.16 55.11 53.95 28.86 31.63 2.59 1.25 2.16 2.48 2.96
Longview 65 0.85 2.18 1.54 10.31 6.15 66.32 72.31 21.20 20.00 2.19 0.00 2.11 2.25 2.33
Mount Vernon-Anacortes 170 2.21 NA NA 9.11 4.71 71.16 77.06 19.73 18.24 3.71 NA 4.08 3.51 4.50
Olympia 316 4.12 NA NA 12.34 7.28 68.09 72.15 19.57 20.57 2.15 NA 0.87 2.14 2.79
Spokane 565 7.36 0.28 0.88 21.71 21.24 44.82 43.19 33.20 34.69 2.32 1.89 2.03 2.38 2.46
Tacoma 916 11.93 0.50 0.55 10.96 7.42 63.09 61.68 25.46 30.35 2.05 1.47 1.35 1.82 2.90
Wenatchee 49 0.64 NA NA 15.78 10.20 58.76 69.39 25.47 20.41 1.77 NA 1.44 2.01 1.51
Yakima 152 1.98 1.43 0.66 22.04 13.82 38.95 33.55 37.58 51.97 1.47 0.00 0.97 1.01 2.01
WA nonMSA 799 10.41 0.11 0.75 11.59 7.76 66.97 60.95 21.33 30.54 4.37 5.26 4.12 4.06 5.07
Data shown includes only one to four-family and manufactured housing (property type 1 or 2). * Based on 2011 Peer Mortgage Data (USPR). ** Home purchase loans originated and purchased in the MA/AA as a percentage of all home purchase loans originated and purchased in the rated area. *** Percentage of Owner-Occupied Units is the number of owner-occupied housing units in a particular geography divided by the number of owner-occupied housing units in the area based on 2000 Census information.

Charter Number 24
D - 306
Table 3. Geographic Distribution of Home Improvement Loans
Geographic Distribution: HOME IMPROVEMENT Geography: WASHINGTON Evaluation Period: JANUARY 1, 2009 To DECEMBER 31, 2011
MA/Assessment Area:
Total Home
Improvement Loans
Low-Income Geographies
Moderate-Income
Geographies
Middle-Income Geographies
Upper-Income Geographies
Market Share (%) by Geography*
#
% of
Total**
% Owner
Occ Units***
% USB Loans
% Owner
Occ Units***
% USB Loans
% Owner
Occ Units***
% USB Loans
% Owner
Occ Units***
%
USB Loans
Overall
Low
Mod
Mid
Upp
Full-Review:
Seattle-Bellevue-Everett 277 31.02 0.49 1.08 15.58 9.39 55.45 52.71 28.48 36.82 4.94 16.67 6.11 4.65 4.84
Limited-Review:
Bellingham 26 2.91 NA NA 8.83 3.85 71.28 76.92 19.90 19.23 2.62 NA 0.00 3.08 2.17
Bremerton-Silverdale 21 2.35 1.75 0.00 9.31 0.00 69.62 80.95 19.32 19.05 2.54 0.00 0.00 2.70 3.17
Kennewick-Pasco- Richland-
61 6.83 2.95 3.28 13.08 16.39 55.11 52.46 28.86 27.87 6.08 9.09 12.50 5.35 5.71
Longview 20 2.24 2.18 5.00 10.31 15.00 66.32 70.00 21.20 10.00 10.00 0.00 10.00 13.04 0.00
Mount Vernon- Anacortes
25 2.80 NA NA 9.11 0.00 71.16 68.00 19.73 32.00 10.26 NA 0.00 11.39 10.00
Olympia 19 2.13 NA NA 12.34 5.26 68.09 73.68 19.57 21.05 2.84 NA 6.25 1.35 6.38
Spokane 164 18.37 0.28 0.61 21.71 14.63 44.82 42.68 33.20 42.07 8.92 33.33 2.91 10.83 9.27
Tacoma 64 7.17 0.50 0.00 10.96 14.06 63.09 51.56 25.46 34.38 3.06 0.00 6.00 2.73 2.96
Wenatchee 7 0.78 NA NA 15.78 14.29 58.76 42.86 25.47 42.86 2.86 NA 5.88 1.59 4.00
Yakima 56 6.27 1.43 0.00 22.04 19.64 38.95 37.50 37.58 42.86 7.17 0.00 15.79 4.60 6.50
WA nonMSA 153 17.13 0.11 0.00 11.59 7.84 66.97 68.63 21.33 23.53 8.77 0.00 8.47 8.76 8.89
Data shown includes only one to four-family and manufactured housing (property type 1 or 2). * Based on 2011 Peer Mortgage Data (USPR). ** Home improvement loans originated and purchased in the MA/AA as a percentage of all home improvement loans originated and purchased in the rated area. *** Percentage of Owner-Occupied Units is the number of owner-occupied housing units in a particular geography divided by number of owner-occupied housing units in the area based on 2000 Census information.

Charter Number 24
D - 307
Table 4. Geographic Distribution of Home Mortgage Refinance Loans
Geographic Distribution: HOME MORTGAGE REFINANCE Geography: WASHINGTON Evaluation Period: JANUARY 1, 2009 To DECEMBER 31, 2011
MA/Assessment Area:
Total Home Mortgage
Refinance Loans
Low-Income Geographies
Moderate-Income Geographies
Middle-Income Geographies
Upper-Income Geographies
Market Share (%) by Geography*
#
% of
Total**
% Owner
Occ Units***
% USB Loans
% Owner
Occ Units***
% USB Loans
% Owner
Occ Units***
% USB Loans
% Owner
Occ Units***
%
USB Loans
Overall
Low
Mod
Mid
Upp
Full-Review:
Seattle-Bellevue-Everet 10,955 44.56 0.49 0.51 15.58 10.65 55.45 54.31 28.48 34.52 3.98 2.46 3.91 3.98 4.01
Limited-Review:
Bellingham 1,449 5.89 NA NA 8.83 6.28 71.28 72.46 19.90 21.26 5.93 NA 3.42 6.16 6.20
Bremerton-Silverdale 1,091 4.44 1.75 1.19 9.31 5.50 69.62 60.95 19.32 32.36 3.32 0.85 1.85 3.10 4.66
Kennewick-Pasco- Richland
806 3.28 2.95 2.11 13.08 6.08 55.11 52.73 28.86 39.08 4.47 8.99 6.05 4.50 4.06
Longview 253 1.03 2.18 1.58 10.31 2.77 66.32 73.91 21.20 21.74 3.14 6.45 0.78 3.55 2.40
Mount Vernon- Anacortes
642 2.61 NA NA 9.11 7.01 71.16 69.94 19.73 23.05 5.07 NA 3.06 5.10 5.58
Olympia 923 3.75 NA NA 12.34 8.23 68.09 67.06 19.57 24.70 2.70 NA 2.54 2.60 3.05
Spokane 2,139 8.70 0.28 0.42 21.71 15.94 44.82 38.52 33.20 45.11 5.60 3.08 5.92 5.36 5.74
Tacoma 2,848 11.58 0.50 0.21 10.96 6.32 63.09 63.03 25.46 30.44 3.95 2.60 4.02 3.95 3.93
Wenatchee 232 0.94 NA NA 15.78 12.93 58.76 59.05 25.47 28.02 3.48 NA 3.81 3.39 3.53
Yakima 703 2.86 1.43 0.43 22.04 16.07 38.95 34.57 37.58 48.93 6.02 3.57 13.06 5.84 4.61
WA nonMSA 2,545 10.35 0.11 0.35 11.59 7.78 66.97 60.55 21.33 31.32 6.71 17.86 6.94 6.97 6.16
Data shown includes only one to four-family and manufactured housing (property type 1 or 2). * Based on 2011 Peer Mortgage Data (USPR). ** Home mortgage refinance loans originated and purchased in the MA/AA as a percentage of all home mortgage refinance loans originated and purchased in the rated area. *** Percentage of Owner-Occupied Units is the number of owner-occupied housing units in a particular geography divided by number of owner-occupied housing units in the area based on 2000 Census information.

Charter Number 24
D - 308
Table 5. Geographic Distribution of Multifamily Loans
Geographic Distribution: MULTIFAMILY Geography: WASHINGTON Evaluation Period: JANUARY 1, 2009 To DECEMBER 31, 2011
MA/Assessment Area:
Total Multifamily
Loans
Low-Income Geographies
Moderate-Income
Geographies
Middle-Income Geographies
Upper-Income Geographies
Market Share (%) by Geography*
#
% of Total**
% of MF Units***
% USB Loans
% MF Units***
% USB Loans
% MF Units***
%USB Loans
% MF Units***
% USB Loans
Overall
Low
Mod
Mid
Upp
Full-Review:
Seattle-Bellevue- Everett
64 52.89 3.72 1.56 36.96 39.06 43.29 45.31 16.04 14.06 6.91 5.00 7.22 6.94 6.56
Limited-Review:
Bellingham 0 0.00 NA NA 27.18 0.00 62.25 0.00 10.58 0.00 0.00 NA 0.00 0.00 0.00
Bremerton- Silverdale
1 0.83 9.25 0.00 28.01 100.00 54.98 0.00 7.76 0.00 6.25 0.00 16.67 0.00 0.00
Kennewick-Pasco- Richland
8 6.61 18.46 0.00 22.92 12.50 45.18 87.50 13.44 0.00 18.18 0.00 25.00 25.00 0.00
Longview 1 0.83 0.64 0.00 42.57 0.00 55.16 100.00 1.62 0.00 11.11 0.00 0.00 16.67 0.00
Mount Vernon- Anacortes
1 0.83 NA NA 13.16 0.00 84.67 100.00 2.16 0.00 8.33 NA 0.00 14.29 0.00
Olympia 2 1.65 NA NA 31.69 50.00 66.41 50.00 1.90 0.00 5.00 NA 25.00 0.00 0.00
Spokane 5 4.13 9.33 0.00 54.66 60.00 25.88 20.00 10.14 20.00 0.00 0.00 0.00 0.00 0.00
Tacoma 28 23.14 8.47 7.14 29.99 21.43 52.41 46.43 9.13 25.00 7.69 0.00 5.41 13.51 5.88
Wenatchee 0 0.00 NA NA 33.87 0.00 55.28 0.00 10.85 0.00 0.00 NA 0.00 0.00 0.00
Yakima 3 2.48 15.70 33.33 38.09 33.33 29.23 33.33 16.99 0.00 8.33 50.00 0.00 0.00 0.00
WA nonMSA 8 6.61 11.28 0.00 21.30 25.00 59.00 37.50 8.42 37.50 7.69 0.00 12.50 8.00 0.00
Multifamily loan distribution includes Home Purchases, Home Improvement and Refinances. * Based on 2011 Peer Mortgage Data (USPR). ** Multifamily loans originated and purchased in the MA/AA as a percentage of all multifamily loans originated and purchased in the rated area. *** Percentage of multifamily units is the number of multifamily housing units in a particular geography divided by number of multifamily housing units in the area based on 2000 Census information.
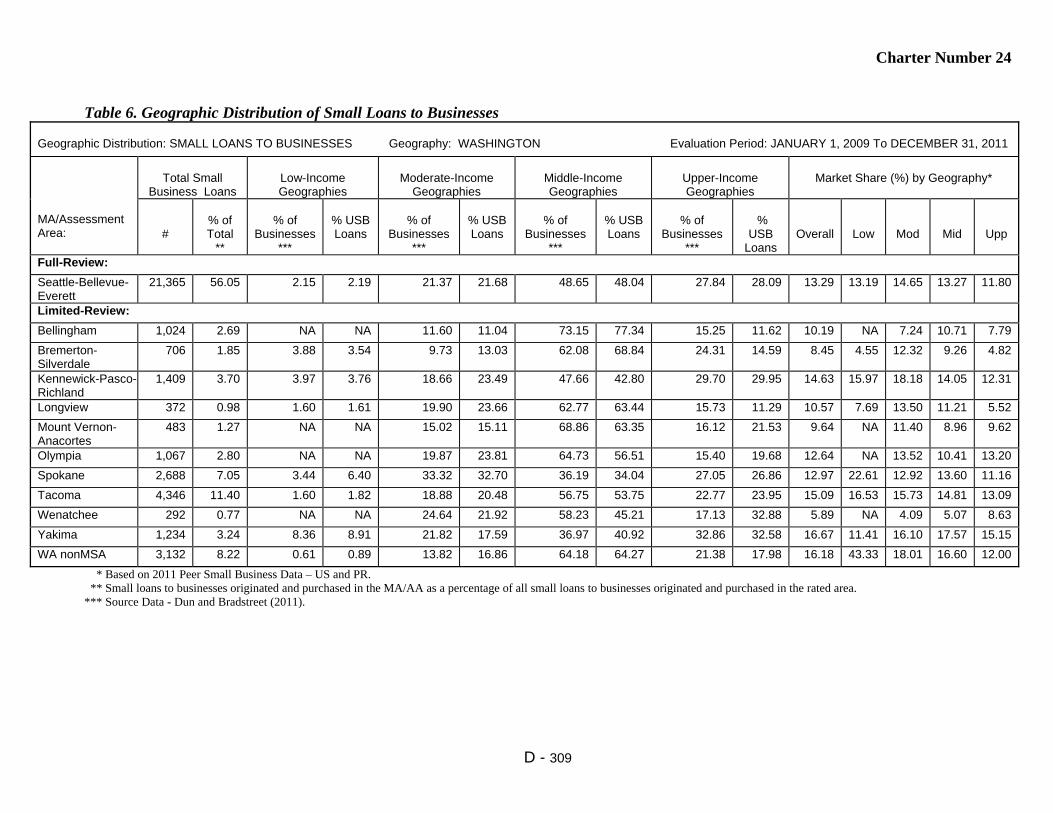
Charter Number 24
D - 309
Table 6. Geographic Distribution of Small Loans to Businesses
Geographic Distribution: SMALL LOANS TO BUSINESSES Geography: WASHINGTON Evaluation Period: JANUARY 1, 2009 To DECEMBER 31, 2011
MA/Assessment Area:
Total Small
Business Loans
Low-Income Geographies
Moderate-Income
Geographies
Middle-Income Geographies
Upper-Income Geographies
Market Share (%) by Geography*
#
% of Total
**
% of
Businesses ***
% USB Loans
% of
Businesses ***
% USB Loans
% of
Businesses ***
% USB Loans
% of
Businesses ***
%
USB Loans
Overall
Low
Mod
Mid
Upp
Full-Review:
Seattle-Bellevue- Everett
21,365 56.05 2.15 2.19 21.37 21.68 48.65 48.04 27.84 28.09 13.29 13.19 14.65 13.27 11.80
Limited-Review:
Bellingham 1,024 2.69 NA NA 11.60 11.04 73.15 77.34 15.25 11.62 10.19 NA 7.24 10.71 7.79
Bremerton- Silverdale
706 1.85 3.88 3.54 9.73 13.03 62.08 68.84 24.31 14.59 8.45 4.55 12.32 9.26 4.82
Kennewick-Pasco- Richland
1,409 3.70 3.97 3.76 18.66 23.49 47.66 42.80 29.70 29.95 14.63 15.97 18.18 14.05 12.31
Longview 372 0.98 1.60 1.61 19.90 23.66 62.77 63.44 15.73 11.29 10.57 7.69 13.50 11.21 5.52
Mount Vernon- Anacortes
483 1.27 NA NA 15.02 15.11 68.86 63.35 16.12 21.53 9.64 NA 11.40 8.96 9.62
Olympia 1,067 2.80 NA NA 19.87 23.81 64.73 56.51 15.40 19.68 12.64 NA 13.52 10.41 13.20
Spokane 2,688 7.05 3.44 6.40 33.32 32.70 36.19 34.04 27.05 26.86 12.97 22.61 12.92 13.60 11.16
Tacoma 4,346 11.40 1.60 1.82 18.88 20.48 56.75 53.75 22.77 23.95 15.09 16.53 15.73 14.81 13.09
Wenatchee 292 0.77 NA NA 24.64 21.92 58.23 45.21 17.13 32.88 5.89 NA 4.09 5.07 8.63
Yakima 1,234 3.24 8.36 8.91 21.82 17.59 36.97 40.92 32.86 32.58 16.67 11.41 16.10 17.57 15.15
WA nonMSA 3,132 8.22 0.61 0.89 13.82 16.86 64.18 64.27 21.38 17.98 16.18 43.33 18.01 16.60 12.00
* Based on 2011 Peer Small Business Data – US and PR. ** Small loans to businesses originated and purchased in the MA/AA as a percentage of all small loans to businesses originated and purchased in the rated area. *** Source Data - Dun and Bradstreet (2011).

Charter Number 24
D - 310
Table 7. Geographic Distribution of Small Loans to Farms
Geographic Distribution: SMALL LOANS TO FARMS Geography: WASHINGTON Evaluation Period: JANUARY 1, 2009 To DECEMBER 31, 2011
MA/Assessment Area:
Total Small
Farm Loans
Low-Income Geographies
Moderate-Income
Geographies
Middle-Income Geographies
Upper-Income Geographies
Market Share (%) by Geography*
#
% of
Total**
% of
Farms***
% USB Loans
% of
Farms***
% USB Loans
% of
Farms***
% USB Loans
% of
Farms***
% USB Loans
Over-
all
Low
Mod
Mid
Upp Full-Review:
Seattle-Bellevue-Everett 19 2.69 0.92 0.00 16.54 5.26 59.03 57.89 23.51 36.84 0.51 0.00 5.00 0.00 0.00
Limited-Review:
Bellingham 13 1.84 NA NA 5.71 0.00 88.05 92.31 6.23 7.69 1.43 NA 0.00 1.56 0.00
Bremerton-Silverdale 1 0.14 2.22 0.00 5.00 0.00 66.94 100.00 25.83 0.00 0.00 0.00 0.00 0.00 0.00
Kennewick-Pasco- Richland-
87 12.32 0.95 0.00 21.35 19.54 63.97 75.86 13.73 4.60 11.30 0.00 8.82 13.89 4.76
Longview 4 0.57 2.33 0.00 15.18 0.00 59.53 100.00 22.96 0.00 25.00 0.00 0.00 42.86 0.00
Mount Vernon-Anacortes 2 0.28 NA NA 7.40 0.00 62.66 50.00 29.93 50.00 0.00 NA 0.00 0.00 0.00
Olympia 3 0.42 NA NA 17.87 0.00 65.31 100.00 16.82 0.00 0.00 NA 0.00 0.00 0.00
Spokane 13 1.84 0.37 0.00 15.86 0.00 45.01 69.23 38.77 30.77 4.60 0.00 0.00 7.89 2.38
Tacoma 11 1.56 0.89 0.00 12.29 9.09 62.38 72.73 24.44 18.18 2.94 0.00 100.00 0.00 0.00
Wenatchee 43 6.09 NA NA 9.35 4.65 63.82 60.47 26.83 34.88 16.49 NA 0.00 14.67 23.53
Yakima 39 5.52 1.18 0.00 10.25 23.08 67.86 69.23 20.72 7.69 1.80 0.00 0.00 1.81 2.63
WA nonMSA 471 66.71 0.33 0.85 15.04 19.96 69.29 70.91 15.33 8.28 15.52 33.33 18.18 14.87 15.05
* Based on 2011 Peer Small Business Data – US and PR. ** Small loans to farms originated and purchased in the MA/AA as a percentage of all small loans to farms originated and purchased in the rated area. *** Source Data - Dun and Bradstreet (2011).
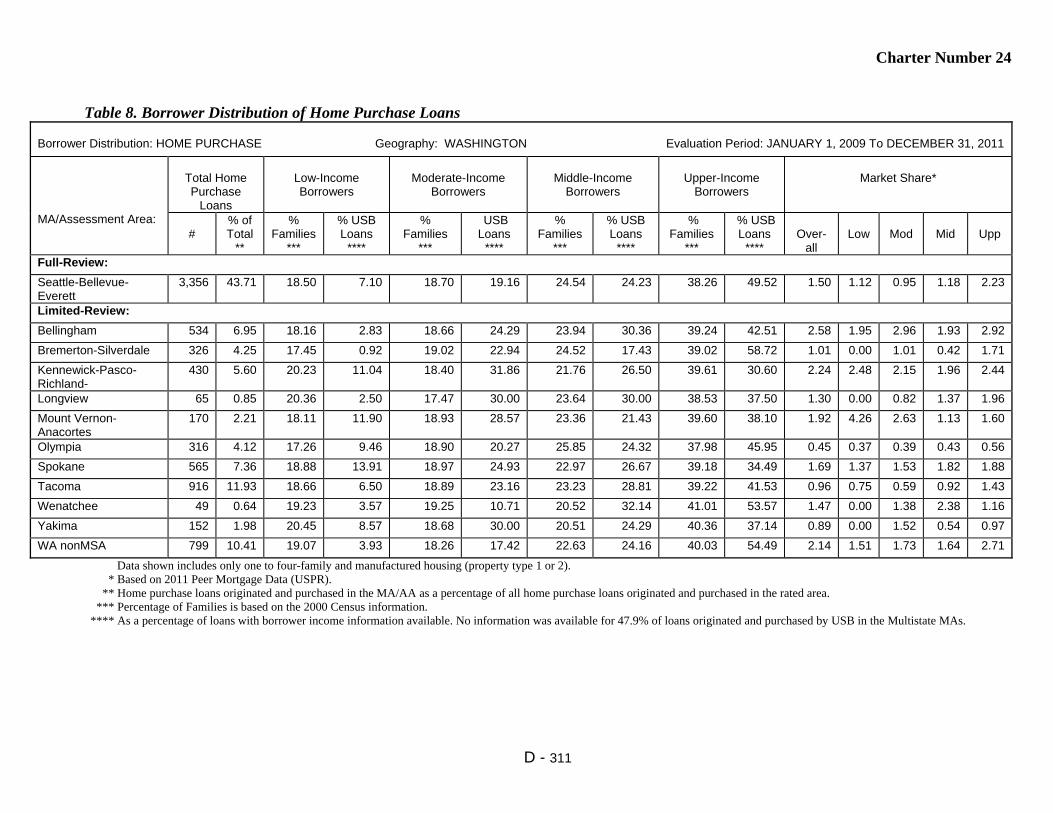
Charter Number 24
D - 311
Table 8. Borrower Distribution of Home Purchase Loans
Borrower Distribution: HOME PURCHASE Geography: WASHINGTON Evaluation Period: JANUARY 1, 2009 To DECEMBER 31, 2011
MA/Assessment Area:
Total Home Purchase
Loans
Low-Income Borrowers
Moderate-Income
Borrowers
Middle-Income
Borrowers
Upper-Income
Borrowers
Market Share*
#
% of Total
**
% Families
***
% USB Loans
****
% Families
***
USB Loans
****
% Families
***
% USB Loans
****
% Families
***
% USB Loans
****
Over-
all
Low
Mod
Mid
Upp
Full-Review:
Seattle-Bellevue- Everett
3,356 43.71 18.50 7.10 18.70 19.16 24.54 24.23 38.26 49.52 1.50 1.12 0.95 1.18 2.23
Limited-Review:
Bellingham 534 6.95 18.16 2.83 18.66 24.29 23.94 30.36 39.24 42.51 2.58 1.95 2.96 1.93 2.92
Bremerton-Silverdale 326 4.25 17.45 0.92 19.02 22.94 24.52 17.43 39.02 58.72 1.01 0.00 1.01 0.42 1.71
Kennewick-Pasco- Richland-
430 5.60 20.23 11.04 18.40 31.86 21.76 26.50 39.61 30.60 2.24 2.48 2.15 1.96 2.44
Longview 65 0.85 20.36 2.50 17.47 30.00 23.64 30.00 38.53 37.50 1.30 0.00 0.82 1.37 1.96
Mount Vernon- Anacortes
170 2.21 18.11 11.90 18.93 28.57 23.36 21.43 39.60 38.10 1.92 4.26 2.63 1.13 1.60
Olympia 316 4.12 17.26 9.46 18.90 20.27 25.85 24.32 37.98 45.95 0.45 0.37 0.39 0.43 0.56
Spokane 565 7.36 18.88 13.91 18.97 24.93 22.97 26.67 39.18 34.49 1.69 1.37 1.53 1.82 1.88
Tacoma 916 11.93 18.66 6.50 18.89 23.16 23.23 28.81 39.22 41.53 0.96 0.75 0.59 0.92 1.43
Wenatchee 49 0.64 19.23 3.57 19.25 10.71 20.52 32.14 41.01 53.57 1.47 0.00 1.38 2.38 1.16
Yakima 152 1.98 20.45 8.57 18.68 30.00 20.51 24.29 40.36 37.14 0.89 0.00 1.52 0.54 0.97
WA nonMSA 799 10.41 19.07 3.93 18.26 17.42 22.63 24.16 40.03 54.49 2.14 1.51 1.73 1.64 2.71
Data shown includes only one to four-family and manufactured housing (property type 1 or 2). * Based on 2011 Peer Mortgage Data (USPR). ** Home purchase loans originated and purchased in the MA/AA as a percentage of all home purchase loans originated and purchased in the rated area. *** Percentage of Families is based on the 2000 Census information. **** As a percentage of loans with borrower income information available. No information was available for 47.9% of loans originated and purchased by USB in the Multistate MAs.

Charter Number 24
D - 312
Table 9. Borrower Distribution of Home Improvement Loans
Borrower Distribution: HOME IMPROVEMENT Geography: WASHINGTON Evaluation Period: JANUARY 1, 2009 To DECEMBER 31, 2011
MA/Assessment Area:
Total Home Improvement
Loans
Low-Income Borrowers
Moderate-Income
Borrowers
Middle-Income
Borrowers
Upper-Income
Borrowers
Market Share*
#
% of Total
**
% Families
***
% USB Loans
****
% Families
***
USB Loans
****
% Families
***
% USB Loans
****
% Families
***
% USB
Loans ****
Over-
all
Low
Mod
Mid
Upp
Full-Review:
Seattle-Bellevue-Everett 277 31.02 18.50 14.87 18.70 16.73 24.54 29.37 38.26 39.03 5.27 9.15 5.78 4.25 4.99
Limited-Review:
Bellingham 26 2.91 18.16 5.88 18.66 23.53 23.94 17.65 39.24 52.94 2.16 3.57 3.13 0.82 2.56
Bremerton-Silverdale 21 2.35 17.45 40.00 19.02 30.00 24.52 20.00 39.02 10.00 2.42 15.38 4.62 0.00 0.69
Kennewick-Pasco- Richland
61 6.83 20.23 8.33 18.40 28.33 21.76 28.33 39.61 35.00 6.25 9.52 12.70 4.88 4.30
Longview 20 2.24 20.36 15.79 17.47 31.58 23.64 21.05 38.53 31.58 10.61 50.00 0.00 12.50 8.33
Mount Vernon- Anacortes
25 2.80 18.11 22.73 18.93 13.64 23.36 31.82 39.60 31.82 9.73 25.00 11.11 13.79 5.17
Olympia 19 2.13 17.26 27.78 18.90 16.67 25.85 38.89 37.98 16.67 3.11 4.35 7.14 3.77 0.00
Spokane 164 18.37 18.88 13.73 18.97 27.45 22.97 22.88 39.18 35.95 9.19 10.81 10.92 8.50 8.58
Tacoma 64 7.17 18.66 11.48 18.89 16.39 23.23 36.07 39.22 36.07 3.28 1.92 3.15 3.75 3.32
Wenatchee 7 0.78 19.23 0.00 19.25 40.00 20.52 0.00 41.01 60.00 2.00 0.00 0.00 0.00 3.92
Yakima 56 6.27 20.45 5.77 18.68 30.77 20.51 28.85 40.36 34.62 7.47 21.43 7.89 12.24 4.29
WA nonMSA 153 17.13 19.07 8.72 18.26 24.16 22.63 25.50 40.03 41.61 9.23 10.53 13.68 11.41 6.69
Data shown includes only one to four-family and manufactured housing (property type of 1 or 2). * Based on 2011 Peer Mortgage Data (USPR). ** Home improvement loans originated and purchased in the MA/AA as a percentage of all home improvement loans originated and purchased in the rated area. *** Percentage of Families is based on the 2000 Census information. **** As a percentage of loans with borrower income information available. No information was available for 5.4% of loans originated and purchased by the bank.
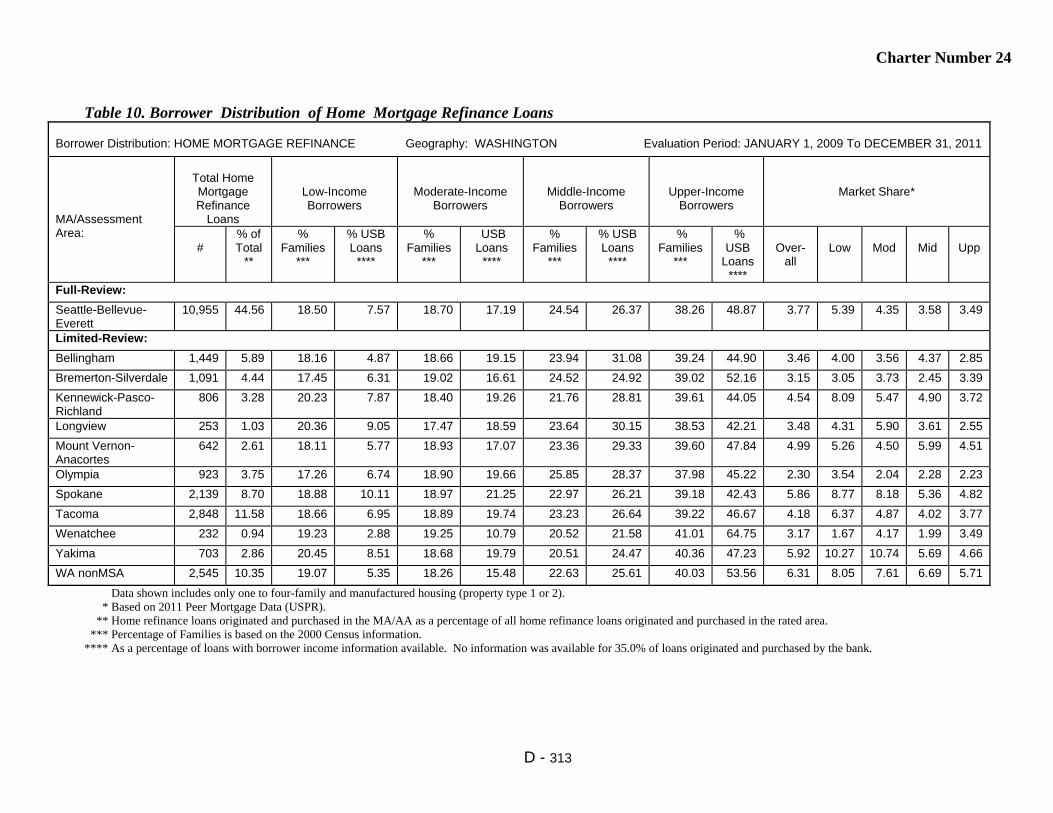
Charter Number 24
D - 313
Table 10. Borrower Distribution of Home Mortgage Refinance Loans
Borrower Distribution: HOME MORTGAGE REFINANCE Geography: WASHINGTON Evaluation Period: JANUARY 1, 2009 To DECEMBER 31, 2011
MA/Assessment Area:
Total Home Mortgage Refinance
Loans
Low-Income Borrowers
Moderate-Income Borrowers
Middle-Income Borrowers
Upper-Income Borrowers
Market Share*
#
% of Total
**
% Families
***
% USB Loans
****
% Families
***
USB Loans
****
% Families
***
% USB Loans
****
% Families
***
% USB
Loans ****
Over-
all
Low
Mod
Mid
Upp
Full-Review:
Seattle-Bellevue- Everett
10,955 44.56 18.50 7.57 18.70 17.19 24.54 26.37 38.26 48.87 3.77 5.39 4.35 3.58 3.49
Limited-Review:
Bellingham 1,449 5.89 18.16 4.87 18.66 19.15 23.94 31.08 39.24 44.90 3.46 4.00 3.56 4.37 2.85
Bremerton-Silverdale 1,091 4.44 17.45 6.31 19.02 16.61 24.52 24.92 39.02 52.16 3.15 3.05 3.73 2.45 3.39
Kennewick-Pasco- Richland
806 3.28 20.23 7.87 18.40 19.26 21.76 28.81 39.61 44.05 4.54 8.09 5.47 4.90 3.72
Longview 253 1.03 20.36 9.05 17.47 18.59 23.64 30.15 38.53 42.21 3.48 4.31 5.90 3.61 2.55
Mount Vernon- Anacortes
642 2.61 18.11 5.77 18.93 17.07 23.36 29.33 39.60 47.84 4.99 5.26 4.50 5.99 4.51
Olympia 923 3.75 17.26 6.74 18.90 19.66 25.85 28.37 37.98 45.22 2.30 3.54 2.04 2.28 2.23
Spokane 2,139 8.70 18.88 10.11 18.97 21.25 22.97 26.21 39.18 42.43 5.86 8.77 8.18 5.36 4.82
Tacoma 2,848 11.58 18.66 6.95 18.89 19.74 23.23 26.64 39.22 46.67 4.18 6.37 4.87 4.02 3.77
Wenatchee 232 0.94 19.23 2.88 19.25 10.79 20.52 21.58 41.01 64.75 3.17 1.67 4.17 1.99 3.49
Yakima 703 2.86 20.45 8.51 18.68 19.79 20.51 24.47 40.36 47.23 5.92 10.27 10.74 5.69 4.66
WA nonMSA 2,545 10.35 19.07 5.35 18.26 15.48 22.63 25.61 40.03 53.56 6.31 8.05 7.61 6.69 5.71
Data shown includes only one to four-family and manufactured housing (property type 1 or 2). * Based on 2011 Peer Mortgage Data (USPR). ** Home refinance loans originated and purchased in the MA/AA as a percentage of all home refinance loans originated and purchased in the rated area. *** Percentage of Families is based on the 2000 Census information. **** As a percentage of loans with borrower income information available. No information was available for 35.0% of loans originated and purchased by the bank.
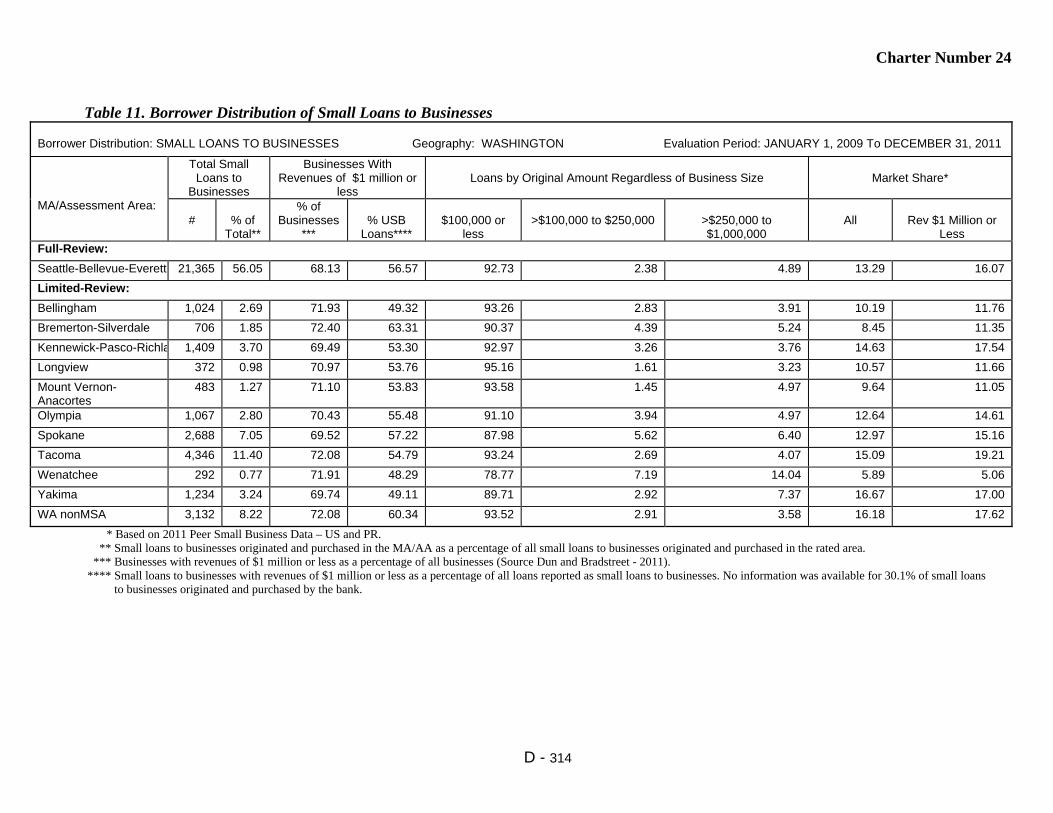
Charter Number 24
D - 314
Table 11. Borrower Distribution of Small Loans to Businesses
Borrower Distribution: SMALL LOANS TO BUSINESSES Geography: WASHINGTON Evaluation Period: JANUARY 1, 2009 To DECEMBER 31, 2011
MA/Assessment Area:
Total Small Loans to
Businesses
Businesses With Revenues of $1 million or
less
Loans by Original Amount Regardless of Business Size
Market Share*
#
% of
Total**
% of Businesses
***
% USB
Loans****
$100,000 or
less
>$100,000 to $250,000
>$250,000 to $1,000,000
All
Rev $1 Million or
Less Full-Review:
Seattle-Bellevue-Everett 21,365 56.05 68.13 56.57 92.73 2.38 4.89 13.29 16.07
Limited-Review:
Bellingham 1,024 2.69 71.93 49.32 93.26 2.83 3.91 10.19 11.76
Bremerton-Silverdale 706 1.85 72.40 63.31 90.37 4.39 5.24 8.45 11.35
Kennewick-Pasco-Richla 1,409 3.70 69.49 53.30 92.97 3.26 3.76 14.63 17.54
Longview 372 0.98 70.97 53.76 95.16 1.61 3.23 10.57 11.66
Mount Vernon- Anacortes
483 1.27 71.10 53.83 93.58 1.45 4.97 9.64 11.05
Olympia 1,067 2.80 70.43 55.48 91.10 3.94 4.97 12.64 14.61
Spokane 2,688 7.05 69.52 57.22 87.98 5.62 6.40 12.97 15.16
Tacoma 4,346 11.40 72.08 54.79 93.24 2.69 4.07 15.09 19.21
Wenatchee 292 0.77 71.91 48.29 78.77 7.19 14.04 5.89 5.06
Yakima 1,234 3.24 69.74 49.11 89.71 2.92 7.37 16.67 17.00
WA nonMSA 3,132 8.22 72.08 60.34 93.52 2.91 3.58 16.18 17.62
* Based on 2011 Peer Small Business Data – US and PR. ** Small loans to businesses originated and purchased in the MA/AA as a percentage of all small loans to businesses originated and purchased in the rated area. *** Businesses with revenues of $1 million or less as a percentage of all businesses (Source Dun and Bradstreet - 2011). **** Small loans to businesses with revenues of $1 million or less as a percentage of all loans reported as small loans to businesses. No information was available for 30.1% of small loans to businesses originated and purchased by the bank.

Charter Number 24
D - 315
Table 12. Borrower Distribution of Small Loans to Farms
Borrower Distribution: SMALL LOANS TO FARMS Geography: WASHINGTON Evaluation Period: JANUARY 1, 2009 To DECEMBER 31, 2011
MA/Assessment Area:
Total Small Loans to Farms
Farms With Revenues of $1 million or less
Loans by Original Amount Regardless of Farm Size
Market Share*
#
% of
Total**
% of
Farms***
% USB
Loans****
$100,000 or
less
>$100,000 to $250,000
>$250,000 to $500,000
All
Rev $1 Million or
Less Full-Review:
Seattle-Bellevue-Everett 19 2.69 96.15 57.89 94.74 5.26 0.00 0.51 0.94
Limited-Review:
Bellingham 13 1.84 96.02 61.54 38.46 0.00 61.54 1.43 1.47
Bremerton-Silverdale 1 0.14 97.92 0.00 100.00 0.00 0.00 0.00 0.00
Kennewick-Pasco- Richland
87 12.32 92.94 75.86 58.62 22.99 18.39 11.30 15.44
Longview 4 0.57 96.50 25.00 100.00 0.00 0.00 25.00 0.00
Mount Vernon- Anacortes
2 0.28 94.08 50.00 50.00 0.00 50.00 0.00 0.00
Olympia 3 0.42 96.06 100.00 100.00 0.00 0.00 0.00 0.00
Spokane 13 1.84 97.14 84.62 61.54 38.46 0.00 4.60 5.48
Tacoma 11 1.56 96.05 36.36 100.00 0.00 0.00 2.94 4.00
Wenatchee 43 6.09 95.12 90.70 32.56 46.51 20.93 16.49 20.00
Yakima 39 5.52 91.60 56.41 53.85 17.95 28.21 1.80 3.05
WA nonMSA 471 66.71 96.40 84.08 51.38 26.33 22.29 15.52 18.14
* Based on 2011 Peer Small Business Data – US and PR. ** Small loans to farms originated and purchased in the MA/AA as a percentage of all small loans to farms originated and purchased in the rated area. *** Farms with revenues of $1 million or less as a percentage of all farms (Source Dun and Bradstreet - 2011). **** Small loans to farms with revenues of $1 million or less as a percentage of all loans reported as small loans to farms. No information was available for 10.2% of small loans to farms originated and purchased by the bank.

Charter Number 24
D - 316
Table 14. Qualified Investments
QUALIFIED INVESTMENTS Geography: WASHINGTON Evaluation Period: JANUARY 1, 2009 To MARCH 31, 2012
MA/Assessment Area:
Prior Period Investments* Current Period Investments** Total Investments Unfunded Commitments***
# $(000’s) # $(000’s) # $(000’s) % of Total # $(000’s) Full-Review:
Seattle-Bellevue-Everett 72 26,759 409 153,671 481 180,429 48.71 13 37,397
Limited-Review:
Bellingham 8 308 36 1,712 44 2,021 0.55 0 0
Bremerton-Silverdale 8 22,999 18 659 26 23,658 6.39 0 0
Kennewick-Pasco- Richland
22 1,018 17 2,847 39 3,865 1.04 0 0
Longview 4 101 12 486 16 588 0.16 0 0
Mount Vernon- Anacortes
11 765 19 3,707 30 4,472 1.21 2 38
Olympia 9 3,915 20 919 29 4,834 1.30 1 3,189
Spokane 11 9,649 90 32,947 101 42,596 11.50 2 658
Tacoma 17 6,961 54 19,997 71 26,957 7.28 2 13,142
Wenatchee 3 89 6 266 9 355 0.10 0 0
Yakima 22 1,309 30 3,488 52 4,797 1.29 0 0
WA nonMSA 25 4,380 49 66,814 74 71,193 19.22 0 0
WA Statewide 6 4,184 67 477 73 4,662 1.26 0 0
* 'Prior Period Investments' means investments made in a previous evaluation period that are outstanding as of the examination date. ** The evaluation period for current period investments is January 1, 2009 to March 31, 2012. *** 'Unfunded Commitments' means legally binding investment commitments that are tracked and recorded by the institution's financial reporting system.

Charter Number 24
D - 317
Table 15. Distribution of Branch Delivery System and Branch Openings/Closings
DISTRIBUTION OF BRANCH DELIVERY SYSTEM/BRANCH OPENINGS/CLOSINGS Geography: WASHINGTON Evaluation Period: JANUARY 1, 2009 To DECEMBER 31, 2011
MA/Assessment Area:
Deposits Branches Branch Openings/Closings Population
% of Rated
Area Deposits in
AA
# of USB Branches
% of Rated
Area Branches in
AA
Location of Branches by
Income of Geographies (%)
# of Branch
Openings
# of Branch
Closings
Net change in Location of Branches (+ or - )
of Population within Each
Geography
Low
Mod
Mid
Upp
Low
Mod
Mid
Upp
Low
Mod
Mid
Upp
Full-Review:
Seattle-Bellevue- Everett
68.12 66 39.52 4.55 25.76 48.48 21.21 2 1 0 -1 2 0 1.93 21.89 52.39 23.79
Limited-Review:
Bellingham 2.28 4 2.40 NA 0.00 100.00 0.00 0 1 NA 0 -1 0 NA 13.44 70.37 16.19
Bremerton- Silverdale
0.77 4 2.40 0.00 25.00 75.00 0.00 0 0 0 0 0 0 3.15 16.39 63.80 16.66
Kennewick- Pasco-Richland
3.06 9 5.39 11.11 33.33 44.44 11.11 0 0 0 0 0 0 6.87 18.55 51.89 22.69
Longview 0.82 2 1.20 0.00 0.00 100.00 0.00 0 0 0 0 0 0 4.85 16.59 61.75 16.81
Mount Vernon- Anacortes
1.39 4 2.40 NA 50.00 50.00 0.00 0 0 NA 0 0 0 NA 9.71 74.25 16.04
Olympia 1.02 4 2.40 NA 50.00 50.00 0.00 2 0 NA 1 1 0 NA 15.50 68.02 16.48
Spokane 6.49 16 9.58 0.00 43.75 43.75 12.50 0 0 0 0 0 0 1.61 30.19 40.90 27.30
Tacoma 4.29 21 12.57 0.00 28.57 57.14 14.29 0 1 0 0 0 -1 2.73 18.13 58.48 20.44
Wenatchee 0.57 1 0.60 NA 0.00 100.00 0.00 0 0 NA 0 0 0 NA 22.29 56.00 21.71
Yakima 3.74 10 5.99 10.00 10.00 40.00 40.00 0 0 0 0 0 0 3.68 29.57 38.98 27.77
WA nonMSA 7.47 26 15.57 0.00 19.23 73.08 7.69 0 1 0 0 -1 0 1.59 17.28 62.74 18.39
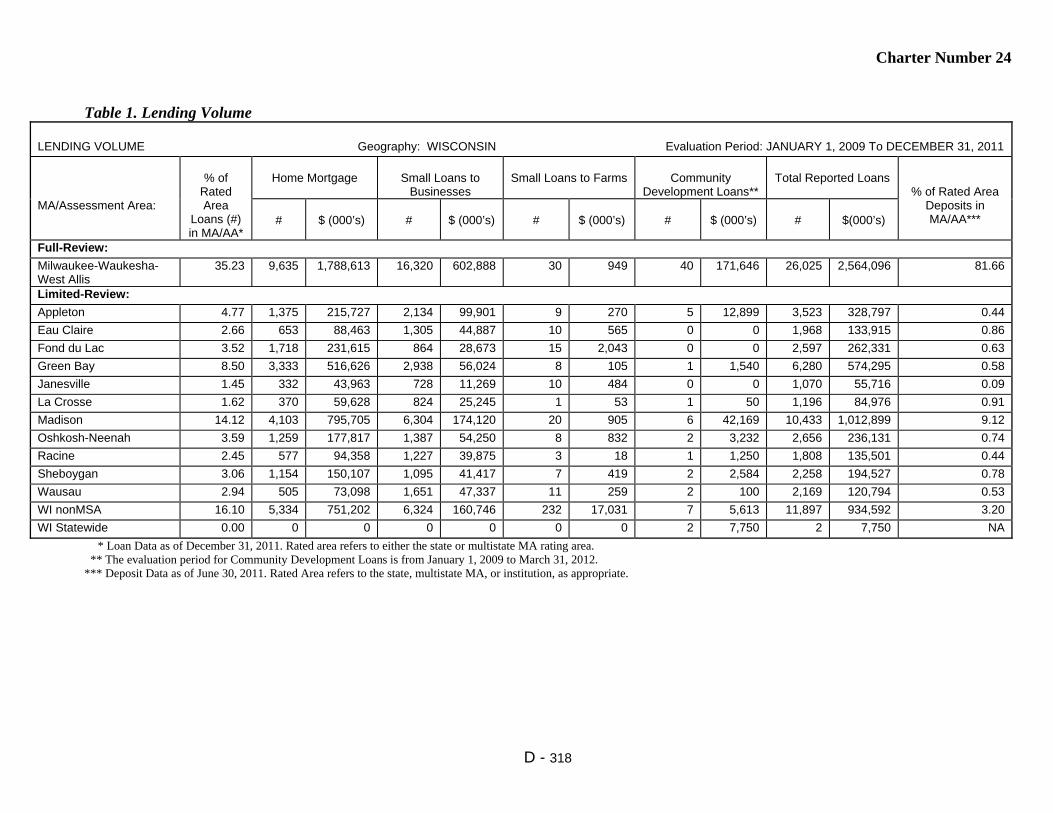
Charter Number 24
D - 318
Table 1. Lending Volume
LENDING VOLUME Geography: WISCONSIN Evaluation Period: JANUARY 1, 2009 To DECEMBER 31, 2011
MA/Assessment Area:
% of
Rated Area
Loans (#) in MA/AA*
Home Mortgage
Small Loans to
Businesses
Small Loans to Farms
Community
Development Loans**
Total Reported Loans
% of Rated Area Deposits in MA/AA***
#
$ (000’s)
#
$ (000’s)
#
$ (000’s)
#
$ (000’s)
#
$(000’s)
Full-Review:
Milwaukee-Waukesha- West Allis
35.23 9,635 1,788,613 16,320 602,888 30 949 40 171,646 26,025 2,564,096 81.66
Limited-Review:
Appleton 4.77 1,375 215,727 2,134 99,901 9 270 5 12,899 3,523 328,797 0.44
Eau Claire 2.66 653 88,463 1,305 44,887 10 565 0 0 1,968 133,915 0.86
Fond du Lac 3.52 1,718 231,615 864 28,673 15 2,043 0 0 2,597 262,331 0.63
Green Bay 8.50 3,333 516,626 2,938 56,024 8 105 1 1,540 6,280 574,295 0.58
Janesville 1.45 332 43,963 728 11,269 10 484 0 0 1,070 55,716 0.09
La Crosse 1.62 370 59,628 824 25,245 1 53 1 50 1,196 84,976 0.91
Madison 14.12 4,103 795,705 6,304 174,120 20 905 6 42,169 10,433 1,012,899 9.12
Oshkosh-Neenah 3.59 1,259 177,817 1,387 54,250 8 832 2 3,232 2,656 236,131 0.74
Racine 2.45 577 94,358 1,227 39,875 3 18 1 1,250 1,808 135,501 0.44
Sheboygan 3.06 1,154 150,107 1,095 41,417 7 419 2 2,584 2,258 194,527 0.78
Wausau 2.94 505 73,098 1,651 47,337 11 259 2 100 2,169 120,794 0.53
WI nonMSA 16.10 5,334 751,202 6,324 160,746 232 17,031 7 5,613 11,897 934,592 3.20
WI Statewide 0.00 0 0 0 0 0 0 2 7,750 2 7,750 NA
* Loan Data as of December 31, 2011. Rated area refers to either the state or multistate MA rating area. ** The evaluation period for Community Development Loans is from January 1, 2009 to March 31, 2012. *** Deposit Data as of June 30, 2011. Rated Area refers to the state, multistate MA, or institution, as appropriate.
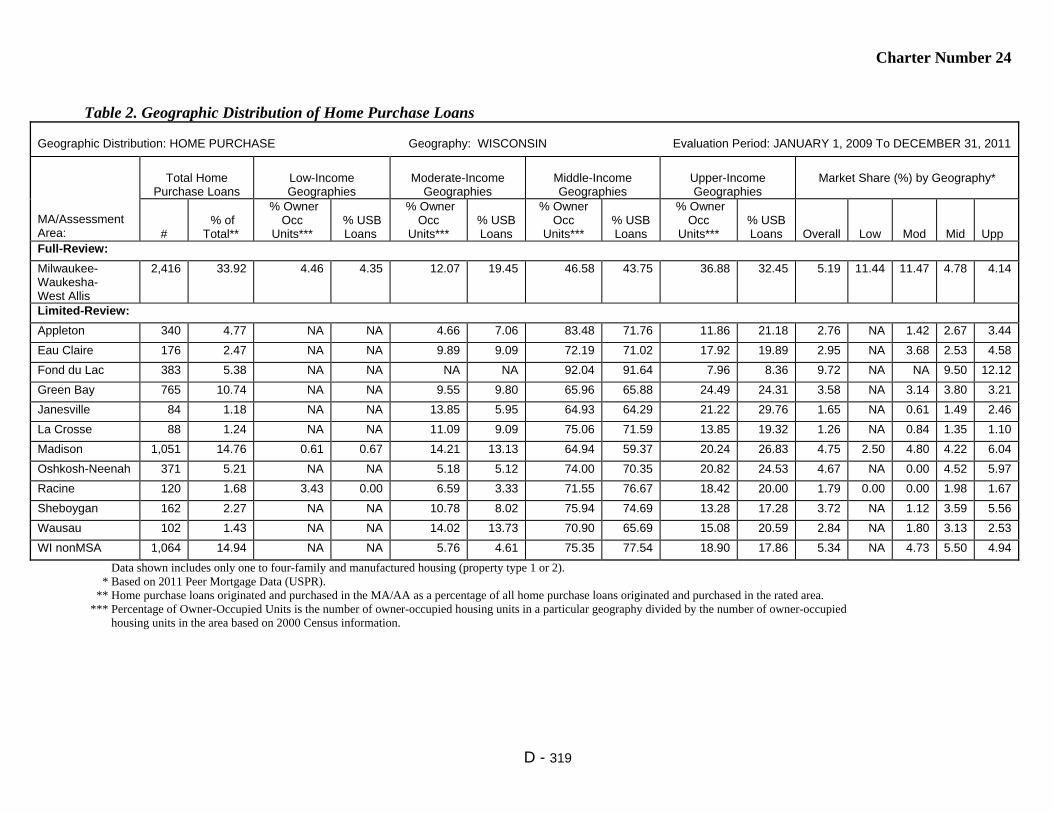
Charter Number 24
D - 319
Table 2. Geographic Distribution of Home Purchase Loans
Geographic Distribution: HOME PURCHASE Geography: WISCONSIN Evaluation Period: JANUARY 1, 2009 To DECEMBER 31, 2011
MA/Assessment Area:
Total Home
Purchase Loans
Low-Income Geographies
Moderate-Income
Geographies
Middle-Income Geographies
Upper-Income Geographies
Market Share (%) by Geography*
#
% of
Total**
% Owner Occ
Units***
% USB Loans
% Owner Occ
Units***
% USB Loans
% Owner Occ
Units***
% USB Loans
% Owner Occ
Units***
% USB Loans
Overall
Low
Mod
Mid
Upp
Full-Review:
Milwaukee- Waukesha- West Allis
2,416 33.92 4.46 4.35 12.07 19.45 46.58 43.75 36.88 32.45 5.19 11.44 11.47 4.78 4.14
Limited-Review:
Appleton 340 4.77 NA NA 4.66 7.06 83.48 71.76 11.86 21.18 2.76 NA 1.42 2.67 3.44
Eau Claire 176 2.47 NA NA 9.89 9.09 72.19 71.02 17.92 19.89 2.95 NA 3.68 2.53 4.58
Fond du Lac 383 5.38 NA NA NA NA 92.04 91.64 7.96 8.36 9.72 NA NA 9.50 12.12
Green Bay 765 10.74 NA NA 9.55 9.80 65.96 65.88 24.49 24.31 3.58 NA 3.14 3.80 3.21
Janesville 84 1.18 NA NA 13.85 5.95 64.93 64.29 21.22 29.76 1.65 NA 0.61 1.49 2.46
La Crosse 88 1.24 NA NA 11.09 9.09 75.06 71.59 13.85 19.32 1.26 NA 0.84 1.35 1.10
Madison 1,051 14.76 0.61 0.67 14.21 13.13 64.94 59.37 20.24 26.83 4.75 2.50 4.80 4.22 6.04
Oshkosh-Neenah 371 5.21 NA NA 5.18 5.12 74.00 70.35 20.82 24.53 4.67 NA 0.00 4.52 5.97
Racine 120 1.68 3.43 0.00 6.59 3.33 71.55 76.67 18.42 20.00 1.79 0.00 0.00 1.98 1.67
Sheboygan 162 2.27 NA NA 10.78 8.02 75.94 74.69 13.28 17.28 3.72 NA 1.12 3.59 5.56
Wausau 102 1.43 NA NA 14.02 13.73 70.90 65.69 15.08 20.59 2.84 NA 1.80 3.13 2.53
WI nonMSA 1,064 14.94 NA NA 5.76 4.61 75.35 77.54 18.90 17.86 5.34 NA 4.73 5.50 4.94
Data shown includes only one to four-family and manufactured housing (property type 1 or 2). * Based on 2011 Peer Mortgage Data (USPR). ** Home purchase loans originated and purchased in the MA/AA as a percentage of all home purchase loans originated and purchased in the rated area. *** Percentage of Owner-Occupied Units is the number of owner-occupied housing units in a particular geography divided by the number of owner-occupied housing units in the area based on 2000 Census information.

Charter Number 24
D - 320
Table 3. Geographic Distribution of Home Improvement Loans
Geographic Distribution: HOME IMPROVEMENT Geography: WISCONSIN Evaluation Period: JANUARY 1, 2009 To DECEMBER 31, 2011
MA/Assessment Area:
Total Home
Improvement Loans
Low-Income Geographies
Moderate-Income
Geographies
Middle-Income Geographies
Upper-Income Geographies
Market Share (%) by Geography*
#
% of
Total**
% Owner
Occ Units***
% USB Loans
% Owner
Occ Units***
% USB Loans
% Owner
Occ Units***
% USB Loans
% Owner
Occ Units***
%
USB Loans
Overall
Low
Mod
Mid
Upp
Full-Review:
Milwaukee-Waukesha- West Allis
238 35.47 4.46 5.46 12.07 15.13 46.58 39.50 36.88 39.92 4.54 7.02 5.91 3.86 4.81
Limited-Review:
Appleton 10 1.49 NA NA 4.66 0.00 83.48 80.00 11.86 20.00 0.83 NA 0.00 1.06 0.00
Eau Claire 28 4.17 NA NA 9.89 10.71 72.19 64.29 17.92 25.00 3.42 NA 3.45 2.87 5.56
Fond du Lac 16 2.38 NA NA NA NA 92.04 100.00 7.96 0.00 4.57 NA NA 5.10 0.00
Green Bay 21 3.13 NA NA 9.55 4.76 65.96 61.90 24.49 33.33 2.27 NA 5.00 2.42 1.49
Janesville 8 1.19 NA NA 13.85 0.00 64.93 50.00 21.22 50.00 1.65 NA 0.00 0.64 6.67
La Crosse 8 1.19 NA NA 11.09 0.00 75.06 75.00 13.85 25.00 1.77 NA 0.00 1.91 2.78
Madison 58 8.64 0.61 0.00 14.21 15.52 64.94 51.72 20.24 32.76 2.16 0.00 2.88 2.05 2.17
Oshkosh-Neenah 21 3.13 NA NA 5.18 0.00 74.00 66.67 20.82 33.33 2.50 NA 0.00 1.59 5.50
Racine 19 2.83 3.43 0.00 6.59 5.26 71.55 78.95 18.42 15.79 2.82 0.00 12.50 3.54 0.00
Sheboygan 31 4.62 NA NA 10.78 16.13 75.94 67.74 13.28 16.13 2.07 NA 0.00 2.27 2.78
Wausau 22 3.28 NA NA 14.02 13.64 70.90 59.09 15.08 27.27 3.23 NA 5.00 2.36 6.38
WI nonMSA 191 28.46 NA NA 5.76 2.09 75.35 82.72 18.90 15.18 6.82 NA 4.35 7.54 5.26
Data shown includes only one to four-family and manufactured housing (property type 1 or 2). * Based on 2011 Peer Mortgage Data (USPR). ** Home improvement loans originated and purchased in the MA/AA as a percentage of all home improvement loans originated and purchased in the rated area. *** Percentage of Owner-Occupied Units is the number of owner-occupied housing units in a particular geography divided by number of owner-occupied housing units in the area based on 2000 Census information.
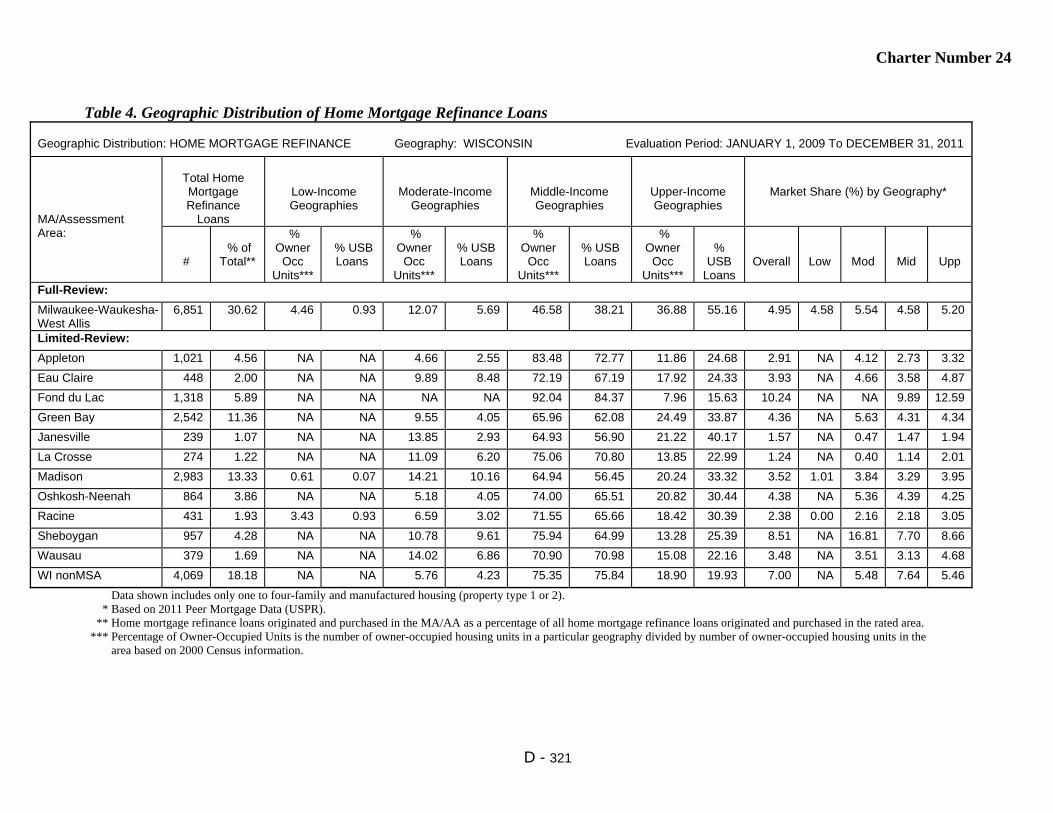
Charter Number 24
D - 321
Table 4. Geographic Distribution of Home Mortgage Refinance Loans
Geographic Distribution: HOME MORTGAGE REFINANCE Geography: WISCONSIN Evaluation Period: JANUARY 1, 2009 To DECEMBER 31, 2011
MA/Assessment Area:
Total Home Mortgage Refinance
Loans
Low-Income Geographies
Moderate-Income Geographies
Middle-Income Geographies
Upper-Income Geographies
Market Share (%) by Geography*
#
% of
Total**
% Owner
Occ Units***
% USB Loans
% Owner
Occ Units***
% USB Loans
% Owner
Occ Units***
% USB Loans
% Owner
Occ Units***
%
USB Loans
Overall
Low
Mod
Mid
Upp
Full-Review:
Milwaukee-Waukesha- West Allis
6,851 30.62 4.46 0.93 12.07 5.69 46.58 38.21 36.88 55.16 4.95 4.58 5.54 4.58 5.20
Limited-Review:
Appleton 1,021 4.56 NA NA 4.66 2.55 83.48 72.77 11.86 24.68 2.91 NA 4.12 2.73 3.32
Eau Claire 448 2.00 NA NA 9.89 8.48 72.19 67.19 17.92 24.33 3.93 NA 4.66 3.58 4.87
Fond du Lac 1,318 5.89 NA NA NA NA 92.04 84.37 7.96 15.63 10.24 NA NA 9.89 12.59
Green Bay 2,542 11.36 NA NA 9.55 4.05 65.96 62.08 24.49 33.87 4.36 NA 5.63 4.31 4.34
Janesville 239 1.07 NA NA 13.85 2.93 64.93 56.90 21.22 40.17 1.57 NA 0.47 1.47 1.94
La Crosse 274 1.22 NA NA 11.09 6.20 75.06 70.80 13.85 22.99 1.24 NA 0.40 1.14 2.01
Madison 2,983 13.33 0.61 0.07 14.21 10.16 64.94 56.45 20.24 33.32 3.52 1.01 3.84 3.29 3.95
Oshkosh-Neenah 864 3.86 NA NA 5.18 4.05 74.00 65.51 20.82 30.44 4.38 NA 5.36 4.39 4.25
Racine 431 1.93 3.43 0.93 6.59 3.02 71.55 65.66 18.42 30.39 2.38 0.00 2.16 2.18 3.05
Sheboygan 957 4.28 NA NA 10.78 9.61 75.94 64.99 13.28 25.39 8.51 NA 16.81 7.70 8.66
Wausau 379 1.69 NA NA 14.02 6.86 70.90 70.98 15.08 22.16 3.48 NA 3.51 3.13 4.68
WI nonMSA 4,069 18.18 NA NA 5.76 4.23 75.35 75.84 18.90 19.93 7.00 NA 5.48 7.64 5.46
Data shown includes only one to four-family and manufactured housing (property type 1 or 2). * Based on 2011 Peer Mortgage Data (USPR). ** Home mortgage refinance loans originated and purchased in the MA/AA as a percentage of all home mortgage refinance loans originated and purchased in the rated area. *** Percentage of Owner-Occupied Units is the number of owner-occupied housing units in a particular geography divided by number of owner-occupied housing units in the area based on 2000 Census information.
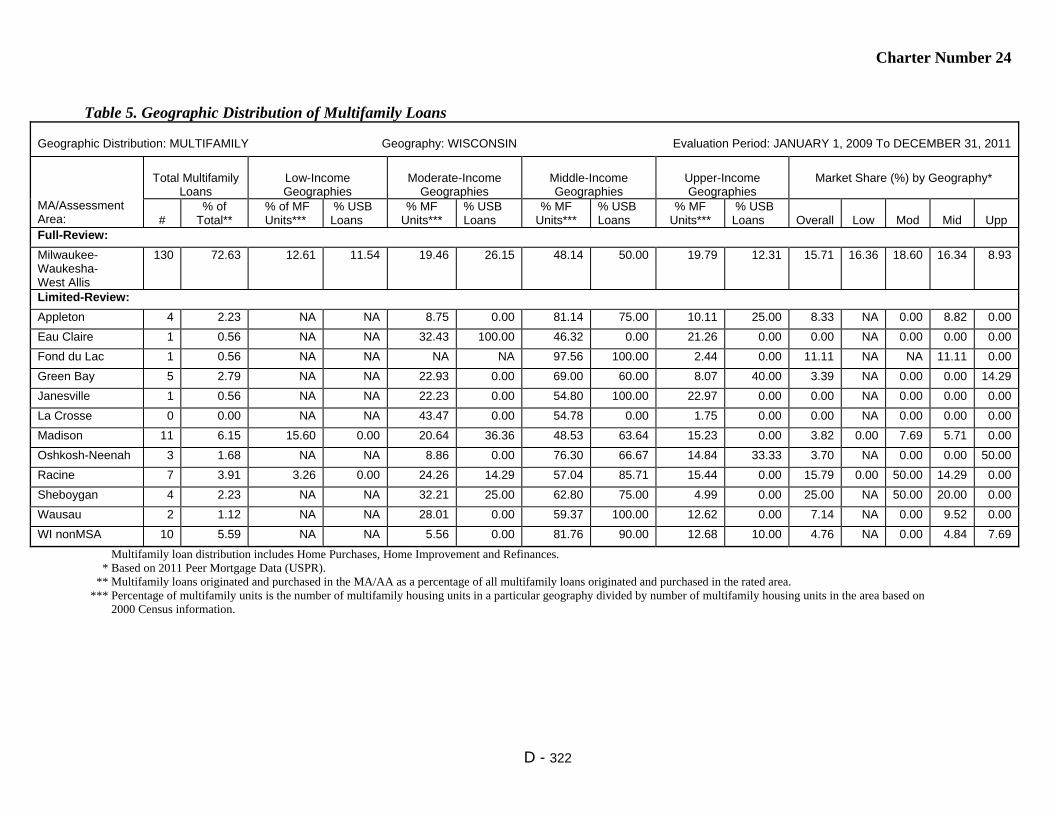
Charter Number 24
D - 322
Table 5. Geographic Distribution of Multifamily Loans
Geographic Distribution: MULTIFAMILY Geography: WISCONSIN Evaluation Period: JANUARY 1, 2009 To DECEMBER 31, 2011
MA/Assessment Area:
Total Multifamily
Loans
Low-Income Geographies
Moderate-Income
Geographies
Middle-Income Geographies
Upper-Income Geographies
Market Share (%) by Geography*
#
% of Total**
% of MF Units***
% USB Loans
% MF Units***
% USB Loans
% MF Units***
% USB Loans
% MF Units***
% USB Loans
Overall
Low
Mod
Mid
Upp
Full-Review:
Milwaukee- Waukesha- West Allis
130 72.63 12.61 11.54 19.46 26.15 48.14 50.00 19.79 12.31 15.71 16.36 18.60 16.34 8.93
Limited-Review:
Appleton 4 2.23 NA NA 8.75 0.00 81.14 75.00 10.11 25.00 8.33 NA 0.00 8.82 0.00
Eau Claire 1 0.56 NA NA 32.43 100.00 46.32 0.00 21.26 0.00 0.00 NA 0.00 0.00 0.00
Fond du Lac 1 0.56 NA NA NA NA 97.56 100.00 2.44 0.00 11.11 NA NA 11.11 0.00
Green Bay 5 2.79 NA NA 22.93 0.00 69.00 60.00 8.07 40.00 3.39 NA 0.00 0.00 14.29
Janesville 1 0.56 NA NA 22.23 0.00 54.80 100.00 22.97 0.00 0.00 NA 0.00 0.00 0.00
La Crosse 0 0.00 NA NA 43.47 0.00 54.78 0.00 1.75 0.00 0.00 NA 0.00 0.00 0.00
Madison 11 6.15 15.60 0.00 20.64 36.36 48.53 63.64 15.23 0.00 3.82 0.00 7.69 5.71 0.00
Oshkosh-Neenah 3 1.68 NA NA 8.86 0.00 76.30 66.67 14.84 33.33 3.70 NA 0.00 0.00 50.00
Racine 7 3.91 3.26 0.00 24.26 14.29 57.04 85.71 15.44 0.00 15.79 0.00 50.00 14.29 0.00
Sheboygan 4 2.23 NA NA 32.21 25.00 62.80 75.00 4.99 0.00 25.00 NA 50.00 20.00 0.00
Wausau 2 1.12 NA NA 28.01 0.00 59.37 100.00 12.62 0.00 7.14 NA 0.00 9.52 0.00
WI nonMSA 10 5.59 NA NA 5.56 0.00 81.76 90.00 12.68 10.00 4.76 NA 0.00 4.84 7.69
Multifamily loan distribution includes Home Purchases, Home Improvement and Refinances. * Based on 2011 Peer Mortgage Data (USPR). ** Multifamily loans originated and purchased in the MA/AA as a percentage of all multifamily loans originated and purchased in the rated area. *** Percentage of multifamily units is the number of multifamily housing units in a particular geography divided by number of multifamily housing units in the area based on 2000 Census information.
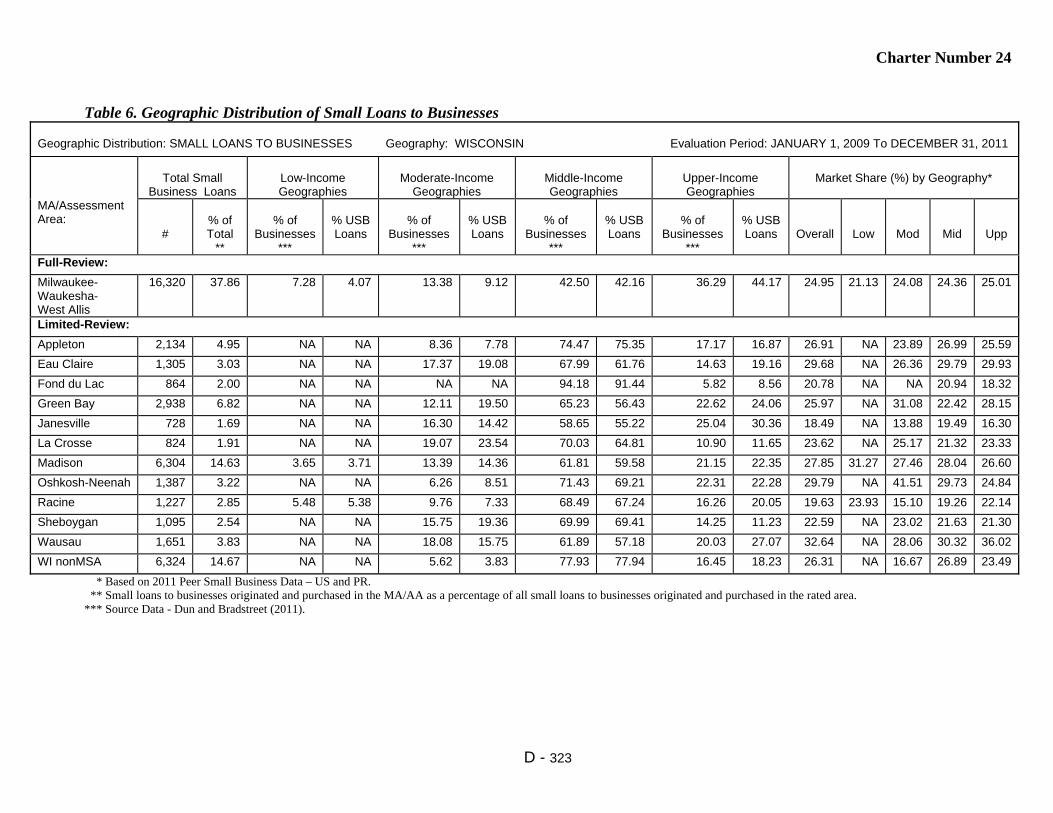
Charter Number 24
D - 323
Table 6. Geographic Distribution of Small Loans to Businesses
Geographic Distribution: SMALL LOANS TO BUSINESSES Geography: WISCONSIN Evaluation Period: JANUARY 1, 2009 To DECEMBER 31, 2011
MA/Assessment Area:
Total Small
Business Loans
Low-Income Geographies
Moderate-Income
Geographies
Middle-Income Geographies
Upper-Income Geographies
Market Share (%) by Geography*
#
% of Total
**
% of
Businesses ***
% USB Loans
% of
Businesses ***
% USB Loans
% of
Businesses ***
% USB Loans
% of
Businesses ***
% USB Loans
Overall
Low
Mod
Mid
Upp
Full-Review:
Milwaukee- Waukesha- West Allis
16,320 37.86 7.28 4.07 13.38 9.12 42.50 42.16 36.29 44.17 24.95 21.13 24.08 24.36 25.01
Limited-Review:
Appleton 2,134 4.95 NA NA 8.36 7.78 74.47 75.35 17.17 16.87 26.91 NA 23.89 26.99 25.59
Eau Claire 1,305 3.03 NA NA 17.37 19.08 67.99 61.76 14.63 19.16 29.68 NA 26.36 29.79 29.93
Fond du Lac 864 2.00 NA NA NA NA 94.18 91.44 5.82 8.56 20.78 NA NA 20.94 18.32
Green Bay 2,938 6.82 NA NA 12.11 19.50 65.23 56.43 22.62 24.06 25.97 NA 31.08 22.42 28.15
Janesville 728 1.69 NA NA 16.30 14.42 58.65 55.22 25.04 30.36 18.49 NA 13.88 19.49 16.30
La Crosse 824 1.91 NA NA 19.07 23.54 70.03 64.81 10.90 11.65 23.62 NA 25.17 21.32 23.33
Madison 6,304 14.63 3.65 3.71 13.39 14.36 61.81 59.58 21.15 22.35 27.85 31.27 27.46 28.04 26.60
Oshkosh-Neenah 1,387 3.22 NA NA 6.26 8.51 71.43 69.21 22.31 22.28 29.79 NA 41.51 29.73 24.84
Racine 1,227 2.85 5.48 5.38 9.76 7.33 68.49 67.24 16.26 20.05 19.63 23.93 15.10 19.26 22.14
Sheboygan 1,095 2.54 NA NA 15.75 19.36 69.99 69.41 14.25 11.23 22.59 NA 23.02 21.63 21.30
Wausau 1,651 3.83 NA NA 18.08 15.75 61.89 57.18 20.03 27.07 32.64 NA 28.06 30.32 36.02
WI nonMSA 6,324 14.67 NA NA 5.62 3.83 77.93 77.94 16.45 18.23 26.31 NA 16.67 26.89 23.49
* Based on 2011 Peer Small Business Data – US and PR. ** Small loans to businesses originated and purchased in the MA/AA as a percentage of all small loans to businesses originated and purchased in the rated area. *** Source Data - Dun and Bradstreet (2011).

Charter Number 24
D - 324
Table 7. Geographic Distribution of Small Loans to Farms
Geographic Distribution: SMALL LOANS TO FARMS Geography: WISCONSIN Evaluation Period: JANUARY 1, 2009 To DECEMBER 31, 2011
MA/Assessment Area:
Total Small
Farm Loans
Low-Income Geographies
Moderate-Income
Geographies
Middle-Income Geographies
Upper-Income Geographies
Market Share (%) by Geography*
#
% of
Total**
% of
Farms***
% USB Loans
% of
Farms***
% USB Loans
% of
Farms***
% USB Loans
% of
Farms***
% USB Loans
Overall
Low
Mod
Mid
Upp
Full-Review:
Milwaukee-Waukesha- West Allis
30 8.24 2.34 0.00 5.62 0.00 49.43 30.00 42.52 70.00 2.35 0.00 0.00 1.64 4.35
Limited-Review:
Appleton 9 2.47 NA NA 0.87 0.00 89.61 88.89 9.51 11.11 0.00 NA 0.00 0.00 0.00
Eau Claire 10 2.75 NA NA 7.37 0.00 77.37 90.00 15.25 10.00 2.75 NA 0.00 2.97 0.00
Fond du Lac 15 4.12 NA NA NA NA 90.84 40.00 9.16 60.00 1.89 NA NA 0.00 23.08
Green Bay 8 2.20 NA NA 3.23 0.00 77.79 50.00 18.98 50.00 0.00 NA 0.00 0.00 0.00
Janesville 10 2.75 NA NA 3.59 0.00 75.45 70.00 20.97 30.00 0.60 NA 0.00 0.83 0.00
La Crosse 1 0.27 NA NA 1.94 0.00 86.41 100.00 11.65 0.00 0.00 NA 0.00 0.00 0.00
Madison 20 5.49 0.54 0.00 9.14 15.00 72.67 65.00 17.65 20.00 0.45 0.00 0.00 0.68 0.00
Oshkosh-Neenah 8 2.20 NA NA 2.04 0.00 80.00 87.50 17.96 12.50 3.77 NA 0.00 5.13 0.00
Racine 3 0.82 1.11 0.00 3.15 33.33 72.78 33.33 22.96 33.33 0.00 0.00 0.00 0.00 0.00
Sheboygan 7 1.92 NA NA 1.79 0.00 83.93 100.00 14.29 0.00 1.90 NA 0.00 2.08 0.00
Wausau 11 3.02 NA NA 12.12 18.18 77.63 72.73 10.25 9.09 0.77 NA 7.69 0.00 0.00
WI nonMSA 232 63.74 NA NA 4.13 1.72 74.35 90.95 21.53 7.33 6.00 NA 0.00 7.37 0.00
* Based on 2011 Peer Small Business Data – US and PR. ** Small loans to farms originated and purchased in the MA/AA as a percentage of all small loans to farms originated and purchased in the rated area. *** Source Data - Dun and Bradstreet (2011).

Charter Number 24
D - 325
Table 8. Borrower Distribution of Home Purchase Loans
Borrower Distribution: HOME PURCHASE Geography: WISCONSIN Evaluation Period: JANUARY 1, 2009 To DECEMBER 31, 2011
MA/Assessment Area:
Total Home
Purchase Loans
Low-Income Borrowers
Moderate-Income
Borrowers
Middle-Income
Borrowers
Upper-Income
Borrowers
Market Share*
#
% of Total
**
% Families
***
% USB Loans
****
% Families
***
% USB Loans
****
% Families
***
% USB Loans
****
% Families
***
% USB Loans
****
Over-
all
Low
Mod
Mid
Upp
Full-Review:
Milwaukee- Waukesha- West Allis
2,416 33.92 19.84 22.41 17.89 28.13 23.61 21.53 38.65 27.93 5.05 8.97 5.69 4.19 3.97
Limited-Review:
Appleton 340 4.77 13.81 17.26 20.05 33.55 30.79 26.06 35.34 23.13 2.77 1.11 2.58 3.66 3.45
Eau Claire 176 2.47 16.25 19.38 20.21 27.50 26.25 25.00 37.29 28.13 2.92 4.46 1.82 2.88 3.20
Fond du Lac 383 5.38 14.43 14.59 18.74 35.81 31.55 28.91 35.27 20.69 10.03 4.63 9.71 12.92 10.26
Green Bay 765 10.74 15.64 19.07 18.07 33.88 26.77 28.53 39.52 18.52 3.86 3.78 4.05 4.33 3.33
Janesville 84 1.18 15.96 17.72 20.02 25.32 26.44 26.58 37.57 30.38 1.81 0.71 1.20 1.60 3.61
La Crosse 88 1.24 16.24 8.82 19.83 26.47 26.51 33.82 37.43 30.88 1.30 0.73 0.67 2.33 1.16
Madison 1,051 14.76 15.60 10.60 19.05 28.64 28.46 27.01 36.89 33.74 5.23 4.65 4.81 4.74 6.13
Oshkosh-Neenah 371 5.21 15.68 16.00 19.70 31.14 28.02 27.14 36.60 25.71 4.68 4.81 2.00 6.50 5.44
Racine 120 1.68 17.83 16.19 18.46 37.14 25.73 18.10 37.98 28.57 1.86 2.20 2.60 0.71 2.00
Sheboygan 162 2.27 14.72 17.65 19.38 21.32 29.30 28.68 36.60 32.35 4.23 2.50 3.57 4.27 5.83
Wausau 102 1.43 15.30 17.39 19.58 39.13 28.61 26.09 36.51 17.39 2.90 4.19 4.19 1.07 2.32
WI nonMSA 1,064 14.94 14.88 12.16 18.71 22.43 25.89 26.10 40.51 39.31 5.12 6.39 3.84 5.38 5.39
Data shown includes only one to four-family and manufactured housing (property type 1 or 2). * Based on 2011 Peer Mortgage Data (USPR). ** Home purchase loans originated and purchased in the MA/AA as a percentage of all home purchase loans originated and purchased in the rated area. *** Percentage of Families is based on the 2000 Census information. **** As a percentage of loans with borrower income information available. No information was available for 10.1% of loans originated and purchased by USB in the Multistate MAs.
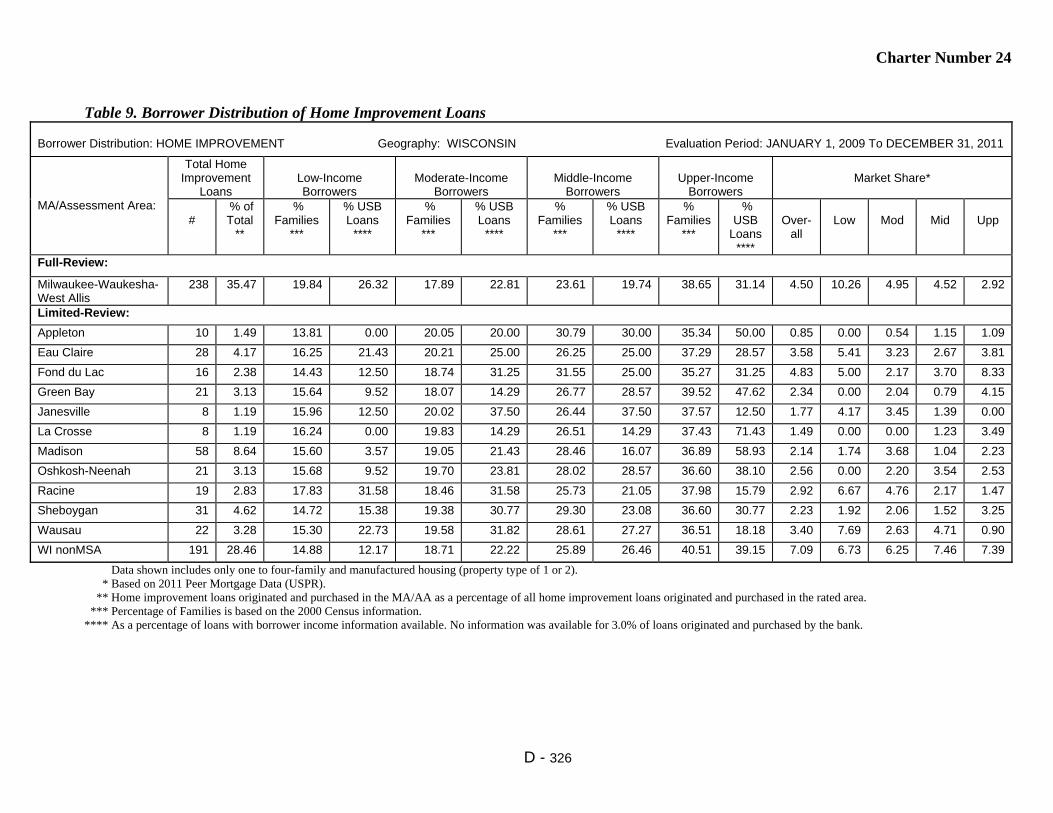
Charter Number 24
D - 326
Table 9. Borrower Distribution of Home Improvement Loans
Borrower Distribution: HOME IMPROVEMENT Geography: WISCONSIN Evaluation Period: JANUARY 1, 2009 To DECEMBER 31, 2011
MA/Assessment Area:
Total Home Improvement
Loans
Low-Income Borrowers
Moderate-Income
Borrowers
Middle-Income
Borrowers
Upper-Income
Borrowers
Market Share*
#
% of Total
**
% Families
***
% USB Loans
****
% Families
***
% USB Loans
****
% Families
***
% USB Loans
****
% Families
***
% USB
Loans ****
Over-
all
Low
Mod
Mid
Upp
Full-Review:
Milwaukee-Waukesha- West Allis
238 35.47 19.84 26.32 17.89 22.81 23.61 19.74 38.65 31.14 4.50 10.26 4.95 4.52 2.92
Limited-Review:
Appleton 10 1.49 13.81 0.00 20.05 20.00 30.79 30.00 35.34 50.00 0.85 0.00 0.54 1.15 1.09
Eau Claire 28 4.17 16.25 21.43 20.21 25.00 26.25 25.00 37.29 28.57 3.58 5.41 3.23 2.67 3.81
Fond du Lac 16 2.38 14.43 12.50 18.74 31.25 31.55 25.00 35.27 31.25 4.83 5.00 2.17 3.70 8.33
Green Bay 21 3.13 15.64 9.52 18.07 14.29 26.77 28.57 39.52 47.62 2.34 0.00 2.04 0.79 4.15
Janesville 8 1.19 15.96 12.50 20.02 37.50 26.44 37.50 37.57 12.50 1.77 4.17 3.45 1.39 0.00
La Crosse 8 1.19 16.24 0.00 19.83 14.29 26.51 14.29 37.43 71.43 1.49 0.00 0.00 1.23 3.49
Madison 58 8.64 15.60 3.57 19.05 21.43 28.46 16.07 36.89 58.93 2.14 1.74 3.68 1.04 2.23
Oshkosh-Neenah 21 3.13 15.68 9.52 19.70 23.81 28.02 28.57 36.60 38.10 2.56 0.00 2.20 3.54 2.53
Racine 19 2.83 17.83 31.58 18.46 31.58 25.73 21.05 37.98 15.79 2.92 6.67 4.76 2.17 1.47
Sheboygan 31 4.62 14.72 15.38 19.38 30.77 29.30 23.08 36.60 30.77 2.23 1.92 2.06 1.52 3.25
Wausau 22 3.28 15.30 22.73 19.58 31.82 28.61 27.27 36.51 18.18 3.40 7.69 2.63 4.71 0.90
WI nonMSA 191 28.46 14.88 12.17 18.71 22.22 25.89 26.46 40.51 39.15 7.09 6.73 6.25 7.46 7.39
Data shown includes only one to four-family and manufactured housing (property type of 1 or 2). * Based on 2011 Peer Mortgage Data (USPR). ** Home improvement loans originated and purchased in the MA/AA as a percentage of all home improvement loans originated and purchased in the rated area. *** Percentage of Families is based on the 2000 Census information. **** As a percentage of loans with borrower income information available. No information was available for 3.0% of loans originated and purchased by the bank.

Charter Number 24
D - 327
Table 10. Borrower Distribution of Home Mortgage Refinance Loans
Borrower Distribution: HOME MORTGAGE REFINANCE Geography: WISCONSIN Evaluation Period: JANUARY 1, 2009 To DECEMBER 31, 2011
MA/Assessment Area:
Total Home Mortgage Refinance Loans
Low-Income Borrowers
Moderate-Income Borrowers
Middle-Income Borrowers
Upper-Income Borrowers
Market Share*
#
% of Total **
% Families
***
% USB Loans
****
% Families
***
% USB Loans
****
% Families
***
% USB Loans
****
% Families
***
% USB Loans
****
Over-
all
Low
Mod
Mid
Upp
Full-Review:
Milwaukee- Waukesha- West Allis
6,851 30.62 19.84 6.61 17.89 15.82 23.61 25.72 38.65 51.84 4.85 7.18 4.53 4.68 4.77
Limited-Review:
Appleton 1,021 4.56 13.81 8.74 20.05 24.91 30.79 28.81 35.34 37.54 2.87 2.90 2.99 3.03 2.68
Eau Claire 448 2.00 16.25 9.50 20.21 21.75 26.25 24.00 37.29 44.75 3.86 4.38 4.84 2.62 4.09
Fond du Lac 1,318 5.89 14.43 7.68 18.74 23.77 31.55 31.70 35.27 36.85 10.40 11.62 12.86 10.15 8.65
Green Bay 2,542 11.36 15.64 7.70 18.07 19.20 26.77 29.72 39.52 43.38 4.56 4.39 4.45 4.65 4.58
Janesville 239 1.07 15.96 6.28 20.02 21.26 26.44 27.05 37.57 45.41 1.58 0.71 2.35 0.77 1.97
La Crosse 274 1.22 16.24 4.26 19.83 14.47 26.51 25.53 37.43 55.74 1.28 0.00 1.61 0.80 1.68
Madison 2,983 13.33 15.60 7.38 19.05 19.95 28.46 24.05 36.89 48.62 3.78 4.36 3.86 3.09 4.11
Oshkosh-Neenah 864 3.86 15.68 10.27 19.70 17.58 28.02 27.00 36.60 45.15 4.29 4.53 4.32 3.63 4.60
Racine 431 1.93 17.83 8.15 18.46 21.63 25.73 27.81 37.98 42.42 2.40 2.57 2.41 2.22 2.47
Sheboygan 957 4.28 14.72 9.25 19.38 25.98 29.30 25.50 36.60 39.26 9.70 10.94 11.13 8.25 9.71
Wausau 379 1.69 15.30 6.65 19.58 20.52 28.61 34.68 36.51 38.15 3.83 1.98 3.88 3.95 4.28
WI nonMSA 4,069 18.18 14.88 7.05 18.71 18.39 25.89 25.25 40.51 49.31 7.29 8.53 8.02 7.52 6.80
Data shown includes only one to four-family and manufactured housing (property type 1 or 2). * Based on 2011 Peer Mortgage Data (USPR). ** Home refinance loans originated and purchased in the MA/AA as a percentage of all home refinance loans originated and purchased in the rated area. *** Percentage of Families is based on the 2000 Census information. **** As a percentage of loans with borrower income information available. No information was available for 14.0% of loans originated and purchased by the bank.
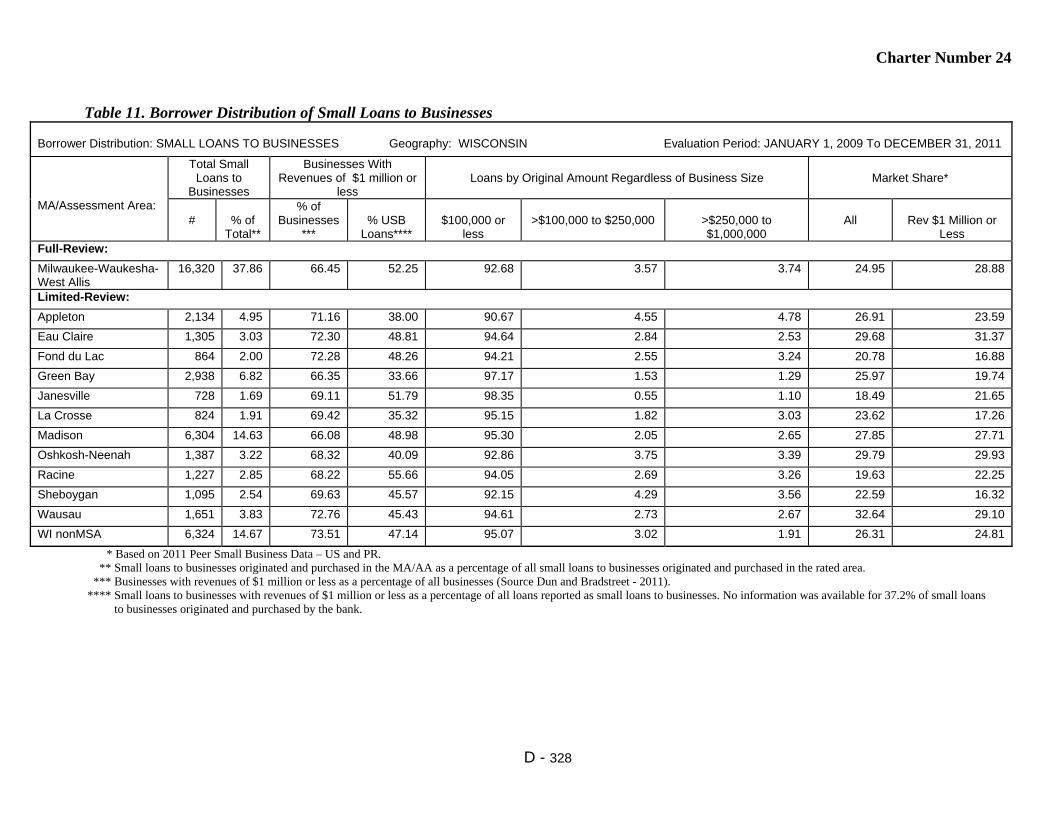
Charter Number 24
D - 328
Table 11. Borrower Distribution of Small Loans to Businesses
Borrower Distribution: SMALL LOANS TO BUSINESSES Geography: WISCONSIN Evaluation Period: JANUARY 1, 2009 To DECEMBER 31, 2011
MA/Assessment Area:
Total Small Loans to
Businesses
Businesses With Revenues of $1 million or
less
Loans by Original Amount Regardless of Business Size
Market Share*
#
% of
Total**
% of Businesses
***
% USB
Loans****
$100,000 or
less
>$100,000 to $250,000
>$250,000 to $1,000,000
All
Rev $1 Million or
Less Full-Review:
Milwaukee-Waukesha- West Allis
16,320 37.86 66.45 52.25 92.68 3.57 3.74 24.95 28.88
Limited-Review:
Appleton 2,134 4.95 71.16 38.00 90.67 4.55 4.78 26.91 23.59
Eau Claire 1,305 3.03 72.30 48.81 94.64 2.84 2.53 29.68 31.37
Fond du Lac 864 2.00 72.28 48.26 94.21 2.55 3.24 20.78 16.88
Green Bay 2,938 6.82 66.35 33.66 97.17 1.53 1.29 25.97 19.74
Janesville 728 1.69 69.11 51.79 98.35 0.55 1.10 18.49 21.65
La Crosse 824 1.91 69.42 35.32 95.15 1.82 3.03 23.62 17.26
Madison 6,304 14.63 66.08 48.98 95.30 2.05 2.65 27.85 27.71
Oshkosh-Neenah 1,387 3.22 68.32 40.09 92.86 3.75 3.39 29.79 29.93
Racine 1,227 2.85 68.22 55.66 94.05 2.69 3.26 19.63 22.25
Sheboygan 1,095 2.54 69.63 45.57 92.15 4.29 3.56 22.59 16.32
Wausau 1,651 3.83 72.76 45.43 94.61 2.73 2.67 32.64 29.10
WI nonMSA 6,324 14.67 73.51 47.14 95.07 3.02 1.91 26.31 24.81
* Based on 2011 Peer Small Business Data – US and PR. ** Small loans to businesses originated and purchased in the MA/AA as a percentage of all small loans to businesses originated and purchased in the rated area. *** Businesses with revenues of $1 million or less as a percentage of all businesses (Source Dun and Bradstreet - 2011). **** Small loans to businesses with revenues of $1 million or less as a percentage of all loans reported as small loans to businesses. No information was available for 37.2% of small loans to businesses originated and purchased by the bank.

Charter Number 24
D - 329
Table 12. Borrower Distribution of Small Loans to Farms
Borrower Distribution: SMALL LOANS TO FARMS Geography: WISCONSIN Evaluation Period: JANUARY 1, 2009 To DECEMBER 31, 2011
MA/Assessment Area:
Total Small Loans to Farms
Farms With Revenues of $1 million or less
Loans by Original Amount Regardless of Farm Size
Market Share*
#
% of
Total**
% of
Farms***
% USB
Loans****
$100,000 or
less
>$100,000 to $250,000
>$250,000 to $500,000
All
Rev $1 Million or
Less Full-Review:
Milwaukee-Waukesha- West Allis
30 8.24 95.61 53.33 86.67 13.33 0.00 2.35 2.50
Limited-Review:
Appleton 9 2.47 97.09 22.22 88.89 11.11 0.00 0.00 0.00
Eau Claire 10 2.75 98.79 50.00 80.00 20.00 0.00 2.75 1.39
Fond du Lac 15 4.12 96.90 66.67 53.33 26.67 20.00 1.89 0.00
Green Bay 8 2.20 97.52 25.00 100.00 0.00 0.00 0.00 0.00
Janesville 10 2.75 96.97 80.00 80.00 20.00 0.00 0.60 0.83
La Crosse 1 0.27 98.06 100.00 100.00 0.00 0.00 0.00 0.00
Madison 20 5.49 97.18 60.00 90.00 0.00 10.00 0.45 0.67
Oshkosh-Neenah 8 2.20 97.78 75.00 75.00 25.00 0.00 3.77 5.56
Racine 3 0.82 97.22 66.67 100.00 0.00 0.00 0.00 0.00
Sheboygan 7 1.92 95.31 57.14 85.71 14.29 0.00 1.90 0.00
Wausau 11 3.02 98.84 45.45 100.00 0.00 0.00 0.77 1.08
WI nonMSA 232 63.74 97.17 75.86 78.88 17.67 3.45 6.00 5.23
* Based on 2011 Peer Small Business Data – US and PR. ** Small loans to farms originated and purchased in the MA/AA as a percentage of all small loans to farms originated and purchased in the rated area. *** Farms with revenues of $1 million or less as a percentage of all farms (Source Dun and Bradstreet - 2011). **** Small loans to farms with revenues of $1 million or less as a percentage of all loans reported as small loans to farms. No information was available for 22.8% of small loans to farms originated and purchased by the bank.
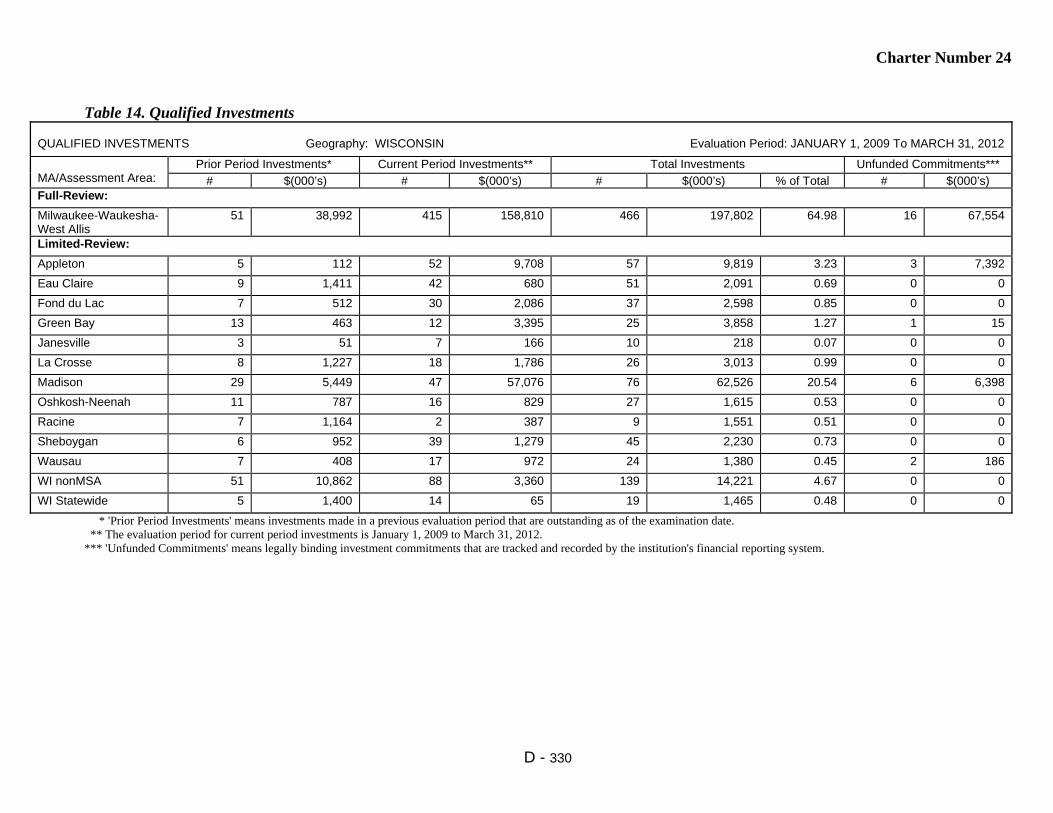
Charter Number 24
D - 330
Table 14. Qualified Investments
QUALIFIED INVESTMENTS Geography: WISCONSIN Evaluation Period: JANUARY 1, 2009 To MARCH 31, 2012
MA/Assessment Area:
Prior Period Investments* Current Period Investments** Total Investments Unfunded Commitments***
# $(000’s) # $(000’s) # $(000’s) % of Total # $(000’s) Full-Review:
Milwaukee-Waukesha- West Allis
51 38,992 415 158,810 466 197,802 64.98 16 67,554
Limited-Review:
Appleton 5 112 52 9,708 57 9,819 3.23 3 7,392
Eau Claire 9 1,411 42 680 51 2,091 0.69 0 0
Fond du Lac 7 512 30 2,086 37 2,598 0.85 0 0
Green Bay 13 463 12 3,395 25 3,858 1.27 1 15
Janesville 3 51 7 166 10 218 0.07 0 0
La Crosse 8 1,227 18 1,786 26 3,013 0.99 0 0
Madison 29 5,449 47 57,076 76 62,526 20.54 6 6,398
Oshkosh-Neenah 11 787 16 829 27 1,615 0.53 0 0
Racine 7 1,164 2 387 9 1,551 0.51 0 0
Sheboygan 6 952 39 1,279 45 2,230 0.73 0 0
Wausau 7 408 17 972 24 1,380 0.45 2 186
WI nonMSA 51 10,862 88 3,360 139 14,221 4.67 0 0
WI Statewide 5 1,400 14 65 19 1,465 0.48 0 0
* 'Prior Period Investments' means investments made in a previous evaluation period that are outstanding as of the examination date. ** The evaluation period for current period investments is January 1, 2009 to March 31, 2012. *** 'Unfunded Commitments' means legally binding investment commitments that are tracked and recorded by the institution's financial reporting system.

Charter Number 24
D - 331
Table 15. Distribution of Branch Delivery System and Branch Openings/Closings
DISTRIBUTION OF BRANCH DELIVERY SYSTEM/BRANCH OPENINGS/CLOSINGS Geography: WISCONSIN Evaluation Period: JANUARY 1, 2009 To DECEMBER 31, 2011
MA/Assessment Area:
Deposits Branches Branch Openings/Closings Population
of Rated
Area Deposits in
AA
# of USB Branches
% of Rated
Area Branches in
AA
Location of Branches by
Income of Geographies (%)
# of Branch
Openings
# of Branch
Closings
Net change in Location of Branches (+ or - )
% of Population within Each
Geography
Low
Mod
Mid
Upp
Low
Mod
Mid
Upp
Low
Mod
Mid
Upp
Full-Review:
Milwaukee- Waukesha- West Allis
81.66 46 40.00 8.70 8.70 43.48 36.96 3 0 0 1 0 1 11.87 16.37 42.27 29.29
Limited-Review:
Appleton 0.44 3 2.61 NA 33.33 66.67 0.00 1 0 NA 0 1 0 NA 6.16 82.89 10.95
Eau Claire 0.86 5 4.35 NA 40.00 40.00 20.00 0 0 NA 0 0 0 NA 14.91 66.07 19.02
Fond du Lac 0.63 3 2.61 NA NA 100.00 0.00 0 0 NA NA 0 0 NA NA 92.18 7.82
Green Bay 0.58 3 2.61 NA 33.33 66.67 0.00 0 0 NA 0 0 0 NA 14.43 63.65 21.06
Janesville 0.09 1 0.87 NA 0.00 100.00 0.00 0 0 NA 0 0 0 NA 19.07 60.23 20.70
La Crosse 0.91 2 1.74 NA 50.00 50.00 0.00 0 0 NA 0 0 0 NA 19.38 69.70 10.92
Madison 9.12 12 10.43 8.33 16.67 50.00 25.00 1 0 0 0 1 0 6.75 16.08 60.09 17.09
Oshkosh-Neenah 0.74 3 2.61 NA 33.33 66.67 0.00 0 0 NA 0 0 0 NA 6.60 75.01 18.39
Racine 0.44 3 2.61 0.00 33.33 66.67 0.00 0 0 0 0 0 0 7.23 9.47 66.60 16.70
Sheboygan 0.78 2 1.74 NA 100.00 0.00 0.00 0 0 NA 0 0 0 NA 16.35 71.79 11.85
Wausau 0.53 5 4.35 NA 20.00 40.00 40.00 0 0 NA 0 0 0 NA 17.15 68.63 14.22
WI Non MSA 3.20 27 23.48 NA 3.70 88.89 7.41 0 0 NA 0 0 0 NA 5.51 76.16 18.33
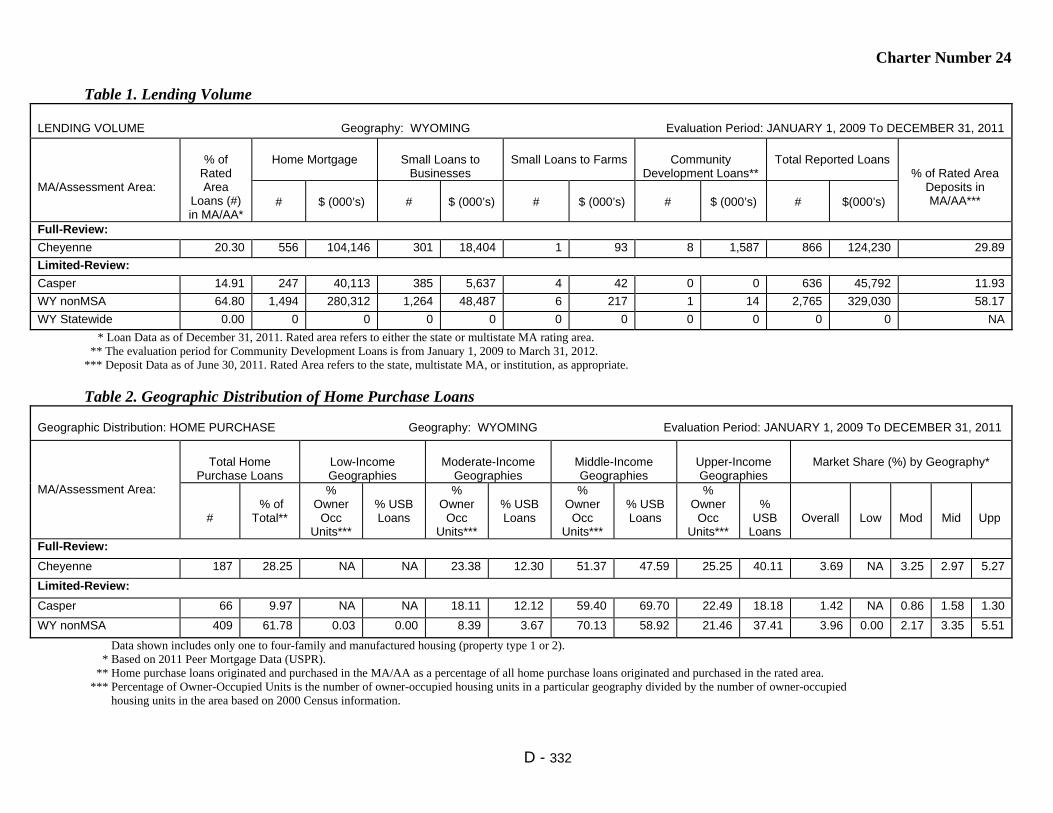
Charter Number 24
D - 332
Table 1. Lending Volume
LENDING VOLUME Geography: WYOMING Evaluation Period: JANUARY 1, 2009 To DECEMBER 31, 2011
MA/Assessment Area:
% of
Rated Area
Loans (#) in MA/AA*
Home Mortgage
Small Loans to
Businesses
Small Loans to Farms
Community
Development Loans**
Total Reported Loans
% of Rated Area Deposits in MA/AA***
#
$ (000’s)
#
$ (000’s)
#
$ (000’s)
#
$ (000’s)
#
$(000’s)
Full-Review:
Cheyenne 20.30 556 104,146 301 18,404 1 93 8 1,587 866 124,230 29.89
Limited-Review:
Casper 14.91 247 40,113 385 5,637 4 42 0 0 636 45,792 11.93
WY nonMSA 64.80 1,494 280,312 1,264 48,487 6 217 1 14 2,765 329,030 58.17
WY Statewide 0.00 0 0 0 0 0 0 0 0 0 0 NA
* Loan Data as of December 31, 2011. Rated area refers to either the state or multistate MA rating area. ** The evaluation period for Community Development Loans is from January 1, 2009 to March 31, 2012. *** Deposit Data as of June 30, 2011. Rated Area refers to the state, multistate MA, or institution, as appropriate. Table 2. Geographic Distribution of Home Purchase Loans
Geographic Distribution: HOME PURCHASE Geography: WYOMING Evaluation Period: JANUARY 1, 2009 To DECEMBER 31, 2011
MA/Assessment Area:
Total Home
Purchase Loans
Low-Income Geographies
Moderate-Income
Geographies
Middle-Income Geographies
Upper-Income Geographies
Market Share (%) by Geography*
#
% of
Total**
% Owner
Occ Units***
% USB Loans
% Owner
Occ Units***
% USB Loans
% Owner
Occ Units***
% USB Loans
% Owner
Occ Units***
%
USB Loans
Overall
Low
Mod
Mid
Upp
Full-Review:
Cheyenne 187 28.25 NA NA 23.38 12.30 51.37 47.59 25.25 40.11 3.69 NA 3.25 2.97 5.27
Limited-Review:
Casper 66 9.97 NA NA 18.11 12.12 59.40 69.70 22.49 18.18 1.42 NA 0.86 1.58 1.30
WY nonMSA 409 61.78 0.03 0.00 8.39 3.67 70.13 58.92 21.46 37.41 3.96 0.00 2.17 3.35 5.51
Data shown includes only one to four-family and manufactured housing (property type 1 or 2). * Based on 2011 Peer Mortgage Data (USPR). ** Home purchase loans originated and purchased in the MA/AA as a percentage of all home purchase loans originated and purchased in the rated area. *** Percentage of Owner-Occupied Units is the number of owner-occupied housing units in a particular geography divided by the number of owner-occupied housing units in the area based on 2000 Census information.

Charter Number 24
D - 333
Table 3. Geographic Distribution of Home Improvement Loans
Geographic Distribution: HOME IMPROVEMENT Geography: WYOMING Evaluation Period: JANUARY 1, 2009 To DECEMBER 31, 2011
MA/Assessment Area:
Total Home
Improvement Loans
Low-Income Geographies
Moderate-Income
Geographies
Middle-Income Geographies
Upper-Income Geographies
Market Share (%) by Geography*
#
% of
Total**
% Owner
Occ Units***
% USB Loans
% Owner
Occ Units***
% USB Loans
% Owner
Occ Units***
% USB Loans
% Owner
Occ Units***
%
USB Loans
Overall
Low
Mod
Mid
Upp
Full-Review:
Cheyenne 11 10.00 NA NA 23.38 27.27 51.37 36.36 25.25 36.36 2.21 NA 2.78 1.83 2.47
Limited-Review:
Casper 14 12.73 NA NA 18.11 7.14 59.40 78.57 22.49 14.29 5.52 NA 3.70 6.98 3.13
WY nonMSA 85 77.27 0.03 0.00 8.39 7.06 70.13 70.59 21.46 22.35 6.51 0.00 11.54 4.41 11.01
Data shown includes only one to four-family and manufactured housing (property type 1 or 2). * Based on 2011 Peer Mortgage Data (USPR). ** Home improvement loans originated and purchased in the MA/AA as a percentage of all home improvement loans originated and purchased in the rated area. *** Percentage of Owner-Occupied Units is the number of owner-occupied housing units in a particular geography divided by number of owner-occupied housing units in the area based on 2000 Census information.

Charter Number 24
D - 334
Table 4. Geographic Distribution of Home Mortgage Refinance Loans
Geographic Distribution: HOME MORTGAGE REFINANCE Geography: WYOMING Evaluation Period: JANUARY 1, 2009 To DECEMBER 31, 2011
MA/Assessment Area:
Total Home Mortgage
Refinance Loans
Low-Income Geographies
Moderate-Income Geographies
Middle-Income Geographies
Upper-Income Geographies
Market Share (%) by Geography*
#
% of
Total**
% Owner
Occ Units***
% USB Loans
% Owner Occ
Units***
% USB Loans
% Owner Occ
Units***
% USB Loans
% Owner Occ
Units***
% USB Loans
Overall
Low
Mod
Mid
Upp
Full-Review:
Cheyenne 356 23.42 NA NA 23.38 13.76 51.37 45.79 25.25 40.45 5.55 NA 7.82 5.26 5.22
Limited-Review:
Casper 167 10.99 NA NA 18.11 13.17 59.40 58.68 22.49 28.14 3.85 NA 5.00 3.54 4.09
WY nonMSA 997 65.59 0.03 0.00 8.39 4.01 70.13 64.29 21.46 31.70 6.12 0.00 5.95 5.52 7.36
Data shown includes only one to four-family and manufactured housing (property type 1 or 2). * Based on 2011 Peer Mortgage Data (USPR). ** Home mortgage refinance loans originated and purchased in the MA/AA as a percentage of all home mortgage refinance loans originated and purchased in the rated area. *** Percentage of Owner-Occupied Units is the number of owner-occupied housing units in a particular geography divided by number of owner-occupied housing units in the area based on 2000 Census information.
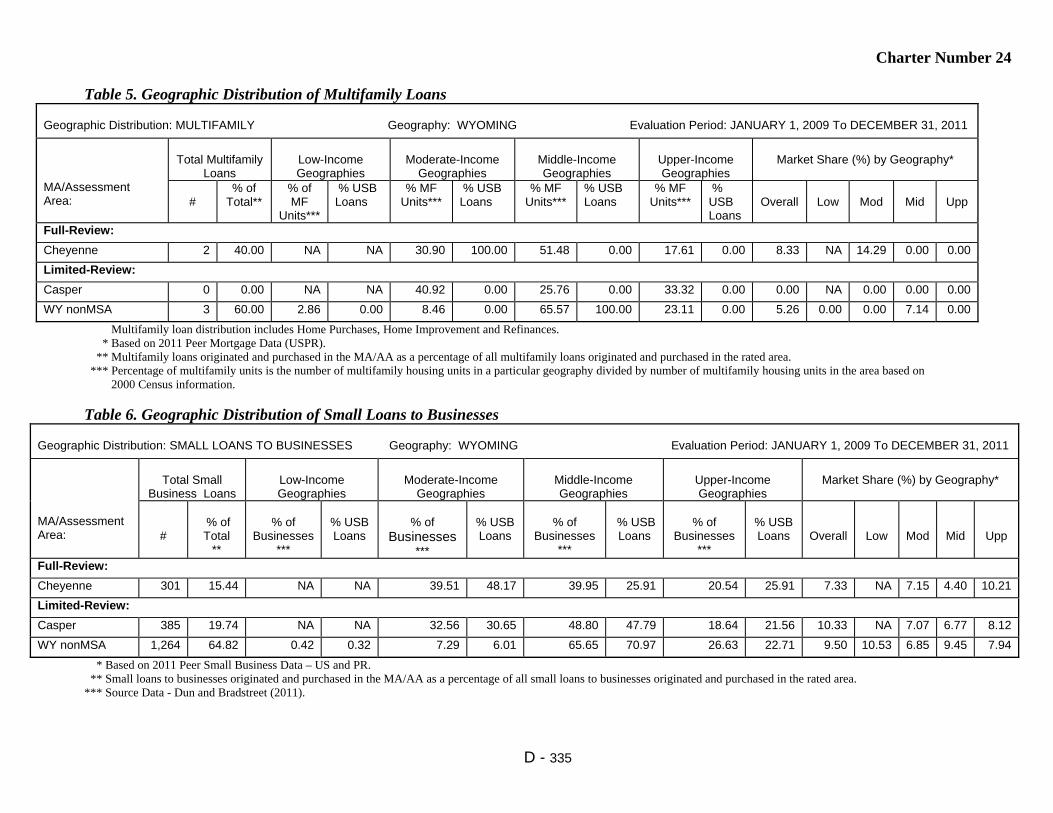
Charter Number 24
D - 335
Table 5. Geographic Distribution of Multifamily Loans
Geographic Distribution: MULTIFAMILY Geography: WYOMING Evaluation Period: JANUARY 1, 2009 To DECEMBER 31, 2011
MA/Assessment Area:
Total Multifamily
Loans
Low-Income Geographies
Moderate-Income
Geographies
Middle-Income Geographies
Upper-Income Geographies
Market Share (%) by Geography*
#
% of Total**
% of MF
Units***
% USB Loans
% MF Units***
% USB Loans
% MF Units***
% USB Loans
% MF Units***
% USB Loans
Overall
Low
Mod
Mid
Upp
Full-Review:
Cheyenne 2 40.00 NA NA 30.90 100.00 51.48 0.00 17.61 0.00 8.33 NA 14.29 0.00 0.00
Limited-Review:
Casper 0 0.00 NA NA 40.92 0.00 25.76 0.00 33.32 0.00 0.00 NA 0.00 0.00 0.00
WY nonMSA 3 60.00 2.86 0.00 8.46 0.00 65.57 100.00 23.11 0.00 5.26 0.00 0.00 7.14 0.00
Multifamily loan distribution includes Home Purchases, Home Improvement and Refinances. * Based on 2011 Peer Mortgage Data (USPR). ** Multifamily loans originated and purchased in the MA/AA as a percentage of all multifamily loans originated and purchased in the rated area. *** Percentage of multifamily units is the number of multifamily housing units in a particular geography divided by number of multifamily housing units in the area based on 2000 Census information.
Table 6. Geographic Distribution of Small Loans to Businesses Geographic Distribution: SMALL LOANS TO BUSINESSES Geography: WYOMING Evaluation Period: JANUARY 1, 2009 To DECEMBER 31, 2011
MA/Assessment Area:
Total Small
Business Loans
Low-Income Geographies
Moderate-Income
Geographies
Middle-Income Geographies
Upper-Income Geographies
Market Share (%) by Geography*
#
% of Total
**
% of
Businesses ***
% USB Loans
% of
Businesses ***
% USB Loans
% of
Businesses ***
% USB Loans
% of
Businesses ***
% USB Loans
Overall
Low
Mod
Mid
Upp
Full-Review:
Cheyenne 301 15.44 NA NA 39.51 48.17 39.95 25.91 20.54 25.91 7.33 NA 7.15 4.40 10.21
Limited-Review:
Casper 385 19.74 NA NA 32.56 30.65 48.80 47.79 18.64 21.56 10.33 NA 7.07 6.77 8.12
WY nonMSA 1,264 64.82 0.42 0.32 7.29 6.01 65.65 70.97 26.63 22.71 9.50 10.53 6.85 9.45 7.94
* Based on 2011 Peer Small Business Data – US and PR. ** Small loans to businesses originated and purchased in the MA/AA as a percentage of all small loans to businesses originated and purchased in the rated area. *** Source Data - Dun and Bradstreet (2011).
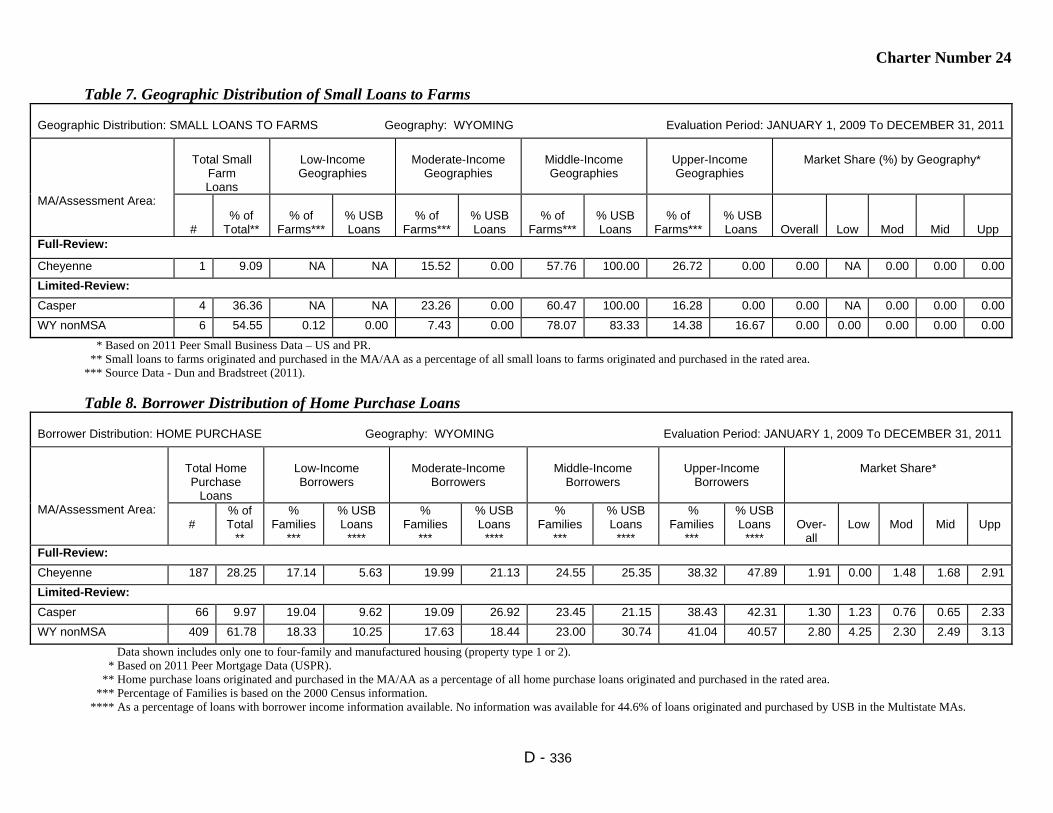
Charter Number 24
D - 336
Table 7. Geographic Distribution of Small Loans to Farms
Geographic Distribution: SMALL LOANS TO FARMS Geography: WYOMING Evaluation Period: JANUARY 1, 2009 To DECEMBER 31, 2011
MA/Assessment Area:
Total Small
Farm Loans
Low-Income Geographies
Moderate-Income
Geographies
Middle-Income Geographies
Upper-Income Geographies
Market Share (%) by Geography*
#
% of
Total**
% of
Farms***
% USB Loans
% of
Farms***
% USB Loans
% of
Farms***
% USB Loans
% of
Farms***
% USB Loans
Overall
Low
Mod
Mid
Upp
Full-Review:
Cheyenne 1 9.09 NA NA 15.52 0.00 57.76 100.00 26.72 0.00 0.00 NA 0.00 0.00 0.00
Limited-Review:
Casper 4 36.36 NA NA 23.26 0.00 60.47 100.00 16.28 0.00 0.00 NA 0.00 0.00 0.00
WY nonMSA 6 54.55 0.12 0.00 7.43 0.00 78.07 83.33 14.38 16.67 0.00 0.00 0.00 0.00 0.00
* Based on 2011 Peer Small Business Data – US and PR. ** Small loans to farms originated and purchased in the MA/AA as a percentage of all small loans to farms originated and purchased in the rated area. *** Source Data - Dun and Bradstreet (2011).
Table 8. Borrower Distribution of Home Purchase Loans Borrower Distribution: HOME PURCHASE Geography: WYOMING Evaluation Period: JANUARY 1, 2009 To DECEMBER 31, 2011
MA/Assessment Area:
Total Home Purchase
Loans
Low-Income Borrowers
Moderate-Income
Borrowers
Middle-Income
Borrowers
Upper-Income
Borrowers
Market Share*
#
% of Total
**
% Families
***
% USB Loans
****
% Families
***
% USB Loans
****
% Families
***
% USB Loans
****
% Families
***
% USB Loans
****
Over-
all
Low
Mod
Mid
Upp
Full-Review:
Cheyenne 187 28.25 17.14 5.63 19.99 21.13 24.55 25.35 38.32 47.89 1.91 0.00 1.48 1.68 2.91
Limited-Review:
Casper 66 9.97 19.04 9.62 19.09 26.92 23.45 21.15 38.43 42.31 1.30 1.23 0.76 0.65 2.33
WY nonMSA 409 61.78 18.33 10.25 17.63 18.44 23.00 30.74 41.04 40.57 2.80 4.25 2.30 2.49 3.13
Data shown includes only one to four-family and manufactured housing (property type 1 or 2). * Based on 2011 Peer Mortgage Data (USPR). ** Home purchase loans originated and purchased in the MA/AA as a percentage of all home purchase loans originated and purchased in the rated area. *** Percentage of Families is based on the 2000 Census information. **** As a percentage of loans with borrower income information available. No information was available for 44.6% of loans originated and purchased by USB in the Multistate MAs.

Charter Number 24
D - 337
Table 9. Borrower Distribution of Home Improvement Loans
Borrower Distribution: HOME IMPROVEMENT Geography: WYOMING Evaluation Period: JANUARY 1, 2009 To DECEMBER 31, 2011
MA/Assessment Area:
Total Home Improvement
Loans
Low-Income Borrowers
Moderate-Income
Borrowers
Middle-Income
Borrowers
Upper-Income
Borrowers
Market Share*
% of Total
**
% Famili
es ***
% USB Loans
****
% Families
***
% USB Loans
****
% Families
***
% USB Loans
****
% Families
***
% USB Loans
****
USB Loans
****
Over-
all
Low
Mod
Mid
Upp
Full-Review:
Cheyenne 11 10.00 17.14 9.09 19.99 9.09 24.55 27.27 38.32 54.55 2.34 0.00 0.00 2.17 3.57
Limited-Review:
Casper 14 12.73 19.04 7.14 19.09 28.57 23.45 35.71 38.43 28.57 5.97 12.50 10.71 5.88 3.13
WY nonMSA 85 77.27 18.33 9.76 17.63 20.73 23.00 30.49 41.04 39.02 6.93 6.90 6.76 7.38 6.70
Data shown includes only one to four-family and manufactured housing (property type of 1 or 2). * Based on 2011 Peer Mortgage Data (USPR). ** Home improvement loans originated and purchased in the MA/AA as a percentage of all home improvement loans originated and purchased in the rated area. *** Percentage of Families is based on the 2000 Census information. **** As a percentage of loans with borrower income information available. No information was available for 2.7% of loans originated and purchased by the bank.
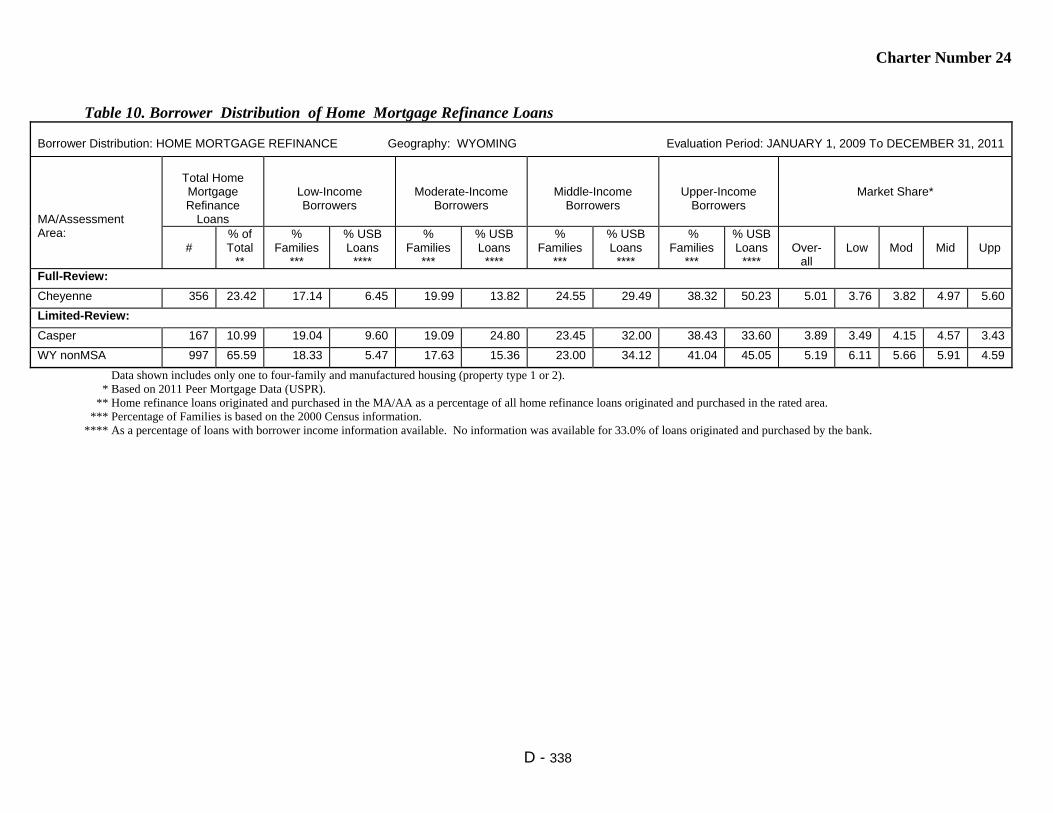
Charter Number 24
D - 338
Table 10. Borrower Distribution of Home Mortgage Refinance Loans
Borrower Distribution: HOME MORTGAGE REFINANCE Geography: WYOMING Evaluation Period: JANUARY 1, 2009 To DECEMBER 31, 2011
MA/Assessment Area:
Total Home Mortgage Refinance
Loans
Low-Income Borrowers
Moderate-Income Borrowers
Middle-Income Borrowers
Upper-Income Borrowers
Market Share*
#
% of Total
**
% Families
***
% USB Loans
****
% Families
***
% USB Loans
****
% Families
***
% USB Loans
****
% Families
***
% USB Loans
****
Over-
all
Low
Mod
Mid
Upp
Full-Review:
Cheyenne 356 23.42 17.14 6.45 19.99 13.82 24.55 29.49 38.32 50.23 5.01 3.76 3.82 4.97 5.60
Limited-Review:
Casper 167 10.99 19.04 9.60 19.09 24.80 23.45 32.00 38.43 33.60 3.89 3.49 4.15 4.57 3.43
WY nonMSA 997 65.59 18.33 5.47 17.63 15.36 23.00 34.12 41.04 45.05 5.19 6.11 5.66 5.91 4.59
Data shown includes only one to four-family and manufactured housing (property type 1 or 2). * Based on 2011 Peer Mortgage Data (USPR). ** Home refinance loans originated and purchased in the MA/AA as a percentage of all home refinance loans originated and purchased in the rated area. *** Percentage of Families is based on the 2000 Census information. **** As a percentage of loans with borrower income information available. No information was available for 33.0% of loans originated and purchased by the bank.
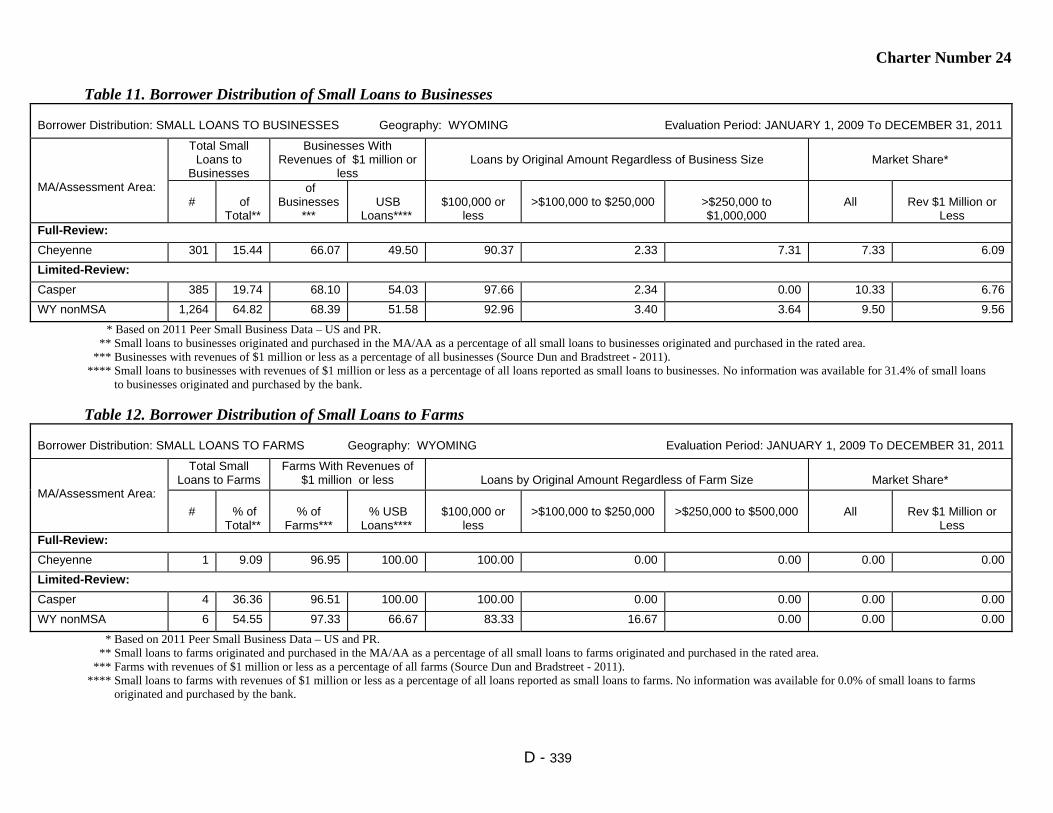
Charter Number 24
D - 339
Table 11. Borrower Distribution of Small Loans to Businesses
Borrower Distribution: SMALL LOANS TO BUSINESSES Geography: WYOMING Evaluation Period: JANUARY 1, 2009 To DECEMBER 31, 2011
MA/Assessment Area:
Total Small Loans to
Businesses
Businesses With Revenues of $1 million or
less
Loans by Original Amount Regardless of Business Size
Market Share*
#
of
Total**
of Businesses
***
USB
Loans****
$100,000 or
less
>$100,000 to $250,000
>$250,000 to $1,000,000
All
Rev $1 Million or
Less Full-Review:
Cheyenne 301 15.44 66.07 49.50 90.37 2.33 7.31 7.33 6.09
Limited-Review:
Casper 385 19.74 68.10 54.03 97.66 2.34 0.00 10.33 6.76
WY nonMSA 1,264 64.82 68.39 51.58 92.96 3.40 3.64 9.50 9.56
* Based on 2011 Peer Small Business Data – US and PR. ** Small loans to businesses originated and purchased in the MA/AA as a percentage of all small loans to businesses originated and purchased in the rated area. *** Businesses with revenues of $1 million or less as a percentage of all businesses (Source Dun and Bradstreet - 2011). **** Small loans to businesses with revenues of $1 million or less as a percentage of all loans reported as small loans to businesses. No information was available for 31.4% of small loans to businesses originated and purchased by the bank.
Table 12. Borrower Distribution of Small Loans to Farms Borrower Distribution: SMALL LOANS TO FARMS Geography: WYOMING Evaluation Period: JANUARY 1, 2009 To DECEMBER 31, 2011
MA/Assessment Area:
Total Small Loans to Farms
Farms With Revenues of $1 million or less
Loans by Original Amount Regardless of Farm Size
Market Share*
#
% of
Total**
% of
Farms***
% USB
Loans****
$100,000 or
less
>$100,000 to $250,000
>$250,000 to $500,000
All
Rev $1 Million or
Less Full-Review:
Cheyenne 1 9.09 96.95 100.00 100.00 0.00 0.00 0.00 0.00
Limited-Review:
Casper 4 36.36 96.51 100.00 100.00 0.00 0.00 0.00 0.00
WY nonMSA 6 54.55 97.33 66.67 83.33 16.67 0.00 0.00 0.00
* Based on 2011 Peer Small Business Data – US and PR. ** Small loans to farms originated and purchased in the MA/AA as a percentage of all small loans to farms originated and purchased in the rated area. *** Farms with revenues of $1 million or less as a percentage of all farms (Source Dun and Bradstreet - 2011). **** Small loans to farms with revenues of $1 million or less as a percentage of all loans reported as small loans to farms. No information was available for 0.0% of small loans to farms originated and purchased by the bank.

Charter Number 24
D - 340
Table 14. Qualified Investments
QUALIFIED INVESTMENTS Geography: WYOMING Evaluation Period: JANUARY 1, 2009 To MARCH 31, 2012
MA/Assessment Area:
Prior Period Investments* Current Period Investments** Total Investments Unfunded Commitments***
# $(000’s) # $(000’s) # $(000’s) % of Total # $(000’s) Full-Review:
Cheyenne 5 2,020 22 1,822 27 3,841 60.01 0 0
Limited-Review:
Casper 3 104 4 262 7 367 5.73 0 0
WY nonMSA 14 392 28 1,790 42 2,182 34.09 0 0
WY Statewide 0 0 3 11 3 11 0.18 0 0
* 'Prior Period Investments' means investments made in a previous evaluation period that are outstanding as of the examination date. ** The evaluation period for current period investments is January 1, 2009 to March 31, 2012. *** 'Unfunded Commitments' means legally binding investment commitments that are tracked and recorded by the institution's financial reporting system.
Table 15. Distribution of Branch Delivery System and Branch Openings/Closings DISTRIBUTION OF BRANCH DELIVERY SYSTEM/BRANCH OPENINGS/CLOSINGS Geography: WYOMING Evaluation Period: JANUARY 1, 2009 To DECEMBER 31, 2011
MA/Assessment Area:
Deposits Branches Branch Openings/Closings Population
of Rated
Area Deposits in
AA
# of USB Branches
% of Rated
Area Branches in
AA
Location of Branches by
Income of Geographies (%)
# of Branch
Openings
# of Branch
Closings
Net change in Location of Branches (+ or - )
% of Population within Each
Geography
Low
Mod
Mid
Upp
Low
Mod
Mid
Upp
Low
Mod
Mid
Upp
Full-Review:
Cheyenne 29.89 2 13.33 NA 50.00 50.00 0.00 0 0 NA 0 0 0 NA 30.33 48.51 21.16
Limited-Review:
Casper 11.93 1 6.67 NA 100.00 0.00 0.00 0 0 NA 0 0 0 NA 20.30 56.97 22.73
WY nonMSA 58.17 12 80.00 0.00 16.67 75.00 8.33 0 0 0 0 0 0 1.34 9.45 67.55 21.67