Embed Size (px)
Citation preview

COMMUNITY PROFILE AUGUST 2012
Identifying communities of interest for the Bunbury Resilient Communities Project
“U-4-72”

Contents 1. Overview ............................................................................................................................ 1
1.1 Purpose of this Community Profile ............................................................................... 1 1.2 Goal and purpose of the U-4-72 Project ...................................................................... 1
1.2.1 Goal .................................................................................................................... 1 1.2.2 Expected outcomes ............................................................................................ 1 1.2.3 Purpose .............................................................................................................. 2 1.2.4 Key Performance Indicators ............................................................................... 2
2. About Bunbury .................................................................................................................. 3 2.1 Location ........................................................................................................................ 3 2.2 Population .................................................................................................................... 3 2.3 Employment ................................................................................................................. 3 2.4 Bunbury’s natural disaster history ................................................................................ 4
3. From data to knowledge ................................................................................................... 5 3.1 What the 2011 Census data tells us ............................................................................ 5
3.1.1 People – demographics and education .............................................................. 5 3.1.2 People – cultural and language diversity ............................................................ 7 3.1.3 People - employment .......................................................................................... 9 3.1.4 Families – family composition ........................................................................... 11 3.1.5 Dwellings – dwelling structure .......................................................................... 12 3.1.6 Dwellings – mortgage and rent ......................................................................... 13 3.1.7 Dwellings – number of motor vehicles .............................................................. 15 3.1.8 Core activity need for assistance ...................................................................... 16 3.1.9 Internet connection ........................................................................................... 17
4. Communities of interest ................................................................................................. 18 4.1 Communities of interest to consider for immediate selection to the U-4-72 Project ... 18
4.1.1 Bunbury’s church/faith-based communities ...................................................... 18 4.1.2 Bunbury’s volunteer communities ..................................................................... 19 4.1.3 Withers and Carey Park local areas ................................................................. 19
4.2 Communities of interest that require further investigation .......................................... 19 4.2.1 Bunbury’s Aboriginal residents ......................................................................... 19 4.2.2 Bunbury’s Italian community ............................................................................. 20 4.2.3 People in Bunbury who need assistance with core activities ............................ 20 4.2.4 Single-parent and FIFO Families ...................................................................... 20

Bunbury Community Profile August 2012 1
1. Overview
1.1 Purpose of this Community Profile This Community Profile has been developed specifically to assist the Resilient Communities Project Governance Group to select communities of interest for the Resilient Communities Project in Bunbury, otherwise known as the U-4-72 Project. A ‘community of interest’ is a population of people who are either particularly vulnerable to the adverse impacts of disasters, or who could become effective champions for EM preparedness within their own communities. The Project Governance Group must set preparedness goals for each community of interest, which will, in turn, guide the Group in designing the right engagement methods for each community of interest.
1.2 Goal and purpose of the U-4-72 Project
1.2.1 Goal To build understanding of and self-responsibility for emergency management within Bunbury’s population so that people in our diverse communities can confidently participate in emergency management planning and decision-making processes, reducing the risk of an unprepared population with low resilience to disasters.
1.2.2 Expected outcomes The ultimate difference that the U-4-72 Project is intended to make is:
§ The building of levels of self-responsibility and resilience of the people in Bunbury so that they are able to rely on their own resources and networks for up to 72 hours (i.e. three days) after a major disaster.
Through U-4-72, communities of interest will:
§ demonstrate increased ownership of and responsibility for their risks and a greater level of control over their own vulnerabilities;
§ feel safer and more empowered to act for themselves and in partnership with their EM agencies; and,
§ identify with their localities and with each other more, experiencing a greater sense of community and being more reliant on themselves and on each other, and less reliant on emergency management services.

Bunbury Community Profile August 2012 2
1.2.3 Purpose To design and implement a cyclical community culture change program, using the Participatory Action Research process (PAR), that gradually reaches specific communities of interest in Bunbury, informs and educates them about emergency management and successfully encourages them to take steps to be prepared.
1.2.4 Key Performance Indicators § Targeted engagement of communities of interest will be effective in significantly
changing EM cultural capital (attitudes, values, aspirations, sense of self-efficacy) and behavioural intentions in regard to community preparedness by the end of two-year project, as measured by the repeated U-4-72 Readiness Survey.
§ Developments will be demonstrated in each of the four culture change drivers (engage, enable, encourage, exemplify) by the end of the two-year project, as evidenced in the project scope management records.
§ Targeted engagement of communities of interest will be effective in achieving a measurable level of behavioural change by the end of the two-year project, as evidenced by the repeated U-4-72 Readiness Survey.

Bunbury Community Profile August 2012 3
2. About Bunbury
2.1 Location Bunbury is a port city located in Western Australia 187km south of Perth metropolitan area. The City of Bunbury covers an area of 65.7 square kilometres on a peninsular bounded on three sides by the Indian Ocean, Koombana Bay and Leschenault Inlet. The City of Bunbury is recognised as the economic, sports, arts and entertainment hub of the State's south-west. The Central Business District hosts the south-west's major private and public company offices and a thriving cafe strip and shopping centres. Bunbury's deep-water port moves more than 12 million tonnes of cargo each year with alumina and wood chips making up the bulk of the exports. Mining extraction, processing and manufacturing are the largest contributors to the economy injecting approximately $1.85 billion per annum into the area.1
2.2 Population The City of Bunbury’s current population is 31,348 within its local government area (LGA) boundary, which is an area of only 65.7 square metres. Although Bunbury’s LGA area and population is small, as the business and administrative centre of the Bunbury Urban Area, Bunbury services a much greater area and population of approximately 60,000. On any given business day, over 65% of the people in Bunbury will be residents from other Shires, especially Dardanup, Capel and Harvey. In fact, the populations of Dardanup, Capel and Harvey are growing at such a high rate that the Bunbury Urban Area is recognised as one of the fastest growing regions in the country.2
2.3 Employment The employment data from the 2011 Census were not available at the time of writing, so the following information has been drawn from the 2006 Census data for Bunbury. Bunbury’s full-time employment rate is approximately 60%, with a part-time employment rate of nearly 30%. In 2006, Bunbury’s unemployment rate was around 4%. However, the Small Area Labour Markets March 2012 Quarter Report3 shows Bunbury’s unemployment rate is now sitting around 5.7%, higher than the Western Australian rate of 4.2% and slightly higher than the Australian rate of 5.1%. The main occupations in which Bunbury’s people are employed are:
1 City of Bunbury (n.d.) Facts and Figures. Accessed online August 7th 2012 at http://www.bunbury.wa.gov.au/index.php 2 City of Bunbury (2007) Economic Development Strategy 2008-2012. 3 Department of Education, Employment and Workplace Relations (2012) Small Area Labour Markets March 2012 Quarter
Report. Commonwealth of Australia.

Bunbury Community Profile August 2012 4
§ Technicians and trades (at 19.5%);
§ Professionals (at 14.5%);
§ Labourers (at 14%);
§ Clerical and administration (at 12.8%);
§ Sales (at 10.1%);
§ Machinery Operation and Driving (at 9.6%);
§ Management (at 9.3%): and,
§ Community and Personal Service (at 8.4%).
2.4 Bunbury’s natural disaster history The Preston River has a history of flooding, with the 1964 event estimated to exceed a 1 in 100 year flood, which resulted in widespread flooding within the downstream Bunbury town site.
In 1978, Tropical Cyclone Alby passed close to the southwest corner of WA, killing five people and causing widespread but mostly minor damage to the southwest. The damage bill was estimated to be $39 million (2003 dollars). One man was blown from the roof of a shed and a woman was killed by a falling pine tree.
In 2005 a tornado with winds of more than 125 kilometres-an-hour swept through the south Bunbury area causing major damage and in some cases completing destroying buildings. In 2009, Bunbury was hit by a weak tornado, causing damage to homes, trees and local businesses.
And in 2012, Bunbury, along with the rest of the South West, Wheatbelt and Perth metropolitan areas, experienced three severe storms in rapid succession, one with winds equivalent to a category 2 cyclone, classified as a 1-in-10 year event. Over 160,000 homes were left without power, with 27,000 properties in the southwest experiencing power outages of more than 24 hours – some for up to two weeks.

Bunbury Community Profile August 2012 5
3. From data to knowledge
3.1 What the 2011 Census data tells us Our timing for the generation of this Community Profile is good. The Census 2011 data have only recently been released, so we have the advantage of being able to use very recent Census statistics. The statistics presented in each of the tables below are discussed in the present tense, as if the figures still hold as at August 2012, when this Profile was prepared.
3.1.1 People – demographics and education
Table 1: Total population
People Bunbury % Western Australia % Australia %
Male 15,595 49.7 1,126,178 50.3 10,634,013 49.4 Female 15,753 50.3 1,112,992 49.7 10,873,704 50.6 ATSI people 972 3.1 69,664 3.1 548,369 2.5 Total 31,348 -- 2,239,170 -- 21,507,717 -- There are 31,348 people in Bunbury. Of these, 49.7% are male and 50.3% are female. Aboriginal and Torres Strait Islander people make up 3.1% of the population, which is the same as the state percentage, but higher that the national percentage of Aboriginal and Torres Strait Islander people.
Implications for U-4-72: Our Aboriginal residents as a potential ‘community of interest’ It is worth noting that there are nearly one thousand Aboriginal people living in Bunbury. It is possible that these residents could represent a community of interest for U-4-72, although it is very important not to assume that our Aboriginal residents are a single homogeneous group that can be easily ‘accessed’, or that they would be particularly vulnerable to the adverse impacts of disasters, or wish to be champions for EM preparedness within their own communities. Further discussion with Aboriginal Elders and other Aboriginal community gatekeepers is required before any decision could be made.

Bunbury Community Profile August 2012 6
Table 2: Age
Age Bunbury % Western Australia % Australia %
People 0-4 years 1,917 6.1 151,262 6.8 1,421,050 6.6 5-9 years 1,794 5.7 142,774 6.4 1,351,921 6.3 10-14 years 1,791 5.7 146,035 6.5 1,371,054 6.4 15-19 years 2,063 6.6 148,208 6.6 1,405,798 6.5 20-24 years 2,181 7.0 159,010 7.1 1,460,673 6.8 25-29 years 2,211 7.1 167,944 7.5 1,513,236 7.0 30-34 years 2,110 6.7 156,152 7.0 1,453,775 6.8 35-39 years 1,981 6.3 161,526 7.2 1,520,138 7.1 40-44 years 2,162 6.9 166,731 7.4 1,542,879 7.2 45-49 years 2,146 6.8 159,859 7.1 1,504,142 7.0 50-54 years 2,276 7.3 150,369 6.7 1,447,404 6.7 55-59 years 2,024 6.5 133,894 6.0 1,297,244 6.0 60-64 years 1,893 6.0 120,531 5.4 1,206,116 5.6 65-69 years 1,384 4.4 86,324 3.9 919,319 4.3 70-74 years 1,076 3.4 66,219 3.0 708,090 3.3 75-79 years 880 2.8 49,832 2.2 545,263 2.5 80-84 years 781 2.5 38,284 1.7 436,936 2.0 85 years and over 677 2.2 34,217 1.5 402,681 1.9
Median age 39 -- 36 -- 37 -- The median age of people in Bunbury is 39 years. Children aged 0-14 years make up 17.6% of the population and people aged 65 years and over make up 15.3% of the population.
Implications for U-4-72 There is no particular implication in these data for the U-4-72 Project, but it is worth noting that school-aged children and youth make up approximately 18% of the population of Bunbury, and people of retirement age and over make up approximately 15% of the population.

Bunbury Community Profile August 2012 7
Table 3: Education by institution type
Education Bunbury % Western Australia % Australia %
Pre-school 449 5.3 32,429 4.8 332,844 5.1 Primary - Government 1,573 18.4 129,300 19.0 1,181,787 18.2 Primary - Catholic 453 5.3 33,580 4.9 359,062 5.5 Primary - Other Non Government 229 2.7 25,745 3.8 214,359 3.3 Secondary - Government 955 11.2 64,075 9.4 774,074 11.9 Secondary - Catholic 259 3.0 29,741 4.4 307,142 4.7 Secondary - Other Non Government 222 2.6 29,867 4.4 254,828 3.9 Technical or further education institution 717 8.4 48,758 7.2 473,606 7.3 University or tertiary institution 562 6.6 91,938 13.5 932,524 14.3 Other 175 2.0 13,527 2.0 161,660 2.5 Not Stated 2,945 34.5 180,865 26.6 1,511,694 23.2 Total 8,539 -- 679,825 -- 6,503,580 -- In Bunbury 27.2% of people attend an educational institution. Of these, 26.4% are in primary school, 16.8% in secondary school and 15.0% in a tertiary or technical institution.
Implications for U-4-72: targeting education institutions Far fewer people attend a university or tertiary institution in Bunbury than both the state and the nation (6.6% as compared with 13.5% and 14.3% for state and nation respectively). This may have implications for the targeting of U-4-72.
3.1.2 People – cultural and language diversity
Table 4: Country of birth
Country of birth Bunbury % Western Australia % Australia %
Australia 22,800 72.7 1,407,806 62.9 15,017,847 69.8 Other top responses England 1,782 5.7 191,934 8.6 911,593 4.2 New Zealand 961 3.1 70,736 3.2 483,398 2.2 South Africa 338 1.1 35,328 1.6 145,683 0.7 Philippines 331 1.1 17,231 0.8 171,234 0.8 Italy 296 0.9 19,477 0.9 185,402 0.9 72.7% of people in Bunbury were born in Australia. The most common countries of birth are England 5.7%, New Zealand 3.1%, South Africa 1.1%, Philippines 1.1% and Italy 0.9%.

Bunbury Community Profile August 2012 8
Table 5: Language (other than English)
Language (other than English) Bunbury % Western Australia % Australia %
Italian 465 1.5 31,447 1.4 299,834 1.4 Tagalog 148 0.5 8,287 0.4 81,457 0.4 Filipino 136 0.4 5,681 0.3 55,400 0.3 Afrikaans 103 0.3 10,929 0.5 35,031 0.2 Mandarin 94 0.3 28,033 1.3 336,410 1.6 English only spoken at home 26,775 85.4 1,775,950 79.3 16,509,291 76.8 Households where two or more languages are spoken 1,227 10 137,091 17.3 1,579,946 20.4
85.4% of people in Bunbury only speak English at home. Other languages spoken at home include Italian 1.5%, Tagalog 0.5%, Filipino 0.4%, Afrikaans 0.3% and Mandarin 0.3%.
Implications for U-4-72: CALD unlikely to be a major factor – but engaging the Italian Club may be a good idea It is unlikely that cultural and language diversity (CALD) will play a major factor in determining “communities of interest” for the U-4-72 Project, as the number of people in Bunbury who were born in non-English speaking countries overseas is quite low. However, a closer look at the Census data reveals that, of people who speak more than one language at home in Bunbury, 319 speak English “not well or not at all”. Interestingly, the vast majority of these people arrived in Australia prior to 1995 (nearly 20 years ago), and the largest single language group in this category for both males and females is Italian (with 56 Italian persons speaking English “not well or not at all”). For this reason, it may be wise to engage our Italian families (perhaps through the South West Italian Club) as a “community of interest”. It is certainly worth investigating whether these “non-English speakers” are family elders (e.g. matriarchs, patriarchs) and therefore influential within the family networks.
Table 6: Religious affiliation
Religious affiliation Bunbury % Western Australia % Australia %
No Religion 8,185 26.1 571,948 25.5 4,796,787 22.3 Catholic 7,228 23.1 529,118 23.6 5,439,268 25.3 Anglican 6,814 21.7 421,093 18.8 3,679,907 17.1 Uniting Church 1,158 3.7 74,368 3.3 1,065,795 5 Christian, nfd 887 2.8 62,821 2.8 470,942 2.2 26.1% of people in Bunbury state that they have no religion, 23.1% are Catholic, 21.7% are Anglican, 3.7% and are Uniting Church.

Bunbury Community Profile August 2012 9
Implications for U-4-72: church groups as “communities of interest” Although these data do not indicate how regularly people attend church services in Bunbury, it could be assumed that Bunbury’s rates of church attendance are similar to those across Australia, which are reported by the National Church Life Survey as approximately 9% of the population per week, or 19% per month4. This may mean that, in any given week, over 2800 people in Bunbury may attend church - or nearly 6000 in any given month. The U-4-72 project stakeholders could consider selecting faith-based communities as a “community of interest”.
3.1.3 People - employment
Table 7: Median weekly incomes
Median weekly incomes Bunbury % Western Australia % Australia %
People aged 15 years and over Personal 582 -- 662 -- 577 -- Family 1,445 -- 1,722 -- 1,481 -- Household 1,139 -- 1,415 -- 1,234 -- The median weekly personal, family and household median weekly incomes for people aged 15 years and over in Bunbury are all lower than the median state incomes.
Implications for U-4-72: Bunbury families may have financial restrictions Families in Bunbury have nearly $300 less per week coming into their homes than the median across the rest of the state. Bunbury’s SEIFA Index of Relative Socio-economic Disadvantage (IRSD) is 982, with a decile score of 4, indicating that it is only slightly more disadvantaged relative to the mean of 1000. However, when one looks at the range of SEIFA scores within the suburbs of Bunbury, and then the range of SEIFA scores within the Collection Districts (approximately 225 dwellings) the picture is more telling. Bunbury’s SEIFA IRSD scores for suburbs, including lowest CD scores in each suburb, are presented in table 8 below.
4 National Church Life Survey: accessed online on August 6th 2012 at http://www.ncls.org.au/default.aspx?sitemapid=131

Bunbury Community Profile August 2012 10
Table 8: 2011 SEIFA IRSD scores by suburb with lowest CD for area
SEIFA IRSD SCORE SEIFA IRSD SCORE Whole
suburb Lowest for
CD Whole suburb
Lowest for CD
Bunbury 1036 915 Pelican Point 1104 1104
Carey Park 915 821 South Bunbury 1014 930
College Grove 1062 1062 Usher 953 934
East Bunbury 987 964 Withers 862 724
Glen Iris 1017 974
Our lowest SEIFA IRSD scores for suburb and collection district are in Withers (862 and 724 respectively), with one CD in Carey Park recording 821. These scores are particularly low for suburbs in a major regional centre. When reviewing non-metropolitan SEIFA IRSD scores, one can see that scores in the 800s and lower are more likely to be recorded in remote areas (e.g Coolgardie: suburb 871/lowest CD 856, Karratha: 846/846, Kookynie: 753/753, Meckering: 897/897, Meekathara: 813/793, Menzies: 779/779, and Norseman: 894/848).
Table 9: Unpaid work
Unpaid work Bunbury % Western Australia % Australia %
People aged 15 years and over Did unpaid domestic work (last week) 17,501 67.7 1,255,935 69.8 12,149,347 70.0 Cared for child/children (last two weeks) 6,600 25.5 507,968 28.2 4,827,808 27.8 Provided unpaid assistance to a person with a disability (last two weeks) 2,505 9.7 168,014 9.3 1,896,957 10.9
Did voluntary work through an organisation or group (last 12 months) 4,275 16.5 304,623 16.9 3,090,874 17.8
Of people aged 15 years and over, 67.7% did unpaid domestic work in the week before the Census. During the two weeks before the Census, 25.5% provided care for children and 9.7% assisted family members or others due to a disability, long-term illness or problems related to old age. In the year before the Census, 16.5% of people did voluntary work through an organisation or a group.
Implications for U-4-72: volunteers as a “community of interest” Although Bunbury’s unpaid work rates are not very different to the rest of the state, we still have a good proportion of our population engaged in voluntary work through an organisation or group (4,275 people – 16.5% of our population). Volunteerism is, in itself, ‘cultural capital’ within a community: volunteering enhances the sense of community, and a strong sense of community is an indicator of further volunteering. Volunteers tend to be highly empathetic, have a high sense of self-efficacy, an inner locus of control, a strong sense of morality and a
Bunbury Community Profile August 2012 11
positive self-image.5 As such, our Bunbury volunteer community should be regarded as a potential community of interest for the U-4-72 Project.
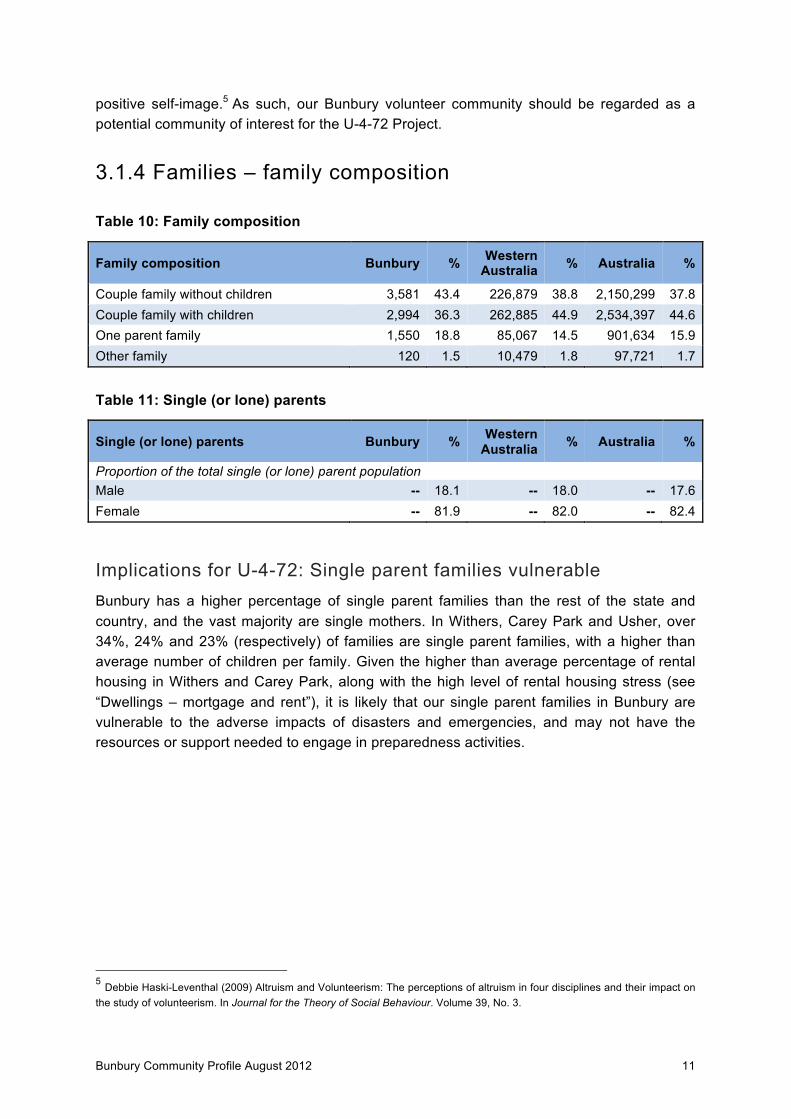
3.1.4 Families – family composition
Table 10: Family composition
Family composition Bunbury % Western Australia % Australia %
Couple family without children 3,581 43.4 226,879 38.8 2,150,299 37.8 Couple family with children 2,994 36.3 262,885 44.9 2,534,397 44.6 One parent family 1,550 18.8 85,067 14.5 901,634 15.9 Other family 120 1.5 10,479 1.8 97,721 1.7
Table 11: Single (or lone) parents
Single (or lone) parents Bunbury % Western Australia % Australia %
Proportion of the total single (or lone) parent population Male -- 18.1 -- 18.0 -- 17.6 Female -- 81.9 -- 82.0 -- 82.4
Implications for U-4-72: Single parent families vulnerable Bunbury has a higher percentage of single parent families than the rest of the state and country, and the vast majority are single mothers. In Withers, Carey Park and Usher, over 34%, 24% and 23% (respectively) of families are single parent families, with a higher than average number of children per family. Given the higher than average percentage of rental housing in Withers and Carey Park, along with the high level of rental housing stress (see “Dwellings – mortgage and rent”), it is likely that our single parent families in Bunbury are vulnerable to the adverse impacts of disasters and emergencies, and may not have the resources or support needed to engage in preparedness activities.
5 Debbie Haski-Leventhal (2009) Altruism and Volunteerism: The perceptions of altruism in four disciplines and their impact on the study of volunteerism. In Journal for the Theory of Social Behaviour. Volume 39, No. 3.

Bunbury Community Profile August 2012 12
3.1.5 Dwellings – dwelling structure
Table 12: Dwelling type
Dwelling type Bunbury % Western Australia % Australia %
Occupied private dwellings 12,330 88.2 794,159 87.9 7,760,322 89.3 Unoccupied private dwellings 1,651 11.8 109,328 12.1 934,471 10.7 88.2% of private dwellings are occupied and 11.8% are unoccupied.
Implication for U-4-72: over 1 in 10 dwellings unoccupied Although Bunbury’s percentage of unoccupied dwellings isn’t greatly different to the rest of the state, more than 1 in every 10 dwellings in Bunbury is unoccupied. This may have ramifications for the U-4-72 Project. Further investigation is needed to determine whether there is a concentration of unoccupied dwellings in certain areas, especially in those areas for prone to flood, storm surge and bushfire.
Table 13: Dwelling structure
Dwelling structure Bunbury % Western Australia % Australia %
Occupied private dwellings Separate house 9,545 77.4 638,768 80.4 5,864,573 75.6 Semi-detached, row or terrace house, townhouse etc. 1,815 14.7 84,333 10.6 765,978 9.9
Flat, unit or apartment 822 6.7 62,990 7.9 1,056,236 13.6 Other dwelling 142 1.2 7,380 0.9 66,666 0.9 Of occupied private dwellings in Bunbury, 77.4% are separate houses, 14.7% are semi-detached, row or terrace houses, or townhouses, 6.7% are flats, units or apartments and 1.2% are other dwellings.
Implications for U-4-72: Is one type of housing more at risk? Bunbury has a higher percentage of semi-detached housing than the rest of the state and country. Whether this type of housing is more or less vulnerable to damage from flood, storms or bushfire is not clear at this stage, but further investigation is warranted.

Bunbury Community Profile August 2012 13
Table 14: Tenure
Tenure Bunbury % Western Australia % Australia %
Occupied private dwellings Owned outright 3,444 27.9 234,627 29.5 2,488,149 32.1 Owned with a mortgage 3,876 31.4 300,334 37.8 2,709,433 34.9 Rented 4,496 36.5 231,824 29.2 2,297,458 29.6 Other tenure type 155 1.3 8,880 1.1 70,070 0.9 Tenure type not stated 357 2.9 18,493 2.3 195,213 2.5 Bunbury has a higher percentage of rented dwellings than the rest of the state. Please refer to the discussion in “Dwellings – mortgage and rent” below for the possible implications to the U-4-72 Project.
3.1.6 Dwellings – mortgage and rent
Table 15: Mortgage monthly repayments
Mortgage monthly repayments Bunbury % Western Australia % Australia %
Median mortgage repayments 1,647 -- 1,950 -- 1,800 --
Households where mortgage payments are less than 30% of household income -- 92.2 -- 89.8 -- 90.1
Households where mortgage payments are 30%, or greater, of household income -- 7.8 -- 10.2 -- 9.9
The median monthly mortgage repayment in Bunbury is $1,647, which is lower than the state and national repayment. 7.8% of homeowner households are paying 30.0% or more of their income in mortgage repayments. However, this a significantly lower level than the 11.8% of rental households that pay more than 30% of their household income on rent (see tables below).
Table 16: Rent weekly payments
Rent weekly payments Bunbury % Western Australia % Australia %
Median rent 250 -- 300 -- 285 --
Households where rent payments are less than 30% of household income -- 88.2 -- 91.1 -- 89.6
Households where rent payments are 30%, or greater, of household income -- 11.8 -- 8.9 -- 10.4

Bunbury Community Profile August 2012 14
In Bunbury, the median weekly rent is $250, which is less than both the state and national median weekly rent. However, 11.8% of all households in Bunbury are paying 30% or more of their income in rent. When one takes a closer look at the suburbs of Withers and Carey Park, the rental burden and housing stress is even greater.
Table 17: Withers rent weekly payments
Rent weekly payments Withers % Western Australia % Australia %
Median rent 188 -- 300 -- 285 --
Households where rent payments are less than 30% of household income -- 82.8 -- 91.1 -- 89.6
Households where rent payments are 30%, or greater, of household income -- 17.2 -- 8.9 -- 10.4
In Withers, where 47.4% of private dwellings are rentals (593 out of 1,252), 17.2% of these households pay 30% or more of their income on rent (that’s over 100 households).
Table 18: Carey Park rent weekly payments
Rent weekly payments Carey Park % Western
Australia % Australia %
Median rent 245 -- 300 -- 285 --
Households where rent payments are less than 30% of household income -- 83.7 -- 91.1 -- 89.6
Households where rent payments are 30%, or greater, of household income -- 16.3 -- 8.9 -- 10.4
In Carey Park, where 45.3% of private dwellings are rentals (913 out 2014), 16.3% of these households pay 30% or more of their income on rent (that’s 149 households).
Implications for U-4-72: are our renters at risk and vulnerable? It may be likely that people renting in Bunbury have less disposable income to spend on emergency and disaster preparedness than people who pay a mortgage, due to their higher level of housing stress. This is an important factor when one considers that nearly 4,500 (or 36.5%) of occupied private dwellings in Bunbury are rental properties, which is higher than the state level of 29.2%. In Withers and Carey Park alone, nearly 150 households are paying more than 30% of their household incomes on rent (representing 10% of Bunbury’s population). The U-4-72 project stakeholders need to take this factor into consideration when planning initiatives to enable and encourage people to become more prepared. People paying rent in Bunbury may be more restricted in what they can do, not only because they must adhere to rental agreements and be dependent upon landlords to undertake structural improvements to their homes, but also because they may be more financially restricted due to their rental payments. It is highly possible that people renting in Bunbury may not have the capacity to undertake certain structural preparedness activities on their homes (e.g. securing

Bunbury Community Profile August 2012 15
roofs and windows) or personal preparedness activities (such as buying and storing the items required for emergency supplies). This is certainly an area of interest (and risk) for the U-4-72 project stakeholders.
3.1.7 Dwellings – number of motor vehicles
Table 19: Number of registered motor vehicles
Number of registered motor vehicles Bunbury % Western Australia % Australia %
None 935 7.6 48,447 6.1 665,851 8.6 1 motor vehicle 4,667 37.9 258,942 32.6 2,778,575 35.8 2 motor vehicles 4,393 35.6 305,676 38.5 2,802,468 36.1 3 or more vehicles 1,946 15.8 158,860 20.0 1,279,133 16.5 Number of motor vehicles not stated 389 3.2 22,234 2.8 234,292 3.0 In Bunbury, 37.9% of occupied private dwellings have one registered motor vehicles garaged or parked at their address. 35.6% have two registered motor vehicles and 15.8% have three or more registered motor vehicles.
Implications for U-4-72: over 900 dwellings have no car for evacuation
More interesting for the U-4-72 project is the number of dwellings with no motor vehicle. 935 dwellings in Bunbury have no motor vehicle at all, which is higher than the Western Australian average. In an evacuation event, the people who live in these dwellings would need assistance to evacuate, and would have much less capacity to take belongings with them than those who have one or more vehicles at their dwelling. In Withers, Carey Park and South Bunbury alone (three suburbs that share boundaries), 595 dwellings have no motor vehicle. See the tables below.
Table 20: Withers – number of registered motor vehicles
Number of registered motor vehicles Withers % Western Australia % Australia %
None 143 11.4 48,447 6.1 665,851 8.6 1 motor vehicle 526 42.0 258,942 32.6 2,778,575 35.8 2 motor vehicles 370 29.6 305,676 38.5 2,802,468 36.1 3 or more vehicles 151 12.1 158,860 20.0 1,279,133 16.5 Number of motor vehicles not stated 62 5.0 22,234 2.8 234,292 3.0 In Withers, 143 households (11.4%) have no motor vehicle.

Bunbury Community Profile August 2012 16
Table 21: Carey Park – number of registered motor vehicles
Number of registered motor vehicles Carey Park % Western
Australia % Australia %
None 210 10.4 48,447 6.1 665,851 8.6 1 motor vehicle 825 40.9 258,942 32.6 2,778,575 35.8 2 motor vehicles 631 31.3 305,676 38.5 2,802,468 36.1 3 or more vehicles 277 13.7 158,860 20.0 1,279,133 16.5 Number of motor vehicles not stated 72 3.6 22,234 2.8 234,292 3.0 In Carey Park, 210 households (10.4%) have no motor vehicle.
Table 22: South Bunbury
Number of registered motor vehicles South Bunbury % Western
Australia % Australia %
None 242 7.1 48,447 6.1 665,851 8.6 1 motor vehicle 1,264 37.2 258,942 32.6 2,778,575 35.8 2 motor vehicles 1,258 37.0 305,676 38.5 2,802,468 36.1 3 or more vehicles 535 15.8 158,860 20.0 1,279,133 16.5 Number of motor vehicles not stated 97 2.9 22,234 2.8 234,292 3.0 In South Bunbury 242 households (7.1%) have no motor vehicle. In Withers, Carey Park and South Bunbury, the average number of people per household is 2.2. So, effectively, if an emergency were to occur that required a mass evacuation of this area, there would be at least 1,309 people without their own motor vehicle transport to evacuate themselves and their belongings. Add this to the fact that Withers and Carey Park renters (of which there are a higher than average percentage compared to the rest of Bunbury) are experiencing significantly more household financial restrictions due to their rental payments, and we can see that communities in these two suburbs may be particularly vulnerable to the adverse impacts of emergencies and disasters.
3.1.8 Core activity need for assistance The 2011 Census measured the number of people in Bunbury with a profound or severe disability. People with a profound or severe disability are defined as those people needing help or assistance in one or more of the three core activity areas of self-care, mobility and communication, because of a disability, long term health condition (lasting six months or more) or old age.6 In Bunbury, we have 1,573 people who need assistance with core activities because of a profound or severe disability. 711 are male and 862 are female.
6 Australian Bureau of Statistics (2012) Definition of “core activity need for assistance”. Accessed online on August 6th at
http://www.abs.gov.au/ausstats/[email protected]/Lookup/2901.0Chapter702011

Bunbury Community Profile August 2012 17
Implication for U-4-72: Assistance required for preparedness and evacuation
Just over 5% of people in our population would need assistance with activities such as personal disaster preparedness and emergency evacuation. The majority of these people are in the 55 years and over age group, and the majority of those may be residential care, although we do not yet have the data to confirm this. Assuming that the majority of these people would be cared for by an agency in the event of an emergency is unwise, as the Census also shows that 2,503 in Bunbury people provided unpaid assistance to a person with a disability in the 12 months prior to the Census.
3.1.9 Internet connection Of 12,330 occupied private dwellings in Bunbury (representing 28,034 people), 9,252 or 75% have internet connection (of which 82% are Broadband connections). This is lower than the state average of 86%.
Implication for U-4-72: consider an internet-based communications strategy
Even though Bunbury’s home-based internet connection level is lower than the state level, at 75% internet connection, an internet-based communications strategy would still be an obvious choice for inclusion in the overall communications management plan.

Bunbury Community Profile August 2012 18
4. Communities of interest
4.1 Communities of interest to consider for immediate selection to the U-4-72 Project
The development of this Community Profile has revealed the following communities of interest to be considered for selection to the U-4-72 Project.
4.1.1 Bunbury’s church/faith-based communities Our church/faith-based communities should be considered for selection, particularly members of our Catholic and Anglican churches, as they have the highest numbers of residents affiliated. In any given week, it is possible that over 2800 people in Bunbury may attend church - or nearly 6000 in any given month. There’s another reason to give serious consideration to the selection of church/faith-based communities into U-4-72. The findings of extensive research in America by esteemed political scientist and pioneer of social capital research, Robert Putnam (famous for his book “Bowling Alone: the Collapse and Revival of American Community”) and David Campbell has recently been released in: “American Grace: How Religion Divides and Unites Us”. One of the most controversial, yet compelling findings is that religious people in America make better citizens and neighbours. As quoted and reported in the Sydney Morning Herald, Putnam and Campbell write: “On every measurable scale, religious Americans are more generous, more altruistic and more involved in civic life than their secular counterparts. They are more likely to give blood, money to a homeless person, financial aid to family or friends, a seat to a stranger and to spend time with someone who is ''a bit down''.”7 The picture in Australia is similar. In 2004, a report released by the Department of Families, Hosing, Community Services and Indigenous Affairs, found that people who practice a religion, attend religious services and hold a religious affiliation are more likely to “give” (both money and volunteer hours), and give more than those without a religion.8 Interestingly, Putnam and Campbell’s research reveals that it’s not the content of a person’s belief that is the causal factor, but rather their involvement in a religious community: in other words, the strength of their social network within that community. A nonbeliever who comes to church to support his or her partner, and is involved in the social network of the church,
7 Sydney Morning Herald, Accessed online on August 8th at http://www.smh.com.au/opinion/society-and-culture/gods-truth-
believers-are-nicer-20110908-1jzrl.htm 8 Department of Families, Housing, Community Services and Indigenous Affairs (2004) Giving Australia: Summary of Findings.
Commonwealth of Australia

Bunbury Community Profile August 2012 19
will rate as well on altruism, giving, volunteering etc. as any believer. And a devout believer who is not involved in a religious social network, will rate as poorly as any secular person. The message here is that religious people in Bunbury who are involved in the social networks of their church/faith-based communities could potentially be proactive and effective champions of U-4-72, especially within those communities.
4.1.2 Bunbury’s volunteer communities Nearly 4,300 people in Bunbury volunteer their services through various organisations. We know that volunteerism is in itself ‘cultural capital’ and that volunteers tend to have a strong sense of community. The U-4-7 Project could connect with Bunbury’s volunteer communities through organisations such as the Bunbury Volunteer Bushfire Brigades, Bunbury SES, Australian Red Cross and Volunteer South West. It would be interesting to learn whether volunteers are more likely than non-volunteers to ‘take up’ the disaster preparedness message, take action to prepare themselves and encourage others to do so.
4.1.3 Withers and Carey Park local areas Residents of the suburbs of Withers and Carey Park may be particularly vulnerable to the short and long term impacts of disasters and emergencies and may be less able to undertake preparatory activities to ensure they are ready for disasters and emergencies. Withers and Carey Park have the highest levels of socioeconomic disadvantage, the highest percentage of single parent families, the highest levels of housing rental, the highest levels of housing stress with the least disposable income (particularly for those who rent), the lowest levels of car ownership, and more than one in every ten dwellings unoccupied. It may be judicious to engage Withers and Carey Park residents as ‘local area communities of interest’. There are existing groups within these suburbs, such as Neighbourhood Watch and the local schools, which could provide starting points for community engagement.
4.2 Communities of interest that require further investigation
Further investigation of the following communities of interest is required before a decision could be made regarding their selection to the U-4-72 Project.
4.2.1 Bunbury’s Aboriginal residents There are nearly one thousand Aboriginal people living in Bunbury. It is possible that these residents could represent a community of interest for U-4-72, although it is very important not to assume that our Aboriginal residents are a single homogeneous group that can be easily ‘accessed’, that they would be particularly vulnerable to the adverse impacts of disasters, or that they would wish to be champions for EM preparedness within their own

Bunbury Community Profile August 2012 20
communities. Further discussion with Aboriginal Elders and other Aboriginal community gatekeepers is required before any decision could be made.
4.2.2 Bunbury’s Italian community The highest percentage of our Bunbury residents who do not speak English well, or not at all, are Italians who came to Australia before 1995. It is possible that these people are vulnerable in terms of communication; however, further investigation is required before this assumption can be confirmed.
4.2.3 People in Bunbury who need assistance with core activities
The 1,573 people in our City who need assistance with core activities, such as self-care, mobility and communication would also need assistance with activities such as personal disaster preparedness and emergency evacuation: so would their carers and families. We need to find out whether these people and their carers and families are already receiving advice and assistance with disaster preparedness. It may be possible to connect with these people through residential care organisations such as Bethanie Elanora, Ocean Star Aged Care and Regis Forrest Gardens - and through community care organisations such as Enable South West, Morrissey Homestead and Community Home Care.
4.2.4 Single-parent and FIFO Families Bunbury has a higher than state and national percentage of single-parent families (1,550 families in total at the 2011 Census – which is nearly 20%, or 1 in 5, of our total families). We also know that many families in Bunbury have one or more parents working in the mining sector under the Fly-In/Fly-Out (FIFO) arrangement that would not have identified as single-parent families in the Census, but who could effectively be functioning as single-parent families at a time of emergency if a parent was away at work. Whilst we do not have data on the exact number of FIFO families in Bunbury, information from other key government agencies and non-government organisations such as South West Emergency Care for Children indicate that this is a growing are for concern in Bunbury, as more families seek assistance with difficulties associated with FIFO working arrangements. It is possible that, one any given day, up to one-third or more of Bunbury’s families are functioning as single-parent families, which presents an obvious vulnerability in the advent of an emergency or disaster. More work is required to determine how to best reach single-parent and FIFO families. FIFO Families, an organisation established to assist FIFO families across the country, advertises an Eaton FIFO Playgroup, which could provide a starting point for contact with Bunbury’s FIFO families.