Embed Size (px)
Citation preview
COMMUNITY PROFILE:
TULSA 2014Prepared by the Community Service Council, with support from the Metropolitan Human Services Commission
November 2014

2 DEMOGRAPHIC TRENDS
3
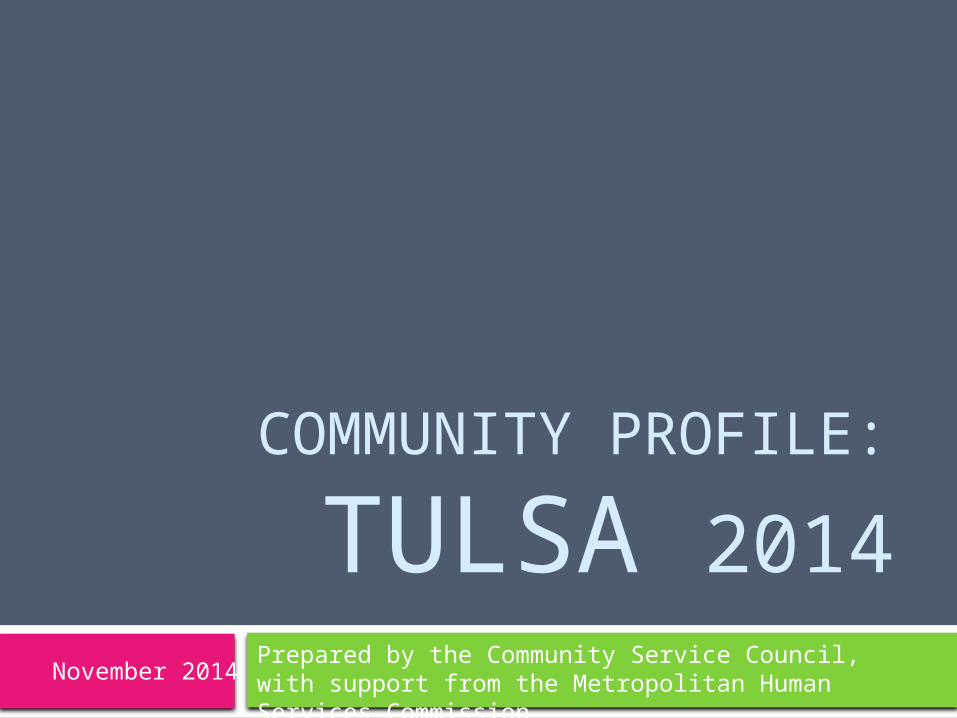
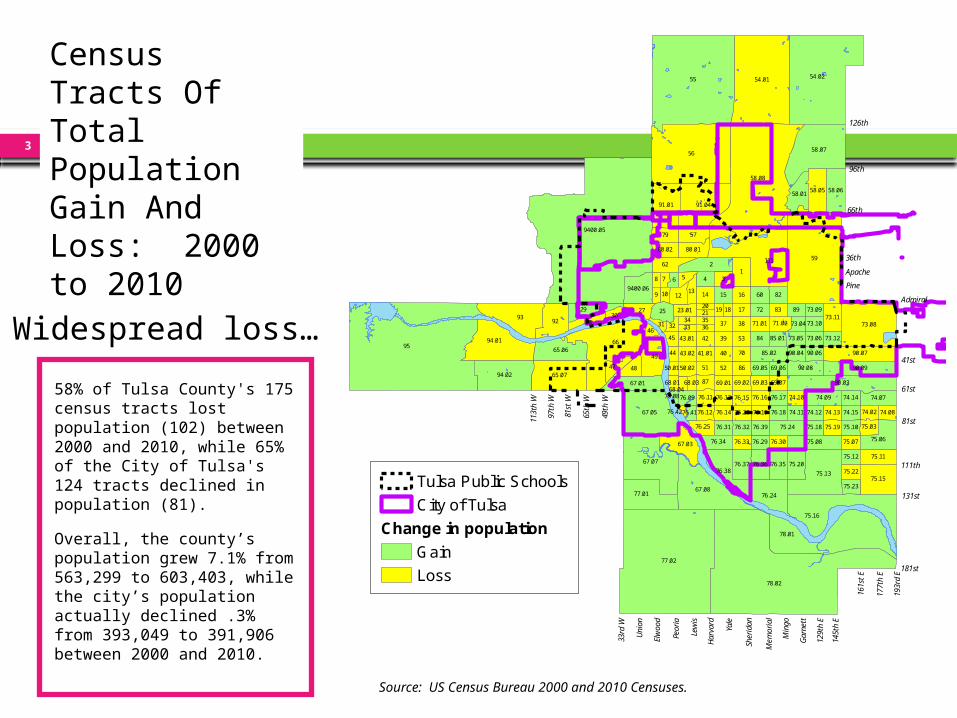
Census Tracts Of Total Population Gain And Loss: 2000 to 2010
58% of Tulsa County's 175 census tracts lost population (102) between 2000 and 2010, while 65% of the City of Tulsa's 124 tracts declined in population (81).
Overall, the county’s population grew 7.1% from 563,299 to 603,403, while the city’s population actually declined .3% from 393,049 to 391,906 between 2000 and 2010.
Widespread loss…
9400.05
9400.06
95
55
59
78.02
56
77.02
58.08
66
54.02
111
54.01
78.01
93
2
75.16
58.07
67.07
67.08
1
73.08
67.05
92
49
94.01
91.04
75.13
94.0290.03
65.07
29
77.01
91.01
34
76.24
76.38
65.06
75.15
62
90.09
90.07
67.03
27
57
88
79
67.01
25
58.05 58.06
75.0675.08
48
5
47
12 821614 6015
6
58.01
87
84
38
52
53
86
40
37
3942
70
7
30
51
9
75.1176.35
17
85.02
74.09
76.37 76.36
90.08
8372
75.24
75.20
8
8973.11
74.07
13
80.01
45
76.34
46
80.02
76.25
44
31
10
71.0232 363534
33
76.11
21
73.05
23.01
75.03
76.14 76.19
76.39
76.30
76.32
69.06
71.01
74.11
18
75.22
74.12
76.09
69.07
69.05
74.08
76.33
76.13 76.16
74.15
76.15
69.01
73.10
75.19
75.12
75.10
19
69.03
74.14
73.06
76.18
90.06
69.02
41.01
76.17
76.31
75.07
73.12
74.13
75.18
76.20
76.29
50.02
75.23
43.02 90.04
74.02
74.10
43.01
76.12
85.01
73.0920
73.04
68.01
50.01
76.4176.42
68.0368.04
76.08
Source: US Census Bureau, 2000 and 2010 Censuses.Prepared by the Community Service Council, with support from the Metropolitan Human Services Commission (5.20.2014)
Apache
96th
66th
111th
81st
Admiral
41st
61st
Peor
ia
Min
go
49t h
W
131st
145t
h E
Gar
nett
Mem
oria
l
Yale
181st
Pine
36th
65th
W
193r
d E
Sher
idan
Harv
ard
Lew
is
129 t
h E
177t
h E
161s
t E
33rd
W
Uni
on
Elw
o od
97t h
W
81st
W
113t
h W
126th
Population Gain or Loss, 2000 to 2010Tulsa County, by Census Tract
Tulsa Public Schools
City of Tulsa
Change in population
Gain
Loss
Source: US Census Bureau 2000 and 2010 Censuses.
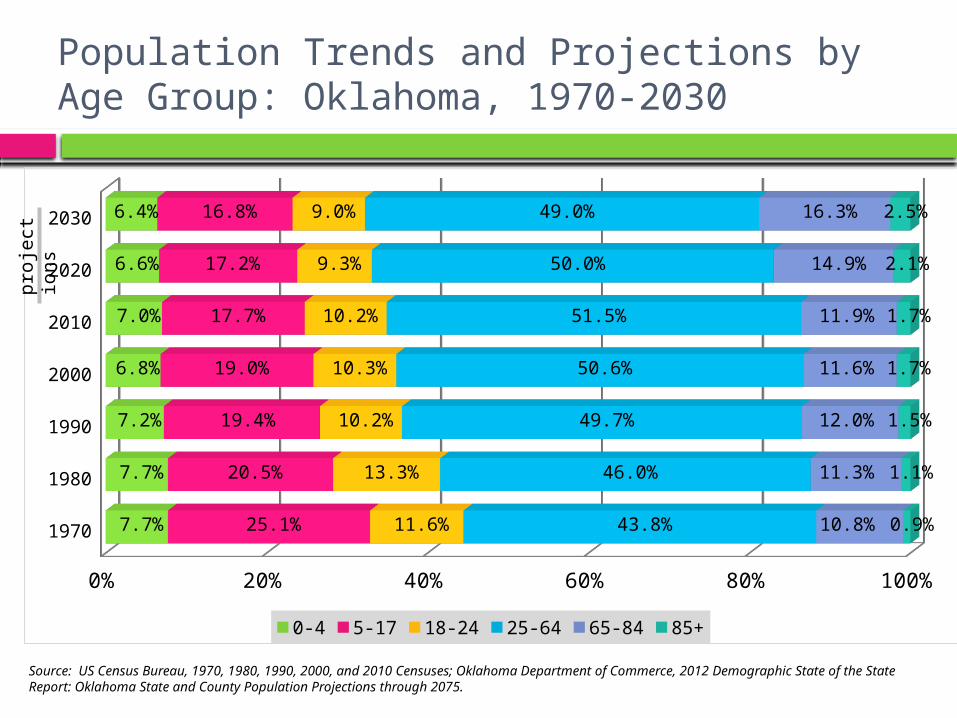
Population Trends and Projections by Age Group: Oklahoma, 1970-2030
1970
1980
1990
2000
2010
2020
2030
0% 20% 40% 60% 80% 100%
7.7%
7.7%
7.2%
6.8%
7.0%
6.6%
6.4%
25.1%
20.5%
19.4%
19.0%
17.7%
17.2%
16.8%
11.6%
13.3%
10.2%
10.3%
10.2%
9.3%
9.0%
43.8%
46.0%
49.7%
50.6%
51.5%
50.0%
49.0%
10.8%
11.3%
12.0%
11.6%
11.9%
14.9%
16.3%
0.9%
1.1%
1.5%
1.7%
1.7%
2.1%
2.5%
0-4 5-17 18-24 25-64 65-84 85+
Source: US Census Bureau, 1970, 1980, 1990, 2000, and 2010 Censuses; Oklahoma Department of Commerce, 2012 Demographic State of the State Report: Oklahoma State and County Population Projections through 2075.
pro
ject
ions
Prepared by the Community Service Council of Greater Tulsa
Living Arrangements of Related Children Under 18Tulsa County, 1970, 1980, 1990, 2000 & 2005-07 Estimates
Source: US Census Bureau, 1970, 1980, 1990, and 2000 Censuses; US Census Bureau, American Community Survey 2005-07.
Married Couple Male-headed Female-headed Other relatives0%
20%
40%
60%
80%
100% 1970 1980 1990 2000 2005-07 est.
1970 82% 1% 11% 4%
1980 74% 2% 16% 6%
1990 71% 3% 18% 5%
2000 65% 5% 21% 7%
2005-07 est. 61% 6% 25% 8%
Children living with 1 or both parents
7
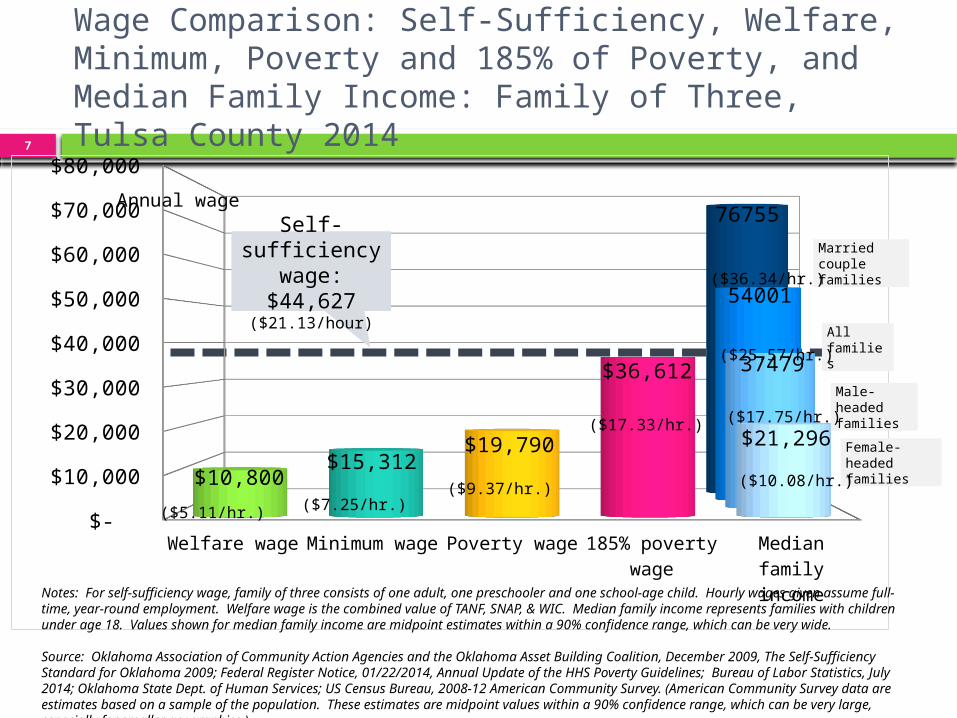
Wage Comparison: Self-Sufficiency, Welfare, Minimum, Poverty and 185% of Poverty, and Median Family Income: Family of Three, Tulsa County 2014
Welfare wage Minimum wage
Poverty wage 185% poverty wage
Median family income
$-
$10,000
$20,000
$30,000
$40,000
$50,000
$60,000
$70,000
$80,000
$10,800 $15,312
$19,790
$36,612
$21,296
37479
54001
76755Self-sufficiency
wage: $44,627
($21.13/hour)
Female-headed families
Male-headed families
Married couple families
All families
Annual wage
Notes: For self-sufficiency wage, family of three consists of one adult, one preschooler and one school-age child. Hourly wages given assume full-time, year-round employment. Welfare wage is the combined value of TANF, SNAP, & WIC. Median family income represents families with children under age 18. Values shown for median family income are midpoint estimates within a 90% confidence range, which can be very wide.
Source: Oklahoma Association of Community Action Agencies and the Oklahoma Asset Building Coalition, December 2009, The Self-Sufficiency Standard for Oklahoma 2009; Federal Register Notice, 01/22/2014, Annual Update of the HHS Poverty Guidelines; Bureau of Labor Statistics, July 2014; Oklahoma State Dept. of Human Services; US Census Bureau, 2008-12 American Community Survey. (American Community Survey data are estimates based on a sample of the population. These estimates are midpoint values within a 90% confidence range, which can be very large, especially for smaller geographies.)
($5.11/hr.) ($7.25/hr.)($9.37/hr.)
($17.33/hr.)
($10.08/hr.)
($17.75/hr.)
($25.57/hr.)
($36.34/hr.)

8
Total population Under 6 Total population Under 60.0%
20.0%
40.0%
60.0%
80.0%
100.0%
19.7%
34.5% 34.5%
49.5%42.8%
64.5% 67.0%
87.7%
100% 200%
Source: US Census Bureau, 2008-12 American Community Survey.
Ratio of Income to Poverty by Age: Tulsa and North Tulsa, 2008-12
Tulsa North Tulsa
9
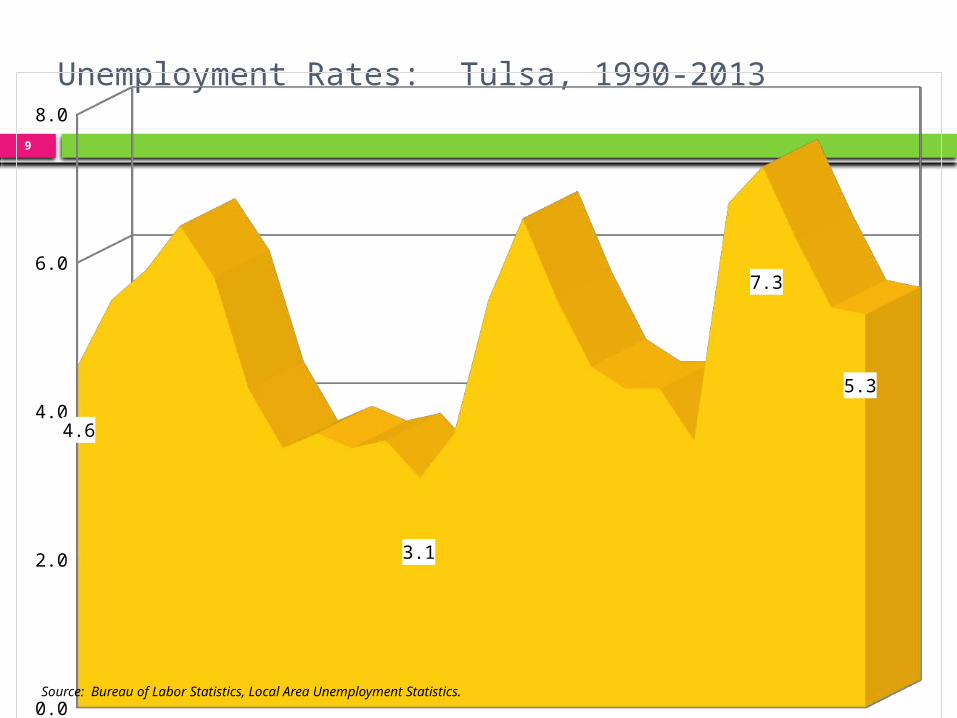
Unemployment Rates: Tulsa, 1990-2013
1990 1995 2000 2005 2010 20130.0
2.0
4.0
6.0
8.0
4.6
3.1
7.3
5.3
Source: Bureau of Labor Statistics, Local Area Unemployment Statistics.
10
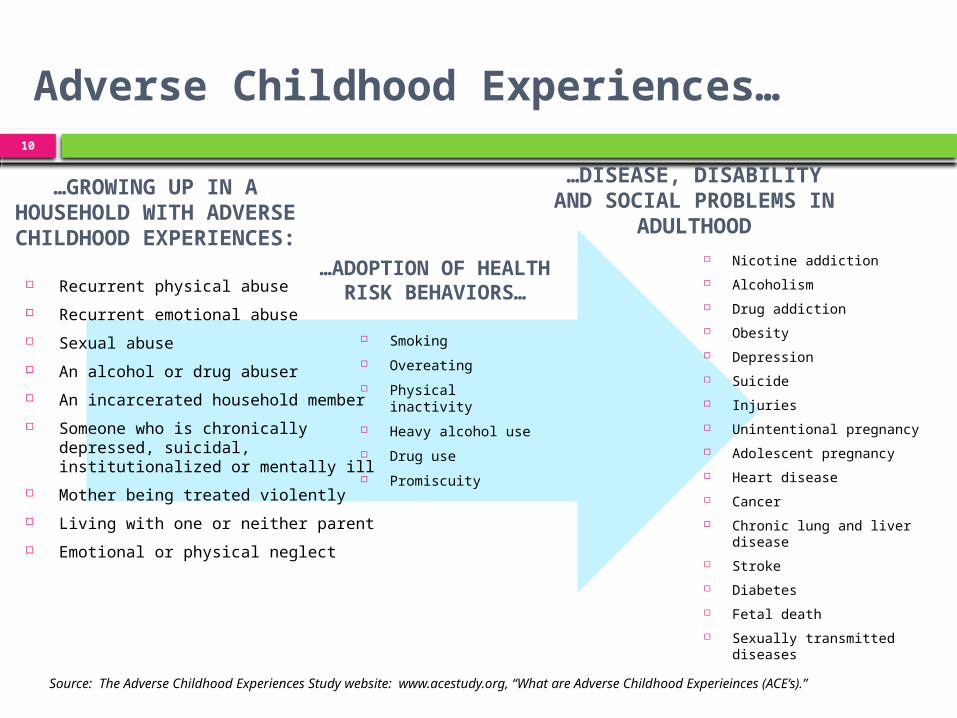
Adverse Childhood Experiences…
Recurrent physical abuse
Recurrent emotional abuse
Sexual abuse
An alcohol or drug abuser
An incarcerated household member
Someone who is chronically depressed, suicidal, institutionalized or mentally ill
Mother being treated violently
Living with one or neither parent
Emotional or physical neglect
Smoking
Overeating
Physical inactivity
Heavy alcohol use
Drug use
Promiscuity
Nicotine addiction
Alcoholism
Drug addiction
Obesity
Depression
Suicide
Injuries
Unintentional pregnancy
Adolescent pregnancy
Heart disease
Cancer
Chronic lung and liver disease
Stroke
Diabetes
Fetal death
Sexually transmitted diseases
Source: The Adverse Childhood Experiences Study website: www.acestudy.org, “What are Adverse Childhood Experieinces (ACE’s).”
…GROWING UP IN A HOUSEHOLD WITH
ADVERSE CHILDHOOD EXPERIENCES: …ADOPTION OF
HEALTH RISK BEHAVIORS…
…DISEASE, DISABILITY AND SOCIAL PROBLEMS
IN ADULTHOOD

12
Summary of Risk Factors for Infants, Tulsa County, 2013
Premature (<37 weeks gest.)
Very short birth spacing (<18 mos. apart)
Short birth spacing (<24 mos. apart)
Very low birthweight (<1500 grams)
Low birthweight (1500-2499 grams)
Mother w/ <12th grade education
Poor prenatal care (3rd tri. or no care)
Unmarried
Teen mother (15-19)
0.0% 10.0% 20.0% 30.0% 40.0% 50.0%
11.7%
13.1%
25.8%
1.3%
7.3%
20.8%
9.8%
42.1%
7.8%729
1,081
NA
NA
117
674
1,911
873
3,888
Source: Oklahoma State Department of Health, Vital Statistics 2013, OK2SHARE, accessed on 11/20/14.
Total births = 9,243

13

14

15
Percentage of 4th Graders NOT Proficient in Reading by Race and Hispanic Origin: United States: 2011
Source: Annie E. Casey Foundation, “KIDS COUNT Data Book, 2013.”
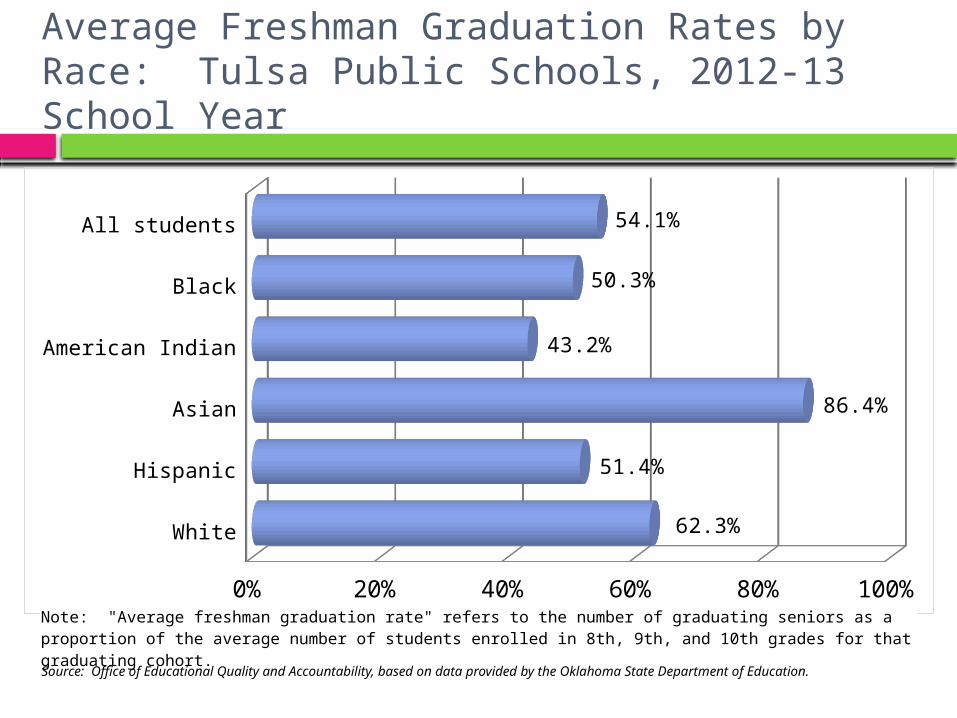
Average Freshman Graduation Rates by Race: Tulsa Public Schools, 2012-13 School Year
White
Hispanic
Asian
American Indian
Black
All students
0% 20% 40% 60% 80% 100%
62.3%
51.4%
86.4%
43.2%
50.3%
54.1%
Source: Office of Educational Quality and Accountability, based on data provided by the Oklahoma State Department of Education.
Note: "Average freshman graduation rate" refers to the number of graduating seniors as a proportion of the average number of students enrolled in 8th, 9th, and 10th grades for that graduating cohort.
16

17
Educational Attainment for Persons Age 25 & over: Tulsa and North Tulsa, 2008-12
Advanced degree
Bachelor's degree
Associate degree
Some college
High school graduate
Less than high school
0.0% 5.0% 10.0% 15.0% 20.0% 25.0% 30.0% 35.0% 40.0%
10.2%
19.6%
7.3%
23.5%
26.1%
13.4%
2.1%
6.4%
5.2%
23.5%
37.4%
25.4%
North Tulsa
Source: US Census Bureau, 2008-12 American Community Survey.

18
Participation in Public Assistance ProgramsNumber of Participants and Percentage of Population Participating
During a Single Month, Tulsa County, 2012
116,415
76,569
3,829
9,063
3,667
89,325
2,720
34,358
6,314
19.3%
47%
43.5%
20.2%
8.2%
14.8%
1.8%
55.1%
10.1%
Soonercare Total (185%/100%)
Soonercare <19 (185%)
WIC Infants (185%)
WIC age 1-5 (185%)
Child Care Subsidy <5 (185%)
SNAP Total (130%)
TANF <18 (50%)
Elem. School Free Lunch (130%)
Elem. School Reduced Lunch (185%)
050,000100,000150,000
Number of Participants
0% 20% 40% 60% 80%
Percent of Population
Source: Oklahoma Dept. of Human Services, Statistical Bulletin, Jan. 2012; Oklahoma State Dept. of Education, Low Income Report for 2011-12; US Census Bureau, 2010 Census; Oklahoma State Department of Health-WIC Service, Caseload Report, Jan. 2012; Oklahoma Health Care Authority, Fast Facts, Jan.2012.

19
Overall Health Status Ranking: Oklahoma, 1990-2013
1990 1992 1994 1996 1998 2000 2002 2004 2006 2008 2010 20120
10
20
30
40
50
32 32
3638
41 42
3941
4341
44
41
48
43 42
4644
4947
49
46 46 4644
Source: United Health Foundation, “America’s Health Rankings 2013.”

20
Oklahoma’s Rankings in Health Determinants, 2013
Primary care physicians
Immunization - children
Public health funding
Lack of health insurance
Children in poverty
Infectious disease
Occup. fatalities
Violent crime
HS graduation
Physical inactivity
Obesity
Drug deaths
Smoking
All Determinants
4848
2632
4618
4541
27444546
3943
Source: United Health Foundation, “America’s Health Rankings 2013.”
1=Healthiest state 50=Least healthy state
Beh
avio
rs
Polic
y &
C
linic
al
Care
Com
mun
ity
&
En
vir
onm
ent
21
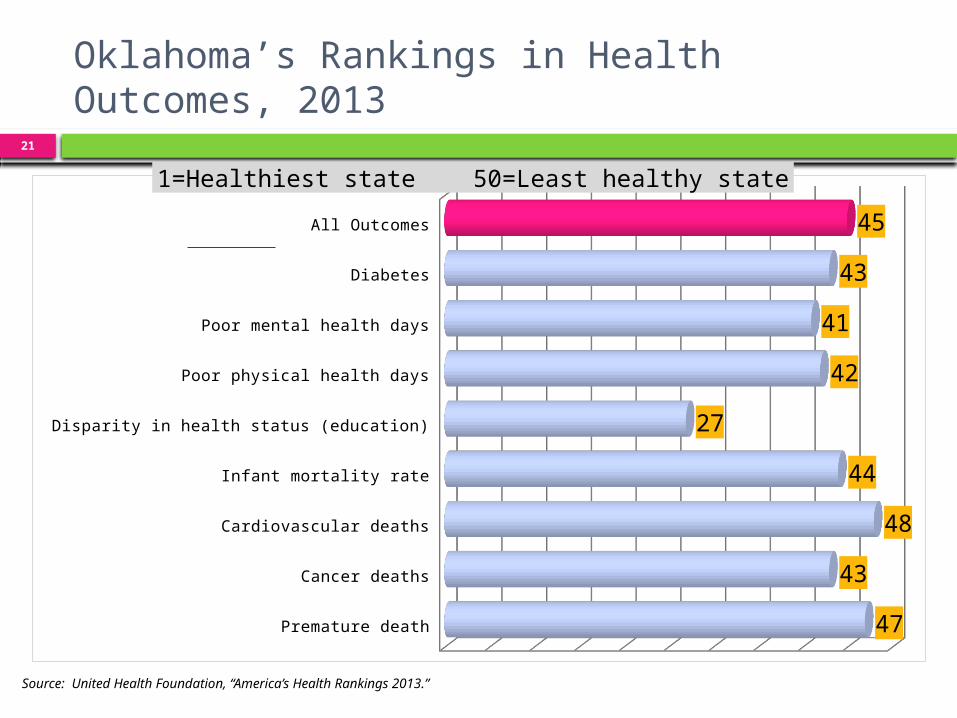
Oklahoma’s Rankings in Health Outcomes, 2013
Premature death
Cancer deaths
Cardiovascular deaths
Infant mortality rate
Disparity in health status (education)
Poor physical health days
Poor mental health days
Diabetes
All Outcomes
47
43
48
44
27
42
41
43
45
Source: United Health Foundation, “America’s Health Rankings 2013.”
1=Healthiest state 50=Least healthy state
22
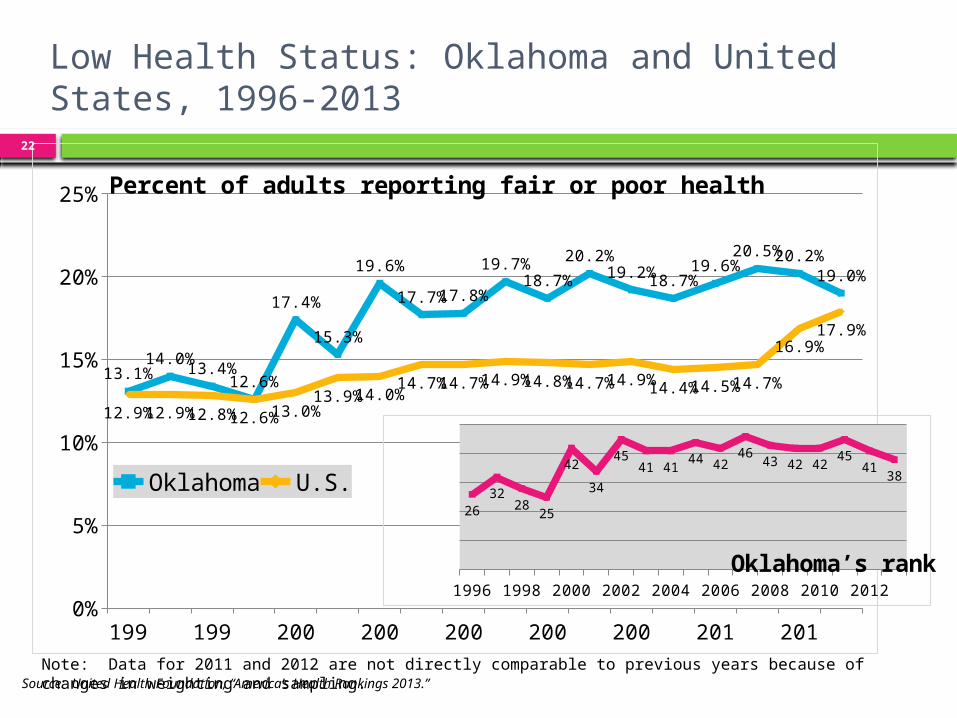
Low Health Status: Oklahoma and United States, 1996-2013
1996 1998 2000 2002 2004 2006 2008 2010 20120%
5%
10%
15%
20%
25%
13.1%14.0%
13.4%12.6%
17.4%
15.3%
19.6%
17.7%17.8%
19.7%18.7%
20.2%19.2%18.7%
19.6%20.5%20.2%
19.0%
12.9%12.9%12.8%12.6%13.0%13.9%14.0%
14.7%14.7%14.9%14.8%14.7%14.9%14.4%14.5%14.7%
16.9%17.9%
Percent of adults reporting fair or poor health
Oklahoma
Source: United Health Foundation, “America’s Health Rankings 2013.”
1996 1998 2000 2002 2004 2006 2008 2010 2012
2632
2825
42
34
4541 41
44 4246
43 42 4245
4138
Oklahoma’s rank
Note: Data for 2011 and 2012 are not directly comparable to previous years because of changes in weighting and sampling.
23
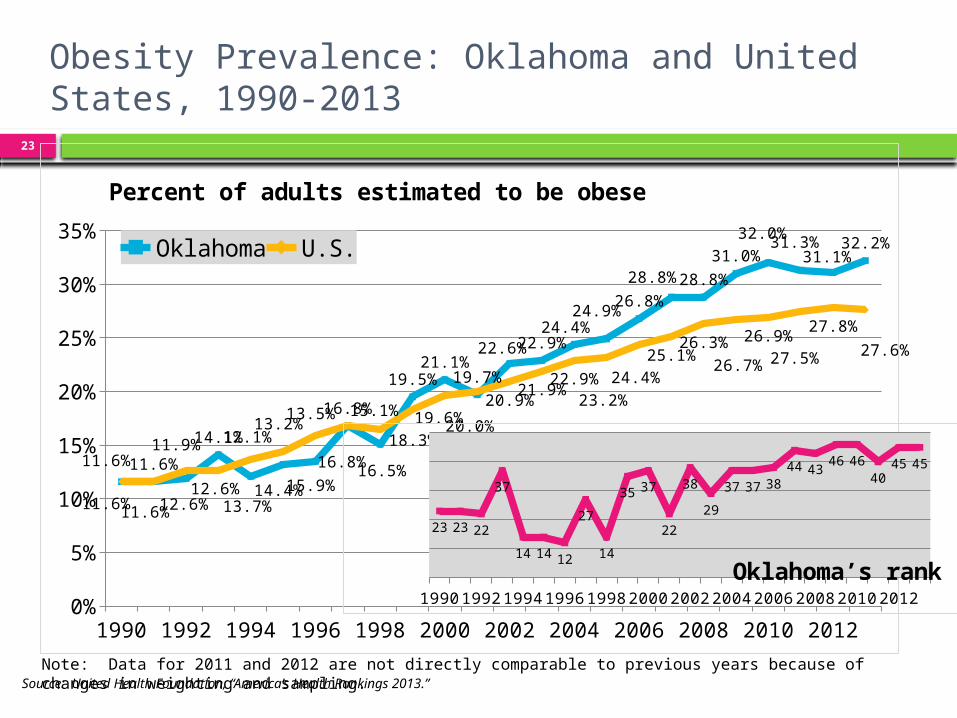
Obesity Prevalence: Oklahoma and United States, 1990-2013
1990 1992 1994 1996 1998 2000 2002 2004 2006 2008 2010 20120%
5%
10%
15%
20%
25%
30%
35%
11.6%11.6%11.9%14.1%12.1%
13.2%13.5%16.8%15.1%
19.5%21.1%
19.7%
22.6%22.9%24.4%
24.9%26.8%
28.8%28.8%
31.0%
32.0%31.3%31.1%
32.2%
11.6%11.6%12.6%12.6%
13.7%14.4%15.9%
16.8%16.5%
18.3%19.6%20.0%
20.9%21.9%
22.9%23.2%
24.4%
25.1%26.3%
26.7%
26.9%
27.5%
27.8%
27.6%
Percent of adults estimated to be obese
Oklahoma
Source: United Health Foundation, “America’s Health Rankings 2013.”
199019921994199619982000200220042006200820102012
23 23 22
37
14 14 12
27
14
35 37
22
38
29
37 37 3844 43
46 4640
45 45
Oklahoma’s rank
Note: Data for 2011 and 2012 are not directly comparable to previous years because of changes in weighting and sampling.

24
Smoking Prevalence: Oklahoma and United States, 1990-2013
1990 1992 1994 1996 1998 2000 2002 2004 2006 2008 2010 20120%
5%
10%
15%
20%
25%
30%
35%33.0%
28.7%28.7%
26.6%25.0%
26.1%
21.7%24.1%
24.6%
23.9%25.2%
23.3%
28.7%26.6%
25.1%26.1%
25.1%25.1%25.8%
24.7%25.5%
23.7%26.1%
23.3%
29.5%
25.2%25.2%22.7%
23.0%22.2%22.7%23.5%23.2%
22.9%22.8%23.2%
23.2%23.2%22.0%
20.9%20.6%20.1%
19.8%18.4%17.9%17.3%
21.2%19.6%
Percent of adults who are current smokers
Oklahoma
Source: United Health Foundation, “America’s Health Rankings 2013.”
199019921994199619982000200220042006200820102012
44 42 42 4037
45
15
28
3632
41
27
49
4236
47 46 47 48 46 48 48 47
39
Oklahoma’s rank
Note: Data for 2011 and 2012 are not directly comparable to previous years because of changes in sampling methodology.

25
26 Conclusion
27
Melanie Poulter
Senior Planner, Demography and Geography
Community Service Council
www.csctulsa.org
918-295-1285
Contact Information: