Embed Size (px)
Citation preview

Community Policies and Programs to Prevent Obesity and Child Adiposity
Edward A. Frongillo, PhD1, Stephen B. Fawcett, PhD2, Lorrene D. Ritchie, PhD, RD3, S. Sonia Arteaga, PhD4, Catherine M. Loria, PhD4, Russell R. Pate, PhD5, Lisa V. John, PhD6, Warren J Strauss, ScM7, Maria Gregoriou, MS8, Vicki L. Collie-Akers, PhD2, Jerry A. Schultz, PhD2, Andrew J. Landgraf, PhD7, and Jyothi Nagaraja, MS7
1Department of Health Promotion, Education, and Behavior, University of South Carolina, Columbia, South Carolina 2Work Group for Community Development, University of Kansas, Lawrence, Kansas 3Nutrition Policy Institute, Division of Agriculture and Natural Resources, University of California, Oakland, California 4National Heart, Lung, and Blood Institute, Bethesda, Maryland 5Department of Exercise Science, University of South Carolina, Columbia, South Carolina 6Battelle Health and Analytics, St. Louis, Missouri 7Battelle Health and Analytics, Columbus, Ohio 8Battelle Health and Analytics, Arlington, Virginia
Abstract
Introduction—Evidence regarding impact of community policies and programs (CPPs) to
prevent child obesity is limited, and which combinations of strategies and components are most
important is not understood. The Healthy Communities Study was an observational study to assess
relationships of characteristics and intensity of CPPs with adiposity, diet, and physical activity in
children, taking advantage of variation across the U.S. in community actions to prevent child
obesity. The study examined the association of CPPs to prevent child obesity with measured BMI
and waist circumference, hypothesizing that communities with more-comprehensive CPPs would
have children with lower adiposity.
Methods—The study included 130 communities selected by probability-based sampling or
because of known CPPs targeting child obesity. Data were collected at home visits on 5,138
children during 2013–2015. CPPs were scored for multiple attributes to create a CPP intensity
score. A CPP target behavior score reflected the number of distinct target behaviors addressed.
Scores were standardized with the smallest observed score across communities being 0 and the
Address correspondence to: Edward A. Frongillo, PhD, Department of Health Promotion, Education, and Behavior, 915 Greene Street, Room 529, Discovery I, University of South Carolina, Columbia SC 29208-4005. [email protected].
Publisher's Disclaimer: This is a PDF file of an unedited manuscript that has been accepted for publication. As a service to our customers we are providing this early version of the manuscript. The manuscript will undergo copyediting, typesetting, and review of the resulting proof before it is published in its final citable form. Please note that during the production process errors may be discovered which could affect the content, and all legal disclaimers that apply to the journal pertain.
EAF, SBF, LDR, SA, CML, RRP, WJS, MG, VLCA, and JAS designed the study. LVJ supervised the collection and preparation of data. EAF, WJS, AL, and JN conducted the data analysis. EAF drafted the manuscript and prepared the final version. All authors provided input to the manuscript, and read and approved the final version. SSA and CML were employed by the study sponsor and contributed to study design; collection, analysis, and interpretation of data; writing the manuscript; and the decision to submit the manuscript for publication.
No financial disclosures were reported by the authors of this paper.
HHS Public AccessAuthor manuscriptAm J Prev Med. Author manuscript; available in PMC 2018 November 01.
Published in final edited form as:Am J Prev Med. 2017 November ; 53(5): 576–583. doi:10.1016/j.amepre.2017.05.006.
Author M
anuscriptA
uthor Manuscript
Author M
anuscriptA
uthor Manuscript
largest 1. Multilevel regression analysis in 2016 adjusted for community, household, and
individual characteristics.
Results—Higher CPP target behavior score was significantly associated with lower BMI and
waist circumference in a dose–response relationship, with magnitude for the past 3 years of CPPs
of 0.843 kg/m2 (p=0.013) for BMI and 1.783 cm (p=0.020) for waist circumference.
Conclusions—This study provides plausible evidence that comprehensive CPPs targeting a
greater number of distinct physical activity and nutrition behaviors were associated with lower
child adiposity.
INTRODUCTION
Child obesity is prevalent (16.9%) in the U.S.,1 and is associated with later obesity, chronic
disease,2 and high medical costs.3 Recommended actions to prevent child obesity have
focused on changing environments to increase children’s healthy eating and physical
activity, with programs sponsored by federal government and private foundations and
policies enacted at federal, state, and local levels.4,5 Cities, towns, or regions have
implemented community interventions to alter physical activity and nutrition.6 These
interventions vary in behaviors targeted and strategies used, with strategies including
policies and programs based on education, health promotion, counseling, and social
marketing and others modifying organizations, environments, or directives.6 Evidence
regarding impact of these community policies and programs (CPPs) is limited, and which
combinations of strategies, intervention components, and behavioral targets are most
important is not understood.7–9
The Healthy Communities Study (HCS) assesses relationships of characteristics and
intensity of CPPs addressing child obesity with adiposity, diet, and physical activity in
children by taking advantage of variation across the country in time, place, content, and
intensity of community actions to prevent child obesity.10–13 This paper focuses on the
hypothesis that communities with more-comprehensive CPPs would have children with
lower BMI and waist circumference after adjusting for community, household, and
individual characteristics.
METHODS
Study Sample
The authors selected 130 communities, 102 from a stratified national probability-based
sample, 25 known to have CPPs targeting child obesity, and three through both processes.14
This design maximized identification of CPPs that might be associated with child obesity,
while providing information about the distribution of CPPs across communities. Strata were
defined from combinations of census tracts based on race, ethnicity, income, region, and a
preselection ranking of perceived CPP intensity.14 Census tracts were selected randomly
from each stratum with probability proportional to the population of children aged 4–15
years; children were in grades Kindergarten–eighth where they could be exposed to CPPs
delivered through schools and other means. The community was defined by the area served
by the public high school closest to the center of each selected census tract; Kindergarten–
Frongillo et al. Page 2
Am J Prev Med. Author manuscript; available in PMC 2018 November 01.
Author M
anuscriptA
uthor Manuscript
Author M
anuscriptA
uthor Manuscript

eighth grade schools within that high school catchment area were used for household
recruitment. Participants were recruited through public schools (two elementary and two
middle) in each community, with 436 schools participating.15 Of 855 contacted schools,
55.9% (n=478) agreed to participate, 26.0% (n=222) refused, and 18.1% (n=155) were not
needed or did not meet study requirements. A total of 15,047 households expressed interest
in participating and provided sufficient information, of which 50.2% (n=7,554) were
screened and recruited, 4.43% (n=666) refused screening, 4.52% (n=680) were ineligible or
not needed, and 40.9% (n=6,147) could not be contacted. Of the 7,554 recruited families,
68.0% (n=5,138) completed a visit, 13.2% (n=997) withdrew or became non-responsive, and
18.8% (n=1,419) were not completed (e.g., data collection ended).
Measures
The authors assessed during 2013–2015 the number and types of CPPs implemented over
the past 10 years through standardized interviews with community key informants and
document review.16 The protocol was developed by the study team based on prior field
research and further field testing.17 In each community, trained study staff interviewed ten to
14 key informants with knowledge of CPPs addressing childhood obesity, with 1,410 key
informants from schools, health organizations and coalitions, government, and non-profit
organizations. Reports and other documents were supplied by key informants or located
through online searches.
Data were collected on 5,138 children by trained field data collectors through interviews and
examination at home visits. Participants underwent a standard protocol to measure child
height, weight, and waist circumference and information collection on demographic and
background characteristics and nutrition and physical activity behaviors.18
An activity was coded by trained interviewers and study staff as a CPP if it: (1) occurred
rather than only planned; (2) was a policy, program, or other change to the environment
occurring during the past 10 years; (3) was related to nutrition, physical activity, weight
control, or prevention of child obesity; (4) targeted or potentially benefited children aged 4–
15 years; and occurred in or potentially benefited children in the community (Appendix
table1).16 Data quality was ensured by independently scoring a randomly selected set of
10% of CPPs from each community. If inter-observer agreement was <80%, interviewers
and coders were re-trained and certified.
Each CPP was coded for multiple attributes:
1. behavior change strategy used (i.e., providing information and enhancing skills;
enhancing services and support; modifying access, barriers, and opportunities;
changing consequences; modifying policies and broader conditions; or other);
2. duration (i.e., one-time occurrence, occurring more than once, or ongoing); and
3. reach (i.e., proportion—high, medium, or low—of the population involved in or
exposed to the activity).16
Each attribute was assigned a numerical intensity score based on relative strength.
Calculation of the intensity score for each CPP accounted for the potential contribution of
Frongillo et al. Page 3
Am J Prev Med. Author manuscript; available in PMC 2018 November 01.
Author M
anuscriptA
uthor Manuscript
Author M
anuscriptA
uthor Manuscript

discrete activities, and, when taken together as a CPP intensity score, estimated the delivered
dose. A behavior change strategy was high (1.0) if it modified policies and systems, changed
consequences, or modified access, opportunities, or barriers; medium (0.55) if it enhanced
services and support; and low (0.1) if it provided information and enhanced skills. Duration
was high (1.0) if it was ongoing throughout the year, medium (0.55) if it occurred more than
once, and low (0.1) if it was one time. Reach was high (1.0) if ≥21% of the population
benefited or was exposed, medium (0.55) if it was 6%–20%; and low (0.1) if it was 0%–5%.
The attribute values were summed to create an intensity score for each CPP that ranged from
0.3 to 3.0. For each community, intensity scores were summed for all CPPs for each year to
create a total community CPP intensity score for each year.
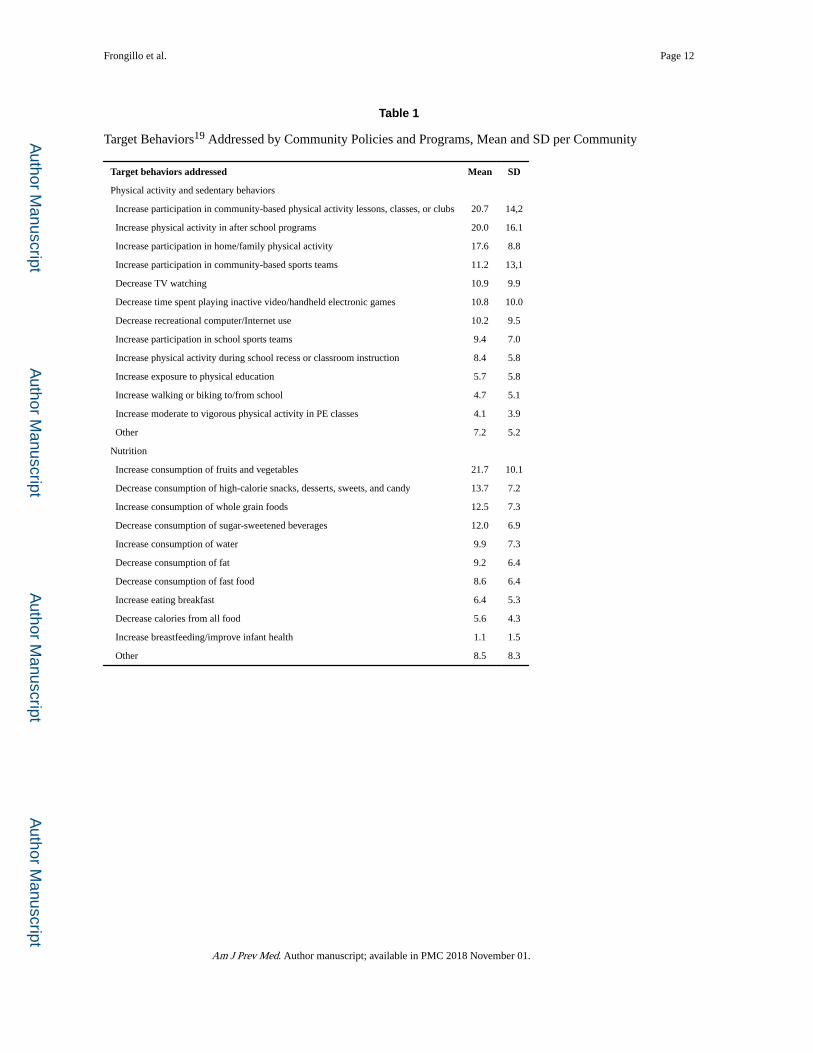
An alternative CPP score reflected public health recommendations that multiple target
behaviors be implemented in comprehensive interventions.19 Each CPP was coded for one
or more of 24 unique target behaviors, 13 for physical activity and sedentary behavior and
11 for nutrition (Table 1). The target behaviors were selected based on expertise of the HCS
team, frequent reference in literature, and recommendations for action. The CPP target
behavior score was the number of 24 distinct behaviors targeted in a community.
The CPP scores were calculated for the current year and accrued for the past 3, 6, and 10
years, intervals chosen to be most meaningful, supported by some preliminary analysis.
Correlations between the intervals ranged from 0.916 to 0.990 for the CPP intensity score
and 0.708 to 0.981 for the CPP target behavior score. Scores were calculated for all CPPs,
physical activity CPPs, and nutrition CPPs. Scores were standardized by rescaling, with the
smallest observed score across communities being 0 and the largest observed score being 1.
Trained field staff measured child weight, height, and waist circumference using standard
procedures20 revised for the home setting.18 Measures were taken twice and entered into the
information management system, which checked for data quality (e.g., plausible values).
Data quality was achieved through training and certification of field staff, repeated
measurement, presence of supervising staff during selected in-home visits, and post-visit
review of data.18
Adiposity was measured using BMI and waist circumference. Although not direct measures
of body composition, for groups of children, high BMI and waist circumference accurately
reflect high adiposity (i.e., fat mass) obtained through assessment of body composition21–26
and chronic disease markers.21,27
The Battelle Memorial Institute’s IRB provided oversight. The HCS had an NIH-appointed
Observational Study Monitoring Board which oversaw participant burden, safety, and study
progress. The protocol and all data collection forms were approved by the U.S. Office of
Management and Budget (OMB #0925-0649).
Statistical Analysis
Analyses were carried out in 2016, and were at child and household level for outcome
variables (i.e., BMI and waist circumference) and some covariates, and community level for
exposure variables (i.e., CPP intensity score and CPP target behavior scores) and some
Frongillo et al. Page 4
Am J Prev Med. Author manuscript; available in PMC 2018 November 01.
Author M
anuscriptA
uthor Manuscript
Author M
anuscriptA
uthor Manuscript

covariates. The least absolute shrinkage and selection operator was used to obtain a set of
covariates that adjusted for confounding while maintaining model precision.28 Community
covariates were geographic region (i.e., Midwest, Northeast, South, and West) and minority
classification of census tract (i.e., African American, Hispanic, and other). Covariates for the
child were height, gender, age, age squared, and ethnicity; and for the household were total
family income (<$20,000, $20,000–<$35,000, $35,000–<$50,000, $50,000–<$75,000,
$75,000–<$100,000, and ≥$100,000), father’s education (no high school; some high school,
no diploma; high school diploma, GED or equivalent; some college, no degree, associate
degree; bachelor degree; master degree, professional degree; and doctoral degree), and
mother’s employment (working full-time for pay now; working part-time for pay now;
temporarily laid off, on sick or maternity leave; looking for work, unemployed; disabled,
permanently or temporarily; keeping house; and other, [e.g., retired or student]).
Two-level mixed models implemented in SAS, version 9.4 were used, with the exposure
variable and covariates as fixed effects and community as a random effect.14 A minimally
adjusted model had as covariates child height, gender, age, and age squared; a fully adjusted
model also included the other covariates described above. There were some missing data due
to non-response; multiple imputation was used to create 20 imputed data sets that were then
combined for inference.29 Community information was used to impute the intensity scores
by predicting start and end dates of individual CPPs if missing, and then other variables
were imputed using chained equations with all variables as possible predictors.28
RESULTS
The 1-year unstandardized CPP intensity score had median of 33.6, mean of 34.9, and range
of 10.7 to 81.8. The 1-year unstandardized CPP target behavior score had median of 23.0,
mean of 22.4, and range of 17.4 to 24.0. For the 1-year CPP intensity score, African
American census tracts had slightly lower mean scores (33.8) than Hispanic (35.4) or other
census tracts (35.2, p=0.80); higher-income census tracts (33.7) had lower scores than lower-
income census tracts (36.8, p=0.13); rural census tracts (31.5) had lower scores than
suburban (35.1) or urban census tracts (36.7, p=0.15); and the Midwest (31.3) and South
(33.7) had lower scores than the Northeast (41.0) and West (36.1, p=0.03). The CPP target
behavior score did not significantly differ across these characteristics of census tracts.
Child age had mean of 9.28 (SD=2.65) years (Appendix Table 2). Weight had mean of 40.3
(SD=18.4) kg and height had a mean of 1.39 (SD=0.168) m. The sample was 50.9% female.
A total of 4,926 children had valid measured BMI with median of 18.4 kg/m2 and mean of
20.0 kg/m2. A total of 5,008 children had valid measured waist circumference with a median
of 66.1 cm and mean of 69.5 cm. Girls had higher mean BMI and lower mean waist
circumference (20.1 kg/m2 and 69.9 cm) than boys (19.9 kg/m2 and 69.1 cm). Both BMI and
waist circumference were higher for children in a higher grade, with lower family income,
who were African American, and reported Hispanic ethnicity; both were lower for those
reporting more than one race, not including African American. For both sexes, the BMI
pattern across age in this study was the same as in the 2011–2012 National Health and
Nutrition Examination Survey; accounting for age and sex, this study had BMIs that were
slightly (0.4 kg/m2) higher.
Frongillo et al. Page 5
Am J Prev Med. Author manuscript; available in PMC 2018 November 01.
Author M
anuscriptA
uthor Manuscript
Author M
anuscriptA
uthor Manuscript

Although in the hypothesized direction, neither BMI nor waist circumference was
significantly associated with the CPP intensity score regardless of the number of years or
whether all, physical activity, or nutrition CPP scores were used (Table 2). Higher
standardized CPP target behavior score in fully adjusted models was significantly associated
with lower BMI for 1, 3, and 6 years for all CPPs and physical activity CPPs. The difference
in BMI between communities with the smallest (17.4) and largest (24.0) observed all CPP
scores for 1–6 years was about 0.8 kg/m2. The difference was greater for physical activity
CPPs (0.927 to 0.988 kg/m2 for 1 to 6 years) and lower for nutrition CPPs (0.683 to 0.827
kg/m2 for 1 to 6 years).
Higher standardized CPP target behavior score in fully adjusted models was significantly
associated with lower waist circumference for 1, 3, 6, and 10 years for all CPPs and nutrition
CPPs with the exception of 10 years for all CPPs (Table 3). For 1 to 6 years, the magnitude
for all CPPs was about 1.5 cm greater for nutrition CPPs, about 2.2 cm and lower for
physical activity CPPs (1.14 to 1.58 cm).
The associations of BMI (Figure 1) and waist circumference with scores for CPP physical
activity target behaviors and for CPP nutrition target behaviors followed a dose–response
pattern. The magnitude of associations was highest for 3-year scores. For 3-year scores,
attenuation of the magnitude of coefficients for fully adjusted models compared to
minimally adjusted models ranged from 6.2% to 18.5%. There was greater attenuation due
to covariate adjustment with scores that accrued over greater number of years, except for the
nutrition CPP score with waist circumference for which there was little attenuation.
DISCUSSION
Children in communities with CPPs that targeted a greater number of distinct behaviors for
physical activity and nutrition had lower BMI and waist circumference, with a magnitude of
public health importance. To illustrate, the median BMI in the sample for both boys and girls
at age 9 years was 18.3 kg/m2, corresponding to percentiles of 82.3 and 73.6, respectively, of
the Centers for Disease Control and Prevention growth reference. The average difference in
BMI between communities with smallest and largest number of addressed target behaviors
was about 0.8 kg/m2. Shifting the population from a BMI of 18.3 to 17.5 corresponds to a
shift of about 0.29 z-scores or 9 percentiles on average for both boys and girls. This shift
also corresponds to a 7.5–percentage point absolute reduction (and a two thirds relative
reduction) in expected obesity prevalence. An average difference of 0.09 child BMI z-scores
was reported in a meta-analysis of community trials.30
Associations of CPP scores with adiposity were largest for scores that summed information
about CPPs over 3 years. A child’s adiposity would be a function of CPPs to which they
were exposed in recent past years as well as the current year.31,32 Because summed scores
add both information and error, 3 years was possibly optimal for capturing information
about CPPs relevant to child adiposity without excess error. Key informants’ recall about
CPPs may have been less accurate and precise for years further away from the current year
and when key informants had limited tenure in the community; these potential biases likely
were consistent across communities, minimizing effects on regression estimates.
Frongillo et al. Page 6
Am J Prev Med. Author manuscript; available in PMC 2018 November 01.
Author M
anuscriptA
uthor Manuscript
Author M
anuscriptA
uthor Manuscript

The CPP intensity and target behavior scores were chosen on conceptual grounds to reflect
different perspectives about exposures needed for public health impact. The CPP target
behavior score counted distinct target behaviors addressed. Many communities targeted most
behaviors, and the score differentiated these communities from those that did not. The CPP
intensity score used more attributes, calculated from behavior change strategy, reach, and
duration for each CPP. An assumption was made that certain behavior change strategies
were stronger than others, that is, strategies that modified policies and systems, changed
consequences, or modified access, opportunities, or barriers were scored highest and
strategies that provided information and enhanced skills were scored lowest. Although this
assumption had a behavioral science rationale, effectiveness of CPPs likely depends on
implementation and context (i.e., a CPP is unlikely to be fully implemented or universally
more effective or stronger in all contexts).33 Further research by this study team and others
is needed to understand which aspects of intensity are most related to child adiposity and
nutrition and physical activity behaviors, and how these can best be measured.
Several alternatives may explain the associations observed between CPP target behavior
score and adiposity, including common omitted variables, selection, or causation. First, the
CPP score and adiposity could be not causally linked, with the association resulting from a
common association with other variables omitted from the analyses. The HCS collected
many community, household, and individual variables that were tested as potential controls,
but other unmeasured variables such as community agency and organizational structure34
may have caused lower adiposity, not CPPs per se. Second, the association could exist
because of selection34–36 wherein, for example, health-conscious families selected to locate
in communities perceived to provide a healthy environment. Third, communities that
targeted a greater number of behaviors could have caused children to have lower adiposity,
the assumption made when CPPs were sponsored for enactment. Some study features
enhance plausibility of this causal explanation relative to Hill’s criteria.37 CPPs that were
measured, albeit by recall, occurred temporally before the BMI and waist circumference
measurements, and there was a strong dose–response relationship between BMI and waist
circumference and scores that was consistent for both CPP physical activity and nutrition
target behaviors.
Children’s BMI and waist circumference were more strongly associated with CPP target
behavior scores for physical activity and nutrition, respectively, suggesting differential
sensitivity of these outcomes to the targeted behaviors. Other HCS manuscripts will examine
specific targeted behaviors in relation to children’s physical activity, sedentary, and nutrition
behaviors, which may inform why this differential association occurred.
The HCS collected data on a large and diverse sample of communities, with oversampling of
Hispanic and African American communities. Children and key informants came from the
same school, strengthening the measurement of school-based CPPs to which children were
exposed. Probability-based sampling of children was not feasible, so adjustment for
potential response bias was not possible. Weights and heights were measured by trained
study staff.
Frongillo et al. Page 7
Am J Prev Med. Author manuscript; available in PMC 2018 November 01.
Author M
anuscriptA
uthor Manuscript
Author M
anuscriptA
uthor Manuscript

CONCLUSIONS
This study provides plausible evidence for the U.S. that community investment to implement
more-comprehensive CPPs—those targeting a greater number of distinct behaviors—
resulted in lower child adiposity. Healthy weight among children is influenced by conditions
that make it easier and more rewarding to engage in multiple behaviors related to physical
activity and healthy nutrition. Investments in CPPs can contribute to capacity of local people
to work together to initiate, implement, and sustain child health. Among important future
questions to be addressed is whether such investments can help to reduce disparities in child
adiposity that are associated with ethnicity, place, and other characteristics. Health
practitioners can play an important role in potentiating advocacy, implementation, and
impact of these efforts.
Supplementary Material
Refer to Web version on PubMed Central for supplementary material.
Acknowledgments
The content is solely the responsibility of the authors and does not necessarily represent the official views of NIH or the U.S. Government. The Healthy Communities Study was funded by the National Heart, Lung, and Blood Institute, in collaboration with the Eunice Kennedy Shriver National Institute of Child Health and Development, National Institute of Diabetes and Digestive and Kidney Disorders, National Cancer Institute, and NIH Office of Behavioral and Social Sciences Research; DHHS, under Contract No. HHSN268201000041C.
References
1. Ogden CL, Carroll MD, Kit BK, Flegal KM. Prevalence of childhood and adult obesity in the United States, 2011–2012. JAMA. 2014; 311(8):806–814. https://doi.org/10.1001/jama.2014.732. [PubMed: 24570244]
2. Shashaj B, Bedogni G, Graziani MP, et al. Origin of cardiovascular risk in overweight preschool children: A cohort study of cardiometabolic factors at the onset of obesity. JAMA Pediatr. 2014; 168(10):917–924. https://doi.org/10.1001/jamapediatrics.2014.900. [PubMed: 25111132]
3. Finkelstein EA, Graham WC, Malhorta R. Lifetime direct medical costs of childhood obesity. Pediatrics. 2014; 133(5):854–862. https://doi.org/10.1542/peds.2014-0063. [PubMed: 24709935]
4. Sanchez-Vaznaugh EV, Sanchez BN, Baek J, Crawford PB. ‘Competitive’ food and beverage policies: Are they influencing childhood overweigth trends? Health Aff (Millwood). 2010; 29(3):436–446. https://doi.org/10.1377/hlthaff.2009.0745. [PubMed: 20194985]
5. Madsen KA, Weedn AE, Crawford PB. Disparities in peaks, plateaus, and declines in prevalence of high BMI among adolescents. Pediatrics. 2010; 126(3):434–443. https://doi.org/10.1542/peds.2009-3411. [PubMed: 20713482]
6. Wolfenden L, Wyse R, Nichols M, Allender S, Millar L, McElduff P. A systematic review and meta-analysis of whole of community interventions to prevent excessive population weight gain. Prev Med. 2014; 62:193–200. https://doi.org/10.1016/j.ypmed.2014.01.031. [PubMed: 24518005]
7. Hennessy E, Oh A, Agurs-Collins T, et al. State-level school competitive food and beverage laws are associated with children’s weight status. J Sch Health. 2014; 84(9):609–616. https://doi.org/10.1111/josh.12181. [PubMed: 25117896]
8. Nanney MS, Nelson T, Wall M, Haddad TA, Kubik M, Story M. State school nutrition and physical activity policy environments and youth obesity. Am J Prev Med. 2010; 38(1):9–16. https://doi.org/10.1016/j.amepre.2009.08.031. [PubMed: 20117552]
Frongillo et al. Page 8
Am J Prev Med. Author manuscript; available in PMC 2018 November 01.
Author M
anuscriptA
uthor Manuscript
Author M
anuscriptA
uthor Manuscript
9. Nanney MS, MacLehose R, Kubik MY, Davey CS, Coombes B, Nelson TF. Recommended school policies are assicated with student sugary drink and fruit vegetable intake. Prev Med. 2014; 62:179–181. https://doi.org/10.1016/j.ypmed.2014.01.026. [PubMed: 24518003]
10. McKinnon RA, Orleans CT, Kumanyika SK, et al. Considerations for an obesity policy agenda. Am J Prev Med. 2009; 36(4):351–357. https://doi.org/10.1016/j.amepre.2008.11.017. [PubMed: 19211215]
11. Sallis JF, Story M, Lou D. Study design and analytic strategies for environmental and policy research on obesity, physical activity, and diet. Am J Prev Med. 2008; 36(2 suppl):S72–S77. https://doi.org/10.1016/j.amepre.2008.10.006.
12. National Academy of Medicine. Evaluating Obesity Prevention Efforts: A Plan for Measuring Progress. Washington DC: The National Academies Press; 2013.
13. Hunter CM, McKinnon RA, Esposito L. News from the NIH: research to evaluate "natural” experiments related to obesity and diabetes. Trans Behav Med. 2014; 4(2):127–129. https://doi.org/10.1007/s13142-013-0250-z.
14. Strauss WJ, Sroka CJ, Frongillo EA, et al. Statistical design features of the Healthy Communities Study. Am J Prev Med. 2015; 49(4):624–630. https://doi.org/10.1016/j.amepre.2015.06.021. [PubMed: 26384932]
15. John LV, Gregoriou M, Pate RR, et al. Operational implementation of the Healthy Communities Study: How communities shape children’s health. Am J Prev Med. 2015; 49(4):631–635. https://doi.org/10.1016/j.amepre.2015.06.019. [PubMed: 26384933]
16. Fawcett SB, Collie-Akers VL, Schultz JA. Measuring community programs and policies and their intensity in the Healthy Communities Study. Am J Prev Med. 2015; 49(4):636–641. https://doi.org/10.1016/j.amepre.2015.06.027. [PubMed: 26384934]
17. Collie-Akers VL, Fawcett SB, Schultz JA. Measuring progress of collaborative action in a community health effort. Rev Panam Salud Publ. 2013; 34(6):422–428.
18. Sroka CJ, McIver KL, Sagatov RDF, Arteaga SS, Frongillo EA. Weight status measures collected in the Healthy Communities Study: Protocols and analyses. Am J Prev Med. 2015; 49(4):642–646. https://doi.org/10.1016/j.amepre.2015.07.001. [PubMed: 26384935]
19. National Academy of Medicine. Accelerating Progress in Obesity Prevention: Solving the Weight of the Nation. Washington, DC: The National Academies Press; 2012.
20. CDC. National Health and Nutrition Examination Survey (NHANES): Anthropometry Procedures Manual. Washington DC: DHHS; Jan. 2013
21. Ali O, Cerjak D, Kent JW, James R, Blangero J, Zhang Y. Obesity, central adiposity and cardiometabolic risk factors in children and adolescents: a family-based study. Pediatr Obes. 2014; 9(3):e58–e62. https://doi.org/10.1111/j.2047-6310.2014.218.x. [PubMed: 24677702]
22. Ochiai H, Shirasawa T, Nishimura R, et al. Relationship of body mass index to percent body fat and waist circumference among schoolchildren in Japan – the influence of gender and obesity: a population-based cross-sectional study. BMC Public Health. 2010; 10:493. https://doi.org/10.1186/1471-2458-10-493. [PubMed: 20716379]
23. Garnett SP, Baur LA, Srinivasan S, Lee JW, Cowell CT. Body mass index and waist circumference in midchildhood and adverse cardiovascular disease risk clustering in adolescence. Am J Clin Nutr. 2007; 86(3):549–555. [PubMed: 17823416]
24. Freedman DS, Ogden CL, Blanck HM, Borrud LG, Dietz WH. The abilities of body mass index and skinfold thicknesses to identify children with low or elevated levels of dual-energy X-ray absorptiometry determined body fatness. J Pediatr. 2013; 163(1):160–166. https://doi.org/10.1016/j.jpeds.2012.12.093. [PubMed: 23410599]
25. Heo M, Wylie-Rosett J, Pietrobelli A, Kabat GC, Rohan TE, Faith MS. U.S. pediatric population-level associations of DXA-measured percentage of body fat with four BMI metrics with cutoffs. Int J Obes (Lond). 2014; 38(1):60–68. https://doi.org/10.1038/ijo.2013.134. [PubMed: 23887060]
26. Javed A, Jumean M, Murad MH, et al. Diagnostic performance of body mass index to identify obesity as defined by body adiposity in children and adolescents: a systematic review and meta-analysis. Pediatr Obes. 2015; 10(3):234–244. https://doi.org/10.1111/ijpo.242. [PubMed: 24961794]
Frongillo et al. Page 9
Am J Prev Med. Author manuscript; available in PMC 2018 November 01.
Author M
anuscriptA
uthor Manuscript
Author M
anuscriptA
uthor Manuscript

27. Weber DR, Leonard MB, Shults J, Zemel BS. A comparison of fat and lean body mass index to BMI for the identification of metabolic syndrome in children and adolescents. J Clin Endocrinol Metab. 2014; 99(9):3208–3216. https://doi.org/10.1210/jc.2014-1684. [PubMed: 24926951]
28. Tibshirani R. Regression shrinkage and selection via the lasso. J R Stat Soc Series B Stat Methodol. 1996; 58(1):267–288.
29. van Buuren S, Groothuis-Oudshoorn K. mice: Multivariate imputation by chained equations in R. J Stat Software. 2011; 45:3. https://doi.org/10.18637/jss.v045.i03.
30. Wolfenden L, Wyse R, Nichols M, Allender S, Millar L, McElduff P. A systematic review and meta-analysis of whole of community interventions to prevent excessive population weight gain. Prev Med. 2014; 62:193–200. https://doi.org/10.1016/j.ypmed.2014.01.031. [PubMed: 24518005]
31. Sobol-Goldberg S, Rabinowitz J, Gross R. School-based obesity prevention programs: a meta-analysis of randomized controlled trials. Obesity (Silver Spring). 2013; 21(12):2422–2428. https://doi.org/10.1002/oby.20515. [PubMed: 23794226]
32. Vasques C, Magalhães P, Cortinhas A, Mota P, Leitão J, Lopes VP. Effects of intervention programs on child and adolescent BMI: A meta-analysis study. J Phys Act Health. 2014; 11(2):426–444. https://doi.org/10.1123/jpah.2012-0035. [PubMed: 23363556]
33. Shroff M, Jones SJ, Frongillo EA, Howlett M. Policy instruments used by states seeking to improve school food environment. Am J Public Health. 2012; 102(2):222–229. https://doi.org/10.2105/AJPH.2011.300338. [PubMed: 22390436]
34. Fawcett S, Schultz J, Watson-Thompson J, Fox M, Bremby R. Building multisectoral partnerships for population health and health equity. Prev Chronic Dis. 2010; 7(6):A118. [Accessed November 2010] www.cdc.gov/pcd/issues/2010/nov/10_0079.htm. [PubMed: 20950525]
35. Sobal J, Rauschenbach BS, Frongillo EA. Marital status, fatness, and obesity. Soc Sci Med. 1992; 35(7):915–923. https://doi.org/10.1016/0277-9536(92)90106-Z. [PubMed: 1411692]
36. Frongillo EA. Understanding obesity and program participation in the context of poverty and food insecurity. J Nutr. 2003; 133(7):2117–2118. [PubMed: 12840164]
37. Lucas RM, McMichael AJ. Association or causation: evaluating links between “environment and disease”. Bull World Health Organ. 2005; 83(10):792–795. [PubMed: 16283057]
Frongillo et al. Page 10
Am J Prev Med. Author manuscript; available in PMC 2018 November 01.
Author M
anuscriptA
uthor Manuscript
Author M
anuscriptA
uthor Manuscript

Figure 1. Scatter plots of mean BMI versus community policy and program (CPP) target behavior
score for nutrition (left) and CPP target behavior score for physical activity and sedentary
behavior (right) using unadjusted data.
Frongillo et al. Page 11
Am J Prev Med. Author manuscript; available in PMC 2018 November 01.
Author M
anuscriptA
uthor Manuscript
Author M
anuscriptA
uthor Manuscript
Author M
anuscriptA
uthor Manuscript
Author M
anuscriptA
uthor Manuscript
Frongillo et al. Page 12
Table 1
Target Behaviors19 Addressed by Community Policies and Programs, Mean and SD per Community
Target behaviors addressed Mean SD
Physical activity and sedentary behaviors
Increase participation in community-based physical activity lessons, classes, or clubs 20.7 14,2
Increase physical activity in after school programs 20.0 16.1
Increase participation in home/family physical activity 17.6 8.8
Increase participation in community-based sports teams 11.2 13,1
Decrease TV watching 10.9 9.9
Decrease time spent playing inactive video/handheld electronic games 10.8 10.0
Decrease recreational computer/Internet use 10.2 9.5
Increase participation in school sports teams 9.4 7.0
Increase physical activity during school recess or classroom instruction 8.4 5.8
Increase exposure to physical education 5.7 5.8
Increase walking or biking to/from school 4.7 5.1
Increase moderate to vigorous physical activity in PE classes 4.1 3.9
Other 7.2 5.2
Nutrition
Increase consumption of fruits and vegetables 21.7 10.1
Decrease consumption of high-calorie snacks, desserts, sweets, and candy 13.7 7.2
Increase consumption of whole grain foods 12.5 7.3
Decrease consumption of sugar-sweetened beverages 12.0 6.9
Increase consumption of water 9.9 7.3
Decrease consumption of fat 9.2 6.4
Decrease consumption of fast food 8.6 6.4
Increase eating breakfast 6.4 5.3
Decrease calories from all food 5.6 4.3
Increase breastfeeding/improve infant health 1.1 1.5
Other 8.5 8.3
Am J Prev Med. Author manuscript; available in PMC 2018 November 01.

Author M
anuscriptA
uthor Manuscript
Author M
anuscriptA
uthor Manuscript
Frongillo et al. Page 13
Tab
le 2
Ass
ocia
tion
of B
MI
(kg/
m2 )
With
Sta
ndar
dize
d Sc
ores
for
Com
mun
ity P
olic
ies
and
Prog
ram
s (C
PPs)
CP
P in
tens
ity
scor
eC
PP
tar
get
beha
vior
sco
re
Min
imal
lyad
just
eda
Ful
ly a
djus
tedb
Min
imal
lyad
just
eda
Ful
ly a
djus
tedb
Mod
el/Y
ears
βp-
valu
eβ
p-va
lue
βp-
valu
eβ
p-va
lue
All
CPP
s
1 y
ear
−0.
903
0.24
−0.
251
0.64
−0.
801
0.11
−0.
756
0.02
3 y
ears
−0.
903
0.19
−0.
205
0.67
−0.
922
0.07
−0.
843
0.01
6 y
ears
−0.
865
0.19
−0.
133
0.77
−0.
931
0.06
−0.
757
0.02
10
year
s−
0.73
60.
260.
053
0.91
−0.
921
0.07
−0.
637
0.07
Phys
ical
act
ivity
CPP
s
1 y
ear
−0.
907
0.18
−0.
225
0.63
−1.
152
0.07
−0.
968
0.03
3 y
ears
−0.
995
0.13
−0.
236
0.61
−1.
212
0.06
−0.
988
0.02
6 y
ears
−0.
920
0.15
−0.
163
0.72
−1.
324
0.03
−0.
927
0.03
10
year
s−
0.79
20.
230.
013
0.98
−1.
365
0.02
−0.
673
0.09
Nut
ritio
n C
PPs
1 y
ear
−0.
005
0.99
−0.
134
0.76
−0.
594
0.43
−0.
766
0.13
3 y
ears
−0.
048
0.94
−0.
111
0.81
−0.
692
0.35
−0.
827
0.09
6 y
ears
−0.
140
0.84
−0.
141
0.78
−0.
558
0.39
−0.
683
0.12
10
year
s0.
053
0.94
0.03
90.
94−
0.35
50.
52−
0.51
20.
18
Not
e: β
is th
e re
gres
sion
coe
ffic
ient
for
the
stan
dard
ized
CPP
sco
re. B
oldf
ace
indi
cate
s st
atis
tical
sig
nifi
canc
e (p
<0.
05).
a Adj
uste
d fo
r ch
ild h
eigh
t, ch
ild g
ende
r, an
d ch
ild a
ge a
nd a
ge-s
quar
ed.
b Adj
uste
d fo
r ge
ogra
phic
reg
ion,
min
ority
cla
ssif
icat
ion
of th
e ce
nsus
trac
t, ch
ild h
eigh
t, ch
ild g
ende
r, ch
ild a
ge a
nd a
ge-s
quar
ed, c
hild
eth
nici
ty, t
otal
fam
ily in
com
e, f
athe
r’s
educ
atio
n, a
nd m
othe
r’s
empl
oym
ent.
Am J Prev Med. Author manuscript; available in PMC 2018 November 01.

Author M
anuscriptA
uthor Manuscript
Author M
anuscriptA
uthor Manuscript
Frongillo et al. Page 14
Tab
le 3
Ass
ocia
tion
of W
aist
Cir
cum
fere
nce
(cm
) W
ith S
tand
ardi
zed
Scor
es f
or C
omm
unity
Pol
icie
s an
d Pr
ogra
ms
(CPP
s)
CP
P in
tens
ity
scor
eC
PP
tar
get
beha
vior
sco
re
Min
imal
lyad
just
eda
Ful
ly a
djus
tedb
Min
imal
lyad
just
eda
Ful
ly a
djus
tedb
Mod
el/Y
ears
βp-
valu
eβ
p-va
lue
βp-
valu
eβ
p-va
lue
All
CPP
s
1 y
ear
−1.
021
0.59
0.70
70.
55−
1.73
70.
16−
1.54
70.
03
3 y
ears
−1.
218
0.48
0.66
30.
53−
2.01
90.
11−
1.78
30.
02
6 y
ears
−1.
200
0.46
0.74
40.
46−
1.86
30.
14−
1.47
50.
05
10
year
s−
1.09
20.
510.
960
0.34
−2.
140
0.09
−1.
380
0.08
Phys
ical
act
ivity
CPP
s
1 y
ear
−0.
795
0.64
0.67
10.
52−
1.75
80.
28−
1.55
10.
11
3 y
ears
−1.
071
0.52
0.63
80.
54−
1.78
90.
28−
1.57
80.
11
6 y
ears
−0.
958
0.55
0.74
30.
45−
1.74
00.
27−
1.14
40.
23
10
year
s−
0.84
00.
610.
962
0.34
−2.
391
0.10
−0.
847
0.34
Nut
ritio
n C
PPs
1 y
ear
0.32
60.
830.
545
0.51
−2.
299
0.21
−2.
187
0.05
3 y
ears
0.16
00.
920.
669
0.50
−2.
546
0.15
−2.
388
0.02
6 y
ears
−0.
062
0.97
0.62
70.
57−
2.03
40.
21−
2.03
70.
05
10
year
s0.
190
0.92
0.77
00.
51−
1.54
00.
26−
1.69
40.
05
Not
e: β
is th
e re
gres
sion
coe
ffic
ient
for
the
stan
dard
ized
CPP
sco
re. B
oldf
ace
indi
cate
s st
atis
tical
sig
nifi
canc
e (p
<0.
05).
a Adj
uste
d fo
r ch
ild h
eigh
t, ch
ild g
ende
r, an
d ch
ild a
ge a
nd a
ge-s
quar
ed.
b Adj
uste
d fo
r ge
ogra
phic
reg
ion,
min
ority
cla
ssif
icat
ion
of th
e ce
nsus
trac
t, ch
ild h
eigh
t, ch
ild g
ende
r, ch
ild a
ge a
nd a
ge-s
quar
ed, c
hild
eth
nici
ty, t
otal
fam
ily in
com
e, f
athe
r’s
educ
atio
n, a
nd m
othe
r’s
empl
oym
ent.
Am J Prev Med. Author manuscript; available in PMC 2018 November 01.