Embed Size (px)
Citation preview
1
COMMUNITY NEEDS ASSESSMENT REPORT
CENTRE FOR COMMUNITY LEARNING
AND DEVELOPMENT
BY: RAJARUBENI AHILAN MARCH, 2012
IMMIGRANT WOMEN INTEGRATION
PROGRAM 2011-2012
2
NEEDS ASSESSMENT REPORT COMMUNITY WELL BEING
2011
CENTRE FOR COMMUNITY LEARNING AND DEVELOPMENT
IMMIGRANT WOMEN INTEGRATION PROGRAM RAJARUBENI AHILAN
EGLINGTON EAST - KENNEDY PARK NEIGHBOURHOOD
3
Acknowledgement I would like to extend my sincere thanks to Centre for Community Learning and Development (CCL&D) for taking me through this amazing learning process. I’m heartily thankful to Alfred Jean -Baptiste, Executive Director of CCL&D, whose encouragement, guidance and support from the start to the end of the project enabled me to develop an understanding of, designing and conducting the survey.
I would like to thank Maria Navarro, Deputy Executive Director of CCL&D and Caroline Outten, Manager-Training Resources and Program Development, for their valuable guidance, knowledge, skills and encouragement.
I would like to thank Rihab, Olga, the community engagement worker and the other staff members of the Centre for Community Learning and Development who gave me vital encouragement and support during the survey. I would like to thank Behiwot Degefu who did the editing and for the feedback.
I acknowledge the support that I have received from the residents of 709,711,720, Kennedy Road, South Asian community and other residents and small businesses located on Eglinton East and Kennedy Park.
I also would like to acknowledge and extend my heartfelt appreciation to the Community, Settlement Agencies and Service Providers. The following staff members who have supported the completion of this needs assessment report: my sincerest thanks to Mrs. Pranoti Menon (Settlement worker ,Catholic Cross-cultural Services), Mrs.Shijamala (Councillor, Policultural Services), Ms. Mona Yousefi (Community Engagement Worker, ANC) Ms.Yoga Arulsubramaniam (Job Facilitator, TESOC Multi Cultural Settlement Services), Ms.Thilga Jeganathan (Settlement Coordinator/Counsellor, Canadian Centre For Victims Of Torture), Ms. Mona Yousefi (Community Engagement Worker, ANC) Ms. Jesmin Habib ( Supervisor, Ontario Early Years Centre, Scarborough Southwest) for connecting me with the Multi-Cultural Community for their assistance in leading ways to meeting with people from different background.
4
TABLE OF CONTENTS
ACQKNOWLEDGEMENTS
CHAPTER 01: INTRODUCTION--------------------------------------------------------------7
1.1 Community profile
1.2 History
CHAPTER: 02: EXCUTIVE SUMMARY --------------------------------------------------- 12
CHAPTER: 03: COMMUNITY NEEDS ASSESSMENT AND SURVEY -------------14
3.1.1 Objectives:
3.2.2 Methodology
3.3.3 Personal Observation
CHAPTER: 04: SURVEY FINDINGS--------------------------------------------------------- 18
4.1) Demographic information
4.1.1Age group
4.1.2 Highest level of Schooling
4.1.3 How are you engaged day-to-day?
4.2) Marital Status
4.2.1 Marital status
4.2.2 People in your house hold
4.2.3 Children living at home
4.2.4 Civic/immigration status
4.2.5 Length of time in Canada
4.3) Self-identity
4.3.1 Self-identity (Race/Ethnicity/Country/Region/Origin)

5
4.3.2 Self-identity (Gender-Male/Female)
4.4) Living Standards
4.4.1 House hold income
4.4.2 Financial Situation
4.4.3 Most Important financial problem
4.5) Basic Needs
4.5.1 Housing
4.5.2 Satisfaction with Accommodation
5.3 Amount your spend on Housing
6.1 Enough money to buy food
7) SUPPORT SERVICES
7.1 Use of Support Services
7.2 Day-To-day involvement
7.3 Schooling required
8) LOOKING FOR WORK /NUMBER OF JOBS
8.1 Number of jobs
8.2 Program needed
8.2.1 Job Development
8.2.2 tutoring Program
9) HEALTH STATUS
9.1health condition
10) DEMOCRATIC ENGAGEMENT

6
CHAPTER 05 -------------------------------------------------------- 32
5.1. Key informant interviews
5.2. Theory of change
5.3. Recommendation
5.4. Conclusion
REFERENCE ---------------------------------------------------------------40
APPENDIX I --------------------------------------------------------------- 41
APPENDIX II-------------------------------------------------------------- 47
7
CHAPTER – 1
1. COMMUNITY PROFILE
1.1 History
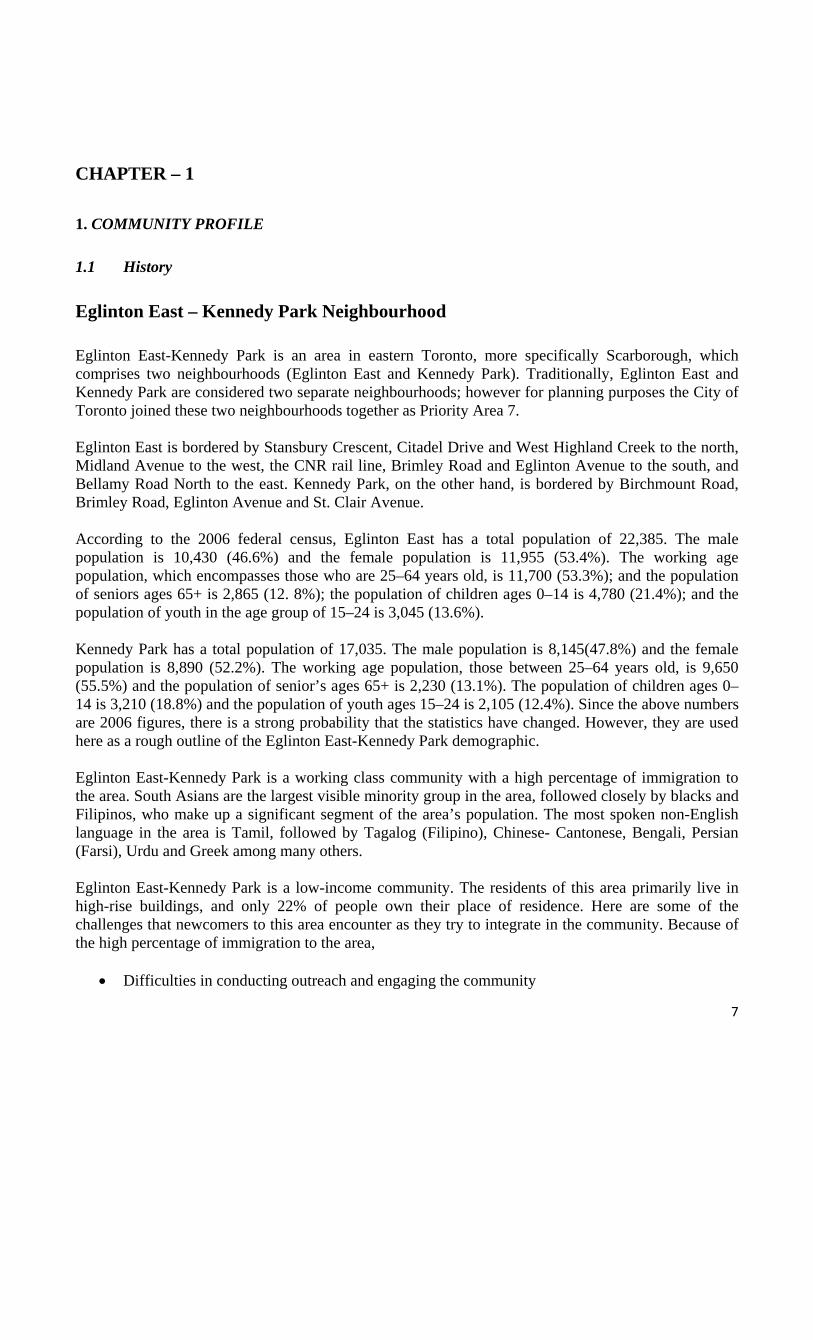
Eglinton East – Kennedy Park Neighbourhood Eglinton East-Kennedy Park is an area in eastern Toronto, more specifically Scarborough, which comprises two neighbourhoods (Eglinton East and Kennedy Park). Traditionally, Eglinton East and Kennedy Park are considered two separate neighbourhoods; however for planning purposes the City of Toronto joined these two neighbourhoods together as Priority Area 7. Eglinton East is bordered by Stansbury Crescent, Citadel Drive and West Highland Creek to the north, Midland Avenue to the west, the CNR rail line, Brimley Road and Eglinton Avenue to the south, and Bellamy Road North to the east. Kennedy Park, on the other hand, is bordered by Birchmount Road, Brimley Road, Eglinton Avenue and St. Clair Avenue. According to the 2006 federal census, Eglinton East has a total population of 22,385. The male population is 10,430 (46.6%) and the female population is 11,955 (53.4%). The working age population, which encompasses those who are 25–64 years old, is 11,700 (53.3%); and the population of seniors ages 65+ is 2,865 (12. 8%); the population of children ages 0–14 is 4,780 (21.4%); and the population of youth in the age group of 15–24 is 3,045 (13.6%). Kennedy Park has a total population of 17,035. The male population is 8,145(47.8%) and the female population is 8,890 (52.2%). The working age population, those between 25–64 years old, is 9,650 (55.5%) and the population of senior’s ages 65+ is 2,230 (13.1%). The population of children ages 0–14 is 3,210 (18.8%) and the population of youth ages 15–24 is 2,105 (12.4%). Since the above numbers are 2006 figures, there is a strong probability that the statistics have changed. However, they are used here as a rough outline of the Eglinton East-Kennedy Park demographic. Eglinton East-Kennedy Park is a working class community with a high percentage of immigration to the area. South Asians are the largest visible minority group in the area, followed closely by blacks and Filipinos, who make up a significant segment of the area’s population. The most spoken non-English language in the area is Tamil, followed by Tagalog (Filipino), Chinese- Cantonese, Bengali, Persian (Farsi), Urdu and Greek among many others. Eglinton East-Kennedy Park is a low-income community. The residents of this area primarily live in high-rise buildings, and only 22% of people own their place of residence. Here are some of the challenges that newcomers to this area encounter as they try to integrate in the community. Because of the high percentage of immigration to the area,
Difficulties in conducting outreach and engaging the community
8
Lack of meaningful collaboration and coordination of services Inadequate infrastructure Changes in the economy Language barriers Lack of adequate service/program funding Managing clients’ expectations.
According to Census (2006), 211toronto.ca & City of Toronto, Eglinton East-Kennedy Park Priority Area Profile includes: Eglinton East-Kennedy Park has a myriad of newcomer service providers who provide a range of services (e.g., employment bridging programs, language programs, housing and family counselling services). Appendix 1 provides a list of some of the service providers who operate in the Eglinton East-Kennedy Park area. 1.2. Community Profile & Demographics Eglinton East has a total population of 22,385 Kennedy Park has a total population of 17,035.
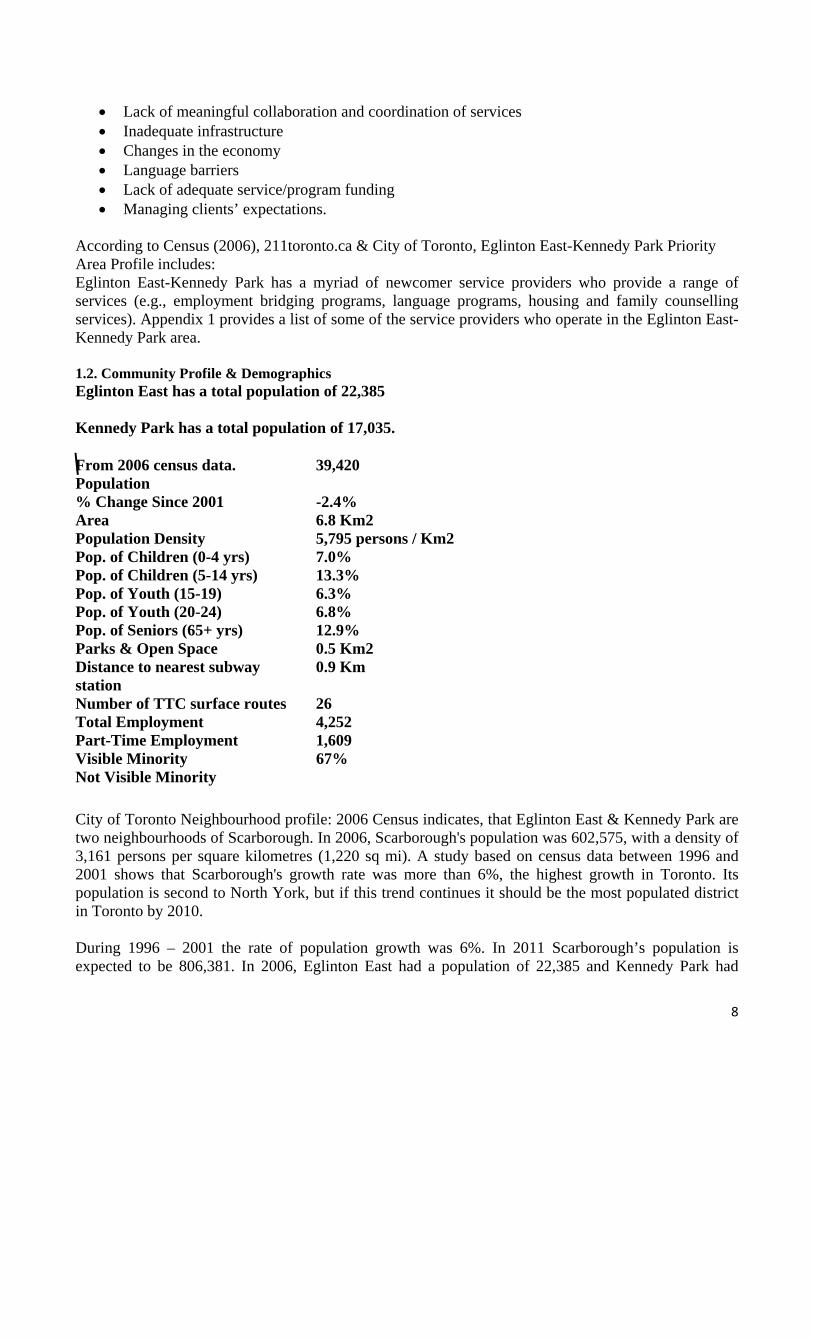
City of Toronto Neighbourhood profile: 2006 Census indicates, that Eglinton East & Kennedy Park are two neighbourhoods of Scarborough. In 2006, Scarborough's population was 602,575, with a density of 3,161 persons per square kilometres (1,220 sq mi). A study based on census data between 1996 and 2001 shows that Scarborough's growth rate was more than 6%, the highest growth in Toronto. Its population is second to North York, but if this trend continues it should be the most populated district in Toronto by 2010. During 1996 – 2001 the rate of population growth was 6%. In 2011 Scarborough’s population is expected to be 806,381. In 2006, Eglinton East had a population of 22,385 and Kennedy Park had
From 2006 census data. Population
39,420
% Change Since 2001 -2.4% Area 6.8 Km2 Population Density 5,795 persons / Km2 Pop. of Children (0-4 yrs) 7.0% Pop. of Children (5-14 yrs) 13.3% Pop. of Youth (15-19) 6.3% Pop. of Youth (20-24) 6.8% Pop. of Seniors (65+ yrs) 12.9% Parks & Open Space 0.5 Km2 Distance to nearest subway station
0.9 Km
Number of TTC surface routes 26 Total Employment 4,252 Part-Time Employment 1,609 Visible Minority 67% Not Visible Minority
9
17,035, a total of 39420. On the same ratio, the population of Eglinton East and Kennedy Park is expected to have grown to 52,754. Like Scarborough, a significant portion of my surveyed neighbourhood’s population is composed of:
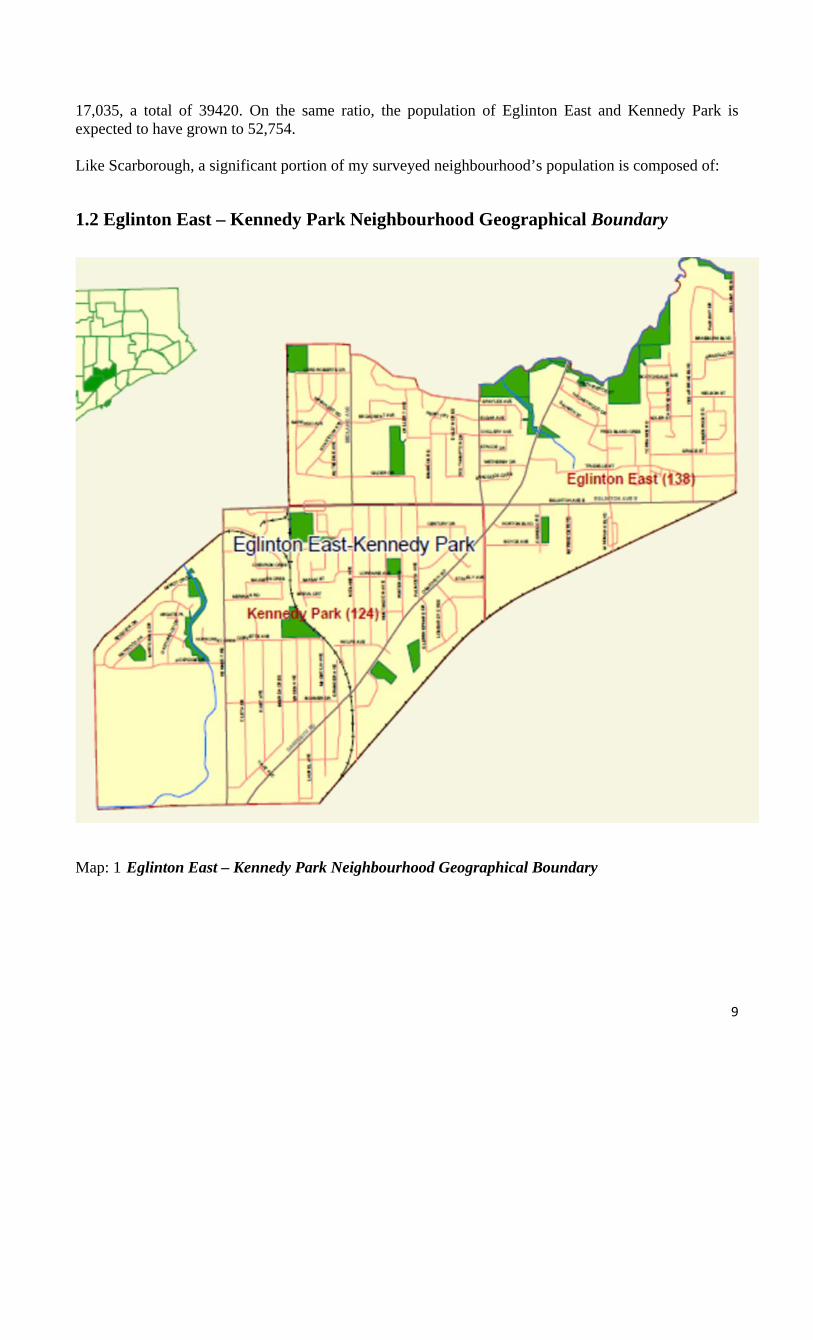
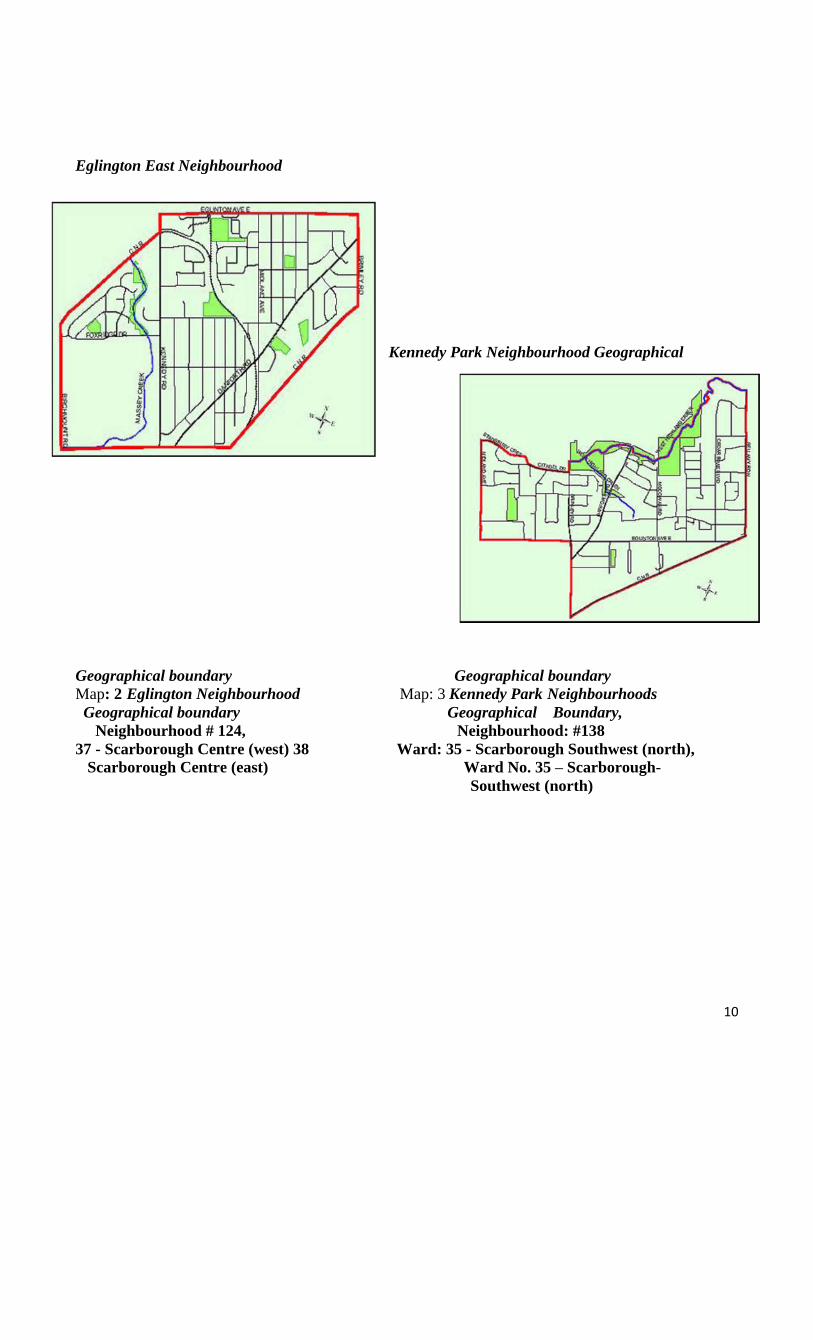
1.2 Eglinton East – Kennedy Park Neighbourhood Geographical Boundary
Map: 1 Eglinton East – Kennedy Park Neighbourhood Geographical Boundary
10
Eglington East Neighbourhood
Kennedy Park Neighbourhood Geographical
Geographical boundary Geographical boundary Map: 2 Eglington Neighbourhood Map: 3 Kennedy Park Neighbourhoods Geographical boundary Geographical Boundary, Neighbourhood # 124, Neighbourhood: #138 37 - Scarborough Centre (west) 38 Ward: 35 - Scarborough Southwest (north), Scarborough Centre (east) Ward No. 35 – Scarborough- Southwest (north)
11
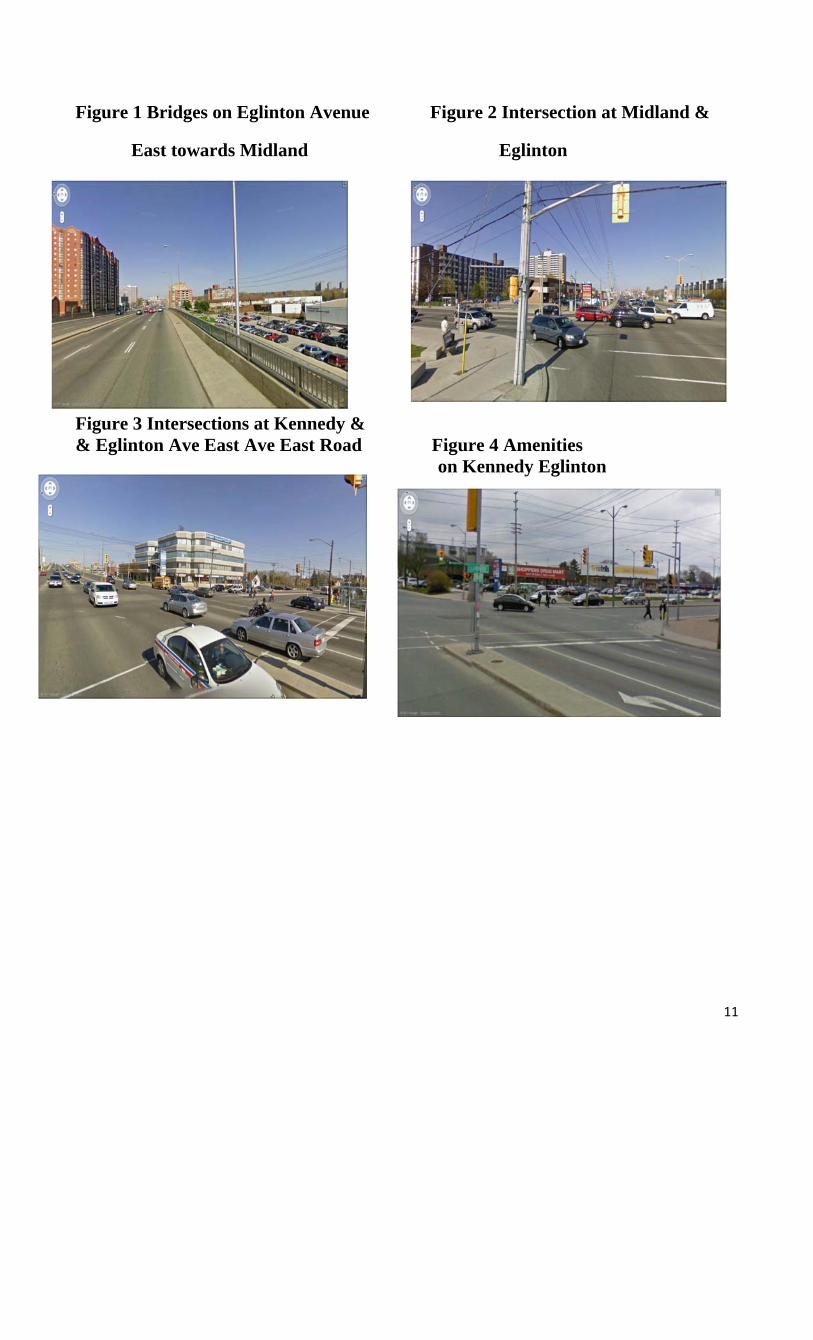
Figure 1 Bridges on Eglinton Avenue Figure 2 Intersection at Midland &
East towards Midland Eglinton
Figure 3 Intersections at Kennedy & & Eglinton Ave East Ave East Road Figure 4 Amenities
on Kennedy Eglinton
12
12
CHAPTER – 2
2. Executive Summary The survey covered Eglinton East - Kennedy Park neighbourhoods – neighbourhood # 124 and 138. The purpose of the survey was to have a deeper understanding of and assess the community needs of surveyed neighbourhoods and to measure the index of well-being. The survey covered the immigrants, both citizens and permanent residents, from various parts. 76.93% respondents do not depend on any support services like food bank, social assistance, subsidised housing, employment insurance, etc. But 33% of the respondents are dissatisfied with their standard of living. High concentration: in day-to-day engagement like employment outside the community and unpaid work at home. Others are volunteering, students, locally employed, and staff of community agency. 24% respondents are employed full time, and 24% are unpaid working at home, 16% work part time. Most employed respondents feel that their jobs required lower level of education and experience compared to theirs. 36% are looking for work and feel that it isn’t easy to find a job, especially in line with their expertise. Respondents stress in life is high: 53% faced various problems. Stress factors are Job loss, job change, thought of losing job, illness or death in the family and friends are identified to be the major factors of potential stress. 64% respondents have worries or stress at various levels, mothers are not educated enough to overcome their language and cultural barriers. For example: Parent Teacher meeting at school; sometimes there is no translator in Schools. Loneliness, depression, lack of Canadian experience, gap between the parents and their children are the contributing factors to deteriorating mental health with in the neighbourhood. Availability of information about social services is inadequate in their community, and it is harder for certain groups in their communities to get access to the services they need. Respondents have experienced discrimination or harassment mainly at school, workplace, in the neighbourhood and at public places. In prohibited grounds, level of discriminations were high in race, place of origin and in low percentage in ethnic origin, citizenship, sexual orientation, sex, marital status, family status, age and receipt of public assistance. Respondents’ level of satisfaction with the community is low and the sense of belonging is weak. It is indicated that 15% very strong and 59% somewhat strong. Accessibility of homework assistance / tutoring programs is low. There were high level of negative response, both in terms of availability and accessibility, with regard to drop-in youth centre, mentoring programs, peer listeners, parental involvement and youth-led programs. There were also high levels of positive response regarding to availability of relevant information and volunteering. All the listed programs for youth are highly needed.
13
13
These are challenges that service providers encounter as they deliver services to Newcomers, including the following:
Difficulties in conducting outreach and engaging the community Lack of meaningful collaboration and coordination of services Inadequate infrastructure Changes in the economy Language barriers Lack of adequate service/program funding Managing clients’ expectations. Barriers/Challenges to Accessing Services
According to serving youth better organization, Eglington east-Kennedy Park Local Immigration: These are the challenges that clients encounter as they try to access services and resources in the community: • Child minding and transportation services are not provided during service delivery • Service eligibility criteria lead to many clients not being eligible for services • Culture shock and cultural context issues related to business and employment • Credential assessment is expensive and time-consuming • Lack of early reliable settlement information and orientation, leading to the right services not being accessed at the right time • Some of the concepts used during service delivery are foreign to clients (e.g., volunteering) • Lack of knowledge and awareness of the services, leading to confusion regarding where to go for particular settlement assistance • Lack of resources (money), leading many newcomers to take whatever job comes along and then “getting stuck” in these survival jobs
14
14
CHAPTER- 3 EGLINGTON EAST - KENNEDY PARK NEIGHBOURHOOD 3.0 Community Needs Assessment - Survey 3.1. Objectives: The objectives of this Community Needs Assessment 2011Survey are: To measure the index of well-being at community level
To find out how community services and life conditions impact the residents’ perception of
well-being To provide information and guidance to government and non-government service organizations
to develop appropriate programs in order to promote community well-being
The objectives of conducting the Community Needs Assessment and the survey for the Priority Area No.7 Eglinton East-Kennedy Park were to get to know the community, identify its needs and understand why it is included as one of the City’s Priority Neighborhood. It was an amazing and reflective experience.
The City of Toronto Neighborhood Profile indicates that due to the low income and the lack of social infrastructure, Eglinton East-Kennedy Park has been included as one of the priority communities. The low-income populations are affected. They cannot grow in the same condition that this city is growing. There is big gap between rich and poor and this lead to major social problems.
The social infrastructure determines the inaccessibility of the social services provided in this specific area, because the Community Centers, Libraries, Social Programs, Food Banks, Shopping Centers, Bank Services, Employment Programs are not in close proximity that allowed to have Strong neighborhood.
The social infrastructure must meet not only the broad needs of the general population, but also the specific needs of the diverse and very vulnerable groups. In comparison to the rest of the Greater Toronto Area (GTA), Toronto is home to a significantly higher proportion of vulnerable groups that rely on its social infrastructure.
15
15
3.2. Methodology
Data from several sources were used for this report.
The methods used in collecting survey data were: community residents were individually interview, focus groups, by phone, by email, by online, and interview with the key informant that played an important part in gathering information.
City of Toronto’s census reports 2006
Statistic Canada, Census report 2011
Canadian Index of well-being report – University of Waterloo Report on Eglinton East (Neighbourhood 138) and Kennedy Park (Neighbourhood 124) by
Social Policy Eglington East-Kennedy Park,Local Immigration Partnership – Local Settlement Strategy
Report- 2011 Analysis & Research Section in the Social Development, Finance and Administration Division
of City of Toronto. Wikipedia database on Scarborough
Surveys were conducted to collect data about accessibility to social services and facilities in the Eglington east - Kennedy Park. For example: community centres, service providing agencies and religious centres, schools, libraries, shopping centres and plazas, and neighbourhood grocery outlets. The survey findings was analysed and the report was prepared with a focus on community needs and to identify possible solutions to develop the community’s well-being. 3.2.1 Survey time line Prior to beginning survey with our group, CCL&D executive director held a training session with all students to explain and agree upon the survey goals, procedures, calendar of activities, and the schedule for the interviews. Information regarding the survey was posted on http://capacity-builders.org/ciw/iwip2011-12.asp.
The formal survey assessment process with each neighbourhood began when CCL&D’s survey Team:
o Prepare materials for their review o Prepare questionnaire o Prepare leaflet with online information o CCL&D designed and administered an online survey. The online survey consisted of 42
questions Total numbers of respondents for EGLINGTON EAST – KENEDY PARK, SURVEY were 65 people.
16
16
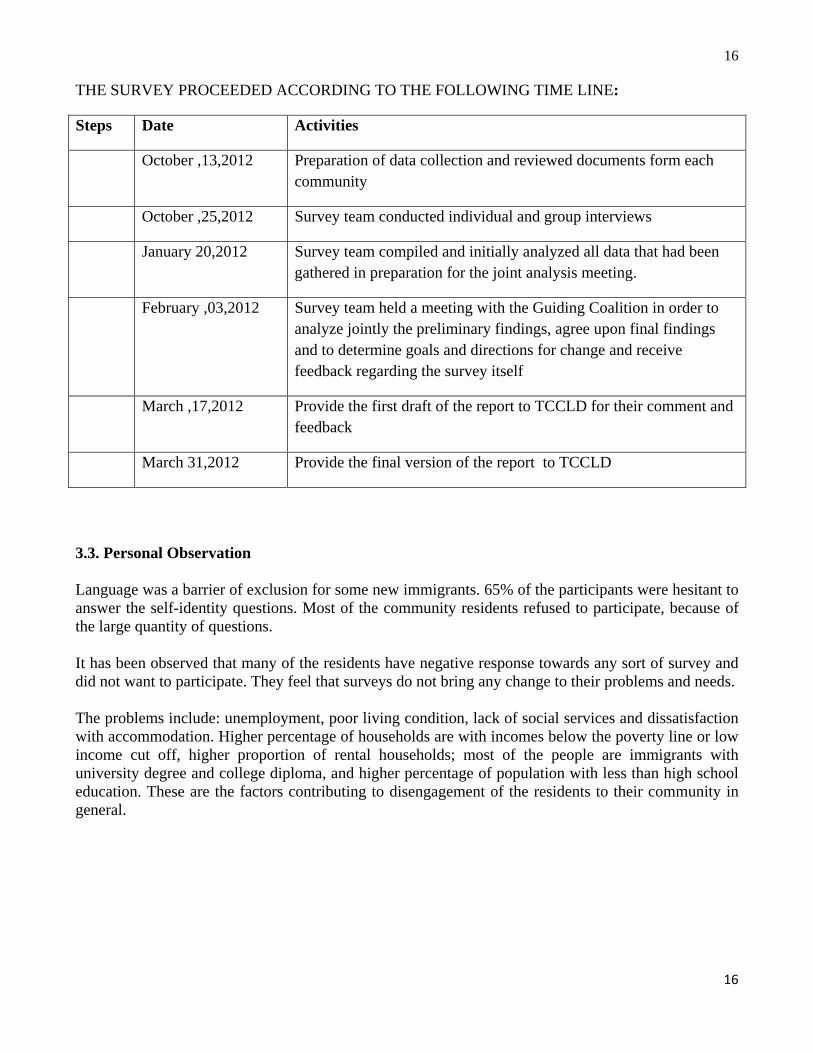
THE SURVEY PROCEEDED ACCORDING TO THE FOLLOWING TIME LINE:
Steps Date Activities
October ,13,2012 Preparation of data collection and reviewed documents form each community
October ,25,2012 Survey team conducted individual and group interviews
January 20,2012 Survey team compiled and initially analyzed all data that had been gathered in preparation for the joint analysis meeting.
February ,03,2012 Survey team held a meeting with the Guiding Coalition in order to analyze jointly the preliminary findings, agree upon final findings and to determine goals and directions for change and receive feedback regarding the survey itself
March ,17,2012 Provide the first draft of the report to TCCLD for their comment and feedback
March 31,2012 Provide the final version of the report to TCCLD
3.3. Personal Observation Language was a barrier of exclusion for some new immigrants. 65% of the participants were hesitant to answer the self-identity questions. Most of the community residents refused to participate, because of the large quantity of questions. It has been observed that many of the residents have negative response towards any sort of survey and did not want to participate. They feel that surveys do not bring any change to their problems and needs. The problems include: unemployment, poor living condition, lack of social services and dissatisfaction with accommodation. Higher percentage of households are with incomes below the poverty line or low income cut off, higher proportion of rental households; most of the people are immigrants with university degree and college diploma, and higher percentage of population with less than high school education. These are the factors contributing to disengagement of the residents to their community in general.
17
17
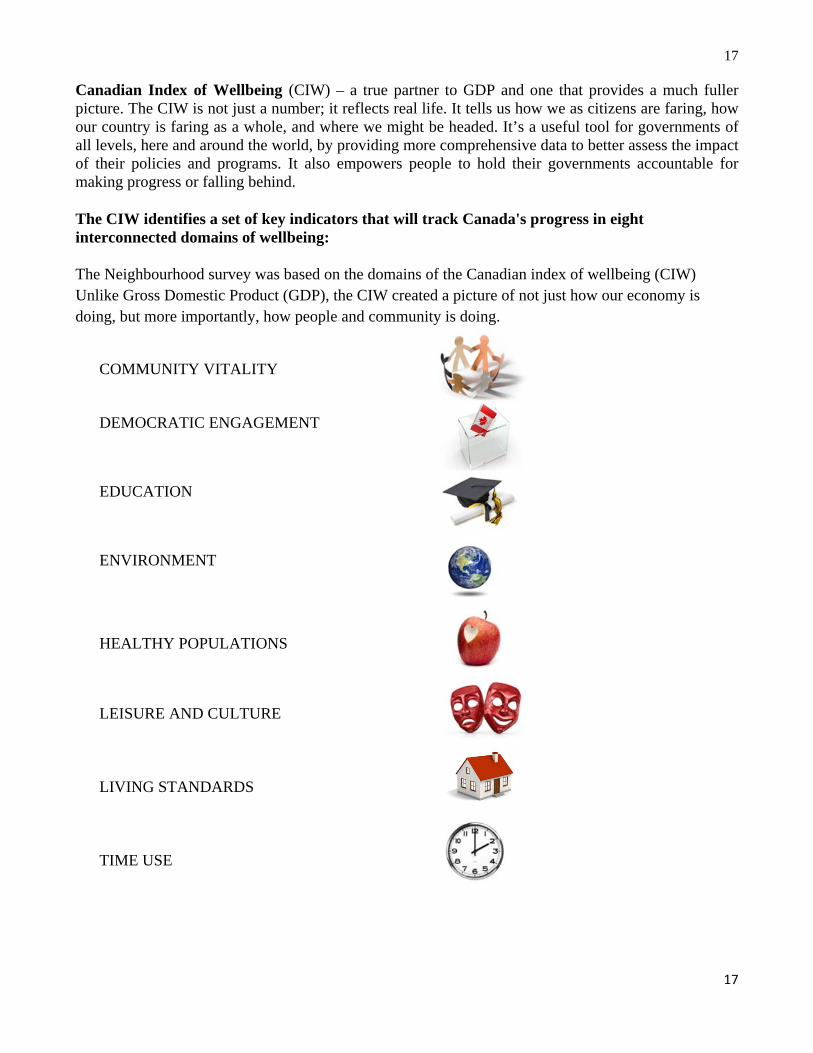
Canadian Index of Wellbeing (CIW) – a true partner to GDP and one that provides a much fuller picture. The CIW is not just a number; it reflects real life. It tells us how we as citizens are faring, how our country is faring as a whole, and where we might be headed. It’s a useful tool for governments of all levels, here and around the world, by providing more comprehensive data to better assess the impact of their policies and programs. It also empowers people to hold their governments accountable for making progress or falling behind.
The CIW identifies a set of key indicators that will track Canada's progress in eight interconnected domains of wellbeing:
The Neighbourhood survey was based on the domains of the Canadian index of wellbeing (CIW) Unlike Gross Domestic Product (GDP), the CIW created a picture of not just how our economy is doing, but more importantly, how people and community is doing.
COMMUNITY VITALITY
DEMOCRATIC ENGAGEMENT
EDUCATION
ENVIRONMENT
HEALTHY POPULATIONS
LEISURE AND CULTURE
LIVING STANDARDS TIME USE
18
18
CHAPTER- 4 EGLINGTON EAST - KENNEDY PARK NEIGHBOURHOOD 4.0 Community Needs Assessment – Survey Findings 4.1 DEMOGRAPHIC INFORMATION
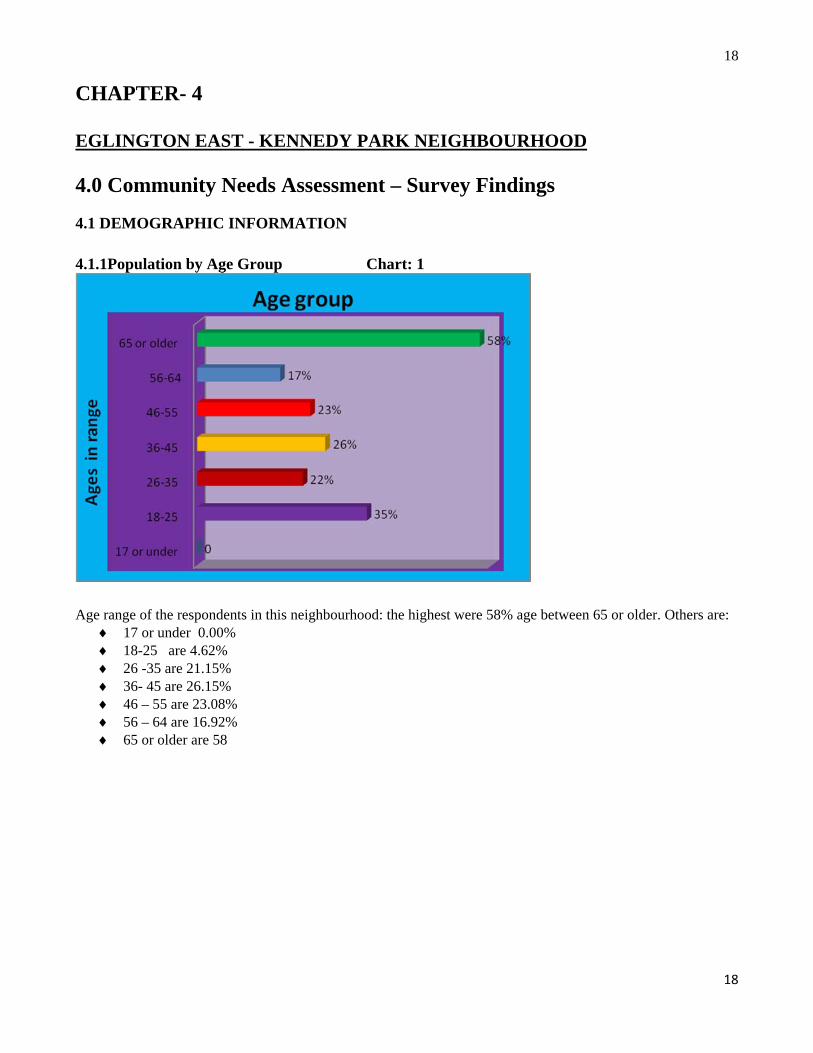
4.1.1Population by Age Group Chart: 1
Age range of the respondents in this neighbourhood: the highest were 58% age between 65 or older. Others are: 17 or under 0.00% 18-25 are 4.62% 26 -35 are 21.15% 36- 45 are 26.15% 46 – 55 are 23.08% 56 – 64 are 16.92% 65 or older are 58
19
19
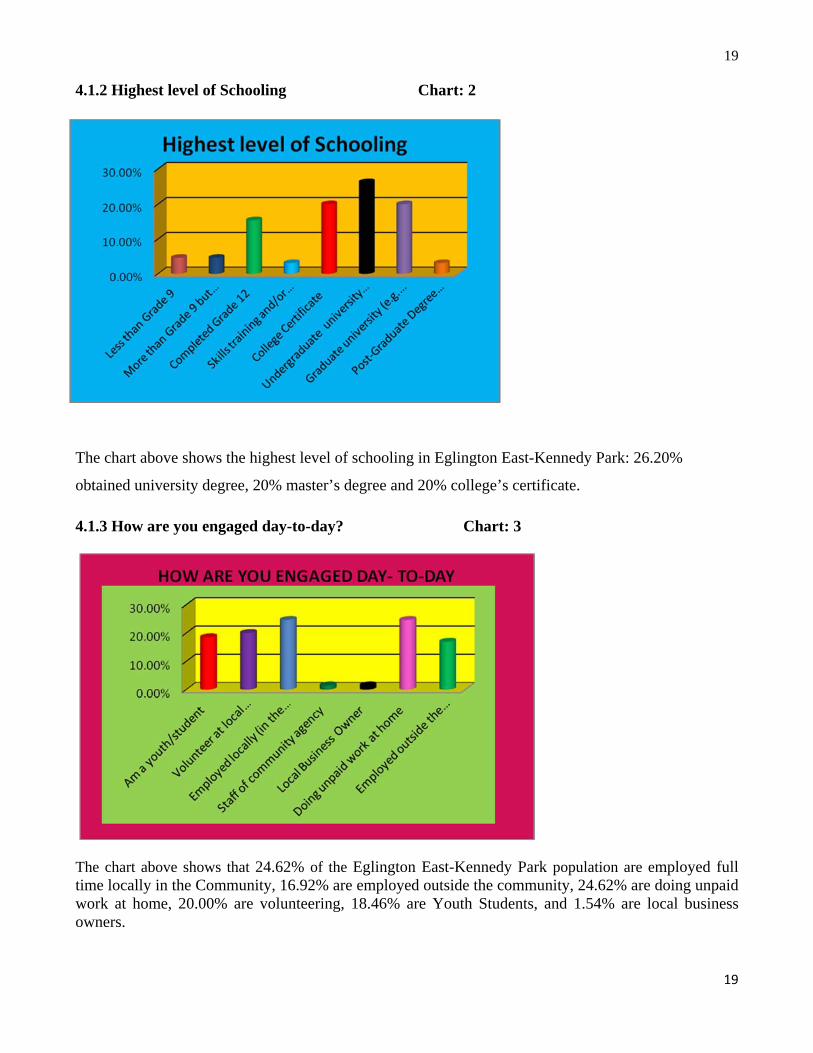
4.1.2 Highest level of Schooling Chart: 2
The chart above shows the highest level of schooling in Eglington East-Kennedy Park: 26.20%
obtained university degree, 20% master’s degree and 20% college’s certificate.
4.1.3 How are you engaged day-to-day? Chart: 3
The chart above shows that 24.62% of the Eglington East-Kennedy Park population are employed full time locally in the Community, 16.92% are employed outside the community, 24.62% are doing unpaid work at home, 20.00% are volunteering, 18.46% are Youth Students, and 1.54% are local business owners.
20
20
4.2 MARITAL STATUS
4.2.1 Marital Status
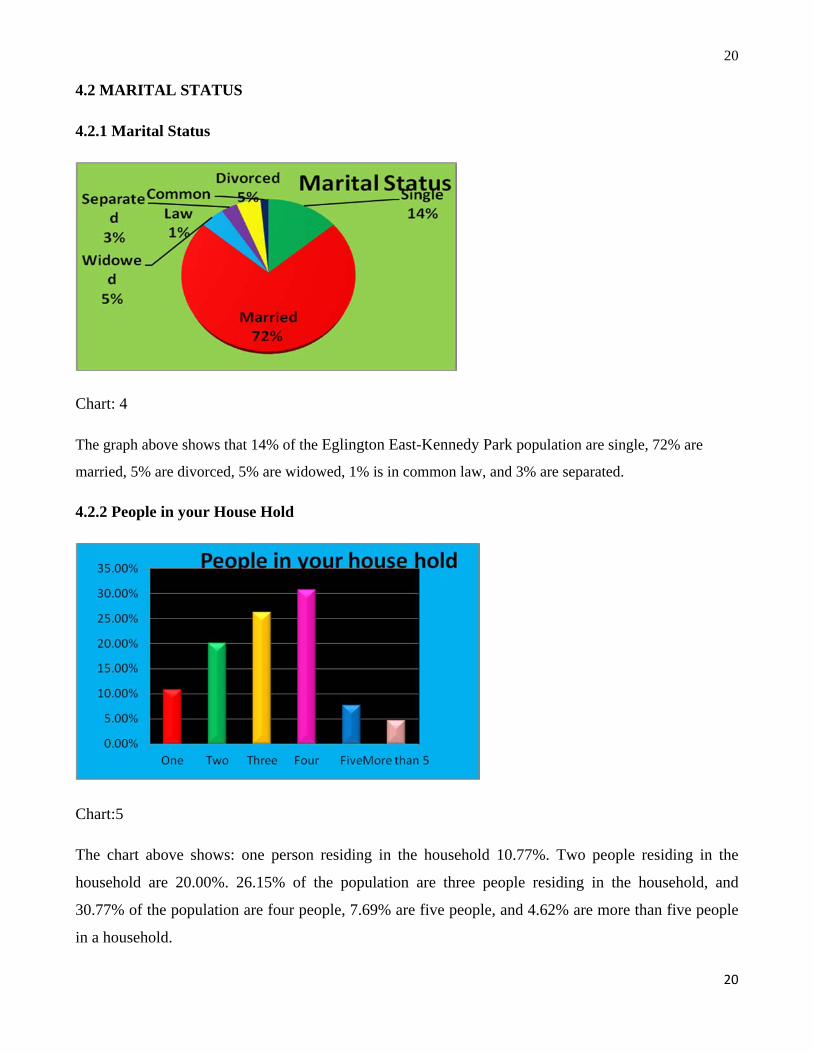
Chart: 4
The graph above shows that 14% of the Eglington East-Kennedy Park population are single, 72% are
married, 5% are divorced, 5% are widowed, 1% is in common law, and 3% are separated.
4.2.2 People in your House Hold
Chart:5
The chart above shows: one person residing in the household 10.77%. Two people residing in the
household are 20.00%. 26.15% of the population are three people residing in the household, and
30.77% of the population are four people, 7.69% are five people, and 4.62% are more than five people
in a household.
21
21
4.2.3 Children living at home
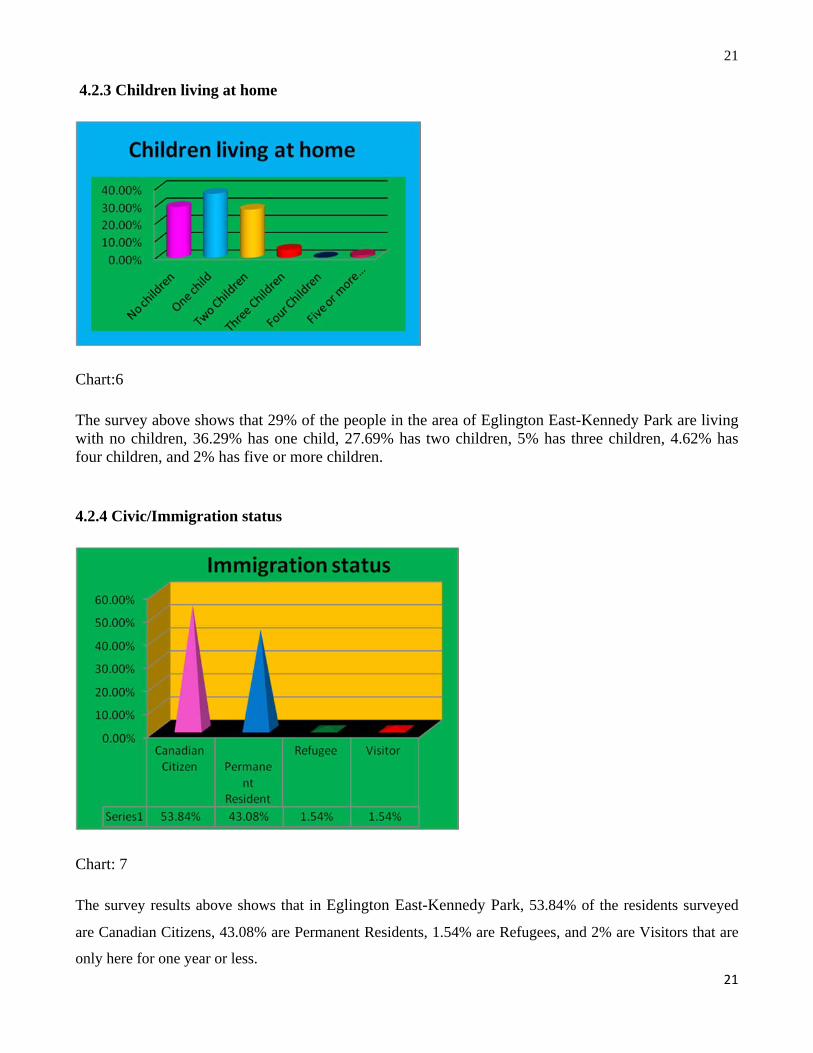
Chart:6
The survey above shows that 29% of the people in the area of Eglington East-Kennedy Park are living with no children, 36.29% has one child, 27.69% has two children, 5% has three children, 4.62% has four children, and 2% has five or more children.
4.2.4 Civic/Immigration status
Chart: 7
The survey results above shows that in Eglington East-Kennedy Park, 53.84% of the residents surveyed
are Canadian Citizens, 43.08% are Permanent Residents, 1.54% are Refugees, and 2% are Visitors that are
only here for one year or less.
22
22
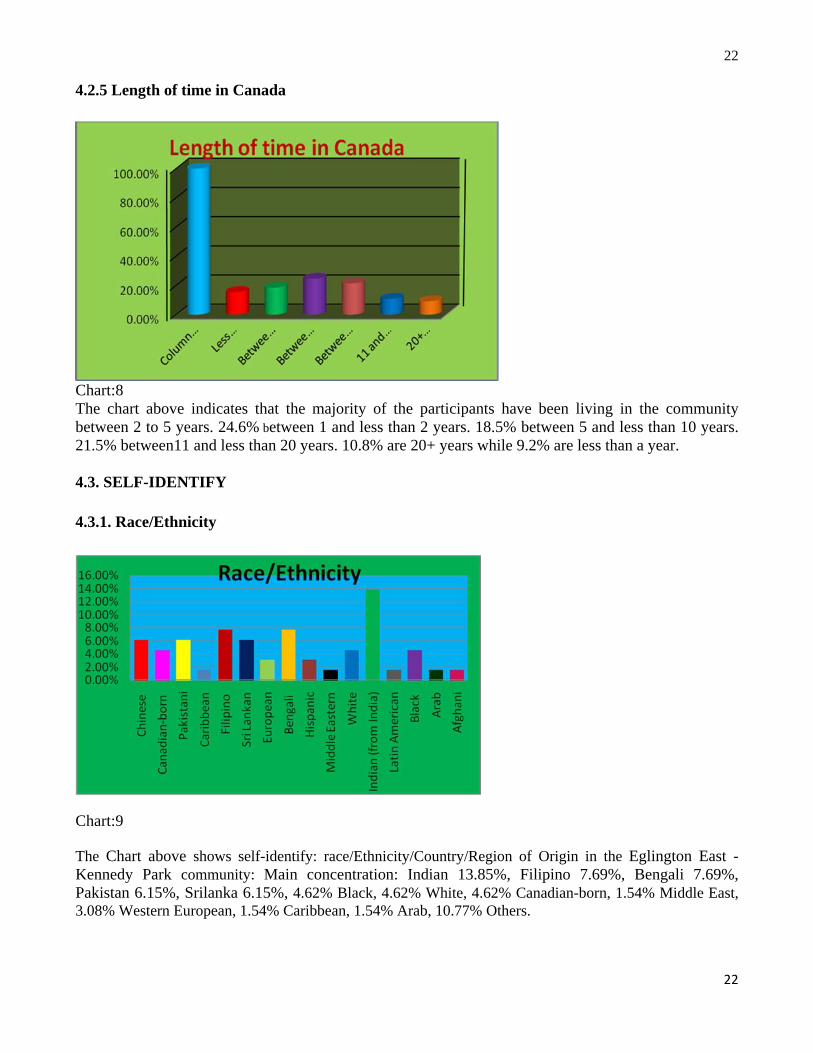
4.2.5 Length of time in Canada
Chart:8 The chart above indicates that the majority of the participants have been living in the community between 2 to 5 years. 24.6% between 1 and less than 2 years. 18.5% between 5 and less than 10 years. 21.5% between11 and less than 20 years. 10.8% are 20+ years while 9.2% are less than a year. 4.3. SELF-IDENTIFY
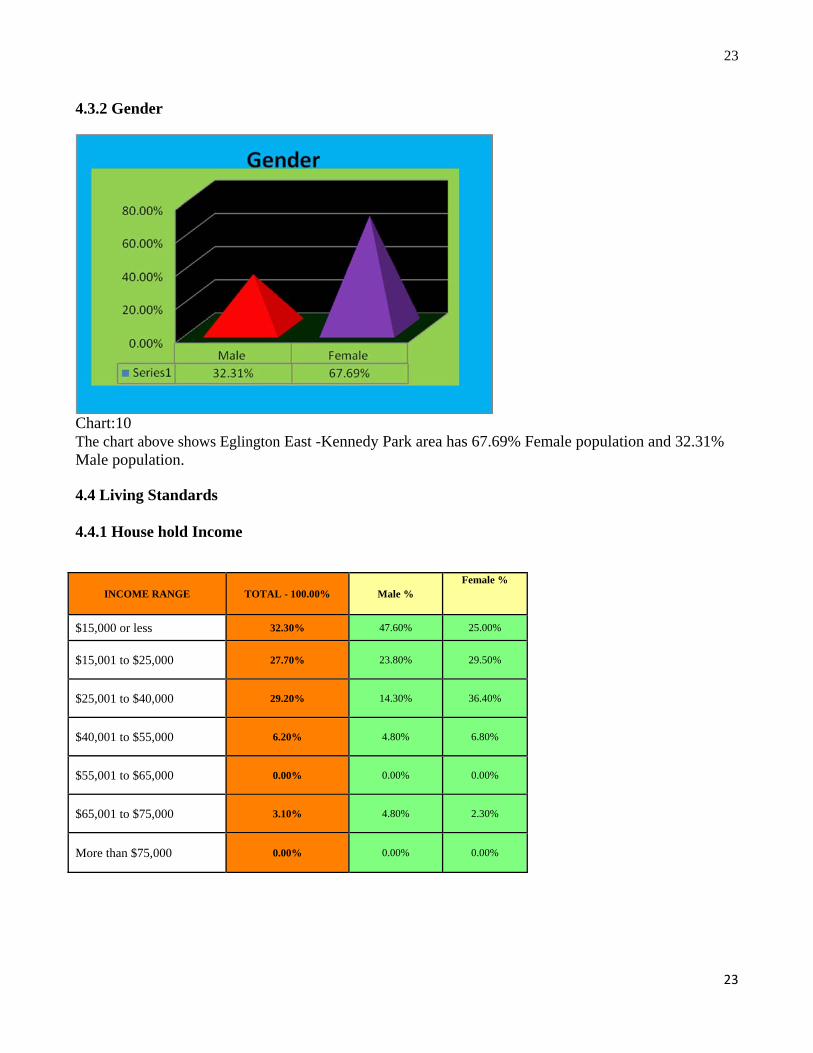
4.3.1. Race/Ethnicity
Chart:9 The Chart above shows self-identify: race/Ethnicity/Country/Region of Origin in the Eglington East -Kennedy Park community: Main concentration: Indian 13.85%, Filipino 7.69%, Bengali 7.69%, Pakistan 6.15%, Srilanka 6.15%, 4.62% Black, 4.62% White, 4.62% Canadian-born, 1.54% Middle East, 3.08% Western European, 1.54% Caribbean, 1.54% Arab, 10.77% Others.
23
23
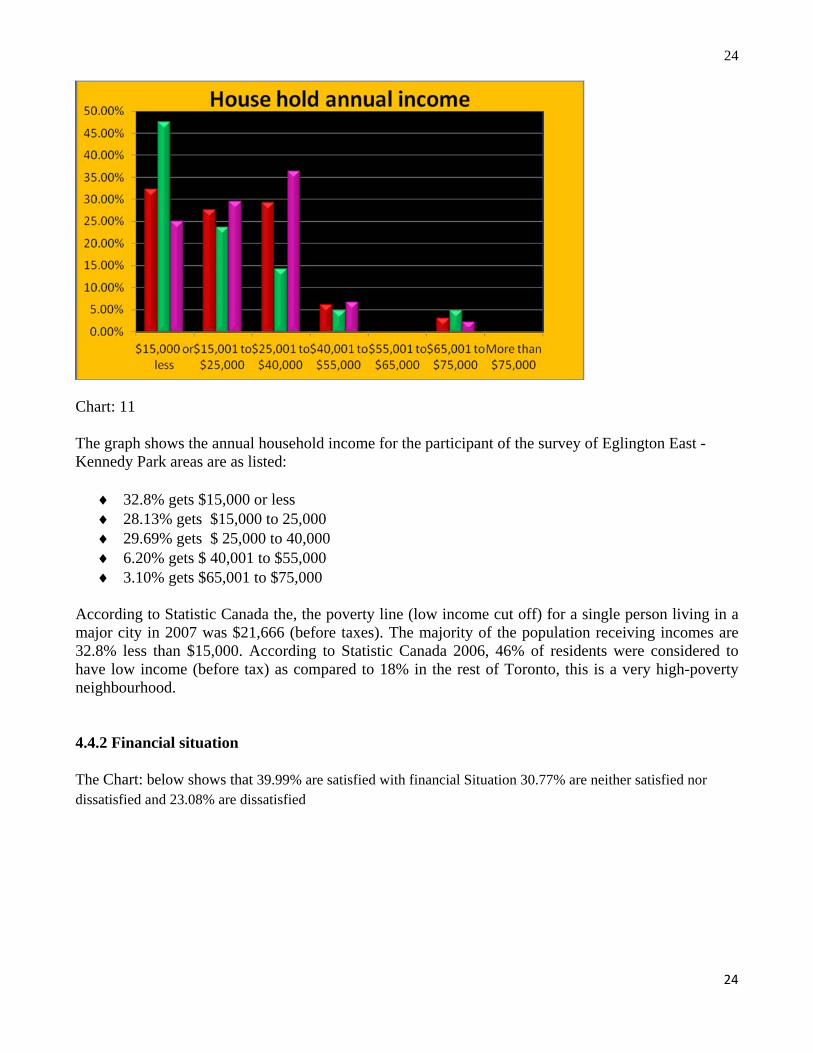
4.3.2 Gender
Chart:10 The chart above shows Eglington East -Kennedy Park area has 67.69% Female population and 32.31% Male population. 4.4 Living Standards 4.4.1 House hold Income
INCOME RANGE TOTAL - 100.00% Male % Female %
$15,000 or less 32.30% 47.60% 25.00%
$15,001 to $25,000 27.70% 23.80% 29.50%
$25,001 to $40,000 29.20% 14.30% 36.40%
$40,001 to $55,000 6.20% 4.80% 6.80%
$55,001 to $65,000 0.00% 0.00% 0.00%
$65,001 to $75,000 3.10% 4.80% 2.30%
More than $75,000 0.00% 0.00% 0.00%
24
24
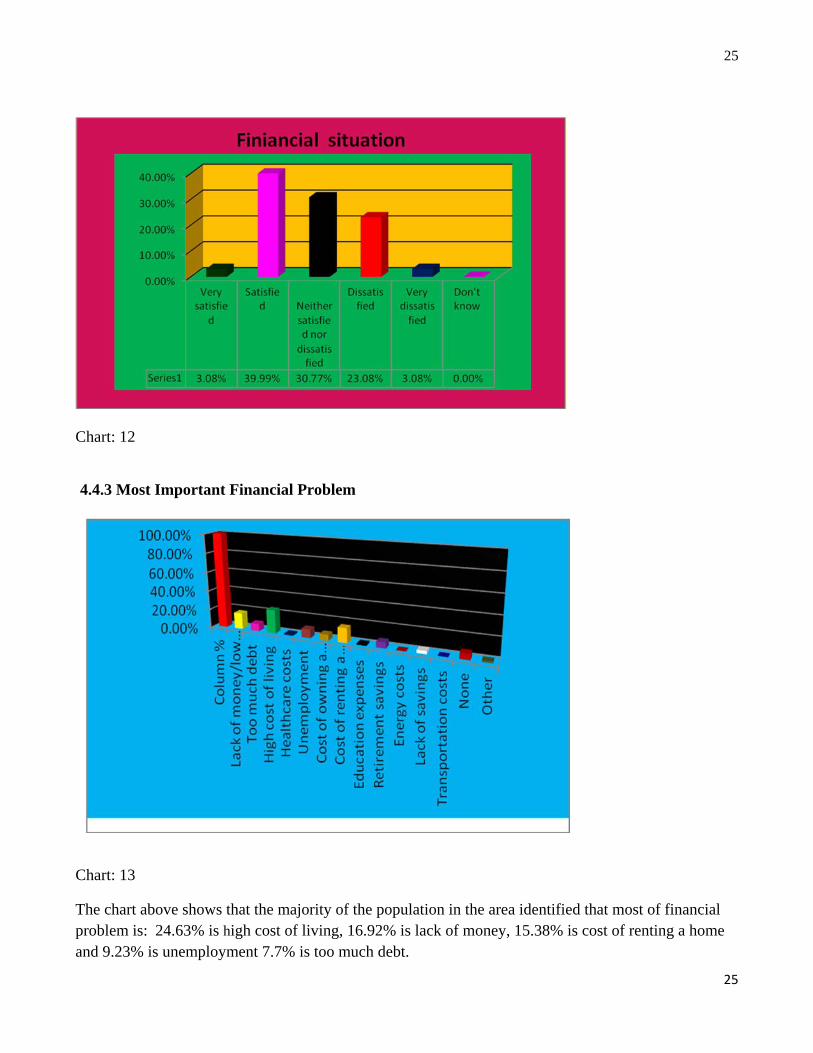
Chart: 11 The graph shows the annual household income for the participant of the survey of Eglington East -Kennedy Park areas are as listed:
32.8% gets $15,000 or less 28.13% gets $15,000 to 25,000 29.69% gets $ 25,000 to 40,000 6.20% gets $ 40,001 to $55,000 3.10% gets $65,001 to $75,000
According to Statistic Canada the, the poverty line (low income cut off) for a single person living in a major city in 2007 was $21,666 (before taxes). The majority of the population receiving incomes are 32.8% less than $15,000. According to Statistic Canada 2006, 46% of residents were considered to have low income (before tax) as compared to 18% in the rest of Toronto, this is a very high-poverty neighbourhood. 4.4.2 Financial situation The Chart: below shows that 39.99% are satisfied with financial Situation 30.77% are neither satisfied nor dissatisfied and 23.08% are dissatisfied
25
25
Chart: 12
4.4.3 Most Important Financial Problem
Chart: 13
The chart above shows that the majority of the population in the area identified that most of financial problem is: 24.63% is high cost of living, 16.92% is lack of money, 15.38% is cost of renting a home and 9.23% is unemployment 7.7% is too much debt.
26
26
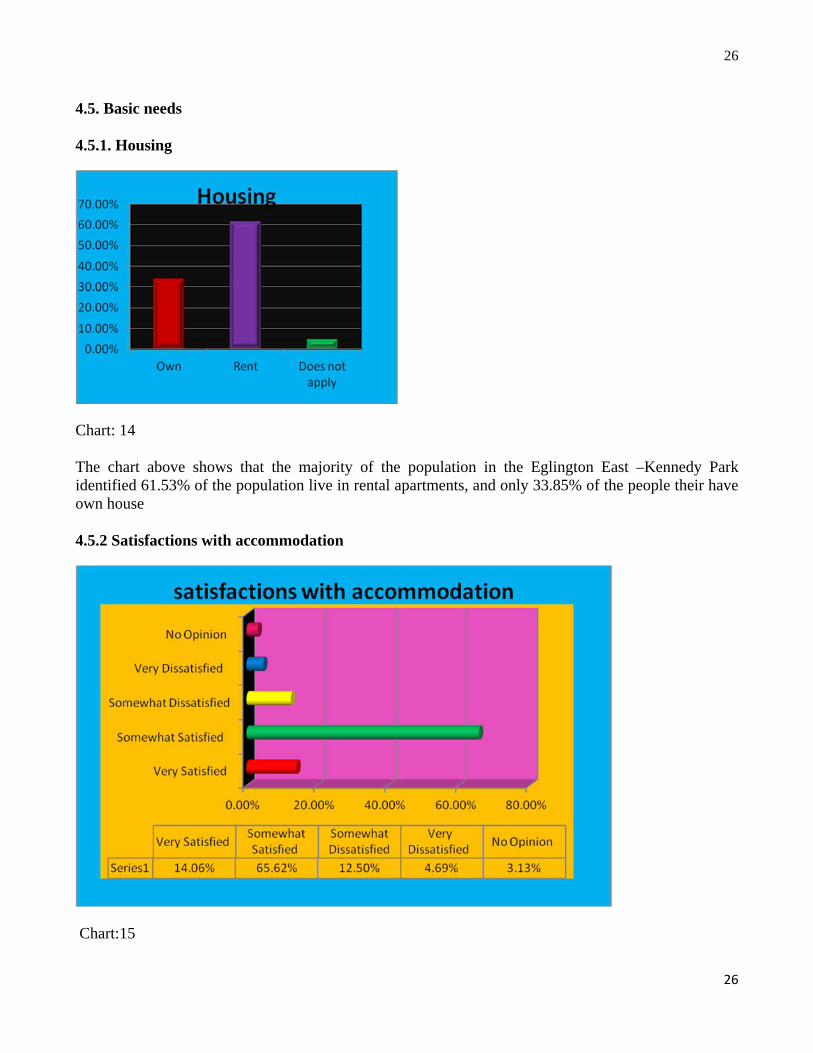
4.5. Basic needs 4.5.1. Housing
Chart: 14 The chart above shows that the majority of the population in the Eglington East –Kennedy Park identified 61.53% of the population live in rental apartments, and only 33.85% of the people their have own house 4.5.2 Satisfactions with accommodation
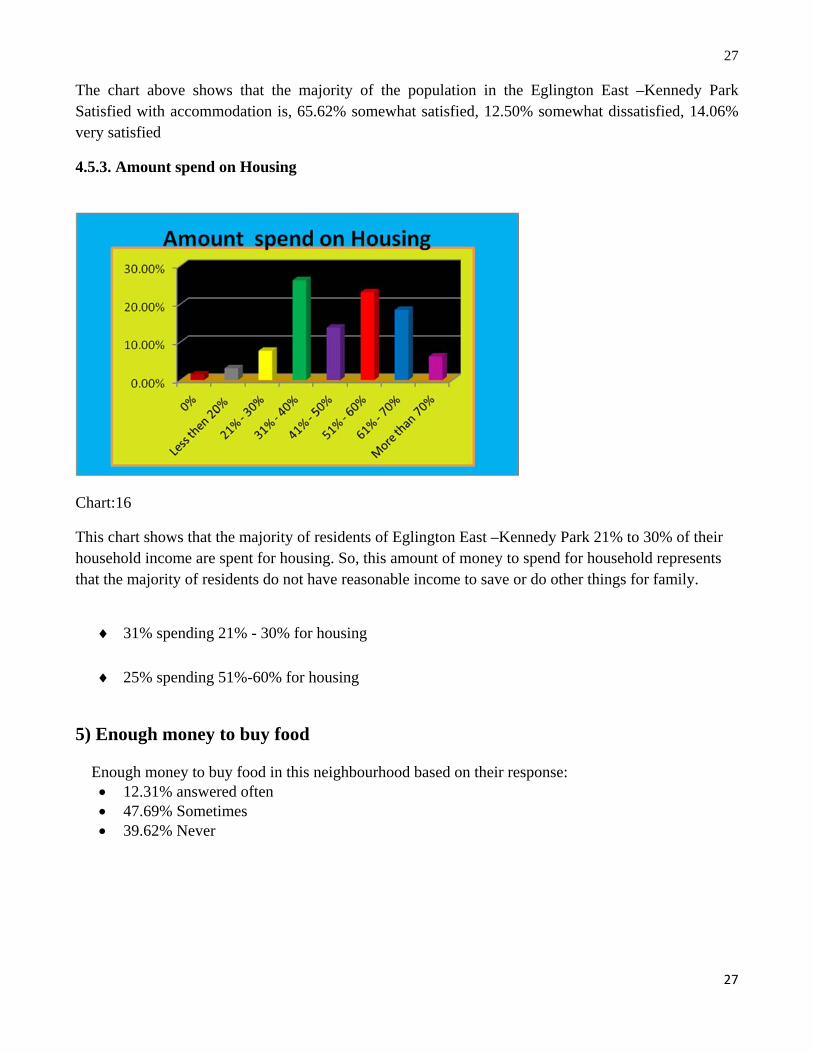
Chart:15
27
27
The chart above shows that the majority of the population in the Eglington East –Kennedy Park Satisfied with accommodation is, 65.62% somewhat satisfied, 12.50% somewhat dissatisfied, 14.06% very satisfied
4.5.3. Amount spend on Housing
Chart:16
This chart shows that the majority of residents of Eglington East –Kennedy Park 21% to 30% of their household income are spent for housing. So, this amount of money to spend for household represents that the majority of residents do not have reasonable income to save or do other things for family.
31% spending 21% - 30% for housing
25% spending 51%-60% for housing
5) Enough money to buy food Enough money to buy food in this neighbourhood based on their response:
12.31% answered often 47.69% Sometimes 39.62% Never
28
28
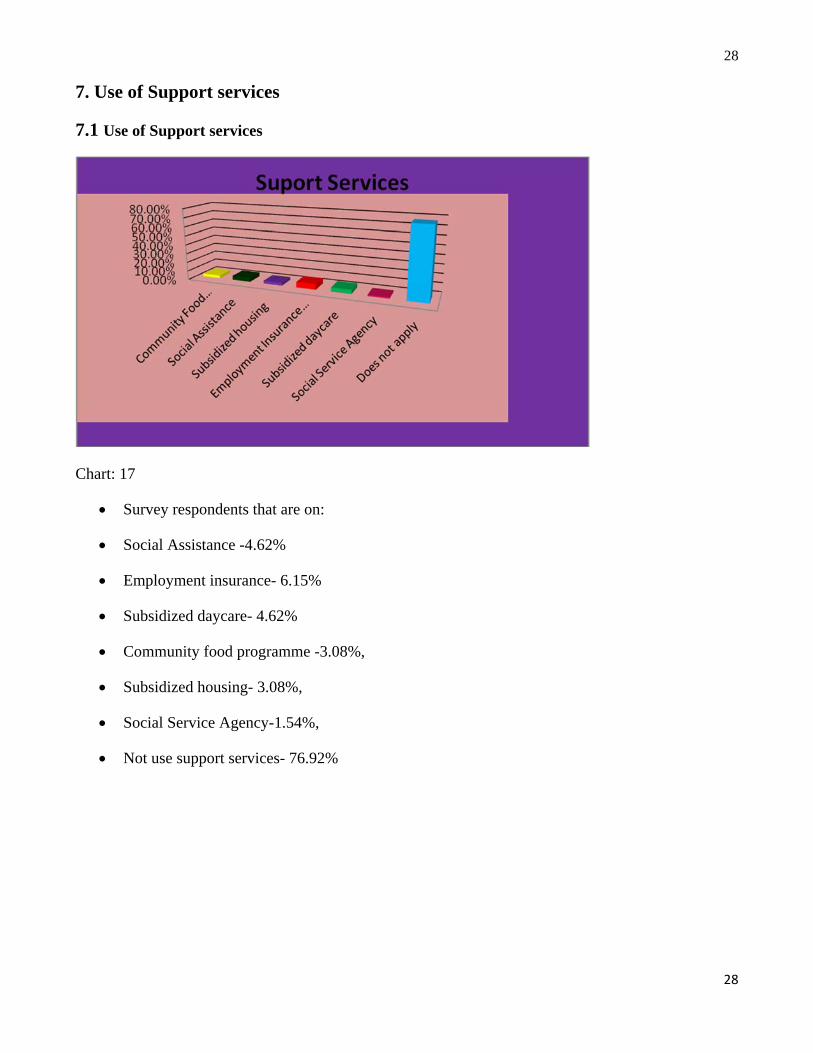
7. Use of Support services
7.1 Use of Support services
Chart: 17
Survey respondents that are on:
Social Assistance -4.62%
Employment insurance- 6.15%
Subsidized daycare- 4.62%
Community food programme -3.08%,
Subsidized housing- 3.08%,
Social Service Agency-1.54%,
Not use support services- 76.92%
29
29
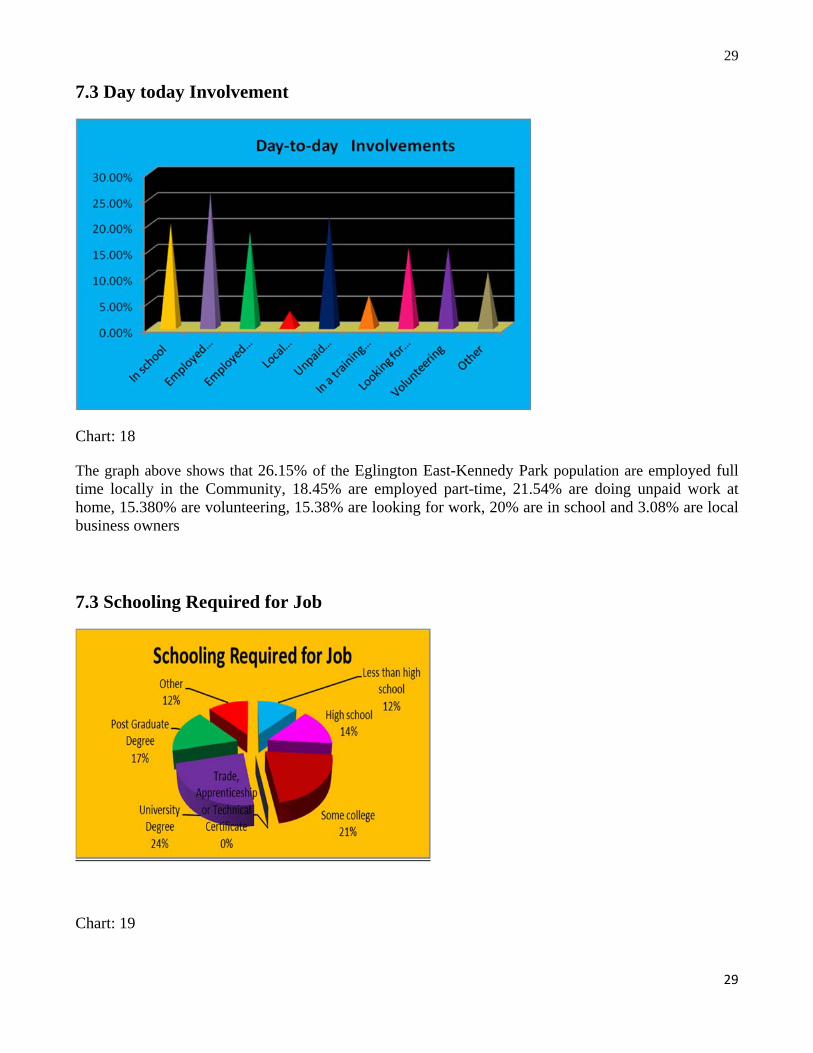
7.3 Day today Involvement
Chart: 18
The graph above shows that 26.15% of the Eglington East-Kennedy Park population are employed full time locally in the Community, 18.45% are employed part-time, 21.54% are doing unpaid work at home, 15.380% are volunteering, 15.38% are looking for work, 20% are in school and 3.08% are local business owners
7.3 Schooling Required for Job
Chart: 19
30
30
Respondents was asked what level of education they required to perform their job: 12% of the jobs need less than high school education, 24% university degree, 14% high school, 21% some college, 17% post graduate degree, 12% other, and 0% apprenticeship and technical certificate. The majority of population in the community is not requiring higher than high school education to perform the type of job they are doing, such as retail, which shows that the low income level in the area is attributed by the low level of education and low standard of job.
8. Looking for work
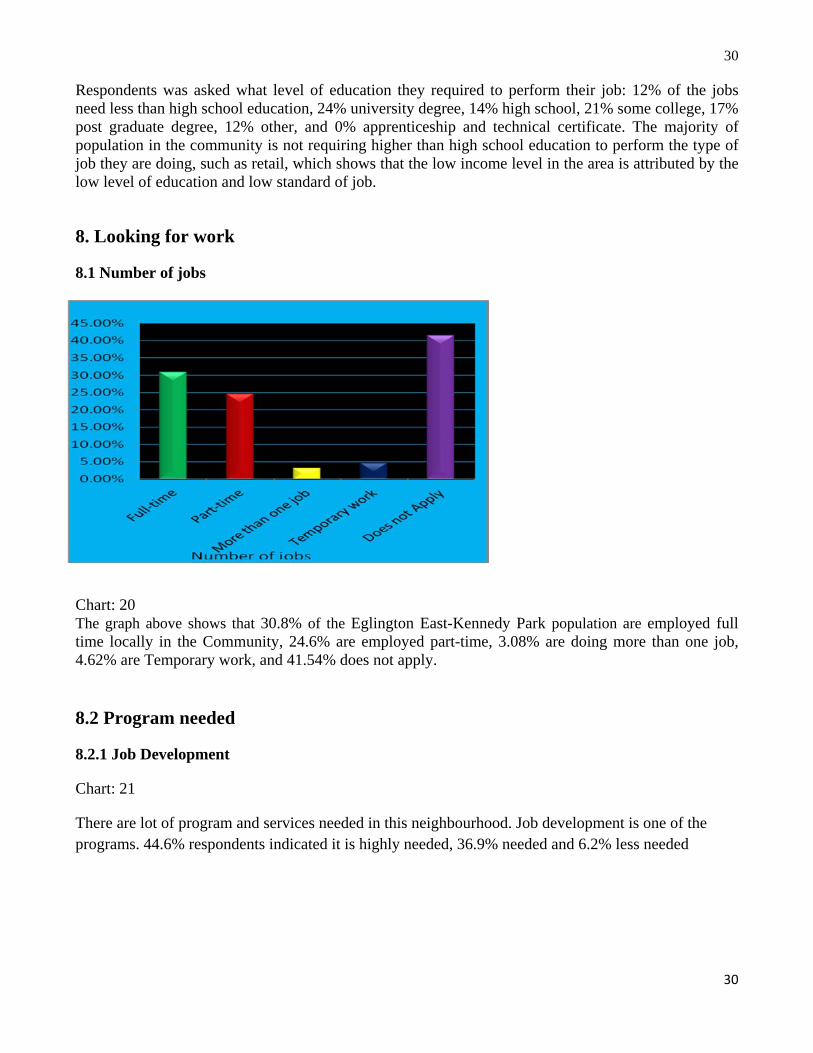
8.1 Number of jobs
Chart: 20 The graph above shows that 30.8% of the Eglington East-Kennedy Park population are employed full time locally in the Community, 24.6% are employed part-time, 3.08% are doing more than one job, 4.62% are Temporary work, and 41.54% does not apply.
8.2 Program needed
8.2.1 Job Development
Chart: 21
There are lot of program and services needed in this neighbourhood. Job development is one of the programs. 44.6% respondents indicated it is highly needed, 36.9% needed and 6.2% less needed
31
31
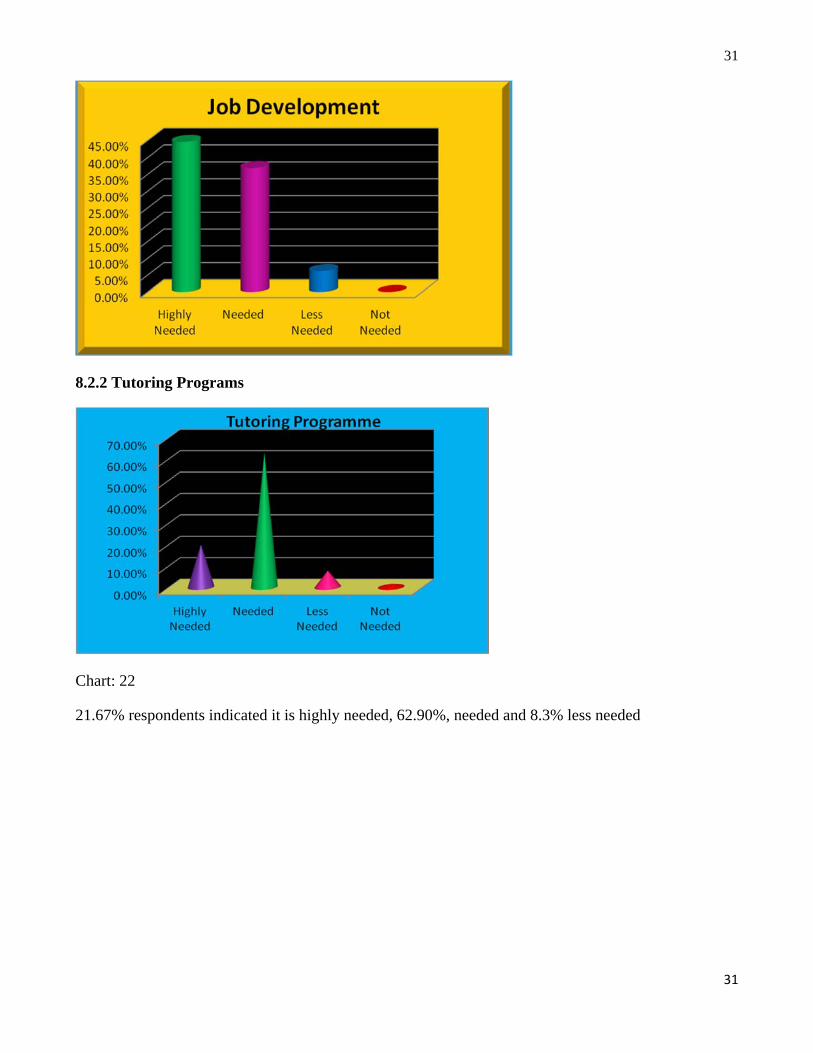
8.2.2 Tutoring Programs
Chart: 22
21.67% respondents indicated it is highly needed, 62.90%, needed and 8.3% less needed
32
32
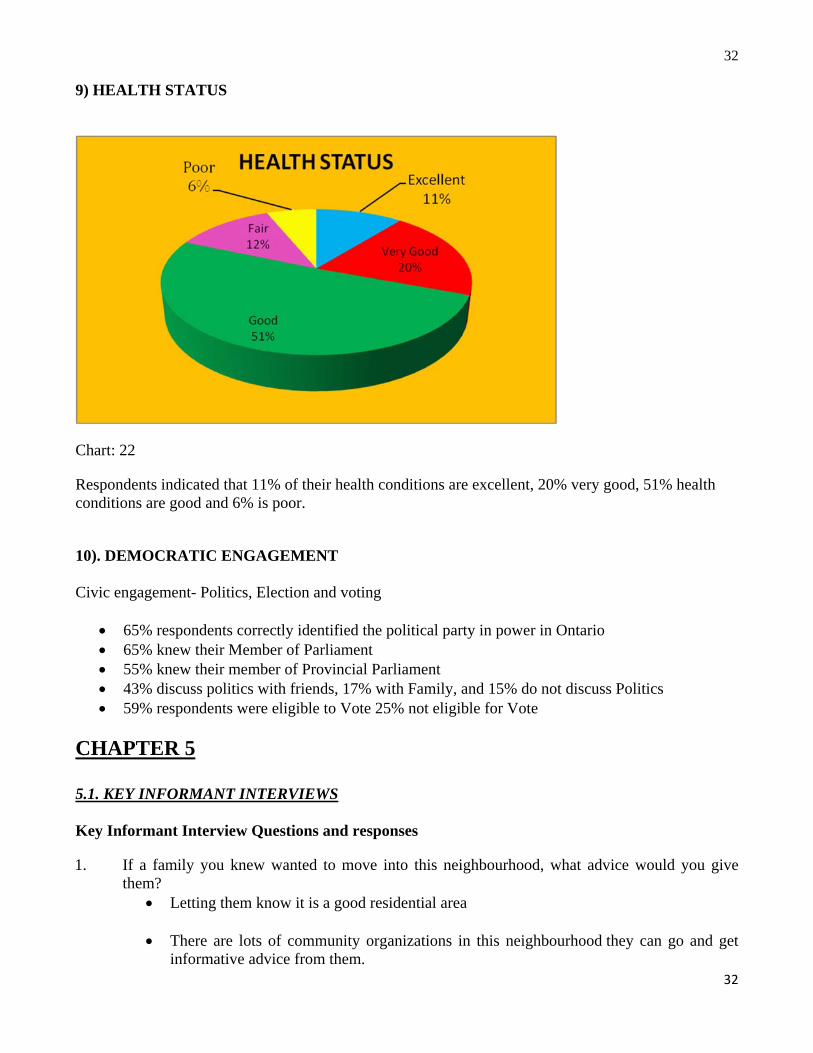
9) HEALTH STATUS
Chart: 22
Respondents indicated that 11% of their health conditions are excellent, 20% very good, 51% health conditions are good and 6% is poor.
10). DEMOCRATIC ENGAGEMENT Civic engagement- Politics, Election and voting
65% respondents correctly identified the political party in power in Ontario 65% knew their Member of Parliament 55% knew their member of Provincial Parliament 43% discuss politics with friends, 17% with Family, and 15% do not discuss Politics 59% respondents were eligible to Vote 25% not eligible for Vote
CHAPTER 5 5.1. KEY INFORMANT INTERVIEWS Key Informant Interview Questions and responses
1. If a family you knew wanted to move into this neighbourhood, what advice would you give them?
Letting them know it is a good residential area There are lots of community organizations in this neighbourhood they can go and get
informative advice from them.
33
33
If they have children: most schools have after school programs. Parents can find out
what the programs are about in order to benefit their children
2. What would you say are the strongest and best qualities of this community? What are some of the good things about living in this community for you? (You may want to consider social, spiritual, political, economic or other aspects of life here).
There are two top qualities (culture and education). People in the community are highly
educated and they are also interested in educating themselves and their children for employment opportunities e.g interested to go to university
People are social or friendly and they want to help each other
People likes spending their time volunteering in their community
Multi-cultural area: it is a diverse community so there are people from different cultural backgrounds.
Shopping centres: there are lots of multicultural or ethnic based shopping centres and grocery stores
Respects for diversity: people are from different ethnic backgrounds and have respect for one another.
People are active in different spiritual faith and still have a respect for one another e.g: Muslims, Hindus, Christians, etc.
Convenient for Transportations: since it is very close to the subway it is easy to access transportation.
Easy access to several banks in the area
Easy access to the libraries: there are around 6 libraries in the area
There are walk in or drop in clinics and government health clinics
Settlement agencies: there are two immigration and settlement services in the community and some outside the boundaries but near to the community
Social services and recreations centres: (Don Montgomery recreation centre) on the
main intersection of the neighbourhood. Politically people are not involved however; during the election time they get together at
Sidabrae School and 6 different parties are invited during the special meeting, which makes it easier because people ask questions.
34
34
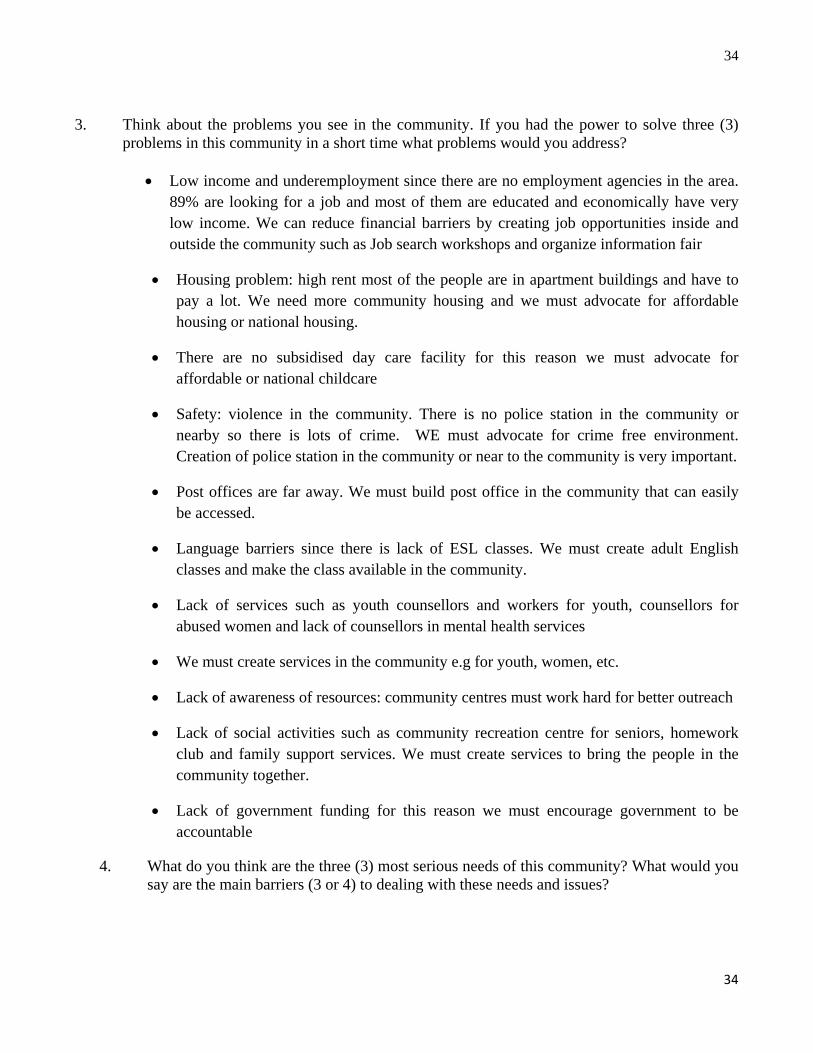
3. Think about the problems you see in the community. If you had the power to solve three (3) problems in this community in a short time what problems would you address?
Low income and underemployment since there are no employment agencies in the area.
89% are looking for a job and most of them are educated and economically have very low income. We can reduce financial barriers by creating job opportunities inside and outside the community such as Job search workshops and organize information fair
Housing problem: high rent most of the people are in apartment buildings and have to pay a lot. We need more community housing and we must advocate for affordable housing or national housing.
There are no subsidised day care facility for this reason we must advocate for affordable or national childcare
Safety: violence in the community. There is no police station in the community or nearby so there is lots of crime. WE must advocate for crime free environment. Creation of police station in the community or near to the community is very important.
Post offices are far away. We must build post office in the community that can easily be accessed.
Language barriers since there is lack of ESL classes. We must create adult English classes and make the class available in the community.
Lack of services such as youth counsellors and workers for youth, counsellors for abused women and lack of counsellors in mental health services
We must create services in the community e.g for youth, women, etc.
Lack of awareness of resources: community centres must work hard for better outreach
Lack of social activities such as community recreation centre for seniors, homework club and family support services. We must create services to bring the people in the community together.
Lack of government funding for this reason we must encourage government to be accountable
4. What do you think are the three (3) most serious needs of this community? What would you say are the main barriers (3 or 4) to dealing with these needs and issues?
35
35
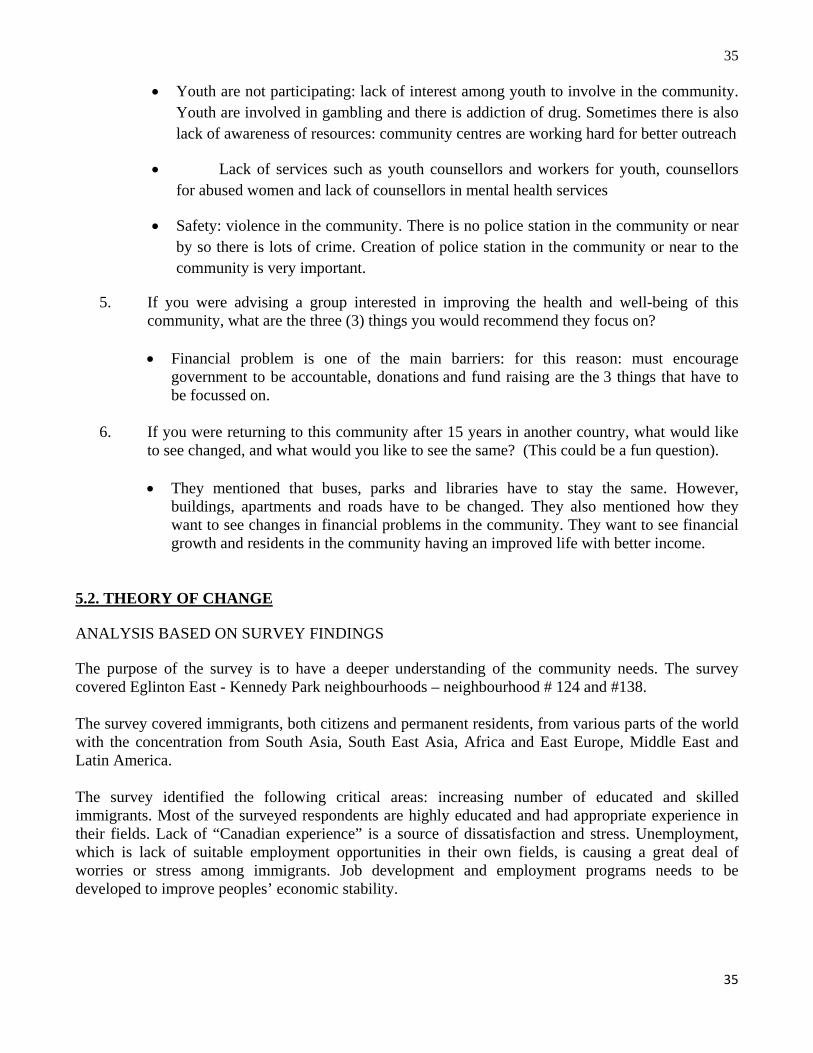
Youth are not participating: lack of interest among youth to involve in the community. Youth are involved in gambling and there is addiction of drug. Sometimes there is also lack of awareness of resources: community centres are working hard for better outreach
Lack of services such as youth counsellors and workers for youth, counsellors for abused women and lack of counsellors in mental health services
Safety: violence in the community. There is no police station in the community or near by so there is lots of crime. Creation of police station in the community or near to the community is very important.
5. If you were advising a group interested in improving the health and well-being of this community, what are the three (3) things you would recommend they focus on?
Financial problem is one of the main barriers: for this reason: must encourage
government to be accountable, donations and fund raising are the 3 things that have to be focussed on.
6. If you were returning to this community after 15 years in another country, what would like
to see changed, and what would you like to see the same? (This could be a fun question). They mentioned that buses, parks and libraries have to stay the same. However,
buildings, apartments and roads have to be changed. They also mentioned how they want to see changes in financial problems in the community. They want to see financial growth and residents in the community having an improved life with better income.
5.2. THEORY OF CHANGE ANALYSIS BASED ON SURVEY FINDINGS
The purpose of the survey is to have a deeper understanding of the community needs. The survey covered Eglinton East - Kennedy Park neighbourhoods – neighbourhood # 124 and #138. The survey covered immigrants, both citizens and permanent residents, from various parts of the world with the concentration from South Asia, South East Asia, Africa and East Europe, Middle East and Latin America. The survey identified the following critical areas: increasing number of educated and skilled immigrants. Most of the surveyed respondents are highly educated and had appropriate experience in their fields. Lack of “Canadian experience” is a source of dissatisfaction and stress. Unemployment, which is lack of suitable employment opportunities in their own fields, is causing a great deal of worries or stress among immigrants. Job development and employment programs needs to be developed to improve peoples’ economic stability.
36
36
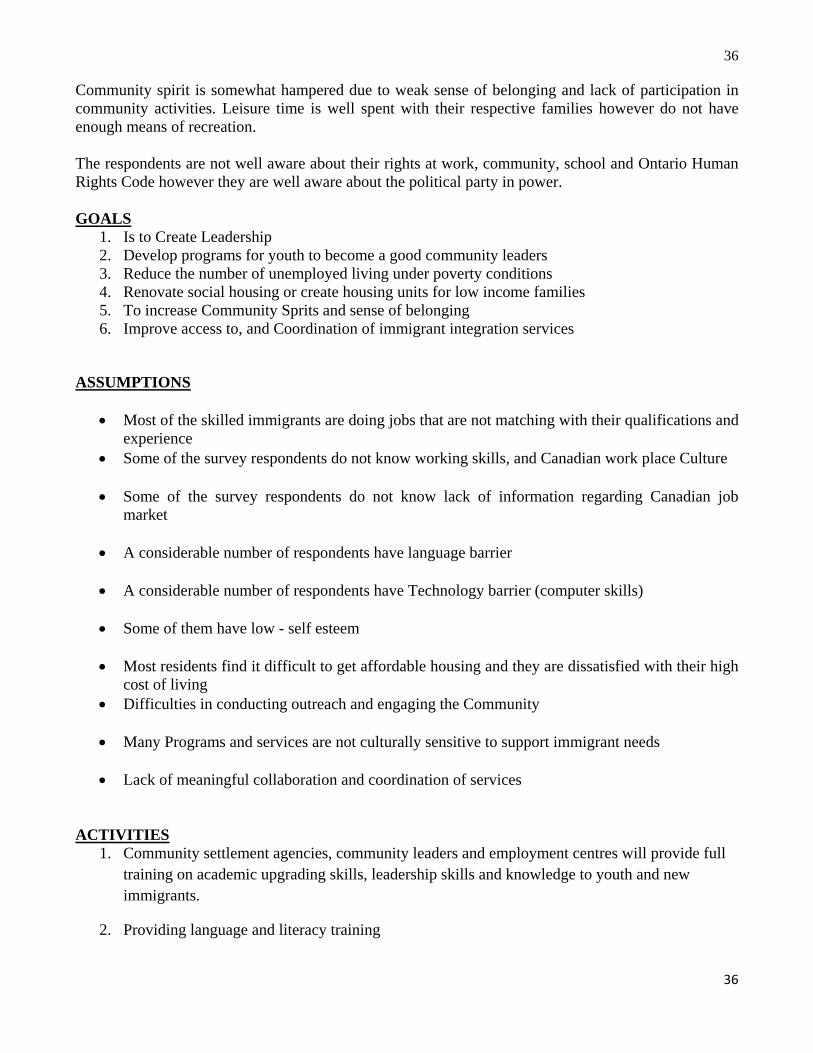
Community spirit is somewhat hampered due to weak sense of belonging and lack of participation in community activities. Leisure time is well spent with their respective families however do not have enough means of recreation. The respondents are not well aware about their rights at work, community, school and Ontario Human Rights Code however they are well aware about the political party in power. GOALS
1. Is to Create Leadership 2. Develop programs for youth to become a good community leaders 3. Reduce the number of unemployed living under poverty conditions 4. Renovate social housing or create housing units for low income families 5. To increase Community Sprits and sense of belonging 6. Improve access to, and Coordination of immigrant integration services
ASSUMPTIONS
Most of the skilled immigrants are doing jobs that are not matching with their qualifications and experience
Some of the survey respondents do not know working skills, and Canadian work place Culture
Some of the survey respondents do not know lack of information regarding Canadian job market
A considerable number of respondents have language barrier
A considerable number of respondents have Technology barrier (computer skills)
Some of them have low - self esteem
Most residents find it difficult to get affordable housing and they are dissatisfied with their high
cost of living Difficulties in conducting outreach and engaging the Community
Many Programs and services are not culturally sensitive to support immigrant needs
Lack of meaningful collaboration and coordination of services
ACTIVITIES
1. Community settlement agencies, community leaders and employment centres will provide full training on academic upgrading skills, leadership skills and knowledge to youth and new immigrants.
2. Providing language and literacy training
37
37
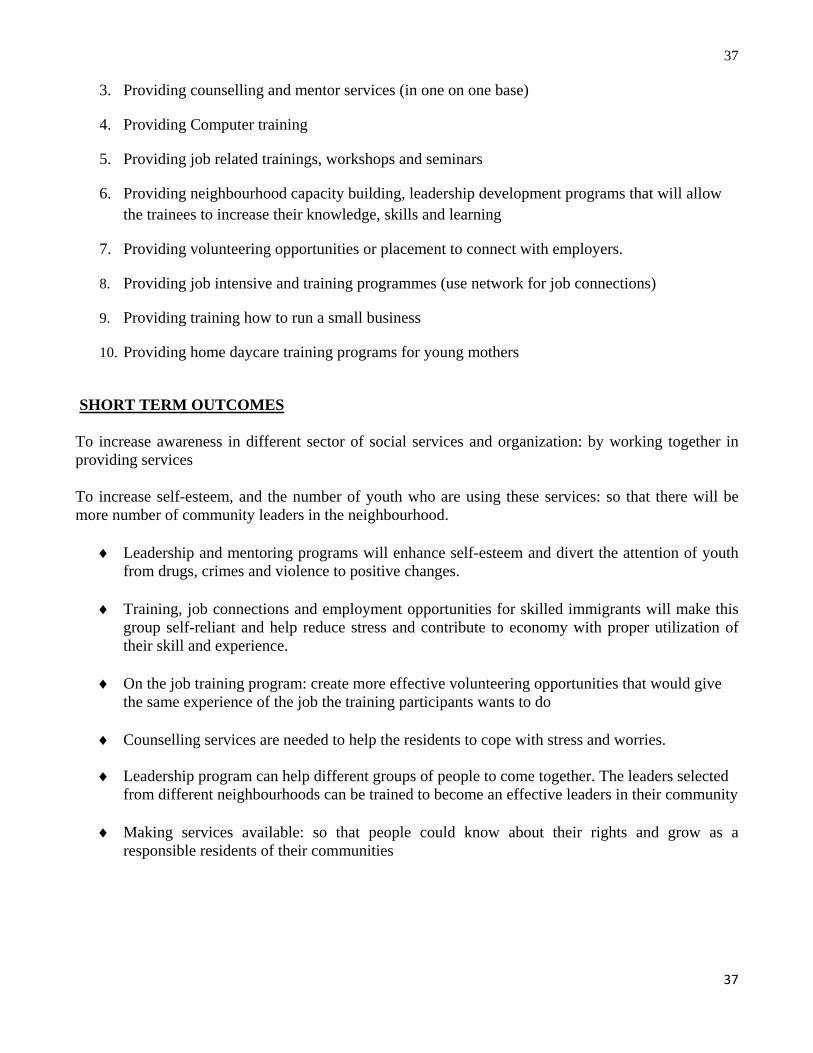
3. Providing counselling and mentor services (in one on one base)
4. Providing Computer training
5. Providing job related trainings, workshops and seminars
6. Providing neighbourhood capacity building, leadership development programs that will allow the trainees to increase their knowledge, skills and learning
7. Providing volunteering opportunities or placement to connect with employers.
8. Providing job intensive and training programmes (use network for job connections)
9. Providing training how to run a small business
10. Providing home daycare training programs for young mothers
SHORT TERM OUTCOMES To increase awareness in different sector of social services and organization: by working together in providing services To increase self-esteem, and the number of youth who are using these services: so that there will be more number of community leaders in the neighbourhood.
Leadership and mentoring programs will enhance self-esteem and divert the attention of youth from drugs, crimes and violence to positive changes.
Training, job connections and employment opportunities for skilled immigrants will make this
group self-reliant and help reduce stress and contribute to economy with proper utilization of their skill and experience.
On the job training program: create more effective volunteering opportunities that would give
the same experience of the job the training participants wants to do Counselling services are needed to help the residents to cope with stress and worries.
Leadership program can help different groups of people to come together. The leaders selected
from different neighbourhoods can be trained to become an effective leaders in their community
Making services available: so that people could know about their rights and grow as a responsible residents of their communities
38
38
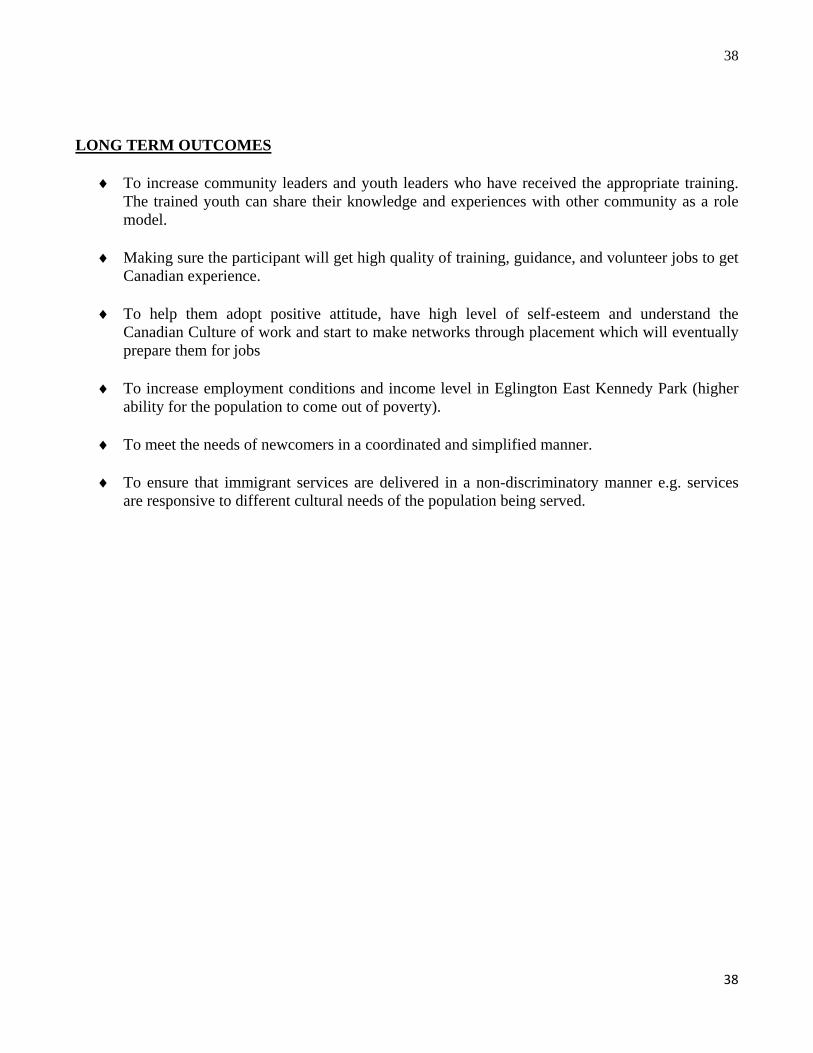
LONG TERM OUTCOMES
To increase community leaders and youth leaders who have received the appropriate training. The trained youth can share their knowledge and experiences with other community as a role model.
Making sure the participant will get high quality of training, guidance, and volunteer jobs to get
Canadian experience.
To help them adopt positive attitude, have high level of self-esteem and understand the Canadian Culture of work and start to make networks through placement which will eventually prepare them for jobs
To increase employment conditions and income level in Eglington East Kennedy Park (higher
ability for the population to come out of poverty).
To meet the needs of newcomers in a coordinated and simplified manner.
To ensure that immigrant services are delivered in a non-discriminatory manner e.g. services are responsive to different cultural needs of the population being served.
39
39
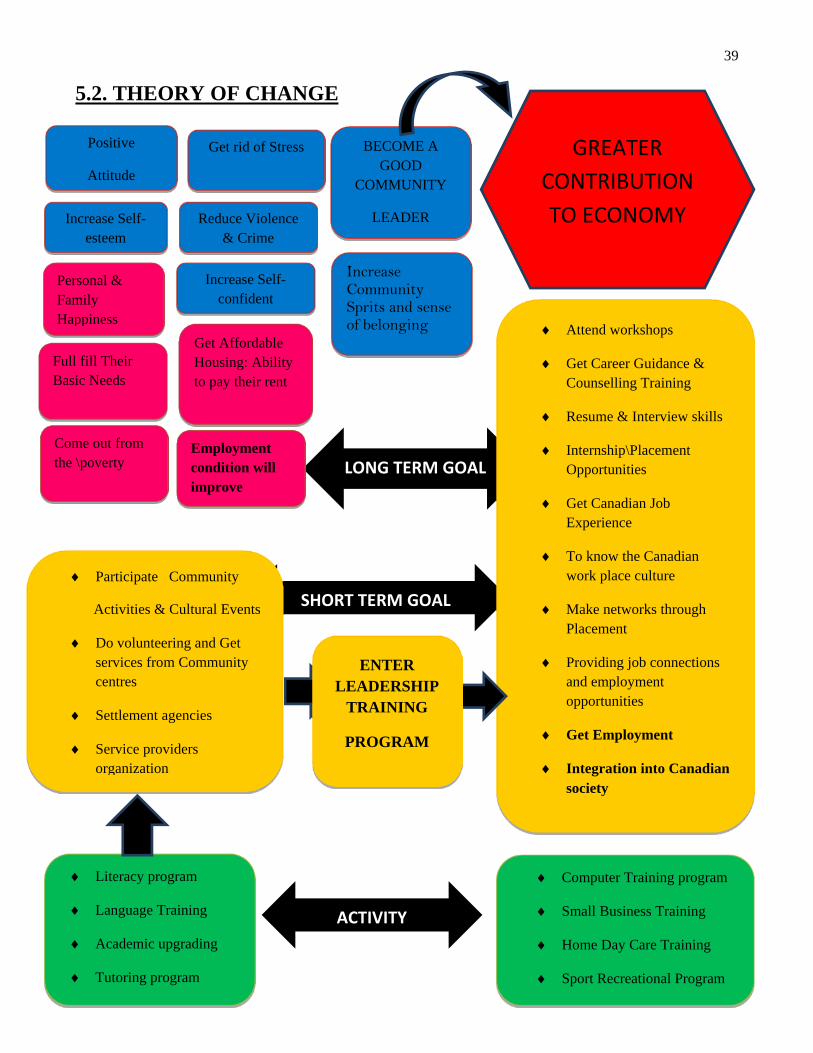
5.2. THEORY OF CHANGE
LONG TERM GOAL
SHORT TERM GOAL
Participate Community
Activities & Cultural Events
Do volunteering and Get services from Community centres
Settlement agencies
Service providers organization
Literacy program
Language Training
Academic upgrading
Tutoring program
Computer Training program
Small Business Training
Home Day Care Training
Sport Recreational Program
Attend workshops
Get Career Guidance & Counselling Training
Resume & Interview skills
Internship\Placement Opportunities
Get Canadian Job Experience
To know the Canadian work place culture
Make networks through Placement
Providing job connections and employment opportunities
Get Employment
Integration into Canadian society
ACTIVITY
ENTER LEADERSHIP
TRAINING
PROGRAM
Employment condition will improve
Personal & Family Happiness
Increase Self-esteem
Full fill Their Basic Needs
Come out from the \poverty
Get rid of Stress BECOME A GOOD
COMMUNITY
LEADER
Get Affordable Housing: Ability to pay their rent
Positive
Attitude
Reduce Violence & Crime
GREATER
CONTRIBUTION
TO ECONOMY
Increase Community Sprits and sense of belonging
Increase Self-confident
40
40
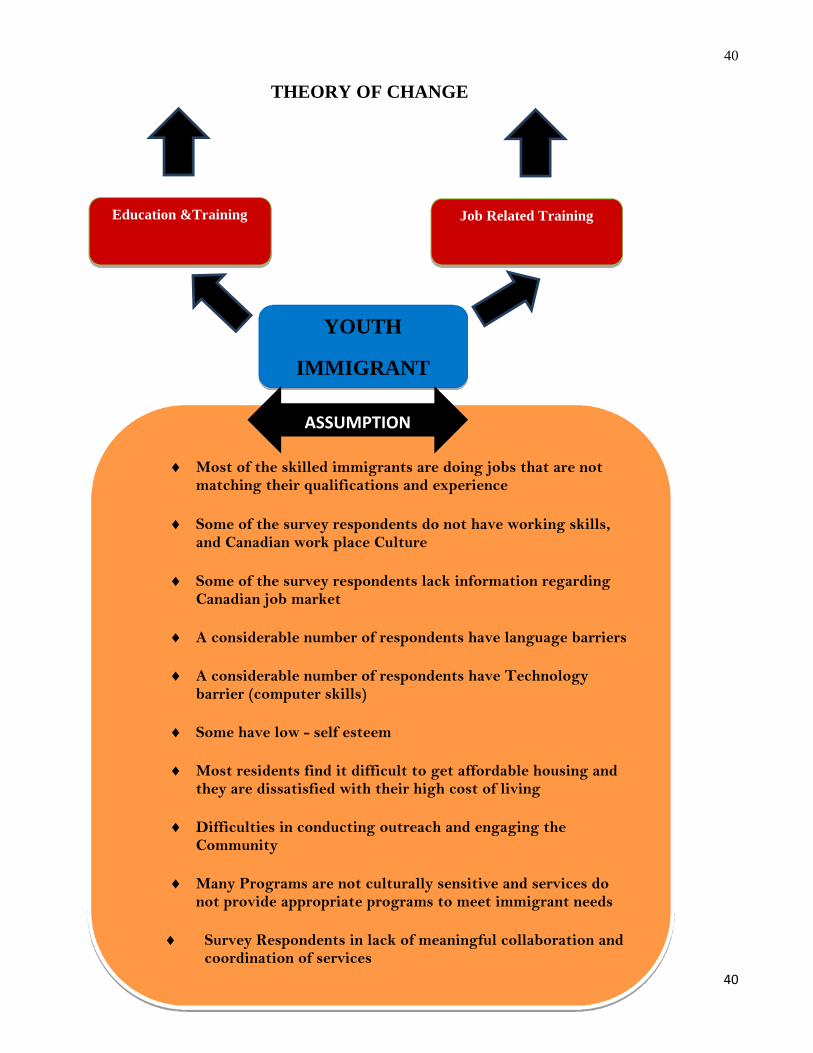
THEORY OF CHANGE
YOUTH
IMMIGRANT
Education &Training
Job Related Training
Most of the skilled immigrants are doing jobs that are not
matching their qualifications and experience
Some of the survey respondents do not have working skills, and Canadian work place Culture
Some of the survey respondents lack information regarding
Canadian job market
A considerable number of respondents have language barriers
A considerable number of respondents have Technology barrier (computer skills)
Some have low - self esteem
Most residents find it difficult to get affordable housing and
they are dissatisfied with their high cost of living
Difficulties in conducting outreach and engaging the Community
Many Programs are not culturally sensitive and services do
not provide appropriate programs to meet immigrant needs
Survey Respondents in lack of meaningful collaboration and coordination of services
ASSUMPTION
41
41
5.3. RECOMMENDATIONS: This section provides many recommendations for Eglinton East – Kennedy Park neighbourhood based on the community needs assessment. The CIW is a new way of measuring societal well-being. It provides unique insights into the quality of life of Canadians – overall, and in specific areas for that matter: our standard of living, our health, the quality of our environment, our education and skill levels, the way we use our time, the vitality of our communities, our participation in the democratic process, and the state of our arts, culture and recreation. The survey that I have conducted in Eglinton East – Kennedy Park neighbourhood is in alignment with the above mentioned areas, as the objective of the survey was to measure the well-being at community level. In these surveyed areas, the education level of the respondents is high. However low income, inaccessibility to affordable and appropriate housing, high cost of rent, standard of living, unemployment and underemployment are all interrelated factors that are affecting the overall well-being and quality of life in these two neighbourhoods. Employment Services/Agencies need to create opportunities like apprenticeship, mentoring, internship and skill development for the skilled immigrants in order to ensure that they contribute positively towards the Canadian economy. Social Service agencies need to broaden information and communication services and encourage enterprises such as, community gardens and small businesses to benefit the unemployed. Social service agencies in collaboration with community centres and schools need to organize fair heritage programs for the residents to make connections with each other. Screening of digital stories and arranging Jane’s Walk can be strong tools to enhance community spirit. Community leaders, volunteers need to advocate for affordable and habitable housing and file petition to their ward councillors e.g. MP and TCHC. Community Health Centres need to make counselling and interpretation services available. The non-profit organizations need to implement rental assistance program to provide low rental housing for low-income families. There is very low involvement in sports and other activity. Service providing agencies for youth need to take initiatives to develop skill building programs to prepare the youth to take on future leadership roles. 63% respondents spend their leisure time with family and watching television. It shows the lack of availability and accessibility of arts, culture and recreation facilities.
5.4. CONCLUSION: Based on the community needs assessment,
We can eliminate poverty by creating more employment opportunity for residents Encourage community capacity building Renovate social housing or create housing units for low income families Increase Community Sprits and sense of belonging Improve access to community resources
42
42
Coordinate immigrant integration services We need to develop more recreation programs for youth to encourage and engage them with
their community Create leadership development programs for youth. This will help youth to become good
community leaders and to build up their leadership skills that will eventually prepare them for jobs. This will give the youth an opportunity to have a bright future.
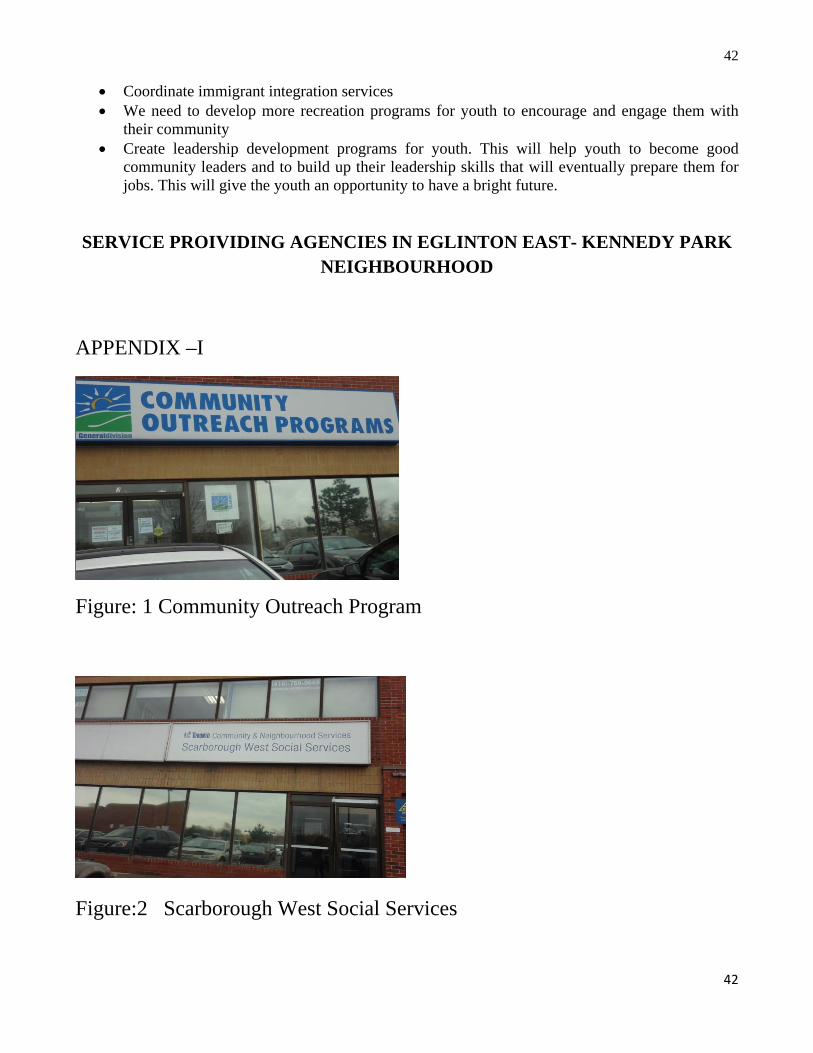
SERVICE PROIVIDING AGENCIES IN EGLINTON EAST- KENNEDY PARK
NEIGHBOURHOOD
APPENDIX –I
Figure: 1 Community Outreach Program
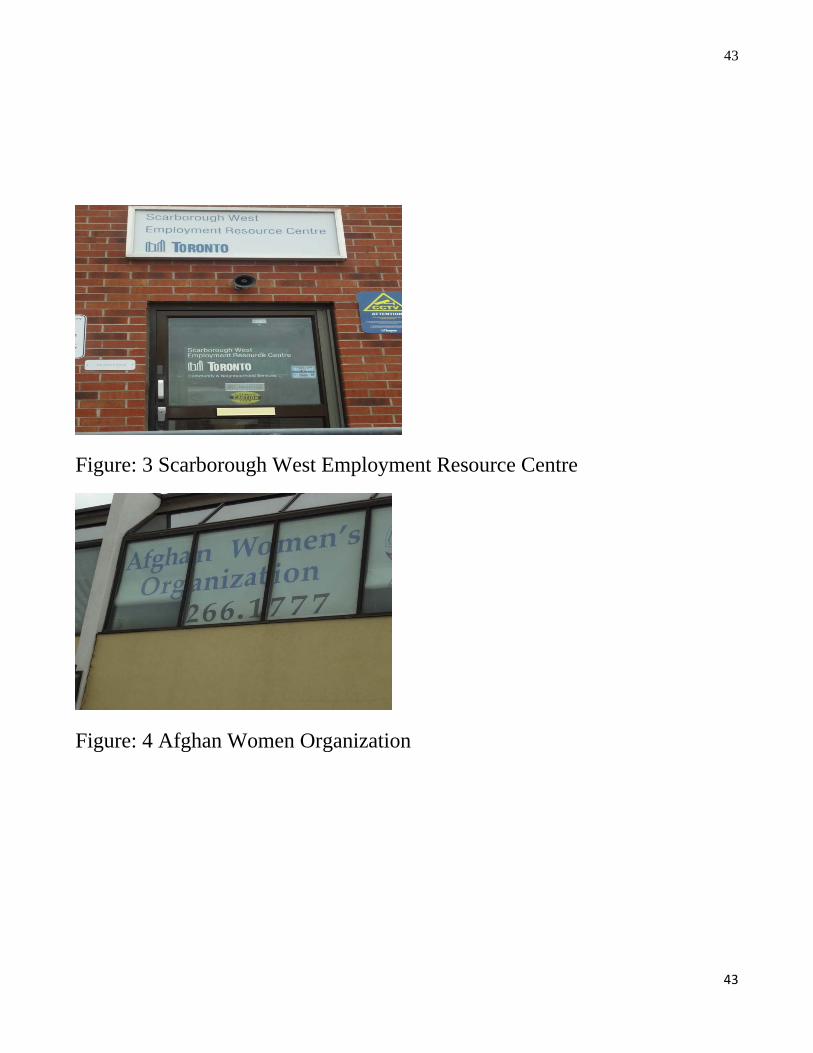
Figure:2 Scarborough West Social Services
43
43
Figure: 3 Scarborough West Employment Resource Centre
Figure: 4 Afghan Women Organization
44
44
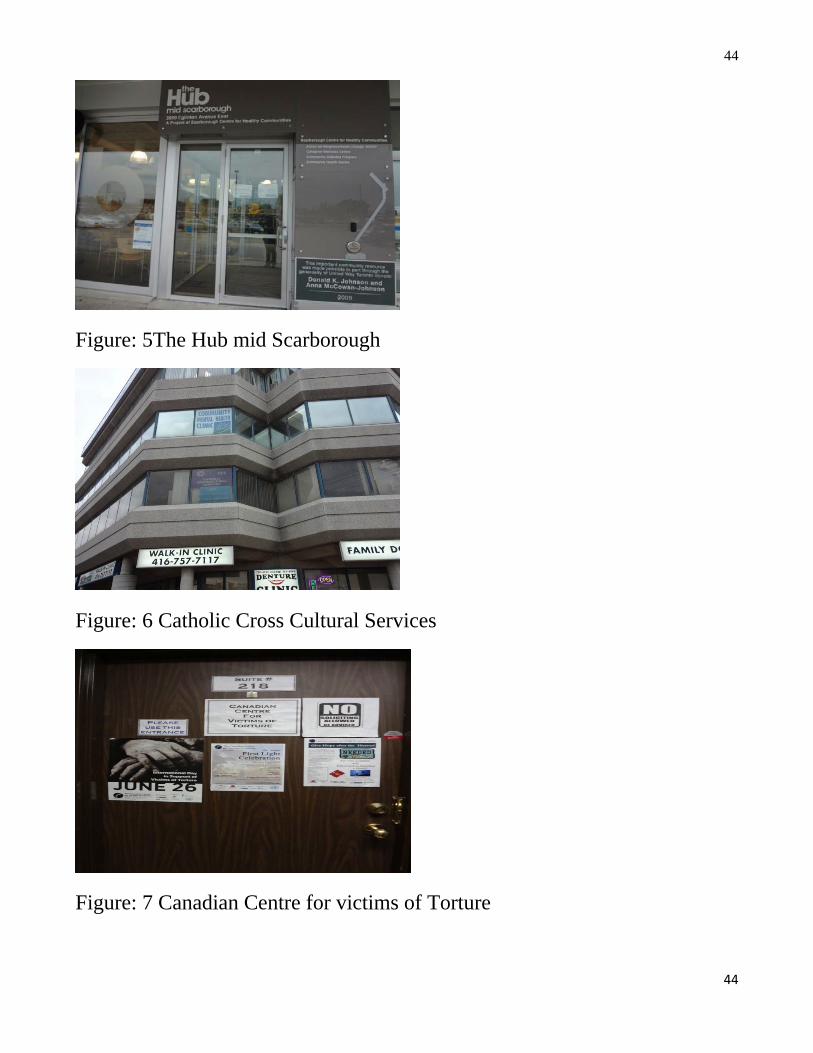
Figure: 5The Hub mid Scarborough
Figure: 6 Catholic Cross Cultural Services
Figure: 7 Canadian Centre for victims of Torture
45
45
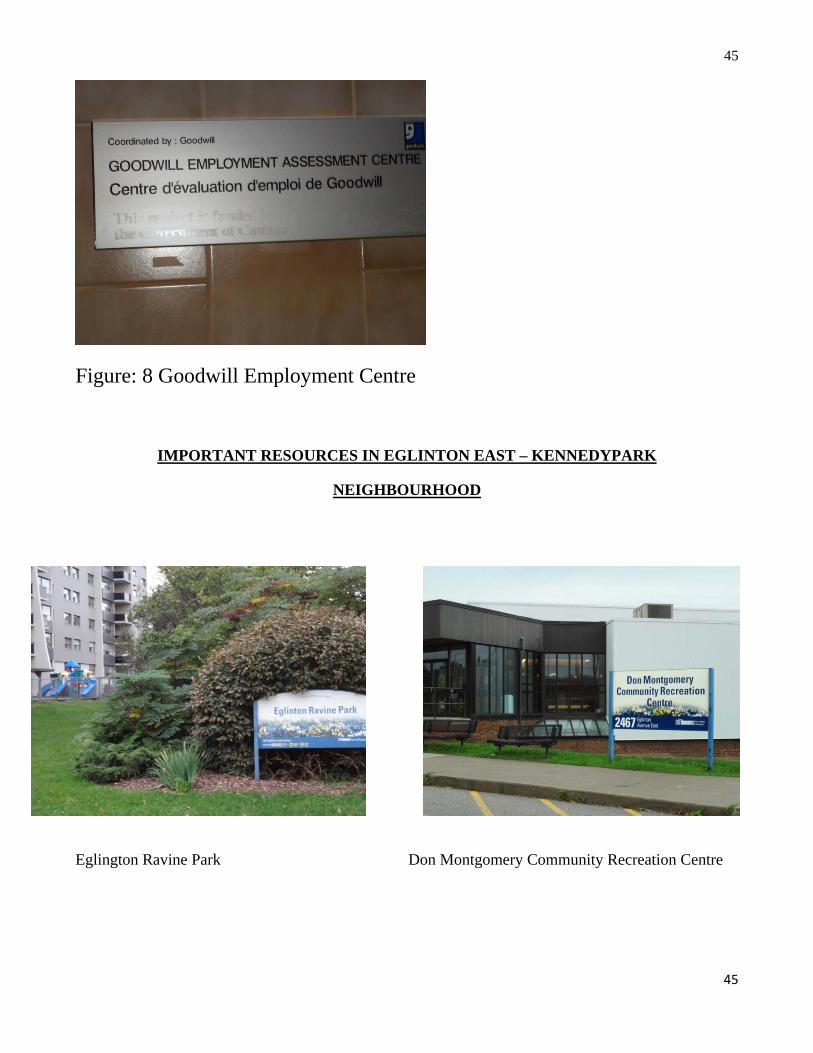
Figure: 8 Goodwill Employment Centre
IMPORTANT RESOURCES IN EGLINTON EAST – KENNEDYPARK
NEIGHBOURHOOD
Eglington Ravine Park Don Montgomery Community Recreation Centre
46
46
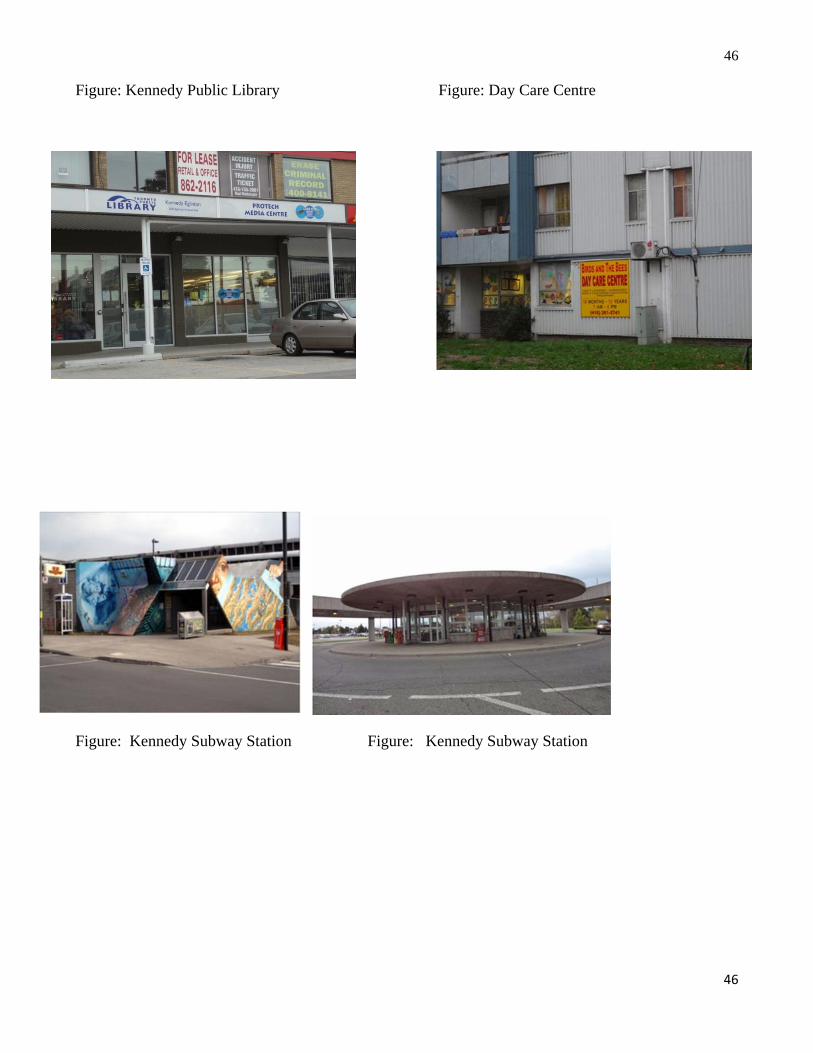
Figure: Kennedy Public Library Figure: Day Care Centre
Figure: Kennedy Subway Station Figure: Kennedy Subway Station
47
47
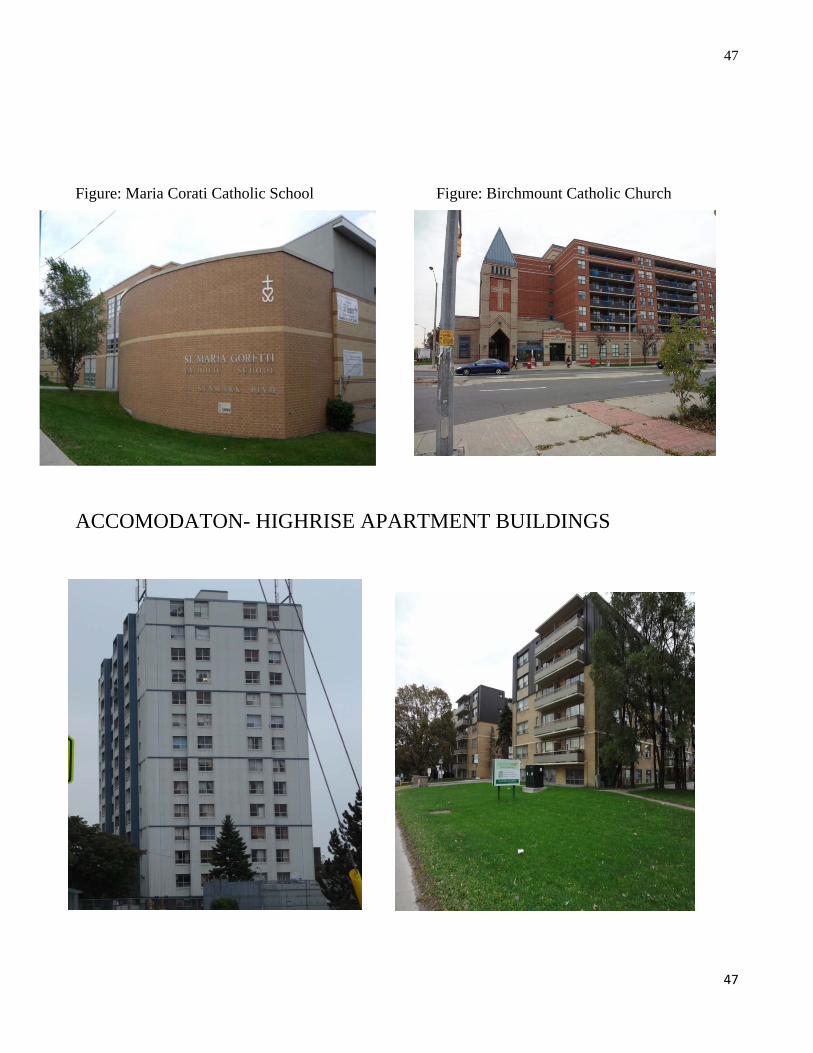
Figure: Maria Corati Catholic School Figure: Birchmount Catholic Church
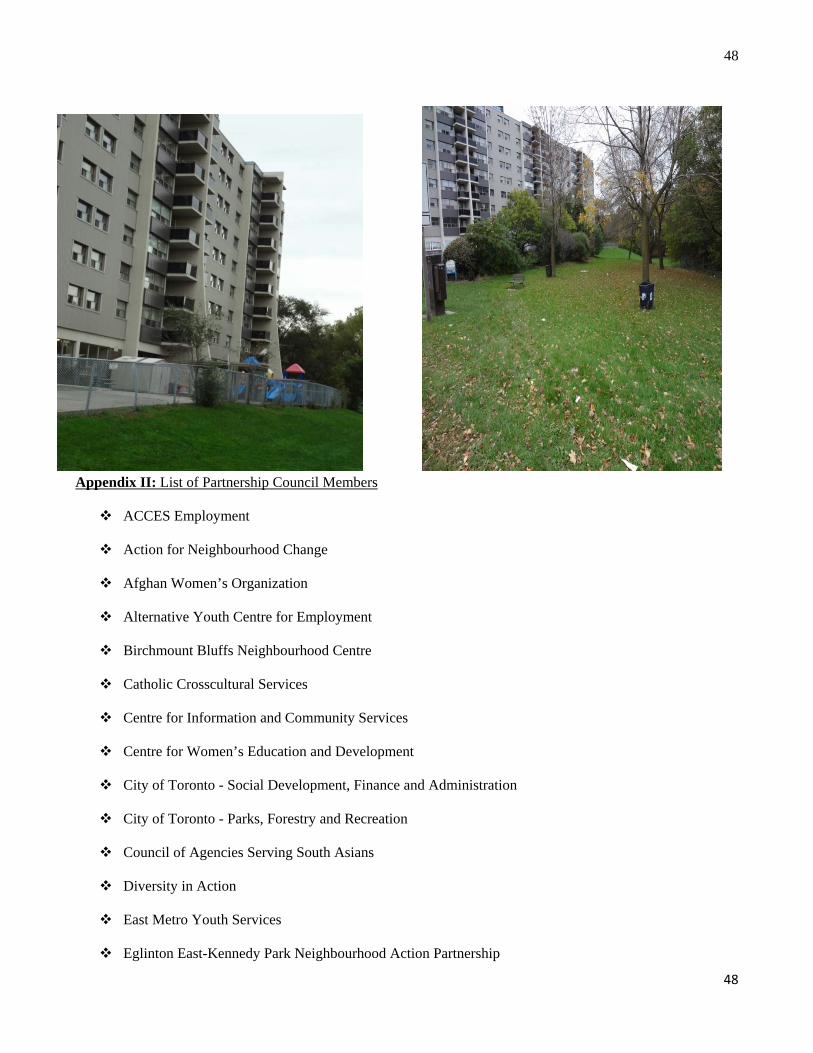
ACCOMODATON- HIGHRISE APARTMENT BUILDINGS
48
48
Appendix II: List of Partnership Council Members ACCES Employment
Action for Neighbourhood Change
Afghan Women’s Organization
Alternative Youth Centre for Employment
Birchmount Bluffs Neighbourhood Centre
Catholic Crosscultural Services
Centre for Information and Community Services
Centre for Women’s Education and Development
City of Toronto - Social Development, Finance and Administration
City of Toronto - Parks, Forestry and Recreation
Council of Agencies Serving South Asians
Diversity in Action
East Metro Youth Services
Eglinton East-Kennedy Park Neighbourhood Action Partnership

49
49
Goodwill Employment services
Heritage Skills Development Centre
Polycultural Immigrant and Community Services
Scarborough Housing Help Centre
Scarborough Women’s Centre
Settlement Assistance and Family Support Services
Tamil Eelam Society of Canada
The Canadian Centre for Victims of Torture
The Hub Mid-Scarborough
Toronto District School Board
Toronto Employment and Social Services
Toronto Public Health
Toronto Public Library
Toronto Scarborough Hospital
Scarborough Centre for Healthy Communities
Youth Link
YMCA Toronto
YWCA Toronto
REFERENCE 1. Statistic Canada: http://www.statcan.ca, 2. Canadian Index of wellbeing: http://www.ciw.ca 3. City of Toronto: http://www.toronto.ca. 4. City of Toronto/311: http://www.toronto.ca/311/ 5. Eglington east-Kennedy Park Local Immigration: http://www.servingyoubetter.org 6. Toronto Center for Community Learning and Development: http://www.tccld.org