Embed Size (px)
Citation preview

Clay County Community Needs and Resources
1
Contents
CLAY COUNTY ................................................................................................................................................... 2
History & Geography .......................................................................................................................................... 2
Demographic Characteristics .............................................................................................................................. 2
Socio-Economic Characteristics .......................................................................................................................... 3
Causes of Poverty ............................................................................................................................................... 3
Community Needs .............................................................................................................................................. 5
Primary Strengths and Community Resources ................................................................................................. 18

2
CLAY COUNTY
History & Geography Clay County is located in the central portion of West Virginia. The county was founded in 1858 and is
named in honor of Henry Clay, famous American statesman, member of the United States Senate from
Kentucky and United States Secretary of State in the 19th century. Clay County was created by an act of
the Virginia General Assembly on March 29, 1858. It was
created from parts of Braxton, Kanawha and Nicholas counties.
The act creating Clay County declared that the county seat was
to be located on the McCalgin farm, near the mouth of Buffalo
Creek. It declared that the county seat was to be known as the
town of Marshall. However, the local citizens generally referred
to the town as Clay Court House, because the courthouse was
the town's primary reason for existing and was the primary
source of social and economic interaction in the community.
On October 10,
1863, the state legislature changed the town's name to
Henry, in honor of Henry Clay. The town's name was
changed to Clay in 1927.
Clay County encompasses 392 square miles in the central
portion of West Virginia. The county is quite rural with
population density of 27.5 persons per sq. mile.
Demographic Characteristics
The total population of Clay County is 9,033
persons (ACS, 2016). 5.7% of the population is
under five years of age and 18.6% is over the age
of 65 yrs.
98.0% of the population is White and 0.0% is Black.
0.5% is American Indian or Alaska Native. The
remaining 1.5% of Clay County residents are of
mixed or other races.
There are 3,375 households and 2,330 family households in the county. 952 or 28.2% of the total
515
1,734
2,4482,656
1,680
Under 5 yrs. 5-19 yrs. 20-44 yrs. 45-64 yrs. 65 yrs. andolder
Clay County Population by Age GroupTotal population = 9,033 (ACS 2016)
Percent White, 98.0%
Percent Black, 0.0%
American Indian or
Alaska Native,
0.5%
Percent Other or Mixed Race,
1.5%
Clay County Population by Race
3
households have children under 18 yrs. of age.
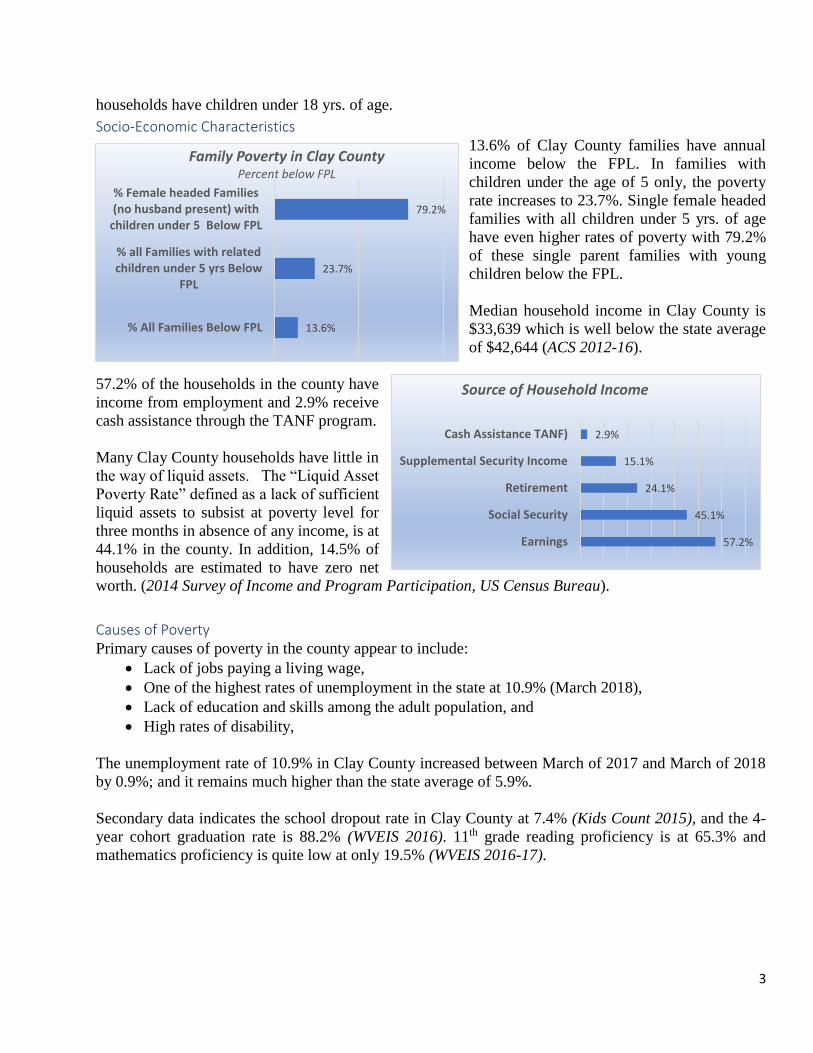
Socio-Economic Characteristics 13.6% of Clay County families have annual
income below the FPL. In families with
children under the age of 5 only, the poverty
rate increases to 23.7%. Single female headed
families with all children under 5 yrs. of age
have even higher rates of poverty with 79.2%
of these single parent families with young
children below the FPL.
Median household income in Clay County is
$33,639 which is well below the state average
of $42,644 (ACS 2012-16).
57.2% of the households in the county have
income from employment and 2.9% receive
cash assistance through the TANF program.
Many Clay County households have little in
the way of liquid assets. The “Liquid Asset
Poverty Rate” defined as a lack of sufficient
liquid assets to subsist at poverty level for
three months in absence of any income, is at
44.1% in the county. In addition, 14.5% of
households are estimated to have zero net
worth. (2014 Survey of Income and Program Participation, US Census Bureau).
Causes of Poverty Primary causes of poverty in the county appear to include:
Lack of jobs paying a living wage,
One of the highest rates of unemployment in the state at 10.9% (March 2018),
Lack of education and skills among the adult population, and
High rates of disability,
The unemployment rate of 10.9% in Clay County increased between March of 2017 and March of 2018
by 0.9%; and it remains much higher than the state average of 5.9%.
Secondary data indicates the school dropout rate in Clay County at 7.4% (Kids Count 2015), and the 4-
year cohort graduation rate is 88.2% (WVEIS 2016). 11th grade reading proficiency is at 65.3% and
mathematics proficiency is quite low at only 19.5% (WVEIS 2016-17).
13.6%
23.7%
79.2%
% All Families Below FPL
% all Families with relatedchildren under 5 yrs Below
FPL
% Female headed Families(no husband present) with
children under 5 Below FPL
Family Poverty in Clay CountyPercent below FPL
57.2%
45.1%
24.1%
15.1%
2.9%
Earnings
Social Security
Retirement
Supplemental Security Income
Cash Assistance TANF)
Source of Household Income

4
Educational attainment is low among
Clay County residents. 10.1% of those
25 yrs. of age and older hold a college
degree and an additional 4.8% have an
associate degree; however, 74.9% of
county residents over age 25 yrs. have
no education beyond high school and
28.0% have less than a high school
education (ACS 2016).
More young people in the county
appear to be enrolling in education programs beyond high school than in the past. The 2016 college going
rate (4 yr. institutions) in the county is at 29.0% of graduating high school seniors and an additional 15.3%
enroll in a 2-yr. program (WV Higher Education Policy Commission).
The community discussion held in Clay County identified several factors contributing to poverty
including:
A dependency mindset,
Opioid abuse and addiction,
Younger people with more education and skills move away to find work, and
Absent property owners and lack of good property management.
When asked to define poverty and the factors that keep county residents in poverty, community discussion
participants identified: (1) Extended families’ preference for living close to one another and in rural areas,
(2) Inability to advance due to lack of education and skills, (3) Loss of mining jobs, (4) Addiction to
opioids, and (5) A general lack of awareness about resources that may be available.
One indicator of generational poverty is the percentage of all county births to mothers with less than a
high school education. This is relatively high in Clay County at 20.7% (Kids Count 2015).
Health status of the population and access
to healthcare, mental health services, and
substance abuse treatment are additional
contributing factors to poverty in Clay
County. Obesity rates are high at 40.4%
among the adult population and 26.8% of
the adult population smoke (BRFS 2014).
8.2% of the population is without any type
of health insurance (ACS 2016). The infant
mortality rate in Clay County is high at 12.9
deaths per 1,000 live births and 10.3% of
babies born to county residents are low birth
weight (less than 2500 grams). The teen birth rate is at 35.6 births per 1,000 females (Kids Count 2015).
28.0%
46.9%
10.2%4.8% 5.4% 4.7%
Less thanHS
HSGraduate
SomeCollege - no
degree
AssociateDegree
Bachelor'sDegree
Graduate orprofessional
degree
Educational Attainment - Clay CountyPersons 25 yrs and over
32.2%
40.4%
26.8%
17.1%
15.5%
Percent Fair or Poor Health
Obesity
Cigarette Smoking
Cardiovascular DiseasePrevalence
Diabetes Prevalence
Health Status - Clay CountyPercent Adults 18 yrs. and Over

5
Community Needs The survey was designed to identify overall areas of need in each county as well as the priority needs
within each of the ten distinct domains assessed. Twenty-four (24) people familiar with local services
and community conditions completed the community survey of key informants in Clay County.
Overall Needs and Priorities
Key informants surveyed were asked:
” What do you think are the top three areas of need of low income people?”
Employment opportunities were the most frequently selected area by key informants. 78.3% of survey
respondents prioritized this domain. Healthcare is also a domain identified by nearly half (47.8%) of the
key informants in Clay County as an area of the service system that needs to be improved. Transportation
services, housing, and services and programs for children were identified as secondary priorities by 39.1%
of the 23 people who responded to this question.
The key informants were also asked to identify what they considered to be the three top priorities within
each of the individual assessment domains examined for the Community Needs Assessment and each
domain is discussed in more detail in the following sections.
Service recipients were asked:
“If you could only choose one type of service, which of the following would be your area of greatest
need?”
Only a small number of service recipients responded to the survey in Clay County; however, among those
that did, employment opportunities were chosen as the area of greatest need by a majority. 4 of the 7
clients (57.1%) responding said they “most needed” opportunities for employment. Transportation
services were chosen by 2 of the 7 clients who responded to the question and services and programs for
children was the area most needed by 1 of the clients responding. None of the service recipients chose any
47.8%
78.3%
39.1%
4.4%
17.4%
39.1%
30.4%
8.7%
13.0%
39.1%
Healthcare.
Employment opportunities.
Transportation services.
Educational opportunities.
Counseling/education about money management anduse of income.
Safe, decent and affordable housing.
Assistance with nutrition and food.
Emergency services.
Senior programs and services.
Children's services and programs for children.
Overall Service System Needs Identified by Key Informants in Clay CountyPercent Identifying as Most Needed N=23

6
of the other seven domains examined as their area of greatest need.
The key informants familiar with services and community conditions in Clay County were asked to
identify what they considered to be the three top priorities or area of need within each of the ten domains
examined for the Community Needs Assessment. Service recipients were also asked to share their needs
and personal experiences about each of the ten domains. Responses of both the key informants and small
number of low-income service recipients participating in the survey are discussed in more detail in the
following sections.
Employment and Jobs: When asked about the most needed services within the employment and jobs domain, key informants
responding to the survey in Clay County were most focused on expanded broadband in the county and
additional training opportunities for the types of jobs available. Based on the survey responses, the top
three priorities in Clay County related to Employment and Jobs are:
Expanded access to broadband Internet services,
Specific training for the types of jobs available, and
Transportation to work locations.
Client experiences related to seeking employment generally reflect a perception that few jobs are available
to them and those that may be available would not pay enough to offset child care expenses and the loss
33.3%
29.2%
41.7%
45.8%
37.5%
29.2%
20.8%
20.8%
20.8%
Additional general education necessary to obtain and keep agood job.
Additional vocational training programs focused on availableemployment opportunities.
Specific skills training necessary for the types of jobs available.
Expanded access to broadband Internet services.
Additional transportation services to work locations.
Transportation services for people seeking a job in order to getto interviews, job fairs, etc.
Additional child care for working parents.
Additional child care options for people seeking employment.
Education/counseling about resume writing, preparing jobapplications, interview skills, etc.
Employment and Jobs N=24Percent Key Informants Indicating Service as Most Needed

7
of government benefits.6 of the 7 clients responding to the client survey (85.7%) said they have tried to
find work but found there was nothing available in the area. 42.9% of the service recipients sharing their
experiences indicated childcare is so costly they would not make much working a low wage job after
paying for childcare expenses.
Respondents to the Community Survey were also asked what they consider to be the most significant
barriers to employment in Clay County.
The most significant barriers to employment identified by the key informants in Clay County are:
A lack of opportunity – sufficient jobs are not available in the area (50.0%),
A lack of transportation to get to job interviews or work locations,
Fear by low income households receiving government benefits that they will lose their benefits if
they become employed (45.8%), and
Childcare expenses result in little or no net gain in household income from a low wage job
(41.7%).
85.7%
28.6%
14.3%
28.6%
28.6%
0.0%
28.6%
42.9%
0.0%
0.0%
0.0%
I have tried to find work but there is nothing available in thisarea.
I don't have the level of education required to get availablejobs.
I need computer and/or technical skills in order to get a job.
Jobs that are available to me don't pay enough to make up forthe loss of my government benefits.
I don't have any way to get to job interviews or work locations.
I feel like I lack skills necessary to compete for a good job likeresume writing, interviewing, completing job applications, etc.
I don't have any childcare during the hours I would have towork.
Childcare costs too much. I wouldn't end up making muchworking a low wage job after paying for childcare.
I was convicted of a crime and no one wants to hire me.
I have a substance abuse problem and can't get treatment.
I have a disability or handicap that prevents me from working .
Client Experiences Related to Employment and Jobs N=7

8
Current employment in the county tends to focus on educational, healthcare, and social service programs.
Education, healthcare, and social services jobs account for an exceptionally high portion (30.2%) of total
employment in the county. The agriculture, forestry, fishing/hunting and mining industry sector accounts
for the second highest number of jobs at 12.5% of the county employment (Selected Economic
Characteristics - ACS 2016). Remainaing employment is spread across the other industry sectors with no
other sectors accounting for more than 10% of total jobs available.
12.5%
9.6%
7.8%
0.6%
7.5%
4.2%
0.8%
3.4%
6.7%
30.2%
4.4%
4.7%
7.6%
Agriculture, forestry, fishing & hunting, and mining
Construction
Manufacturing
Wholesale Trade
Retail Trade
Transportation, warehousing and utilities
Information Services
Finance & insurance and real estate and rental and leasing
Professional, administrative & waste management
Educational services and health care and social assistance
Arts, entertainment, recreation, accomodation, and food
Other services
Public administration
Employment by Industry - Clay County
79.2%
12.5%
16.7%
45.8%
50.0%
12.5%
41.7%
33.3%
Lack of opportunity - jobs are not available in the area.
People lack the level of education required for available jobs.
People lack specific computer and/or technical skills requiredfor available jobs.
Low-income households fear a loss of government benefits orother types of support.
People lack a means of transportation to get to job interviewsor work locations.
Childcare is not available during non-traditional work hours ordays.
Childcare expenses result in little or no net gain in householdincome from low-wage jobs.
There are too few "second chance" programs available topeople with criminal or substance abuse histories.
Barriers to Employment Identified by key Informants N=24Percent Key Informants Identifying Issue as a Barrier to Employment

9
The largest employers in Clay County (in order of number of people employed) are:
1. Clay County Board of Education,
2. Clay County Development Corporation,
3. Clay Trucking, Inc, and
4. Clay Health Care Center.
Education and Training: Half or more of key informants responding to the survey in Clay County prioritized (1) a need for
broadband access and computers (62.5%), (2) additional vocational training programs (54.2%), and (3)
transportation services to existing education and training programs (50.0%). Child care for those attending
education and training programs was a priority for 37.5% of the key informants, and more GED/Adult
Education classes across the county was a priority for one in three of the key informants.
Additional vocational training programs was prioritized by 51.4% of the survey respondents, and
transportation to existing training programs was identified as a need by 52.7%. Expanded availability of
GED and adult education is viewed as a priority by 43.2% of the key informants and child care for parents
attending training classes was prioritized by 41.9%. A variety of other programs and services are also seen
by some as important to improve education and training in the county.
Four (4) of the 6 service recipients sharing their experiences through the survey confirmed there was no
fast Internet connection available to them and these 4 people also said they could not afford to pay for an
Internet connection or purchase a computer. The few clients completing the survey also reinforce a need
for transportation to education and training programs. 3 of the 6 clients (50%) who answered the question
about their experience in seeking education and training said they lacked transportation to a program they
54.2%
33.3%
12.5%
20.8%
62.5%
50.0%
37.5%
20.8%
Additional vocational training.
Expanded availability of GED/Adult Education classes across thecounty.
Prevention of violence or threats of violence in schools.
Additional dropout prevention programs.
Affordable access to broadband and computers in homes.
Transportation to existing education and training programs.
Child care for parents while attending education and trainingprograms.
Improved communication between parents and schoolpersonnel.
Education and Training N=24Percent Key Informants Identifying Service as Most Needed

10
would like to attend. Two of the clients (33.3%) said they have not been able to attend any education or
training program because they don’t have child care.
Housing:
Key informants responding to the survey in Clay County identified a need for new construction of
affordable housing including rental units (77.3%), Senior housing (54.6%), single-family homes (45.5%),
and subsidized housing (45.5%). Temporary emergency housing is also seen by 45.5% of the key
informants as a need in the county.
When asked about barriers to safe, decent and affordable housing, 83.3% of those responding identified
an inability of many residents to purchase a home due to a lack of a sufficient down payment and more
than half (54.2%) of the key informants said potential homeowners cannot qualify for a mortgage due to
low credit scores.
A majority of key informants (62.5%) also indicated available rental units in the county are not affordable
for many families.
Only three Clay County service recipients offered their experiences related to housing. Two of these
clients said they don’t have any way to make the down payment required to purchase a home, and two
also said they have been unable to get approved for any type of housing assistance. One of three clients
77.3%
45.5%
54.6%
45.5%
13.6%
45.5%
New construction of affordable rental units.
New construction of affordable single family homes.
Senior housing (smaller homes accessible to the elderly).
Additional subsidized public housing.
Developed land for home sites.
Additional temporary emergency housing.
Housing N=22Percent Key Informants Identifying Service as Most Needed
29.2%
54.2%
83.3%
4.2%
45.8%
62.5%
There are not enough Sec 8 housing vouchers available toassist low income people in obtaining housing.
Potential homeowners do not have credit scores high enoughto qualify for a mortgage.
People lack funds for a required down payment when tryingto purchase a home.
There are not enough home-buyer education counselingprograms available.
The area lacks lower cost starter homes for sale.
Available rental properties are not affordable for manyfamilies.
Barriers to Safe Decent and Affordable Housing Percent Identifying Issue As Barrier N=24

11
surveyed indicated rents are too high for them to afford, homes for sale cost too much, and one client also
said they need advice about how to buy a home.
Secondary data sets were reviewed to provide more information about housing in Clay County and the
data tend to reinforce the need for additional safe decent and affordable housing units.
81.0% of Clay County residents are home owners 19.0% live in rental properties.
There is a total of 4,584 housing units in Clay County;
however, only 73.6% of existing housing units are
occupied while 26.4% are vacant. 18.4% of existing
housing units were built prior to 1950. As of 2016,
there were an estimated 38 occupied homes without
plumbing in the county. The median value of owner
occupied housing in the county is $77,700 (ACS 2011-
16).
Median monthly owner costs for those with a mortgage
is $940, and 31.8% of homeowners with a mortgage
are “cost burdened” with monthly housing costs
exceeding 30% of income. Nearly twice as many renters are cost burdened (61.7%) based on their gross
rent exceeding 30% of the household income. (ACS 2011-16).
Homeowner Assistance:
Key Informant Survey respondents in Clay County believe assistance with housing repairs are the greatest
need among low-income persons. 83.3% of the key informants prioritized repairs to existing homes.
Assistance with energy efficiency also appears to be a high priority based on the survey responses with
79.2% of respondents identifying the need for insulation, storm windows, etc. as a high need area.
Education about programs to assist with paying utility bills was also seen as priority by more than half
(58.3%) of the key informants.
When the service recipients were asked about their needs and experiences related to housing, 100% of the
4 people responding to the survey said they need help finding people who can do home repairs at a
reasonable cost.
Percent Owner Occupied (Home Ownership Rate),
81.0%
Percent Renter
Occupied, 19.0%
Housing Tenure in Clay County
83.3%
33.3%
79.2%
4.2%
58.3%
33.3%
Assistance with the cost of needed housing repairs (roof,foundation, or other structural repairs).
A listing of reputable people providing home repair services.
Assistance with energy efficiency ( insulation, storm windows,etc.).
Homebuyer education classes.
Education about programs that assist low income households topay utility bills.
Counseling about using credit, securing a mortgage, or assetbuilding.
Types of Assistance Needed By Current HomeownersPercent Key Informants Identifying Need N=24

12
Three (3) of the clients
surveyed also said they have
needed help with the cost of
housing repairs and 2 service
recipients (half the clients
responding) indicated they
can’t afford to pay utility bills
without assistance and they
need help with making their
home more energy efficient.
Healthcare:
Assistance with dental
procedures, access to
affordable health insurance,
and access to substance abuse treatment are the major priority needs identified by the key informants
surveyed in Clay County.
More than half (58.3%) of the key informants indicated people in the county need help accessing
affordable health insurance, and 54.2% think assistance with dental procedures is a priority in the county.
Nearly half (45.8%) of the survey respondents identified access to substance abuse treatment as a priority.
Only 5 service recipients responded about their needs and experiences in seeking healthcare services.
These respondents indicated their needs are consistent with the key informant priorities identified related
75.0%
100.0%
50.0%
50.0%
25.0%
I have needed help with the cost ofhousing repairs (roof, foundation, or
other structural repairs).
I need help finding people who can dohome repairs at a reasonable cost.
I need help with making my home moreenergy efficient ( insulation, storm
windows, etc.).
I can't afford to pay my utility billswithout assistance.
I would like to know more about usingcredit, mortgage refinancing, or other
money issues.
Client Experiences with Home Assistance N=4
58.3%
54.2%
12.5%
16.7%
16.7%
12.5%
4.2%
20.8%
12.5%
16.7%
16.7%
45.8%
12.5%
Access to affordable health insurance.
Assistance with dental procedures .
More health care providers who accept Medicaid.
More primary care clinics or other low-cost medical services.
Additional home-health (in-home care) services for seniors.
Additional primary care providers.
Additional dental care providers.
Additional vision care providers.
Additional medical specialists.
Additional pre-natal care services.
Additional mental health services.
Additional substance abuse treatment services.
More affordable prescription drugs.
Health and Healthcare N=24Percent Key Informants Identifying Service as Most Needed

13
to health insurance and dental assistance. Respondents to the service recipient survey (2 of 5) also said
they have had difficulty finding providers who accept Medicaid and 1 of the clients said they need help
paying for prescription drugs.
Nutrition:
When asked about community needs related to food and nutrition, Clay County respondents to the
community survey focused on a need for additional food outlets, increasing the availability of
supplemental food programs (food pantries, meal programs, etc.) in the county and transportation to
grocery stores, food pantries, or other food programs. 59.1% think additional food outlets is one of the
most needed services in the county, and 54.6% think additional food programs such as Senior Center
meals, food pantries, and “meals on wheels” are needed.
When low income persons receiving services were asked about their food needs, 60.0% (3 of 5
respondents) said they sometimes need help feeding themselves or their family but were unable to find
anyplace to get free food. 60% of these clients surveyed also indicated they would like more information
about healthy food choices.
In 2015, there were 8 supplemental food programs (food pantries, hot meal programs, backpack programs,
meal delivery, etc.) serving the county (WV Foodlink 2015). Nearly one in every three households 28.9%
in Clay County receive food stamps to supplement their food budgets, and 685 families were enrolled in
WIC through the WIC office serving the county in 2013. The WV Foodlink County Profile for Clay County
documents 14 retail locations that accept food stamps and 2 locations accepting WIC (2015).
There are 1,907 school-age children eligible for free and reduced cost meals at school, and available data
reflects only 81.0% of eligible students participate in the program (WV FoodLink).
Income and Assets:
Community Survey responses indicate low income residents need information about available resources
and programs that may assist them. Education about money management including responsible use of
income, using credit, budgeting, using bank accounts, and other issues related to financial literacy are also
seen as a high priority by the key informants in Clay County. Information and education about these issues
are the types of services most needed based on survey responses from key informants. 79.2% of
54.6%
18.2%
22.7%
31.8%
59.1%
45.5%
13.6%
31.8%
Increased availability of food programs such as Senior Centermeals, "meals on wheels" or food pantries.
Increased access to free and reduced lunch in schools.
Increased access to food stamps (SNAP).
Increased access to meal delivery programs.
Additional outlets (grocery stores) for purchase of healthyfood.
Transportation to grocery store, food pantry, or other foodresources.
Education about available nutrition programs such as SNAP,WIC, food pantries, etc.
Education about healthy food choices.
Nutrition and Supplemental Food Programs N=22Percent Key Informants Identifying Service as Most Needed

14
respondents indicated information about available resources such as health insurance coverage, nutrition
programs, housing subsidies, etc. was a priority need in the county. 70.8% believe education about money
management was one of the most needed services to improve financial literacy and use of income.
Available data from the 2015 FDIC Survey of Unbanked and Underbanked households indicates 8.7% of
Clay County households are “unbanked” (have no checking or savings accounts).
The 5 Clay County service recipients who related their experience and needs about money and finances
identified three types of information they would find useful. 60% (3 of the 5 clients) said they would like
information about (1) how to take advantage of federal tax credits, (2) money management (using credit,
banking etc.), and (3) information about health insurance, food programs, housing subsidies or other
programs that may help lower income people make ends meet.
Transportation:
Additional access to public transportation was identified as the most needed service within this domain
by the key informants. 66.7% of the informants participating in the survey indicated increasing access to
public transportation was a priority, and 45.8% said information about available transportation services
was needed by county residents.
79.2%
33.3%
16.7%
70.8%
16.7%
41.7%
25.0%
Information about available resources for lower incomepersons.
Education about how to build financial assets - save and investmoney.
Education/counseling about use of credit.
Education about money management (using credit, budgeting,bank accounts, etc.).
Information about federal tax credits (low income credit, childcare credit, etc.).
Education/counseling about the responsible use of income.
Information and assistance with securing child support.
Income and Assets N=24Perecent Key Informants Indicating Service as Most Needed

15
More than half of the respondents (62.5%) also thought a vehicle donation programs to make available
dependable but low-cost vehicles to people in need was a high priority.
All four of the service recipients surveyed about transportation needs said they need to know what
transportation services might be
available in the area, and 3 of 4
service recipients said they need a
vehicle to get a job.
Half of the clients completing the
survey indicated they need to know
where to take a vehicle to get it
repaired at a fair price.
Dependable transportation is necessary
for most county residents to access their
work location. The mean travel time to
work for current workers is 45.3 minutes.
Most workers rely on private
transportation to get from home to their
work site. 95.6% of all persons employed
either drive alone or car pool to work
(ACS 2011-16).
There are currently no public transit
services available in Clay County; however, specialized transportation services appear to be available
45.8%
66.7%
33.3%
62.5%
20.8%
12.5%
8.3%
16.7%
Information about available transportation services.
Additional public transportation services.
Uber type services that provide on-call transportation asneeded.
Additional vehicle donation programs to make available lowcost, dependable vehicles to people.
Information about reputable mechanics/car repair services inthe area.
Information and advice about buying a vehicle.
Information and education about the costs of owning andoperating a vehicle.
Assistance with learning to drive and getting a drivers license.
Transportation and Public Transit Services N=24Percent Key Informants Indicating Service as Most Neded
75.4%
20.2%
0.0% 1.2% 0.8% 2.4%
Drove aloneto work
Car pooled towork
Publictransportation
Walked Other means Worked atHome
Type of Transportation to WorkPercent Employed
100.0%
75.0%
50.0%
25.0%
I need to know what transportationservices might be available in my area.
I need a vehicle in order to get a job.
I need to know where to take myvehicle to get it repaired at a fair price.
I need help with learning to drive andgetting a drivers license.
Client Experiences Related to Transportation N=4

16
through some local agencies including the Clay County Development Corporation, Prestera Center, and
Head Start.
Emergency Services: The most frequently cited needs within the emergency services domain are temporary emergency shelter,
additional access to food, and assistance in securing housing in disaster situations. Half (50.0%) of all key
informants knowledgeable of community conditions in Clay County prioritized these three areas of need.
37.5% of those completing the community survey selected assistance with prescription drug costs,
emergency medical transportation, and assistance with medical emergencies as one of the top three needs
in the county.
Clients surveyed were primarily concerned about putting food on the table. 100% of the 4 service
recipients who shared experiences related to emergency situations identified help with obtaining adequate
food as the area they are most concerned about. One of the clients said they have needed temporary
housing due to a flood, fire, eviction or other crisis, and one needed police to come to their home.
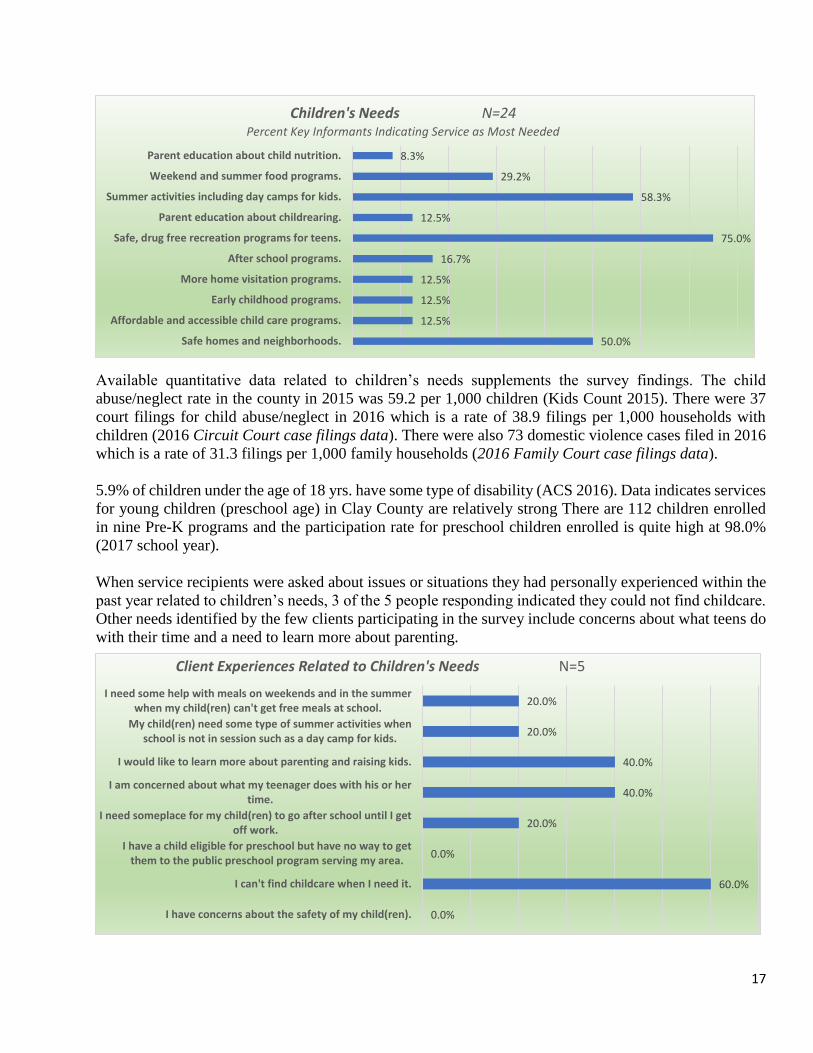
Children’s Needs: Safe and drug free recreational programs for teens and summer programs were identified as the major
areas of concern when community survey respondents were asked about the needs of children. Half or
more of the community survey respondents indicated the most needed services and programs for children
include:
Safe and drug free recreation programs for teens (75.0%),
Summer activities for children/youth including day camps (58.3%), and
Safe homes and neighborhoods (50%).
50.0%
50.0%
37.5%
37.5%
25.0%
12.5%
37.5%
50.0%
Additional access to food.
Additional access to emergency shelter due to domesticviolence, flood, fire, eviction, etc.
Additional access to emergency medical transportation(ambulance services).
Additional access to services in a medical emergency or drugoverdose situation
More equitable distribution of law enforcement personnelthroughout county.
Additional access to emergency (on-call) mental healthservices.
Assistance with necessary prescription drug costs notcovered by insurance.
Assistance with securing housing if home is lost due to adisaster (flood, fire, etc.).
Emergency Services N=24Percent Key Informants Indicating Service as Most Needed
17
Available quantitative data related to children’s needs supplements the survey findings. The child
abuse/neglect rate in the county in 2015 was 59.2 per 1,000 children (Kids Count 2015). There were 37
court filings for child abuse/neglect in 2016 which is a rate of 38.9 filings per 1,000 households with
children (2016 Circuit Court case filings data). There were also 73 domestic violence cases filed in 2016
which is a rate of 31.3 filings per 1,000 family households (2016 Family Court case filings data).
5.9% of children under the age of 18 yrs. have some type of disability (ACS 2016). Data indicates services
for young children (preschool age) in Clay County are relatively strong There are 112 children enrolled
in nine Pre-K programs and the participation rate for preschool children enrolled is quite high at 98.0%
(2017 school year).
When service recipients were asked about issues or situations they had personally experienced within the
past year related to children’s needs, 3 of the 5 people responding indicated they could not find childcare.
Other needs identified by the few clients participating in the survey include concerns about what teens do
with their time and a need to learn more about parenting.
50.0%
12.5%
12.5%
12.5%
16.7%
75.0%
12.5%
58.3%
29.2%
8.3%
Safe homes and neighborhoods.
Affordable and accessible child care programs.
Early childhood programs.
More home visitation programs.
After school programs.
Safe, drug free recreation programs for teens.
Parent education about childrearing.
Summer activities including day camps for kids.
Weekend and summer food programs.
Parent education about child nutrition.
Children's Needs N=24Percent Key Informants Indicating Service as Most Needed
0.0%
60.0%
0.0%
20.0%
40.0%
40.0%
20.0%
20.0%
I have concerns about the safety of my child(ren).
I can't find childcare when I need it.
I have a child eligible for preschool but have no way to getthem to the public preschool program serving my area.
I need someplace for my child(ren) to go after school until I getoff work.
I am concerned about what my teenager does with his or hertime.
I would like to learn more about parenting and raising kids.
My child(ren) need some type of summer activities whenschool is not in session such as a day camp for kids.
I need some help with meals on weekends and in the summerwhen my child(ren) can't get free meals at school.
Client Experiences Related to Children's Needs N=5

18
Senior Needs
There are 1,155 households with Seniors in Clay County and 51.2% of Seniors have some type of
disability. 10.6% of the Senior population lives alone (ACS 2016). It is estimated that 23.2% of
grandparents who live with their grandchildren are responsible for raising grandchildren under 18 yrs. of
age.
The most prevalent Senior needs identified by the key informant responses is meal delivery services, and
home modifications to accommodate handicapping conditions or limited mobility. 82.6% of the key
informants indicated meal delivery was a “most needed” service within the Senior Needs domain. 69.6%
prioritized home modifications for Seniors with a handicap or mobility issue.
When low income service recipients in Clay County were asked about the needs of Seniors, only 2 people
responded. Both said they need information about their Medicaid or Medicare benefits.
Primary Strengths and Community Resources Community survey respondents in Clay County were asked what they considered to be the greatest
strengths within the Clay County services system and they were asked to select all options they consider
to be a “particular strength”.
69.6%
82.6%
47.8%
17.4%
26.1%
30.4%
Home modifications to accommodate handicaps or limitedmobility.
Meal delivery services.
Improved access to the State Health Insurance AssistanceProgram (SHIP) for Medicaid beneficiaries.
Education/counseling services related to financial issuessuch as reverse mortgage, selling life insurance policies,…
Information about Internet or phone fraud targeted atSeniors.
Availability of for-hire, Uber-type transportation services.
Senior Needs N=23Percent key Informants Indicating Service as Most Needed
20.0%
5.0%
50.0%
20.0%
20.0%
15.0%
0.0%
30.0%
5.0%
45.0%
20.0%
Social programs.
Access to good healthcare.
Public education system.
Early childhood programs.
Public transportation.
Job opportunities (availability of good jobs).
Safe and affordable housing.
Nutrition and supplemental food programs.
Opportunities to learn about money management.
Emergency services/First responders.
Services and programs for Seniors.
Service System Strengths N=20Percent Indicating Service Area is a Strength

19
The public education system and first responders are the strongest components of the service system in
Clay County based on the responses of key informants. 50.0% of the respondents selected public education
as a “particular strength and 45.0% indicated they though emergency services provided by first responders
was a strong component of the overall system.
Nine service recipients offered their opinion about strengths in the services system and the service
recipients surveyed agreed that the public schools are the strongest service system domain in their
community. One in three (33.3%) of the service recipients also think early childhood services are strong.
Other types of services were seen by few or none of the clients as a strength.
Persons participating in the community discussion held in Clay County identified a number of strengths
and assets within the county including:
Great educational system
People who desire to have a small community and know they’re part of it
Beautiful community, mountains, and scenery
May 5th railroad trail
Churches and communities of faith
JG Bradley Lodge and Campground
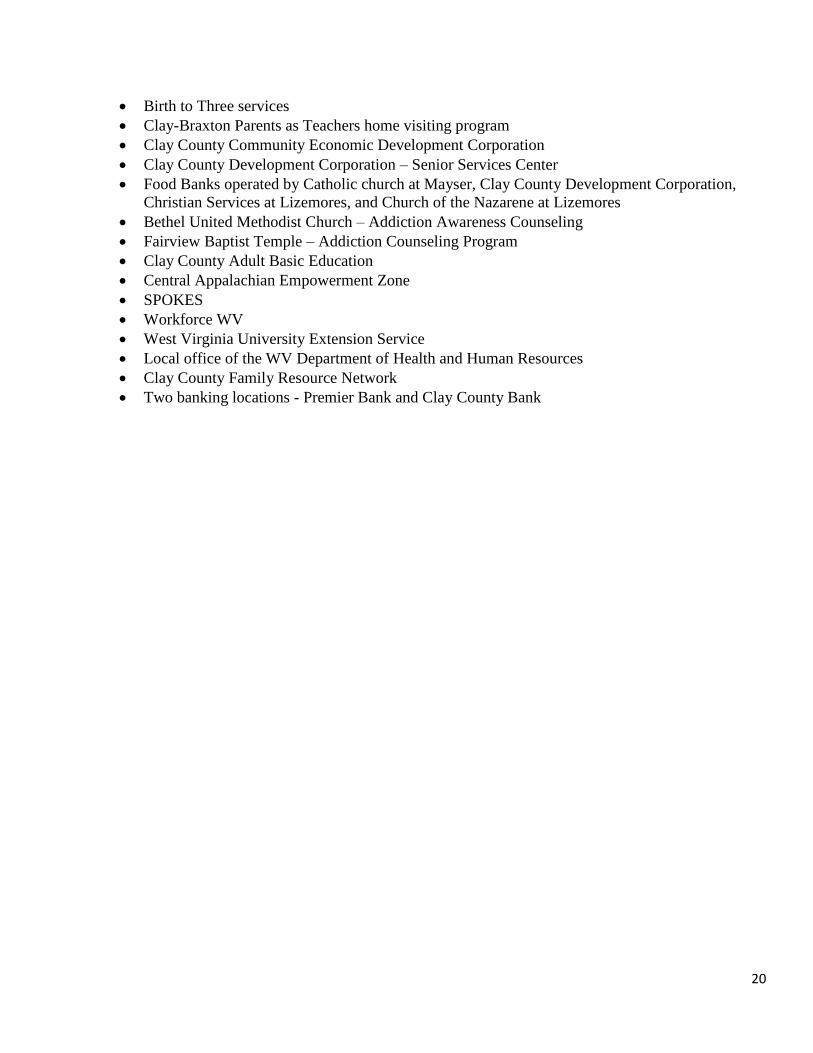
Some of the resources that address the needs of low income families identified within Clay County
include:
A range of public health and healthcare services provided by Clay County Health Department,
School-based Health Centers at Big Otter Elementary, Clay Elementary, Clay County Middle,
and Clay County High schools
Behavioral Health services provided by Prestera Center
Right from the Start program for Medicaid eligible pregnant women and infants
Six licensed family day care providers
One Day Care facility
Nine Pre-K public school classrooms
Five Head Start locations
11.1%
11.1%
66.7%
33.3%
0.0%
0.0%
11.1%
22.2%
0.0%
0.0%
11.1%
Social programs.
Healthcare system.
Public education system.
Early childhood programs.
Public transportation.
Job opportunities (availability of good jobs).
Safe and affordable housing.
Nutrition and supplemental food programs.
Opportunities to learn about money management.
Emergency services/First responders.
Services and programs for Seniors.
Client Perception of Strengths in Service System N=9
20
Birth to Three services
Clay-Braxton Parents as Teachers home visiting program
Clay County Community Economic Development Corporation
Clay County Development Corporation – Senior Services Center
Food Banks operated by Catholic church at Mayser, Clay County Development Corporation,
Christian Services at Lizemores, and Church of the Nazarene at Lizemores
Bethel United Methodist Church – Addiction Awareness Counseling
Fairview Baptist Temple – Addiction Counseling Program
Clay County Adult Basic Education
Central Appalachian Empowerment Zone
SPOKES
Workforce WV
West Virginia University Extension Service
Local office of the WV Department of Health and Human Resources
Clay County Family Resource Network
Two banking locations - Premier Bank and Clay County Bank