Embed Size (px)
Citation preview

Community Matters – ASA Community Matters – ASA 0909Understanding your Community

Indiana Partnerships for Indiana Partnerships for Lifespan Communities Lifespan Communities
The first application of the AdvantAge Initiative on a statewide basis
Three year Administration on Aging Planning Demonstration Site
“…a comprehensive, participatory, and data driven initiative to create good places to grow up and grow
old in Indiana.”

Indiana Partnerships for Indiana Partnerships for Lifespan Communities Lifespan Communities
Years One and Two: Groundwork
•State level partnerships and Steering CommitteeDivision of Aging, Indiana Family and Social Services
AdministrationCenter on Aging and Community, Indiana University Indiana Association of Area Agencies on AgingSelf-Advocates of Indiana, Inc.
•Professional Development Workshops StatewideAdvantAge Initiative Workshops: Mia Oberlink /J. BeilensonBuilding Community Partnerships: Mike WinerCommunities for All Ages: Nancy Henkin
•Fund Development for statewide survey and community engagementIAAA - $150,000Div of Aging - $50,000Daniels Fund - $100,000Lilly Endowment - $100,000
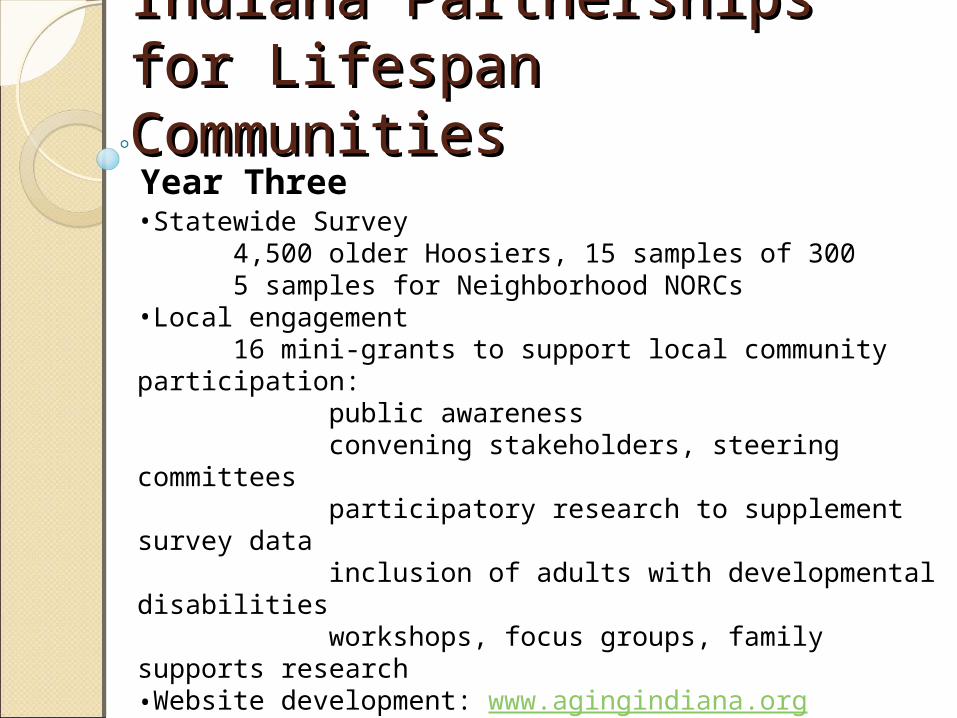
Indiana Partnerships for Indiana Partnerships for Lifespan Communities Lifespan Communities Year Three•Statewide Survey
4,500 older Hoosiers, 15 samples of 300 5 samples for Neighborhood NORCs
•Local engagement16 mini-grants to support local community participation:
public awarenessconvening stakeholders, steering committeesparticipatory research to supplement survey data inclusion of adults with developmental disabilitiesworkshops, focus groups, family supports research
•Website development: www.agingindiana.org•Engagement with philanthropy
Materials and workshops for State Chamber of Commerce , Indiana Grantmakers Alliance EngAgement Initiative
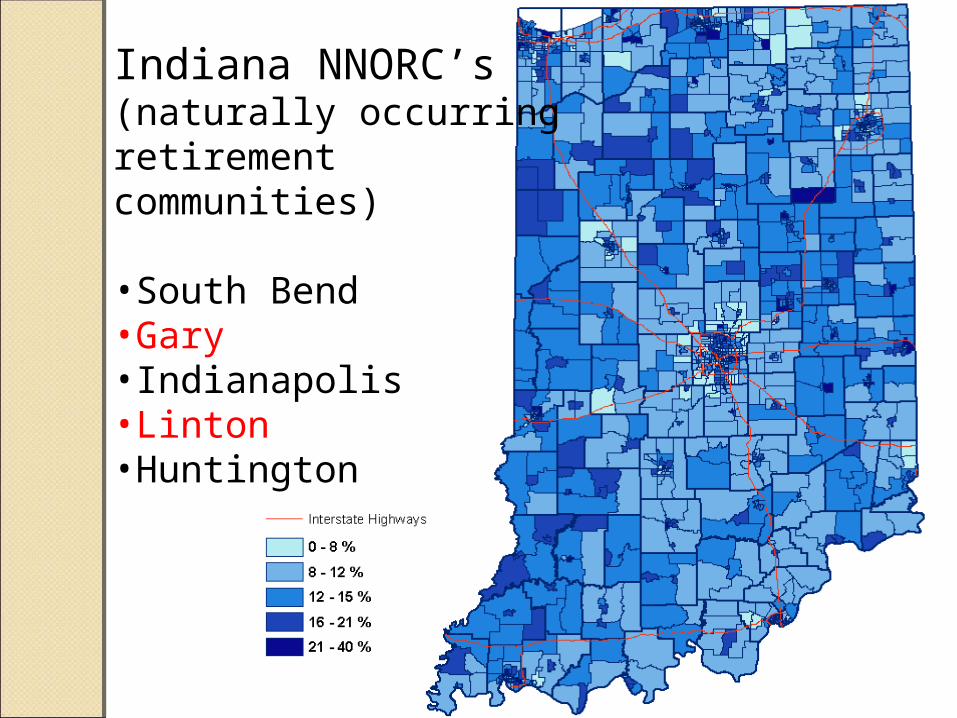
Indiana NNORC’s(naturally occurring retirement communities)
•South Bend •Gary •Indianapolis •Linton•Huntington
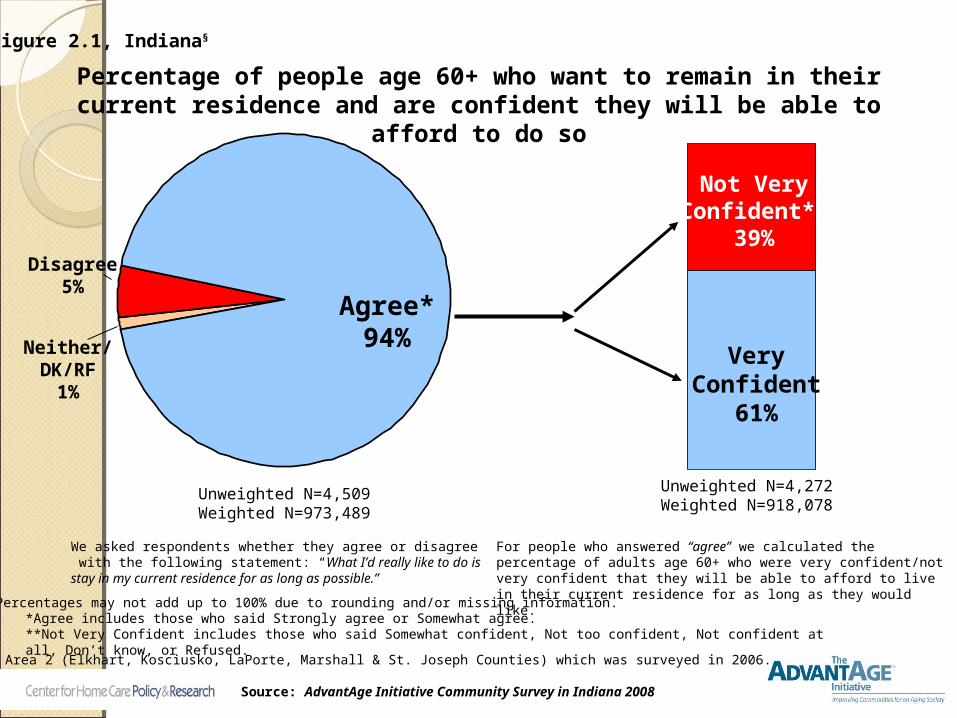
Percentage of people age 60+ who want to remain in their current residence and are confident they will be able to afford to do so
Unweighted N=4,272Weighted N=918,078
Unweighted N=4,509Weighted N=973,489
Disagree5%
Agree*94%
VeryConfident
61%
Not VeryConfident**
39%
Neither/DK/RF
1%
We asked respondents whether they agree or disagree with the following statement: “What I’d really like to do is stay in my current residence for as long as possible.”
For people who answered “agree” we calculated the percentage of adults age 60+ who were very confident/not very confident that they will be able to afford to live in their current residence for as long as they would like.
*Agree includes those who said Strongly agree or Somewhat agree.**Not Very Confident includes those who said Somewhat confident, Not too confident, Not confident at all, Don’t know, or Refused.
Figure 2.1, Indiana§
Note: Percentages may not add up to 100% due to rounding and/or missing information.
Source: AdvantAge Initiative Community Survey in Indiana 2008
§ Excludes Area 2 (Elkhart, Kosciusko, LaPorte, Marshall & St. Joseph Counties) which was surveyed in 2006.
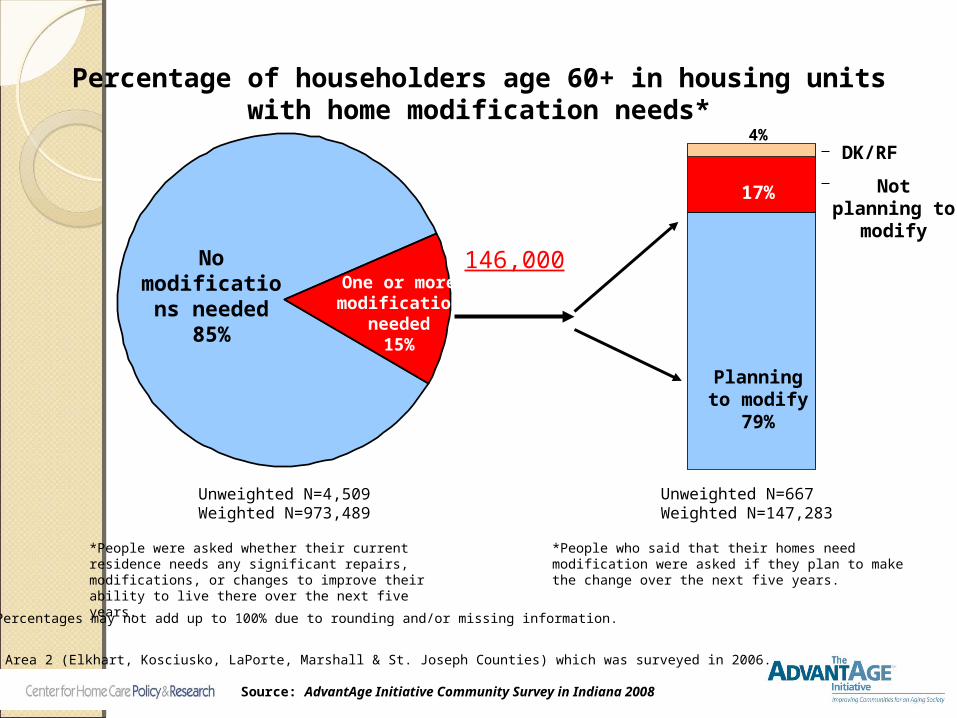
Percentage of householders age 60+ in housing units with home modification needs*
Unweighted N=667Weighted N=147,283
Unweighted N=4,509Weighted N=973,489
One or more modification
needed15%
No modifications
needed85%
Planning to modify
79%
Not planning to modify
*People were asked whether their current residence needs any significant repairs, modifications, or changes to improve their ability to live there over the next five years.
*People who said that their homes need modification were asked if they plan to make the change over the next five years.
Note: Percentages may not add up to 100% due to rounding and/or missing information.
17%
4%DK/RF
Source: AdvantAge Initiative Community Survey in Indiana 2008
§ Excludes Area 2 (Elkhart, Kosciusko, LaPorte, Marshall & St. Joseph Counties) which was surveyed in 2006.
146,000
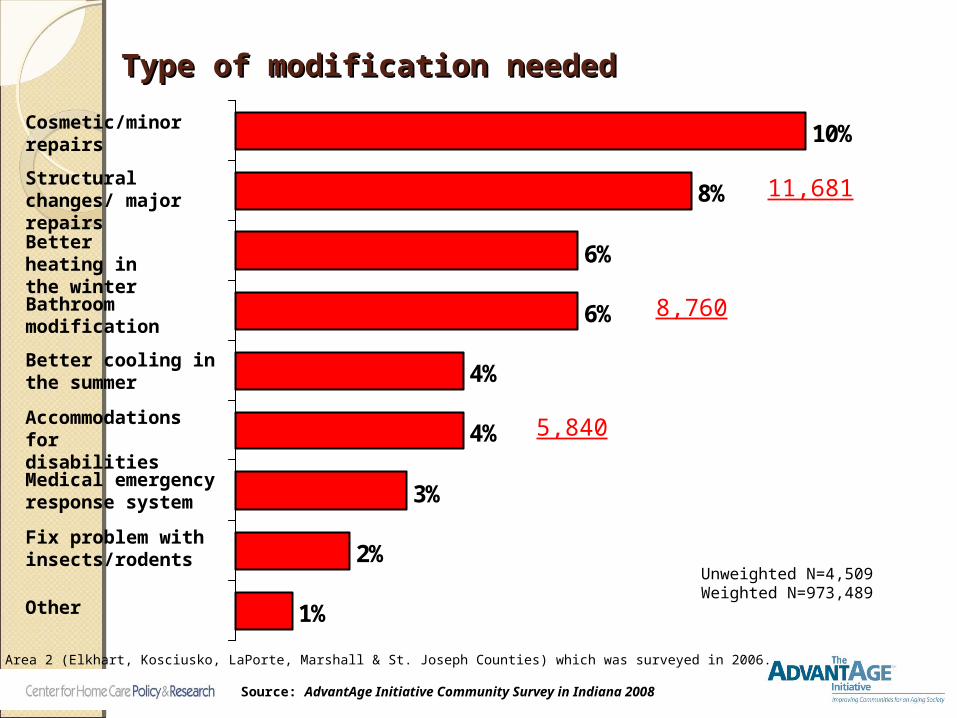
Type of modification neededType of modification needed
1%
2%
3%
4%
4%
6%
6%
8%
10%Cosmetic/minor repairs
Better cooling in the summer
Accommodations for disabilities
Structural changes/ major repairs
Bathroom modification
Medical emergency response system
Fix problem with insects/rodents
Other
Better heating in the winter
Unweighted N=4,509Weighted N=973,489
Source: AdvantAge Initiative Community Survey in Indiana 2008
§ Excludes Area 2 (Elkhart, Kosciusko, LaPorte, Marshall & St. Joseph Counties) which was surveyed in 2006.
11,681
5,840
8,760

Percentage of people age 60+ who do not know whom to Percentage of people age 60+ who do not know whom to call if they need information about services in their call if they need information about services in their community*community*
Unweighted N=4,509Weighted N=973,489
Note: Percentages may not add up to 100% due to rounding and/or missing information.
*People were asked to indicate the best resource, such as a person or an organization, in their city, town, or county to get information on various services.
Do Not Know Whom to Call
25%
Family/Neighbors
City/County/Office of Aging/Social Services/Other Agency
27%
Church/Synagogue
3%
Other
Internet/Phone Book/Other Media
2%
Senior Center12%
Source: AdvantAge Initiative Community Survey in Indiana 2008
5%
Medical Center/Health Professional
16%
10%
§ Excludes Area 2 (Elkhart, Kosciusko, LaPorte, Marshall & St. Joseph Counties) which was surveyed in 2006.

Percentage of people age 60+ who had problems paying for medical care,* Percentage of people age 60+ who had problems paying for medical care,* by demographicsby demographics
11%
4%
3%
6%
3%
4%
8%
5%
Unweighted N= 4,509Weighted N= 973,489
Figure 18.2, Indiana§
*People were asked whether there was a time in the past 12 months when they did not have enough money to follow up on tests or treatment recommended by a doctor.
Source: AdvantAge Initiative Community Survey in Indiana 2008
Total
Age 60-64
Age 65-74
Men
White non-Hispanic
Women
Age 75+
Non-white
§ Excludes Area 2 (Elkhart, Kosciusko, LaPorte, Marshall & St. Joseph Counties) which was surveyed in 2006.
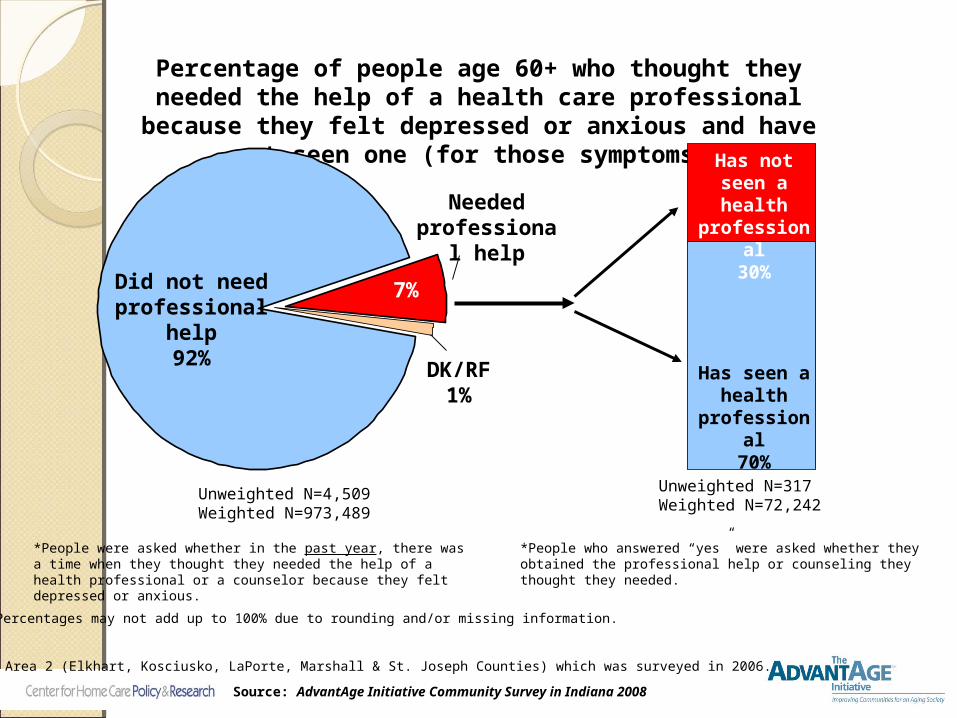
Percentage of people age 60+ who thought they needed the help of a health care professional because they felt depressed
or anxious and have not seen one (for those symptoms)*
Unweighted N=317Weighted N=72,242
Unweighted N=4,509Weighted N=973,489
7%
Has seen a health
professional70%
Has not seen a health
professional30%
Did not need professional
help92%
Note: Percentages may not add up to 100% due to rounding and/or missing information.
*People were asked whether in the past year, there was a time when they thought they needed the help of a health professional or a counselor because they felt depressed or anxious.
*People who answered “yes” were asked whether they obtained the professional help or counseling they thought they needed.
Source: AdvantAge Initiative Community Survey in Indiana 2008
Needed professional
help
§ Excludes Area 2 (Elkhart, Kosciusko, LaPorte, Marshall & St. Joseph Counties) which was surveyed in 2006.
DK/RF1%
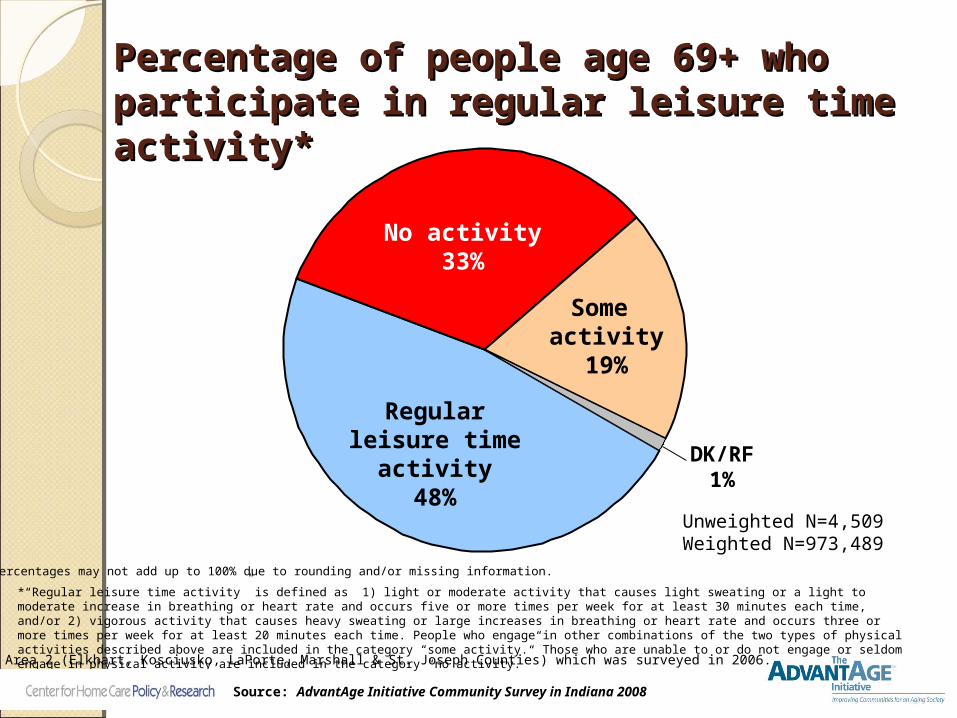
Percentage of people age 69+ who participate Percentage of people age 69+ who participate in regular leisure time activity*in regular leisure time activity*
Unweighted N=4,509Weighted N=973,489
Note: Percentages may not add up to 100% due to rounding and/or missing information.
*“Regular leisure time activity” is defined as 1) light or moderate activity that causes light sweating or a light to moderate increase in breathing or heart rate and occurs five or more times per week for at least 30 minutes each time, and/or 2) vigorous activity that causes heavy sweating or large increases in breathing or heart rate and occurs three or more times per week for at least 20 minutes each time. People who engage in other combinations of the two types of physical activities described above are included in the category “some activity.” Those who are unable to or do not engage or seldom engage in physical activity are included in the category “no activity.”
No activity33%
Regular leisure time activity
48%
Some activity
19%
Source: AdvantAge Initiative Community Survey in Indiana 2008
§ Excludes Area 2 (Elkhart, Kosciusko, LaPorte, Marshall & St. Joseph Counties) which was surveyed in 2006.
DK/RF1%
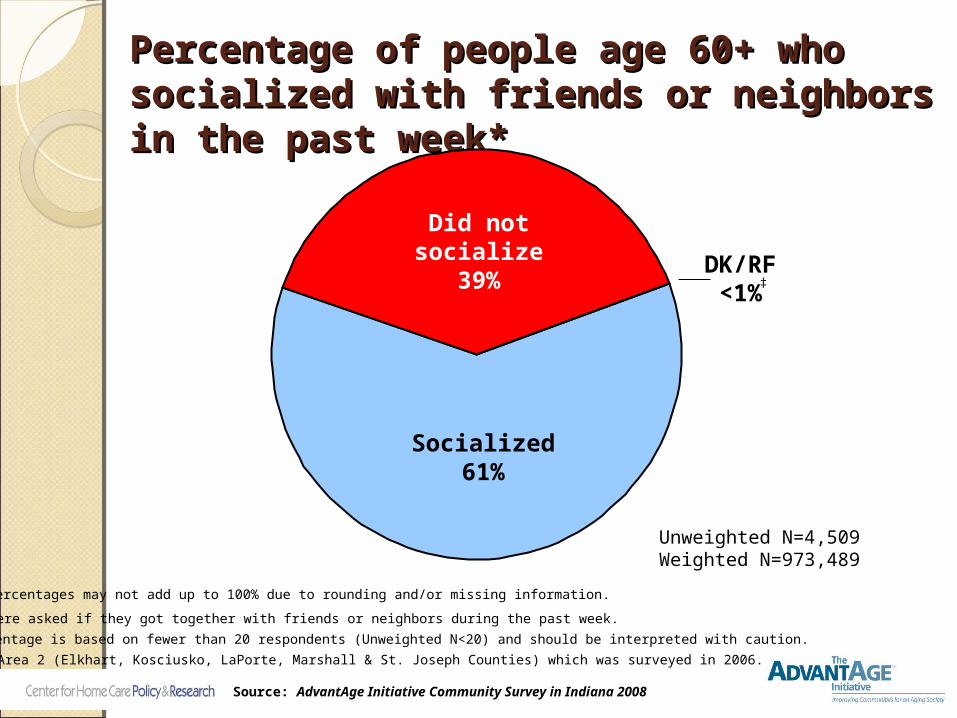
Percentage of people age 60+ who socialized Percentage of people age 60+ who socialized with friends or neighbors in the past week*with friends or neighbors in the past week*
Did not socialize
39%
Socialized61%
Unweighted N=4,509Weighted N=973,489
Note: Percentages may not add up to 100% due to rounding and/or missing information.
*People were asked if they got together with friends or neighbors during the past week.
Source: AdvantAge Initiative Community Survey in Indiana 2008
§ Excludes Area 2 (Elkhart, Kosciusko, LaPorte, Marshall & St. Joseph Counties) which was surveyed in 2006.
DK/RF<1%
‡ This percentage is based on fewer than 20 respondents (Unweighted N<20) and should be interpreted with caution.
‡

Active and Contributing!Active and Contributing!85% voted in last
election37% contacted an
elected representative
89% made donation of goods or services to charity
22% provide help to frail or disabled friend and family
7% live with grandchildren
23% non-working would like to work for pay
39% participated in volunteer work
81% report good to excellent health
48% engage in regular physical activity
88% engaged in at least one social, religious or cultural activity last week
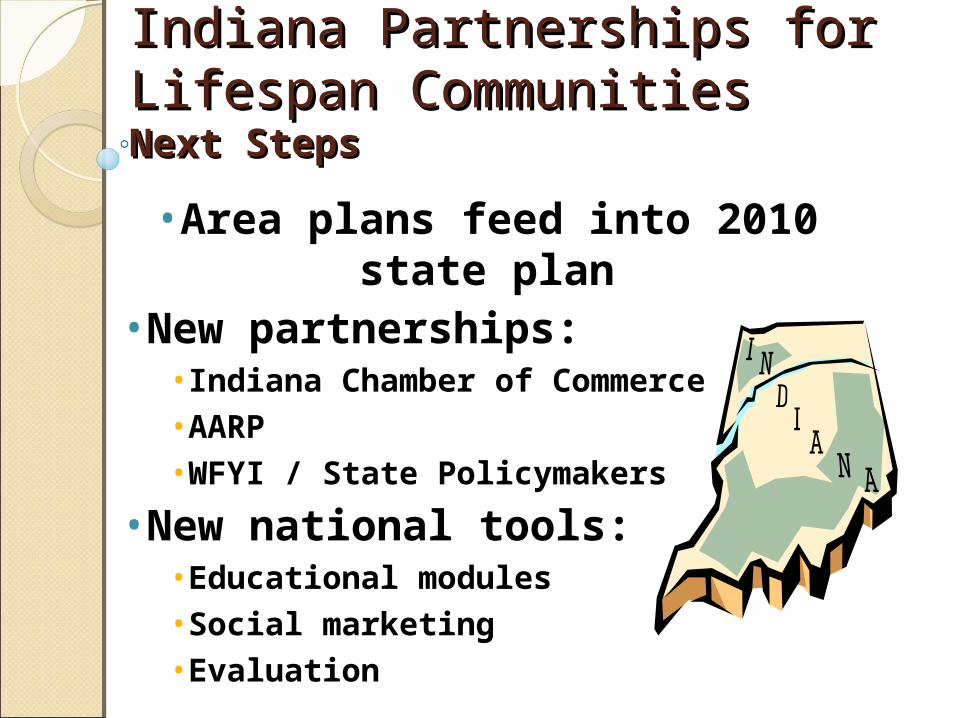
Indiana Partnerships for Indiana Partnerships for Lifespan CommunitiesLifespan CommunitiesNext StepsNext Steps
•Area plans feed into 2010 state plan
•New partnerships:•Indiana Chamber of Commerce•AARP•WFYI / State Policymakers
•New national tools:•Educational modules•Social marketing•Evaluation
Numbers don’t stand on their own…
we have to make meaning from the data.

FramingFraming the issue may be the the issue may be the most important thing we do…most important thing we do…
For – how we define the
problem will determine what we do to solve it.
Using Data to Tell Your Story Using Data to Tell Your Story and and Move towards Action Move towards Action
Philip B. Stafford, Ph.D.
Center on Aging and Community,
Indiana Institute on Disability and Community
812-855-2163 [email protected]
Neighborhood NORC Workshop
May 15,2008

Aging is not about time and the body, but about relationships… and the meaning of place.
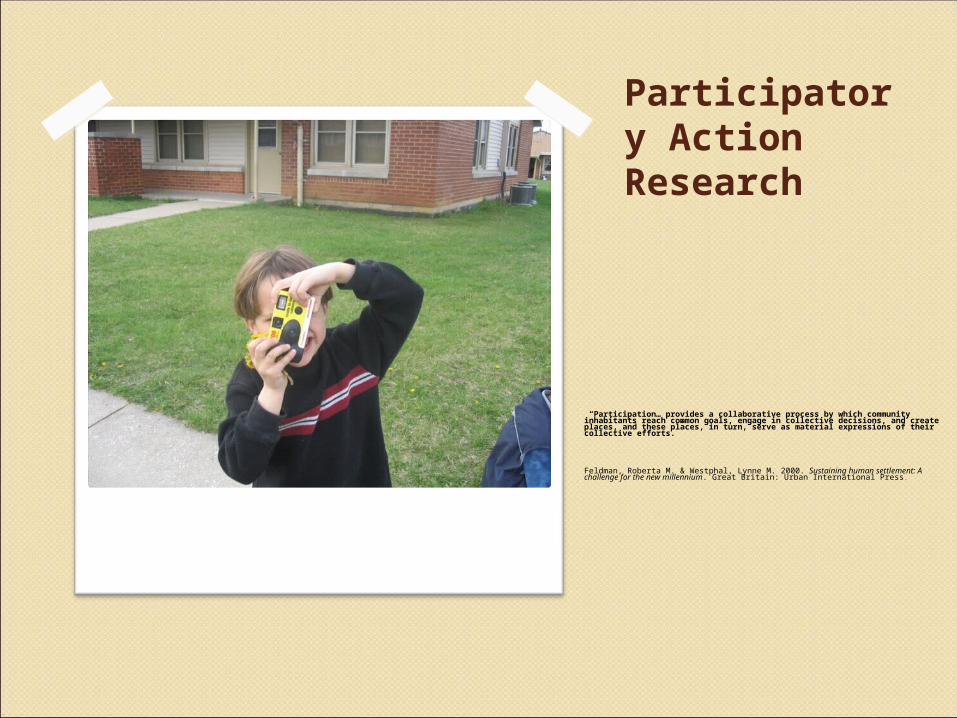
Participatory Action Research
“Participation… provides a collaborative process by which community inhabitants reach common goals, engage in collective decisions, and create places, and these places, in turn, serve as material expressions of their collective efforts.”
Feldman, Roberta M. & Westphal, Lynne M. 2000. Sustaining human settlement: A challenge for the new millennium. Great Britain: Urban International Press.

Why participation? Why participation?
Counter decline in civic engagement.
Broaden accountability.
People need to know fully the process and how they fit in.
Public “input” meetings alone are unsatisfactory.
Diverse public suggests diverse modes of learning & interpretation.
The people need tools to be on an equal plane with holders of power.
Builds the democracy.
Help frame issues.
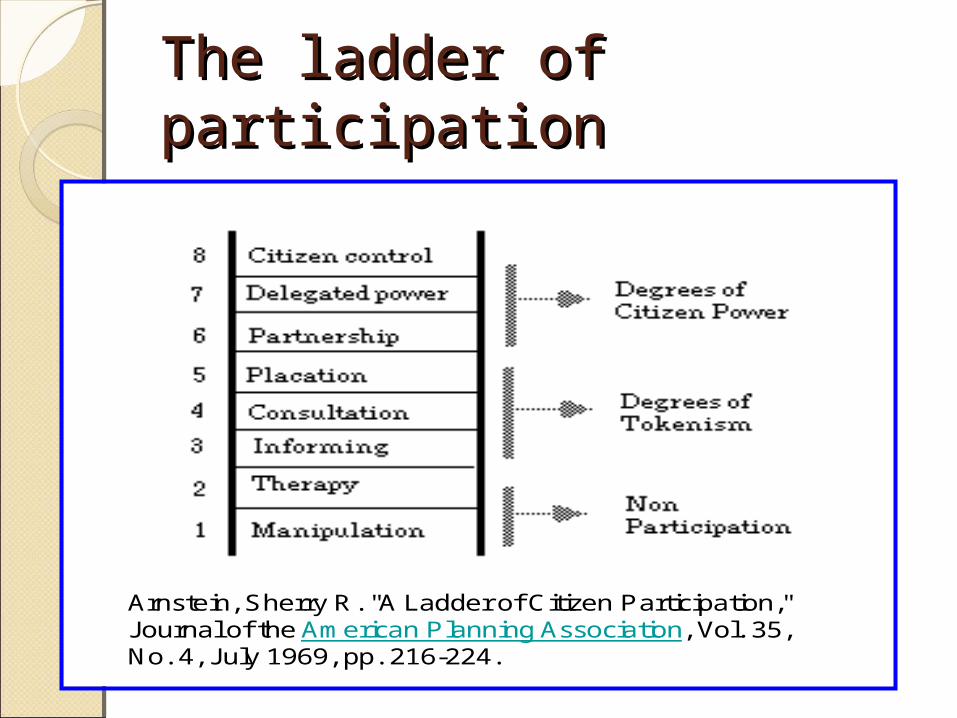
The ladder of participationThe ladder of participation
Arnstein, Sherry R. "A Ladder of Citizen Participation," Journal of the American Planning Association, Vol. 35, No. 4, July 1969, pp. 216-224.
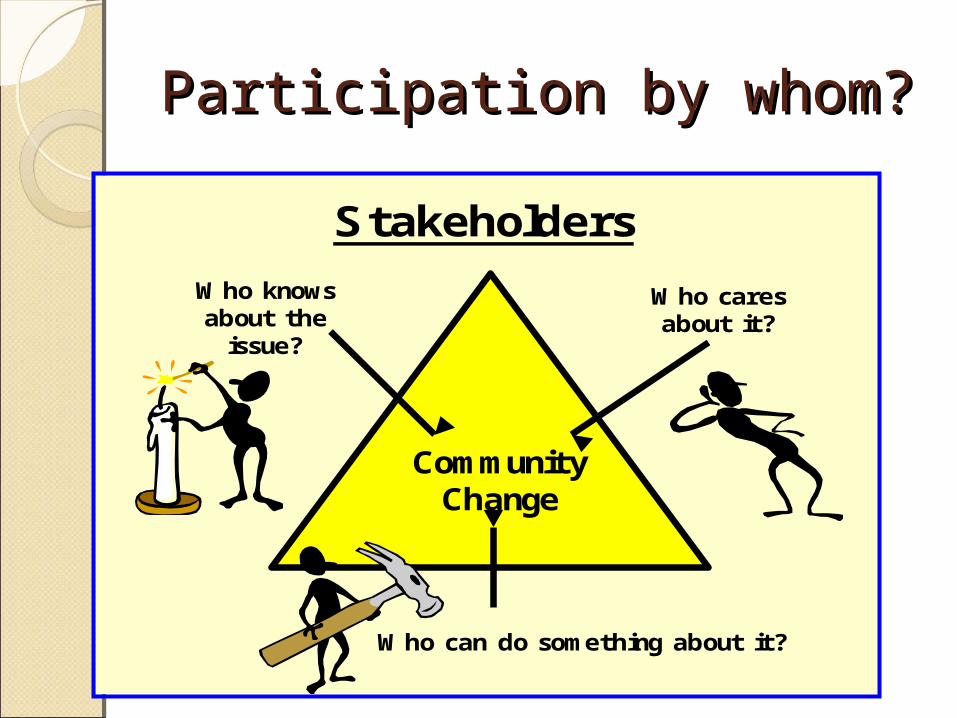
Participation by whom? Participation by whom?
Who knows about the
issue?
Who cares about it?
Who can do something about it?
Stakeholders
Community Change
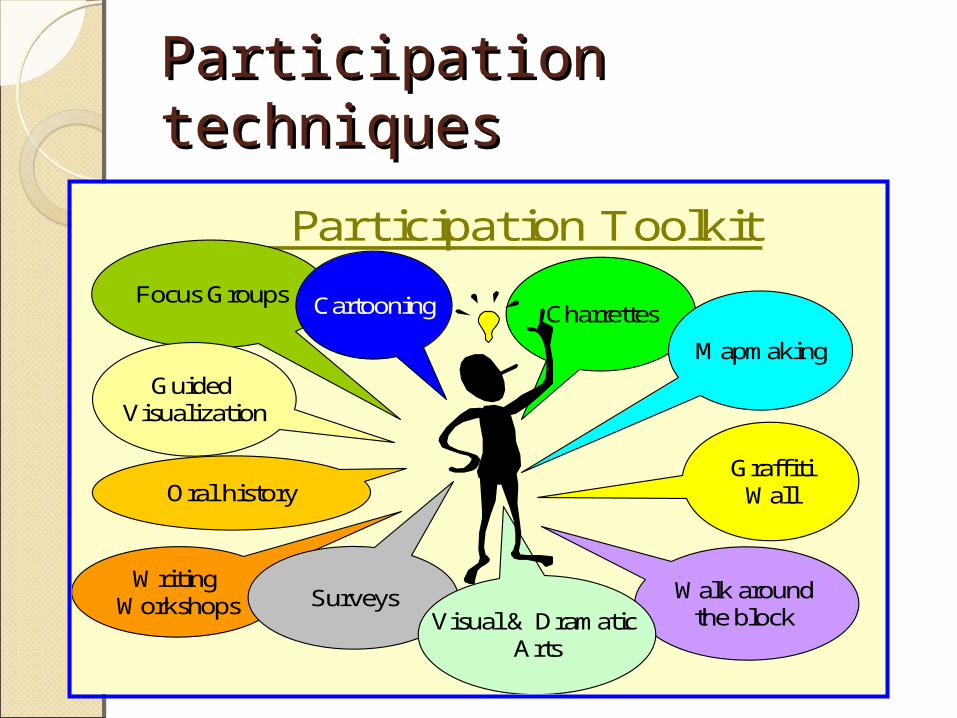
Participation techniquesParticipation techniques
Participation Toolkit
Focus GroupsCharrettes
Mapmaking
Guided Visualization
Walk around the block
Writing Workshops Surveys
Cartooning
GraffitiWall
Visual & Dramatic Arts
Oral history

An accessible “center” housing data, tools and resources for
planning livable lifespan
communities, organized around
33 universal indicators
up to date demographic
data
Utilization data and evaluation
tools
Asset inventories
Area consumer data and
national archive
Evidence based research findings
Other stakeholder and
participation data
Best practice resources
Categories of information that communities need to organize and interpret in conducting effective and
participatory planning efforts.

www.agingindiana.org

Contact InformationContact Information
Philip B. Stafford, Ph.D.Director, Center on
Aging and Community, Indiana Institute on Disability & Community
2853 East Tenth, Bloomington, IN, 47408
(812) [email protected] www.agingindiana.org
National AdvantAge Initiative
Mia OberlinkCenter for Home Care
Policy and Research107 East 70th, New York,
New York 10021212-609-1537 www.advantageinitiative.
org