Embed Size (px)
Citation preview
1
Community Health
Status Report
Community Health Indicators
Dutchess County, NY
Report Prepared by Dutchess County Department of Health
April 2012
(Errata June 2013, page 12) (Errata March 2014, page 7)
2
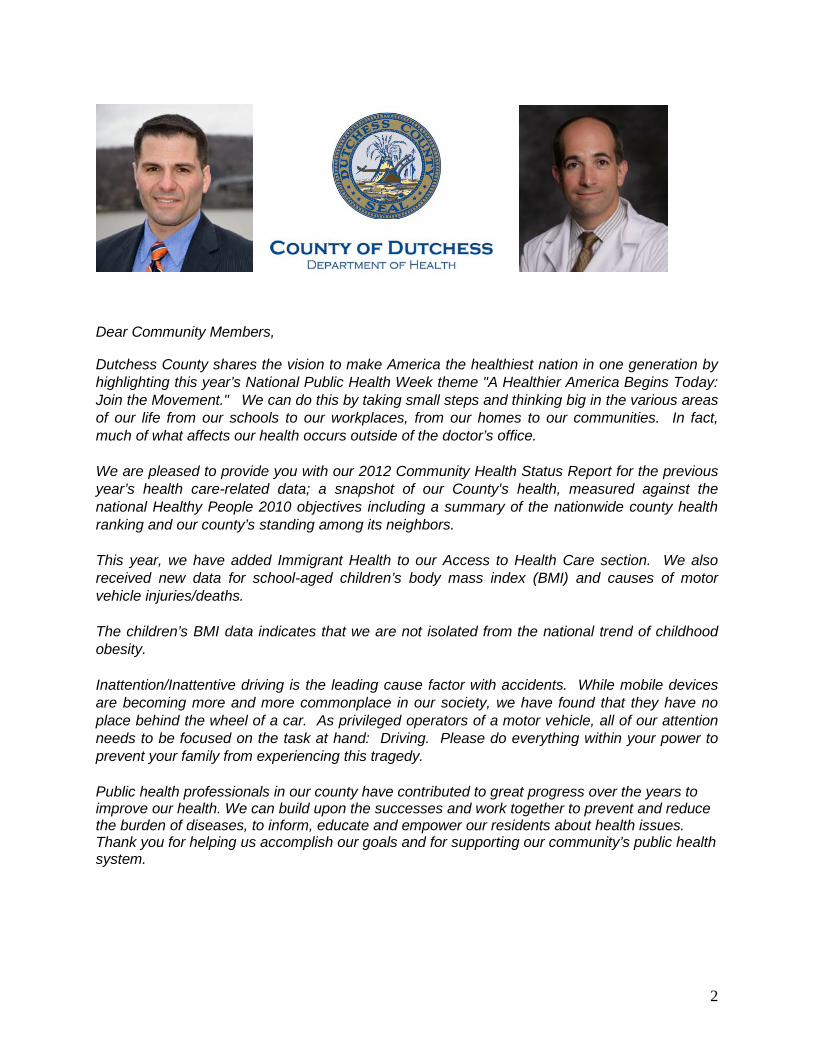
Dear Community Members, Dutchess County shares the vision to make America the healthiest nation in one generation by highlighting this year’s National Public Health Week theme "A Healthier America Begins Today: Join the Movement." We can do this by taking small steps and thinking big in the various areas of our life from our schools to our workplaces, from our homes to our communities. In fact, much of what affects our health occurs outside of the doctor’s office. We are pleased to provide you with our 2012 Community Health Status Report for the previous year’s health care-related data; a snapshot of our County's health, measured against the national Healthy People 2010 objectives including a summary of the nationwide county health ranking and our county’s standing among its neighbors. This year, we have added Immigrant Health to our Access to Health Care section. We also received new data for school-aged children’s body mass index (BMI) and causes of motor vehicle injuries/deaths. The children’s BMI data indicates that we are not isolated from the national trend of childhood obesity. Inattention/Inattentive driving is the leading cause factor with accidents. While mobile devices are becoming more and more commonplace in our society, we have found that they have no place behind the wheel of a car. As privileged operators of a motor vehicle, all of our attention needs to be focused on the task at hand: Driving. Please do everything within your power to prevent your family from experiencing this tragedy. Public health professionals in our county have contributed to great progress over the years to improve our health. We can build upon the successes and work together to prevent and reduce the burden of diseases, to inform, educate and empower our residents about health issues. Thank you for helping us accomplish our goals and for supporting our community’s public health system.
3
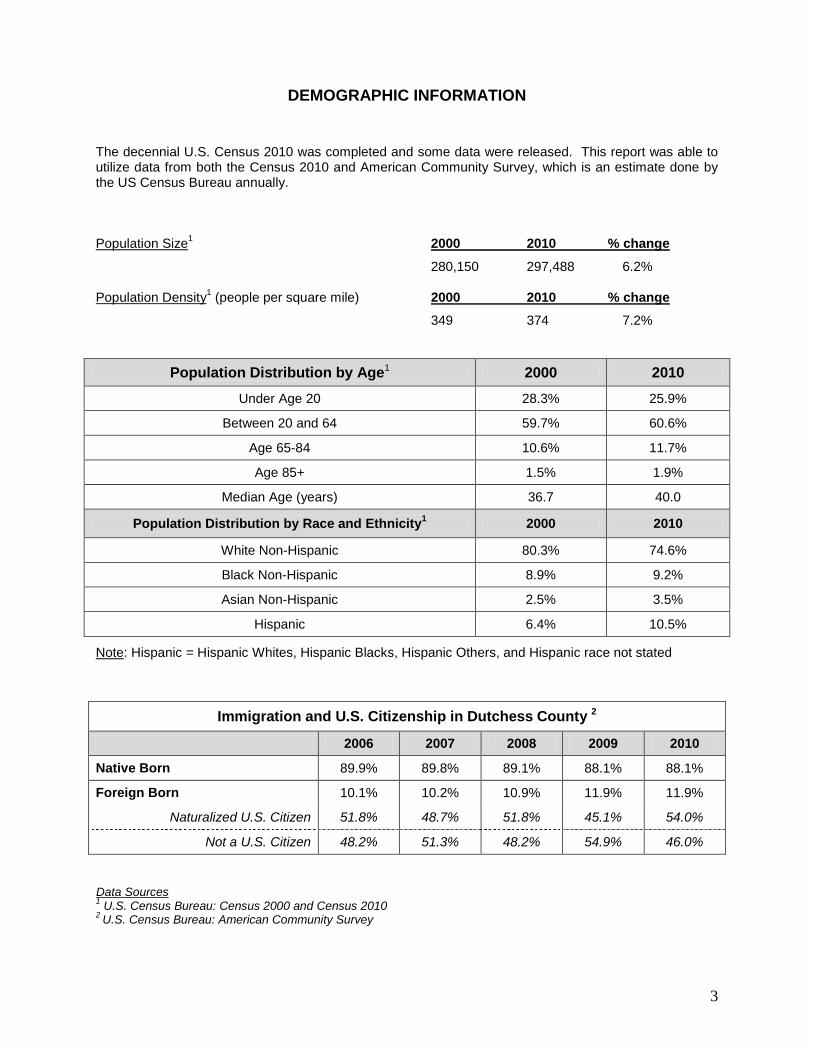
DEMOGRAPHIC INFORMATION The decennial U.S. Census 2010 was completed and some data were released. This report was able to utilize data from both the Census 2010 and American Community Survey, which is an estimate done by the US Census Bureau annually. Population Size1 2000 2010 % change
280,150 297,488 6.2%
Population Density1 (people per square mile) 2000 2010 % change
349 374 7.2%
Population Distribution by Age1 2000 2010
Under Age 20 28.3% 25.9%
Between 20 and 64 59.7% 60.6%
Age 65-84 10.6% 11.7%
Age 85+ 1.5% 1.9%
Median Age (years) 36.7 40.0
Population Distribution by Race and Ethnicity1 2000 2010
White Non-Hispanic 80.3% 74.6%
Black Non-Hispanic 8.9% 9.2%
Asian Non-Hispanic 2.5% 3.5%
Hispanic 6.4% 10.5%
Note: Hispanic = Hispanic Whites, Hispanic Blacks, Hispanic Others, and Hispanic race not stated
Immigration and U.S. Citizenship in Dutchess County 2
2006 2007 2008 2009 2010
Native Born 89.9% 89.8% 89.1% 88.1% 88.1%
Foreign Born 10.1% 10.2% 10.9% 11.9% 11.9%
Naturalized U.S. Citizen 51.8% 48.7% 51.8% 45.1% 54.0%
Not a U.S. Citizen 48.2% 51.3% 48.2% 54.9% 46.0% Data Sources 1 U.S. Census Bureau: Census 2000 and Census 2010 2 U.S. Census Bureau: American Community Survey
4
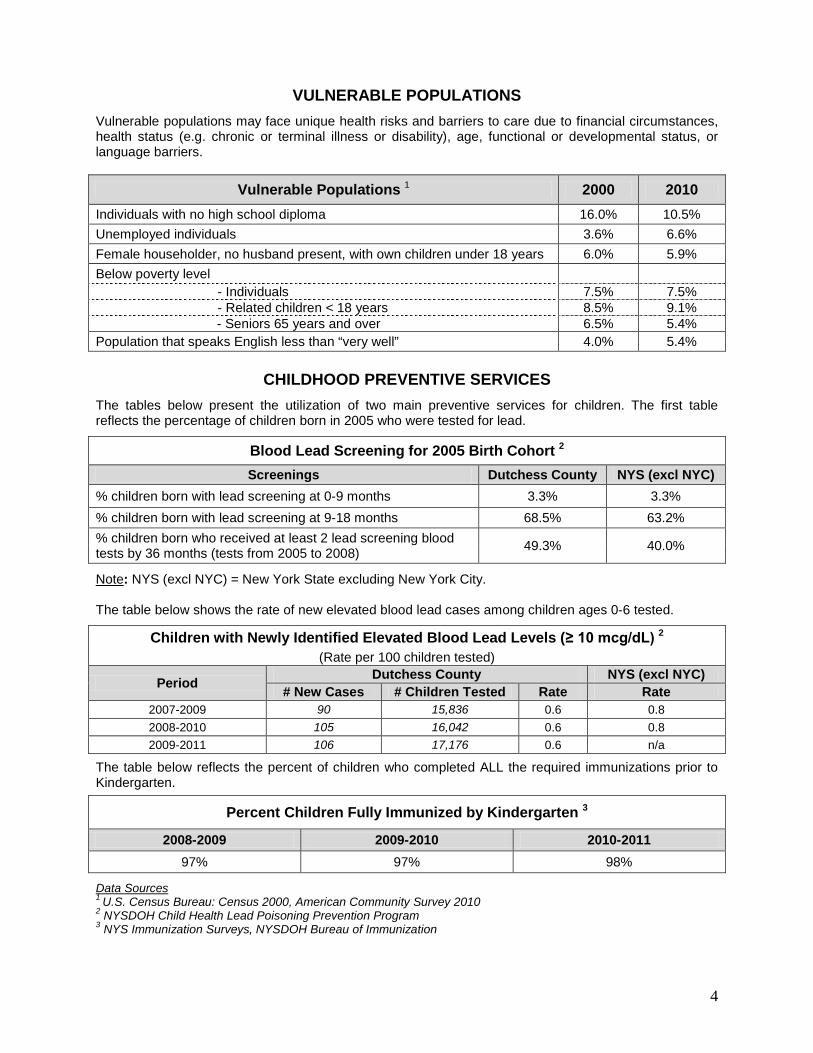
VULNERABLE POPULATIONS Vulnerable populations may face unique health risks and barriers to care due to financial circumstances, health status (e.g. chronic or terminal illness or disability), age, functional or developmental status, or language barriers.
Vulnerable Populations 1 2000 2010 Individuals with no high school diploma 16.0% 10.5% Unemployed individuals 3.6% 6.6% Female householder, no husband present, with own children under 18 years 6.0% 5.9% Below poverty level - Individuals 7.5% 7.5% - Related children < 18 years 8.5% 9.1%
- Seniors 65 years and over 6.5% 5.4% Population that speaks English less than “very well” 4.0% 5.4%
CHILDHOOD PREVENTIVE SERVICES
The tables below present the utilization of two main preventive services for children. The first table reflects the percentage of children born in 2005 who were tested for lead.
Blood Lead Screening for 2005 Birth Cohort 2
Screenings Dutchess County NYS (excl NYC) % children born with lead screening at 0-9 months 3.3% 3.3% % children born with lead screening at 9-18 months 68.5% 63.2% % children born who received at least 2 lead screening blood tests by 36 months (tests from 2005 to 2008) 49.3% 40.0%
Note: NYS (excl NYC) = New York State excluding New York City. The table below shows the rate of new elevated blood lead cases among children ages 0-6 tested.
Children with Newly Identified Elevated Blood Lead Levels (≥ 10 mcg/dL) 2
(Rate per 100 children tested)
Period Dutchess County NYS (excl NYC) # New Cases # Children Tested Rate Rate
2007-2009 90 15,836 0.6 0.8 2008-2010 105 16,042 0.6 0.8 2009-2011 106 17,176 0.6 n/a
The table below reflects the percent of children who completed ALL the required immunizations prior to Kindergarten.
Percent Children Fully Immunized by Kindergarten 3
2008-2009 2009-2010 2010-2011 97% 97% 98%
Data Sources 1 U.S. Census Bureau: Census 2000, American Community Survey 2010 2 NYSDOH Child Health Lead Poisoning Prevention Program 3 NYS Immunization Surveys, NYSDOH Bureau of Immunization
5
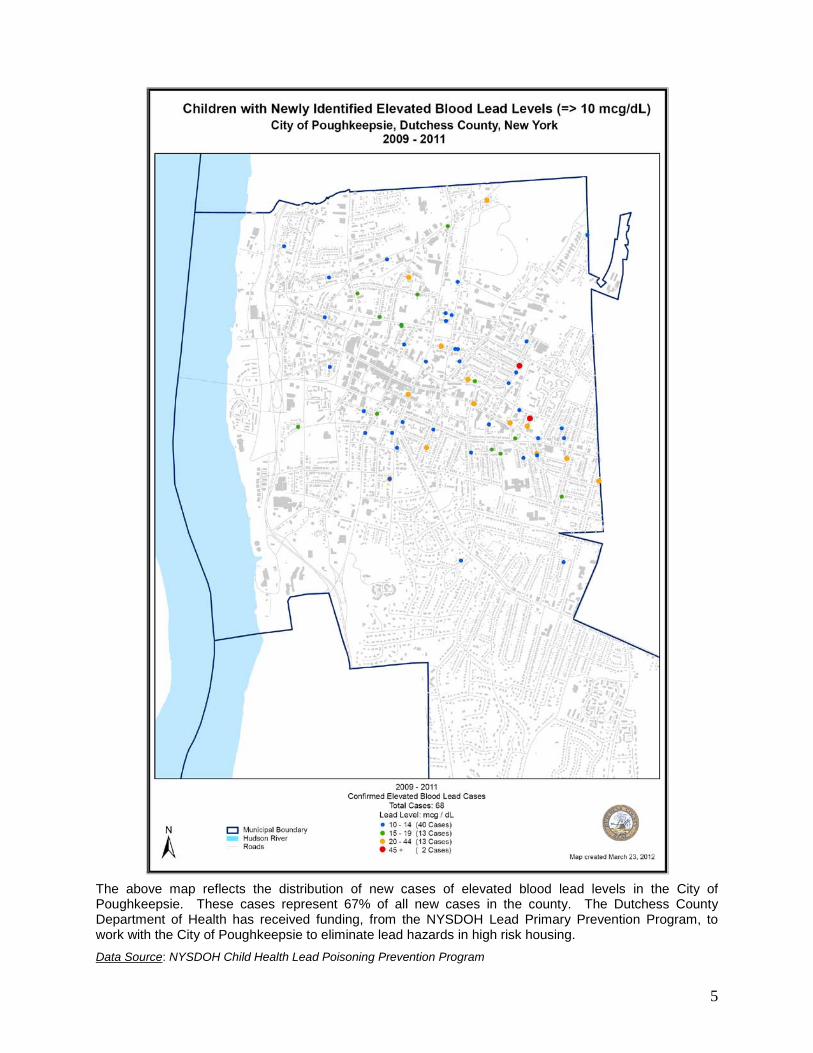
The above map reflects the distribution of new cases of elevated blood lead levels in the City of Poughkeepsie. These cases represent 67% of all new cases in the county. The Dutchess County Department of Health has received funding, from the NYSDOH Lead Primary Prevention Program, to work with the City of Poughkeepsie to eliminate lead hazards in high risk housing. Data Source: NYSDOH Child Health Lead Poisoning Prevention Program
6
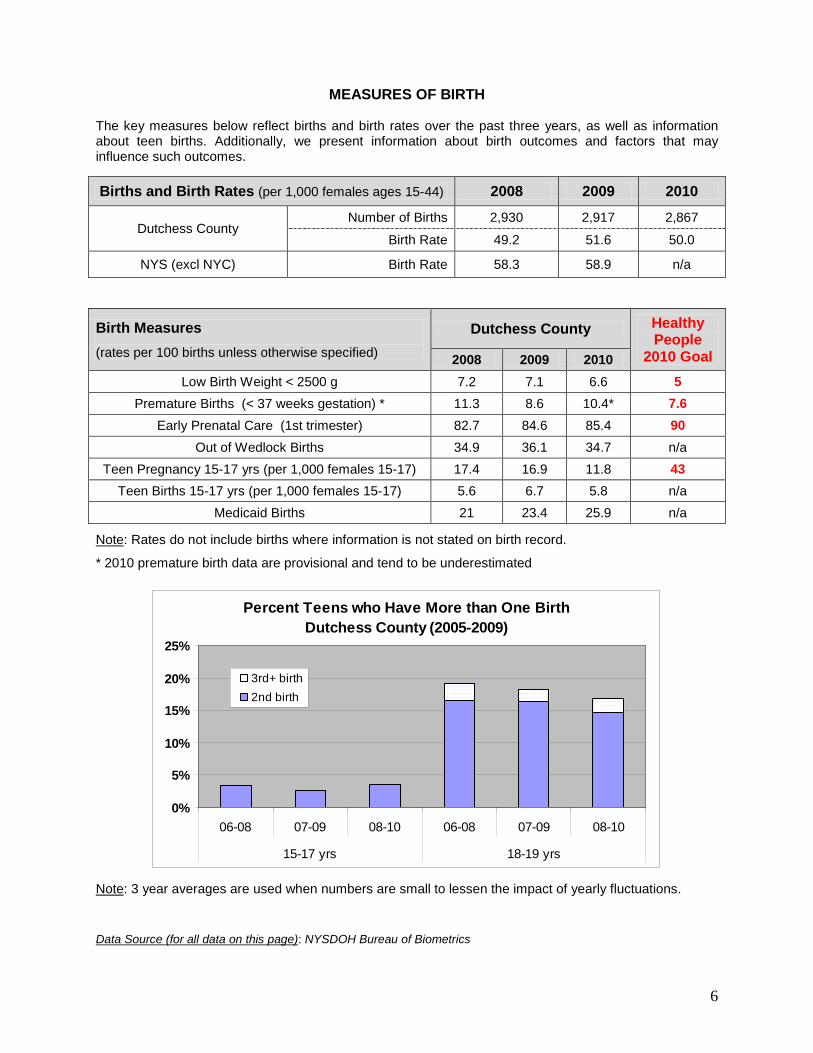
MEASURES OF BIRTH The key measures below reflect births and birth rates over the past three years, as well as information about teen births. Additionally, we present information about birth outcomes and factors that may influence such outcomes.
Births and Birth Rates (per 1,000 females ages 15-44) 2008 2009 2010
Dutchess County Number of Births 2,930 2,917 2,867
Birth Rate 49.2 51.6 50.0
NYS (excl NYC) Birth Rate 58.3 58.9 n/a
Birth Measures (rates per 100 births unless otherwise specified)
Dutchess County Healthy People
2010 Goal 2008 2009 2010 Low Birth Weight < 2500 g 7.2 7.1 6.6 5
Premature Births (< 37 weeks gestation) * 11.3 8.6 10.4* 7.6 Early Prenatal Care (1st trimester) 82.7 84.6 85.4 90
Out of Wedlock Births 34.9 36.1 34.7 n/a Teen Pregnancy 15-17 yrs (per 1,000 females 15-17) 17.4 16.9 11.8 43
Teen Births 15-17 yrs (per 1,000 females 15-17) 5.6 6.7 5.8 n/a Medicaid Births 21 23.4 25.9 n/a
Note: Rates do not include births where information is not stated on birth record.
* 2010 premature birth data are provisional and tend to be underestimated
Percent Teens who Have More than One BirthDutchess County (2005-2009)
0%
5%
10%
15%
20%
25%
06-08 07-09 08-10 06-08 07-09 08-10
15-17 yrs 18-19 yrs
3rd+ birth2nd birth
Note: 3 year averages are used when numbers are small to lessen the impact of yearly fluctuations.
Data Source (for all data on this page): NYSDOH Bureau of Biometrics
7
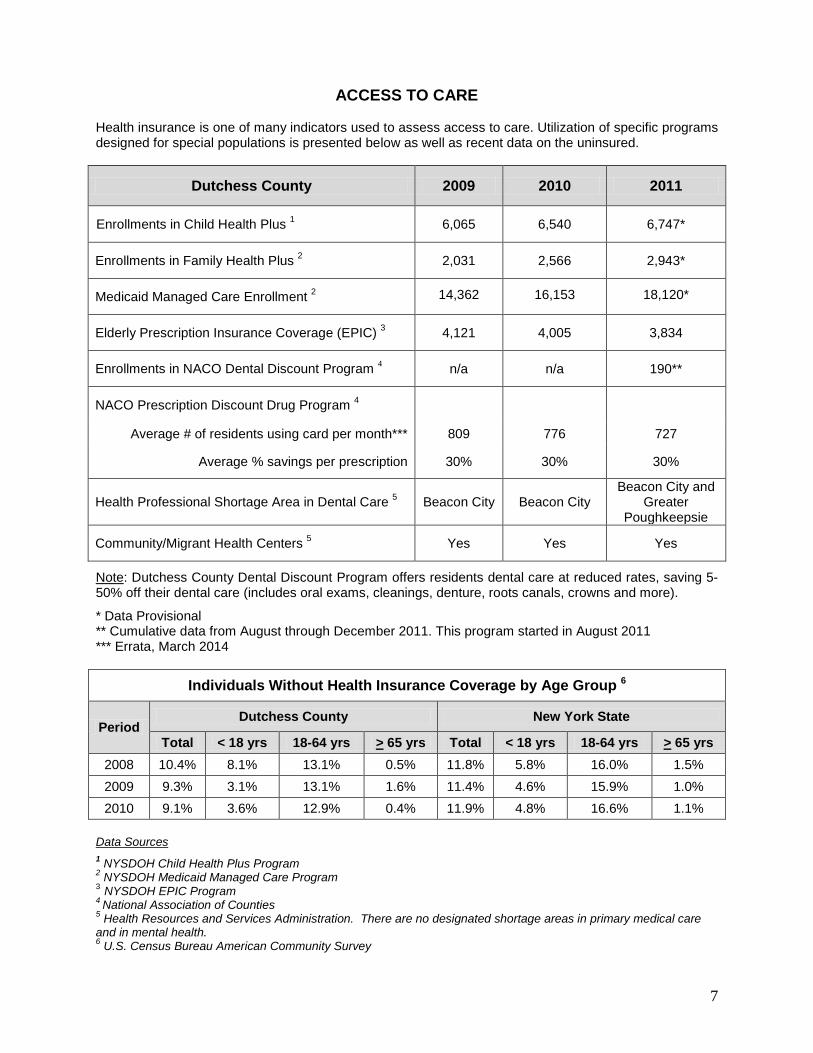
ACCESS TO CARE Health insurance is one of many indicators used to assess access to care. Utilization of specific programs designed for special populations is presented below as well as recent data on the uninsured.
Dutchess County 2009 2010 2011
Enrollments in Child Health Plus 1 6,065 6,540 6,747*
Enrollments in Family Health Plus 2 2,031 2,566 2,943*
Medicaid Managed Care Enrollment 2 14,362 16,153 18,120*
Elderly Prescription Insurance Coverage (EPIC) 3 4,121 4,005 3,834
Enrollments in NACO Dental Discount Program 4 n/a n/a 190**
NACO Prescription Discount Drug Program 4
Average # of residents using card per month*** 809 776 727
Average % savings per prescription 30% 30% 30%
Health Professional Shortage Area in Dental Care 5 Beacon City Beacon City Beacon City and
Greater Poughkeepsie
Community/Migrant Health Centers 5 Yes Yes Yes
Note: Dutchess County Dental Discount Program offers residents dental care at reduced rates, saving 5-50% off their dental care (includes oral exams, cleanings, denture, roots canals, crowns and more).
* Data Provisional ** Cumulative data from August through December 2011. This program started in August 2011 *** Errata, March 2014
Individuals Without Health Insurance Coverage by Age Group 6
Period Dutchess County New York State
Total < 18 yrs 18-64 yrs > 65 yrs Total < 18 yrs 18-64 yrs > 65 yrs 2008 10.4% 8.1% 13.1% 0.5% 11.8% 5.8% 16.0% 1.5% 2009 9.3% 3.1% 13.1% 1.6% 11.4% 4.6% 15.9% 1.0% 2010 9.1% 3.6% 12.9% 0.4% 11.9% 4.8% 16.6% 1.1%
Data Sources 1 NYSDOH Child Health Plus Program 2 NYSDOH Medicaid Managed Care Program 3 NYSDOH EPIC Program 4 National Association of Counties 5 Health Resources and Services Administration. There are no designated shortage areas in primary medical care and in mental health. 6 U.S. Census Bureau American Community Survey
8
ACCESS TO CARE
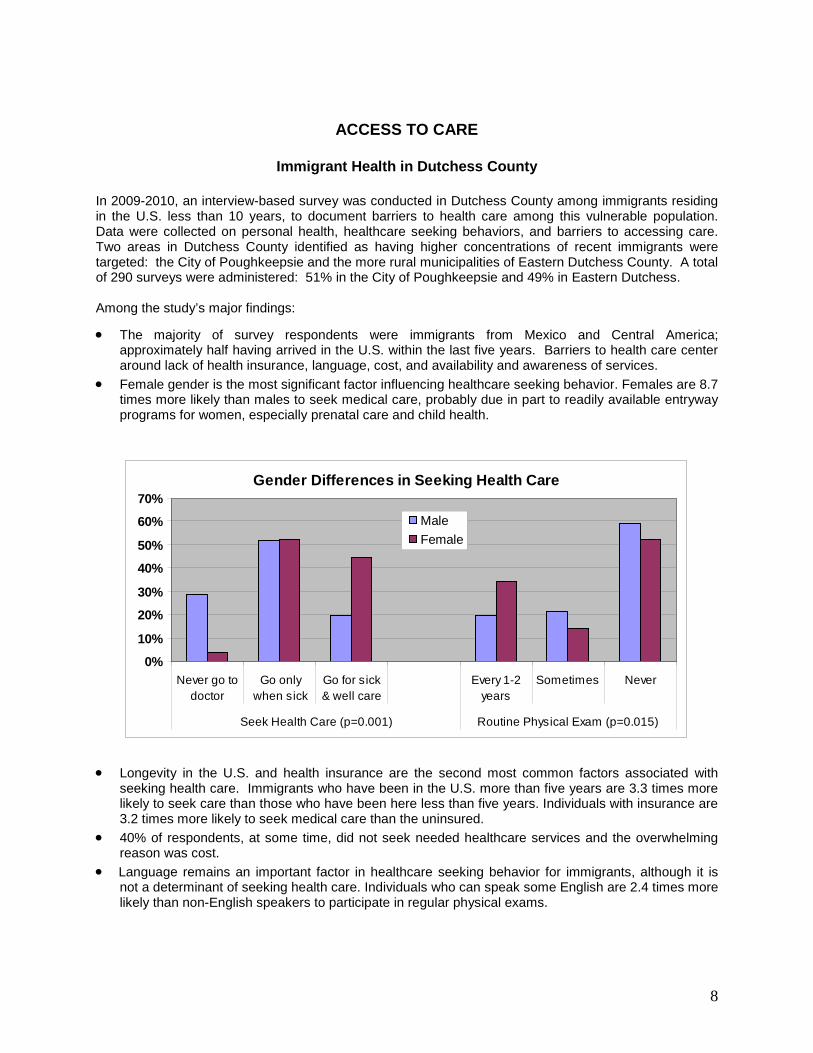
Immigrant Health in Dutchess County In 2009-2010, an interview-based survey was conducted in Dutchess County among immigrants residing in the U.S. less than 10 years, to document barriers to health care among this vulnerable population. Data were collected on personal health, healthcare seeking behaviors, and barriers to accessing care. Two areas in Dutchess County identified as having higher concentrations of recent immigrants were targeted: the City of Poughkeepsie and the more rural municipalities of Eastern Dutchess County. A total of 290 surveys were administered: 51% in the City of Poughkeepsie and 49% in Eastern Dutchess. Among the study’s major findings:
• The majority of survey respondents were immigrants from Mexico and Central America; approximately half having arrived in the U.S. within the last five years. Barriers to health care center around lack of health insurance, language, cost, and availability and awareness of services.
• Female gender is the most significant factor influencing healthcare seeking behavior. Females are 8.7 times more likely than males to seek medical care, probably due in part to readily available entryway programs for women, especially prenatal care and child health.
Gender Differences in Seeking Health Care
0%
10%
20%
30%
40%
50%
60%
70%
Never go todoctor
Go onlywhen sick
Go for sick& well care
Every 1-2years
Sometimes Never
Seek Health Care (p=0.001) Routine Physical Exam (p=0.015)
MaleFemale
• Longevity in the U.S. and health insurance are the second most common factors associated with seeking health care. Immigrants who have been in the U.S. more than five years are 3.3 times more likely to seek care than those who have been here less than five years. Individuals with insurance are 3.2 times more likely to seek medical care than the uninsured.
• 40% of respondents, at some time, did not seek needed healthcare services and the overwhelming reason was cost.
• Language remains an important factor in healthcare seeking behavior for immigrants, although it is not a determinant of seeking health care. Individuals who can speak some English are 2.4 times more likely than non-English speakers to participate in regular physical exams.

9
• Feelings of sadness or depression are widespread among the recent immigrant population; 81% of immigrants interviewed described such feelings, primarily related to separation from family in their homeland. More than half of individuals cope by talking to friends and family. There is no evidence of alcohol abuse, with 70% reporting never drinking alcohol, and less than one third drinking only occasionally.
Reasons for Sadness & DepressionRegional Comparison
0% 20% 40% 60% 80% 100%
Problems with partner
Housing/work
Unwelcome/unwanted
Alone/isolated
Miss family
PoughkeepsieEastern Dutchess
• 85% of immigrants sought healthcare services and half of these did so only when sick. • The majority of respondents seek health services at health centers/clinics. Poughkeepsie
respondents used the emergency room (ER) significantly more often. The primary reasons for ER utilization were unavailability of a regular provider and not knowing where else to go.
Where Immigrants Seek Healthcare Services in U.S.Regional Comparison
0%10%20%30%40%50%60%70%80%90%
Healthcenter/clinic
ER Health Dept Private MD Other
Eastern DutchessPoughkeepsie
The survey was funded by the Foundation for Community Health. Data Source: The Immigrant Health Initiative: A Study of Health Care of Recent Immigrants in Dutchess County, New York. The entire report is available at http://www.co.dutchess.ny.us/CountyGov/Departments/Health/14178.htm
10
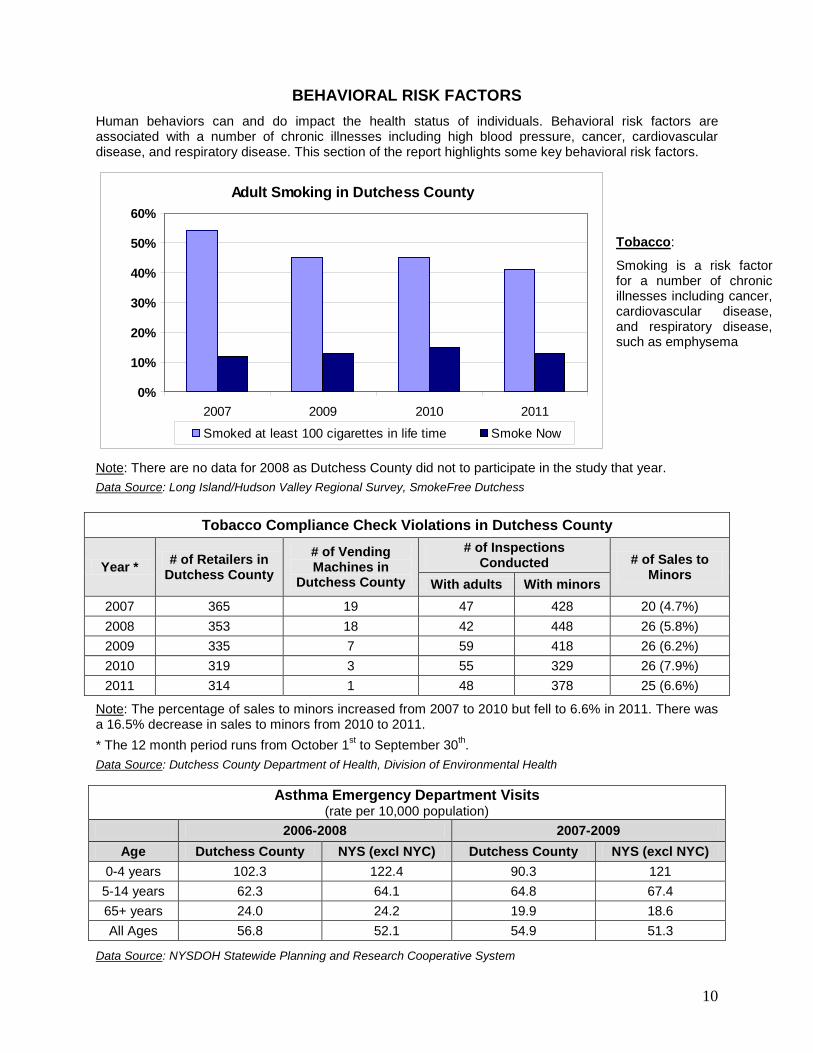
BEHAVIORAL RISK FACTORS
Human behaviors can and do impact the health status of individuals. Behavioral risk factors are associated with a number of chronic illnesses including high blood pressure, cancer, cardiovascular disease, and respiratory disease. This section of the report highlights some key behavioral risk factors.
Adult Smoking in Dutchess County
0%
10%
20%
30%
40%
50%
60%
2007 2009 2010 2011
Smoked at least 100 cigarettes in life time Smoke Now
Note: There are no data for 2008 as Dutchess County did not to participate in the study that year. Data Source: Long Island/Hudson Valley Regional Survey, SmokeFree Dutchess
Tobacco Compliance Check Violations in Dutchess County
Year * # of Retailers in Dutchess County
# of Vending Machines in
Dutchess County
# of Inspections Conducted # of Sales to
Minors With adults With minors
2007 365 19 47 428 20 (4.7%) 2008 353 18 42 448 26 (5.8%) 2009 335 7 59 418 26 (6.2%) 2010 319 3 55 329 26 (7.9%) 2011 314 1 48 378 25 (6.6%)
Note: The percentage of sales to minors increased from 2007 to 2010 but fell to 6.6% in 2011. There was a 16.5% decrease in sales to minors from 2010 to 2011. * The 12 month period runs from October 1st to September 30th. Data Source: Dutchess County Department of Health, Division of Environmental Health
Asthma Emergency Department Visits (rate per 10,000 population)
2006-2008 2007-2009 Age Dutchess County NYS (excl NYC) Dutchess County NYS (excl NYC)
0-4 years 102.3 122.4 90.3 121 5-14 years 62.3 64.1 64.8 67.4 65+ years 24.0 24.2 19.9 18.6 All Ages 56.8 52.1 54.9 51.3
Data Source: NYSDOH Statewide Planning and Research Cooperative System
Tobacco:
Smoking is a risk factor for a number of chronic illnesses including cancer, cardiovascular disease, and respiratory disease, such as emphysema
11
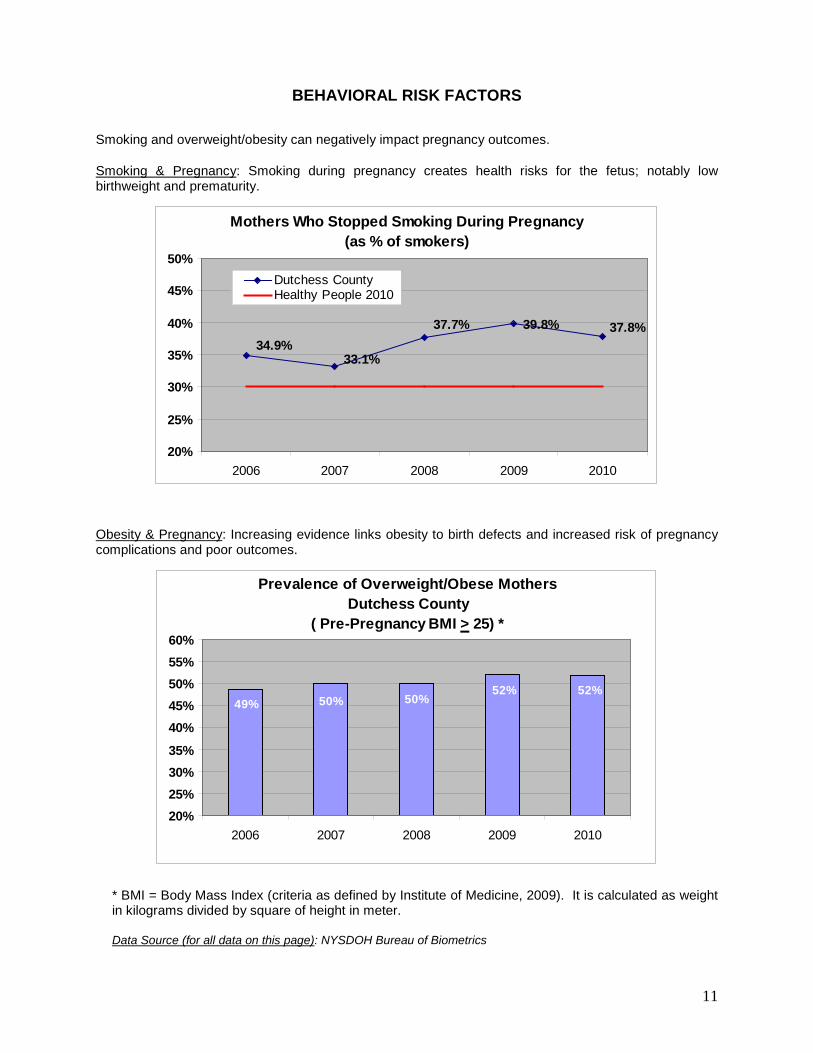
BEHAVIORAL RISK FACTORS
Smoking and overweight/obesity can negatively impact pregnancy outcomes.
Smoking & Pregnancy: Smoking during pregnancy creates health risks for the fetus; notably low birthweight and prematurity.
Mothers Who Stopped Smoking During Pregnancy(as % of smokers)
39.8% 37.8%37.7%
33.1%34.9%
20%
25%
30%
35%
40%
45%
50%
2006 2007 2008 2009 2010
Dutchess CountyHealthy People 2010
Obesity & Pregnancy: Increasing evidence links obesity to birth defects and increased risk of pregnancy complications and poor outcomes.
Prevalence of Overweight/Obese Mothers Dutchess County
( Pre-Pregnancy BMI > 25) *
49% 50% 50%52% 52%
20%25%30%35%
40%45%50%55%60%
2006 2007 2008 2009 2010
* BMI = Body Mass Index (criteria as defined by Institute of Medicine, 2009). It is calculated as weight in kilograms divided by square of height in meter. Data Source (for all data on this page): NYSDOH Bureau of Biometrics
12
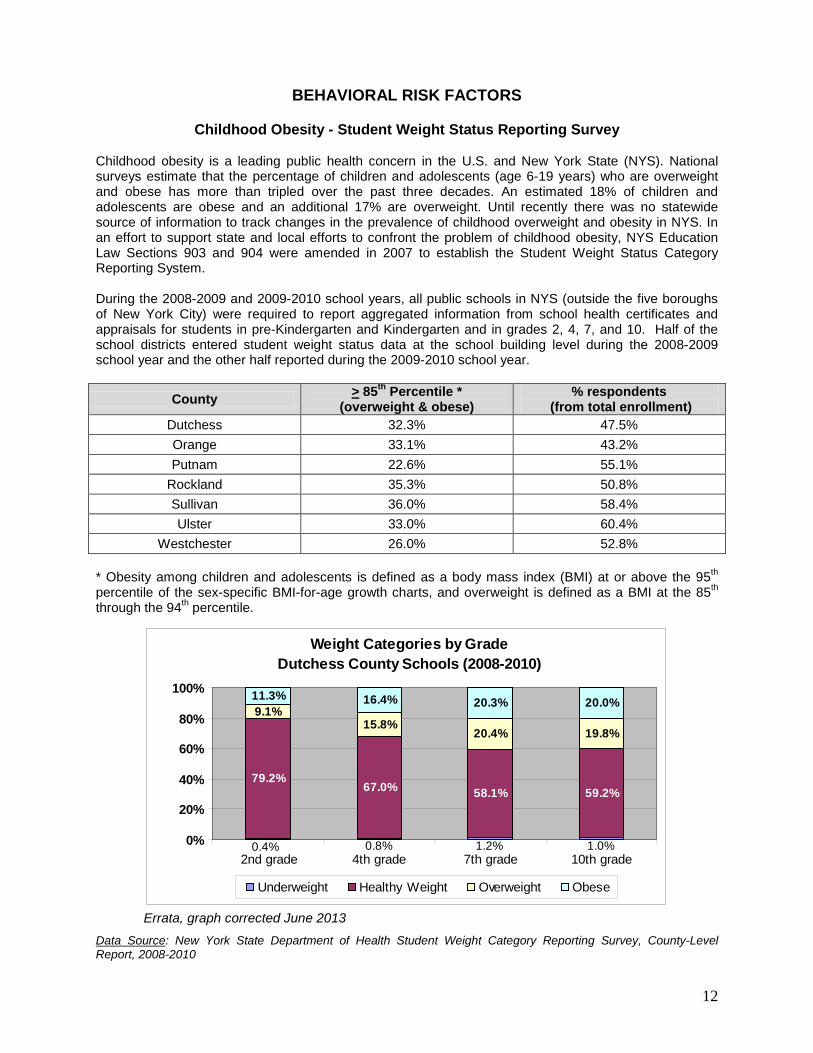
BEHAVIORAL RISK FACTORS
Childhood Obesity - Student Weight Status Reporting Survey Childhood obesity is a leading public health concern in the U.S. and New York State (NYS). National surveys estimate that the percentage of children and adolescents (age 6-19 years) who are overweight and obese has more than tripled over the past three decades. An estimated 18% of children and adolescents are obese and an additional 17% are overweight. Until recently there was no statewide source of information to track changes in the prevalence of childhood overweight and obesity in NYS. In an effort to support state and local efforts to confront the problem of childhood obesity, NYS Education Law Sections 903 and 904 were amended in 2007 to establish the Student Weight Status Category Reporting System. During the 2008-2009 and 2009-2010 school years, all public schools in NYS (outside the five boroughs of New York City) were required to report aggregated information from school health certificates and appraisals for students in pre-Kindergarten and Kindergarten and in grades 2, 4, 7, and 10. Half of the school districts entered student weight status data at the school building level during the 2008-2009 school year and the other half reported during the 2009-2010 school year.
County > 85th Percentile * (overweight & obese)
% respondents (from total enrollment)
Dutchess 32.3% 47.5% Orange 33.1% 43.2% Putnam 22.6% 55.1%
Rockland 35.3% 50.8% Sullivan 36.0% 58.4% Ulster 33.0% 60.4%
Westchester 26.0% 52.8% * Obesity among children and adolescents is defined as a body mass index (BMI) at or above the 95th percentile of the sex-specific BMI-for-age growth charts, and overweight is defined as a BMI at the 85th through the 94th percentile.
Weight Categories by GradeDutchess County Schools (2008-2010)
79.2%67.0% 58.1% 59.2%
9.1%15.8%
20.4% 19.8%
11.3% 16.4% 20.3% 20.0%
1.0%1.2%0.8%0.4%0%
20%
40%
60%
80%
100%
2nd grade 4th grade 7th grade 10th grade
Underweight Healthy Weight Overweight Obese
Errata, graph corrected June 2013
Data Source: New York State Department of Health Student Weight Category Reporting Survey, County-Level Report, 2008-2010

13
MEASURES OF MORBIDITY
The morbidity section reflects some of the most common illnesses and conditions in our community, including chronic and communicable diseases, tick borne diseases and injuries. Chronic disease can be defined as those that have a prolonged duration, and for which a complete cure is rarely achieved. Diseases that are transmitted from person to person or from animals to persons are called communicable diseases (also known as infectious diseases). Most of these diseases are preventable either by vaccination (when available) or reduced exposure to the infectious agent.
COMMUNICABLE DISEASES INCIDENCE RATES
Note: Incidence Rate = number of new cases of illness over a period of time divided by number of persons at risk at the beginning of the time period.
Disease 1
(rate per 100,000 population)
2008 2009 2010 2011 Dutchess County 08-10
NYS (excl NYC)
08-10
Blood-Borne Pathogens
Hepatitis B, Chronic 11.6 9.2 7.8 10.9 9.5 6.4
Hepatitis C, Chronic 120.6 92.0 102.9 198.6 105.3 61.8
Sexually Transmitted Diseases
Chlamydia 215.6 240.8 259.9 224.1 238.8 303.5
Gonorrhea, total 29.6 41.6 42.2 35.4 37.8 55.8
Gastro-Enteric Infections
E.Coli 0157:H7 1.0 2.0 1.0 1.7 1.4 0.8
Salmonellosis 11.6 13.6 10.9 18.7 11.9 12.9
Respiratory Infections
Streptococcus pneumoniae, invasive 10.6 12.9 10.2 6.8 11.2 12.7
Tuberculosis 2.4 1.4 3.7 1.4 2.4 2.5
AIDS Case Rate 2
(rate per 100,000 population) 2007 2008 2009 2010 *
Dutchess County 6.1 7.9 6.1 4.4
NYS (excl NYC) 7.6 7.8 6.7 6.0
Note: AIDS case rates are exclusive of prison inmates. Case rate (incidence) is by diagnosis year.
*Provisional, data as of August 4, 2011. Data Sources 1 NYSDOH Division of Epidemiology 2 Bureau of AIDS/HIV Epidemiology, AIDS Institute
14
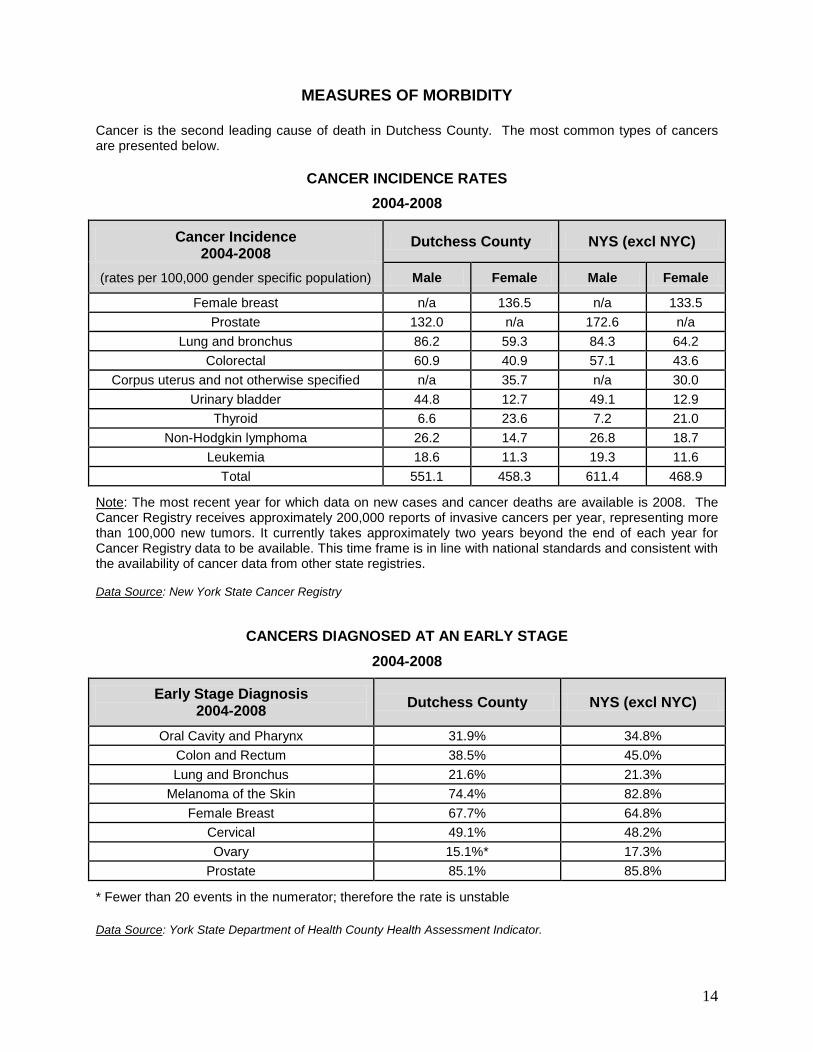
MEASURES OF MORBIDITY
Cancer is the second leading cause of death in Dutchess County. The most common types of cancers are presented below.
CANCER INCIDENCE RATES
2004-2008
Cancer Incidence 2004-2008
Dutchess County NYS (excl NYC)
(rates per 100,000 gender specific population) Male Female Male Female
Female breast n/a 136.5 n/a 133.5 Prostate 132.0 n/a 172.6 n/a
Lung and bronchus 86.2 59.3 84.3 64.2 Colorectal 60.9 40.9 57.1 43.6
Corpus uterus and not otherwise specified n/a 35.7 n/a 30.0 Urinary bladder 44.8 12.7 49.1 12.9
Thyroid 6.6 23.6 7.2 21.0 Non-Hodgkin lymphoma 26.2 14.7 26.8 18.7
Leukemia 18.6 11.3 19.3 11.6 Total 551.1 458.3 611.4 468.9
Note: The most recent year for which data on new cases and cancer deaths are available is 2008. The Cancer Registry receives approximately 200,000 reports of invasive cancers per year, representing more than 100,000 new tumors. It currently takes approximately two years beyond the end of each year for Cancer Registry data to be available. This time frame is in line with national standards and consistent with the availability of cancer data from other state registries. Data Source: New York State Cancer Registry
CANCERS DIAGNOSED AT AN EARLY STAGE
2004-2008
Early Stage Diagnosis 2004-2008 Dutchess County NYS (excl NYC)
Oral Cavity and Pharynx 31.9% 34.8% Colon and Rectum 38.5% 45.0% Lung and Bronchus 21.6% 21.3%
Melanoma of the Skin 74.4% 82.8% Female Breast 67.7% 64.8%
Cervical 49.1% 48.2% Ovary 15.1%* 17.3%
Prostate 85.1% 85.8%
* Fewer than 20 events in the numerator; therefore the rate is unstable
Data Source: York State Department of Health County Health Assessment Indicator.
15
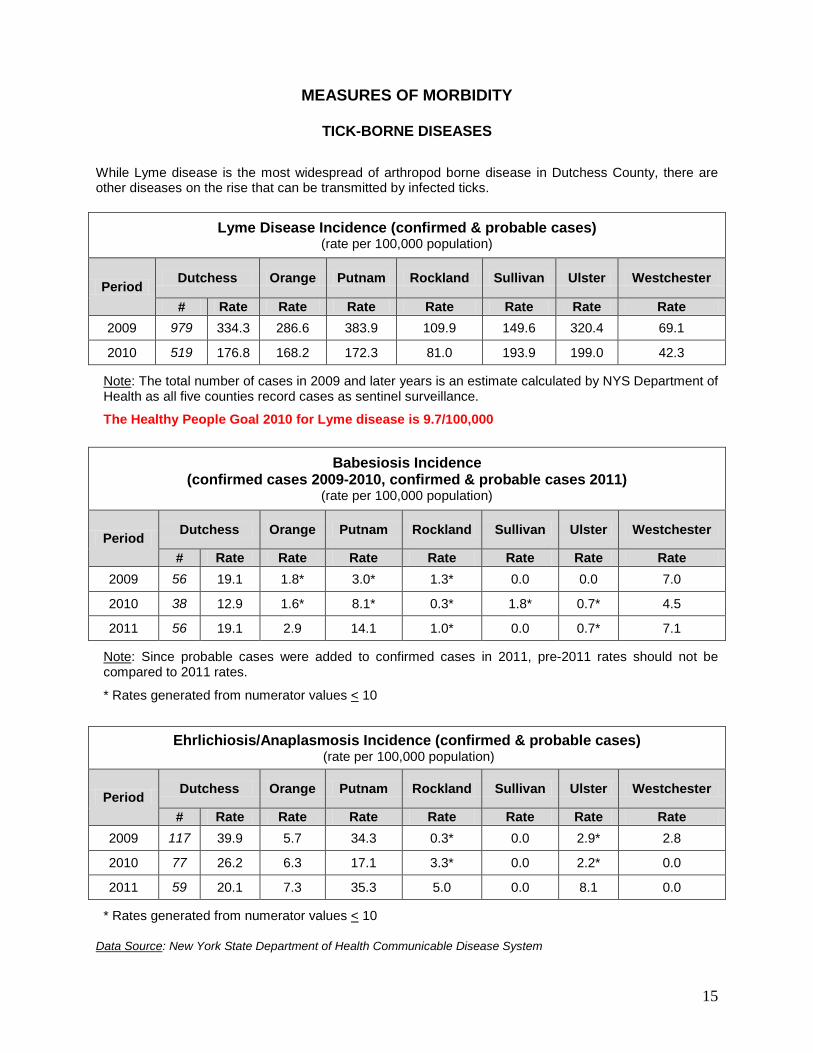
MEASURES OF MORBIDITY
TICK-BORNE DISEASES
While Lyme disease is the most widespread of arthropod borne disease in Dutchess County, there are other diseases on the rise that can be transmitted by infected ticks.
Lyme Disease Incidence (confirmed & probable cases) (rate per 100,000 population)
Period Dutchess Orange Putnam Rockland Sullivan Ulster Westchester
# Rate Rate Rate Rate Rate Rate Rate 2009 979 334.3 286.6 383.9 109.9 149.6 320.4 69.1
2010 519 176.8 168.2 172.3 81.0 193.9 199.0 42.3
Note: The total number of cases in 2009 and later years is an estimate calculated by NYS Department of Health as all five counties record cases as sentinel surveillance.
The Healthy People Goal 2010 for Lyme disease is 9.7/100,000
Babesiosis Incidence (confirmed cases 2009-2010, confirmed & probable cases 2011)
(rate per 100,000 population)
Period Dutchess Orange Putnam Rockland Sullivan Ulster Westchester
# Rate Rate Rate Rate Rate Rate Rate 2009 56 19.1 1.8* 3.0* 1.3* 0.0 0.0 7.0
2010 38 12.9 1.6* 8.1* 0.3* 1.8* 0.7* 4.5
2011 56 19.1 2.9 14.1 1.0* 0.0 0.7* 7.1
Note: Since probable cases were added to confirmed cases in 2011, pre-2011 rates should not be compared to 2011 rates.
* Rates generated from numerator values < 10
Ehrlichiosis/Anaplasmosis Incidence (confirmed & probable cases) (rate per 100,000 population)
Period Dutchess Orange Putnam Rockland Sullivan Ulster Westchester
# Rate Rate Rate Rate Rate Rate Rate 2009 117 39.9 5.7 34.3 0.3* 0.0 2.9* 2.8
2010 77 26.2 6.3 17.1 3.3* 0.0 2.2* 0.0
2011 59 20.1 7.3 35.3 5.0 0.0 8.1 0.0
* Rates generated from numerator values < 10
Data Source: New York State Department of Health Communicable Disease System
16
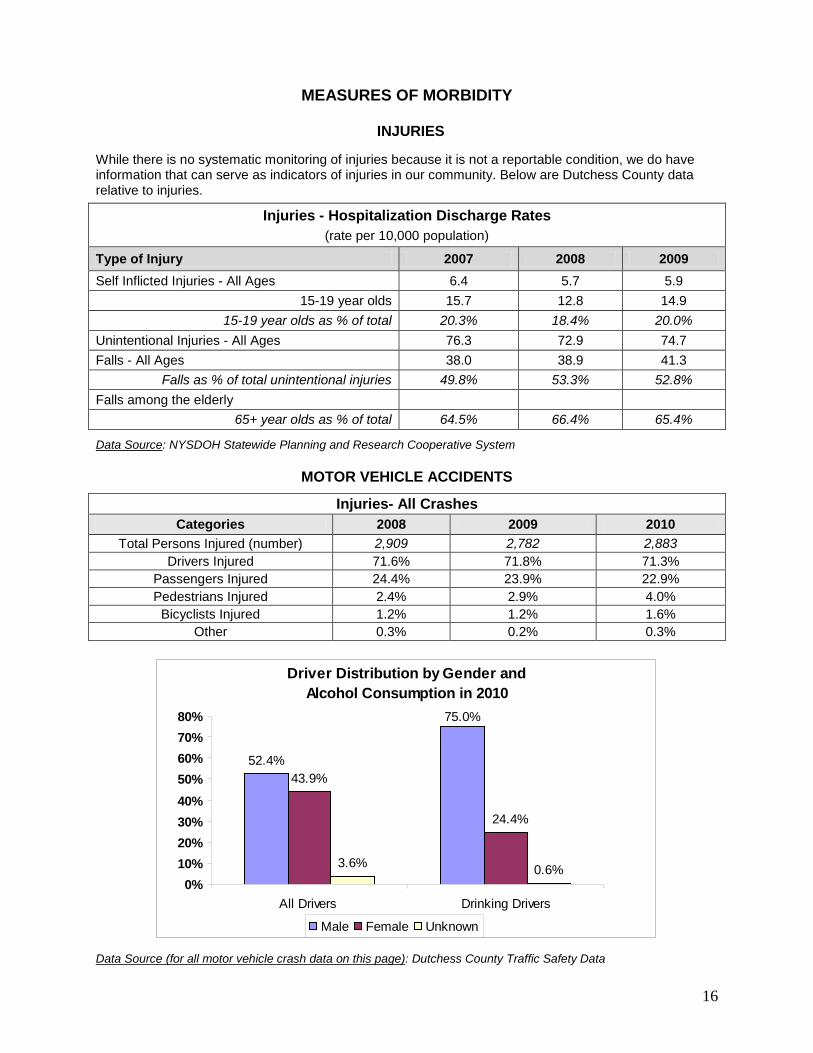
MEASURES OF MORBIDITY
INJURIES
While there is no systematic monitoring of injuries because it is not a reportable condition, we do have information that can serve as indicators of injuries in our community. Below are Dutchess County data relative to injuries.
Injuries - Hospitalization Discharge Rates (rate per 10,000 population)
Type of Injury 2007 2008 2009 Self Inflicted Injuries - All Ages 6.4 5.7 5.9
15-19 year olds 15.7 12.8 14.9 15-19 year olds as % of total 20.3% 18.4% 20.0%
Unintentional Injuries - All Ages 76.3 72.9 74.7 Falls - All Ages 38.0 38.9 41.3
Falls as % of total unintentional injuries 49.8% 53.3% 52.8% Falls among the elderly
65+ year olds as % of total 64.5% 66.4% 65.4%
Data Source: NYSDOH Statewide Planning and Research Cooperative System
MOTOR VEHICLE ACCIDENTS
Injuries- All Crashes Categories 2008 2009 2010
Total Persons Injured (number) 2,909 2,782 2,883 Drivers Injured 71.6% 71.8% 71.3%
Passengers Injured 24.4% 23.9% 22.9% Pedestrians Injured 2.4% 2.9% 4.0%
Bicyclists Injured 1.2% 1.2% 1.6% Other 0.3% 0.2% 0.3%
Driver Distribution by Gender and Alcohol Consumption in 2010
52.4%43.9%
3.6% 0.6%
75.0%
24.4%
0%10%20%30%40%50%60%70%80%
All Drivers Drinking Drivers
Male Female Unknown
Data Source (for all motor vehicle crash data on this page): Dutchess County Traffic Safety Data
17
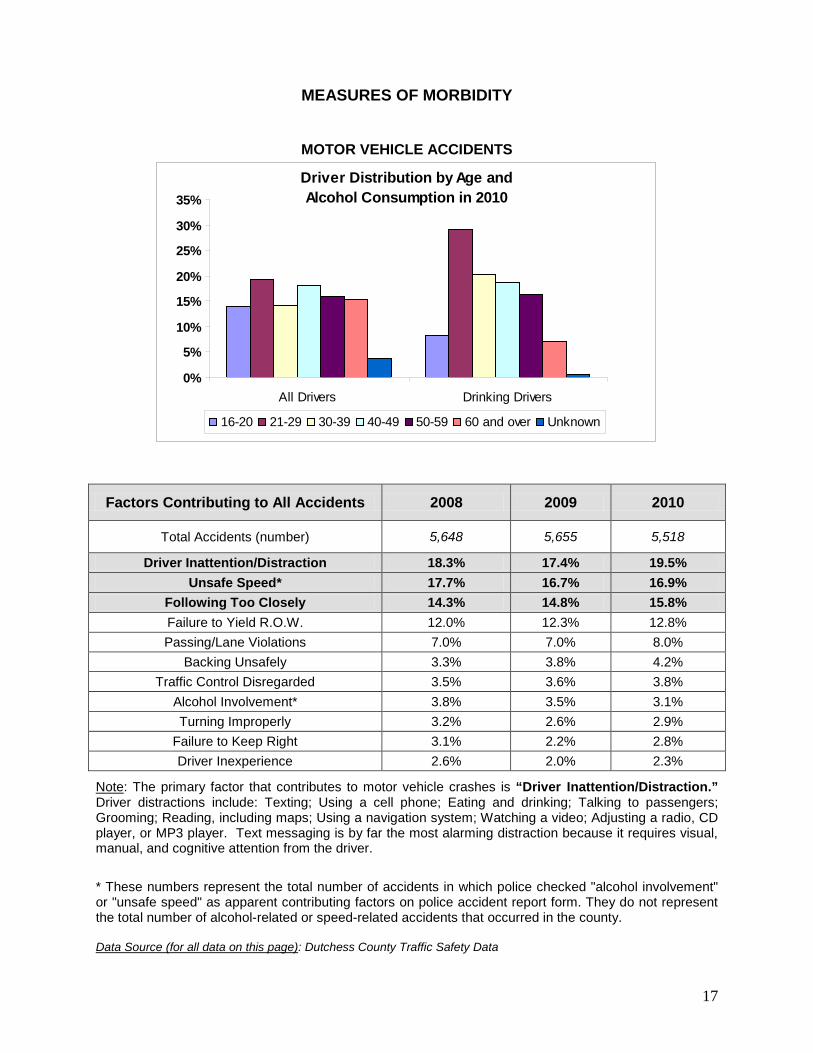
MEASURES OF MORBIDITY
MOTOR VEHICLE ACCIDENTS
Driver Distribution by Age and Alcohol Consumption in 2010
0%
5%
10%
15%
20%
25%
30%
35%
All Drivers Drinking Drivers
16-20 21-29 30-39 40-49 50-59 60 and over Unknown
Factors Contributing to All Accidents 2008 2009 2010
Total Accidents (number) 5,648 5,655 5,518
Driver Inattention/Distraction 18.3% 17.4% 19.5% Unsafe Speed* 17.7% 16.7% 16.9%
Following Too Closely 14.3% 14.8% 15.8% Failure to Yield R.O.W. 12.0% 12.3% 12.8% Passing/Lane Violations 7.0% 7.0% 8.0%
Backing Unsafely 3.3% 3.8% 4.2% Traffic Control Disregarded 3.5% 3.6% 3.8%
Alcohol Involvement* 3.8% 3.5% 3.1% Turning Improperly 3.2% 2.6% 2.9%
Failure to Keep Right 3.1% 2.2% 2.8% Driver Inexperience 2.6% 2.0% 2.3%
Note: The primary factor that contributes to motor vehicle crashes is “Driver Inattention/Distraction.” Driver distractions include: Texting; Using a cell phone; Eating and drinking; Talking to passengers; Grooming; Reading, including maps; Using a navigation system; Watching a video; Adjusting a radio, CD player, or MP3 player. Text messaging is by far the most alarming distraction because it requires visual, manual, and cognitive attention from the driver.
* These numbers represent the total number of accidents in which police checked "alcohol involvement" or "unsafe speed" as apparent contributing factors on police accident report form. They do not represent the total number of alcohol-related or speed-related accidents that occurred in the county. Data Source (for all data on this page): Dutchess County Traffic Safety Data
18
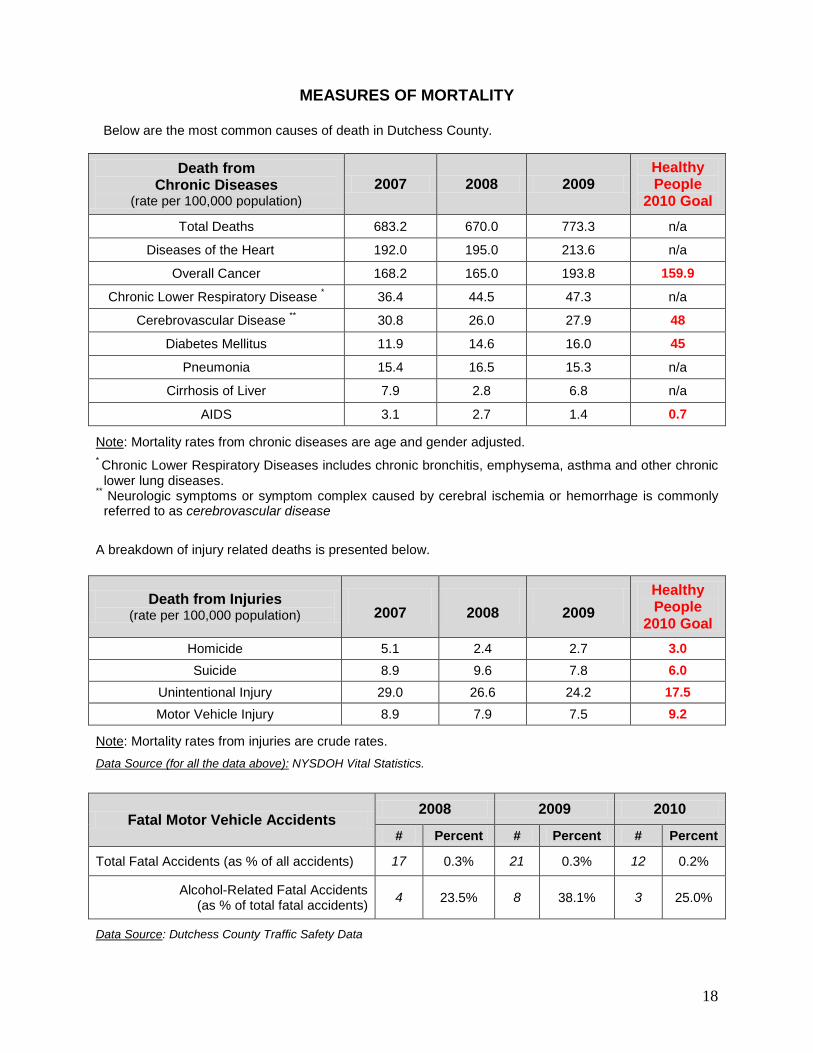
MEASURES OF MORTALITY
Below are the most common causes of death in Dutchess County.
Death from Chronic Diseases
(rate per 100,000 population) 2007 2008 2009
Healthy People
2010 Goal Total Deaths 683.2 670.0 773.3 n/a
Diseases of the Heart 192.0 195.0 213.6 n/a
Overall Cancer 168.2 165.0 193.8 159.9
Chronic Lower Respiratory Disease * 36.4 44.5 47.3 n/a
Cerebrovascular Disease ** 30.8 26.0 27.9 48
Diabetes Mellitus 11.9 14.6 16.0 45
Pneumonia 15.4 16.5 15.3 n/a
Cirrhosis of Liver 7.9 2.8 6.8 n/a
AIDS 3.1 2.7 1.4 0.7
Note: Mortality rates from chronic diseases are age and gender adjusted. * Chronic Lower Respiratory Diseases includes chronic bronchitis, emphysema, asthma and other chronic
lower lung diseases. ** Neurologic symptoms or symptom complex caused by cerebral ischemia or hemorrhage is commonly
referred to as cerebrovascular disease
A breakdown of injury related deaths is presented below.
Death from Injuries (rate per 100,000 population) 2007 2008 2009
Healthy People
2010 Goal Homicide 5.1 2.4 2.7 3.0 Suicide 8.9 9.6 7.8 6.0
Unintentional Injury 29.0 26.6 24.2 17.5 Motor Vehicle Injury 8.9 7.9 7.5 9.2
Note: Mortality rates from injuries are crude rates. Data Source (for all the data above): NYSDOH Vital Statistics.
Fatal Motor Vehicle Accidents 2008 2009 2010
# Percent # Percent # Percent
Total Fatal Accidents (as % of all accidents) 17 0.3% 21 0.3% 12 0.2%
Alcohol-Related Fatal Accidents (as % of total fatal accidents) 4 23.5% 8 38.1% 3 25.0%
Data Source: Dutchess County Traffic Safety Data
19
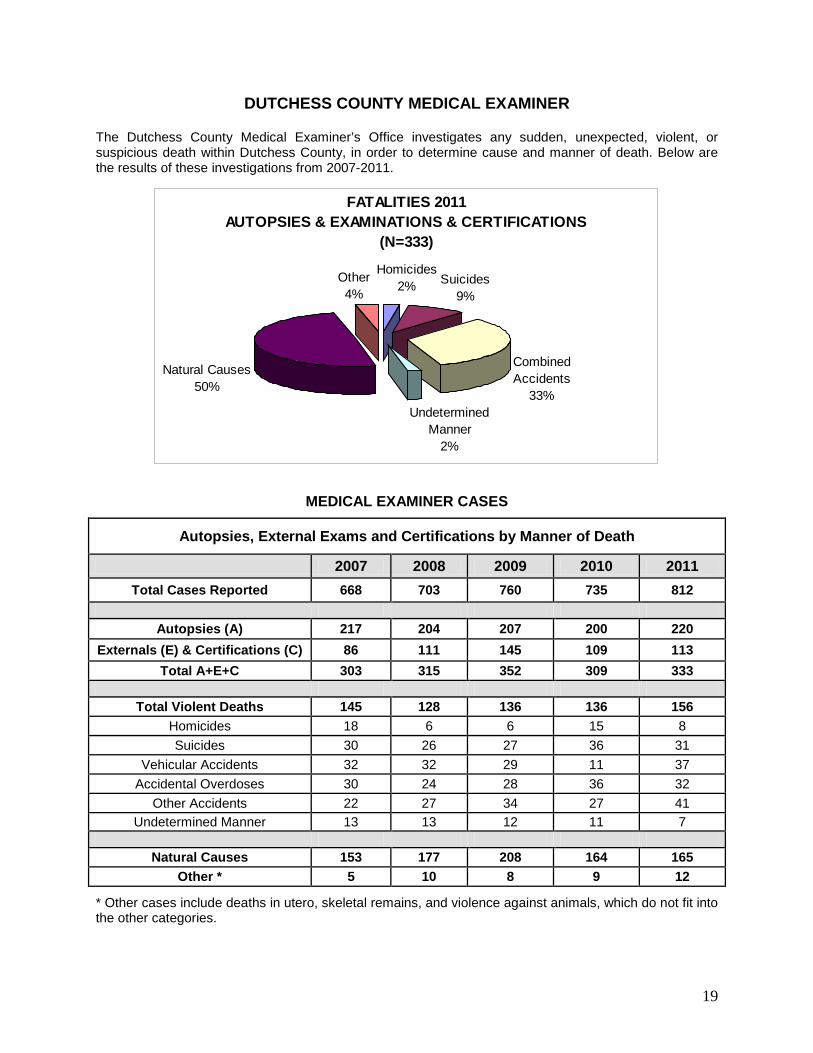
DUTCHESS COUNTY MEDICAL EXAMINER
The Dutchess County Medical Examiner’s Office investigates any sudden, unexpected, violent, or suspicious death within Dutchess County, in order to determine cause and manner of death. Below are the results of these investigations from 2007-2011.
FATALITIES 2011AUTOPSIES & EXAMINATIONS & CERTIFICATIONS
(N=333)
Suicides9%
Combined Accidents
33%Undetermined
Manner2%
Natural Causes50%
Other4%
Homicides2%
MEDICAL EXAMINER CASES
Autopsies, External Exams and Certifications by Manner of Death
2007 2008 2009 2010 2011 Total Cases Reported 668 703 760 735 812
Autopsies (A) 217 204 207 200 220
Externals (E) & Certifications (C) 86 111 145 109 113 Total A+E+C 303 315 352 309 333
Total Violent Deaths 145 128 136 136 156
Homicides 18 6 6 15 8 Suicides 30 26 27 36 31
Vehicular Accidents 32 32 29 11 37 Accidental Overdoses 30 24 28 36 32
Other Accidents 22 27 34 27 41 Undetermined Manner 13 13 12 11 7
Natural Causes 153 177 208 164 165
Other * 5 10 8 9 12
* Other cases include deaths in utero, skeletal remains, and violence against animals, which do not fit into the other categories.
20
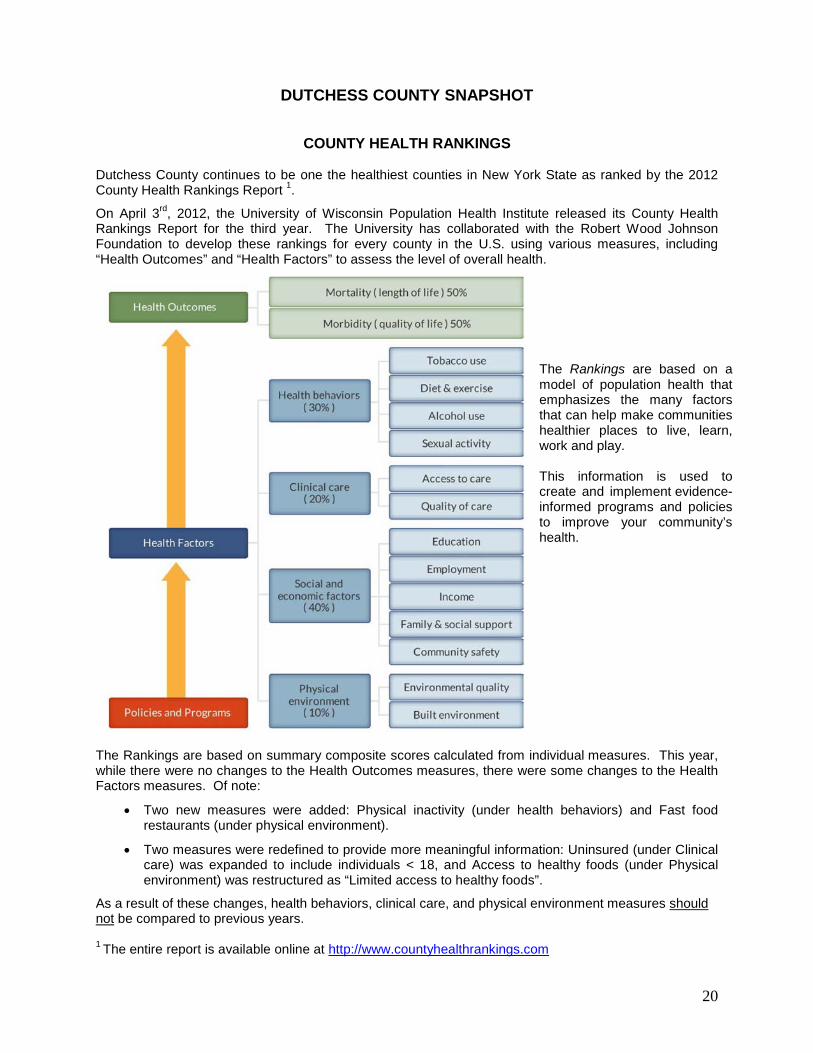
DUTCHESS COUNTY SNAPSHOT
COUNTY HEALTH RANKINGS Dutchess County continues to be one the healthiest counties in New York State as ranked by the 2012 County Health Rankings Report 1.
On April 3rd, 2012, the University of Wisconsin Population Health Institute released its County Health Rankings Report for the third year. The University has collaborated with the Robert Wood Johnson Foundation to develop these rankings for every county in the U.S. using various measures, including “Health Outcomes” and “Health Factors” to assess the level of overall health.
The Rankings are based on summary composite scores calculated from individual measures. This year, while there were no changes to the Health Outcomes measures, there were some changes to the Health Factors measures. Of note:
• Two new measures were added: Physical inactivity (under health behaviors) and Fast food restaurants (under physical environment).
• Two measures were redefined to provide more meaningful information: Uninsured (under Clinical care) was expanded to include individuals < 18, and Access to healthy foods (under Physical environment) was restructured as “Limited access to healthy foods”.
As a result of these changes, health behaviors, clinical care, and physical environment measures should not be compared to previous years. 1 The entire report is available online at http://www.countyhealthrankings.com
The Rankings are based on a model of population health that emphasizes the many factors that can help make communities healthier places to live, learn, work and play. This information is used to create and implement evidence-informed programs and policies to improve your community’s health.
21
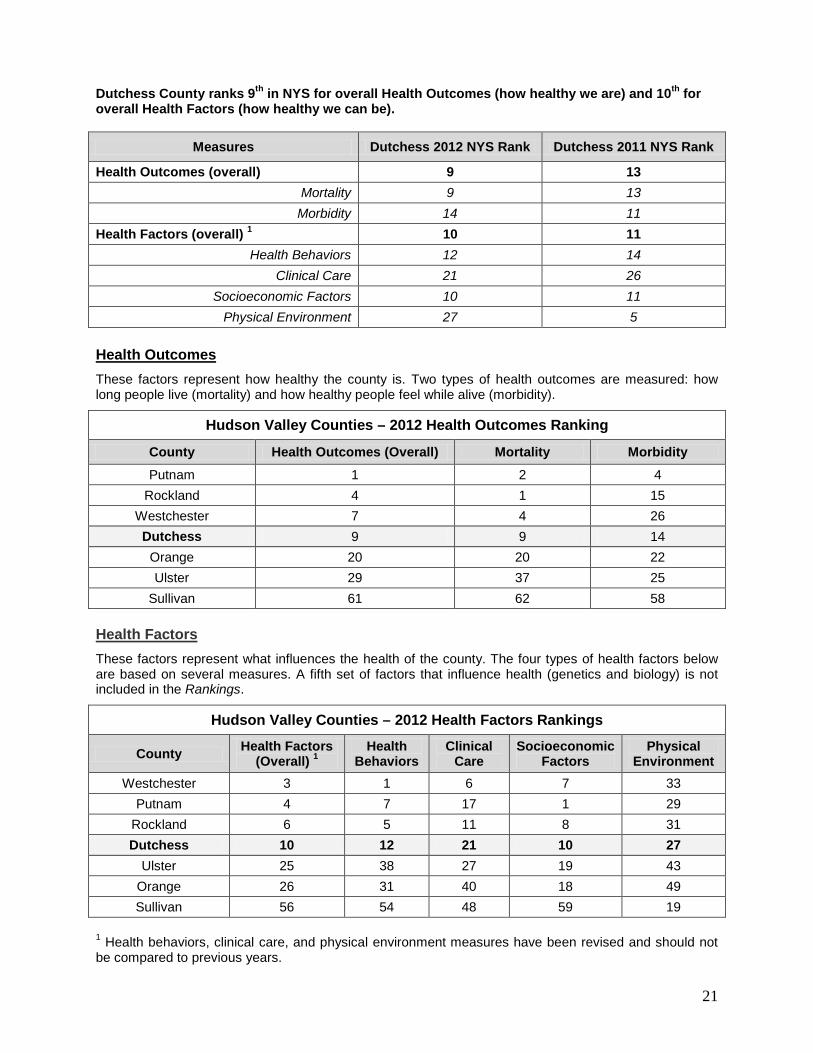
Dutchess County ranks 9th in NYS for overall Health Outcomes (how healthy we are) and 10th for overall Health Factors (how healthy we can be).
Measures Dutchess 2012 NYS Rank Dutchess 2011 NYS Rank
Health Outcomes (overall) 9 13 Mortality 9 13 Morbidity 14 11
Health Factors (overall) 1 10 11 Health Behaviors 12 14
Clinical Care 21 26 Socioeconomic Factors 10 11
Physical Environment 27 5 Health Outcomes These factors represent how healthy the county is. Two types of health outcomes are measured: how long people live (mortality) and how healthy people feel while alive (morbidity).
Hudson Valley Counties – 2012 Health Outcomes Ranking
County Health Outcomes (Overall) Mortality Morbidity Putnam 1 2 4
Rockland 4 1 15 Westchester 7 4 26 Dutchess 9 9 14
Orange 20 20 22 Ulster 29 37 25
Sullivan 61 62 58 Health Factors These factors represent what influences the health of the county. The four types of health factors below are based on several measures. A fifth set of factors that influence health (genetics and biology) is not included in the Rankings.
Hudson Valley Counties – 2012 Health Factors Rankings
County Health Factors (Overall) 1
Health Behaviors
Clinical Care
Socioeconomic Factors
Physical Environment
Westchester 3 1 6 7 33 Putnam 4 7 17 1 29
Rockland 6 5 11 8 31 Dutchess 10 12 21 10 27
Ulster 25 38 27 19 43 Orange 26 31 40 18 49 Sullivan 56 54 48 59 19
1 Health behaviors, clinical care, and physical environment measures have been revised and should not be compared to previous years.
22
DATA NOTES
Healthy People 2010 and 2020
Healthy People 2010 is referred to throughout the report as a benchmark for certain indicators. It represents national health objectives designed to identify the most significant preventable threats to health and to establish national goals to reduce these threats. It is grounded in science, built through public consensus, and designed to measure progress. Its overarching goals are to increase quality of life and years of healthy life as well as eliminate health disparities. It provides a framework for nationwide health promotion and disease prevention.
As of the printing of this report, Healthy People 2020 objectives have been released but cannot be applied to data predating 2011. While 2011 data may be included in a few tables, these data do not match a Healthy People 2020 goal.
For the 2020 goals, four foundation health measures will serve as an indicator of progress towards achieving goals: (1) General health status; (2) Health-related quality of life and well-being; (3) Determinants of health; and (4) Disparities.
Healthy People 2020 contains 42 topic areas with nearly 600 objectives (with others still evolving), which encompass 1,200 measures. A smaller set of objectives, called Leading Health Indicators, has been selected to communicate high-priority health issues and actions that can be taken to address them. They highlight current critical health issues - such as tobacco use, health disparities, and overweight and obesity - that, if left unaddressed, can result in future public health problems.
For more information on Healthy People 2020, please refer to http://www.healthypeople.gov/
U.S. Census 2010 and the American Community Survey
There are important differences between the decennial Census (i.e. Census 2000 and Census 2010), the American Community Survey (ACS). The Decennial Census collects certain demographic and household data every 10 years from every household in the U.S. and its territories. The most recent is Census 2010.
The ACS is a nationwide survey. It is a critical part of the Census Bureau's re-engineered 2010 census plan. It collects demographic, social, economic, and housing information. It is an on-going survey sent to a sample of the population and not the total population as in decennial Census. As of 2010, the ACS has replaced the decennial census long form which was also based on a sample of the population.
For more information on the Census Bureau, please refer to http://www.census.gov/

23
We invite you to visit our website and view our Community Health Assessment at:
www.dutchessny.gov/CountyGov/Departments/Health/HDindex.htm
----------------------------------------------------------
Dutchess County Department of Health 387 Main Street, Poughkeepsie, NY 12601
845.486.3400 (tel) - 845.486.3447 (fax) - 845.486.3417 (TTY) www.dutchessny.gov
Dutchess County Government
@DutchessCoGov
Marcus J. Molinaro Michael C. Caldwell, MD, MPH County Executive Commissioner of Health