Embed Size (px)
Citation preview

Community Health Status Assessment
OKLAHOMA COUNTYWELLNESS SCORE
2014

A MESSAGE FROM OUR EXECUTIVE DIRECTOR…
The Oklahoma City-County Health Department, in partnership with the City of Oklahoma City, Oklahoma County, and the Wellness Now Coalition, is pleased to present the 2014 Health and Wellness Assessment. This document represents the culmination of assessments and information gathering over the last year. As one of the first local health departments to become accredited by the Public Health Accreditation Board (PHAB), the Oklahoma City-County Health Department was commended for our strong community partnerships, and our vision for improving health for residents of our community.
PHAB designation requires continued focus on quality improvement and agency transparency. We are excited about the results you will find in the pages that follow. This is a living, breathing document, intended to spark discussion, and action for continuing our trend of improving health outcomes for Oklahoma City and County residents. We have made many improvements over the last several years, and to continue this upward trend we will rely on the partnerships of this community to direct us in developing and delivering services that meet the needs and expectations of our residents.
The Health and Wellness Assessment is designed to link health outcomes to actionable policies and evidence-based programs that have the potential to improve health. Additionally, for each data point, a message specifically tailored to providers and community members has been included to encourage continuing and new partners to begin discussions for first steps.
There are many individuals who participated in the development of this manual, but we would like to especially thank the Oklahoma City-County Health Department Board of Health members for providing us with the vision, oversight, and support for our approach to improving health outcomes and the Wellness Now Coalition partnership for their continued commitment to implementing change in our community.
We hope you will see this not just as a report on the current status of health in our community, but an opportunity to engage in improving our health outcomes, one neighborhood, one zip code, one community at a time.
Sincerely,
Gary Cox, JD, Executive Director Stephen Cagle, M.D., Chairman, Board of Health

ii
Wellness ScoreThe purpose of the Wellness Score is to provide an overall summary of community health status. This information represents the foundation of planning and program development for improving health outcomes for our community.
The Oklahoma City-County Health Department (OCCHD) consulted with representatives across several agencies in Oklahoma County to obtain a list of variables that include both determinants and outcomes of health and wellness for our community residents. For inclusion in the Wellness Score, data had to be collected at a zip code level and available for the 2010 – 2012 time frame.
Strengths & ThemesThis assessment seeks community feedback to identify strengths and themes of our community that influence our health and well-being, for example, our extensive trail system was considered a strength, while community concern regarding access to grocery stores was identified as a theme. This assessment is commonly administered through surveys.
To increase the validity of the information collected, and in partnership with the City of Oklahoma City, Gallup, Inc., was solicited to conduct a community-wide survey using the Gallup Daily tracking system. This system ensures sampling of listed landline and wireless phone numbers in a target community. Additionally, the survey includes Spanish-language interviews for respondents who speak only Spanish. One-thousand surveys were conducted to measure the perception of well-being among residents of our community, providing new information about strengths and themes in our community.
Forces of ChangeThe purpose of this assessment is to determine, through community feedback and participation, what barriers and supports exist for improving community health. The feedback for this assessment is typically collected through town hall meetings, focus groups, and stakeholder interviews.
In addition to administering the Strengths & Themes assessment, Gallup, Inc. also completed 6 focus groups and more than 20 key stakeholder interviews to provide insight for the Forces of Change assessment.
Local Public Health System AssessmentThe purpose of this assessment is to bring together traditional and non-traditional providers of services that impact our health outcomes to assess our community’s capacity to meet the health needs of our residents. The assessment is completed utilizing the National Public Health Performance Standards Program (NPHPSP), and is typically completed over the course of a single day.
OCCHD facilitated the NPHPSP in November, 2013 with more than 60 individuals present representing more than 25 individual agencies and communities. The Center for Disease Control calculates the assessment results and generates a profile report, enabling the local public health system to identify gaps in capacity and strengths of the system.
Data OverviewThe Oklahoma City-County Health Department (OCCHD) consulted with representatives across several agencies in Oklahoma County to obtain data variables. A total of 47 variables were identified in 6 different categories. The variables include both determinants and outcomes to assess the health and wellness of populations in multiple aspects of life.
OVERVIEWThe Oklahoma City-County Health Department (OCCHD) utilizes the Mobilizing for Action through Planning and Partnership (MAPP) tool to conduct community-wide health needs assessments. The MAPP process engages a broad, and diverse coalition of stakeholders to collect qualitative and quantitative data across four distinct assessments: Wellness Score (Community Health Profile), Forces of Change, Strengths & Themes, and the Local Public Health System Assessment. Each assessment utilizes a distinct methodology, representing a robust cross-section of quantitative and qualitative data.

iii
Zip Code LevelMany of the health indicators in this assessment are defined at the zip code level and are presented for the 63 zip codes located in Oklahoma County. However, maps and tables in the profile display only 56 zip codes since data for two sparsely populated zip codes have been combined with adjacent zip codes, and five zip codes had less than 25% of their population within Oklahoma City-County jurisdiction (see the section below for more information on this topic). This more visual approach to data presentation is intended to promote easier identification of health concerns for specific areas of the county and therefore assist in targeting programs, resources, and necessary intervention where they are most needed.
Border/Combined Zip CodesOklahoma County has 9 zip codes that are shared with adjacent counties, but are primarily in Oklahoma County. These zip codes are: 73007, 73025, 73034, 73045, 73054, 73099, 73165, 73170 and 74857. Data sets for these shared zip codes in some cases required mathematical distribution between the counties. This was accomplished, when needed, by dividing the data in proportion to the number of people living in the two counties.
Data for two zip codes that lie entirely within Oklahoma County is combined with adjacent zip codes in this profile due to the small populations residing in each. These zip codes are 73066 and 73097 and when viewed on the maps throughout the profile will be combined with 73141 and 73169 respectively.
In addition, Oklahoma County includes small proportions (less than 25% population) of five zip codes that are shared but lie primarily in adjacent counties. The data for these partial zip codes (73026, 73064, 73071, 73078 and 73160) have been excluded as not meaningful because of their small resident populations and the instability of rates computed on the basis of small numbers of events.
RatesThis profile presents most of the information in the form of ‘rates’. Rates allow for easier comparison to other populations and geographic areas. Rates are developed by taking the total number of events and dividing it by the total population (or population at risk of the event) in the same specific area. Rates in this profile are computed per 1,000 or 100,000 population. This report also contains both crude and age-adjusted death rates (see glossary for a definition).
In general, areas of larger population can be expected to support more reliable rate calculations. Note that zip codes 73007, 73054, 73102, 73103, 73104, 73121, 73128, 73131, 73134, 73145, 73149, 73150, 73151, 73169, 73173, and 73179 all have populations less than 5,000. Caution should be exercised in interpreting data for these less populated areas as they can potentially result in misleading comparisons with other zip codes. In addition, the calculation of rates is not recommended when there are less than five indicator deaths due to reliability concerns.
Data BreaksWhen viewing a table or map, the data are grouped for presentation by natural breaks in the data sets. Natural breaks is also the name of the default computer-generated method of classifying data in the geographic information system software, ArcGIS, used to produce the maps presented in this report. An additional 5 zip codes shared with adjacent counties with less than 25% of their populations in OCCHD jurisdiction were excluded. These zip codes are: 73026, 73064, 73071, 73078, and 73160. Use of natural breaks supports a user-friendly visual representation of the geographic distribution of risk factors and outcomes of health data in Oklahoma County.
Descriptive StatisticsThis profile uses tables, graphs, charts, maps and narrative to statistically describe the factors that affect the health of the Oklahoma County community. The information presented includes both risk factors and health outcomes. Geographic and demographic areas of public health concern can be identified by evaluating data presented for each of the Oklahoma County zip codes.
OVERVIEW

iv
Time PeriodData throughout the profile are generally included for the years 2010-2012 depending on the availability of data for the specific topic. Therefore, most data are average annual rates over a three year period. All zip code level population data is based on 2012 estimates.
Overall Zip Code RatingThis profile looks at numerous risk/outcome measures that give an indication of the health status of the community. The profile often records the data by zip code. Zip codes are grouped into five data ranges using natural breaks in the overall data (see Data Breaks) and shaded accordingly in the presentation maps.
Data groupings are assigned values 1 through 5 with 1 (lightest shading) being the most favorable and 5 (darkest shading) indicating areas of greatest potential concern from a public health perspective.
An average zip code rating is also computed that collapses the individual risk/outcome measures into a single summary statistic for each zip code. The raw zip code wellness score was calculated for all variables using a formula adapted from the United Health Foundation to calculate scores for America’s Health Rankings. Each category was also given a score which was obtained by averaging the variable scores within each category. This balances the effect of categories having different numbers of variables, and at the same time assumes the equal contribution of each variable towards the category score. Category scores are averaged to obtain the aggregate Wellness Score, again assuming equal contribution.
SurveySurvey design: Gallup Daily tracking employs a dual-frame design involving sampling of listed landline and wireless phone numbers. The surveys were conducted using two different topical questionnaires, with a number of shared items: half of the respondents receive the Wellbeing track, while the other half receives the Politics and Economy track. Additionally, the survey includes Spanish-language interviews for respondents who speak only Spanish. Gallup stratifies the listed landline sample by census region and employs appropriate sample allocation scheme to ensure that the unweighted samples are roughly proportionate by region. Gallup weights the data daily to compensate for disproportionalities in selection probabilities and nonresponse. In addition, Gallup weights the data to match targets from the U.S. Census Bureau by age, sex, region, gender, education, ethnicity, and race, as well as population density of self-reported location. Gallup also weights the data to match national targets of phone status (such as cellphone only, dual user cellphone mostly with unlisted landline, etc.). With the inclusion of the cellphone-only households and the Spanish-language interviews, the sample represents more than 95% of the U.S. adult population.
Landline and cellphone sampling frame description: Survey Sampling Inc. provides listed landline sample and random-digit-dialing (RDD) wireless phone sample (consisting of all exchanges set aside for wireless phones) in non-overlapping frames. The listed landline sample is stratified proportionately by U.S. Census region.
Sample selection methodology: Gallup uses listed landline sample and RDD cellphone sample. When calling a landline telephone, based on respondents’ self-report of phone type rather than sample frame, Gallup uses random selection to choose respondents within a household based on the most recent birthday. Gallup treats cellphones as personal devices: The individual who answers the cellphone is the respondent.
Sample sizes: Gallup conducts 1,000 surveys with
OVERVIEW

v
American adults, aged 18 and older, daily, 350 days annually. Five hundred respondents are asked the Wellbeing track survey, while the other 500 complete the Politics and Economy track survey. Certain variables, such as employment indicators and key demographics, are asked on both survey tracks.
Data collection modes: Gallup completes all 1,000 surveys using an outbound phone mode.
Sample weighting methodology: To compensate for disproportionalities in selection probabilities and nonresponse, Gallup weights the data daily. Gallup further post-stratifies the data using an iterative proportional fitting (i.e., raking) algorithm to account for nonrandom nonresponse by phone status, age, sex, region, education, population density, ethnicity, and race. Gallup calculates daily weights for each survey track separately and for the combined data.
Number of callbacks: Gallup uses a three-call design to reach a respondent not contacted on the initial attempt. Gallup may make more than three attempts on a number under certain circumstances such as a scheduled callback.
The call design ensures that each call after the initial one takes place at a different time in the afternoon or evening to maximize the likelihood of contact by dividing the interviewing period into three “buckets.” Monday to Friday, Gallup calls individuals between 5 p.m. and 9 p.m. in respondents’ time zone unless they request a callback. Saturdays, Gallup begins dialing at 10 a.m. in each time zone, and on Sundays, Gallup begins dialing at 11 a.m. in each time zone.


DEMOGRAPHICS . . . . . . . . . . . . . . . . . . . . . . . . . . . . . . . . 1 County Specific Total Population . . . . . . . . . . . . . . . . . . . . . . . . . . . . . . . . . . . . . . 4 County Specific Population Change . . . . . . . . . . . . . . . . . . . . . . . . . . . . . . . . . . . . 6 County Specific Age and Gender . . . . . . . . . . . . . . . . . . . . . . . . . . . . . . . . . . . . . . 8 County Specific Race . . . . . . . . . . . . . . . . . . . . . . . . . . . . . . . . . . . . . . . . . . . . . . . 12
SOCIOECONOMICS . . . . . . . . . . . . . . . . . . . . . . . . . . . . . 13 Overall Economic Score . . . . . . . . . . . . . . . . . . . . . . . . . . . . . . . . . . . . . . . . . . . . 14 Median Household Income . . . . . . . . . . . . . . . . . . . . . . . . . . . . . . . . . . . . . . . . . . 16 Poverty . . . . . . . . . . . . . . . . . . . . . . . . . . . . . . . . . . . . . . . . . . . . . . . . . . . . . . . . . . 17 Households with SSI and SNAP . . . . . . . . . . . . . . . . . . . . . . . . . . . . . . . . . . . . . . 18 Unemployment . . . . . . . . . . . . . . . . . . . . . . . . . . . . . . . . . . . . . . . . . . . . . . . . . . . . 19 Education Attainment . . . . . . . . . . . . . . . . . . . . . . . . . . . . . . . . . . . . . . . . . . . . . . 20
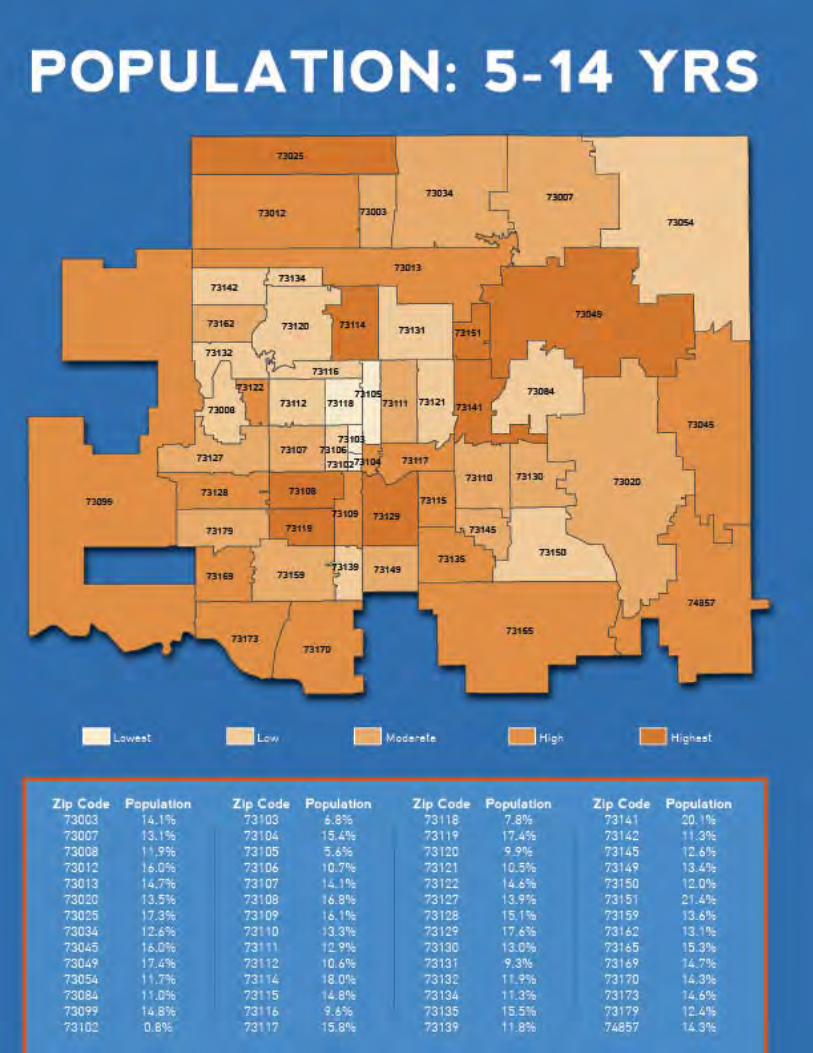
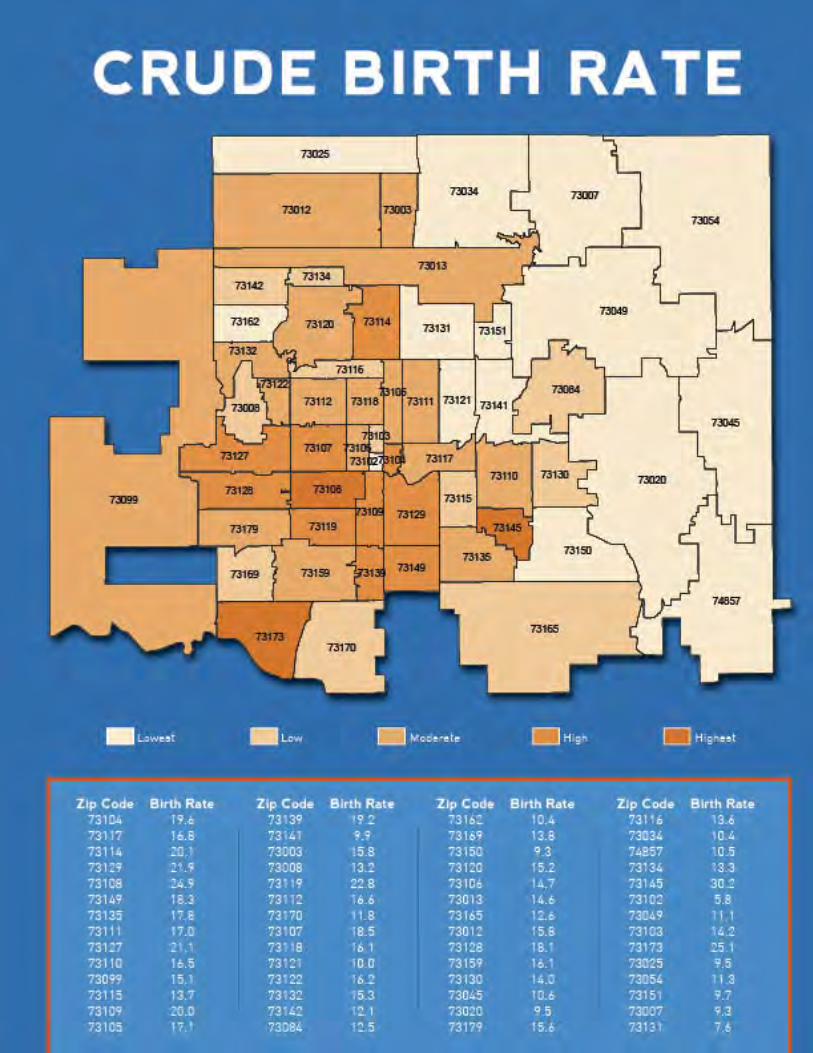
MATERNAL and CHILD HEALTH . . . . . . . . . . . . . . . . . . 21 Overall Maternal and Child Health Score . . . . . . . . . . . . . . . . . . . . . . . . . . . . . . 22 Crude Birth Rate . . . . . . . . . . . . . . . . . . . . . . . . . . . . . . . . . . . . . . . . . . . . . . . . . . 24 Births to Teens . . . . . . . . . . . . . . . . . . . . . . . . . . . . . . . . . . . . . . . . . . . . . . . . . . . . 26 No Maternal Prenatal Care . . . . . . . . . . . . . . . . . . . . . . . . . . . . . . . . . . . . . . . . . 28 Premature Birth . . . . . . . . . . . . . . . . . . . . . . . . . . . . . . . . . . . . . . . . . . . . . . . . . . 30 Low Birth Weight . . . . . . . . . . . . . . . . . . . . . . . . . . . . . . . . . . . . . . . . . . . . . . . . . . 32 Single Mother Households/Births to Unmarried Women . . . . . . . . . . . . . . . . . 34 Infant Mortality Rate . . . . . . . . . . . . . . . . . . . . . . . . . . . . . . . . . . . . . . . . . . . . . . . 36 Maternal Tobacco Use . . . . . . . . . . . . . . . . . . . . . . . . . . . . . . . . . . . . . . . . . . . . . . 38 Maternal Education . . . . . . . . . . . . . . . . . . . . . . . . . . . . . . . . . . . . . . . . . . . . . . . . 40
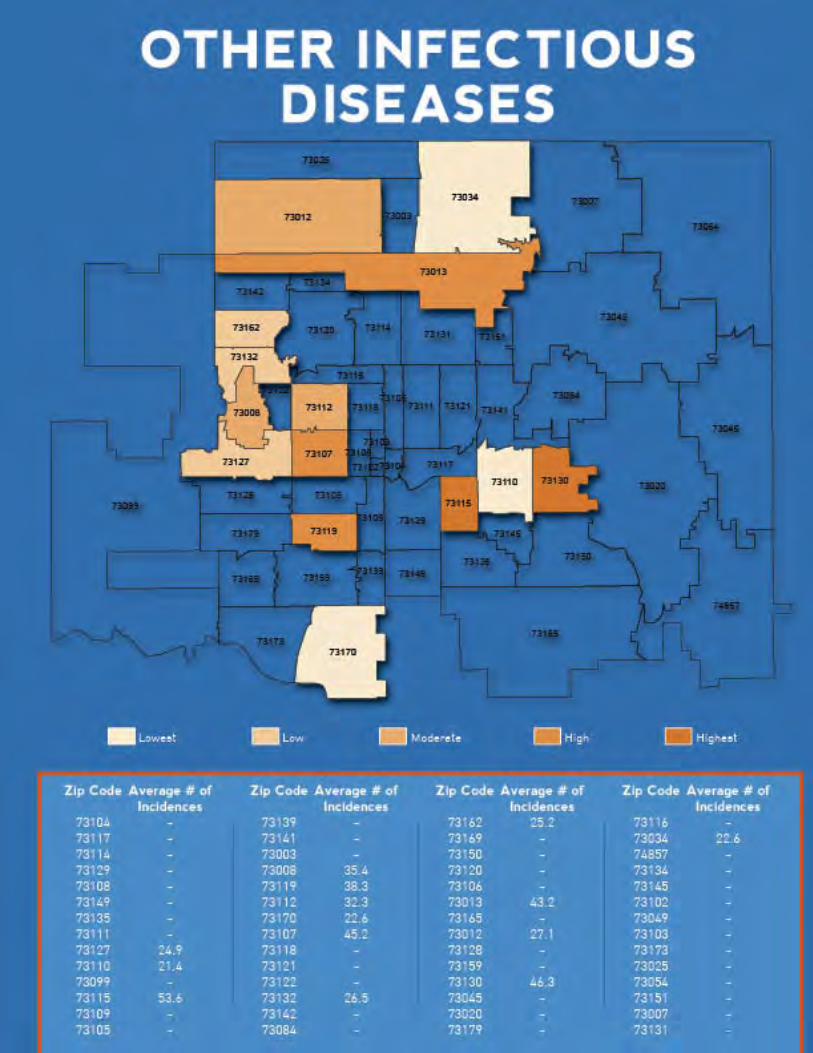
INFECTIOUS DISEASE . . . . . . . . . . . . . . . . . . . . . . . . . . .43 Overall Infectious Disease Score . . . . . . . . . . . . . . . . . . . . . . . . . . . . . . . . . . . . . 46 Enteric Disease . . . . . . . . . . . . . . . . . . . . . . . . . . . . . . . . . . . . . . . . . . . . . . . . . . . 48 Hepatitis B . . . . . . . . . . . . . . . . . . . . . . . . . . . . . . . . . . . . . . . . . . . . . . . . . . . . . . . 50 Hepatitis C . . . . . . . . . . . . . . . . . . . . . . . . . . . . . . . . . . . . . . . . . . . . . . . . . . . . . . . 52 Other Infectious Disease . . . . . . . . . . . . . . . . . . . . . . . . . . . . . . . . . . . . . . . . . . . . 54 Influenza/Pneumonia Mortality . . . . . . . . . . . . . . . . . . . . . . . . . . . . . . . . . . . . . . 56
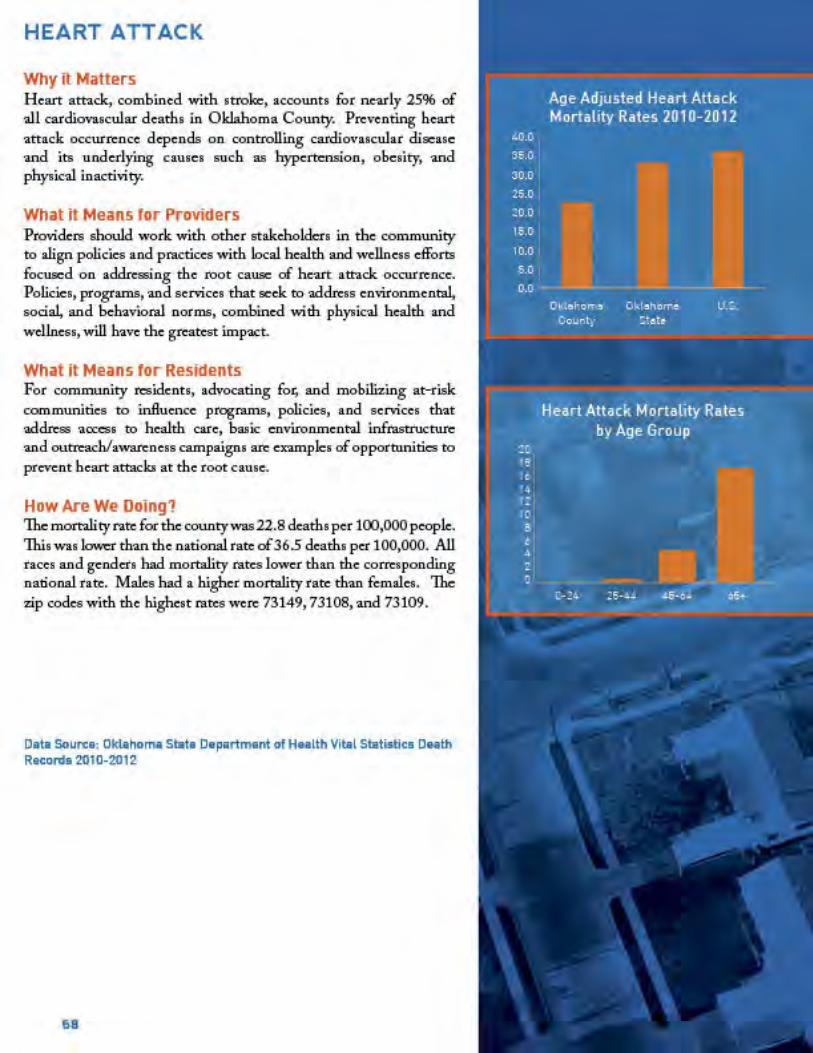
CHRONIC DISEASE MORTALITY . . . . . . . . . . . . . . . . . . 59 Overall Chronic Disease Score . . . . . . . . . . . . . . . . . . . . . . . . . . . . . . . . . . . . . . 60 All Cause . . . . . . . . . . . . . . . . . . . . . . . . . . . . . . . . . . . . . . . . . . . . . . . . . . . . . . . . . 62 Cardiovascular Disease . . . . . . . . . . . . . . . . . . . . . . . . . . . . . . . . . . . . . . . . . . . . 64 Stroke . . . . . . . . . . . . . . . . . . . . . . . . . . . . . . . . . . . . . . . . . . . . . . . . . . . . . . . . . . . 66 Heart Attack . . . . . . . . . . . . . . . . . . . . . . . . . . . . . . . . . . . . . . . . . . . . . . . . . . . . . . 68 Diabetes . . . . . . . . . . . . . . . . . . . . . . . . . . . . . . . . . . . . . . . . . . . . . . . . . . . . . . . . . 70 Hypertension . . . . . . . . . . . . . . . . . . . . . . . . . . . . . . . . . . . . . . . . . . . . . . . . . . . . . 72 Chronic Lower Respiratory Disease . . . . . . . . . . . . . . . . . . . . . . . . . . . . . . . . . . 74 Cancer . . . . . . . . . . . . . . . . . . . . . . . . . . . . . . . . . . . . . . . . . . . . . . . . . . . . . . . . . . . 76 Breast Cancer . . . . . . . . . . . . . . . . . . . . . . . . . . . . . . . . . . . . . . . . . . . . . . . . . . . . 78 Lung Cancer . . . . . . . . . . . . . . . . . . . . . . . . . . . . . . . . . . . . . . . . . . . . . . . . . . . . . . 80 Prostate Cancer . . . . . . . . . . . . . . . . . . . . . . . . . . . . . . . . . . . . . . . . . . . . . . . . . . . 82
TABLE OF CONTENTS

MENTAL and SOCIAL HEALTH . . . . . . . . . . . . . . . . . . . . 85 Overall Mental Health Score . . . . . . . . . . . . . . . . . . . . . . . . . . . . . . . . . . . . . . . . 88 Overall Social Health Score . . . . . . . . . . . . . . . . . . . . . . . . . . . . . . . . . . . . . . . . . 88 Mental Health Visits . . . . . . . . . . . . . . . . . . . . . . . . . . . . . . . . . . . . . . . . . . . . . . . 90 Substance Abuse . . . . . . . . . . . . . . . . . . . . . . . . . . . . . . . . . . . . . . . . . . . . . . . . . . 92 Child Abuse & Neglect . . . . . . . . . . . . . . . . . . . . . . . . . . . . . . . . . . . . . . . . . . . . . 94 Suicide Mortality . . . . . . . . . . . . . . . . . . . . . . . . . . . . . . . . . . . . . . . . . . . . . . . . . . 96 Free or Reduced Lunch . . . . . . . . . . . . . . . . . . . . . . . . . . . . . . . . . . . . . . . . . . . . . 98 Grocery Store Availability . . . . . . . . . . . . . . . . . . . . . . . . . . . . . . . . . . . . . . . . . . 100
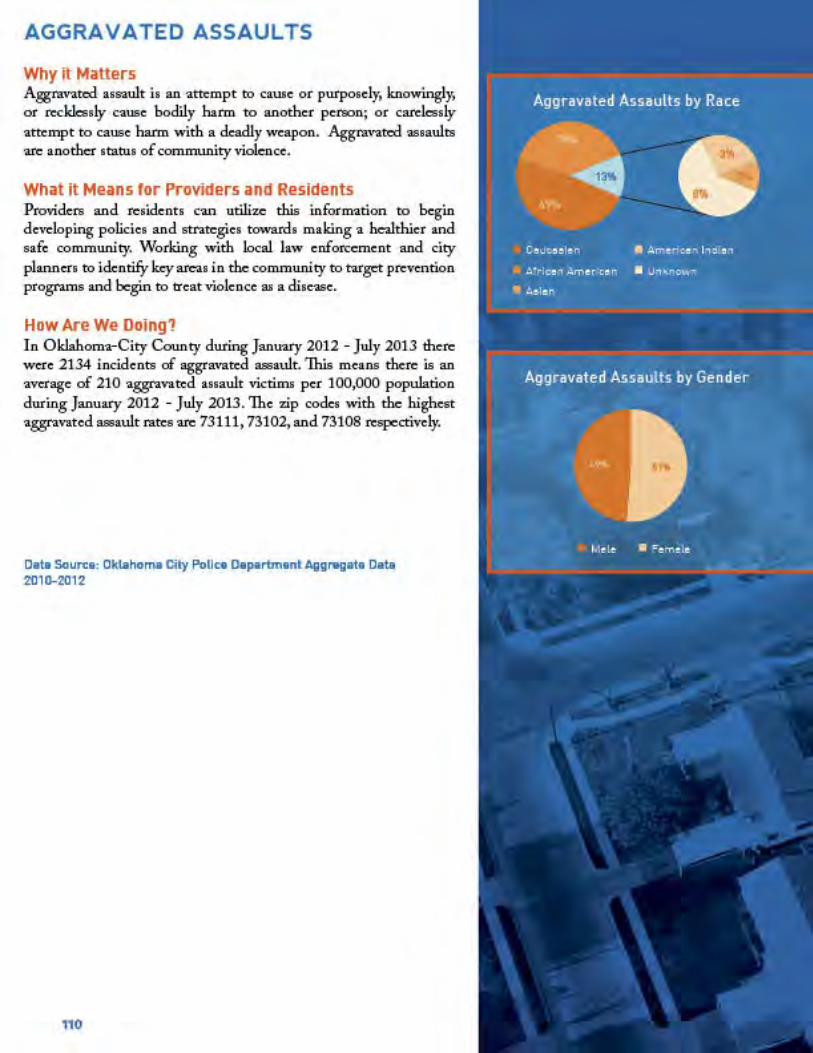
CRIME . . . . . . . . . . . . . . . . . . . . . . . . . . . . . . . . . . . . . . 103 Overall Crime Score . . . . . . . . . . . . . . . . . . . . . . . . . . . . . . . . . . . . . . . . . . . . . . 106 Homicide . . . . . . . . . . . . . . . . . . . . . . . . . . . . . . . . . . . . . . . . . . . . . . . . . . . . . . . . 108 Aggravated Assaults . . . . . . . . . . . . . . . . . . . . . . . . . . . . . . . . . . . . . . . . . . . . . . 110 Gun-Related Mortality . . . . . . . . . . . . . . . . . . . . . . . . . . . . . . . . . . . . . . . . . . . . . 112
HEALTH CARE ACCESS . . . . . . . . . . . . . . . . . . . . . . . . 115 Emergency Room Visits . . . . . . . . . . . . . . . . . . . . . . . . . . . . . . . . . . . . . . . . . . . 118 Preventable Hospital Stays . . . . . . . . . . . . . . . . . . . . . . . . . . . . . . . . . . . . . . . . 120 Physicians . . . . . . . . . . . . . . . . . . . . . . . . . . . . . . . . . . . . . . . . . . . . . . . . . . . . . . . 121
OVERALL WELLNESS SCORE RANKING . . . . . . . . . . . 123
STRENGTHS and THEMES / FORCES of CHANGE . . . . 127Behavioral Risk Factor Surveillance System (BRFSS) . . . . . . . . . . . . . . . . . . . . . . . . . . 128Gallup Well-Being Index . . . . . . . . . . . . . . . . . . . . . . . . . . . . . . . . . . . . . . . . . . . . . . . . . . 129
LOCAL PUBLIC HEALTH SYSTEM . . . . . . . . . . . . . . . . 131
GLOSSARY . . . . . . . . . . . . . . . . . . . . . . . . . . . . . . . . . . 133
TABLE OF CONTENTS