Embed Size (px)
Citation preview
Community Health Needs Assessment2014 – 2016

December 2016
I am pleased to present the 2016 Community Health Needs Assessment (CHNA) for Advocate Trinity Hospital. The 2016 CHNA takes a comprehensive look at the health of our primary and secondary service area residents through an extensive data review process of a broad range of variables affecting health outcomes. The CHNA is an important tool to identify key health priorities and to gain a better understanding of health disparities and inequities affecting our communities.
In 2016, our comprehensive review includes a thorough assessment of the hospital’s primary and secondary service areas health care profile, secondary public health data and new primary health data through our collaboration with community and public health organizations and with the Health Impact Collaborative of Cook County (HICCC). The HICCC was created in 2015 through the collaboration of Advocate Health Care, including Trinity Hospital, other hospitals, health departments and community organizations within Cook County. This collaborative facilitated a diverse community-engaged assessment which is posted as a companion to this report.
We have learned that partnerships have been critical to addressing all priority areas that were identified in 2013. We look forward to strengthening those partnerships and establishing new relationships to respond to the priority areas within this report. We deeply appreciate the work of our Community Health Council and community partners that are highlighted in this report.
Our accomplishments can be directly credited to the voices of the community members who contributed to this CHNA and the exceptionally dedicated staff and leadership at Trinity and our Trinity partners. I am grateful for their enduring commitment to this public health mission that we share and thank them for their ongoing efforts to protect and promote the health of all. We value your feedback, please leave us a comment or express your thoughts after reading this report on the link provided at the end of the report.
Sincerely,
Terika Richardson President Advocate Trinity Hospital

21 2
I. Executive Summary 3
II. Description of Advocate Health Care and Advocate Trinity Hospital 4
4 Advocate Health Care
4 Advocate Trinity Hospital
III. Summary of 2011-2013 Community Health Needs Assessment and Program Implementation 4
4 Community Definition
5 Process of Assessment and Prioritization
5 Needs Identified and Priorities Selected
5 Summary of Program Implementation to Address Identified Priorities
5 First Place 4 Health
6 Project H.E.A.L.T.H. (Healing Effectively After Leaving the Hospital)
6 Advocate Physician Partners (APP) – Asthma Support Initiative
6 Input from the Community for 2011-2013 CHNA
6 Lessons Learned
IV. 2014-2016 Community Health Needs Assessment 7
7 Demographics of Defined Community
8 Race and Ethnicity
8 Age
9 Gender
9 Education
10 Household Income
11 Poverty Level
11 Insurance Status
12 SocioNeeds Index
14 Key Roles in the Assessment
14 System and Hospital Leadership
14 Community Health Council (CHC)
15 Governing Council
15 Health Impact Collaborative of Cook County
16 Methodology
16 Health Impact Collaborative of Cook County
16 MAPP Process
18 Community Survey
18 Focus Groups in South Region
Table of Contents
22
20 Use of Healthy Communities Institute (HCI) Data Platform
20 Review of Other Available National and Local Data
20 Summary of Results
20 Health Impact Collaborative of Cook County, CHNA, South Region
21 Data Review at Trinity Hospital
21 Asthma
23 Diabetes
26 Cancer
27 Heart Disease
28 Hypertension and Stroke
29 Mental Health
29 Violence and Homicide
30 Prioritization of Health Needs
30 Health Impact Collaborative of Cook County
31 Community Health Council Priority Setting
31 Health Needs Not Selected as Priorities
32 Governing Council Approval
V. 2016 Implementation Planning 33
33 Asthma
33 Diabetes
33 Social, Economic and Structural Determinants of Health – Workforce Development
VI. Vehicle for Community Feedback 34
VII. Appendix: Sources for 2014-2016 CHNA 35
Table of Contents continued...

3
I. Executive SummaryWith this Community Health Needs Assessment (CHNA) report, Advocate Trinity Hospital continues to demonstrate strong commitment to building lifelong relationships to improve the health of individuals, families and communities. In 2015, all five Advocate Health Care hospitals principally serving Cook County, including Advocate Trinity Hospital, were founding members of the Health Impact Collaborative of Cook County (HICCC). HICCC is a best practice community health initiative involving 26 hospitals, 7 health departments and nearly 100 community-based organizations. The goal of this collaborative is to work together on a county-wide health assessment and common implementation strategies once priorities are identified. The Illinois Public Health Institute (IPHI) served as the backbone organization for the collaborative—providing facilitation, data coordination and report preparation activities.
Given the size and diversity of Cook County, the collaborative created three regions—North, Central and South—for purposes of organizing the assessment process. Trinity Hospital was appropriately assigned to the South region consisting of both the south side of Chicago and the south suburbs of Cook County. Please see the companion document to Trinity Hospital’s CHNA, Health Impact Collaborative of Cook County, Community Health Needs Assessment, South Region, which are also posted on the Advocate website and at www.healthimpactcc.org/reports2016.
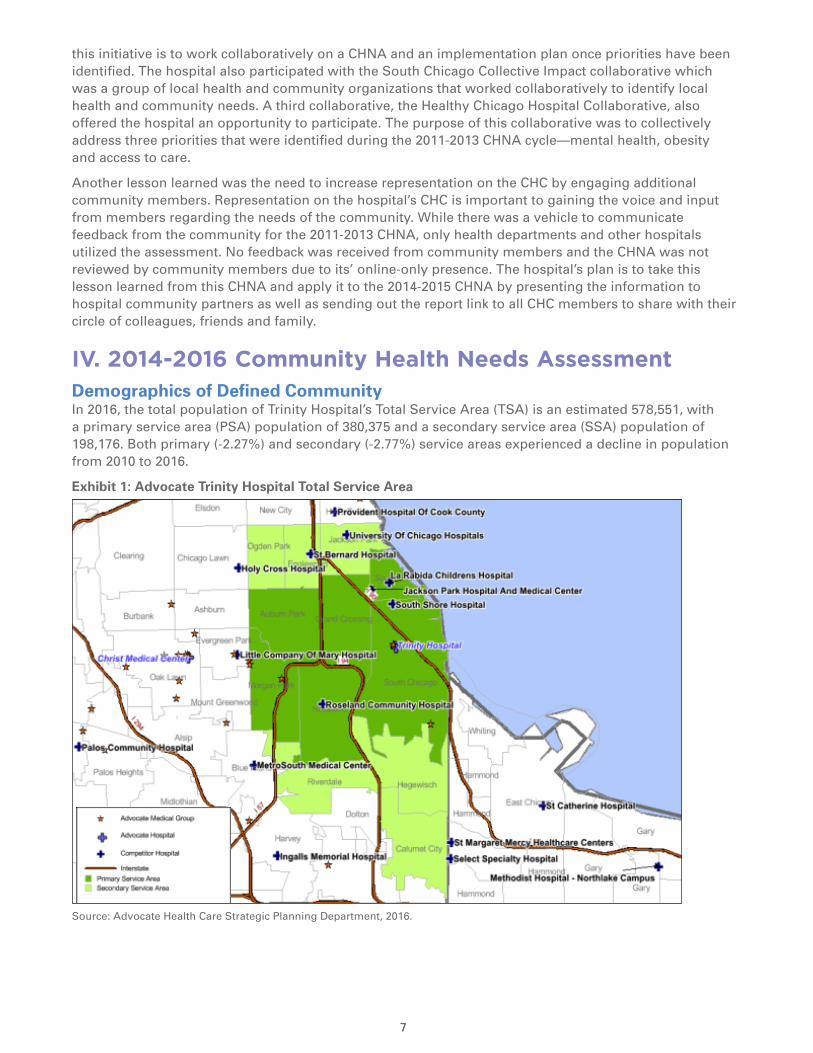
In addition to participating in the Cook County collaborative, Trinity Hospital conducted a community health assessment targeting its defined community—the hospital’s primary (PSA) and secondary (SSA) service areas. The total service area covers 12 zip codes including 20 community areas as defined by the City of Chicago Department of Planning, all in the Chicago city limits with the exception of Calumet City, which lies just south of Chicago but still in Cook County. This total area includes an estimated 578,551 individuals, with a PSA population of 380,375 and an SSA population of 198,176. Both primary and secondary service areas experienced a decline in population from 2010 to 2016. The total population is 83% African American and 10% white; by ethnicity, nearly 10% report being Hispanic. The median age of the PSA is 38.6 while it is somewhat younger in the SSA at 33.3. Nine out of twelve zip codes in the community have HCI SocioNeeds Index values above 90, identifying these areas as having very high socioeconomic needs.
For purposes of the 2014-2016 CHNA cycle, a Community Health Council (CHC) consisting of 22 community and medical center leaders was convened to oversee the assessment. Data from the Health Impact Collaborative of Cook County was presented to the CHC including the HICCC priority-setting process that identified Social Determinants of Health, Mental Health and Substance Abuse, Access to Care and Chronic Disease as the four county-wide priorities. All hospitals that participated in HICCC agreed to accept Social Determinants as one of their priorities, with Trinity Hospital identifying that one of their strategies within this priority would be workforce development.
In addition, multiple indicators from the Healthy Communities Institute (HCI) data platform were shared with Trinity Hospital’s CHC. Many of these indicators were particularly useful to the assessment because the hospitalization and emergency room visits rates were available by zip code, thus permitting a deeper look into the health status of the defined community. A voting process was used with the CHC to select the second and third priorities for this CHNA cycle—asthma and diabetes. Cancer, heart disease and hypertension (stroke) were not selected primarily because the hospital already has clinical and community programs addressing each of these important health needs. Mental health was not selected because the hospital provides very limited services in this area and did not feel qualified to address this need. Finally, while violence prevention was not selected, it remains an important need for ongoing collaboration with community partners. The three priorities selected by Trinity Hospital are workforce development, asthma and diabetes.
Trinity Hospital is currently developing implementation plans for each of the three priorities selected. Community health staff will be participating in the action planning teams on Social Determinants of Heath and Chronic Disease Prevention convened as part of the HICCC. For workforce development, the hospital plans to expand its work with the Advocate Workforce Collaborative. For the asthma priority, the community health team is planning to expand Project H.E.A.L.T.H. and work with Claretian Associates to educate homeowners about asthma triggers. For the diabetes priority, the team plans to implement the National Diabetes Prevention Program (DPP), Prevent T2, in community areas in partnership with community-based organizations and faith communities.
54 5
II. Description of Advocate Health Care and Advocate Trinity HospitalAdvocate Health CareAdvocate Trinity Hospital is one of 11 hospitals in the Advocate Health Care (Advocate) system. Advocate is the largest health system in Illinois and one of the largest healthcare providers in the Midwest, operating more than 400 sites of care, including 11 acute care hospitals, the state’s largest integrated children’s network, 5 Level I trauma centers, 2 Level II trauma centers, the region’s largest medical group and one of the region’s largest home health care companies. The Advocate system trains more primary care physicians and residents at its four teaching hospitals than any other health system in the state.
Advocate is a faith-based, not-for-profit health system related to both the Evangelical Lutheran Church in America and the United Church of Christ. Advocate’s mission is to serve the health needs of individuals, families and communities through a wholistic philosophy rooted in the fundamental understanding of human beings as created in the image of God. This wholistic approach provides quality care and service, and treats each patient with dignity, respect and integrity. To guide its relationships and actions, Advocate embraces the five values of compassion, equality, excellence, partnership and stewardship. The mission, values and wholistic philosophy (MVP) permeate all areas of Advocate’s healing ministry and are integrated into every aspect of the organization building a cultural foundation. The MVP calls Advocate to extend its services into the community to address access to care issues and to improve the health and well-being of the people in the communities Advocate serves. As an Advocate hospital, Advocate Trinity Hospital embraces the system MVP as its own.
Advocate Trinity HospitalProviding health care on the south side of Chicago for more than 115 years, Advocate Trinity Hospital is a 205-bed not-for-profit health care facility. Trinity Hospital offers a full range of inpatient and outpatient services, including advanced cardiac and vascular care, women’s services, endoscopy, oncology, dialysis, and specialized ear, nose and throat services. The hospital is designated as a primary stroke center, a Level II-Plus special care nursery, and a Level II Comprehensive Emergency Service. Trinity Hospital cares for more than 90,000 patients each year, providing access to more than 300 physicians with expertise in more than 50 specialties. Trinity Hospital is the first hospital to be certified as a “Baby Friendly” Chicago Hospital, a designation from the World Health Organization recognizing the highest level of support for breastfeeding mothers and babies. The hospital is proud to be a community hospital where patients can receive advanced care in state-of-the-art facilities close to home.
Trinity has a long standing commitment to improving the health of the community it serves. Over the years, the hospital has sponsored community health programs designed to improve the health of its residents. The hospital believes in community partnership as a means to tackle the health and social needs of the community, thus faith based organizations and schools, among others, are key partners.
III. Summary of 2011-2013 Community Health Needs Assessment and Program Implementation Community DefinitionTrinity hospital defined its community for the 2011-2013 CHNA process as the hospital’s primary and secondary service areas spanning 12 zip codes including 20 community areas as defined by the City of Chicago Department of Planning. The primary service area (PSA) included zip codes 60617, 60619, 60620, 60628, 60643 and 60649; while the secondary service area included zip codes 60409, 60621, 60633, 60636, 60637 and 60827. Trinity Hospital’s community was located within the Chicago city limits with the exception of Calumet City, Illinois, zip code 60827, which lies just south of the Chicago city limits but still in Cook County. The population of the defined community totaled 586,271 at the time of the assessment in 2013.
55
Process of Assessment and PrioritizationIn 2011 Trinity Hospital, along with nine other Advocate Health Care hospitals, convened hospital-specific Community Health Councils (CHC) to oversee a comprehensive needs assessment. The health needs of the community were compiled based on a variety of data sources including city, state, and county level data. The CHC ranked the most significant community health needs using the following criteria: 1) most prevalent health needs identified based on highest mortality rates; highest incidence of disease in the community; and the highest hospital admissions; 2) availability of community partnerships; and 3) availability of current resources needed to plan and implement programs.
The data identified the following conditions as the most significant health needs within the 20 communities in the Trinity Hospital total service area:
1. Heart Disease, Stroke, and Obesity
2. Cancer
3. Asthma
4. Accidents
5. Homicide
Needs Identified and Priorities SelectedThe CHC compared the data identified for each important health need by community and total service area. The data was also compared to the leading causes of hospital admissions and discharges. After careful review of all available data, the CHC identified heart disease/stroke, obesity and asthma as the top health needs for focus in the 2011-2013 CHNA.
Summary of Program Implementation to Address Identified PrioritiesDuring the implementation planning process, the CHC agreed that the root causes of obesity in the community included lack of exercise and poor eating habits. These modifiable and preventable risk factors significantly impact the heart disease and stroke burden in the community. In order to address the prioritized health needs, two evidence-based interventions were selected: 1) First Place 4 Health; and 2) Project H.E.A.L.T.H. (Healing Effectively After Leaving the Hospital).
First Place 4 Health First Place for Health was developed as a behavioral modification program rooted in evidence based practice. The program goals are to improve the cardiovascular health and overall fitness of the community by reducing the controllable risk factors associated with heart disease, stroke and obesity. The program focuses on two primary objectives: 1) to increase the knowledge of risks factors associated with heart disease by providing health education workshops to community residents; and 2) to increase the physical fitness level of the community by encouraging healthy lifestyle changes.
This faith based program well suited to the population within the community, utilizes 12 weekly Bible-based modules designed to provide health education and support the need to improve health. Practicing healthy behaviors and incorporating regular physical activity in faith communities has been shown to be an effective intervention. During the implementation phase, the hospital partnered with faith communities to provide the First Place 4 Health program to congregants and the community at large. A total of 10 series were conducted, engaging over 95 participants. A pre and post-test survey was administered to assess outcomes. Ninety-four percent of the participants reported engaging in some type of physical activity 3 or more days a week. Correspondingly, there was a 30% increase in knowledge among participants’ ability to identify activities considered to be “moderate intensity physical activity” and there was a 6.1% increase in knowledge on how to read food labels. Further, there was an 18% increase in fresh fruit and vegetable consumption among participants.
Additionally, Trinity Hospital successfully engaged the community by conducting workshops and health screenings regarding cardiovascular disease and its risk factors. The hospital established a network of faith and community organizations that support and offer health screenings and health education programs to the community. The collaborative is now known as the Partners for Faith and Health Network. Between 2013 and 2016, the hospital offered over 50 health education seminars and participated in over 250 health

76 7
screening events in which staff conducted screenings for blood pressure, glucose and cholesterol—all controllable risk factors for heart disease and stroke. These activities allowed the hospital an opportunity to promote health awareness for heart disease and stroke, as well as improve knowledge in chronic disease and behavioral health management within faith based organizations and the community as a whole.
Project H.E.A.L.T.H. (Healing Effectively After Leaving the Hospital)The hospital addressed the needs of residents with asthma by developing and implementing a Community Health Worker (CHW) Program in 2013. The program was developed as an effort to improve patients’ health outcomes and reduce avoidable readmission among patients discharged from the hospital. The program, known as Project H.E.A.L.T.H, is a truly innovative and collaborative program offered to the community. The CHWs provide services that support effective healing and self-care including: wellness calls to patients post-discharge, assistance with scheduling follow-up appointment with physicians, educating patients regarding available community resources, and coaching patients on self–management of chronic disease. The program also helped connect patients to resources including but not limited to housing, transportation, disability application approval, medication refill and mental health counselling services.
The program generated positive patient feedback and is poised to support improved patient satisfaction and healing in and outside of the hospital. Since its inception, the program has enrolled 1,027 patients of which over 200 were patients with asthma. For the enrolled patients with asthma, the ED readmission rate dropped to 15% from 16.1%. Further, the inpatient asthma readmission rate dropped to 8.9%, an improvement from 11%. Each asthma patient was provided asthma management education by the CHW during each hospital or ED visit.
Advocate Physician Partners (APP) – Asthma Support Initiative The successful implementation and positive health outcome indicators derived from Project H.E.A.L.T.H served as a catalyst for Advocate Physician Partners to develop a robust asthma support program for outpatient clients using CHWs. The program covers the service areas of Trinity Hospital, Christ Medical Center and South Suburban Hospital. Advocate Physician Partners is a clinically integrated network and care management collaboration that brings 11 Physician-Hospital Organizations (PHOs) and 5,000 employed and independently practicing, aligned physicians together around a common set of quality metrics and clinical performance targets. The CHWs make home visits and follow up calls over the course of 6 months to provide personalized asthma education based on the plan outlined by their primary care provider.
Input from the Community for 2011-2013 CHNATrinity Hospital convened a CHC to oversee its CHNA conducted between 2011 and 2013. Members representing the community included three members from Trinity Hospital’s Governing CHC, local community health centers, community organizations, other nearby hospitals, community residents and a representative from the Chicago Department of Public Health. Following review of the data, analysis and a prioritization process, the hospital’s Governing CHC gave final approval for the CHNA and its implementation plans. The Community Health CHC represents leaders from the community. Of the 18 members, nine (50 percent) represented the community
After the CHNA was completed, it was posted on the hospital’s website for public comment. Subsequently, the CHNA’s progress has been posted on the hospital’s website each year for community information and comment. No comments have been received from the public regarding the 2011-2013 CHNA report or implementation plan.
Lessons LearnedAfter conducting the 2011-2013 CHNA and executing strategies from the implementation plan, the hospital learned that collaboration was a key aspect needed to adequately address community needs. In 2015, the hospital began participating in three community health collaborations within Cook County and the City of Chicago. One collaborative, the Health Impact Collaborative of Cook County (HICCC), is a project involving 26 hospitals, 7 health departments and nearly 100 community-based organizations. The goal of
77
this initiative is to work collaboratively on a CHNA and an implementation plan once priorities have been identified. The hospital also participated with the South Chicago Collective Impact collaborative which was a group of local health and community organizations that worked collaboratively to identify local health and community needs. A third collaborative, the Healthy Chicago Hospital Collaborative, also offered the hospital an opportunity to participate. The purpose of this collaborative was to collectively address three priorities that were identified during the 2011-2013 CHNA cycle—mental health, obesity and access to care.
Another lesson learned was the need to increase representation on the CHC by engaging additional community members. Representation on the hospital’s CHC is important to gaining the voice and input from members regarding the needs of the community. While there was a vehicle to communicate feedback from the community for the 2011-2013 CHNA, only health departments and other hospitals utilized the assessment. No feedback was received from community members and the CHNA was not reviewed by community members due to its’ online-only presence. The hospital’s plan is to take this lesson learned from this CHNA and apply it to the 2014-2015 CHNA by presenting the information to hospital community partners as well as sending out the report link to all CHC members to share with their circle of colleagues, friends and family.
IV. 2014-2016 Community Health Needs AssessmentDemographics of Defined CommunityIn 2016, the total population of Trinity Hospital’s Total Service Area (TSA) is an estimated 578,551, with a primary service area (PSA) population of 380,375 and a secondary service area (SSA) population of 198,176. Both primary (-2.27%) and secondary (-2.77%) service areas experienced a decline in population from 2010 to 2016.
Exhibit 1: Advocate Trinity Hospital Total Service Area
Source: Advocate Health Care Strategic Planning Department, 2016.

98 9
Race and EthnicityAs shown in Exhibits 2 and 3, the race and ethnicity distribution in the total service area is predominantly African American (83.0%) followed by the White population (10.0%). Approximately 9.0% of the population identifies as being of Hispanic or Latino ethnicity. The Hispanic population is primarily located in four specific community areas: Eastside, South Chicago, South Deering and Hegewisch. This racial and ethnic breakdown of Trinity Hospital’s total service area is substantially different than the Cook County and the State of Illinois.
Exhibit 2: Population by Race for Trinity Hospital Total Service Area, Cook County and Illinois 2016
Race TSA % Cook % Illinois %
White 57,359 10% 2,886,394 55% 9,058,485 70%
Black/African American 480,121 83% 1,239,297 24% 1,840,394 14%
Am Indian/Alaskan Native 1,942 0% 22,077 0% 46,012 0%
Asian 3,341 1% 370,745 7% 677,866 5%
Native Hawaiian/Pacific Islander
97 0% 1,656 0% 4,753 0%
Some Other Race 23,943 4% 589,973 11% 930,499 7%
2+ Races 11,748 2% 147,659 3% 327,862 3%
Total Population 578,551 5,257,801 12,885,871 Source: Healthy Communities Institute, Claritas, 2016.
Exhibit 3: Population by Hispanic/Latino Ethnicity for Trinity Hospital Total Service Area, Cook County and Illinois 2016
Ethnicity TSA % Cook % Illinois %
Hispanic/Latino 54,545 9% 1,331,792 25% 2,199,562 17%
Not Hispanic/Latino 524,006 91% 3,926,009 75% 10,686,309 83%
Source: Healthy Communities Institute, Claritas, 2016.
AgeExhibit 4 provides the age distribution in the total service area. At least half of the adult population is between the ages of 25-64. The median age of the population in Trinity Hospital’s PSA is 38.6. The population in the secondary service area is younger, with a median age of 33.3 years.
There has been a slight increase in the 65+ population across the Trinity Hospital service area. Data shows the Trinity PSA has a higher percentage of seniors 65 and older—17%—compared to the secondary service area with 12%. The communities within Trinity Hospital’s PSA with the highest percentage of population age 65+ include: South Shore, South Chicago, Morgan Park, Roseland, Auburn Gresham, Greater Grand Crossing and Woodlawn. The aging “baby-boomer” population presents challenges to healthcare to ensure that infrastructure can support the needs of the aging population; enabling them to live healthy and independent lives. According to 2010 data from the Chicago Department of Public Health, the proportion of the population age 65+ reporting “Fair or Poor Health Status” equaled 29.0%, compared to only 12% of those age 18-29 (Healthy Communities Institute, Claritas, 2016).

99
Exhibit 4: Trinity Hospital Total Service Area Population by Age 2016
Source: Healthy Communities Institute, Claritas, 2016.
GenderIn both the hospital’s primary and secondary service areas, males represent approximately 48% and females 51% of the population. A less pronounced gender difference is observed in Cook County. (See Exhibit 5.)
Exhibit 5: Population by Gender for Trinity Hospital PSA, SSA, and Cook County 2016
Trinity PSA Trinity SSA Cook County
Male 172,183 (45.27%) 90,985 (45.91%) 2,553,990 (48.58%)
Female 208,192 (54.73%) 107,191 (54.09%) 2,703,811 (51.42%)
Source: Healthy Communities Institute, Claritas, 2016.
EducationIn the PSA, 10.47% of the population and 13.62% of the SSA population have some high school but no diploma. This percentage is higher in comparison to the Illinois rate of 6.75% and the county rate of 7.44%; however, when “less than 9th grade” and “some high school” are added together, the differences between the PSA and the county and state narrow. Twenty-nine percent of the PSA population has a high school diploma and 28% has taken some college classes. Only 12.18% of the PSA and 9.16% of the SSA residents have a bachelor’s degree compared to the 20.99% of Cook County residents with such a degree.

1110 11
Exhibit 6: Educational Attainment Age 25+ for the Trinity Hospital PSA, SSA, Cook County and Illinois Populations 2016
PSA SSA Cook IL
Less than 9th Grade 5.32% 5.34% 7.55% 5.55%
Some High School, No Diploma 10.47% 13.62% 7.44% 6.75%
High School Grad 28.50% 30.69% 24.36 27.09%
Some College, No Degree 27.59% 27.72% 19.13% 21.17%
Associate Degree 7.87% 6.90% 6.41% 7.56%
Bachelor Degree 12.18% 9.16% 20.99% 19.69%
Master's Degree 6.46% 4.54% 9.94% 8.89%
Professional School Degree 0.92% 0.85% 2.79% 2.11%
Doctorate Degree 0.71% 1.17% 1.39% 1.20%
Source: Healthy Communities Institute, Claritas, 2016.
Household IncomeThe median household income in Trinity Hospital’s PSA is $38,029 and $30,660 in the hospital’s secondary service area. Both are considerably lower amounts when compared to the Illinois median household income of $59,608 and the Cook County median household income of $56,747 (Healthy Communities Institute, Claritas, 2016). Examining race and income, the community health data reviewed shows that the African American population has one of the lowest median household incomes ($35,677 in the PSA and $27,830 in the SSA) in comparison to other races.
Exhibit 7: Trinity Hospital PSA and SSA Median Household Income (HH Inc.) by Race 2016
Source: Healthy Communities Institute, Claritas, 2016.
1111
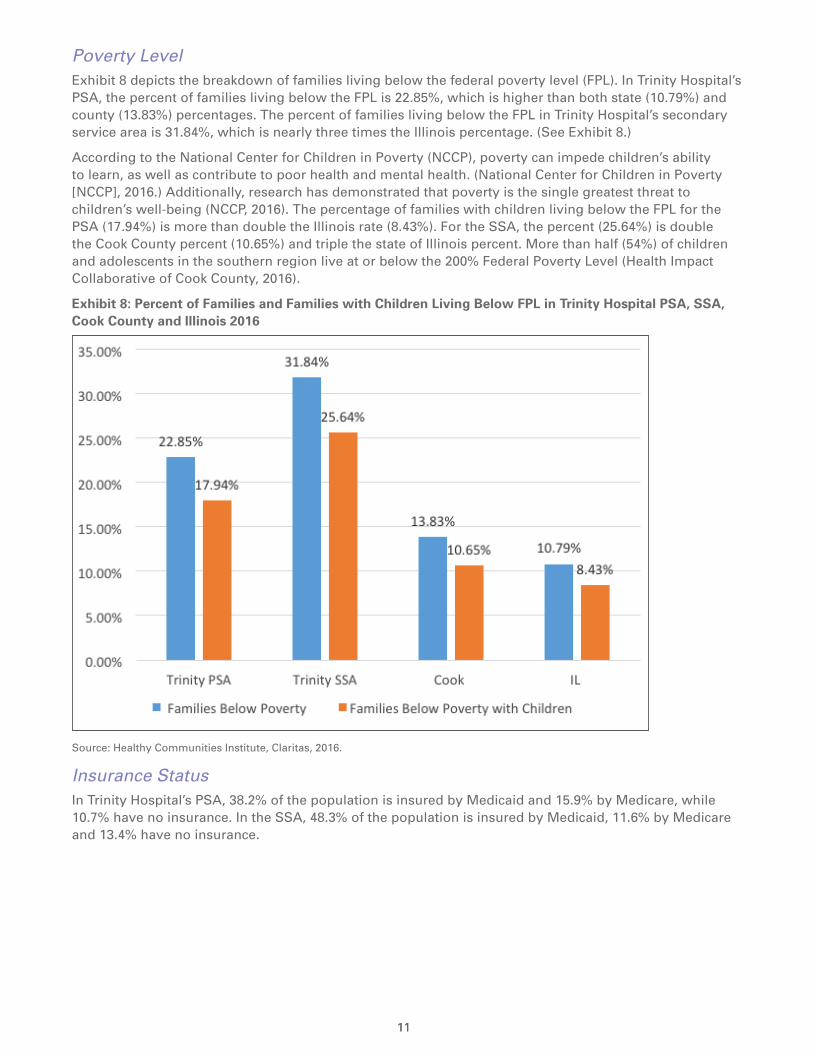
Poverty LevelExhibit 8 depicts the breakdown of families living below the federal poverty level (FPL). In Trinity Hospital’s PSA, the percent of families living below the FPL is 22.85%, which is higher than both state (10.79%) and county (13.83%) percentages. The percent of families living below the FPL in Trinity Hospital’s secondary service area is 31.84%, which is nearly three times the Illinois percentage. (See Exhibit 8.)
According to the National Center for Children in Poverty (NCCP), poverty can impede children’s ability to learn, as well as contribute to poor health and mental health. (National Center for Children in Poverty [NCCP], 2016.) Additionally, research has demonstrated that poverty is the single greatest threat to children’s well-being (NCCP, 2016). The percentage of families with children living below the FPL for the PSA (17.94%) is more than double the Illinois rate (8.43%). For the SSA, the percent (25.64%) is double the Cook County percent (10.65%) and triple the state of Illinois percent. More than half (54%) of children and adolescents in the southern region live at or below the 200% Federal Poverty Level (Health Impact Collaborative of Cook County, 2016).
Exhibit 8: Percent of Families and Families with Children Living Below FPL in Trinity Hospital PSA, SSA, Cook County and Illinois 2016
Source: Healthy Communities Institute, Claritas, 2016.
Insurance StatusIn Trinity Hospital’s PSA, 38.2% of the population is insured by Medicaid and 15.9% by Medicare, while 10.7% have no insurance. In the SSA, 48.3% of the population is insured by Medicaid, 11.6% by Medicare and 13.4% have no insurance.

1312 13
Exhibit 9: Percent of Population with Public Insurance and No Insurance in Trinity Hospital PSA, SSA, Cook County and Illinois 2016
Source: Truven Data Estimates, 2016.
SocioNeeds IndexTo clearly illustrate the disparity of income and other socioeconomic factors that exist within Trinity Hospital’s primary and secondary service areas, it is useful to examine how the SocioNeeds index varies across zip codes. Created by the Healthy Communities Institute, the SocioNeeds Index is a measure of socioeconomic need that is correlated with poor health outcomes. Indicators for the index are weighted to maximize the correlation of the index with premature death rates and preventable hospitalization rates. This index combines multiple socioeconomic indicators (which range from poverty to education) into a single composite value. As a single indicator, the index can serve as a concise way to explain which areas are of highest need. The scores can range from 1 to 100. A score of 100 represents the highest socioeconomic need. The ranking of 1-5 is a comparison of each zip code to all others within the PSA; a 5 represents areas of highest socioeconomic need in comparison to others in the specific geographic area under consideration. Exhibit 10 maps the SocioNeeds Index for zip codes by rank within the PSA.

1313
Exhibit 10: SocioNeeds Index Map for the Trinity Hospital PSA 2016
Source: Healthy Communities Institute, 2016.
Exhibit 11 showing the actual index values for zip codes in the hospital’s PSA and SSA documents the overall high needs of all the communities in the service area. In the PSA, five out of six zip codes have a value above 90, validating the high levels of social and economic need in these communities. In this case, the ranking does not provide much useful information because the index values fall in such a narrow range. For the SSA, four zip codes including Englewood, Ogden Park, Jackson Park and Riverdale, all have values above 96, affirming the significant socioeconomic barriers in these communities.

14 15
Exhibit 11: SocioNeeds Index Values and Rankings for Trinity Hospital PSA and SSA 2016
Primary Service Area Secondary Service Area
Community Areas
Zip Code
Index Rank Pop. Community
Areas Zip
CodeIndex Rank Pop.
Auburn Gresham
60620 95.3 5 70,876 Englewood 60621 99.8 5 33,936
South Chicago 60617 94.7 4 82,401 Ogden Park 60636 99.2 5 38,852
Roseland 60628 94.6 4 69,727 Jackson Park 60637 97 4 48,494
South Shore 60649 93.9 3 46,292 Riverdale 60827 96.2 3 27,767
Grand Crossing
60619 91.9 2 61,816 Calumet City 60409 88 2 36,212
Morgan Park 60643 53.1 1 49,263 Hegewisch 60633 85 1 12,915
Source: Healthy Communities Institute, 2016.
Key Roles in the AssessmentSystem and Hospital Leadership In 2014, Advocate Health Care began organizing resources to implement the 2014-2016 CHNA cycle. The system signed a three-year contract with the Healthy Communities Institute (HCI), now a Xerox Company, to provide an internet-based data resource for their eleven hospitals during the 2014-2016 CHNA cycle. This robust platform offered the hospitals 171 health and demographic indicators including thirty-one (31) hospitalization and emergency department (ED) visit indicators at the service area and zip code levels. In addition, system leaders collaborated with the Strategic Planning Department to create sets of demographic, mortality and utilization data for each hospital site. This collaboration with strategic planning continued during the three-year cycle ensuring that each hospital site had detailed inpatient, outpatient and emergency department data for its site.
By the end of 2014, a new Department of Community Health was established under Mission and Spiritual Care, a vice-president named to lead the department, and a plan developed to ensure that each hospital in the system would have a community health expert to coordinate its community health work. In the South region which includes Advocate Trinity Hospital, a master’s prepared community health director (previously the Director of Community Health at Trinity Hospital) was hired to oversee the activities of Trinity, Christ and South Suburban Hospitals. Additionally, a Manager and Coordinator of Community Health were hired at Trinity Hospital in August 2015. These community health personnel are responsible for coordinating and promoting the hospital’s involvement in policies, programs and services to improve the overall health status of the communities Trinity Hospital serves. The community health needs assessment process, the convening of the CHC and the co-administering of the hospitals’ community benefits reporting process are all responsibilities of the Manager of Community Health, with oversight from the Regional Director of Community Health.
Community Health Council (CHC)During the last quarter of 2015, Trinity Hospital launched its CHC, which had been convened in 2011 to oversee the hospital’s previous CHNA. The CHC was chaired by one of Trinity Hospital’s governing CHC members and co-chaired by a community leader. The CHC was comprised of representatives from community based organizations (CBOs), members of Trinity Hospital’s Governing Council, faith leaders, social service agencies and Federally Qualified Health Centers. Of the 22 members, 11 members (50%) represent the community, 5 (23%) represent the hospital’s Governing Council and 6 (27%) represent hospital leaders. Emphasis was placed on recruiting CHC members that represented minority and/or underserved populations within the hospital’s surrounding community. The CHC provided Trinity Hospital with the opportunity to gather valuable input from community members and the organizations providing services to the community. The hospital’s Community Health CHC members attended five CHNA meetings hosted at a Trinity site. A kick-off meeting was conducted in the last quarter of 2015 to update the CHC members on strategies from the preceding CHNA and the process for the current CHNA. In 2016, the CHC met four times between January and November. The CHC members were instrumental in both the
15
development of the CHNA process and the implementation plan. They played a crucial role in data review and identifying the health priorities set forth. The titles and organizations of current members of Trinity Hospital’s CHC follow.
2016 Trinity Hospital Community Health Council Members
• A-Design Studio, Owner; Trinity Hospital Governing Council Member
• Calumet Height Homeowners Association, Community Member (Community Health Council Co-Chair)
• Chicago Family Health Center, Assistant CEO
• Claretian Associates, Program Director
• Community Member
• Community Member
• Community Member
• Community Resident; Trinity Hospital Governing Council Member
• Community Resident; Trinity Hospital Governing Council Member (Community Health Council Chair)
• Metropolitan Family Services, Program Supervisor
• Retired Chicago Public Schools Educator, Community Representative
• Roseland Community Member, Deacon
• The Washington Group, Owner; Trinity Hospital Governing Council Member
• Trinity United Church of Christ, Parish Nurse
• Wimp Corporation, Chief Executive Officer; Trinity Hospital Governing Council Member
• Advocate Health Care, South Regional Director, Community Health
• Advocate Trinity Hospital, Coordinator, Community Health
• Advocate Trinity Hospital, Manager, Community Health
• Advocate Trinity Hospital, President
• Advocate Trinity Hospital, Staff Chaplain, Mission and Spiritual Care
• Advocate Trinity Hospital, Vice President, Mission and Spiritual Care
Governing CouncilThe principal roles of each Governing Council member are: 1) to support hospital leadership in their pursuit of the hospital’s goals; and 2) to represent the community’s interests to the hospital and to serve as an ambassador in the community. The role of the Governing Council for the Community Health Needs Assessment, specifically, is to review and approve the recommendations of the CHC. In addition, five Governing Council members serve on the CHC and one co-chairs the CHC. The Governing Council also represents leadership from both the hospital and the community.
Health Impact Collaborative of Cook CountyIn 2015, Advocate Health Care and its five hospitals principally serving Cook County (including Advocate Trinity Hospital) contributed financially and with in-kind resources to the formation and development of the Health Impact Collaborative of Cook County, a project involving 26 hospitals, 7 health departments and nearly 100 community-based organizations. The goal of this initiative is to work collaboratively on a county-wide CHNA and implementation plan once priorities have been identified. The Illinois Public Health Institute (IPHI) served as the backbone organization for the collaborative including coordinating the data collection and report preparation activities.
Given the size and diversity of Cook County (second largest county in the United States), the collaborative created three regions--North, Central and South—for purposes of organizing the assessment process. Advocate Trinity Hospital was appropriately assigned to the South region consisting of both the south side of Chicago as well as southern suburbs of Chicago. As will be described in more detail in the accompanying report—Health Impact Collaborative of Cook County: Community Health Needs

16 17
Assessment, South Region—a regional leadership team was formed including representatives from the hospitals and health departments in the region. A regional stakeholder group was also organized including members of community organizations representing various sectors. From February 2015 through June 2016, the collaborative completed an extensive community health assessment process within each of the three regions using the public health process—MAPP—Mobilizing for Action through Partnerships and Planning. More details regarding the data collection and prioritization process will be presented later in this report.
Methodology The CHNA utilized a mixed methods approach which included the collection and review of secondary data from existing sources and primary data from both qualitative (survey) and quantitative methods (focus groups). The methodology for the CHNA had three components: 1) the MAPP process used by the Health Impact Collaborative of Cook County (2/2015-6/2016); 2) use of the Healthy Communities Institute platform to review county, service area and zip code data (3/2014-8/2016); and 3) review of other available national and local data (1/2016-8/2016).
Health Impact Collaborative of Cook CountyMAPP ProcessThe Health Impact Collaborative of Cook County (HICCC) conducted a collaborative CHNA between February 2015 and June 2016. The Illinois Public Health Institute (IPHI) designed and facilitated a collaborative, community-engaged assessment based on the Mobilizing for Action through Planning and Partnerships (MAPP) framework. MAPP is a community-driven strategic planning framework that was developed by the National Association for County and City Health Officials (NACCHO) and the Centers for Disease Control and Prevention (CDC). Both the Chicago and Cook County Departments of Public Health use the MAPP framework for community health assessment and planning. The MAPP framework promotes a system focus, emphasizing the importance of community engagement, partnership development and the dynamic interplay of factors and forces within the public health system. The Health Impact Collaborative of Cook County chose this inclusive, community-driven process so that the assessment and identification of priority health issues would be informed by the direct participation of stakeholders and community residents. The MAPP framework emphasizes partnerships and collaboration to underscore the critical importance of shared resources and responsibility to make the vision for a healthy future a reality.
17
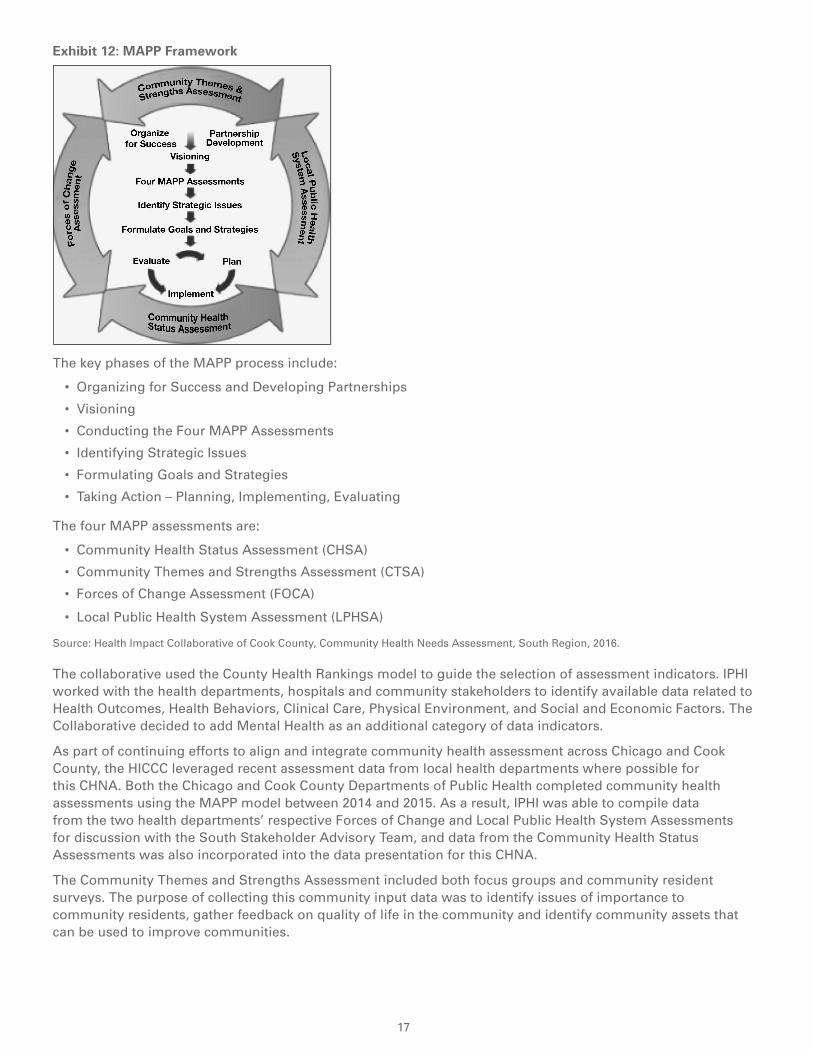
Exhibit 12: MAPP Framework
The key phases of the MAPP process include:
• Organizing for Success and Developing Partnerships
• Visioning
• Conducting the Four MAPP Assessments
• Identifying Strategic Issues
• Formulating Goals and Strategies
• Taking Action – Planning, Implementing, Evaluating
The four MAPP assessments are:
• Community Health Status Assessment (CHSA)
• Community Themes and Strengths Assessment (CTSA)
• Forces of Change Assessment (FOCA)
• Local Public Health System Assessment (LPHSA)
Source: Health Impact Collaborative of Cook County, Community Health Needs Assessment, South Region, 2016.
The collaborative used the County Health Rankings model to guide the selection of assessment indicators. IPHI worked with the health departments, hospitals and community stakeholders to identify available data related to Health Outcomes, Health Behaviors, Clinical Care, Physical Environment, and Social and Economic Factors. The Collaborative decided to add Mental Health as an additional category of data indicators.
As part of continuing efforts to align and integrate community health assessment across Chicago and Cook County, the HICCC leveraged recent assessment data from local health departments where possible for this CHNA. Both the Chicago and Cook County Departments of Public Health completed community health assessments using the MAPP model between 2014 and 2015. As a result, IPHI was able to compile data from the two health departments’ respective Forces of Change and Local Public Health System Assessments for discussion with the South Stakeholder Advisory Team, and data from the Community Health Status Assessments was also incorporated into the data presentation for this CHNA.
The Community Themes and Strengths Assessment included both focus groups and community resident surveys. The purpose of collecting this community input data was to identify issues of importance to community residents, gather feedback on quality of life in the community and identify community assets that can be used to improve communities.

18 19
Community Survey By leveraging its partners and networks, the HICCC collected approximately 5,200 resident surveys between October 2015 and January 2016, including 2,288 in the South region. The survey was available on paper and online and was disseminated in five languages—English, Spanish, Polish, Korean and Arabic.1 The majority of the responses were paper-based (about 75%) and about a quarter were submitted online.
\
The community resident survey was a convenience sample survey, distributed by hospitals and community-based organizations through targeted outreach to diverse communities in Chicago and Cook County, with a particular interest in reaching low income communities and diverse racial and ethnic groups to hear their input into this Community Health Needs Assessment. The community resident survey was intended to complement existing community health surveys that are conducted by local health departments for their IPLAN community health assessment processes. IPHI reviewed approximately 12 existing surveys to identify possible questions, and worked iteratively with hospitals, health departments, and stakeholders from the 3 regions to hone in on the most important survey questions. IPHI consulted with the UIC Survey Research Laboratory to refine the survey design. The data from paper surveys was entered into the online Survey Monkey system so that electronic and paper survey data could be analyzed together. Survey data analysis was conducted using SAS statistical analysis software, and Microsoft Excel was used to create survey data tables and charts.
The majority of survey respondents from the South region identified as heterosexual (91%, n=2146) and African American/black (57%, n=2146). Twenty-seven percent (27%) of survey respondents identified as white, 2% Asian/Pacific Islander, and 2% Native American/American Indian. Approximately 25% (n=1651) of survey respondents in the South region identified as Hispanic/Latino and approximately 10% identified as Middle Eastern (n=1651).1 Two-percent of survey respondents from the South region indicated that they were living in a shelter and 1% indicated that they were homeless (n=2257). The South region had the highest percentage of individuals with less than a high school education (12%, n=2027) compared to the North and Central regions of Cook County, and the majority of respondents from the South region (68%, n=1824) reported an annual household income of less than $40,000.
Focus Groups in South RegionIPHI conducted eight focus groups in the South region between October 2015 and March 2016. The collaborative ensured that the focus groups included populations who are typically underrepresented in community health assessments, including racial and ethno-cultural groups, immigrants, limited English speakers, low-income communities, families with children, LGBQIA and transgender individuals and service providers, individuals with disabilities and their family members, individuals with mental health issues, formerly incarcerated individuals, veterans, seniors, and young adults.
1 Race and ethnicity categories do not add to 100% because a few paper-based surveys included write-in responses and because 163 surveys that were conducted with Arab American Family Services included an additional race option of “Arab.”
19
The main goals of the focus groups were to:
1. Understand needs, assets, and potential resources in the different communities of Chicago and suburban Cook County.
2. Start to gather ideas about how hospitals can partner with communities to improve health.
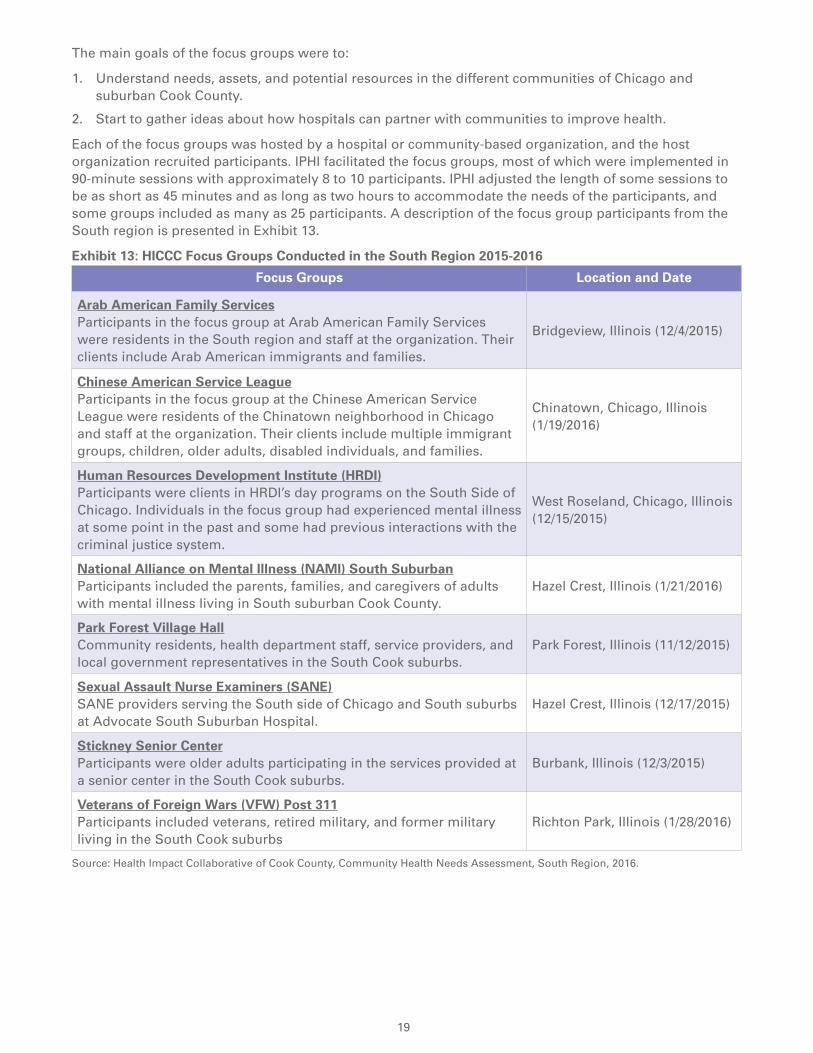
Each of the focus groups was hosted by a hospital or community-based organization, and the host organization recruited participants. IPHI facilitated the focus groups, most of which were implemented in 90-minute sessions with approximately 8 to 10 participants. IPHI adjusted the length of some sessions to be as short as 45 minutes and as long as two hours to accommodate the needs of the participants, and some groups included as many as 25 participants. A description of the focus group participants from the South region is presented in Exhibit 13.
Exhibit 13: HICCC Focus Groups Conducted in the South Region 2015-2016
Focus Groups Location and Date
Arab American Family Services Participants in the focus group at Arab American Family Services were residents in the South region and staff at the organization. Their clients include Arab American immigrants and families.
Bridgeview, Illinois (12/4/2015)
Chinese American Service League Participants in the focus group at the Chinese American Service League were residents of the Chinatown neighborhood in Chicago and staff at the organization. Their clients include multiple immigrant groups, children, older adults, disabled individuals, and families.
Chinatown, Chicago, Illinois (1/19/2016)
Human Resources Development Institute (HRDI) Participants were clients in HRDI’s day programs on the South Side of Chicago. Individuals in the focus group had experienced mental illness at some point in the past and some had previous interactions with the criminal justice system.
West Roseland, Chicago, Illinois (12/15/2015)
National Alliance on Mental Illness (NAMI) South Suburban Participants included the parents, families, and caregivers of adults with mental illness living in South suburban Cook County.
Hazel Crest, Illinois (1/21/2016)
Park Forest Village Hall Community residents, health department staff, service providers, and local government representatives in the South Cook suburbs.
Park Forest, Illinois (11/12/2015)
Sexual Assault Nurse Examiners (SANE) SANE providers serving the South side of Chicago and South suburbs at Advocate South Suburban Hospital.
Hazel Crest, Illinois (12/17/2015)
Stickney Senior Center Participants were older adults participating in the services provided at a senior center in the South Cook suburbs.
Burbank, Illinois (12/3/2015)
Veterans of Foreign Wars (VFW) Post 311 Participants included veterans, retired military, and former military living in the South Cook suburbs
Richton Park, Illinois (1/28/2016)
Source: Health Impact Collaborative of Cook County, Community Health Needs Assessment, South Region, 2016.
20 21
There were residents from the South region that participated in focus groups that were conducted in other regions. A focus group in the Austin community area (in the Central region) that was conducted with formerly incarcerated individuals and hosted by the National Alliance for the Empowerment of the Formerly Incarcerated included participants who were residents in the South region. A focus group in the Lakeview community area (in the North region) that was conducted with LGBQIA and transgender individuals and hosted by Howard Brown Health Center also included several participants who were residents in the South region.
More detail on the findings of the MAPP Assessments can be found in the companion document to the Trinity Hospital CHNA report—Health Impact Collaborative of Cook County, Community Health Needs Assessment, South Region—that is also posted on the Advocate website and at www.healthimpactcc.org/reports2016.
Use of Healthy Communities Institute (HCI) Data PlatformSince early 2014, each hospital in the Advocate system has had access to the Healthy Communities Institute data platform, customized to the system through providing access to data for the counties, service areas and zip codes served by the hospitals. This robust platform provided the hospitals with 171 indicators at the county level, including a variety of demographic indicators, and thirty-one (31) hospitalization and emergency department (ED) visit indicators also at the service area and zip code levels. Utilizing the Illinois Hospital Association’s COMP data, HCI was able to summarize, age adjust and average the hospitalization and ED data for five time periods from 2009-2015. The HCI contract also provided a wealth of county and zip code data comparisons; cross tabulation of data by age, race, ethnicity and gender; a SocioNeeds Index visualizing vulnerable populations within service areas and counties; a Healthy People 2020 tracker; and a database of promising and evidence-based interventions.
One of the most important contributions of this resource has been the availability of hospitalization and emergency department use data at the zip code level, enabling more in-depth analysis of at-risk communities and the hospital’s service areas.
Review of Other Available National and Local DataBetween April 2016 and June 2016, Trinity Hospital staff collected pertinent community health data for the hospital’s PSA and SSA. Other data sources reviewed included the South Chicago Collective Impact Neighborhood Network, Illinois Department of Public Health, Chicago Department of Public Health, Trinity Hospital patient utilization data, City of Chicago-Healthy Chicago 2.0, Healthy People 2020, and the Centers for Disease Control and Prevention (state and county health data). A comprehensive list of data resources is provided in Appendix 1.
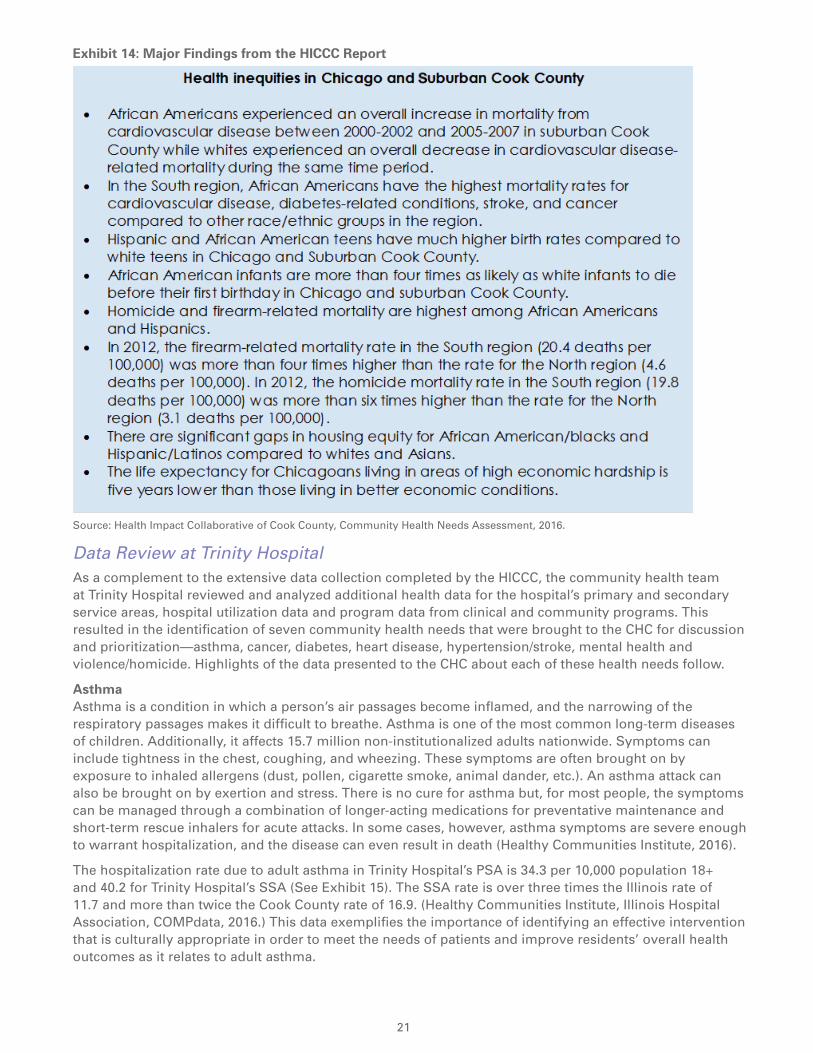
Summary of Results Health Impact Collaborative of Cook County, CHNA, South RegionParticipation by the hospital in the Health Impact Collaborative of Cook County (HICCC) resulted in access to a substantial amount of quantitative and qualitative data that is contained in the HICCC Community Health Needs Assessment, South Region report, a companion document to this CHNA. The report served as a foundational document to the assessment process at Trinity Hospital. Important findings from this collaborative project, including data from southern Cook County, are summarized in Exhibit 14.
21
Exhibit 14: Major Findings from the HICCC Report
Source: Health Impact Collaborative of Cook County, Community Health Needs Assessment, 2016.
Data Review at Trinity HospitalAs a complement to the extensive data collection completed by the HICCC, the community health team at Trinity Hospital reviewed and analyzed additional health data for the hospital’s primary and secondary service areas, hospital utilization data and program data from clinical and community programs. This resulted in the identification of seven community health needs that were brought to the CHC for discussion and prioritization—asthma, cancer, diabetes, heart disease, hypertension/stroke, mental health and violence/homicide. Highlights of the data presented to the CHC about each of these health needs follow.
AsthmaAsthma is a condition in which a person’s air passages become inflamed, and the narrowing of the respiratory passages makes it difficult to breathe. Asthma is one of the most common long-term diseases of children. Additionally, it affects 15.7 million non-institutionalized adults nationwide. Symptoms can include tightness in the chest, coughing, and wheezing. These symptoms are often brought on by exposure to inhaled allergens (dust, pollen, cigarette smoke, animal dander, etc.). An asthma attack can also be brought on by exertion and stress. There is no cure for asthma but, for most people, the symptoms can be managed through a combination of longer-acting medications for preventative maintenance and short-term rescue inhalers for acute attacks. In some cases, however, asthma symptoms are severe enough to warrant hospitalization, and the disease can even result in death (Healthy Communities Institute, 2016).
The hospitalization rate due to adult asthma in Trinity Hospital’s PSA is 34.3 per 10,000 population 18+ and 40.2 for Trinity Hospital’s SSA (See Exhibit 15). The SSA rate is over three times the Illinois rate of 11.7 and more than twice the Cook County rate of 16.9. (Healthy Communities Institute, Illinois Hospital Association, COMPdata, 2016.) This data exemplifies the importance of identifying an effective intervention that is culturally appropriate in order to meet the needs of patients and improve residents’ overall health outcomes as it relates to adult asthma.

22 23
Exhibit 15: Age–Adjusted Hospitalization Rates per 10,000 Population 18+ due to Adult Asthma in Trinity Hospital PSA and SSA 2013-2015
Source: Healthy Communities Institute, Illinois Hospital Association, COMPdata, 2016.
In Exhibit 16, both the PSA and SSA have higher age-adjusted emergency room (ER) visits due to adult asthma in 2013-2015 in comparison to both Cook County and the State of Illinois. The PSA rate for ER visits per 10,000 residents age 18+ is 148.1. In the SSA, the rate is 170.0, more than triple the rate for Illinois and double the Cook County rate of 64.3. Community areas with particularly high utilization rates include: South Chicago (124.0), Grand Crossing (166.4), Roseland (126.2), South Shore (211.9), Englewood (275.2), Riverdale (146.4) and Ogden Park (263.9). The data from 2009-2015 shows rates trending upward for asthma ER utilization for both the hospital’s PSA and SSA, as shown in Exhibit 17 and 18. (Healthy Communities Institute, Illinois Hospital Association, COMPdata, 2016.)
Exhibit 16: Age–Adjusted ER Rates due to Adult Asthma in Trinity Hospital PSA and SSA 2013-2015
Source: Healthy Communities Institute, Illinois Hospital Association, COMPdata, 2016.

23
Exhibit 17: Age–Adjusted ER Rate per 10,000 Population 18+ due to Adult Asthma in Trinity Hospital PSA 2009-2015
Source: Healthy Communities Institute, Illinois Hospital Association, COMPdata, 2016.
Exhibit 18: Age–Adjusted ER Rate per 10,000 Population 18+ due to Adult Asthma in Trinity Hospital SSA 2009-2015
Source: Healthy Communities Institute, Illinois Hospital Association, COMPdata, 2016.
DiabetesAccording to the American Diabetes Association, 29.1 million Americans (9.3%) have diabetes. Among the individuals with diabetes, 1.25 million have Type 1 diabetes. As of 2010, diabetes remained the 7th leading cause of death in the US as recorded by vital record statistics. Further, diabetes is listed on a total of 234,051 death certificates as an underlying or contributing cause of death (American Diabetes Association, 2016). The percentage of Americans age 65+ with both diagnosed and undiagnosed diabetes remains high at 25.9%, or 11.8 million seniors.
24 25
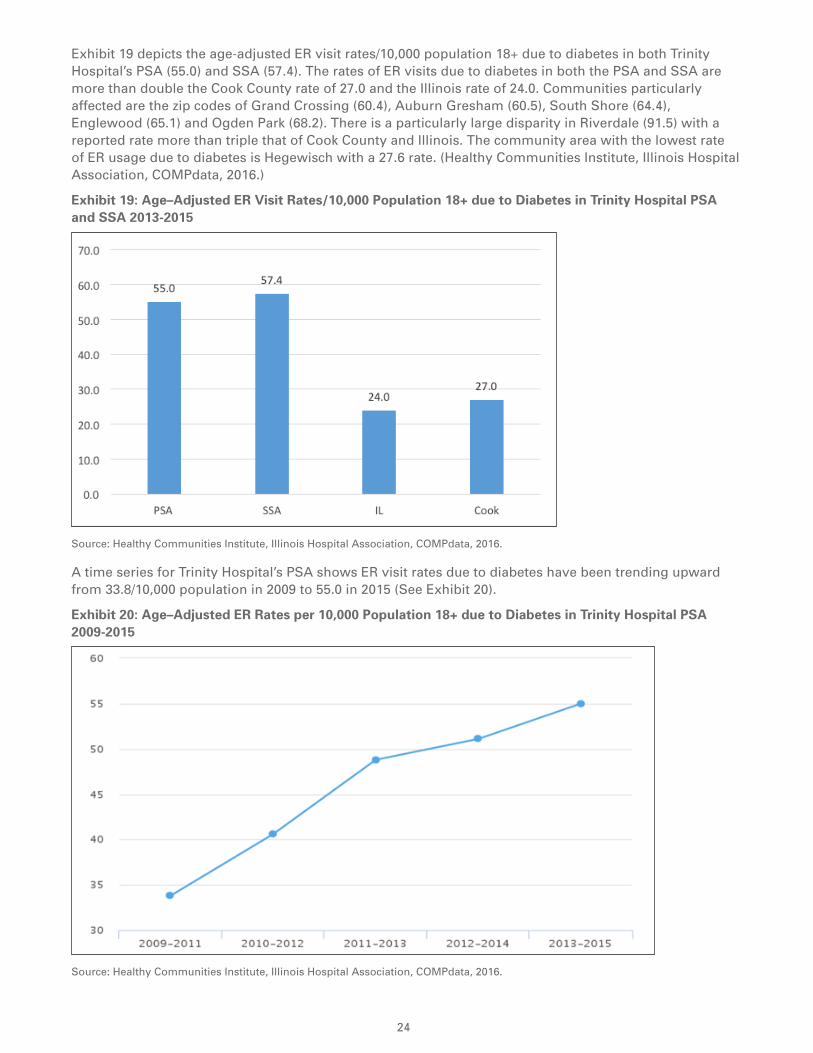
Exhibit 19 depicts the age-adjusted ER visit rates/10,000 population 18+ due to diabetes in both Trinity Hospital’s PSA (55.0) and SSA (57.4). The rates of ER visits due to diabetes in both the PSA and SSA are more than double the Cook County rate of 27.0 and the Illinois rate of 24.0. Communities particularly affected are the zip codes of Grand Crossing (60.4), Auburn Gresham (60.5), South Shore (64.4), Englewood (65.1) and Ogden Park (68.2). There is a particularly large disparity in Riverdale (91.5) with a reported rate more than triple that of Cook County and Illinois. The community area with the lowest rate of ER usage due to diabetes is Hegewisch with a 27.6 rate. (Healthy Communities Institute, Illinois Hospital Association, COMPdata, 2016.)
Exhibit 19: Age–Adjusted ER Visit Rates/10,000 Population 18+ due to Diabetes in Trinity Hospital PSA and SSA 2013-2015
Source: Healthy Communities Institute, Illinois Hospital Association, COMPdata, 2016.
A time series for Trinity Hospital’s PSA shows ER visit rates due to diabetes have been trending upward from 33.8/10,000 population in 2009 to 55.0 in 2015 (See Exhibit 20).
Exhibit 20: Age–Adjusted ER Rates per 10,000 Population 18+ due to Diabetes in Trinity Hospital PSA 2009-2015
Source: Healthy Communities Institute, Illinois Hospital Association, COMPdata, 2016.
25
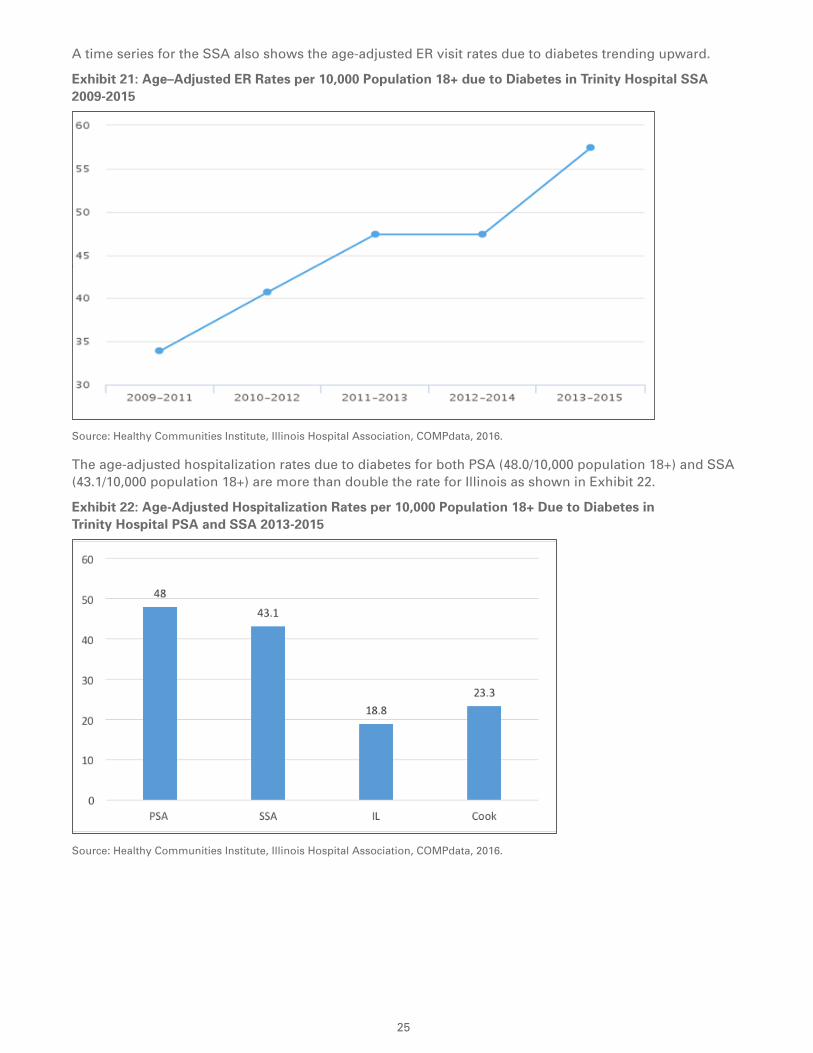
A time series for the SSA also shows the age-adjusted ER visit rates due to diabetes trending upward.
Exhibit 21: Age–Adjusted ER Rates per 10,000 Population 18+ due to Diabetes in Trinity Hospital SSA 2009-2015
Source: Healthy Communities Institute, Illinois Hospital Association, COMPdata, 2016.
The age-adjusted hospitalization rates due to diabetes for both PSA (48.0/10,000 population 18+) and SSA (43.1/10,000 population 18+) are more than double the rate for Illinois as shown in Exhibit 22.
Exhibit 22: Age-Adjusted Hospitalization Rates per 10,000 Population 18+ Due to Diabetes in Trinity Hospital PSA and SSA 2013-2015
Source: Healthy Communities Institute, Illinois Hospital Association, COMPdata, 2016.

26 27
Diabetes is a major risk factor for many serious health problems if not properly managed. Some of the long term health complications that result due to unmanaged diabetes include blindness, kidney disease, neuropathy, limb amputation and death (American Diabetes Association, 2016). Trinity Hospital’s PSA age-adjusted hospitalization rate (25.3 per 10,000 population) due to long term complications of diabetes is nearly double the Cook County rate of 13.5 per 10,000 population and more than double the Illinois rate of 10.1 per 10,000 population. The SSA has a rate of 22.2 per 10,000 population that is above the Cook County rate and more than double the Illinois rate (see Exhibit 23). (Healthy Communities Institute, Illinois Hospital Association, COMPdata, 2016.)
Exhibit 23: Age-Adjusted Long and Short-term Complications Due to Diabetes Per 10,000 Population in Trinity Hospital PSA and SSA, Cook County and Illinois 2013-2015
PSA SSA Cook IL
ER Rate due to Uncontrolled Diabetes 5 5.9 2.4 2.3
Hospitalization Rate due to Uncontrolled Diabetes 5.4 4.1 2.1 1.6
ER Rate due to Short-Term Complications of Diabetes 3.6 3.2 1.6 1.8
Hospitalization Rate due to Short-Term Complications of Diabetes
16.1 15.8 7.2 6.7
ER Rate due to Long-Term Complications of Diabetes 16.4 19.0 9.5 9.5
Hospitalization rate due to Long Term Complications of Diabetes
25.3 22.2 13.5 10.1
Source: Healthy Communities Institute, Illinois Hospital Association, COMPdata, 2016.
According to the 2008-2012 Illinois Department of Public Health (IDPH) age-adjusted diabetes related mortality rate per 100,000 population, some communities in Trinity’s TSA have rates that are higher than state and the city of Chicago. The highest mortality rates in Trinity Hospital’s PSA communities included: Calumet Heights (83); Auburn Gresham (81.6); and South Shore (94.2). The communities with the highest mortality due to diabetes in the SSA included: Riverdale (117.4); Englewood (103.7); West Englewood (93.3); and Woodlawn (97.3). Comparatively, the state rate is 63.2 per 100,000 and the city of Chicago rate is 68.5 per 100,000 population (Health Impact Collaborative of Cook County, Illinois Department of Public Health, Mortality Dataset, 2008-2012).
Cancer Cancer is the second leading cause of death in the United States. The National Cancer Institute (NCI) defines cancer as a term used to describe diseases in which abnormal cells divide without control and are able to invade other tissues. There are over 100 different types of cancer. According to the NCI, lung, colon and rectal, breast, pancreatic, and prostate cancer lead to the greatest number of annual deaths (Healthy Community Institute, 2016.) In 2016, an estimated 1,685,210 new cases of cancer will be diagnosed in the United States and 595,690 people will die from the disease (National Cancer Institute, 2016).
In the Trinity PSA for 2008-2012, the five-year average cancer incidence rate is 614 per 100,000 population, while for the SSA the rate is 524.4 per 100,000 compared to the state of Illinois rate of 511.2 per 100,000 and the Cook County rate of 487.3. The five-year average cancer incidence rate per 100,000 population is shown by type of cancer in Exhibit 24. Colorectal cancer (65.7), prostate cancer (100.1), invasive breast cancer (89.0), and lung & bronchus cancer (90.1) occurred at higher rates in Trinity Hospital’s PSA than in the state as a whole. Lower rates of leukemia & lymphoma, as well as nervous system cancers and urinary system cancer were noted in the hospital’s PSA.

27
Exhibit 24: 5-Year Average Cancer Incidence Rates per 100,000 Population by Cancer Type in Trinity Hospital PSA, SSA, Illinois and Cook County 2008-2012
IL Cook PSA SSA
Oral Cavity 12.8 12.3 13.6 14.6
Colorectal 49.6 49.4 65.7 57.9
Lung & Bronchus 72.8 65.6 90.1 83.8
Breast-invasive 73.5 72.2 89.0 68.3
Breast-in situ 19.1 19.2 24.1 16.0
Cervix 4.3 5.2 9.3 9.9
Prostate 68.4 67.6. 100.1 76.2
Urinary System 41.3 36.2 37.6 32.3
Nervous System 6.8 6.1 5.1 4.3
Leukemias & Lymphomas 37.2 34.5 31.1 27.0
All Other Cancers 147.6 120.7 148.2 134.0 Source: Illinois Department of Public Health, Illinois State Cancer Registry 2008-2012, Public Dataset as of March 2016.
Heart DiseaseChronic diseases such as cancer and heart disease affect the lives of millions of Americans and continue to be contributing factors to increasing health care costs. Heart disease is the leading cause of death for both men and women. More than half of the deaths due to heart disease in 2009 were in men. According to the Centers for Disease Control and Prevention (CDC), about 610,000 people (or 1 in every 4 deaths) die from heart disease every year in the US. Coronary heart disease is the most common type of heart disease, killing over 370,000 people annually (Centers for Disease Control, National Center for Health Statistics, 2015). Every year, approximately 785,000 Americans have a heart attack. Of these, 525,000 are a first heart attack and 210,000 happen in people who have already had a heart attack (Mozaffarian et al., 2015).
The mortality rate for coronary heart disease in Trinity Hospital’s service areas ranges from 193.1 to 330.7 compared to the Chicago rate of 217.3 per 100,000 population. A major disparity was observed in the hospital’s PSA community of Grand Crossing which registered a heart disease mortality rate of 300 per 100,000. Additionally, Trinity Hospital’s SSA community of Englewood has a rate of 330.7 per 100,000, which is almost triple the rate of heart disease mortality for the State of Illinois (112.1). (Health Impact Collaborative of Cook County, Illinois Department of Public Health, Mortality Dataset, 2008-2012.)
Heart failure is a condition in which the heart can’t pump enough blood to the body’s other organs. This can result from a variety of conditions including coronary artery disease, diabetes, past heart attack, hypertension, heart infections, diseases of the heart valves or muscle, and congenital heart defects. Because the heart is not able to work efficiently, blood backs up in the tissues causing edema or swelling. Edema can occur in the legs and ankles as well as in the lungs, where it causes shortness of breath, especially while lying down. According to the Centers for Disease Control and Prevention, approximately round 5.7 million people in the United States have heart failure, and about half of people who develop heart failure will die within five years of diagnosis. (Healthy Communities Institute, 2016.)
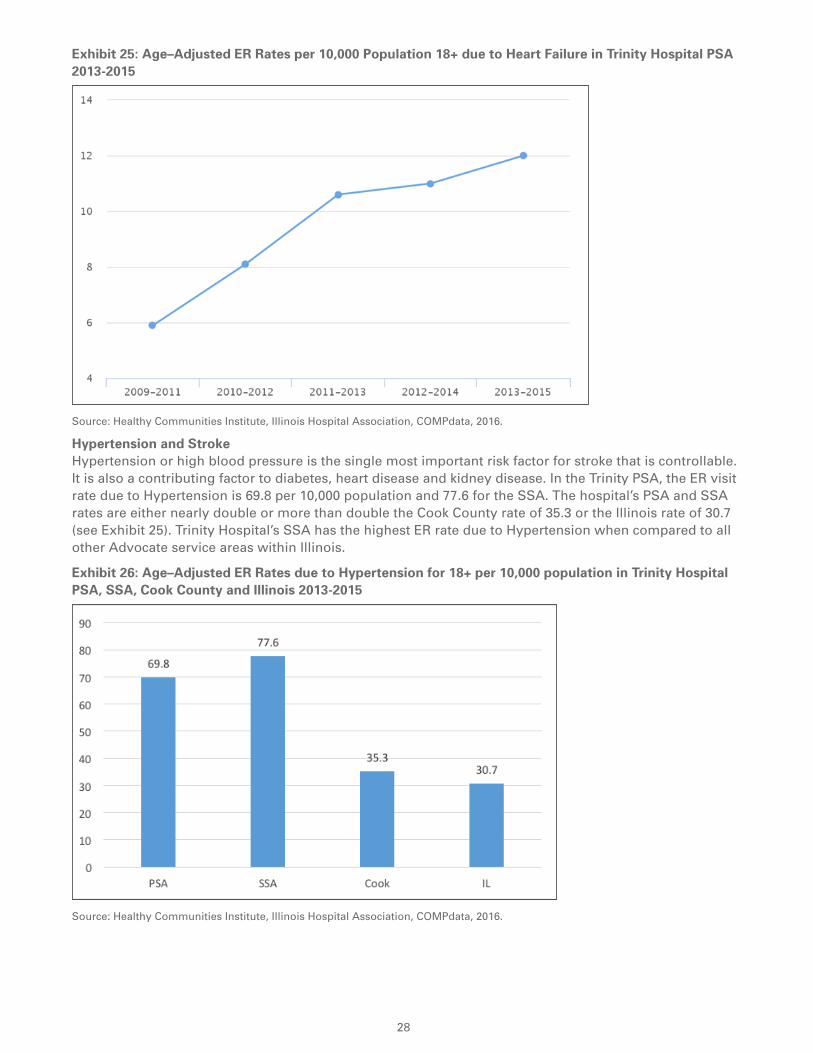
When compared with Cook County (6.1) and Illinois rates (8.1) for 2013-2015, both Trinity Hospital’s PSA (12.0) and SSA (15.8) have higher age–adjusted ER rates per 10,000 population due to Heart Failure. The review of the time series for the primary service area shows data trending upward from the rate of 5.9 per 10,000 in 2009-2011 to 12.0 per 10,000 in 2013-2015. See Exhibit 25. In 2013-2015, the hospitalization rate for heart failure for Trinity Hospital’s PSA was 76.5 per 10,000 population 18+ and 82.2 for the SSA—rates that are noticeably higher than the Cook County rate (43.1) and the Illinois rate (36.6). The service area rates are also high compared to most Illinois counties. Analysis of the time series data for the SSA shows that this rate had been decreasing but has increased again in the last few years from 81.2/10,000 in 2012-2014 to the 2013-2015 value of 82.2. The hospitalization rate for the PSA has continued to decline. (Healthy Communities Institute, Illinois Hospital Association, COMPdata, 2016.) While heart failure has no cure, lifestyle changes along with proper treatment can help people with the condition live longer and more active lives (National Institute of Health, 2015).
28 29
Exhibit 25: Age–Adjusted ER Rates per 10,000 Population 18+ due to Heart Failure in Trinity Hospital PSA 2013-2015
Source: Healthy Communities Institute, Illinois Hospital Association, COMPdata, 2016.
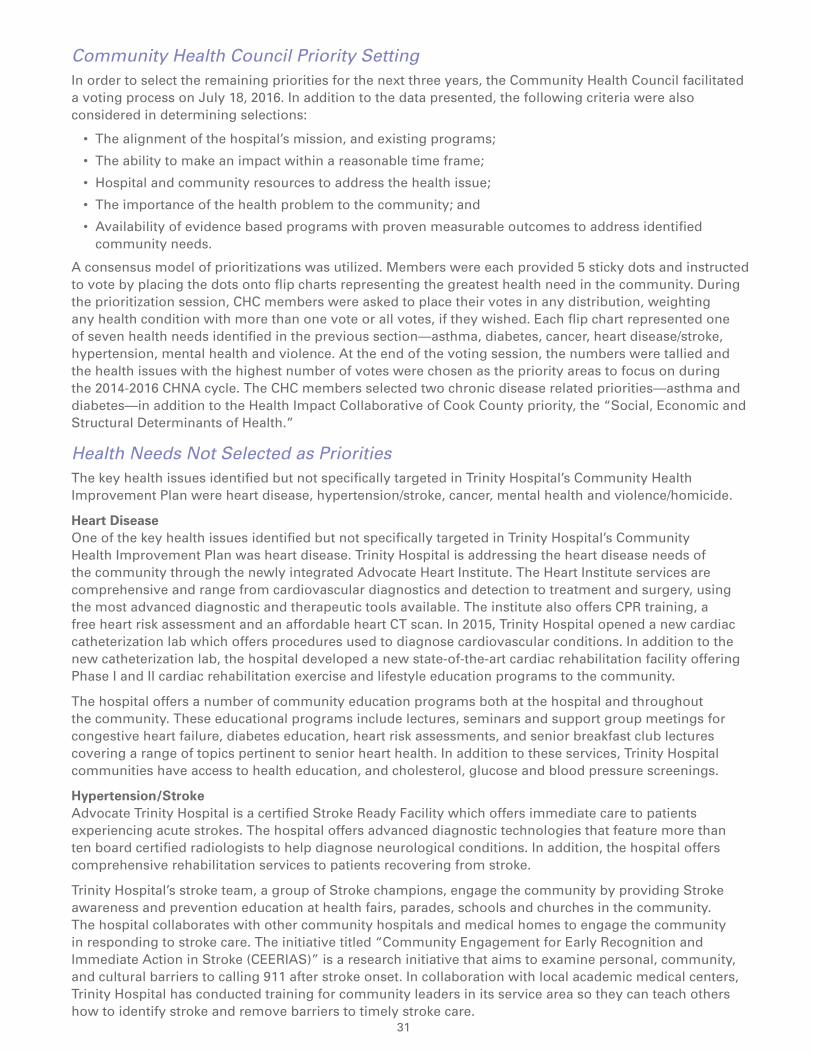
Hypertension and StrokeHypertension or high blood pressure is the single most important risk factor for stroke that is controllable. It is also a contributing factor to diabetes, heart disease and kidney disease. In the Trinity PSA, the ER visit rate due to Hypertension is 69.8 per 10,000 population and 77.6 for the SSA. The hospital’s PSA and SSA rates are either nearly double or more than double the Cook County rate of 35.3 or the Illinois rate of 30.7 (see Exhibit 25). Trinity Hospital’s SSA has the highest ER rate due to Hypertension when compared to all other Advocate service areas within Illinois.
Exhibit 26: Age–Adjusted ER Rates due to Hypertension for 18+ per 10,000 population in Trinity Hospital PSA, SSA, Cook County and Illinois 2013-2015
Source: Healthy Communities Institute, Illinois Hospital Association, COMPdata, 2016.

29
The stroke mortality rate in the South region was 40.1 deaths per 100,000 population in 2012. The Healthy People 2020 target is 34.8 per 100,000 population (Health Impact Collaborative of Cook County, Community Health Needs Assessment, South Region, 2016). Noticeable disparities are observed in the following communities within Trinity Hospital’s PSA with reported rates higher than the Chicago rate of 40.0 and Illinois rates of 39.5. These communities include Auburn Gresham 56.9; Greater Grand Crossing 58.9; and Roseland 52.1 per 100,000 population. For the secondary service area, Englewood at 63.9 has the highest mortality rate for stroke (Health Impact Collaborative of Cook County, Illinois Department of Public Health, Mortality Dataset, 2008-2012).
Mental Health Mental health continues to be a concern in the Trinity PSA and SSA, with an ER visit rate due to Mental Health per 10,000 population 18 and over of 127.9 for the PSA and 157 for the SSA, which are higher than both the Cook County and Illinois rates. (See Exhibit 26.) Higher ER visit rates are found in both the hospital’s primary and secondary service area communities. The communities especially impacted include Englewood (266.1); Ogden Park (199.5); South Shore (152.8); and Auburn Gresham (156.5). ER Rates due to Suicide/Self-Inflicted Injury per 10,000 population for the PSA and SSA were higher both for Cook County and Illinois.
Exhibit 27: Age–Adjusted ER Rate due to Mental Health and Suicide/Self-Inflicted Injury per 10,000 population 18+ in Trinity Hospital PSA and SSA 2013-2015
PSA SSA Cook IL
ER Rate due to Mental Health 127.9 157.0 89.8 93.1
ER Rate due to Suicide and Intentional Self-inflicted Injury
34.3 37.0 27.5 29.0
Source: Healthy Communities Institute, Illinois Hospital Association, COMPdata, 2016.
According to Healthy Chicago 2.0, people with serious mental illnesses are more likely to have one or more chronic medical conditions such as; obesity, hypertension, diabetes, heart disease, asthma, and kidney disease (Chicago Department of Public Health, Healthy Chicago 2.0, 2016). Mental health and substance use were identified as key issues in each of the four assessment processes in the HICCC south region of Cook County. Community mental health issues are exacerbated by long-standing inadequate funding, as well as recent cuts to social services, healthcare and public health. Focus group participants and survey respondents in the HICCC south region reported stigma, cost or lack of insurance, lack of knowledge about where to get services, and wait times for treatment as barriers to accessing needed mental health treatment. Survey respondents from the HICCC south region indicated financial strain and debt were the largest contributing factors to feelings of stress in their day-to-day lives. (Health Impact Collaborative of Cook County, Community Health Needs Assessment, South Region, 2016.)
Violence and HomicideThe south and central regions of the collaborative appear to be disproportionately affected by trauma, safety issues and community violence. Firearm-related and homicide mortality are highest among Hispanic/Latinos and African American/blacks in the South region. Police violence, gang activity, drug use/drug trafficking, intimate partner violence, child abuse and robbery were some of the safety concerns identified by residents in the south region. (Health Impact Collaborative of Cook County, Community Health Needs Assessment, South Region, 2016.)
According to 2008-2012 Illinois Department of Public Health data, homicide mortality rates for communities in Trinity’s PSA and SSA ranged from 3.7 to 81.7 per 100,000 population. This range is broad compared to the Illinois rate of 6.5 and Chicago rate of 14.8 per 100,000 population. Additional data review shows that mortality rates from firearm-related injuries for communities in the PSA and SSA ranged from 5.3-43.1 per 100,000 population as compared to the Illinois rate of 8.5 and Chicago rate of 13.7. Some of the communities largely affected by firearm-related injuries include: Auburn Gresham 35.3; Greater Grand Crossing 40.5; West Englewood 43.1 and South Chicago 33.5. Some of these communities have rates that are five times the Illinois rate and more than three times the Chicago rate. Disparities related to socioeconomic status, built environment, safety and violence, policies and structural racism were identified in the South region as being key drivers of community health and individual health outcomes (Health Impact Collaborative of Cook County, Illinois Department of Public Health, Mortality Dataset, 2008-2012).

30 31
The long-lasting effect of violence within the Trinity Hospital community is a concern that needs attention. According to Claretian Associates, a not-for-profit housing organization located in South Chicago, a survey conducted during the summer of 2015 indicated that 50% of respondents had witnessed a shooting; 33% had witnessed aggravated assault/battery; and 25% had witnessed a domestic violence incident.
Prioritization of Health NeedsHealth Impact Collaborative of Cook CountyThrough a data-driven collaborative prioritization process, the Health Impact Collaborative of Cook County (HICCC) identified four priority focus areas. (See Exhibit 27.) As the HICCC moves from assessment to planning, the partners are working together to determine the best infrastructure for implementing collaborative strategies related to the four focus areas. Addressing the social, economic and structural determinants of health has been identified as an overarching priority that will be an important focus for collaborative planning and implementation among all hospital participants. Thus, for Advocate Trinity Hospital, an initial priority for implementation is to address collaboratively one or more of the social, economic and structural determinants of health.
Exhibit 27: The Four Focus Areas for the Health Impact Collaborative of Cook County
1. Improving social, economic, and structural determinants of health/reducing social and economic inequities.*
2. Improving mental and behavioral health.
3. Preventing and reducing chronic disease (focus on risk factors–nutrition, physical activity, and tobacco).
4. Increasing access to care and community resources.
* All hospitals within the Collaborative will include the first focus area – Improving social, economic, and structural determinants of health – as a priority in their CHNA and implementation plan. Each hospital will also select at least one of the other focus areas as a priority.
* Policy, Advocacy, and Data Systems are strategies that should be applied across all priorities.
Key Community Health Needs for Each of the Collaborative Focus Areas:
Social, economic and structural determinants
of health
Mental health and substance abuse
(Behavioral health)
Chronic disease Access to care and community resources
• Economic inequities and poverty
• Education inequities
• Systemic racism
• Housing
• Healthy environment
• Safety and violence
• Overall access to services and funding
• Violence and trauma, and its ties to mental health
• Focus on risk factors – nutrition, physical activity, tobacco
• Healthy environment
• Cultural & linguistic competency/ humility
• Health literacy
• Access to healthcare and social services, particularly for uninsured and underinsured
• Navigating complex health care system and insurance
Source: Health Impact Collaborative of Cook County, 2016.
31
Community Health Council Priority SettingIn order to select the remaining priorities for the next three years, the Community Health Council facilitated a voting process on July 18, 2016. In addition to the data presented, the following criteria were also considered in determining selections:
• The alignment of the hospital’s mission, and existing programs;
• The ability to make an impact within a reasonable time frame;
• Hospital and community resources to address the health issue;
• The importance of the health problem to the community; and
• Availability of evidence based programs with proven measurable outcomes to address identified community needs.
A consensus model of prioritizations was utilized. Members were each provided 5 sticky dots and instructed to vote by placing the dots onto flip charts representing the greatest health need in the community. During the prioritization session, CHC members were asked to place their votes in any distribution, weighting any health condition with more than one vote or all votes, if they wished. Each flip chart represented one of seven health needs identified in the previous section—asthma, diabetes, cancer, heart disease/stroke, hypertension, mental health and violence. At the end of the voting session, the numbers were tallied and the health issues with the highest number of votes were chosen as the priority areas to focus on during the 2014-2016 CHNA cycle. The CHC members selected two chronic disease related priorities—asthma and diabetes—in addition to the Health Impact Collaborative of Cook County priority, the “Social, Economic and Structural Determinants of Health.”
Health Needs Not Selected as Priorities The key health issues identified but not specifically targeted in Trinity Hospital’s Community Health Improvement Plan were heart disease, hypertension/stroke, cancer, mental health and violence/homicide.
Heart DiseaseOne of the key health issues identified but not specifically targeted in Trinity Hospital’s Community Health Improvement Plan was heart disease. Trinity Hospital is addressing the heart disease needs of the community through the newly integrated Advocate Heart Institute. The Heart Institute services are comprehensive and range from cardiovascular diagnostics and detection to treatment and surgery, using the most advanced diagnostic and therapeutic tools available. The institute also offers CPR training, a free heart risk assessment and an affordable heart CT scan. In 2015, Trinity Hospital opened a new cardiac catheterization lab which offers procedures used to diagnose cardiovascular conditions. In addition to the new catheterization lab, the hospital developed a new state-of-the-art cardiac rehabilitation facility offering Phase I and II cardiac rehabilitation exercise and lifestyle education programs to the community.
The hospital offers a number of community education programs both at the hospital and throughout the community. These educational programs include lectures, seminars and support group meetings for congestive heart failure, diabetes education, heart risk assessments, and senior breakfast club lectures covering a range of topics pertinent to senior heart health. In addition to these services, Trinity Hospital communities have access to health education, and cholesterol, glucose and blood pressure screenings.
Hypertension/StrokeAdvocate Trinity Hospital is a certified Stroke Ready Facility which offers immediate care to patients experiencing acute strokes. The hospital offers advanced diagnostic technologies that feature more than ten board certified radiologists to help diagnose neurological conditions. In addition, the hospital offers comprehensive rehabilitation services to patients recovering from stroke.
Trinity Hospital’s stroke team, a group of Stroke champions, engage the community by providing Stroke awareness and prevention education at health fairs, parades, schools and churches in the community. The hospital collaborates with other community hospitals and medical homes to engage the community in responding to stroke care. The initiative titled “Community Engagement for Early Recognition and Immediate Action in Stroke (CEERIAS)” is a research initiative that aims to examine personal, community, and cultural barriers to calling 911 after stroke onset. In collaboration with local academic medical centers, Trinity Hospital has conducted training for community leaders in its service area so they can teach others how to identify stroke and remove barriers to timely stroke care.

32 33
Cancer Trinity Hospital’s Oncology Center programs are structured to facilitate a multidisciplinary environment that provides minimally invasive procedures and advanced surgical intervention to treat cancer. The Oncology Center includes advanced diagnostics, imaging services, interventional radiology and an infusion center. The hospital has a Cancer Committee to develop, approve and implement the strategic plans, goals and objectives of Trinity Hospital’s cancer programs and to provide oversight for ongoing programs and outreach services. The Cancer Committee ensures that community outreach plans reflect the cancer experience at Trinity Hospital and that the defined community needs are addressed.
Trinity Hospital’s oncology nurse navigator, in collaboration with the community health department, work to implement outreach services in the community. Outreach activities include community education for breast cancer prevention, prostate cancer prevention and other community health education such as healthy lifestyle education for cancer prevention. Additionally, Trinity Hospital is addressing the cancer care needs of the community through its recent grant initiative funded by the Susan B. Komen Foundation, a collaboration with Advocate Illinois Masonic Medical Center on the north side of the city. Both hospitals will address cultural barriers that lead to disparities in access and utilization of screening, counseling and testing for hereditary breast cancer utilizing a Community Health Worker (CHW) program. This joint effort will support expanded health education, cancer risk assessment and increase the capacity for community-based support and navigation.
Mental HealthAdvocate Trinity Hospital is a community hospital that does not have a psychiatric unit and does not provide ongoing treatment for mental health conditions and substance abuse. However, in order to meet the immediate needs of its Emergency Department (ED) patients and inpatients and provide for continuity of care, the hospital utilizes two major strategies. First, there is an on-site behavioral health clinician 8 hours a day who evaluates patients with mental health and substance abuse conditions, provides referrals to outpatient mental health providers, and completes transfers to inpatient psychiatric or detox facilities when appropriate. This clinician also serves as a consulting resource on patients with these conditions, provides education and training to hospital staff, and can offer guidance and education to patients, families and community representatives. Second, the hospital coordinates patient services through the Advocate Behavioral Health telemedicine hub at Advocate Christ Medical Center. Patients interact through telemedicine technology with specialized clinicians—psychiatrists, clinical psychologists and APNs—for medication management, risk assessment, competency determination, recommendations regarding level of care, and ongoing treatment while they are patients. Both the on-site and hub clinicians connect with patients’ primary care providers, when available, to promote continuity of care. In addition, the Community Health Department sponsors Mental Health First Aid trainings for congregations, community organizations and other health care organizations.
Violence and HomicideTrinity Hospital continually assesses whether additional prevention strategies are needed within the community and works in support of its partners to address community needs such as violence and homicide. Community partners specifically addressing these needs include the Claretian Associates and the Neighborhood Chicago Alternative Policing Strategy (CAPS), Chicago Police Department. Claretian Associates recently conducted a survey to better understand the range of exposure to violence potentially causing traumatic reactions. The survey results prompted the organization to embark on the journey to be a “Trauma Informed Community.” With Trinity Hospital in such close proximity to Claretian Associates, the hospital is planning to establish a partnership with them to deliver information to faith organizations within the hospital’s service area. The police department is working within the community to address these needs and Trinity Hospital partners with them to support their activities, such as the National Night Out event. The National Night Out event is designed to increase awareness about police and community partnerships or programs that educate communities regarding violence prevention, drug prevention, town watch, neighborhood watch and other anti-crime events.
Governing Council ApprovalTrinity Hospital’s Governing Council fully approved the 2014-2016 Community Health Needs Assessment Report including identified priorities for future action on November 22, 2016.
33
V. 2016 Implementation PlanningInitial strategy planning for the three priorities identified as part of the 2014-2016 CHNA has begun. In addition, plans are being finalized regarding how the results of the CHNA will be shared with the community.
AsthmaGoalTo reduce the incidence of uncontrolled asthma among adults in the Trinity Service Area.
Potential Strategies• Expand the Project HEALTH–Community Health Worker program to engage patients in their homes to
identify triggers and barriers to asthma management.
• Work with Claretian Associates, a neighborhood housing organization, to educate home owners regarding identifying and remediating asthma triggers in the home.
• Continue to work on reducing 30-day readmission of asthma patients.
DiabetesGoalReduce incidence of diabetes in communities within Trinity Hospital’s primary and secondary service areas.
Potential Strategies• Implement the National Diabetes Prevention Program (DPP), Prevent T2, in selected community areas in
partnership with community-based organizations and faith communities.
• Work to establish Trinity Hospital as a designated Centers for Disease Control diabetes prevention program approved site by collaborating with the Clinical Diabetes Education team.
• Increase community educational opportunities to support diabetes self-management skills.
Social, Economic and Structural Determinants of Health – Workforce DevelopmentGoalTrinity Hospital will collaborate with community organizations to recruit and train community members for community health worker and other entry and mid-level skill jobs for positions within health care.
Potential Strategies• Partner with local communities to train 15 Community Health Workers (CHW) over a period of 1 year.
• Provide practical experience opportunities (internships) for CHWs after completion of Community Based Organization (CBO) training programs.
• Develop a CHW curriculum that supports the community health worker roles within both health care and community settings.
• Continue to expand the relationship with Chicago Public Schools to increase the number of high school students participating in the health careers development program.
• Serve as an internship site for entry level health care positions by partnering with Lights of Zion Ministries in the Roseland Community.
• Serve as a hub for clinical education and workforce development for entry and mid-level health care positions for 200 community residents over the next three years.
34 35
VI. Vehicle for Community FeedbackWe welcome your feedback regarding the Community Health Needs Assessment (CHNA) Report. If you would like to comment on this report, please click on the link below to complete a CHNA feedback form. We will respond to your questions/comments within thirty days. Your comments will also be considered during our next CHNA assessment cycle. http://www.advocatehealth.com/chnareportfeedback
If you experience any issues with the link to our feedback form or have any other questions, please click below to send an email to us at: [email protected]
This report can be viewed online at Advocate Health Care’s CHNA Report webpage via the following link: http://www.advocatehealth.com/chnareports
Other CHNA Communication OpportunitiesA paper copy of this report may also be requested by contacting the hospital’s Community Health Department. In addition to the opportunity to provide feedback through the means described above, Advocate Trinity Hospital also plans to communicate the CHNA findings and preliminary implementation plans, as available, to the community through the following:
• Block Clubs – Presentation to various block clubs and community organizations during the first quarter of 2017.
• South Chicago Chamber of Commerce – Email notification that the CHNA Report has been completed with a link to the report will be sent in January 2017, with notification that the CHNA Implementation Plan is available for review occurring in late May, following website posting of the plan in mid-May 2017.
• South Chicago Neighborhood Health Impact Initiative – Presentation to organization during first quarter of 2017.
35
VII. Appendix: Sources for 2014-2016 CHNA(All data and website links were verified as of the date of Governing Council approval.)
Primary SourcesAdvocate Health Care Strategic Planning Department, Hospital Utilization, 2016.
Health Impact Collaborative of Cook County, Community Health Needs Assessment, South Region, 2015-2016 Surveys and Focus Groups.
Claretian Associates, Chicago, Illinois, South Chicago Residents Survey, 2015.
Secondary SourcesAdvocate Health Care Strategic Planning Department. Demographic and other health data by service areas and communities. Truven Data Estimates, 2016. Website unavailable to public.
American Diabetes Association (ADA), 2016, Statistics about Diabetes, information retrieved on August 26, 2016. http://www.diabetes.org/diabetes-basics/statistics/?loc=db-slabnav
Center for Disease Control and Prevention (CDC), 2015. National Center for Health Statistics. Heart Disease Fact. Information retrieved November 4, 2016. http://www.cdc.gov/heartdisease/facts.htm
CDC, NCHS, Underlying Cause of Death 1999-2013 on CDC WONDER Online Database, released 2015. Data are from the Multiple Cause of Death Files, 1999-2013, as compiled from data provided by the 57 vital statistics jurisdictions through the Vital Statistics Cooperative Program, accessed Feb. 3, 2015.
Chicago Department of Public Health (CDPH), 2016, Healthy Chicago 2.0 – Partnering to Improve Health Equity 2016-2020, information retrieved October 11, 2016. https://www.cityofchicago.org/content/dam/city/depts/cdph/CDPH/HC2.0Plan_3252016.pdf
Healthy Communities Institute (HCI), a Xerox Company, 2016, accessed via a contract with Advocate Health Care. Website unavailable to the public. The following data sources were accessed through the HCI portal:
American Community Survey, 2010-2014. http://factfinder.census.gov/faces/nav/jsf/pages/index.xhtml
Claritas, 2016. Website unavailable to public.
Illinois Hospital Association, COMPdata, 2009-2015. Data unavailable to public.
Health Impact Collaborative of Cook County (HICCC), 2016; Illinois Department of Public Health (IDPH), 2008-2012 Mortality Dataset.
Health Impact Collaborative of Cook County (HICCC), Community Health Needs Assessment, South Region, 2016. www.healthimpactcc.org/reports2016
Illinois Department of Public Health, Illinois State Cancer Registry, 2008-2012; and Mortality Files 2008-2012, Public Dataset as of March 2016.
Mozaffarian D, Benjamin EJ, Go AS, et al. Heart Disease and Stroke Statistics—2015 Update: a report from the American Heart Association. Circulation. 2015;131:e29-322.
National Heart, Lung and Blood Institute, National Institute of Health, information retrieved on November 11, 2016. http://www.nhlbi.nih.gov/health/health-topics/topics/hf
National Cancer Institute (NCI), National Institutes of Health, Cancer Statistics, information retrieved on November 11, 2016. https://www.cancer.gov/about-cancer/understanding/statistics
National Center for Children in Poverty (NCCP), 2016; Child Poverty, information retrieved on October 22, 2016. http://www.nccp.org/topics/childpoverty.html

12/16 MC 2346
2320 East 93rd Street Chicago, Illinois 60617
773.967.2000 advocatehealth.com/trin