Embed Size (px)
Citation preview

Page 49
Page 49
IndexI. Executive Summary
II. Health Assessments and Planning Initiatives
a. Upper Chesapeake Healthb. Healthy Harfordc. Health County Ranking d. Harford County Health
Department - State and Local Health Improvement Process
e. Obesity Task Forcef. Summary
III. Demographic and Economic Profile a. Location and Populationb. Agec. Diversityd. Educatione. Incomef. Housing and transportationg. Povertyh. Special Populationsi. Summary
IV. Health Outcomes a. Births and Infant Deathsb. Mortality (Chronic Disease)c. Mortality (Injuries)d. Summary
V. Health Behaviorsa. Tobaccob. Alcohol and Substance
Abusec. Obesityd. Summary
VI. Access to Carea. Health Insurance Coverageb. Availability of Preventive
Health Servicesc. Access to Medical and
Dental Cared. Access to Healthy Foode. Summary
VII. Public Health Resources
VIII. Conclusion
Appendix: Maps
Page 49
I. Executive Summary
The Harford County Community Health Needs Assessment is a reflective assessment of the health status of Harford County. Assessments are an important component of meeting local community health needs, and are used to inform decisions about public health strategies to improve the health, safety and environment for Harford County residents. This assessment builds on previous efforts to identify and quantify public health concerns. It is a collaborative process that reports health indicator statistics and community stakeholder input in order to identify and prioritize our community health needs, areas for health improvement, and resources that can be mobilized to improve community health.
The Community Health Needs Assessment describes the health status of Harford County residents, as individuals and as population groups, and provides population comparisons to residents of Maryland and to the nation as a whole. It also examines trends in health indicators of County residents over time, highlights racial and geographic disparities, and identifies areas of poverty and at-risk populations which will provide a basis for public health planning. Data in this assessment comes from a variety of National and State sources, including, but not limited to, the United States Census Bureau, Maryland State Health Improvement Plan, Maryland Vital Statistics, the Maryland Behavioral Risk Factor Surveillance Survey, the Injuries in Maryland report, national County Health Rankings, as well as local sources including the Healthy Harford Community Health Assessment Project (CHAP) survey, Harford County Community Services Point-in-Time Homeless Count, and information from the Obesity Task Force and Local Health Improvement Plan. The Community Health Assessment is part of an ongoing cooperative local effort in Harford County to identify public health problems and develop initiatives for addressing them. Data in this assessment will serve as a baseline to measure the success of cooperative strategies now being developed to improve the health of all Harford residents.
Harford is one of the fastest growing jurisdictions in Maryland, with a strong economy and a high proportion of families with incomes above the state average. At first glance certain social determinants of health: higher than average high school graduation rate, low unemployment, and low percentage of uninsured, suggest a relatively healthy population. However, there are areas where there is room for improvement. Disparities in income exist, with Black or African-American households having a lower median household income, higher rate of poverty, and worse health outcomes for cancer, heart disease, and diabetes when compared to Whites. For the most part, health indicators for the county compare favorably with those of the state and the nation. However, there are notable exceptions
While Harford County’s infant mortality rate is lower than the Maryland rate, the county rate increased between 2001-2005 and 2006-2010, unlike the Maryland rate, which decreased (Maryland Vital Statistics). In addition, infant mortality rates were three times higher for Blacks than for Whites.
Page 49
Harford County’s mortality rate for the three leading causes of death (heart disease, cancer and stroke), is slightly above the Maryland rate, with both county and state rates decreasing over time (Maryland Vital Statistics).
Harford County’s mortality rate for Chronic Obstructive Pulmonary Disease, the fourth leading cause of death, is well above Maryland’s rate and increased by 21% between 2004-2006 and 2007-2009, while the state rate remained the same (Maryland Vital Statistics).
The suicide death rate for Harford County is well-above Maryland’s and almost doubled between 2004-2006 and 2007-2009 (Maryland Vital Statistics).
In 2011, Harford County’s death rates from intoxication were the third highest in Maryland (Office of State Medical Examiner).
Health behavior data for the Harford County population provides insight into the higher than expected mortality rates for county residents:
Adult smoking rates in Harford County did not substantially decrease between 2005-2007 and 2008-2010, remaining at 20% while the Maryland rate dropped from approximately 18% to 15% (Behavioral Risk Surveillance Survey (BRFSS)).
Adult and youth binge drinking rates in Harford County are higher than those in Maryland, with the county rates increasing between 2005-2007 and 2008-2010 while the state rates remained the same (BRFSS, Maryland Tobacco Youth Survey (MYTS)).
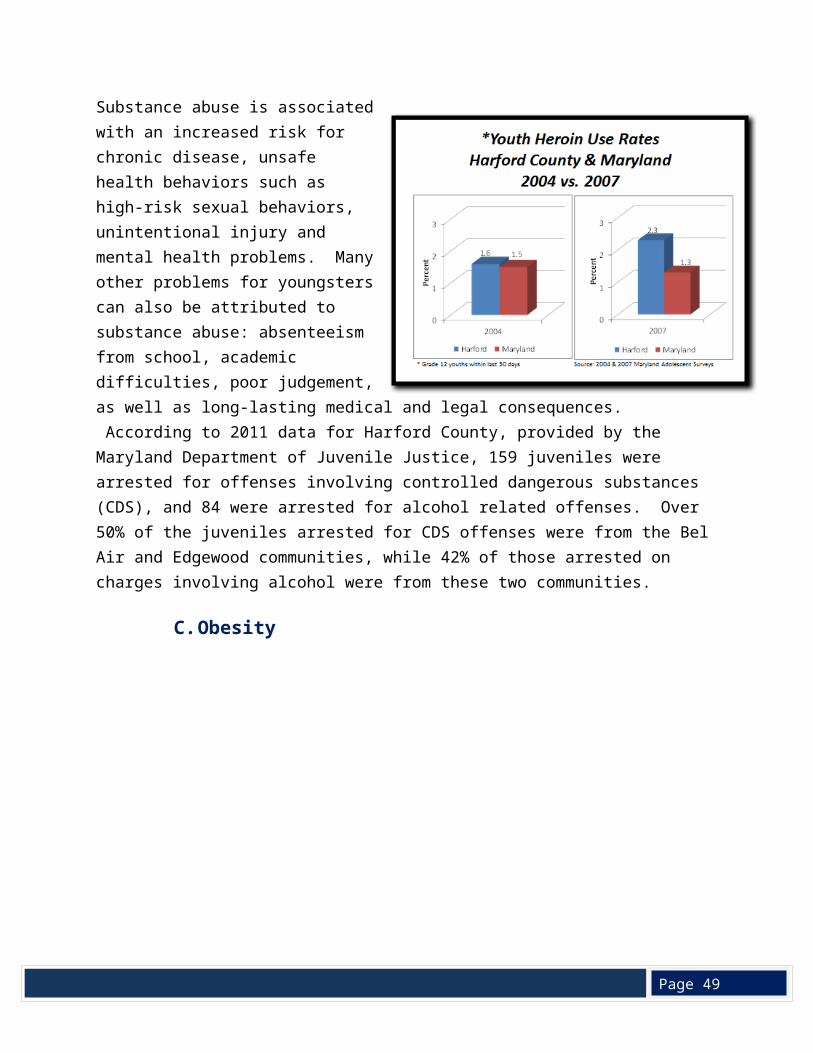
The rate of narcotic use by Harford County youth is above the Maryland rate and showed marked increases between 2004 and 2007 (MYTS).
The rate for obesity and overweight adults in Harford County is similar to Maryland’s rate, and both have increased between 2005-2007 and 2008-2010 (BRFSS).
Access to health care was identified as a problem for some Harford County residents:
While a higher percentage of the Harford residents have health insurance as compared to Maryland, the Hispanic or Latino population in the county was twice as likely to lack health insurance when compared to the county population (2010 American Community Survey, U.S. Census Bureau).
One out of every 10 adults between the ages of 18 and 64 reported they could not afford to see a doctor in 2008-2010, an increase from the previous three-year period (BRFSS).
Approximately one-fourth of adults between the ages of 18 and 64 had not had a dental visit in 2008-2010 (BRFSS).
When compared to Maryland, Harford County had a lower percentage of colonoscopy screenings, mammography screenings, and vaccinations against influenza (BRFSS).
Harford County has a severe shortage of mental health providers (Maryland Office of Primary Care, Department of Health and Mental Hygiene).
An area of four census tracts along the southern border of the county received a Governor’s exception Medically Underserved Population (MUP) designation due to its lack of accessible primary care services (U.S. Health Services and Resources Administration, Health and Human Services).
Page 49
Harford County has a strong group of community stakeholders committed to tackling the county’s public health challenges - with representatives from Upper Chesapeake Health, the Harford County Health Department, and Harford County Government providing key leadership. The recently convened Local Health Improvement Coalition (LHIC), a component of the Local Health Improvement Process (LHIP), brought over 50 representatives from a wide variety of community organizations together to work on this common goal. At its meeting in December, 2011, the LHIC identified the county’s three major health issues: obesity prevention, tobacco use prevention, and behavioral health encouraging the formation of workgroups to specifically address these issues. Concurrently, the Harford County Obesity Task Force, established by the Harford County Council in October 2011 and including many LHIC representatives, is developing recommendations about programs and policies to create a healthier Harford County. These efforts, along with this present Community Health Needs Assessment, will result in the development of a Local Health Improvement Plan to address identified needs.
Harford County has a long tradition of strong cooperative partnerships to address critical public needs. Upper Chesapeake Health (UCH), the Harford County Health Department (HCHD) and the Harford County Government (HCG), have been leaders in improving public health outcomes, both individually and under the cooperative umbrella of Healthy Harford - the Harford County healthy communities initiative, a non-profit 501c3 organization. This community assessment is a result of the shared goal of this partnership and the dedication of those involved to create a healthier Harford County.
Page 49
II. Health Assessments and Planning Initiatives A. Upper Chesapeake Health
Upper Chesapeake Health (UCH) is a not-for-profit, community-based, two-hospital system that demonstrates its dedication to the people in our communities by delivering Upper Chesapeake Health’s broad range of healthcare services, technology, and facilities. Our HealthLink program works within our communities to serve as a resource and champion for wellness and health education. It is the leading health care system and second largest private employer in Harford County. Our 3,200 Team Members and over 600 Medical Staff Physicians serve residents of Harford County and western Cecil County.The Upper Chesapeake HealthLink community outreach program provides health screenings, educational programs, support groups and a Primary Care Clinic for under- and non-insured individuals in the community.
B. Healthy Harford
Established in 1993 by leaders from Upper Chesapeake Health, Harford County Health Department, and Harford County Government, Healthy Harford is a community coalition dedicated to improved health outcomes in Harford County. Recognizing that good health extends well beyond the confines of somatic care, Healthy Harford seeks to bring both traditional and nontraditional segments of the community together to removing barriers and limitations to achieving a healthier lifestyle ~ creating a community where the healthy choice is the easy choice.Over the years, multiple partners have joined this effort, including additional Harford County governmental agencies and leaders, the public schools, local businesses, healthcare providers, community-based organizations, faith-based groups, advocacy groups, community residents, and others. Some of Healthy Harford’s most ardent supporters include organizational partners
MissionUpper Chesapeake Health is dedicated to maintaining and improving the health of the people in its communities through an integrated health delivery system that provides high quality care to all. Upper Chesapeake Health is committed to service excellence as it offers a broad range of healthcare services, technology and facilities. It will work collaboratively with its communities and other health organizations to serve as a resource for health promotion and education.
VisionThe Vision of Upper Chesapeake Health is to become the preferred, integrated healthcare system creating the healthiest community in Maryland.

Page 49
that are not always traditionally involved in public health issues such as the Harford County Sheriff’s Office, Harford Community College, the Harford County Public Libraries, the Department of Planning and Zoning, and the Department of Public Works. Healthy Harford maintains both a website (http://www.healthyharford.org/), where county residents can access general wellness information, local community activities, and public health updates, and a Facebook page (http://www.facebook.com/HealthyHarford) which provides a more personal interactive venue for health news and trends, local happenings, and events.Starting in 1996, and roughly every 5 years since, Healthy Harford has conducted a health and lifestyle Community Health Assessment Project (CHAP) survey of Harford County residents to help identify health needs and monitor health behaviors in our community. Based on the Centers for Disease Control (CDC) Behavioral Risk Factor Surveillance Survey (BRFSS), this demographically representative phone survey conducted by an independent telemarketing firm, provides first hand self reported data on the health habits and lifestyle activities of Harford County residents. This data is then used to develop CHAP Preventive Health and Wellness Report Cards, prioritizing health issues in the community and setting 5 year community health outcome goals which are then re-evaluated and reassessed during the next CHAP survey. The latest CHAP survey was conducted in 2010.From 1996 to 2006 Healthy Harford had a broad focus, conducting programs and projects on a number of different health issues. In 2007, with almost two-thirds of our adult population registering as overweight or obese, a corollary increase in diabetes, and a rising premature death rate, the Healthy Harford Board of Directors voted to narrow that focus to working with community partners to promote healthy lifestyles, improved eating habits and increased physical activity for the prevention of chronic disease and obesity in Harford County. Their goal was to not only provide community education, but to improve public health via policy, systems and environmental change. In 2008, coalition members conducted a Physical Activity and Nutrition Survey, which delved deeper into the reasons behind our modest rates of regular physical activity and low fruit and vegetable consumption, to explore attitudes, barriers, and possible solutions. As part of an on-going effort to increase opportunities for physical activity, Healthy Harford advocates for strategies that will enable people to walk and ride bicycles to meet their transportation needs. In 2009 coalition members conducted a Walkability and Bikability Survey of three area schools, and in 2010 partnered with the Harford County Department of Planning and Zoning (DPZ) to conduct a bicycle survey, reporting on residents’ interests and concerns about bicycle transportation and their willingness to use bicycles to commute and for routine travel (http://www.harfordcountymd.gov/PlanningZoning/Download/323.pdf). Information from both of these surveys was used to help draft the 2012 Harford County Master Plan and the Land Use Element Plan, which for the first time included the concept that the built environment played a strong role in the health of the community. As part of the Land Use Element Plan, a Bicycle and Pedestrian Advisory Board, which includes a number of members from the Healthy Harford Coalition, was convened to draft a Bicycle and Pedestrian Plan (BPP) for submission by the end of calendar year 2012. An initial public workshop/open house was held in March 2012 for public education and feedback. Additional presentations at public forums and fairs in the community have been held throughout the year.

Page 49
In December 2010, the Healthy Harford Advisory Board reviewed information from all of the aforementioned surveys as well as the latest CHAP data and Preventive Health and Wellness Report Cards to assess the overall health of Harford County adult residents with the goals of ensuring that health improvement strategies were matching the actual needs. Indicators of health status that were highlighted included rates and trends in: obesity, diagnosed diabetes, tobaccos use, high blood pressure, access to dental care, and behavioral health issues, among others. This information was used to develop next steps which included the drafting of the Obesity Resolution and formation of the Obesity Task Force which will be discussed later on in this report. The Obesity Task Force Resolution can be accessed at http://www.harfordcountyhealth.com/wp-content/uploads/2012/02/Obesity-Task-Force-Resolution.pdf
C. Health County Ranking
The County Health Rankings & Roadmaps project, launched in 2010 with funding from the Robert Wood Johnson Foundation, ranks health outcomes and health factors for nearly every county in the nation, providing data on a variety
of measures that affect health such as the rate of people dying before age 75, high school graduation rates, access to healthier foods, air pollution levels, income, and rates of smoking, obesity, and teen births. The Rankings, which focus on measuring the overall health of each county on the multiple factors that influence health (http://www.countyhealthrankings.org/about-project), are designed to raise awareness of the multiple facets, including social determinants, which affect the health of a community.The County Health Rankings provide two rankings, one for Health Outcomes (mortality and morbidity) and the other for Health Factors (behavioral, clinical, social and economic, and environmental). Harford County was ranked 9th out of the 24 Maryland jurisdictions on the Health Outcomes and 8th on Health Factors. Of particular note was the difference within the overall Health Outcomes measure: Harford ranked 6th out of the 24 counties on mortality (length of life), but 12th on morbidity (quality of life), with higher average numbers of poor physical health days and poor mental health days. Within the Health Factors ranking, Harford County was ranked 20th for physical environment, with 23 air pollution-ozone days compared to an average of 16 for Maryland. For reasons of climate and geography, Harford County has poor air quality. Located at the top of the Chesapeake Bay and to the west of the Susquehanna River, prevailing winds carrying large particulate pollution from aging power plants in the Midwest and motor vehicles and industry pollution from metropolitan areas and highways to our south, often stagnate over our region. The data provided by the Health County Rankings has been useful in drawing attention to the public health successes and challenges faced by Harford County. Both the Health Outcomes and Factor rankings, which fall in the second highest quartile for the state, demonstrate that the county has health problems that could be more effectively addressed. This community health assessment provides an opportunity to more fully define these public health concerns.
Page 49
D. Harford County Health Department - State and Local Health Improvement Process
The Harford County Health Department (HCHD) is the local Harford County branch of the Maryland Department of Health and Mental Hygiene (DHMH). As such it is governed by State rules, but locally reports to the Harford County Council which functions as the Harford County Board of Health. The HCHD’s mission is to Protect and promote the health, safety, and environment of the citizens of Harford County through community assessment, education, collaboration and assurance of services.
To carry out this mission, the health department has adopted public health values and goals, which are to:
Conduct community needs assessments; Mobilize the community for action; Provide targeted outreach and form partnerships;
and Assure the provision of essential health care services.
In an effort to improve the health of all Marylanders, the Maryland Department of Health and Mental Hygiene (DHMH) launched the State Health Improvement Process (SHIP) (http://dhmh.maryland.gov/ship) to focus on health priorities and provide a framework for accountability, local action, and public engagement. Six vision areas, with 39 health objectives, were defined to create and measure progress in Maryland’s health. The six vision areas are:
1. Healthy Babies2. Healthy Social Environments3. Safe Physical Environments4. Infectious Disease5. Chronic Disease 6. Healthcare Access
DHMH provided each state jurisdiction with an individualized profile (http://eh.dhmh.md.gov/ship/SHIP_Profile_Harford.pdf), with local data for the 39 objectives to highlight where they stood regarding these State prioritized objectives. Harford County is comparable to or better than the State average on 28 of the objectives, but ranks worse than the State in the following 11 objectives:
Objective 8 – Suicide rate Objective 19 – Air Quality Index exceeds 100 Objective 24 – Adult seasonal influenza vaccine rate Objective 25 – Heart disease mortality Objective 26 – Cancer mortality

Page 49
Objective 29 – Drug-induced deaths Objective 32 – Adult tobacco use Objective 33 – Youth tobacco use Objective 34 – Behavioral admissions to the emergency room Objective 35 – Alzheimer’s related admissions to the emergency room Objective 38 – Dental care for children and adolescents
With encouragement and support from DHMH, Maryland county health departments developed Local Health Improvement Processes for their individual jurisdictions. In Harford County, this process consisted of convening a Local Health Improvement Coalition (LHIC) which reviewed the results of the 39 objectives and selected the most pressing local health priorities to be addressed in a Local Health Action Plan. The LHIC, chaired by the Harford County Health Officer, first met in December 2011 and utilized the World Café method (http://www.theworldcafe.com/method.html), to help educate and inform attendees of the County’s most pressing health issues.
After much discussion, the LHIC emphatically declared its top three health priority areas to be: (1) obesity prevention/healthy eating and active living, (2) tobacco use prevention/tobacco-free living, (3) and behavioral health, including mental healthcare and substance abuse prevention. The Coalition emphasized that physical and behavioral health issues must be addressed in tandem in order to achieve optimal outcomes. Workgroups for each of these priority areas were established. The strategies designed to address these priorities are included in the Harford County Local Action Plan http://www.healthyharford.org/wp-content/uploads/2011/06/10.2.12-Obesity-Task-Force-Final-Report.pdf.
E. Obesity Task Force
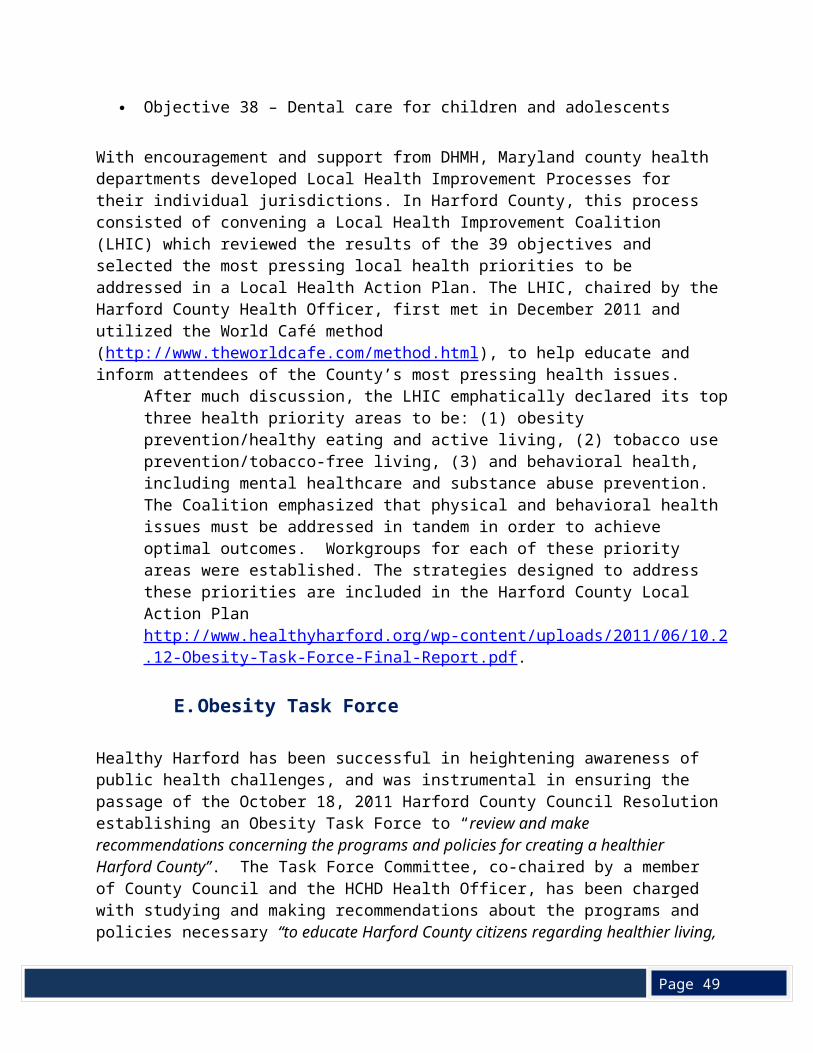
Healthy Harford has been successful in heightening awareness of public health challenges, and was instrumental in ensuring the passage of the October 18, 2011 Harford County Council Resolution establishing an Obesity Task Force to “review and make recommendations concerning the programs and policies for creating a healthier Harford County”. The Task Force Committee, co-chaired by a member of County Council and the HCHD Health Officer, has been charged with studying and making recommendations about the programs and policies necessary “to educate Harford County citizens regarding healthier living, food choices, and exercise; to provide for accessibility to healthy and affordable foods; and to identify ways to develop and implement more opportunities for walkable communities and recreational activities throughout the County.”
The Obesity Task Force is comprised of the Obesity Task Force Committee as well as three subcommittee workgroups: Access to Healthy Foods, Community Engagement, and the Built Environment. There is a broad range of community representation on these committees and leadership and guidance is provided by the leading partners of Healthy Harford, Upper
Page 49
Chesapeake Health, the Health Department, the County Government. The Obesity Task Force Report, issued to the County Council on October 2012, is entirely consistent with Harford County’s LHIC efforts that have prioritized obesity education and prevention, as well as tobacco use/prevention and behavioral health as priorities. The Local Health Improvement Coalition Committee will serve as the umbrella entity providing direction to and assuring integration of all Harford County community health improvement efforts.
F. Summary
Since the founding of Healthy Harford in 1993, Upper Chesapeake Health, the Harford County Health Department, and other County partners have worked to cooperatively assess and improve the health of county residents. The Healthy Harford Community Health Assessment Project (CHAP), the County Health Rankings, and Maryland’s State (SHIP) and Local Health Improvement Processes (LHIP) provide data on health status indicators, to help us focus attention on areas of concern. The Local Health Improvement Coalition, established to oversee the LHIP, will provide guidance as health improvement strategies are developed and implemented. This health assessment provides data to highlight public health concerns and to serve as a baseline for evaluation of new initiatives to address health status indicators.
III. Demographic and Economic Profile
Demographic identifiers such as race, age and ethnicity, as well as social determinants of health such as education level, income, and geographic location are all influencers on the type/rate of diseases and causes of death that may be experienced in a community. For example, access to health care may depend on the availability of health insurance (often tied to employment), income for co-pays, and the availability of transportation to get to health care providers. Lower levels of education levels often correlate to fewer employment opportunities, which often leads to less access to health insurance and poorer health outcomes. The profile of Harford County will focus on those indicators that are associated with the health of the population, comparing these to Maryland and the United States, where data is available.
A. Location and Population
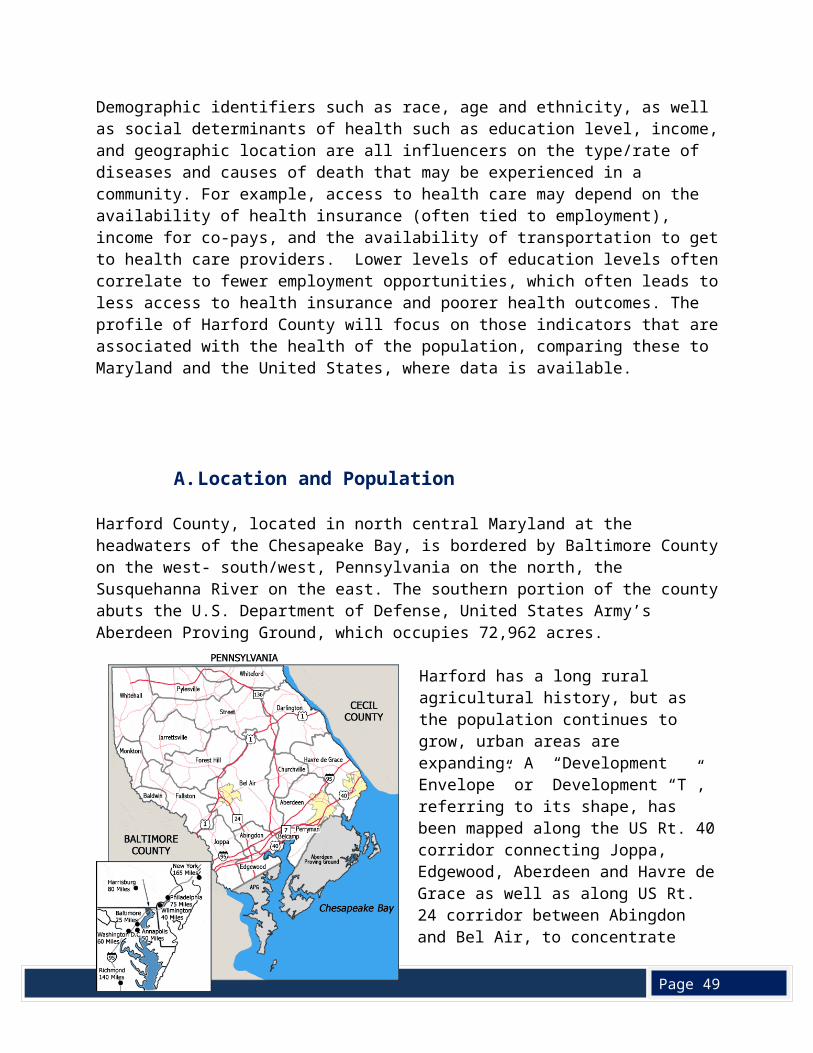
Harford County, located in north central Maryland at the headwaters of the Chesapeake Bay, is bordered by Baltimore County on the west- south/west, Pennsylvania on the north, the Susquehanna River on the east. The southern portion of the county abuts the U.S. Department of Defense, United States Army’s Aberdeen Proving Ground, which occupies 72,962 acres.
Page 49
Harford has a long rural agricultural history, but as the population continues to grow, urban areas are expanding. A “Development Envelope” or Development “T”, referring to its shape, has been mapped along the US Rt. 40 corridor connecting Joppa, Edgewood, Aberdeen and Havre de Grace as well as along US Rt. 24 corridor between Abingdon and Bel Air, to concentrate growth, maximize utilization of public services, reduce sprawl, and preserve agricultural land.
Harford County is one of the fastest growing counties in the state due to its strategic location between New York and Washington D.C. as well as its proximity to the major east coast transportation corridors of I-95 and
commercial and passenger rail lines. Harford’s population grew from 182,132 in 1990 to 244,826 in 2010, representing a 34% increase, far surpassing the growth experienced by 9% statewide Maryland growth experience during the same 20 year period. Contributing to this growth is the Base Realignment and Closure (BRAC) process within the Department of the Army that relocated federal jobs from Fort Monmouth, New Jersey and other bases to Aberdeen Proving Ground, and the subsequent import of government contractor positions that support Army initiatives.
In his 2012 State of the County address, Harford County Executive David Craig noted that during 2011, 80 new defense contractors relocated to Harford County, the County’s retail base expanded exponentially. Two thousand three hundred new jobs were created, providing the County with ‘one of the best unemployment rates, better than any other place in the Baltimore Region, better than the State of Maryland, and better than the National Government’ (State of the County Address, February 21, 2012).
Page 49
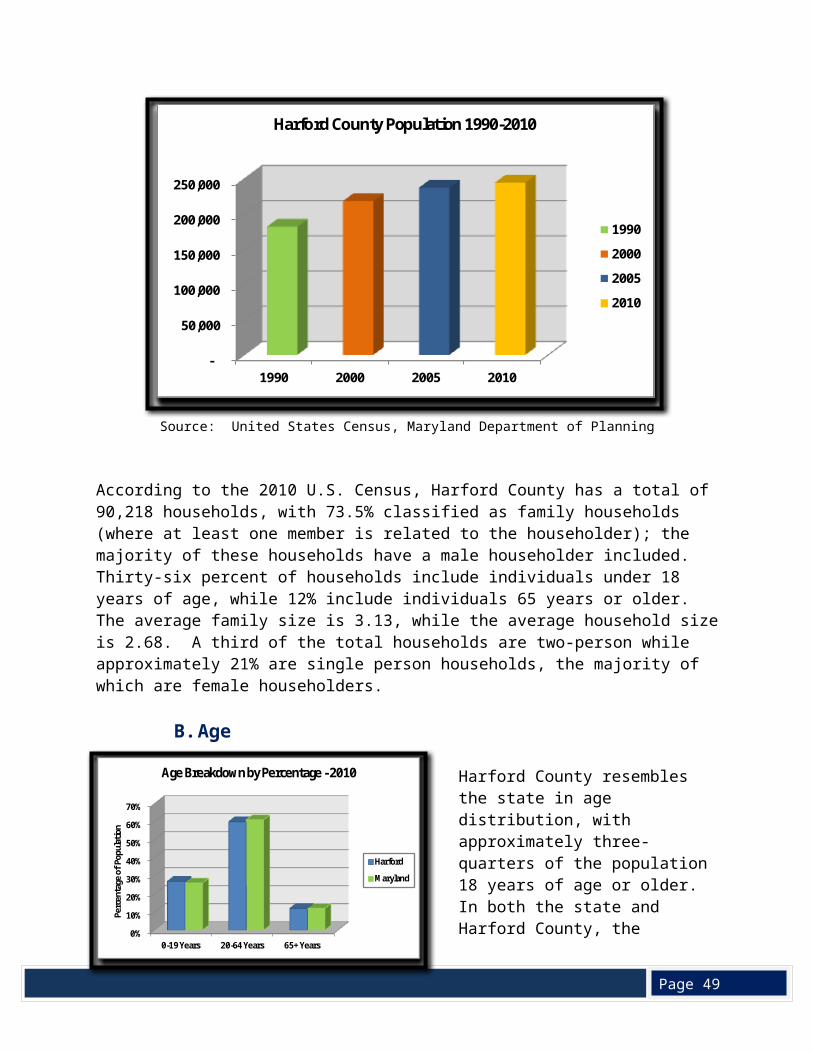
Source: United States Census, Maryland Department of Planning
According to the 2010 U.S. Census, Harford County has a total of 90,218 households, with 73.5% classified as family households (where at least one member is related to the householder); the majority of these households have a male householder included. Thirty-six percent of households include individuals under 18 years of age, while 12% include individuals 65 years or older. The average family size is 3.13, while the average household size is 2.68. A third of the total households are two-person while approximately 21% are single person households, the majority of which are female householders.
B. Age
Harford County resembles the state in age distribution, with approximately three-quarters of the population 18 years of age or older. In both the state and Harford County, the percentage of those 65 years old or over is 12%. Harford’s population includes about 15,000 children under the age of five, and approximately 51,700 of the population are between the ages of five and 19 (U.S. Census, Census 2010).
Source: United States Census Bureau, American Community Survey 2006 - 2010
-
50,000
100,000
150,000
200,000
250,000
1990 2000 2005 2010
Harford County Population 1990-2010
1990
2000
2005
2010
0%
10%
20%
30%
40%
50%
60%
70%
0-19 Years 20-64 Years 65+ Years
Perc
enta
ge o
f Pop
ulati
on
Age Breakdown by Percentage - 2010
Harford
Maryland
Page 49
C. Diversity
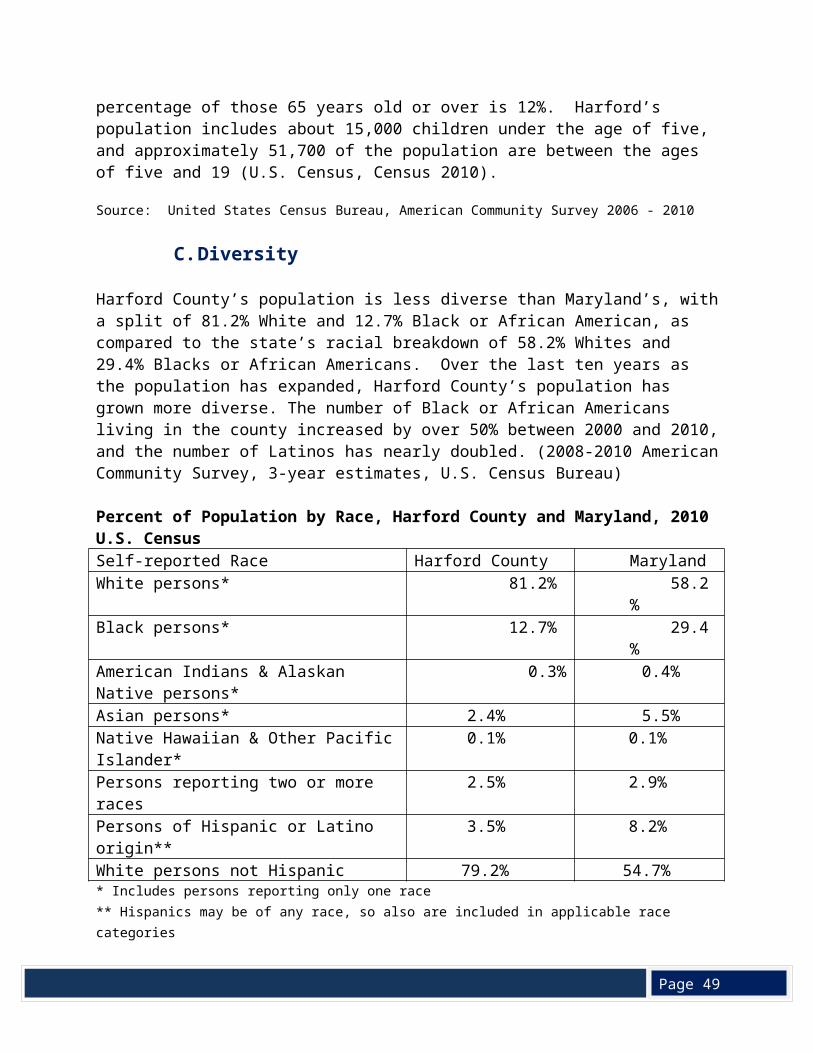
Harford County’s population is less diverse than Maryland’s, with a split of 81.2% White and 12.7% Black or African American, as compared to the state’s racial breakdown of 58.2% Whites and 29.4% Blacks or African Americans. Over the last ten years as the population has expanded, Harford County’s population has grown more diverse. The number of Black or African Americans living in the county increased by over 50% between 2000 and 2010, and the number of Latinos has nearly doubled. (2008-2010 American Community Survey, 3-year estimates, U.S. Census Bureau)
Percent of Population by Race, Harford County and Maryland, 2010 U.S. CensusSelf-reported Race Harford County MarylandWhite persons* 81.2% 58.2%Black persons* 12.7% 29.4%American Indians & Alaskan Native persons* 0.3% 0.4%Asian persons* 2.4% 5.5%Native Hawaiian & Other Pacific Islander* 0.1% 0.1%Persons reporting two or more races 2.5% 2.9%Persons of Hispanic or Latino origin** 3.5% 8.2%White persons not Hispanic 79.2% 54.7%* Includes persons reporting only one race** Hispanics may be of any race, so also are included in applicable race categoriesSource: Quick Facts for Harford County and Maryland, United States Census Bureau
The percentage of foreign born persons in Harford County is considerably less than the percentage in Maryland: 4.9% as compared to 13.9% of state residents. Most Harford County residents were born in Maryland (65.5%) as compared to Maryland as a whole (47.5%), so it is not surprising that the percentage of Harford’s population that live in homes where language other than English is spoken (7.9%) is less than half of Maryland’s percentage (16.2%) (Quick Facts for Harford County and Maryland, United States Census Bureau).
D. Education
Harford County School District has 53 schools that, during the 2011-2012 school year served 38,222 students in grades pre-kindergarten through 12. The district’s six Title I elementary schools, with the mission to ensure academic achievement for at-risk students attending schools in high poverty areas, are located in the southern portion of the county: two in Aberdeen, and one each in Edgewood, Havre de Grace, Joppa and Abingdon (http://www.hcps.org/schools/). Starting with the 2012-2013 school year, Edgewood Elementary will lose its Title 1 status due to student scholastic achievement.
For the 2011-2012 school year, 87% of the 2,773 Harford County children entering kindergarten were fully “ready to learn,” as compared to the Maryland percentage of 83%. These
Page 49
percentages are based on the results of the Maryland Model for School Readiness assessments, which measures children’s readiness to start school by looking at a number of different domains such as language and literacy, mathematical thinking, social and personal development, and physical development and health.
Not all groups of Harford County kindergarteners had high percentages for readiness to learn: 79% of the 829 children who qualified for free and reduced meals entered kindergarten
fully ready to learn as compared to 90% of the 1,944 children who did not qualify; 81% of the 423 African American children were fully ready to learn as compared to 89%
of the 1,892 White children; 83% of the 1,452 male children were fully ready to learn as compared to 91% of the
1,321 female children.
These figures suggest that more African American, low income and male children were unprepared and face a disadvantage when they begin school (Children Entering School Ready to Learn: The 2011-2012 School Readiness Report, Maryland State Department of Education).
In 2011, the drop-out rate for grades 9-12 was less than 3% for the county, comparable to Maryland’s rate (http://www.mdreportcard.org/). The district is ranked 11th best of the 24 school districts in the state (http://www.schooldigger.com/go/MD/districtrank.aspx).
According to the 2010 U. S. Census, a high proportion of Harford residents have high school degrees (91%), as compared to Maryland residents (87.8%). However, less than one-third (30.5%) of county residents 25 years or older have a Bachelor’s degree or higher, compared to 35.7% of all Marylanders. The population with the lowest educational attainment is located in Aberdeen and Edgewood, along the southern border of the county.
E. Income
The median household income in Harford County was estimated to be $76,808, higher than the state as a whole ($70,017), and $25,000 higher than the United States’ median income. White households had markedly higher median income ($78,266) than Black or African American households ($66,434). The county’s median family income was estimated to be $87,636, with White median family income ($90,324) well above the African American or Black family median incomes of $74,894 (2008-2010 American Community Survey, 3-year estimates, U.S. Census Bureau).
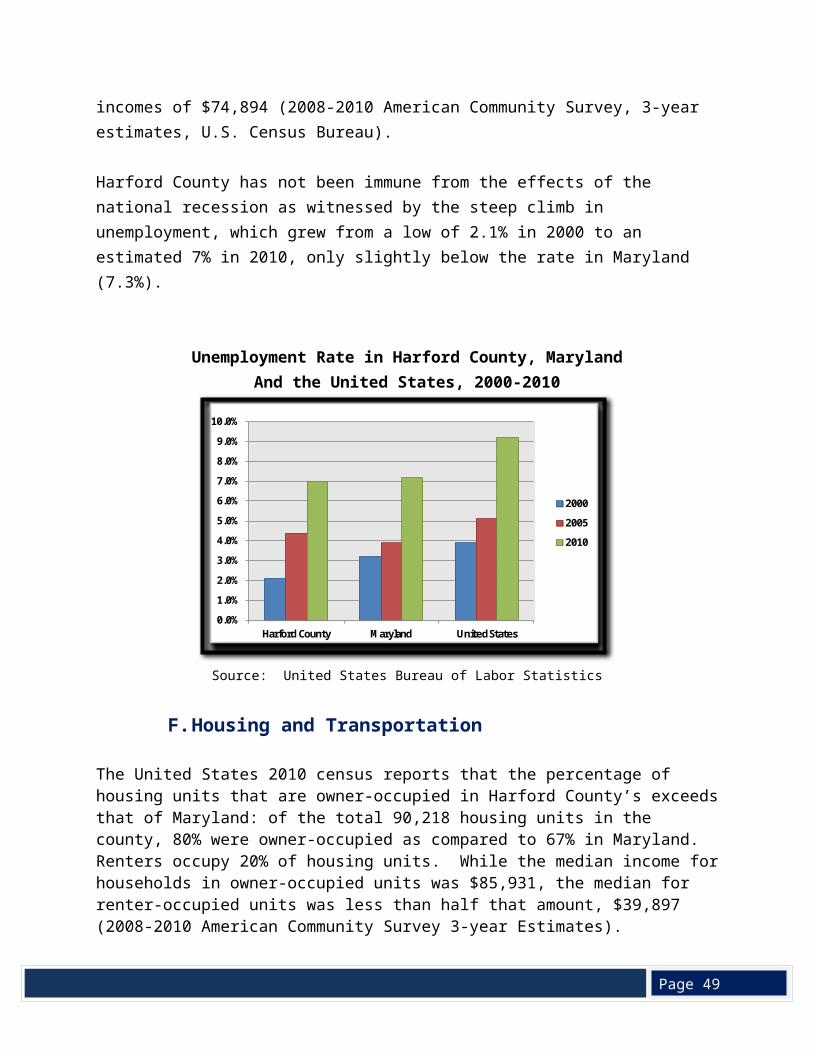
Harford County has not been immune from the effects of the national recession as witnessed by the steep climb in unemployment, which grew from a low of 2.1% in 2000 to an estimated 7% in 2010, only slightly below the rate in Maryland (7.3%).
Page 49
Unemployment Rate in Harford County, MarylandAnd the United States, 2000-2010
Source: United States Bureau of Labor Statistics
F. Housing and Transportation
The United States 2010 census reports that the percentage of housing units that are owner-occupied in Harford County’s exceeds that of Maryland: of the total 90,218 housing units in the county, 80% were owner-occupied as compared to 67% in Maryland. Renters occupy 20% of housing units. While the median income for households in owner-occupied units was $85,931, the median for renter-occupied units was less than half that amount, $39,897 (2008-2010 American Community Survey 3-year Estimates).
According to the National Low Income Housing Coalition’s 2011 Out of Reach Report, the fair market rent for a two-bedroom unit in Harford County is $1,263 per month, requiring a $50,520 income per year, over $10,000 more than the estimated median income for Harford County renters. This discrepancy suggests that some Harford County residents will have difficulty affording rental housing. The county’s public transportation is provided by buses. The majority of transit routes are located in areas with the highest concentration of low to moderate income families, along the route 40 corridor in the southern portion of the county (Map 2, Appendix). The transit routes are not extensive, and it would be impossible to make your way around the entire county solely using mass transit, however, all Harford County transit buses now come equipped with bike racks to help bridge some of those gaps. Most Harford County households, however, do have a vehicle, with less than 5% of households without a vehicle, and most households owning two or more vehicles.
0.0%
1.0%
2.0%
3.0%
4.0%
5.0%
6.0%
7.0%
8.0%
9.0%
10.0%
Harford County Maryland United States
2000
2005
2010

Page 49
In Harford County, the mean travel time to work is similar to that of Maryland as a whole: about one-half hour (2008-2010 American Community Survey, 3-year estimates, U.S. Census Bureau). Most workers (84%) drive alone to work, while an estimated 9% of workers carpool. Maryland Transit Authority (MTA) commuter buses and MARC and Amtrack trains are available for commutes to Baltimore and Washington DC. Only about one percent of workers use public transportation (excluding taxicab) to get to work, while the remaining workers use other means.
G. Poverty
The estimated poverty rate in Harford County is 6.4%, lower than the Maryland poverty rate which is slightly above 9%. Harford’s population under 18 years of age has the highest rate of poverty, with an estimated 8.5% or 5,168 of those under 18 living in families with incomes below the poverty level. The population 65 years and over has the next highest rate of poverty, with an estimated 1,878 or 6.5% with incomes below the poverty level (2008-2010 American Community Survey, 3-year estimates, U.S. Census Bureau).
Of the estimated 89,712 households in Harford County, 4,757 households or 5% receive food stamps; an estimated 65% of these households have children less than 18 years of age while an 23% have one or more people 60 years of age or older (2008-2010 American Community Survey, 3-year estimates, U.S. Census Bureau).
The poverty rate for Blacks or African Americans in Harford County is over twice that of Whites, with an estimated 13.5% of Black residents with income below the poverty level as compared to 5.4% of Whites (2008-2010 American Community Survey, 3-year estimates, U.S. Census Bureau). The greatest concentration of poverty is located in the southern portion of the county along the Route 40 corridor (Maps 2, 3 and 4, Appendix).
H. Special Populations
According to 2010 census data, 3.5% of the Harford County population is of Hispanic or Latino origin. This population had been rising locally, making up only 1.9% of the population in 2000. The number of families served who are refugee or illegal immigrants has also increased. As Harford County plans comprehensive services, it must take into consideration a rising number of families who may have Limited English Proficiency and be in need of translation services. As a mirror to this change, the minority patient populations at the UCH HealthLink Primary Care Clinic which serves uninsured and underinsured adults age 19 and above, have increased, most notably the Latino population which has increased from 2% in 2008 to 13% in 2011.
The U.S. Census Bureau estimates that there are 341 disabled children under 5 years of age in Harford County, about 1.6% of the under 5 population; most have hearing and vision difficulties. The percentage of children with disabilities increases for the population 5 to 17 years of age: 3.2% of this age group is disabled, with the most frequent problem being cognitive difficulty.
Page 49
Source: United States Census Bureau, American Community Survey, 2008-2010
Approximately 8.7% of adults aged 18 to 64 are disabled, most frequently with cognitive and ambulatory difficulties. Almost one-third (32.7%) of the 65 years and over population is disabled, with over 18% of this group having difficulty with self-care and independent living. A total of 10% of both White and African American or Black populations are classified as disabled (United States Census Bureau, American Community Survey, 2008-2010).
The number of homeless individuals in Harford County is increasing. In fiscal year 2011, Harford County provided 1,073 people with 41,048 emergency shelter or transitional housing bed nights, for an average stay of 38 nights per person. Harford County currently has 12 emergency, transitional, and permanent supportive shelters, offering a total of 258 beds for homeless adults, children and families. Over a quarter of the homeless population is under 17 years of age or younger. Half of the homeless population is living in emergency shelters, with most others living in transitional housing or on the streets. Twenty-one percent of the population is considered “chronically homeless”. Over one quarter of the homeless population reported having mental health problems, while 12% reported drug or alcohol abuse.
UCH HealthLink Primary Care Clinic in partnership with the Harford County Health Department (HCHD) has received a Health Care for the Homeless Grant to provide care to this vulnerable population. UCH manages medical care, while the HCHD provides social work and case management. Included in the effort is the providing of free flu vaccinations and TB screenings. This grant provides support for medical/case management services for up to 400 adult patients per annum.
Each year, during the annual Homeless Point-in-Time Count, government and faith based volunteers canvass the streets and wooded areas on a selected winter’s night to count homeless persons living outdoors. The number of people recorded during these counts has
0.0%
5.0%
10.0%
15.0%
20.0%
25.0%
30.0%
Under 5
Years
5-17 Years
18-34 Years
35-64 Years
65-74 Years
75 Years
& Over
Perc
enta
ge
Age By Number of Disabilities
With one type of disability
With two or more disabilities
Page 49
doubled from 114 in 2005 to 243 in 2011 (Harford County Homeless Point-in-Time Count, Harford County Department of Community Services). Sixty percent of individuals in the homeless count reported having a disability.
I. Summary
Harford County is a relatively affluent county in one of the wealthiest states in the nation. The median income of households in the county is above Maryland’s, and well above that of the nation. Indicators of education, homeownership, employment and poverty level draw a picture of a county with a well-educated, prosperous population. However, disparities in income and education have been identified: Blacks or African Americans households have a lower median income when compared to Whites; African Americans are more than twice as likely to be poor; and African American children are less likely to be fully ready to learn when entering kindergarten. Populations of poverty are concentrated along the Route 40 corridor and in isolated farming communities in the northern end of the county. Poverty clusters correlate with areas of high minority population. The Route 40 corridor is also an area that is experiencing the most dramatic growth due to BRAC and other growth associated with the Aberdeen Proving Ground. The demographic changes over the last 20 years have brought more diversity to the county’s population, and along with the accompanying growth, a need for increased social and health services.
IV. Health Outcomes
A. Births & Infant Deaths
In 2010, 2,708 babies were born to Harford County residents, for a birth rate of 11.1 per 1,000 population, slightly lower than the birth rate (12.8/1,000) of Maryland as a whole. Both Harford’s White birth rate at 10.6/1,000 and the Black rate at 13.5/1,000 were also lower than Maryland’s (12.0/1000 and 14.0/1000 respectively). Most births occurred outside of Harford County, with slightly more than 1,000 babies born in the County and 1,395 babies born in other Maryland counties, 204 born in Baltimore City, and the remaining 29 babies born out of state.
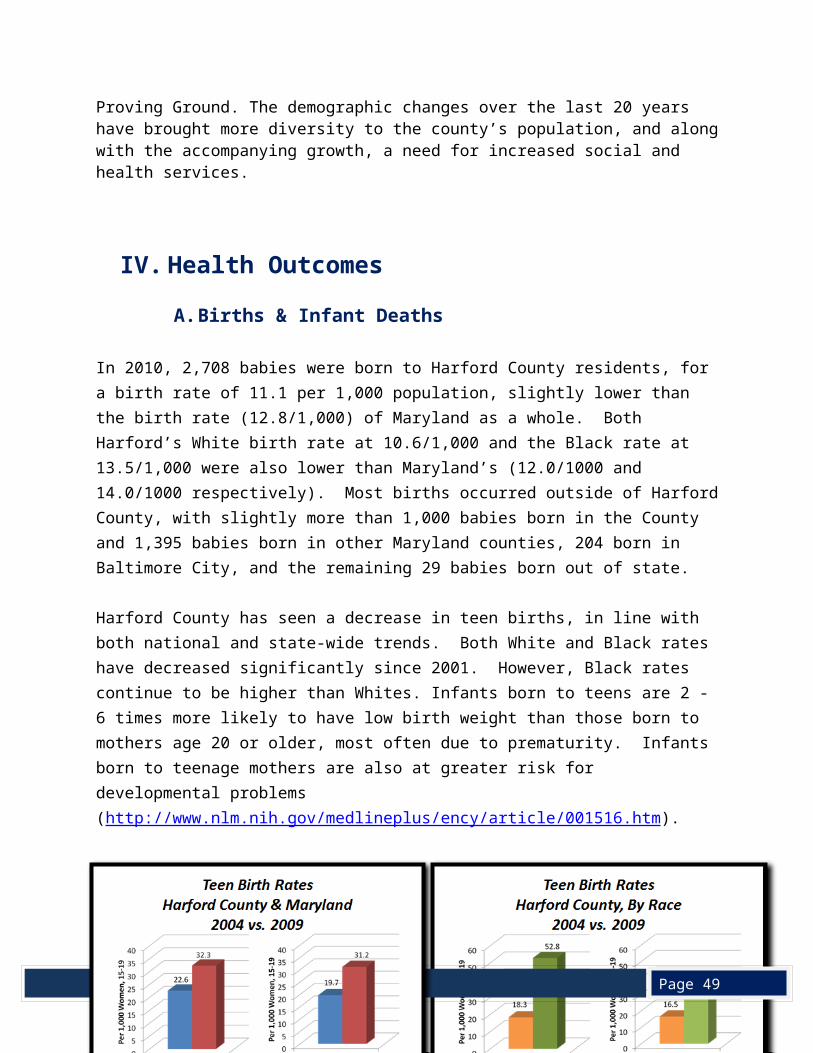
Harford County has seen a decrease in teen births, in line with both national and state-wide trends. Both White and Black rates have decreased significantly since 2001. However, Black rates continue to be higher than Whites. Infants born to teens are 2 - 6 times more likely to have low birth weight than those born to mothers age 20 or older, most often due to prematurity. Infants born to teenage mothers are also at greater risk for developmental problems (http://www.nlm.nih.gov/medlineplus/ency/article/001516.htm).

Page 49
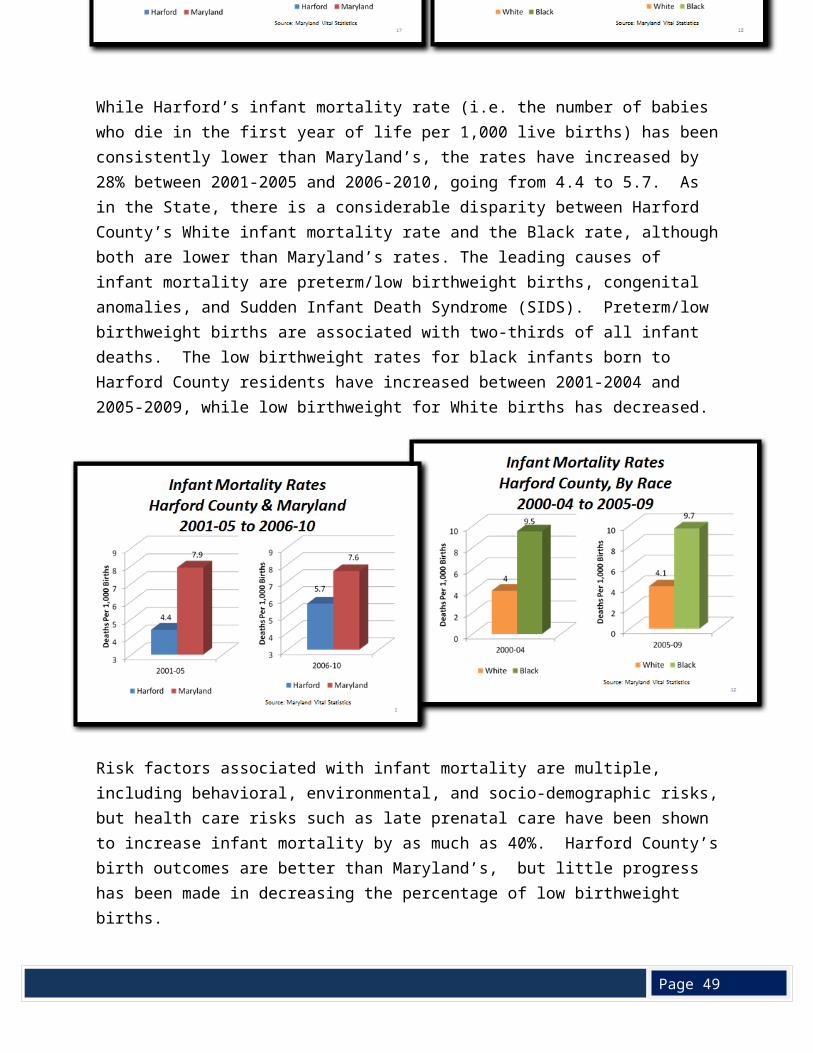
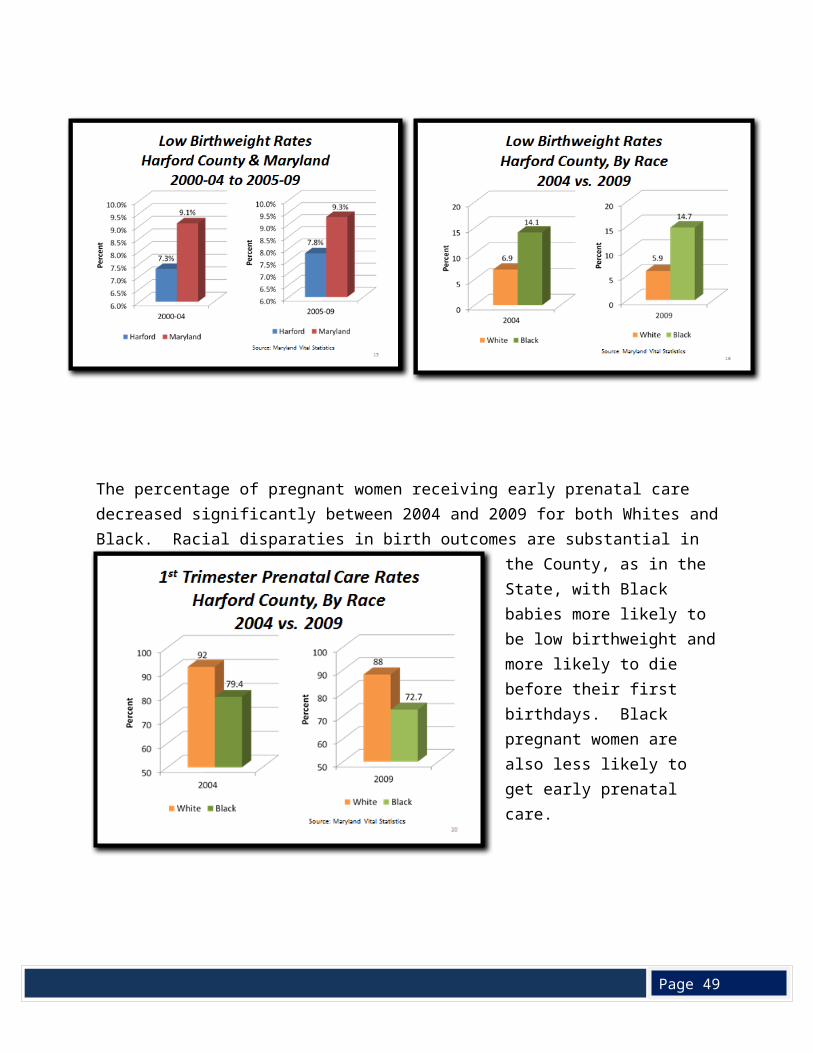
While Harford’s infant mortality rate (i.e. the number of babies who die in the first year of life per 1,000 live births) has been consistently lower than Maryland’s, the rates have increased by 28% between 2001-2005 and 2006-2010, going from 4.4 to 5.7. As in the State, there is a considerable disparity between Harford County’s White infant mortality rate and the Black rate, although both are lower than Maryland’s rates. The leading causes of infant mortality are preterm/low birthweight births, congenital anomalies, and Sudden Infant Death Syndrome (SIDS). Preterm/low birthweight births are associated with two-thirds of all infant deaths. The low birthweight rates for black infants born to Harford County residents have increased between 2001-2004 and 2005-2009, while low birthweight for White births has decreased.
Risk factors associated with infant mortality are multiple, including behavioral, environmental, and socio-demographic risks, but health care risks such as late prenatal care have been shown

Page 49
to increase infant mortality by as much as 40%. Harford County’s birth outcomes are better than Maryland’s, but little progress has been made in decreasing the percentage of low birthweight births.
The percentage of pregnant women receiving early prenatal care decreased significantly between 2004 and 2009 for both Whites and Black. Racial disparaties in birth outcomes are substantial in the County, as in the State, with Black babies more likely to be low birthweight
and more likely to die before their first birthdays. Black pregnant women are also less likely to get early prenatal care.
Page 49
B. Mortality (Chronic Disease - Heart Disease, Cancer, Stroke, COPD)
Harford County residents have a life expectancy (calculated at time of birth) of 78.9 years, comparable to that of Maryland as a whole. However, as with other many health measures, disparities exist between Whites and Blacks, with the life expectancy for Harford County Whites estimated to be 79.0 years while for Blacks, the estimation is 77.1. Blacks living in Harford County however have a higher life expectancy than the overall Maryland Black population, which is 75.5 years.
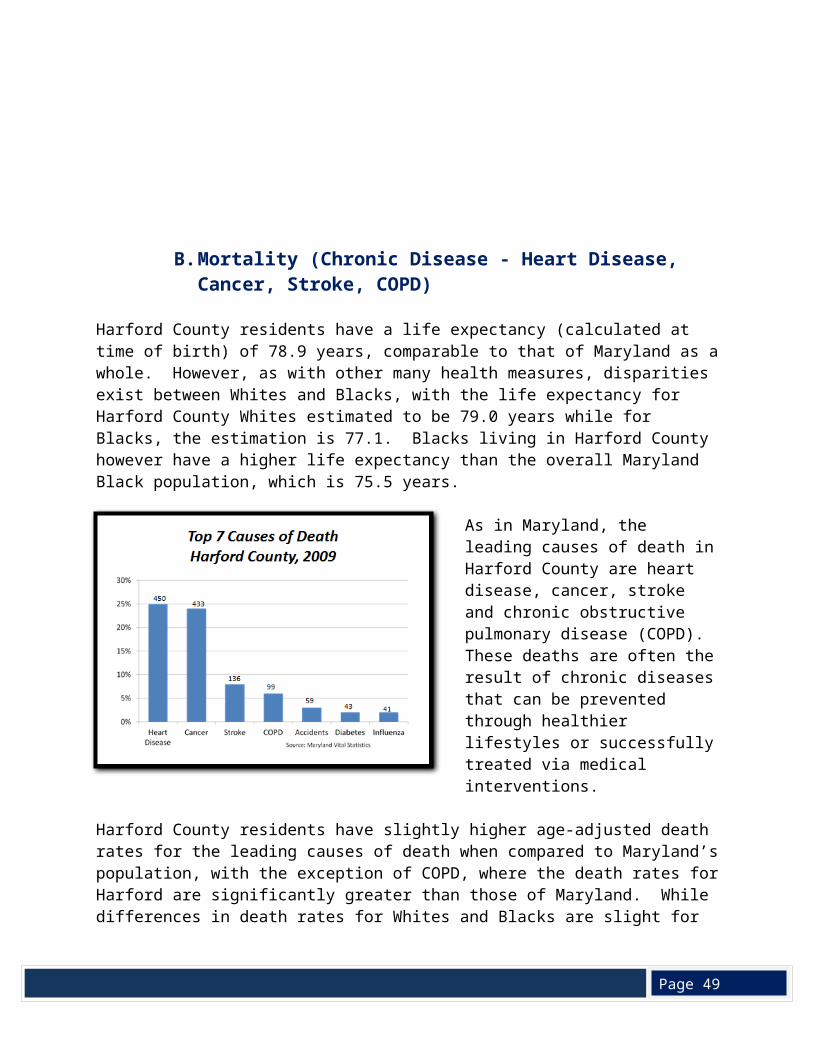
As in Maryland, the leading causes of death in Harford County are heart disease, cancer, stroke and chronic obstructive pulmonary disease (COPD). These deaths are often the result of chronic diseases that can be prevented through healthier lifestyles or successfully treated via medical interventions.
Harford County residents have slightly higher age-adjusted death rates for the leading causes of death when compared to Maryland’s population, with the
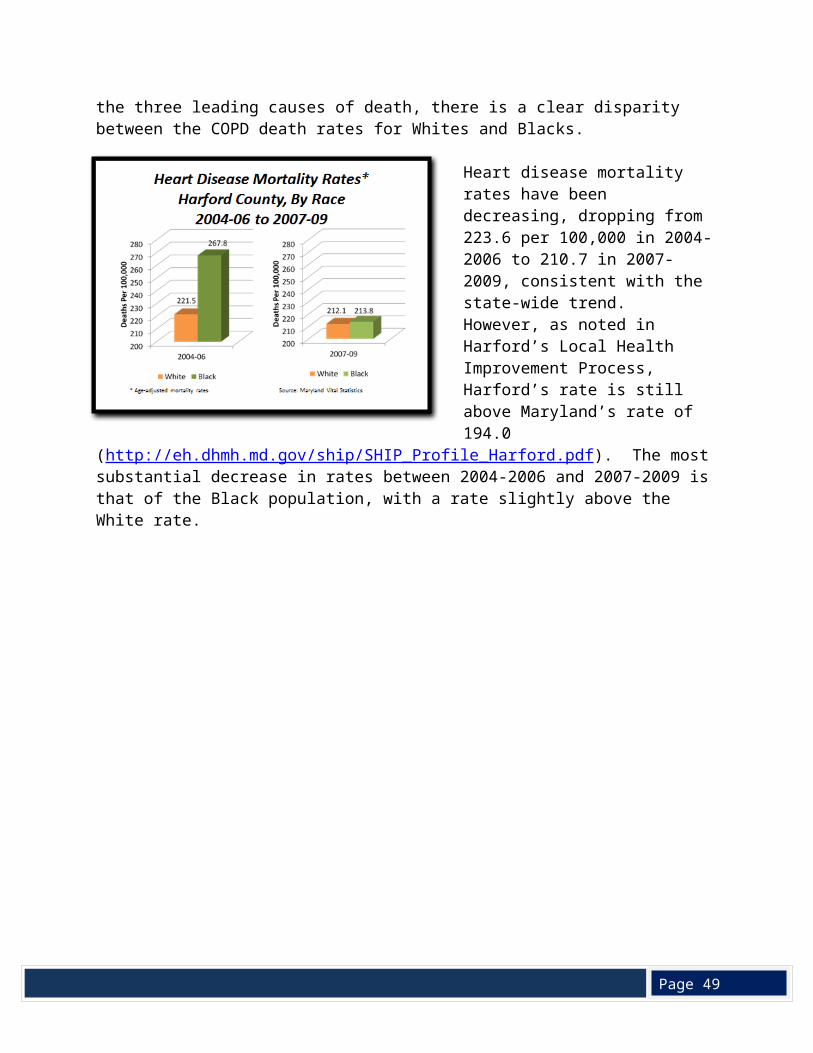
exception of COPD, where the death rates for Harford are significantly greater than those of Maryland. While differences in death rates for Whites and Blacks are slight for the three leading causes of death, there is a clear disparity between the COPD death rates for Whites and Blacks.
Heart disease mortality rates have been decreasing, dropping from 223.6 per 100,000 in 2004-2006 to 210.7 in 2007-2009, consistent with the state-wide trend. However, as noted in Harford’s Local Health Improvement Process, Harford’s rate is still above Maryland’s rate of 194.0
(http://eh.dhmh.md.gov/ship/SHIP_Profile_Harford.pdf). The most substantial decrease in
Page 49
rates between 2004-2006 and 2007-2009 is that of the Black population, with a rate slightly above the White rate.
Page 49
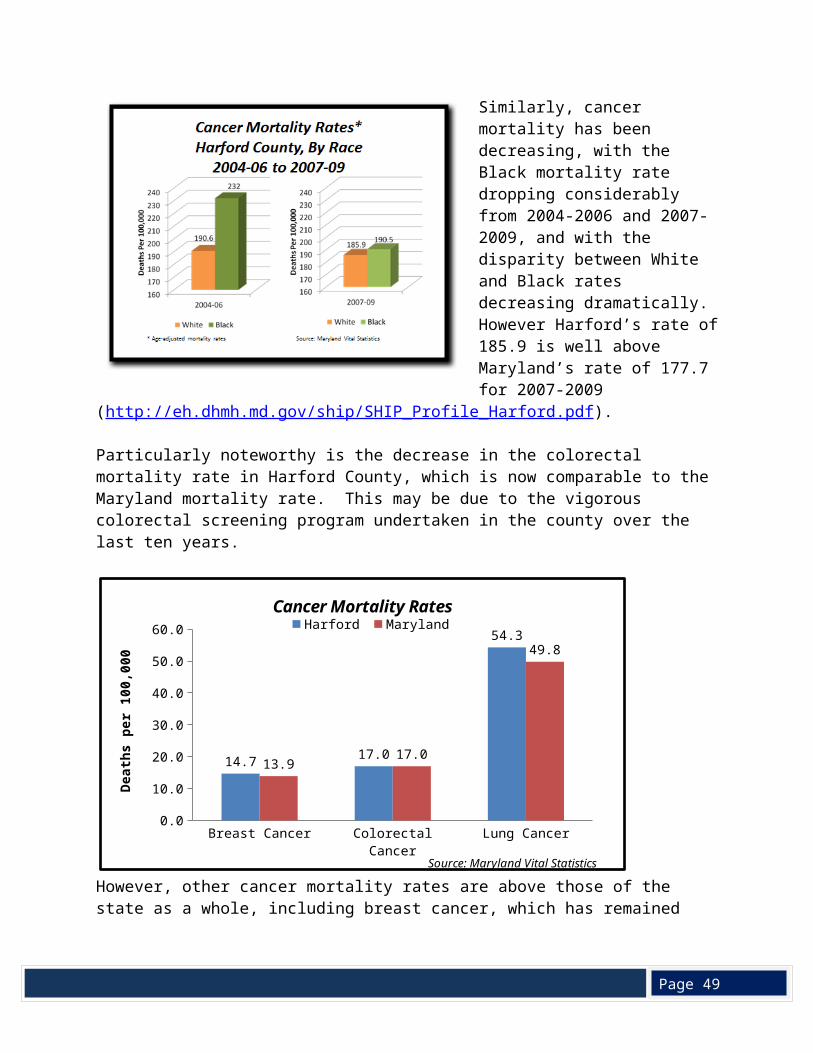
Similarly, cancer mortality has been decreasing, with the Black mortality rate dropping considerably from 2004-2006 and 2007-2009, and with the disparity between White and Black rates decreasing dramatically. However Harford’s rate of 185.9 is well above Maryland’s rate of 177.7 for 2007-2009
(http://eh.dhmh.md.gov/ship/SHIP_Profile_Harford.pdf).
Particularly noteworthy is the decrease in the colorectal mortality rate in Harford County, which is now comparable to the Maryland mortality rate. This may be due to the vigorous colorectal screening program undertaken in the county over the last ten years.
However, other cancer mortality rates are above those of the state as a whole, including breast cancer, which has remained constant between 2004-2007 and 2008-2010, and lung cancer, which has shown less of a decrease than Maryland’s rate.
Breast Cancer Colorectal Cancer Lung Cancer0.0
10.0
20.0
30.0
40.0
50.0
60.0
14.7 17.0
54.3
13.917.0
49.8
Cancer Mortality RatesHarford Maryland
Source: Maryland Vital Statistics
Deat
hs p
er 1
00,0
00
Page 49
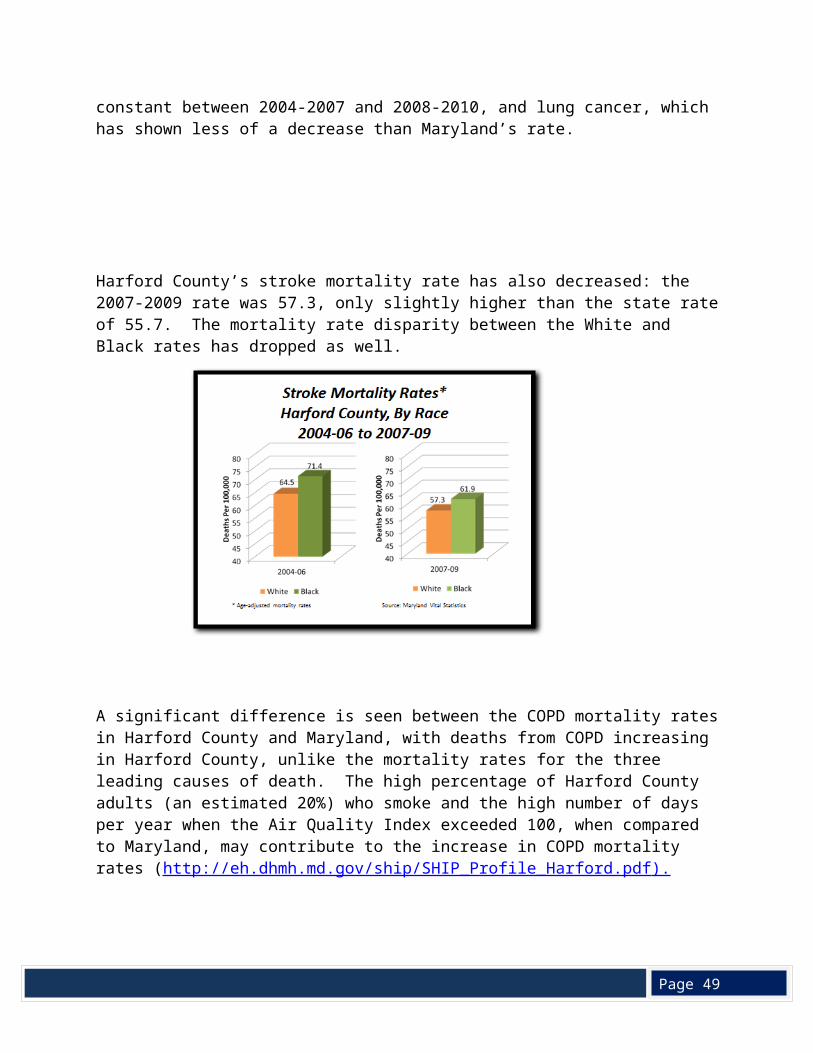
Harford County’s stroke mortality rate has also decreased: the 2007-2009 rate was 57.3, only slightly higher than the state rate of 55.7. The mortality rate disparity between the White and Black rates has dropped as well.
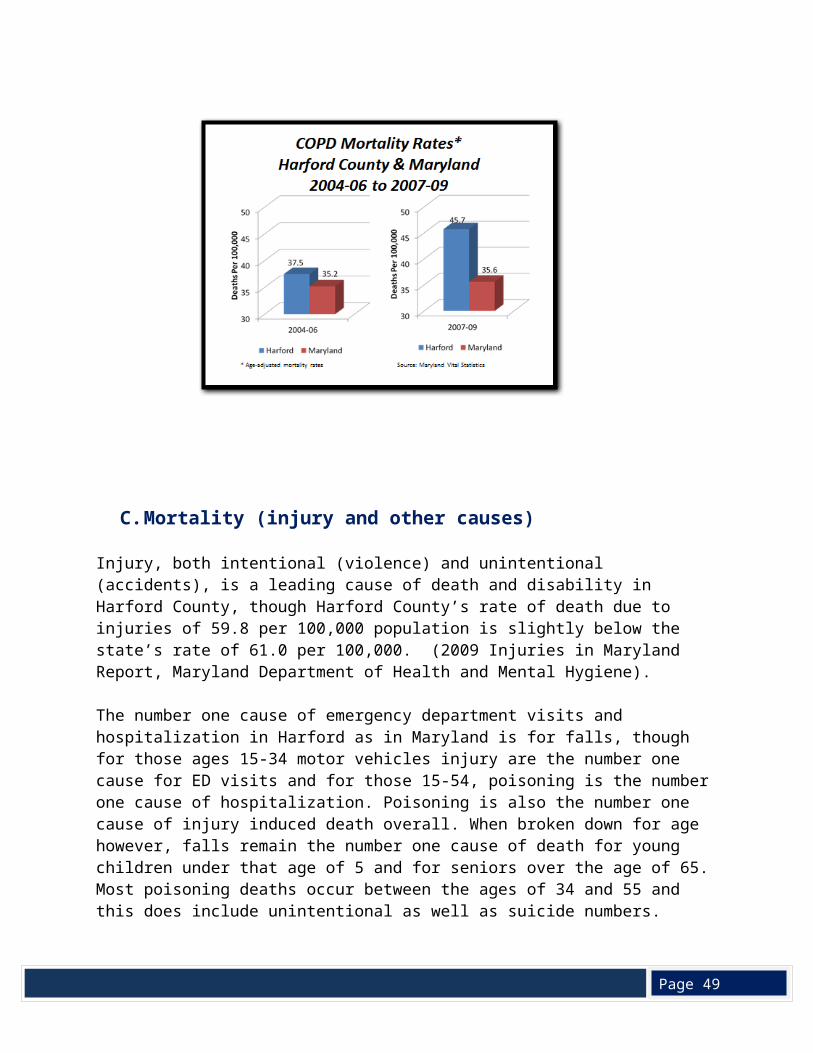
A significant difference is seen between the COPD mortality rates in Harford County and Maryland, with deaths from COPD increasing in Harford County, unlike the mortality rates for the three leading causes of death. The high percentage of Harford County adults (an estimated 20%) who smoke and the high number of days per year when the Air Quality Index exceeded 100, when compared to Maryland, may contribute to the increase in COPD mortality rates (http://eh.dhmh.md.gov/ship/SHIP_Profile_Harford.pdf ).
Page 49
C. Mortality (injury and other causes)
Injury, both intentional (violence) and unintentional (accidents), is a leading cause of death and disability in Harford County, though Harford County’s rate of death due to injuries of 59.8 per 100,000 population is slightly below the state’s rate of 61.0 per 100,000. (2009 Injuries in Maryland Report, Maryland Department of Health and Mental Hygiene).
The number one cause of emergency department visits and hospitalization in Harford as in Maryland is for falls, though for those ages 15-34 motor vehicles injury are the number one cause for ED visits and for those 15-54, poisoning is the number one cause of hospitalization. Poisoning is also the number one cause of injury induced death overall. When broken down for age however, falls remain the number one cause of death for young children under that age of 5 and for seniors over the age of 65. Most poisoning deaths occur between the ages of 34 and 55 and this does include unintentional as well as suicide numbers.
According to the Children's Safety Network, bicycle helmets prevent 52 to 60 percent of bike-related head injury deaths (for all ages), as well as an estimated 68 to 85 percent of nonfatal head and scalp injuries, and 65 percent of upper and middle face injuries, even when misuse is considered. As bicycle helmets significantly reduce the total medical costs for bike-related head injuries HealthLink, in partnership with the Greg Krause Helmet Foundation and the Harford County Health Department, provides free child helmets and free helmet fittings in the community.
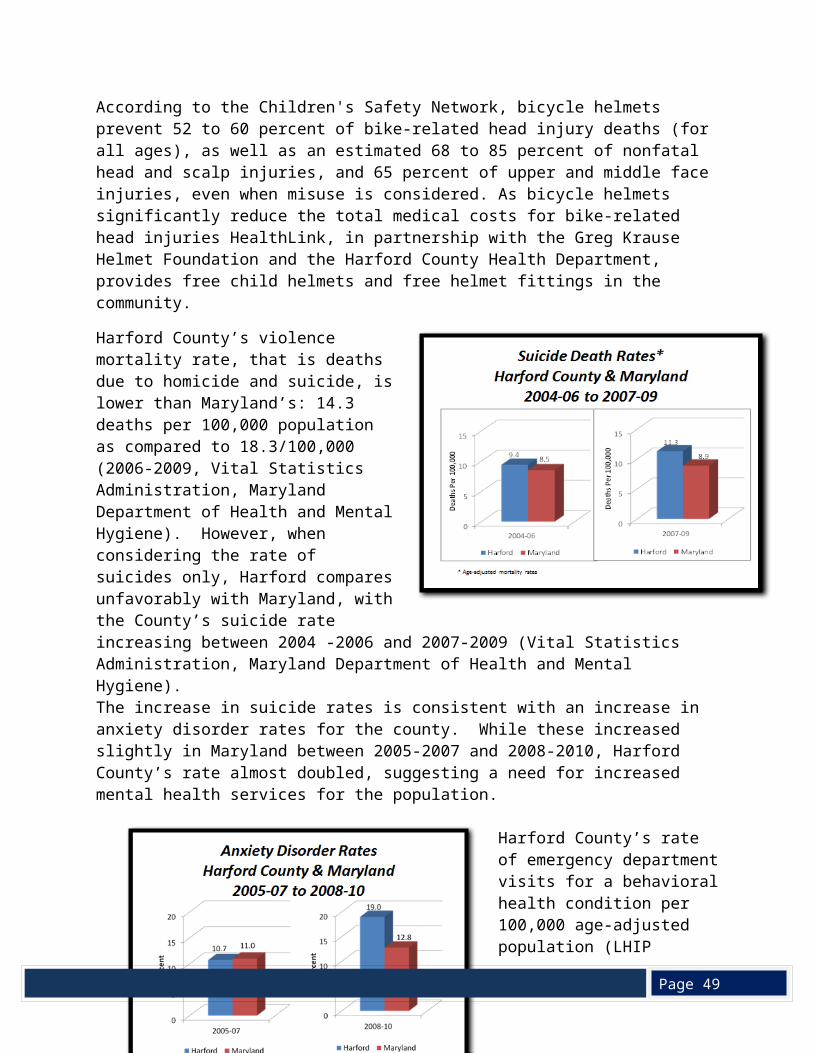
Harford County’s violence mortality rate, that is deaths due to homicide and suicide, is lower than Maryland’s: 14.3 deaths per 100,000 population as compared to 18.3/100,000 (2006-2009, Vital Statistics Administration, Maryland Department of Health and Mental Hygiene). However, when considering the rate of suicides only, Harford compares unfavorably with Maryland, with the County’s suicide rate increasing between 2004 -2006 and 2007-2009 (Vital Statistics Administration, Maryland Department of Health and Mental Hygiene).The increase in suicide rates is consistent with an increase in anxiety disorder rates for the county. While these increased slightly in Maryland between 2005-2007 and 2008-2010, Harford County’s rate almost doubled, suggesting a need for increased mental health services for the population.
Harford County’s rate of emergency department visits for a
Page 49
behavioral health condition per 100,000 age-adjusted population (LHIP objective 34) is 1,243.7 in comparison with the Maryland rate of 1,206.3, indicating that county residents are more likely to go to the hospital with behavioral health problems (Health Services Cost Review Commission, 2010).
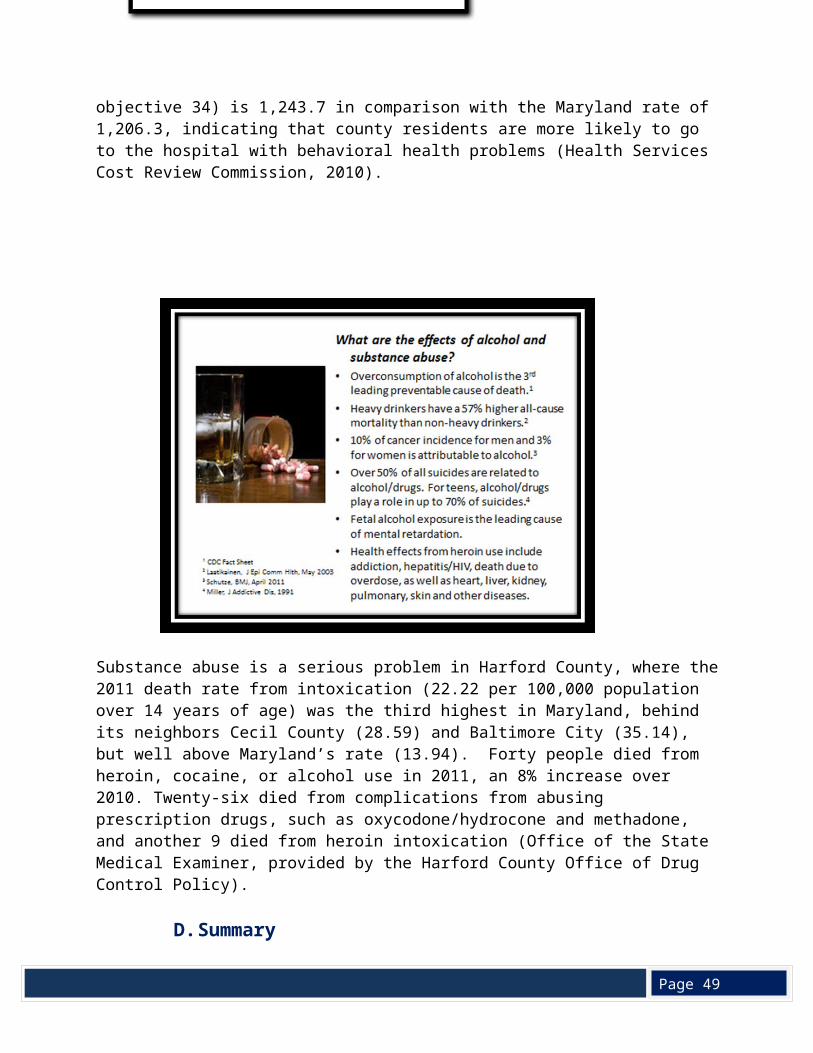
Substance abuse is a serious problem in Harford County, where the 2011 death rate from intoxication (22.22 per 100,000 population over 14 years of age) was the third highest in Maryland, behind its neighbors Cecil County (28.59) and Baltimore City (35.14), but well above Maryland’s rate (13.94). Forty people died from heroin, cocaine, or alcohol use in 2011, an 8% increase over 2010. Twenty-six died from complications from abusing prescription drugs, such as oxycodone/hydrocone and methadone, and another 9 died from heroin intoxication (Office of the State Medical Examiner, provided by the Harford County Office of Drug Control Policy).
D. Summary
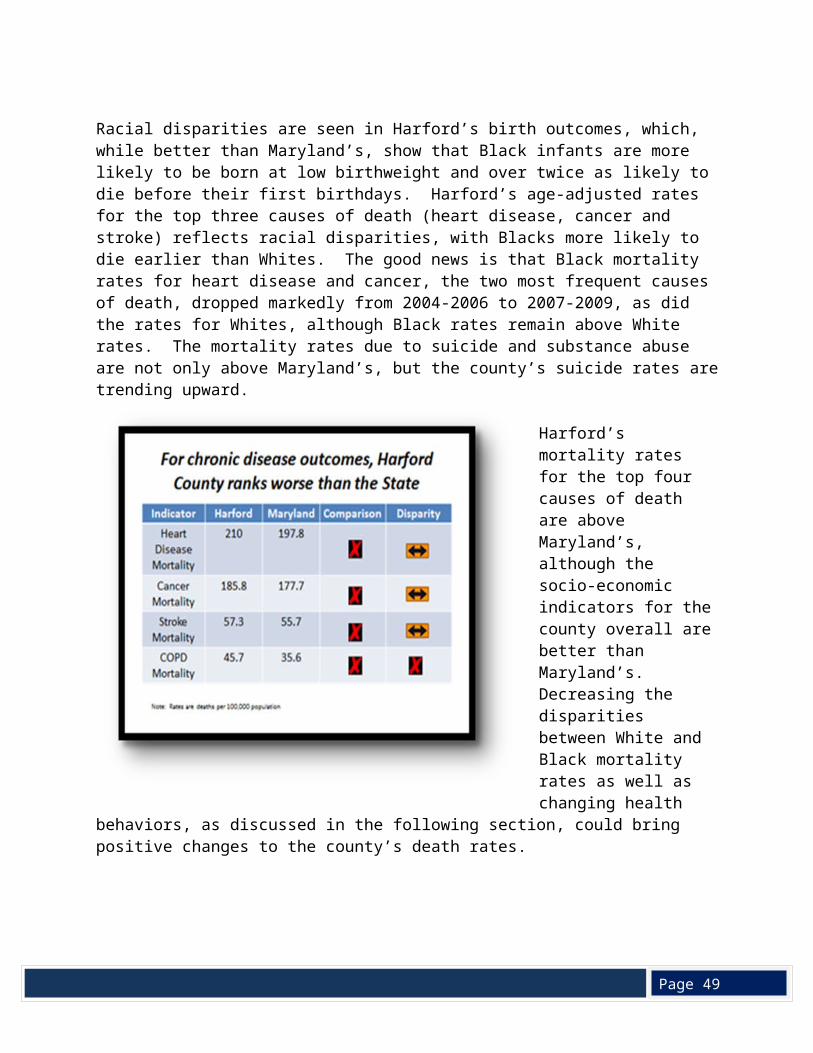
Racial disparities are seen in Harford’s birth outcomes, which, while better than Maryland’s, show that Black infants are more likely to be born at low birthweight and over twice as likely to die before their first birthdays. Harford’s age-adjusted rates for the top three causes of death (heart disease, cancer and stroke) reflects racial disparities, with Blacks more likely to die earlier than Whites. The good news is that Black mortality rates for heart disease and cancer, the two most frequent causes of death, dropped markedly from 2004-2006 to 2007-2009, as did the
Page 49
rates for Whites, although Black rates remain above White rates. The mortality rates due to suicide and substance abuse are not only above Maryland’s, but the county’s suicide rates are trending upward.
Harford’s mortality rates for the top four causes of death are above Maryland’s, although the socio-economic indicators for the county overall are better than Maryland’s. Decreasing the disparities between White and Black mortality rates as well as changing health behaviors, as discussed in the following section, could bring positive changes to the county’s death rates.
V. Health Behaviors
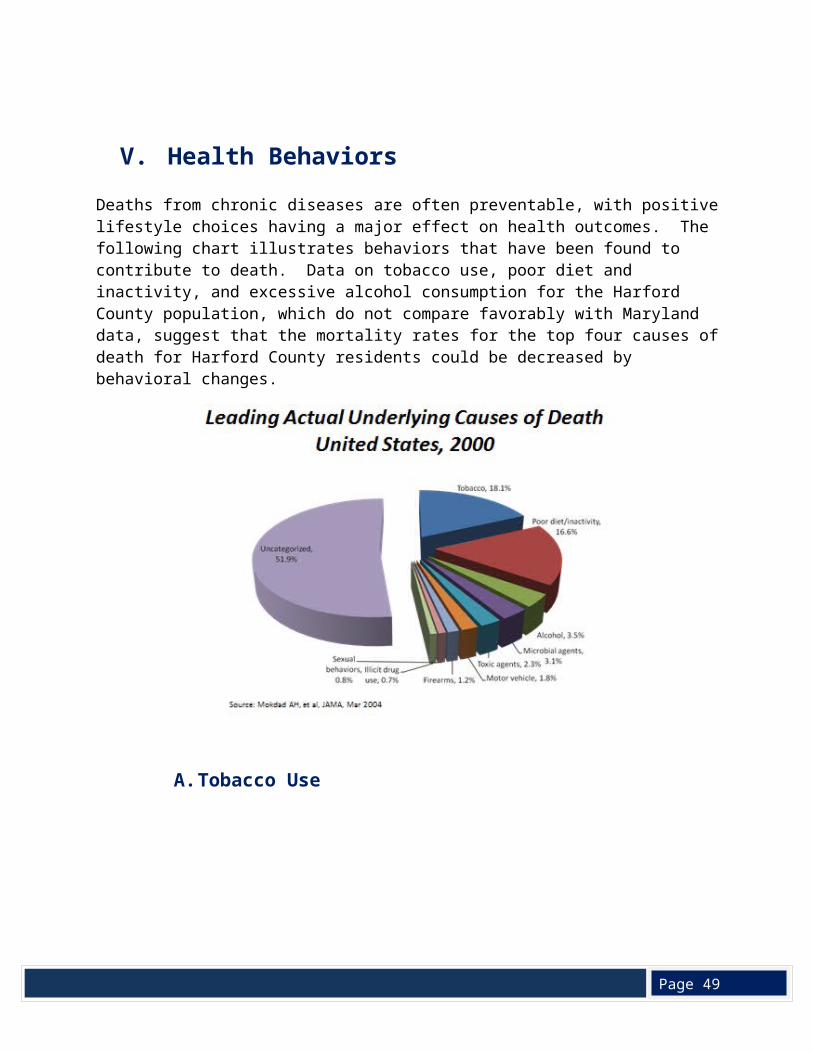
Deaths from chronic diseases are often preventable, with positive lifestyle choices having a major effect on health outcomes. The following chart illustrates behaviors that have been found to contribute to death. Data on tobacco use, poor diet and inactivity, and excessive alcohol consumption for the Harford County population, which do not compare favorably with Maryland data, suggest that the mortality rates for the top four causes of death for Harford County residents could be decreased by behavioral changes.
Page 49
A. Tobacco Use
Page 49
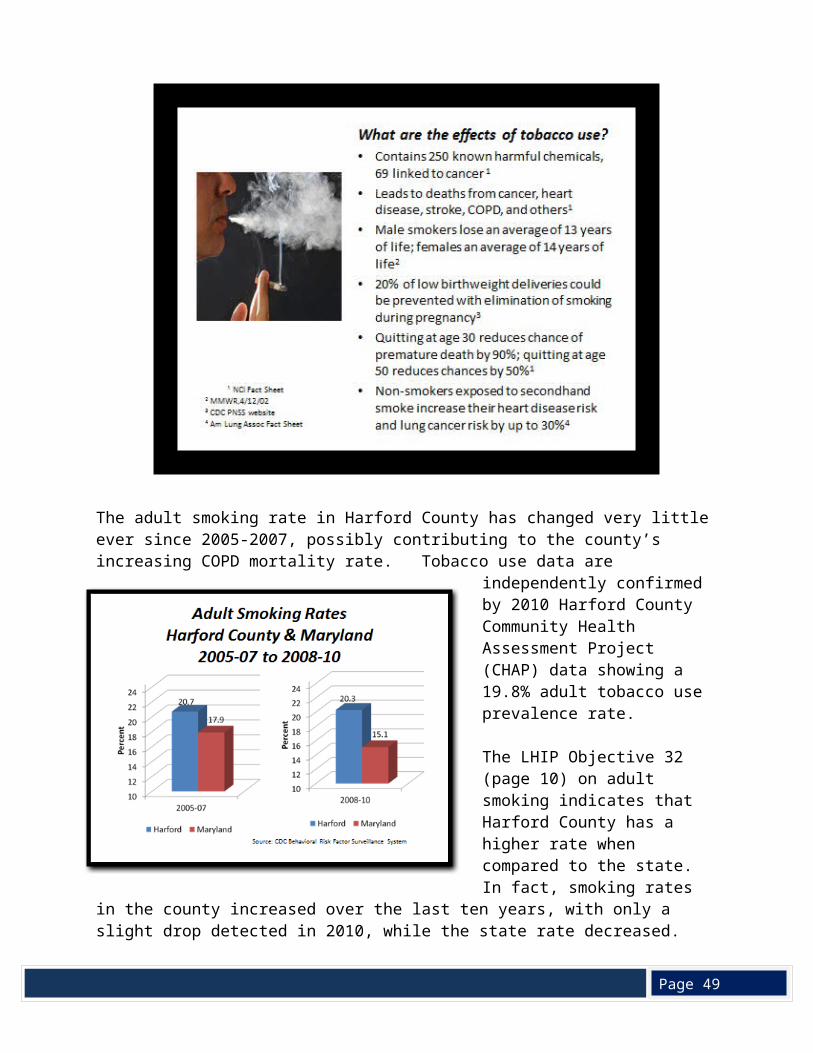
The adult smoking rate in Harford County has changed very little ever since 2005-2007, possibly contributing to the county’s increasing COPD mortality rate. Tobacco use data are independently confirmed by 2010 Harford County Community Health Assessment Project (CHAP) data showing a 19.8% adult tobacco use prevalence rate.
The LHIP Objective 32 (page 10) on adult smoking indicates that Harford County has a higher rate when compared to the state. In fact, smoking rates in the county increased over the last ten years, with only a slight drop detected in 2010, while the state rate decreased.
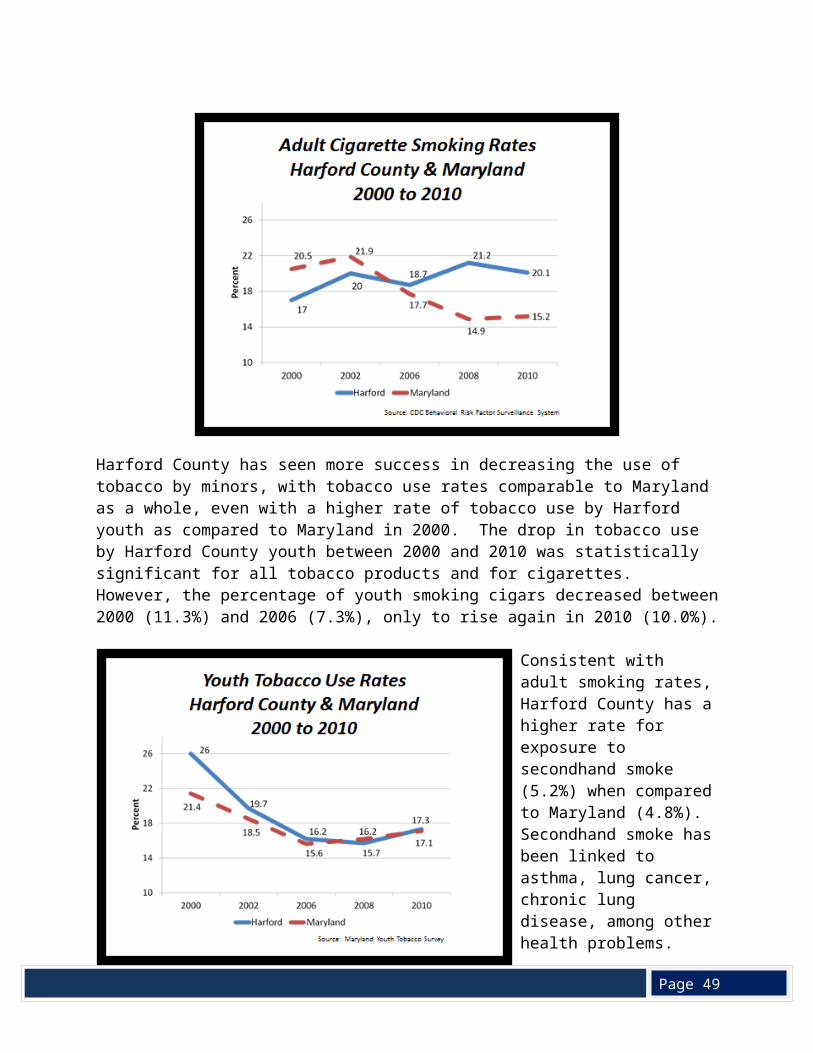
Harford County has seen more success in decreasing the use of tobacco by minors, with tobacco use rates comparable to Maryland as a whole, even with a higher rate of tobacco use by Harford youth as compared to Maryland in 2000. The drop in tobacco use by Harford County youth between 2000 and 2010 was statistically significant for all tobacco products and for cigarettes. However, the percentage of youth smoking cigars decreased between 2000 (11.3%) and 2006 (7.3%), only to rise again in 2010 (10.0%).
Page 49
Consistent with adult smoking rates, Harford County has a higher rate for exposure to secondhand smoke (5.2%) when compared to Maryland (4.8%). Secondhand smoke has been linked to asthma, lung cancer, chronic lung disease, among other health problems.
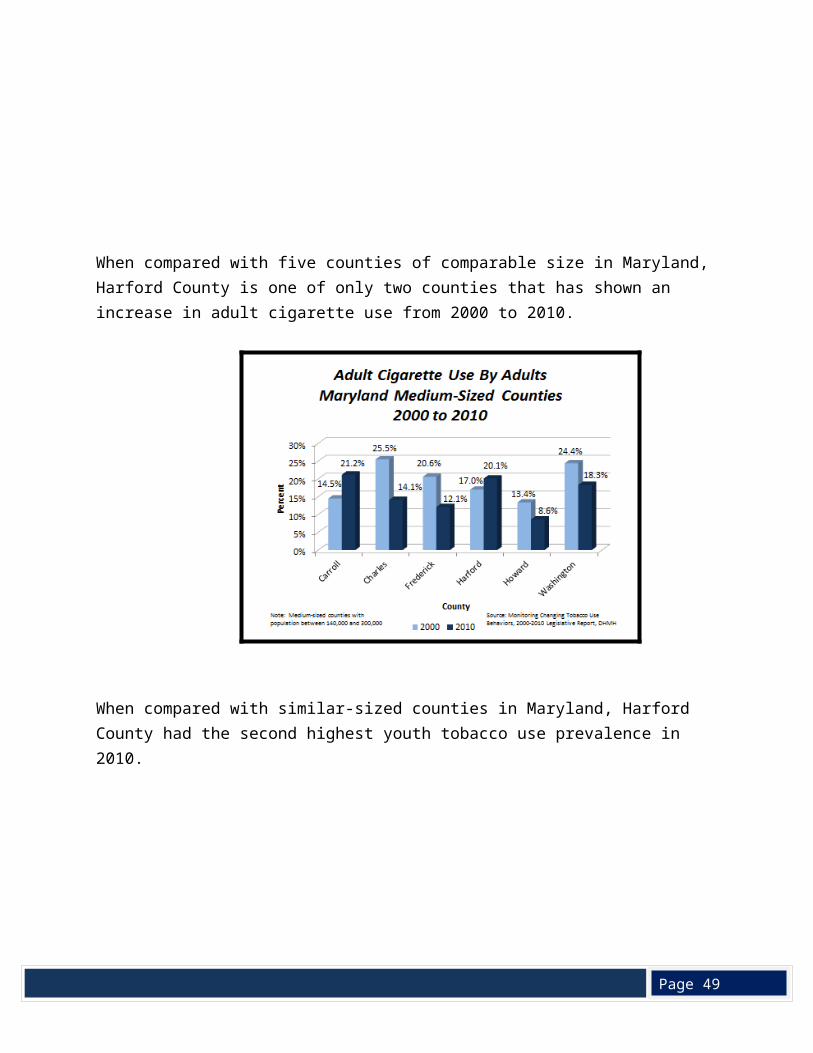
When compared with five counties of comparable size in Maryland, Harford County is one of only two counties that has shown an increase in adult cigarette use from 2000 to 2010.
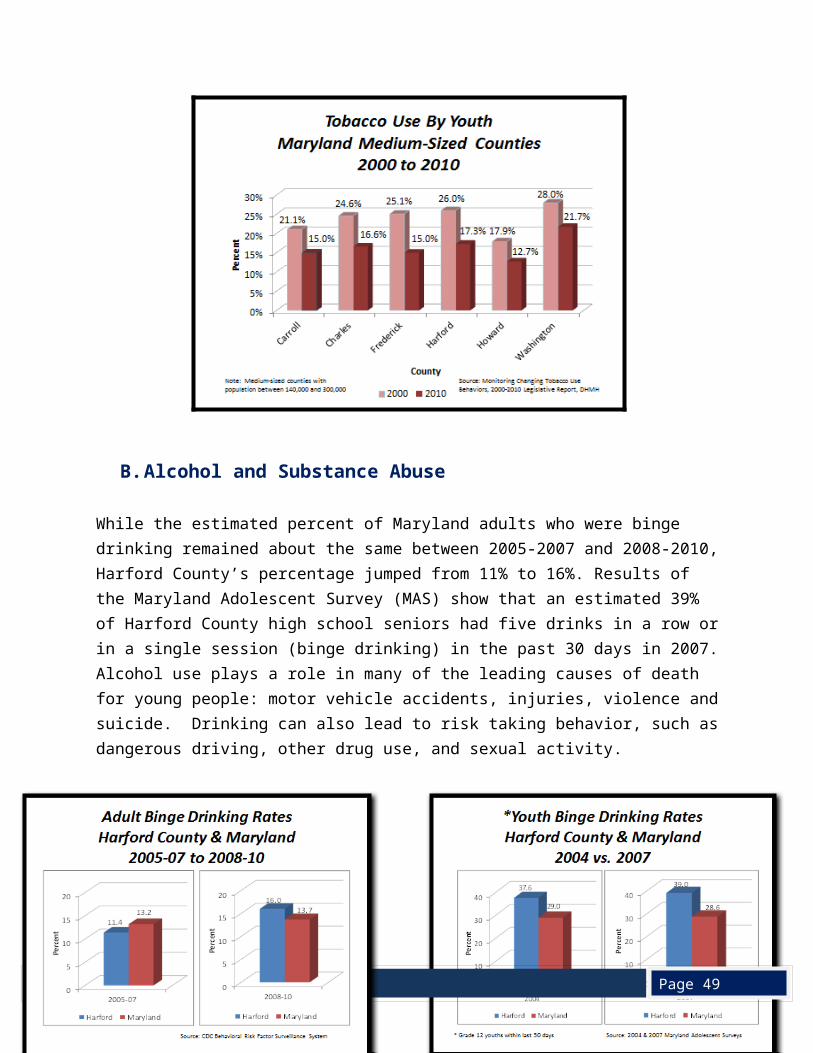
When compared with similar-sized counties in Maryland, Harford County had the second highest youth tobacco use prevalence in 2010.
Page 49
B. Alcohol and Substance Abuse
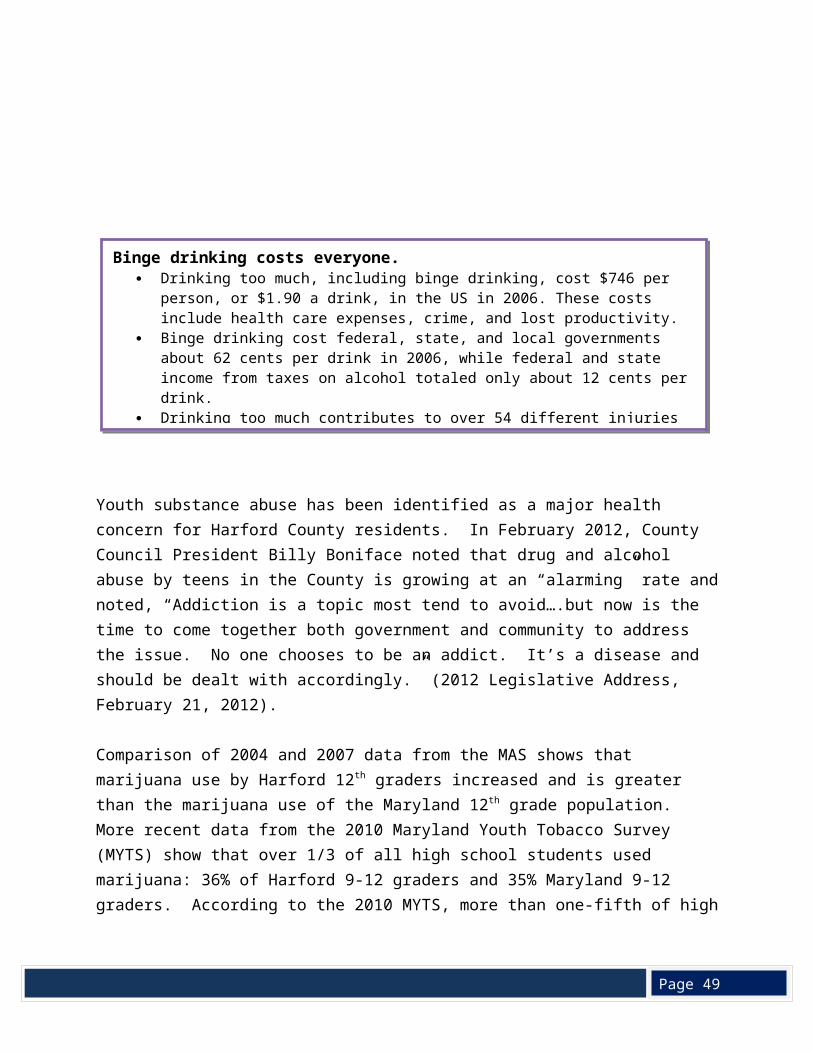
While the estimated percent of Maryland adults who were binge drinking remained about the same between 2005-2007 and 2008-2010, Harford County’s percentage jumped from 11% to 16%. Results of the Maryland Adolescent Survey (MAS) show that an estimated 39% of Harford County high school seniors had five drinks in a row or in a single session (binge drinking) in the past 30 days in 2007. Alcohol use plays a role in many of the leading causes of death for young people: motor vehicle accidents, injuries, violence and suicide. Drinking can also lead to risk taking behavior, such as dangerous driving, other drug use, and sexual activity.
Page 49
Youth substance abuse has been identified as a major health concern for Harford County residents. In February 2012, County Council President Billy Boniface noted that drug and alcohol abuse by teens in the County is growing at an “alarming” rate and noted, “Addiction is a topic most tend to avoid….but now is the time to come together both government and community to address the issue. No one chooses to be an addict. It’s a disease and should be dealt with accordingly.” (2012 Legislative Address, February 21, 2012).
Comparison of 2004 and 2007 data from the MAS shows that marijuana use by Harford 12th graders increased and is greater than the marijuana use of the Maryland 12th grade population. More recent data from the 2010 Maryland Youth Tobacco Survey (MYTS) show that over 1/3 of all high school students used marijuana: 36% of Harford 9-12 graders and 35% Maryland 9-12 graders. According to the 2010 MYTS, more than one-fifth of high school students in Harford (23%) and in Maryland (22%) used marijuana during the past 30 days.
Binge drinking costs everyone. Drinking too much, including binge drinking, cost $746 per person, or $1.90 a drink, in the
US in 2006. These costs include health care expenses, crime, and lost productivity. Binge drinking cost federal, state, and local governments about 62 cents per drink in
2006, while federal and state income from taxes on alcohol totaled only about 12 cents per drink.
Drinking too much contributes to over 54 different injuries and diseases, including car crashes, violence, and sexually-transmitted diseases.
The chance of getting sick and dying from alcohol problems increases significantly for those who binge drink more often and drink more when they do.
Page 49
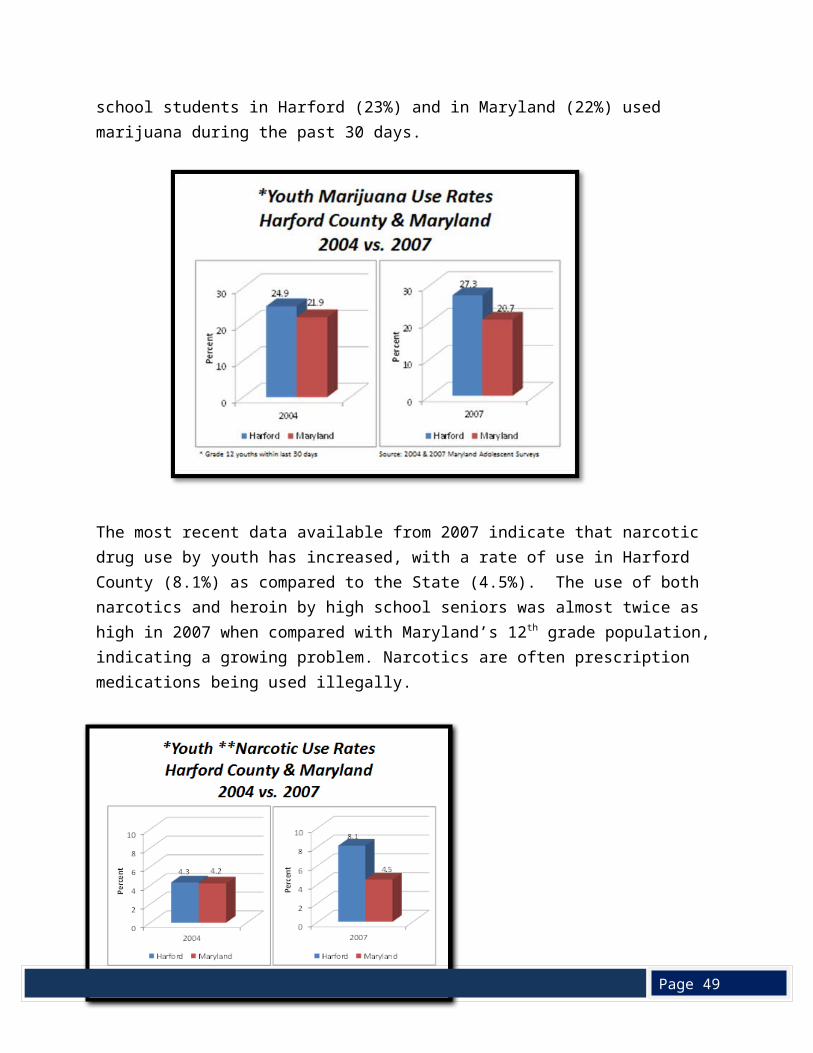
The most recent data available from 2007 indicate that narcotic drug use by youth has increased, with a rate of use in Harford County (8.1%) as compared to the State (4.5%). The use of both narcotics and heroin by high school seniors was almost twice as high in 2007 when compared with Maryland’s 12th grade population, indicating a growing problem. Narcotics are often prescription medications being used illegally.
Substance abuse is associated with an increased risk for chronic disease, unsafe health behaviors such as high-risk sexual behaviors, unintentional injury and mental health problems.
Many other problems for youngsters can also be attributed to substance abuse: absenteeism from school, academic difficulties, poor judgement, as well as long-lasting medical and legal consequences. According to 2011 data for Harford County, provided by the Maryland Department of Juvenile Justice, 159 juveniles were arrested for offenses involving controlled dangerous substances (CDS), and 84 were arrested for alcohol related offenses. Over 50% of the juveniles arrested for CDS offenses were from the Bel Air and Edgewood communities, while 42% of those arrested on charges involving alcohol were from these two communities.
C. Obesity
Page 49
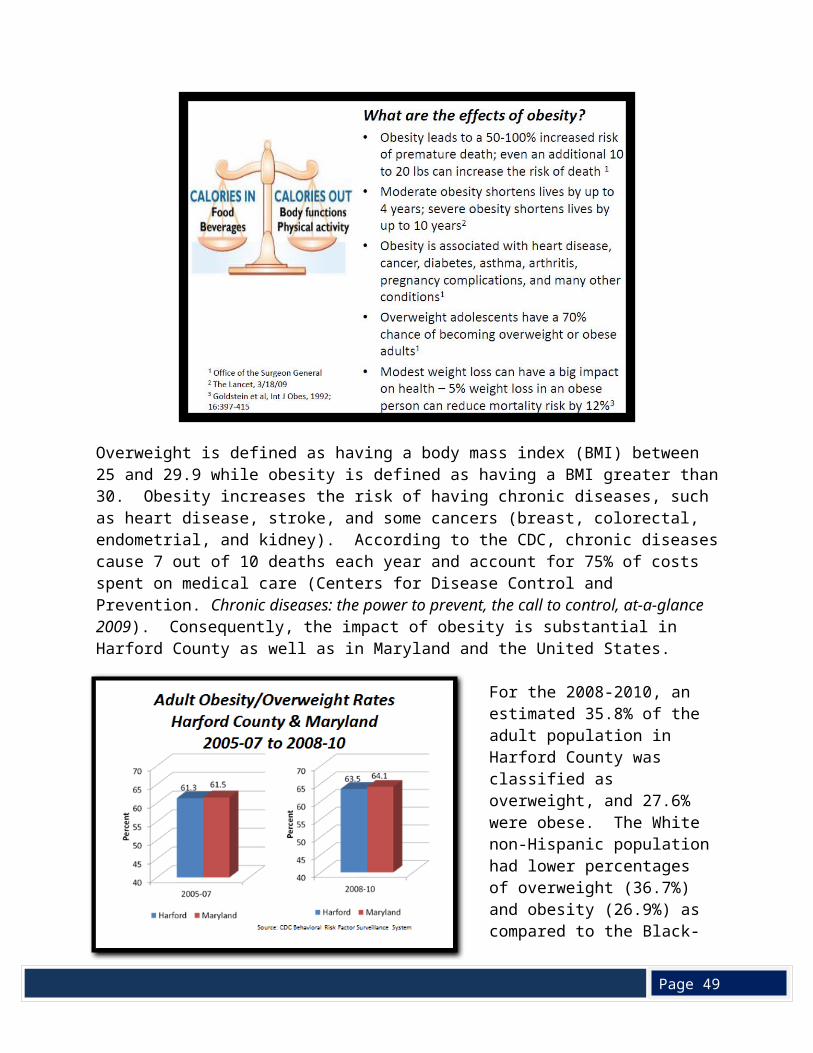
Overweight is defined as having a body mass index (BMI) between 25 and 29.9 while obesity is defined as having a BMI greater than 30. Obesity increases the risk of having chronic diseases, such as heart disease, stroke, and some cancers (breast, colorectal, endometrial, and kidney). According to the CDC, chronic diseases cause 7 out of 10 deaths each year and account for 75% of costs spent on medical care (Centers for Disease Control and Prevention. Chronic diseases: the power to prevent, the call to control, at-a-glance 2009). Consequently, the impact of obesity is substantial in Harford County as well as in Maryland and the United States.
For the 2008-2010, an estimated 35.8% of the adult population in Harford County was classified as overweight, and 27.6% were obese. The White non-Hispanic population had lower percentages of overweight (36.7%) and obesity (26.9%) as compared to the Black-non-Hispanic population (42.4% overweight, 33% obese) (CDC Behavioral Risk Factor Surveillance System).
Type 2 diabetes, which accounts for about 90% to 95% of all diagnosed cases of diabetes, is associated with obesity. African Americans, Hispanic/Latino Americans, American Indians, and
overweight obese0.0%5.0%
10.0%15.0%20.0%25.0%30.0%35.0%40.0%45.0%
Males42.5%
Males30.0%
Females30.5% Females
22.3%
Page 49
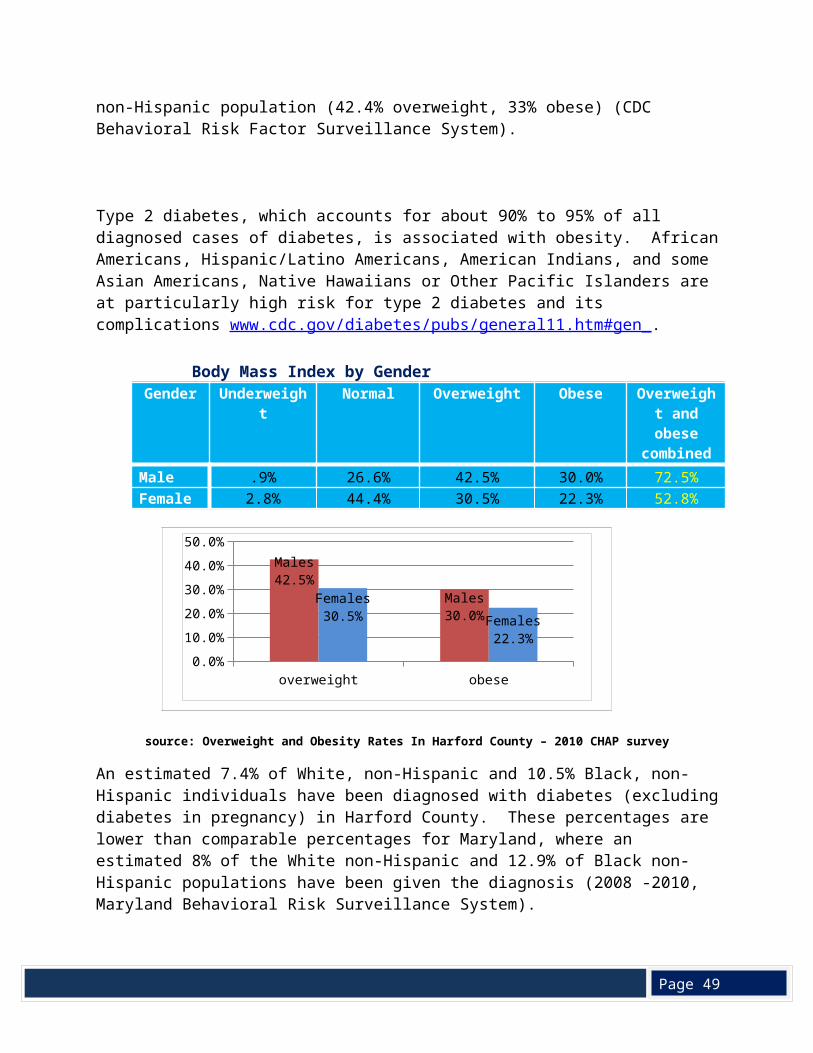
some Asian Americans, Native Hawaiians or Other Pacific Islanders are at particularly high risk for type 2 diabetes and its complications www.cdc.gov/diabetes/pubs/general11.htm#gen_. Body Mass Index by Gender
Gender Underweight Normal Overweight Obese Overweight and obese combined
Male .9% 26.6% 42.5% 30.0% 72.5%Female 2.8% 44.4% 30.5% 22.3% 52.8%
source: Overweight and Obesity Rates In Harford County – 2010 CHAP survey
An estimated 7.4% of White, non-Hispanic and 10.5% Black, non-Hispanic individuals have been diagnosed with diabetes (excluding diabetes in pregnancy) in Harford County. These percentages are lower than comparable percentages for Maryland, where an estimated 8% of the White non-Hispanic and 12.9% of Black non-Hispanic populations have been given the diagnosis (2008 -2010, Maryland Behavioral Risk Surveillance System).
This data is similar to 2010 CHAP data that reports the rate of adult diabetes in Harford County as 11.4%, up from 7.9% in 2005. The males report a higher rate of diabetes than females until the age of 60 when the rates balance out at 30% for both males and females.
diabetes0.0%2.0%4.0%6.0%8.0%
10.0%12.0%14.0%16.0%
Males15.1%
Females8.1%
Source: 2010 CHAP Survey
Page 49
The Maryland Youth Tobacco Survey (MYTS), conducted biannually in public middle and high schools in Maryland to assess the prevalence of risk factors and behaviors, provides data on obesity in 12 – 18 year olds. The survey asks about the height and weight of the respondent, and these values are used to determine overweight and obesity. Overweight and Obese are determined by measuring BMI-for-age, a Centers for Disease Control and Prevention (CDC) methodology that takes into account a youth's height, weight, gender, and age in months.
The results of the MYTS indicate that, in 2010, an estimated 9.8% of Harford County youth were obese as compared to 11.6% of Maryland youth. Black youth had higher percentages of obesity in both Harford County and Maryland.
Estimated Percentage of Obesity for Middle and High School Students Harford County and Maryland, 2010
Middle and High School Students Harford County Maryland
Total middle and high school 9.8% 11.6%Total Female 7.2% 9.2%Total Male 12.5% 14.1%White 8.2% 8.7%Black 15.2% 15.1%Hispanic 12.3% 13.9%
Source: 2010 Maryland Youth Tobacco Survey, Maryland Department of Health and Mental HygieneEstimates on the rates of overweight and obesity for children aged two through four are available from the Centers for Disease Control’s Pediatric Nutrition Surveillance System (PedNSS), using data from the federally funded Special Nutrition Program for Women, Infants and Children (WIC). The most recent data available, from the 2010 PedNSS, show that 17.4% of Harford County WIC participants 2-4 years of age were overweight and 13.6% were obese, as compared to the Maryland results of 16.5% overweight and 15.7% obese.
The following bar chart shows data from the 2009 PedNSS report to compare the prevalence of obesity and overweight for preschool WIC participants for the counties, Maryland and the United States.
Page 49
The PedNSS analysis is for a selected population of children: WIC participants must be income eligible (185% or less of the poverty level) and have a nutritional risk in order to be enrolled in the program. However, these data are consistent with the national increase in the rates of overweight and obesity, even the very young, bringing risk factors for cardiovascular disease, Type 2 diabetes, sleep apnea, asthma and psychosocial consequences (such as social discrimination) (Childhood Overweight, What Research Tells Us, Center for Health and Health Care in Schools, September 2007).A number of explanations have been posited about why obesity is now at epidemic proportions. In 2001, the Surgeon General’s Call to Action noted that poor eating habits and physical inactivity contribute to increased levels of overweight and obesity (U.S. Department of Health and Human Services, The Surgeon General’s Call to Action to Prevent and DecreaseOverweight and Obesity. 2001).
The 2008 Guidelines, science-based guidance to help Americans improve their health, recommends that adults do at least 150 minutes of moderate intensity or 75 minutes of vigorous intensity physical activity per week or an equivalent combination of the two (Centers for Disease Control and Prevention, State Indicator Report on Physical Activity, 2010 National Action Guide). Slightly more than one-third of Harford County’s adults exercise as recommended by federal guidelines, a slightly higher percentage than Maryland.
Page 49
Eating fruits and vegetables contribute to a healthy diet. However, only one-fourth of Harford County adults eat the recommended five or more fruits and vegetables a day, a smaller percentage than the Maryland population.
D. Summary
Obesity, tobacco use and behavioral health stand out as three significant health problems affecting Harford County. The percentage of overweight/obese adults in Harford County is similar to the state, and the percentages of county adults who meet the physical activity guidelines and eat the recommended daily amount of fruits and vegetables are both abismally as low. The percent of Harford County’s adults who use tobacco, is well above the state average, with youth rates also slightly above the
state average. Tobacco use and obesity contribute to chronic disease, and the mortality rate from heart disease, cancer, and COPD for Harford residents is above the rate for Maryland.
Substance abuse, both alcohol and illegal drugs, is a major problem in the county, as illustrated by a death rate from intoxication that is the third highest in the state. Suicide rates are also climbing, suggesting that behavioral health is a significant public health problem.
Page 49
VI. Access to Health Care
A. Health Insurance coverage
Access to health care takes into consideration the ability of a person to receive health care services, a function of the availability of the services, and whethe@! r or not the person can pay for services. Lack of health insurance often keeps people from accessing needed health care, which can lead to serious health problems. Indeed, for adults under the age of 64, not having health insurance is associated with increased mortality (Health Insurance and Mortality in US Adults, Andrew P. Wilper, MD, MPH, Steffie Woolhandler, MD, MPH, Karen E. Lasser, MD, MPH, Danny McCormick, MD, MPH, David H. Bor, MD, and David U. Himmelstein, MD, American Journal of Public Health, 2009).
In Harford County, an estimated 7% of the population does not have health insurance coverage, compared to 11.3% at the State level. Locally 10% of adults between the ages of 18 and 64 years lacking insurance as compared to Maryland where 15.5% of adults between the ages of 18 to 64 are uninsured (2010 American Community Survey 1-Year Estimates, U. S. Census Bureau).
Of the various population groups in Harford County, the Hispanic or Latino population has the highest proportion of uninsured individuals (16.3%), but this is still better than the estimated rate of 35% of Hispanic or Latino population in Maryland who lack health insurance. No surprisingly, since insurance is often tied to employment, Harford’s White population has a lower percentage of uninsured (6.1%), when compared to the Black or African American population (12.9%) (2010 American Community Survey 1-Year Estimates, U. S. Census Bureau).
In 2008-2010, one out of every 10 Harford County adults between the ages of 18 and 64 could not afford to see a doctor, an increase over 2005-2007.
Page 49
Less than three-fourths of adults between the ages of 18 and 64 years had a dental visit in 2008-2010, comparable to Maryland and a slightly lower percentage than 2005-2007.
Harford County’s LHIP objective 38 measuring, “the percentage of children 4-20 years enrolled in Medicaid that received a dental service visit in the past year” (CY 2009 Medicaid data) indicates that, 58.2% Medicaid children received a dental visit, only slightly lower than Maryland’s 59% (http://eh.dhmh.md.gov/ship/SHIP_Profile_Harford.pdf).
B. Availability of Preventive Health Services
UCH provides free community wide colorectal screenings on an annual basis. HealthLink also works cooperatively with the HCHD to help eligible patients receive free colorectal and breast cancer screenings via grant funding (since 2001) from the Maryland Tobacco Fund Program. The county has had a decrease in colorectal cancer deaths in 2007-2009, although breast cancer death rates have remained unchanged and are slightly above the Maryland rate.
The county lags behind in the percentage of colonoscopies and mammography screenings performed in 2008-2010 although the percentage of colonoscopy screenings has increased. In 2012, Upper Chesapeake Health was awarded a grant from the American Cancer Society to improve tracking of mammogram screenings for women enrolled with the HealthLink Primary
Page 49
Care Clinic, as well as fund additional access to screenings for those women not eligible under the Health Department program.
Both Upper Chesapeake Health and the Harford County Health Department sponsor influenza immunization clinics for adults. Vaccination rates increased in 2008-2010, as compared to 2005-2007, although the rate remains lower than Maryland’s,
(http://eh.dhmh.md.gov/ship/SHIP_Profile_Harford.pdf). Conversely, Harford County leads all other Maryland jurisdictions in childhood influenza vaccination rates due to a cooperative partnership involving the Harford County Public Schools that allows for an in- school vaccination program.
Page 49
C. Access to Medical and Dental Care
When health care providers are not available in a geographic area, the federal government can designate the area as a Health Professional Shortage Area (HPSA), which makes the area eligible for additional resources including health care providers who are on a special immigration program through the J1Visa Waiver Program, who are funded through the National Health Services Corps, or who participate in the dental or physician Loan Assistance Repayment Programs. In addition, providers may be entitled to enhanced Medicare and Medicaid reimbursements (http://fha.dhmh.maryland.gov/ohpp/docs/HPSA_Factsheet.pdf).
The ratio of population to primary care provider (1 provider for every 1,713 residents) in Harford County is similar to Maryland’s. The number by itself does not represent a shortage of physicians. However, four southern census tracts running along the boundary of the Aberdeen Proving Ground have been included in a health HPSA due to a lack of accessible primary care in that area (Map 5, Appendix). Also, while it appears that there is an adequate number of dentists to provide care to county residents (1 dentist for every 1,662 residents) when compared to the Maryland ratio, the southern portion of the county, bordering Aberdeen Proving Grounds, is a Medicaid eligible HPSA for dental professionals, meaning that there are not enough Medicaid providers to meet the needs of the Medicaid population (W#Map 6, Appendix).
Page 49
Source: Maryland 2004 Claritas; 2006-2007 Maryland Board of Physicians; 2008 Maryland State Board of Dental Examiners. Data provided by the Maryland Primary Care Organization, 7/1/10
As reflected in the bar chart above, there is a ratio of one mental health professional to every 44,354 residents in Harford County. State-wide this ratio is one mental health professional to every 12,253 residents. This lack of mental health service providers has resulted in the federal designation of Harford County as a mental health HPSA.
Because access to medical services in the southern portion of Harford County is a problem, the County submitted an application to the U.S. Health Services and Resources Administration, Health and Human Services requesting designation of four census tracts in the south as medically underserved, so that the area would be eligible for a Federally Qualified Health Center (http://bhpr.hrsa.gov/shortage/hpsas/designationcriteria/primarycarehpsaoverview.html).
The Department of Health and Mental Hygiene, Maryland Primary Care Organization, in partnership with Healthy Harford and Upper Chesapeake Health, documented that the tracts highlighted in red on the map below demonstrated a qualifying Index of Medical Underservice (IMU) in the four measured variables - ratio of primary medical care physicians per 1,000 population, infant mortality rate, percentage of the population with incomes below the poverty level, and percentage of the population age 65 or over. The IMU score received by these four census tracts enabled the area to receive a Governor’s exception Medically Underserved
Page 49
Population federal designation. With this designation, the area is now eligible to establish a Federally Qualified Health Center (FQHC), a federally subsidized primary care medical facility that offers affordable care on a sliding fee scale.
Presently, primary care for the low income population is available on a sliding fee scale through the Upper Chesapeake HealthLink Primary Care Clinic (UC HealthLink PCC), funded by the Upper Chesapeake Health Foundation and supported by Upper Chesapeake Health Systems. The UC HealthLink PCC provides primary care to adults ages 19 and above who are uninsured or underinsured and are at or below 300% of the federal poverty level. In addition to primary care, the clinic offers on-site mental health counseling by a licensed social worker, diabetes education, medication assistance, and access to specialty care on a sliding scale basis via a cooperative community Specialty Care Network. In-person Spanish language interpretive services are also available. In addition to the stationary clinic, HealthLink also operates a mobile medical van which offers primary care clinics on a rotating basis at different locations throughout the county. The van is also used to provide biometric screenings such as blood pressure, cholesterol, and body fat, at various locations and community events
Page 49
(http://www.uchs.org/?section=healthlink&page=about_healthlink). At this time, the only FQHC services available in Harford County are those supported through a small targeted grant as part of Maryland’s Healthcare for the Homeless program. The UC HealthLink PCC serves as a Healthcare for the Homeless extension site, and serves Harford County’s homeless population both at the stationary clinic and through monthly mobile medical van clinics at the overnight homeless shelter in Belcamp.
The Harford County Health Department provides additional safety net programs for the county’s most vulnerable populations (http://www.harfordcountyhealth.com/), including an HIV/AIDS clinic, homeless persons case management, sliding fee scale family planning services, pediatric dental care for children receiving Medicaid, immunizations, school based health centers, insurance coverage for income-eligible breast and cervical cancer patients, and addiction services for adolescents and adults. Upper Chesapeake Health, the Harford County Health Department, Harford County’s Department of Community Services, the Harford County Public Schools, and many other organizations work collaboratively to help provide safety net services for the communities most vulnerable residents.
D. Access to Healthy Food
Healthy foods are an essential component in maintaining a healthy weight and overall well-being. Lack of access to nutritious foods has been associated with obesity and other health problems. The Harford Obesity Task Force Access to Food workgroup collaborated with the Harford County Department of Community Services (DCS) in assessing food access for low and moderate income populations. These groups also mapped access to subsidized food resources such as food banks and soup kitchens. Most of the subsidized food resources were located in the southern part of the county which houses the highest proportion of low income populations.
Harford County does not have an area which meets the federal criteria for a food desert (a low income census tract where a substantial number or share of residents has low access to a supermarket or large grocery store). However, the committee did identify three geographical areas in the northeastern part of the county that lacked food resources, Darlington, Street and Whiteford. In meeting with local nonprofits that support food access issues, it was determined that better utilization and reallocation of existing resources would rectify the issue, as opposed to creating additional service providers. The DCS submitted the results of its assessment to the U.S. Department of Housing and Urban Development, as part of the Harford County Consolidated planning process (http://www.harfordcountymd.gov/services ).
Page 49
E. Summary
Many Harford County residents lack access to primary, mental health, and dental care. While the Health Department and Upper Chesapeake HealthLink offer screenings and primary care for low-income residents, a group of four census tracts in the lower southern part of the county has received a designation as a Medically Underserved Population and is eligible for a federally qualified health center, which would provide a wide-variety of health services to Medicaid and Medicare recipients, the insured population, and low income residents who would pay on a sliding fee scale. While there are no food deserts, under the federal definition, in Harford County, the county does have areas in which low income residents may have difficulty accessing healthy foods.
VII. Public Health Resources
As resources to address public health concerns are scarce. It is Harford County’s desire to maximize these resources via cooperative efforts from a variety of community stakeholders.
The Harford County Health Department (HCHD) and Upper Chesapeake Health have a number of programs to address the public health needs of Harford County residents and works with a variety of community organizations to assess community health and to develop strategies to meet these needs.
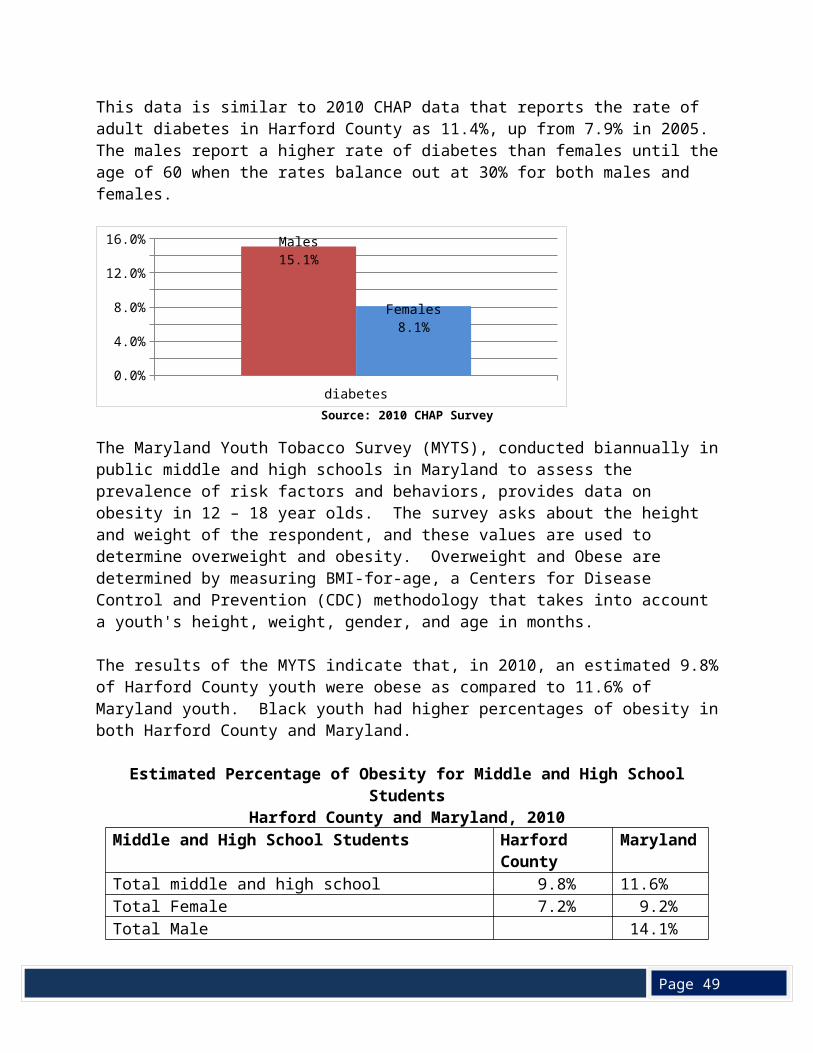
Page 49
The HCHD’s Fiscal Year 2011 Annual Report (http://www.harfordcountyhealth.com/) gives a summary of the services that the health department provides, and the first section of the plan summarizes efforts underway to identify the most significant health issues in the County and to develop effective strategies to address these.
To support the health improvement strategies, HCHD has applied for and received State funding to implement new initiatives. In January 2012, the Maryland Community Health Resources Commission (http://dhmh.maryland.gov/mchrc/SitePages/Home.aspx) awarded the Harford County Health Department Community Health Assessment health department a grant to fund the Family Planning Program’s initiative to increase access to comprehensive women’s health services in an effort to reduce infant mortality in Harford County. Recognizing the importance of preconception health for both reducing unintended pregnancies and improving pregnancy outcomes, Family Planning is adding comprehensive care coordination and community outreach components to its existing family planning/reproductive health services.
The Maryland Community Health Resources Commission (MCHRC) has also funded HCHD to implement several of the strategies outlined in the Local Health Action Plan (http://www.harfordcountyhealth.com/wp-content/uploads/2012/03/Action-PlanPriorities.pdf) developed to address the results of the Local Health Improvement Process (http://eh.dhmh.md.gov/ship/SHIP_Profile_Harford.pdf). The action plan, developed in consultation with Harford County’s Health Improvement Coalition, focuses on obesity, tobacco use prevention, and behavioral health.
Components of the Local Health Action Plan will also be supported by funds from the Federal Community Transformation Grant awarded through the Maryland Department of Health and Mental Hygiene. This grant will focus on strategies to change tobacco use policies (e.g. smokefree municipalities) and to initiate obesity prevention and school wellness policies.
Upper Chesapeake Health connects the HealthLink Primary Care Clinic (UC HealthLink PCC), to critical services with the HCHD through an active “no wrong door” reverse referral program. Linked services include: Addiction Counseling, Family Planning, Breast and Cervical Screening, Smoking Cessation, Homeless Case Management, and limited adult dental care. The HealthLink Community Health Improvement department offers community focused health education and screenings free or at cost to the general public, and guidance for access services in the community.
Upper Chesapeake has also received grants from the MCHRC to provide additional services in our community including a specialty care network developer to improve access to specialty care for low income patients, on-site mental health care and Spanish language translation services at the UC HealthLink PCC.
The UCH and HCHD staff participate on a number of committees, coalitions and associations to advocate for public health initiatives and to provide public health expertise. These groups
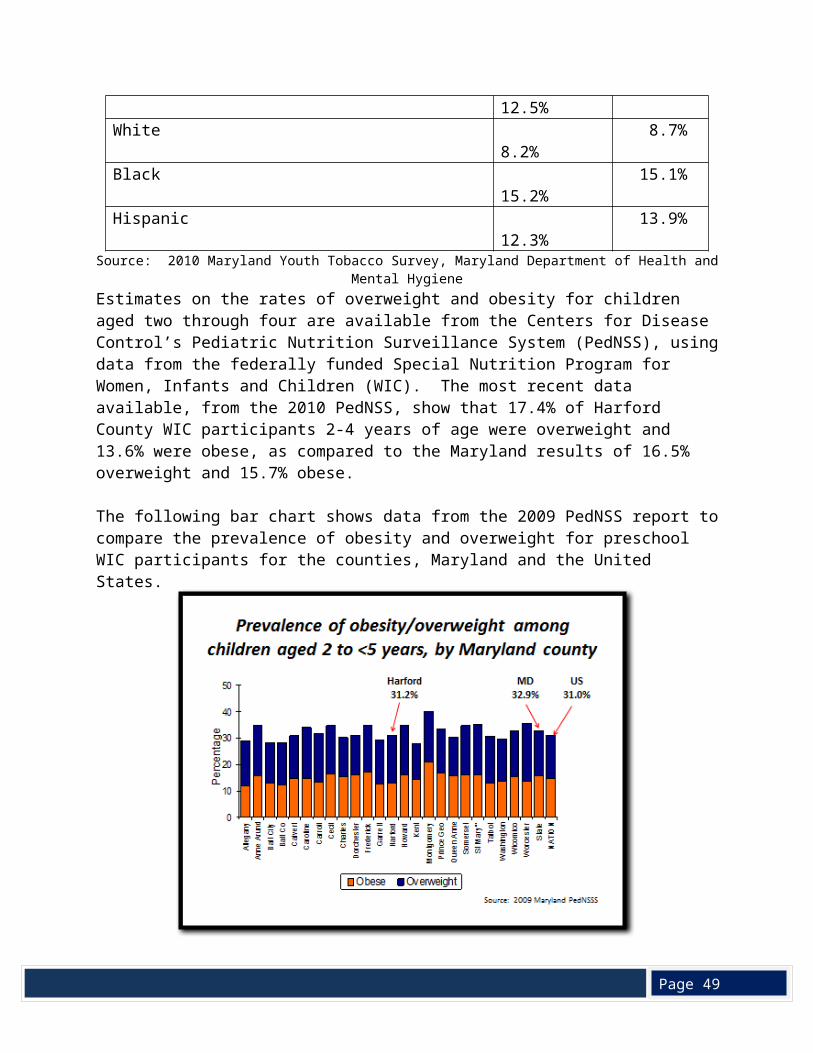
Page 49
share a common commitment to improve Harford County residents’ health and access to care.
UCH and HCHD staff are active in working with: The Harford County Dental Advisory Council, which includes a representative from the
County Council as well as the Maryland Office of Oral Health; School Health Council; Harford County Cancer and Tobacco Community Coalition, comprised of two sections
(Tobacco and Cancer), established under the Maryland Cigarette Restitution Fund’s enacting legislation;
Inner County Outreach, HCHD’s Minority Outreach and Technical Assistance contractor for Maryland Cigarette Restitution Fund programs;
FACE IT, a faith-based community coalition working on substance abuse issues; Maryland Air Quality Control Council; Harford County Environmental Advisory Board; Harford County Animal Control
Advisory Board; Mental Health and Addictions Advisory Council; Harford County Fetal and Infant Mortality Review Program and the Child Fatality Review
Team; Domestic Violence Fatality Review Team; Local Management Board; Harford Roundtable, sponsored by Homeless Services, Harford County Department of
Community Services; Harford County Community College Nursing Advisory Board; Harford County Women’s Roundtable; Healthtacular – UCH annual free community health screening fair; Ask a Doc – column in local newspaper; Access to Care Group; Harford and Cecil County Emergency Medical Systems Trauma Symposium Heart Club American Heart Association Harford County Homeless Coalition; Healthcare for the Homeless; Bel Air High School Biomedical Science Program Advisor Council Mental Health and Addictions Advisory Committee; Harford County Fetal and Infant Mortality Review and the Child Fatality Review
Committees; Harford County Traffic Safety Committee
VIII. Conclusion
Harford County, a relatively wealthy and well-educated Maryland jurisdiction, has a surprisingly and unacceptably high burden of chronic disease. Demographic data for Harford County
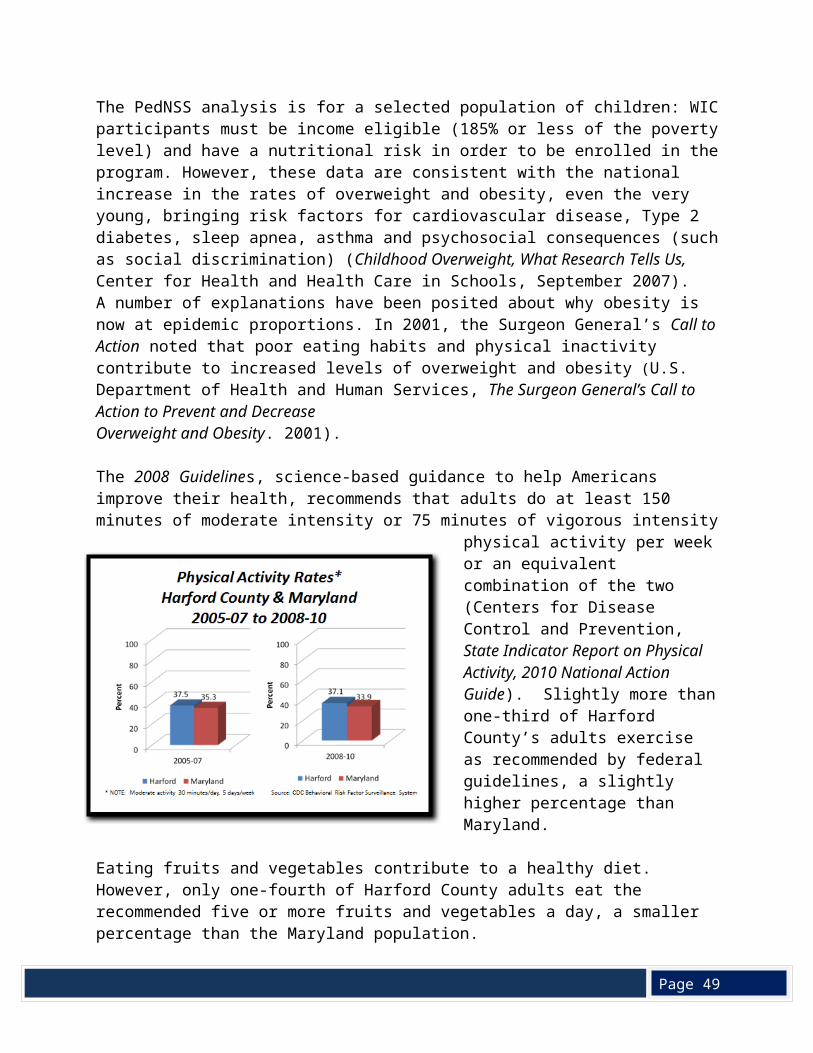
Page 49
residents reveal an above average median household income ($76,808 in Harford vs. $70,017 in Maryland); a higher than average percent of high school graduates (91 % in Harford vs. 87.8% in Maryland); and a more homogeneous population (81.2% White/12.7% Black populations in Harford vs. 58.2% White/29.4% Black populations in Maryland). Yet, Harford County residents have age-adjusted mortality rates worse than the State average for the four leading causes of death – heart disease, cancer, stroke, and chronic obstructive pulmonary disease (COPD). Furthermore, chronic disease mortality trends are not moving in the right direction. From 2004-06 to 2007-09, Harford County age-adjusted mortality rates failed to improve at the same rate as the State average for cancer, stroke, and COPD.
Racial disparities are also a concern in Harford County: Black infants are more likely to be low birth weight and are more than twice as likely to die before the age of one, as compared to White infants. The Black age-adjusted mortality rates are worse than the White age-adjusted mortality rates for heart disease, cancer, and stroke. Primary prevention data reflecting adverse lifestyle factors, such as tobacco use, are worse in Harford County than the rest of the State, as evidenced by 2008-10 BRFSS data for adult tobacco use (20.3% in Harford vs. 15.1% in Maryland) and by 2010 Maryland Youth Tobacco Survey data for underage middle and high school youth (17.3% in Harford vs. 17.1% in Maryland). Furthermore, Harford County adults and youth tobacco use trends are moving in the wrong direction.
According to 2008-10 BRFSS data, other lifestyle risk factor indicators, such as adult obesity/overweight prevalence (63.5% in Harford vs. 64.1% in Maryland; physical activity rates (37.1% in Harford vs. 33.9% in Maryland); fruit/vegetable intake rates (25.2% in Harford vs. 27.3% in Maryland), are comparably poor in both Harford County and the State. Similarly, 2009 Pediatric Nutrition Surveillance data reveal comparably poor obesity/overweight indicators for 2 to 4 year olds in both Harford County (31.2%) and Maryland (32.9%).
Mental health and substance abuse are significant public health concerns in Harford County, reflected in an increase in the suicide death rate, which rose by 20% between 2005-07 and 2008-10, reaching 11.3 deaths per 100,000 population, well above the state rate of 8.9. Greater percentages of Harford County adults and of youth are binge drinking, when compared to Maryland. Also, a higher percentage of Harford County high school students use marijuana, heroin, and other narcotics.
While a lower percentage of Harford County residents are uninsured (7%) when compared to Maryland (11.3%), one in 10 Harford adults between the ages of 18 and 64 could not afford to see a doctor (2008-2010). Harford’s Black population was less likely than the White population to be insured: 6.1% of Whites were estimated to be uninsured as compared to 12.9% of Blacks, possibly leading to the higher mortality rates for chronic diseases that Blacks experience.
In primary prevention, the county also lags behind Maryland with lower percentage of the population receiving colonoscopies and mammography screenings in 2008-2010. During that
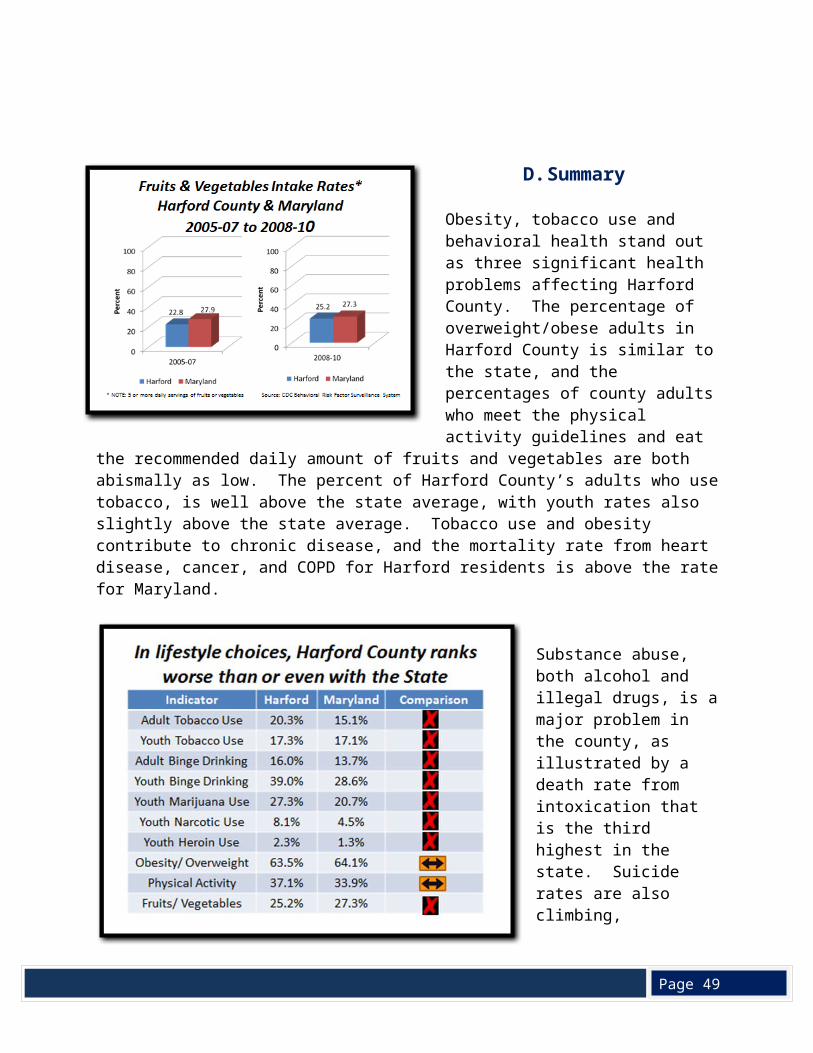
Page 49
same time period, a lower percentage of Harford adults received influenza vaccinations when compared to Maryland although Harford led the state in childhood influenza rates.
Lack of access to primary health care and dental care have both been identified as significant in the southern portion of the County, along the boundary of the Aberdeen Proving Grounds, with Health Provider Shortage Areas (HPSA) designations, while the low number of mental health providers in the County earned a HPSA designation for all of Harford County. Four census tracts in southern Harford County received the federal designation of Medically Underserved Population, making the area eligible for Federally Qualified Health Center services. No “food deserts” were identified in the County, but three northeastern communities did lack food resources and should be targeted for additional resources: Darlington, Street and Whiteford.
To address the three major health problems identified by the LHIC – obesity, tobacco use, and behavioral health (substance abuse and mental health) – the County’s Local Health Improvement Coalition is working on the Local Health Action Plan, which includes a number of specific strategies to promote healthy lifestyles. The Obesity Task Force is also developing recommendations on programs and policies to create a healthier Harford and will present these to the County Council in October, 2012.
A “Community Health Improvement Plan” is now being written to reflect the work of the LHIC and the Obesity Task Force and the goals and objectives of public health improvement efforts. The Local Health Action Plan, supported in part by funding from the Maryland Department of Health and Mental Hygiene, will serve as a road map to reach these goals.
Page 49
Appendix
Map 1
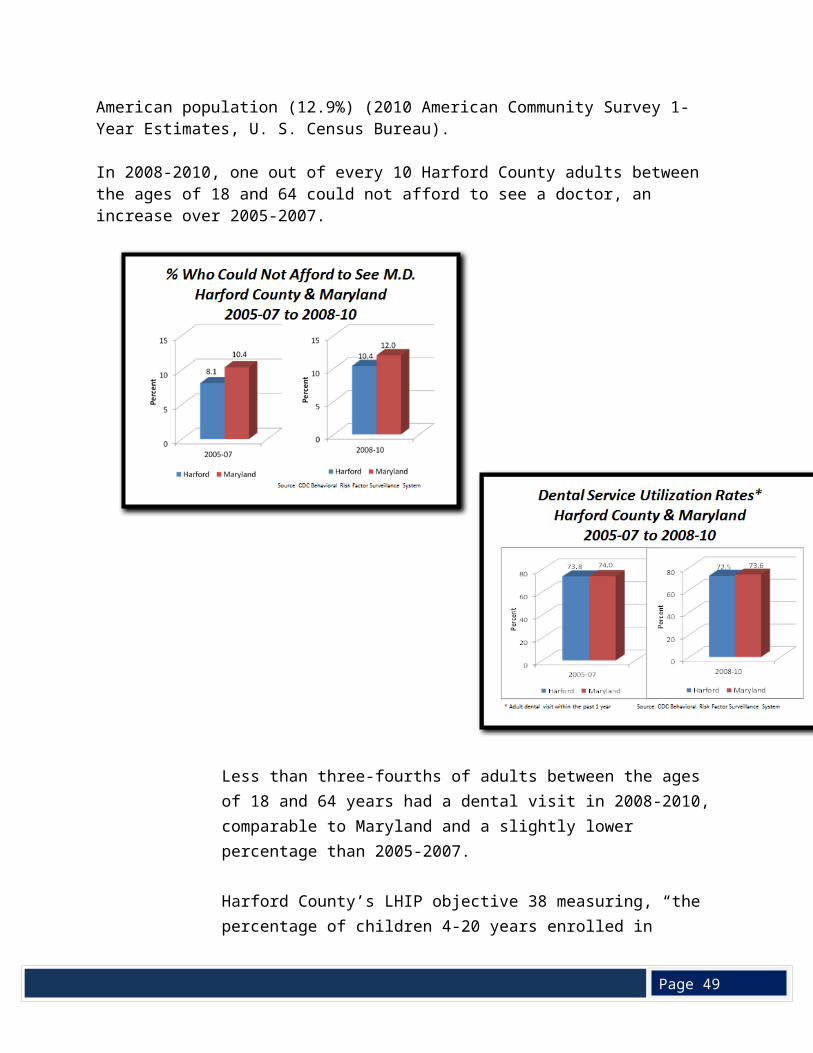
Page 49
Appendix
Map 2
The areas highlighted in yellow in the map above are census tracts where over 51% of families have low to moderate incomes, defined as incomes below $70,697 (80% of the county’s median family income of $88,370).
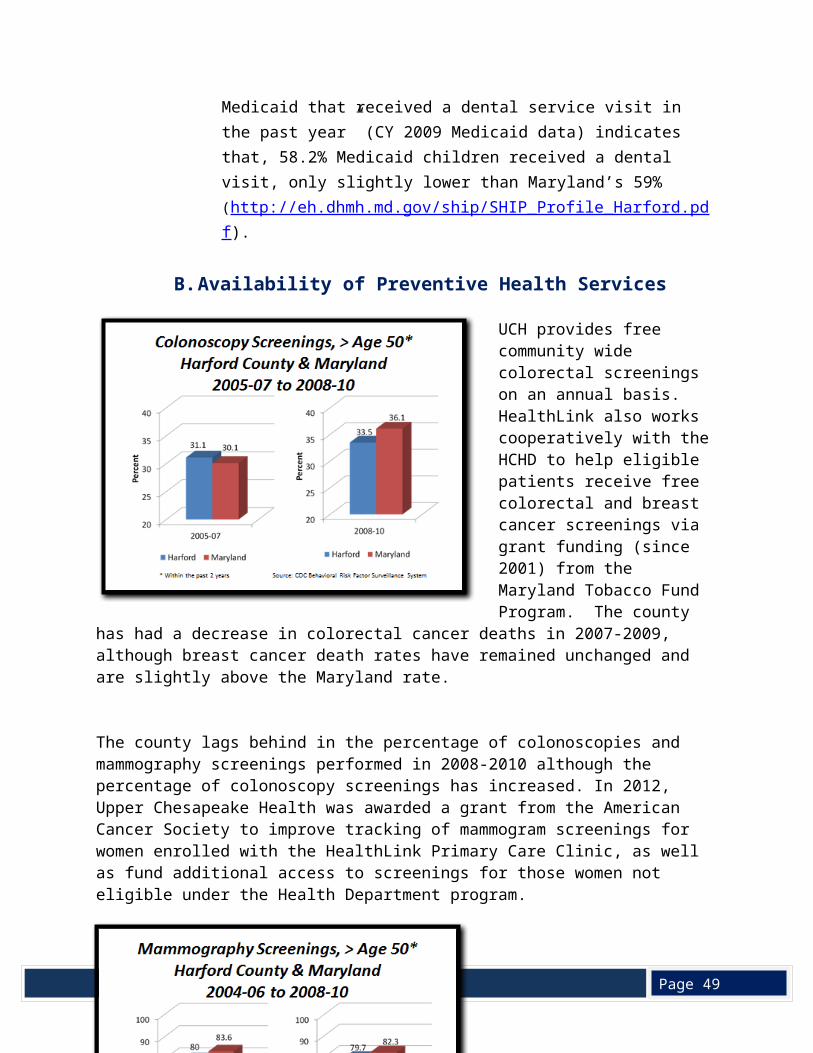
Page 49
Appendix
Map 3
The map above indicates census tracts where 3% or more of families have incomes below the poverty level.
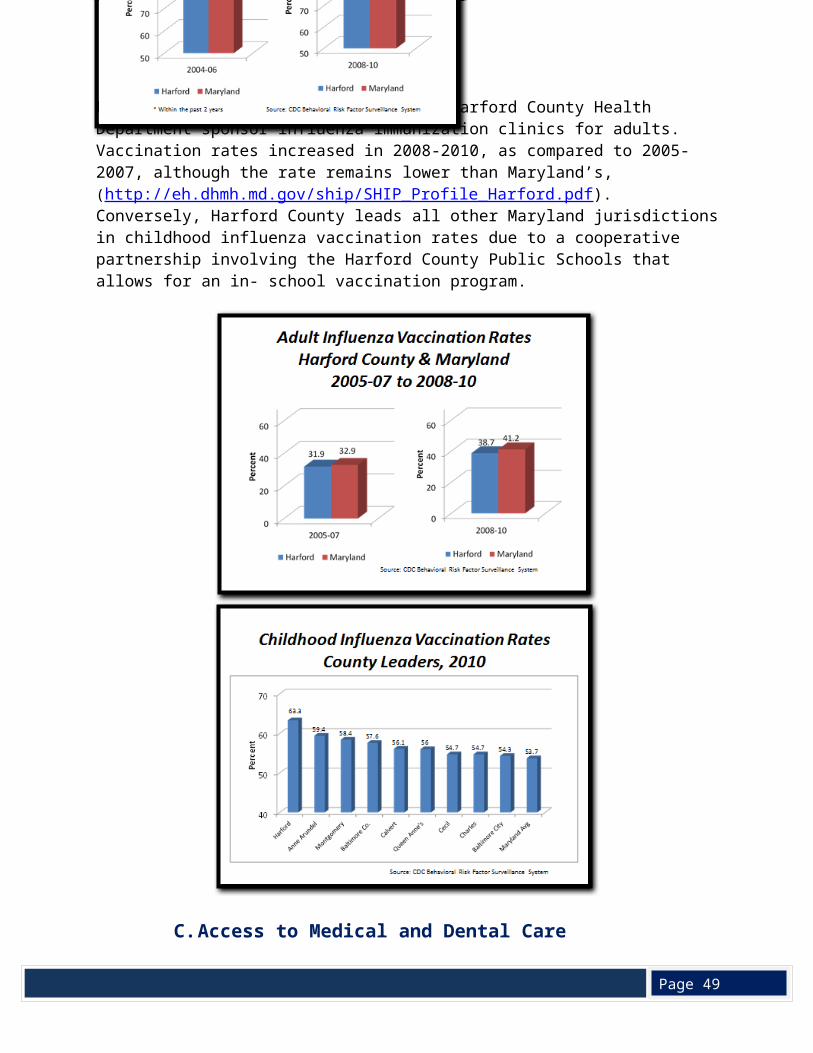
Page 49
Appendix
Map 4
Page 49
Appendix
Map 5
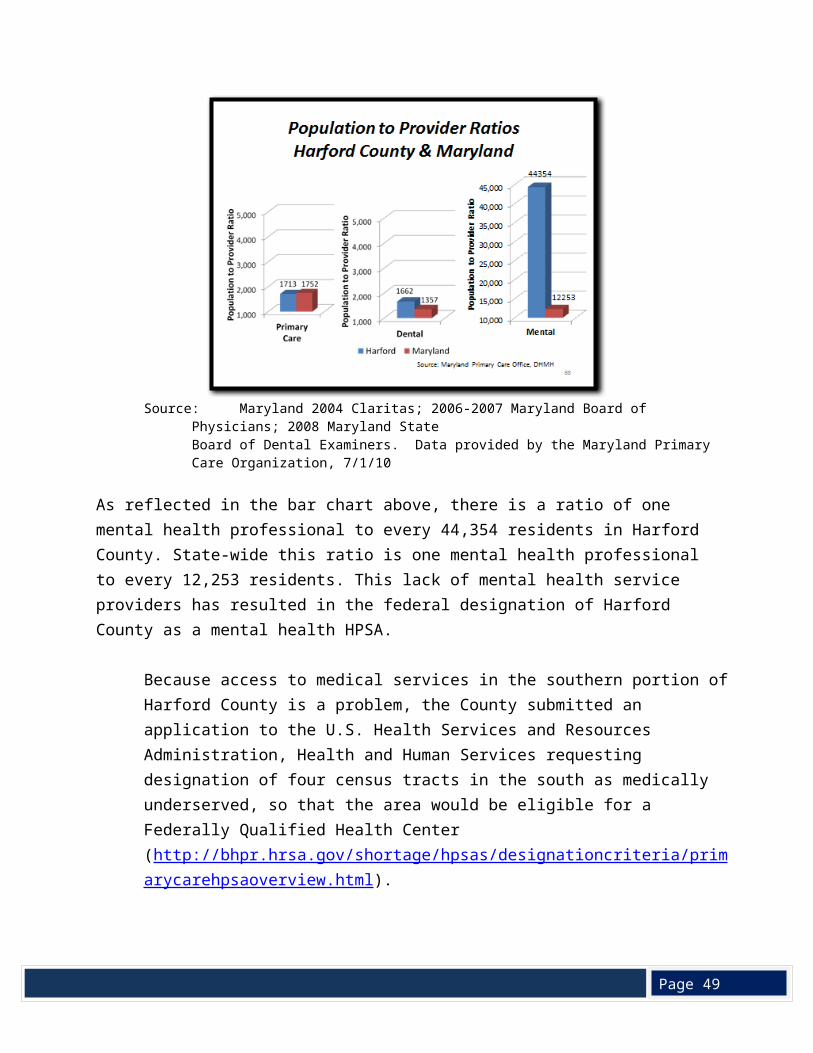
Page 49
Appendix
Map 6
Page 49
Appendix
Map 7