Embed Size (px)
Citation preview
COMMUNITY HEALTH ASSESSMENT FOR THE
BLOOMFIELD DEPARTMENT OF HEALTH AND HUMAN SERVICES
May 2013
Submitted to:
Bloomfield Department of Health and Human Services
Bloomfield, New Jersey
By:
Montclair State University
College of Education and Human Services
Center for Research and Evaluation on Education and Human Services (CREEHS)
Eden N. Kyse, Ph.D., Director, CREEHS
Rebecca Swann-Jackson M.Ed., Senior Research Associate, CREEHS
Dawn Diamond, MPH, Project Manager Stephanie Prall, Graduate Research Assistant, CREEHS With the financial support of: The Bloomfield Board of Health The Community Health Assessment is also funded in part by a grant from the Partners for Health Foundation,
which partners to strengthen health and wellness in the Montclair area.
i
ACKNOWLEDGMENTS
The authors wish to acknowledge the following for their support on this report:
The Township of Bloomfield, Board of Health for the opportunity to better understand the emerging
health issues facing the residents we serve;
Karen Lore, Director of Health and Human Services; committee members Mike Fitzpatrick, Paula Peikes,
Donna Williams, Vincent Nicosia and Michael Hodges;
Particular thanks to Mike Fitzpatrick and Michael Hodges, for their participation, communication, and
assistance in recruiting focus group and key informant interview participants, and scheduling time and
space for focus group discussions and interviews, and for their collaboration and patience in answering
questions throughout the process;
The study participants, including community members and other key stakeholders, for their
participation, their interest in the study, and their thoughtful responses;
Partners for Health for their guidance and input, and the financial support of this project;
Montclair State University and CREEHS staff, including Dean Francine Peterman, Associate Dean Tamara
Lucas, Assistant Professor Lisa Lieberman, and Program Assistant Tina Seaboch for their contributions
and support.
ii
Community Health Assessment for the Bloomfield Health and Human Services Department
TABLE OF CONTENTS
EXECUTIVE SUMMARY…………………………………………………………………………………………………………. iii
BACKGROUND AND FRAMEWORK FOR THE COMMUNITY HEALTH ASSESSMENT (CHA) ........... 1
PURPOSE OF THE COMMUNITY HEALTH ASSESSMENT
DEMOGRAPHIC PROFILES OF TOWNSHIPS INCLUDED IN ASSESSMENT
METHODOLOGY OF THE COMMUNITY HEALTH ASSESSMENT……………………………..…………………9
RESULTS OF THE COMMUNITY HEALTH ASSESSMENT…………………………………………………………13
PERSONAL HEALTH/NUTRITION AND PHYSICAL ACTIVITY
COMMUNITY HEALTH/SIGNIFICANT HEALTH ISSUES AND BARRIERS
PUBLIC HEALTH ANNOUCEMENTS AND DISASTER PREPAREDNESS
QUALITY OF LIFE IN THE COMMUNITY
COLLABORATION AMONG COMMUNITY AGENCIES
SUMMARY AND NEXT STEPS………………………………………………………………………………………………..35
APPENDICES………………………………………………………………………………………………………………………...44
iii
EXECUTIVE SUMMARY Background
As part of their mission in the community, the Bloomfield Department of Health and
Human Services (BDHHS) aims to reduce or eliminate health threats through
medical, social, and environmental interventions, giving particular attention to
those members of the community who face barriers in obtaining health services.
BDHHS employees dedicate themselves to educating and protecting the community
by offering programs that promote environmental safety, healthy life choices, safer
food, disease control and more. A primary part of the department mission is to
to prevent disease and promote physical and mental well-being through policy
development, disease detection, prevention, education, and enforcement; in a
culturally competent manner that ensures the highest quality of life for the
population served. BDHHS divisions include Human Services (with its volunteer
arm, Neighbor to Neighbor Network), Public Health Nursing, Environmental Health,
and Health Education.
To encourage best practices and services, the national Public Health Accreditation
Board (PHAB) has created a framework for accreditation of state, county, tribal and
local community health departments. The overall goal is to advance the practice of
public health at the community level and throughout the nation while providing, at
all levels, an element of accountability of public health departments to the
populations they serve. In agreement with the principles of the PHAB, in the
interests of achieving accreditation, and with the goal of providing superior public
health services, the Township of Bloomfield, NJ Department of Health and Human
Services (BDHHS) received grant funding from Partners for Health (PFH), located in
Montclair, NJ, for the purpose of conducting a community health assessment.
With the backing of PFH, in November of 2012, BDHHS contracted with Montclair
State University’s Center for Research and Evaluation on Education and Human
Services (CREEHS) to collaborate in the development of data collection instruments
and to analyze and summarize collected data for a Comprehensive Community
Health Assessment that is suitable to meet the standards set by the PHAB.
The township of Bloomfield is currently under contract to supply public health
department services to the townships of Caldwell and Glen Ridge in New Jersey, in
iv
addition to serving the community of Bloomfield. Although public health services
are delivered to the three townships from under the same umbrella (BDHHS), the
three towns differ in meaningful ways, for instance population size, median age,
racial ethnic composition, and income and education levels.
Methods
For the Comprehensive Community Health Assessment, a mixed method of data
collection was used to enable analysis of both quantitative and qualitative data from
the three townships. The methods also allowed for gathering data from different
types of participants including random selection in the general public of adults over
18 years of age (N = 604) for participation in a telephone survey, three (3) specific
focus groups (faith-based, senior living, recreation department), and ten (10)
representatives from other Bloomfield agencies involved in the CHA process
through the key informant interviews.
Data collection instruments, prepared by CREEHS, with guidance and input from the
Bloomfield Department and Partners for Health, included a Community Health
Telephone Survey, a Community Focus Group Protocol, and a Key Informant
Interview Protocol. The Montclair State University Institutional Review Board (MSU
IRB) reviewed these instruments and protocols to ensure that all data collection was
performed in compliance with federal and state laws governing research that is
conducted with human participants. Data were collected by Braun Research
(telephone survey) and BDHHS (focus groups and key informant interviews) during
the months of March and April 2013.
This assessment, carried out with attention to generalizability to the township
populations, revealed valuable data that can be used to influence program planning.
However, as is often the case with the collection of data, limitations must be
considered in understanding and drawing conclusions and implications of the data
collected. First, the telephone survey sample included more female, more white,
and higher educated respondents than the general population of these towns.
Second, focus groups and key informant interviews are relevant for Bloomfield only,
and these, too, were limited in scope and number. Therefore, although the
assessment gathered data that previously were not accessible, conclusions must be
carefully considered, and likely reflect the responses of a healthier and more
connected population than actually exists in these three towns.
v
Findings
ACCESS: To questions regarding access to general health services provided by
BDHHS, the response was between 94.5 - 99% access and, with specific regard to
childhood vaccinations, access was reported to be between 94 - 96.4%. These
numbers dropped for access to dental health services at 88.5 - 94% with 11.5% of
Bloomfield respondents reporting no access.
Answers regarding access to cancer prevention and treatment services in a range of
89 - 95.3% access and mental health care services in a range from 89.6 - 97.6%
access may have been slightly biased by the ability for respondents to claim, “don’t
need this service.” With regard to cancer services, respondents may not have
differentiated between “prevention” and “treatment” services. With regard to
mental health services, attitudes of privacy and embarrassment may impact
responses.
BARRIERS: For respondents stating no access to certain services, the two key
barriers were lack of money and lack of information on how to access the services.
The lack of money response may reflect lack of information about access to free
services and lack of knowledge about the potential for charity care available under
certain circumstances. In the focus groups, lack of knowledge regarding services
was discussed. Lack of awareness of services was a common theme in all three data
collection methods. Key informants also commented on the broader dilemma of the
uninsured and under insured and the correlation to use by these people of
emergency room services for general health care.
SELF-RATED HEALTH: For the state of New Jersey the percentage of respondents
who reported fair or poor health using the 2009 BRFSS question, “Would you say
that in general your health is excellent, very good, good, fair, or poor?”(6) ranged
from 13.5 – 15.2% for adults age 18 and over. For the similar question in the
BDHHS telephone survey, “How would you rate your personal health on a scale from
1 to 5, with 1 being very unhealthy and 5 being very healthy?”, the aggregate of data
from the three townships formed a range of 0.8 – 1.0% of adults age 18 and over
reporting unhealthy/very unhealthy. This may indicate an attitude of better self-
rated personal health in the BDHHS communities. There may be slight bias in the
vi
different wording of the question and in the likelihood that those who participated
in the surveys may have been healthier than the general population
SCREENINGS: Given the importance of screenings to disease prevention and
detection/early treatment, several of the numbers reported in the telephone survey
on use of health screenings appear low. This may be due in part to the question
limiting the response to screenings that occurred during the past year. If that time
frame was expanded to two or five years, as some of these tests are recommended,
the percentages would likely increase.
DIAGNOSIS OF CHRONIC DISEASE: Of the 604 respondents to the telephone survey,
there were 267 (44%) positive responses to having one or more chronic disease(s)
in the household. High blood pressure was the most reported diagnosis in all three
communities. Bloomfield reported the highest levels of diabetes, high blood
pressure, asthma, lung disease and mental health concerns. Consideration should
be given to the national data on health disparities that indicate higher levels of
diabetes in minority populations, recalling that Bloomfield’s Hispanic and African
American population accounts for 21.5% of those Bloomfield respondents surveyed,
while in Caldwell and Glen Ridge those minority numbers were, respectively, 5%
and 12.6% of the population. Overall there were 267 diagnoses of chronic diseases
in a survey of 604 households, suggesting that these communities, like much of the
US, must be increasingly focused on reducing chronic disease.
NUTRITION AND PHYSICAL ACTIVITY: The BDHHS health assessment sought data
on consumption of fruits and vegetables and extent of physical exercise by various
methods and specifically walking and/or biking. For consumption of fruits and
vegetables, the telephone survey data indicated that 83% of the respondents eat less
than 5 servings per day while the greater percentage of participants in the focus
groups and key informant interviews indicated awareness that 6 – 11 servings per
day would be optimum. This may indicate that there has been a small amount of
progress toward the population having an awareness of what they should be doing,
with less progress toward that awareness being a determinant of behavior change.
COMMUNITY HEALTH & QUALITY OF LIFE/SIGNIFICANT HEALTH ISSUES AND
BARRIERS: Diet and exercise and chronic disease are related in their direct impact
to the individual as well as to the community (as opposed to an issue of broader
community impact such as environmental concerns and social concerns). They are
also related in the fact that there is much developing scientific data that lack of
vii
healthy diet and exercise is one of the primary predictors of chronic disease. Nearly
half (47.8%) of telephone survey participants responded that diet/exercise/chronic
diseases are the community’s most pressing issues. This was also supported by
commentary in the Bloomfield Recreation Department focus group. From the other
two focus groups and in the key informant interviews, social concerns emerged as
the most significant health problems in the community. Despite the local data
indicating disturbing trends in household wellness (i.e. high rates of chronic
diseases), ratings from focus groups and interviews on quality of life in the
community were generally above average and focus groups indicated that BDHHS
had made an above average effort to inform the residents in times of disaster, for
instance, the recent Hurricane Sandy.
CONCLUSIONS: The demographic differences in the three townships that are
serviced by BDHHS will create challenges in program planning, for instance,
Bloomfield requires more attention to minority populations in order to reduce
nationally recognized health care disparities. Caldwell has a larger population
approaching middle-age. Glen Ridge has the highest percentage of population under
18 years of age making it an area for focus on youth-related health interventions, for
example, driving safety, sex, drug, and alcohol themes. BDHHS needs to move
forward with a constant eye towards these differences in the communities they
serve.
As the nation recognizes the impact of education on health and well-being, the
positive news is that all three communities appear to be above county, state, and
national education levels in percent of population that have received a high school
diploma and that have received bachelors’ degrees. These education levels may be
viewed as positive factor for the population’s comprehension of important
information about wellness and disease prevention.
Access to primary health care services was reported at 94% or better by telephone
survey respondents. While the question posed to BDHHS respondents differs from
data collection questions used by Healthy People 2020 (10), the data topic is similar.
Healthy People 2020 reported, in their baseline year of 2007, that 76.3 % of the U.S.
population had a usual primary care provider. The Healthy People 2020 target is
83.9%. At 94% access to primary healthcare services in the BDHHS communities, it
would appear that the population has greater access than the general U.S.
population. This should provide an opportunity for BDHHS from which to launch
viii
new programs through collaboration with local primary care physicians and
hospitals.
In a general analysis of most pressing health concerns and chronic disease
diagnoses, the data gathered appears to align with state and national concerns
regarding nutrition, exercise, and chronic disease. In the telephone survey there
were 267 reports of chronic disease diagnoses in 604 households. Nearly 50% of
the telephone survey respondents reported that they believe nutrition, exercise, and
chronic disease are the top health issues in the communities.
In contrast, self-rated health in the three communities appears to be better than
state of New Jersey data collected through the Behavioral Risk Factor Surveillance
System (6). For the state of New Jersey the percentage of respondents who reported
fair or poor health using the 2009 BRFSS question, “Would you say that in general
your health is excellent, very good, good, fair, or poor?” ranged from 13.5 – 15.2%
for adults age 18 and over. For the similar question in the BDHHS telephone survey,
“How would you rate your personal health on a scale from 1 to 5, with 1 being very
unhealthy and 5 being very healthy?”, the aggregate of data from the three
townships formed a range of 0.8 – 1.0% of adults age 18 and over reporting
unhealthy/very unhealthy.
In key respondent interviews (Bloomfield only), social concerns were reported as
the most significant health problems in the community. Responses reflect concern
by other community agency stakeholders regarding homelessness, discrimination,
alcohol and drug abuse and other social concerns. While these qualitative data may
reflect bias (i.e. the key respondents may have a greater awareness of the social
concerns because the agencies they represent are closer to the problem then the
random public), this portion of the data provides BDHHS with direction for
establishing the social concerns as targets for collaborative efforts by multiple
agencies.
Beyond accomplishing assessment goals for PHAB and BDHHS requirements, the
Partners for Health Foundation should also benefit from the data collection as the
PFH service footprint includes all three townships that were involved in the CHA.
Data gathered in response to questions on nutrition and physical activity should
allow the PFH organization to expand their data base on attitudes and behaviors
toward fruit and vegetable consumption, and walking and biking in the communities
surveyed by inclusion of the new data from Bloomfield, Caldwell, and Glen Ridge.
ix
In conclusion, supported by the quantitative and qualitative analysis of the mixed
method data collected in the Community Health Assessment, the BDHHS is in a good
position to pursue the PHAB accreditation. Empowered with the potential to
collaborate with other local agencies to achieve critical public health objectives, the
department will be able to bring a fresh approach to health education, health
interventions, and prevention strategies that will improve the health status of the
communities they serve.
1
BACKGROUND AND FRAMEWORK FOR THE COMMUNITY HEALTH ASSESSMENT
(CHA)
As part of their mission in the community, the Bloomfield Department of Health and Human
Services (BDHHS) aims to reduce or eliminate health threats through medical, social, and
environmental interventions, giving particular attention to those members of the community who
face barriers in obtaining health services.
BDHHS employees dedicate themselves to educating and protecting the community by offering
programs that promote environmental safety, healthy life choices, safer food, disease control and
more. A primary part of the department mission is to prevent disease and promote physical and
mental well-being through policy development, disease detection, prevention, education, and
enforcement; in a culturally competent manner that ensures the highest quality of life for the
population served. The departments include Human Services (including its volunteer arm,
Neighbor to Neighbor Network), Public Health Nursing, and Environmental Health, and Health
Education.
Human Services is the township’s outpatient mental health and social services center, which aims
to foster a sense of well-being and wholeness. The Human Services Division is aided by a
contracted psychiatrist who prescribes medications and conducts consultations as needed. Public
health social workers provide counseling, crisis intervention, home visits and assessments as
required by state-mandated practice standards. At all times, special attention is given to the
community’s most vulnerable populations: people with special needs, and children.
The Neighbor to Neighbor Network is the volunteer arm of the Division of Human Services.
NTNN recruits and trains volunteers to support Bloomfield’s needy populations through
nontraditional programs, with an emphasis on seniors and low-income families.
In Public Health Nursing, the population is the patient. Focus is on achieving the greatest good
for every resident using nursing strategies that promote and protect the public’s health. The
BDHHS Public Health Nursing Staff identifies and reaches out to all who might benefit from
specific programs and services while collaborating with community stakeholders who are
invested in improving the health of individuals, families and the greater community.
Each year, Environmental Health conducts routine sanitary inspections of more than 500
business establishments and service providers within the community. Citizen requests generate
2
several hundred more inspections. Services include food service sanitation, food handler training
courses, public health investigations and complaints, childhood lead poisoning investigations, and
potable water sample testing.
“Many health department activities are devoted to solving a problem – but a health educator can
solve problems before they start” (Institute of Medicine). Health Education is an integral
component of the Health and Human Services Department. Programs such as alcohol abuse
control, drug abuse control, chronic disease prevention/management, nutrition and exercise
promotion, injury control, blood-borne pathogen safety, home safety, and HIV/AIDS are provided
directly by the health educator or coordinated with other community agencies. Health Education
also applies for and manages grants for the Department.
The national Public Health Accreditation Board (PHAB), based on extensive study, vetting and
testing, has created a framework for accreditation of state, county, tribal and local community
health departments. The overall goal of the PHAB is to advance the practice of public health at the
community level and throughout the nation while providing, at all levels, an element of
accountability of public health departments to the populations they serve. (1)
PHAB launched its initial accreditation program in September 2011. A common thread in PHAB
standards is collaboration in the local health environment to ensure that individual health
department goals and objectives are not created in isolation, but instead engage a representative
cross-section of appropriate community agencies. Standard 1.1 of the PHAB process requires that
the community, “Participate in or conduct a collaborative process resulting in a comprehensive
community health assessment.” While the PHAB does not require a specific format for the
community health assessment, the organization’s standards indicate that the CHA should include a
“measure”, a “purpose”, and information of “significance” to program development, funding
applications, coordination of community resources, and new ways to collaboratively use
community assets to improve the health status of the population.” Among several other criteria
for accreditation, a current Community Health Assessment is required in the PHAB application
documentation. The PHAB allows for the department applying for accreditation to structure the
format and decide the methodology of the Community Health Assessment. (1)(2)
In agreement with the principles of the PHAB, in the interests of achieving accreditation, and with
the goal of providing superior public health services, the Township of Bloomfield, NJ Department
of Health and Human Services (BDHHS) received grant funding from Partners for Health (PFH),
located in Montclair, NJ, for the purpose of conducting a community health assessment. PFH is a
local public charity whose mission is to administrate funding to strengthen general health and
wellness in the fifteen New Jersey communities that it serves. (3)
3
With the backing of PFH, in November of 2012, BDHHS contracted with Montclair State
University’s Center for Research and Evaluation on Education and Human Services (CREEHS) to
collaborate in the development of data collection instruments, and to analyze and summarize
collected data for a Comprehensive Community Health Assessment that is suitable to meet the
standards set by the PHAB.
DEMOGRAPHIC PROFILES OF TOWNSHIPS INCLUDED IN ASSESSMENT
The Township of Bloomfield is under contract to supply public health department services to the
townships of Caldwell and Glen Ridge in New Jersey, in addition to serving the community of
Bloomfield, a reflection of the growing need to coordinate public health services and health
education to meet the budgets and requirements of a variety of New Jersey communities. These
programs and services include:
environmental health services
food inspections
nuisance complaints
camp and community swimming pool inspections
nursing clinics for heart, stroke, diabetes
communicable disease surveillance and school audits
health education and promotion
In addition, the BDHHS Health Educator communicates general public health information and
disseminates media about BDHHS programs to the population of the three townships.
4
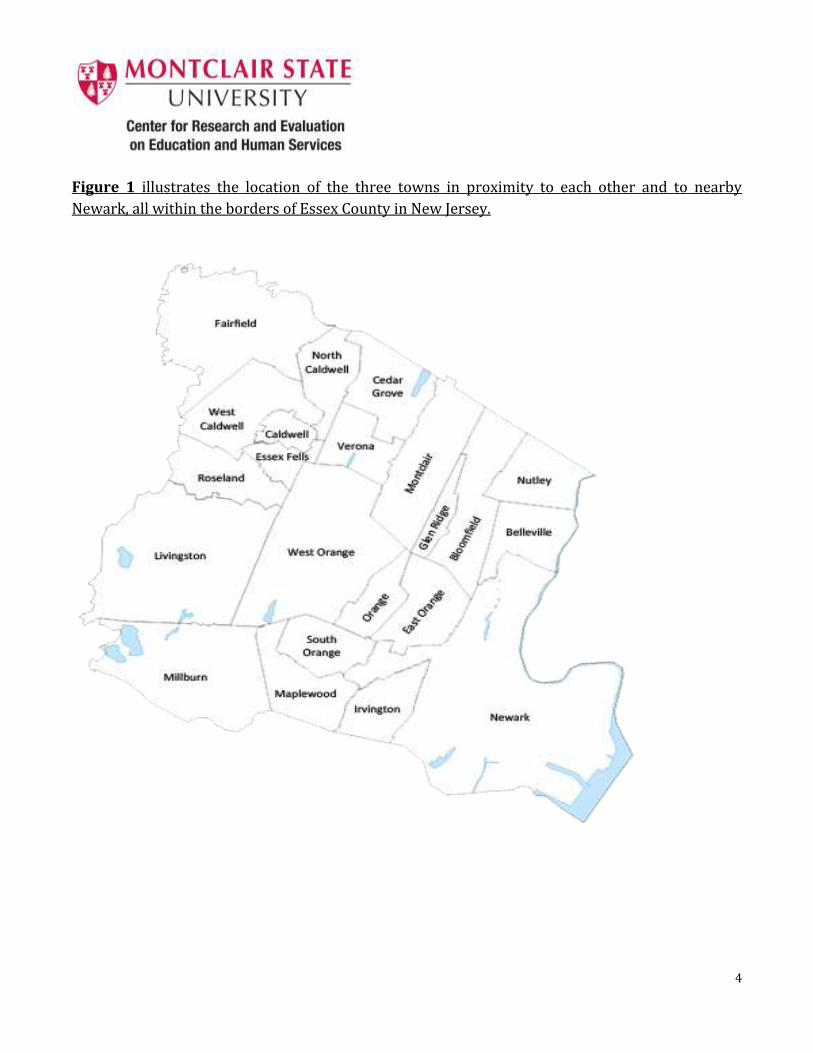
Figure 1 illustrates the location of the three towns in proximity to each other and to nearby
Newark, all within the borders of Essex County in New Jersey.
5
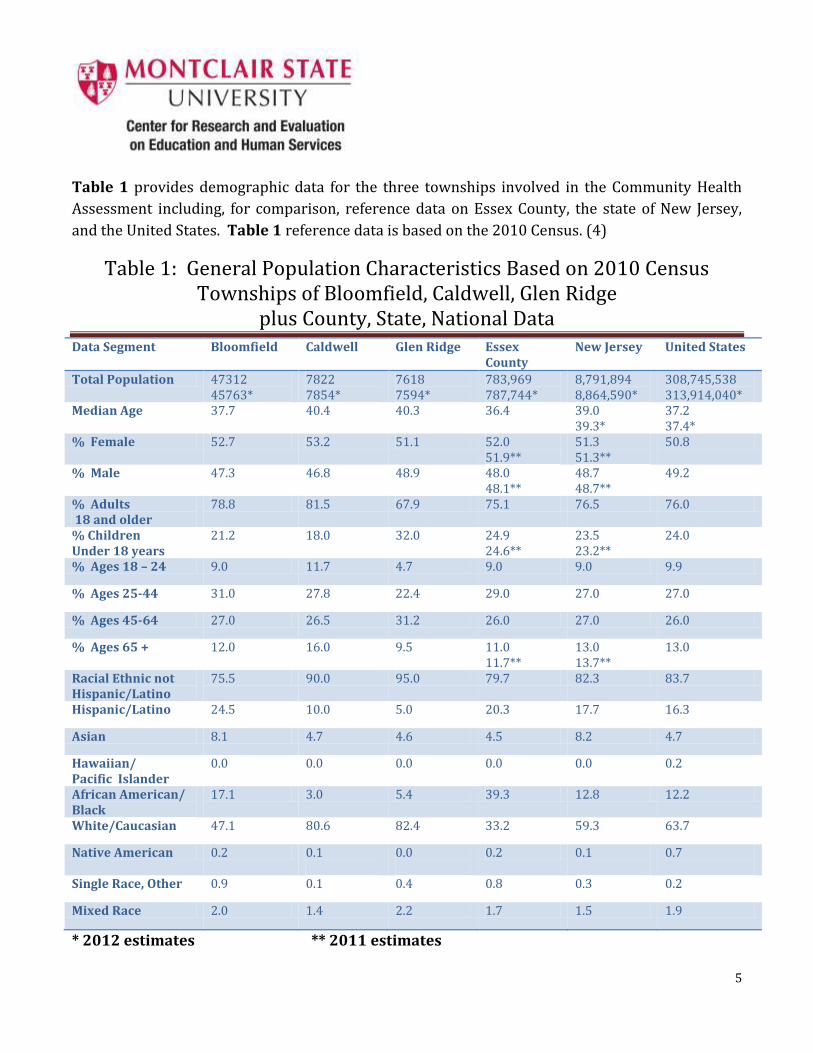
Table 1 provides demographic data for the three townships involved in the Community Health
Assessment including, for comparison, reference data on Essex County, the state of New Jersey,
and the United States. Table 1 reference data is based on the 2010 Census. (4)
Table 1: General Population Characteristics Based on 2010 Census Townships of Bloomfield, Caldwell, Glen Ridge
plus County, State, National Data Data Segment Bloomfield Caldwell
Glen Ridge Essex
County New Jersey United States
Total Population 47312 45763*
7822 7854*
7618 7594*
783,969 787,744*
8,791,894 8,864,590*
308,745,538 313,914,040*
Median Age 37.7 40.4 40.3 36.4 39.0 39.3*
37.2 37.4*
% Female 52.7 53.2 51.1 52.0 51.9**
51.3 51.3**
50.8
% Male 47.3 46.8 48.9 48.0 48.1**
48.7 48.7**
49.2
% Adults 18 and older
78.8 81.5 67.9 75.1 76.5 76.0
% Children Under 18 years
21.2 18.0 32.0 24.9 24.6**
23.5 23.2**
24.0
% Ages 18 – 24 9.0 11.7 4.7 9.0 9.0 9.9
% Ages 25-44 31.0 27.8 22.4 29.0 27.0 27.0
% Ages 45-64 27.0 26.5 31.2 26.0 27.0 26.0
% Ages 65 + 12.0 16.0 9.5 11.0 11.7**
13.0 13.7**
13.0
Racial Ethnic not Hispanic/Latino
75.5 90.0 95.0 79.7 82.3 83.7
Hispanic/Latino 24.5 10.0 5.0 20.3 17.7 16.3
Asian 8.1 4.7 4.6 4.5 8.2 4.7
Hawaiian/ Pacific Islander
0.0
0.0
0.0
0.0
0.0
0.2
African American/ Black
17.1 3.0 5.4 39.3 12.8 12.2
White/Caucasian 47.1 80.6 82.4 33.2 59.3 63.7
Native American 0.2 0.1
0.0
0.2 0.1
0.7
Single Race, Other 0.9 0.1 0.4 0.8 0.3 0.2
Mixed Race 2.0 1.4 2.2 1.7 1.5 1.9
* 2012 estimates ** 2011 estimates
6
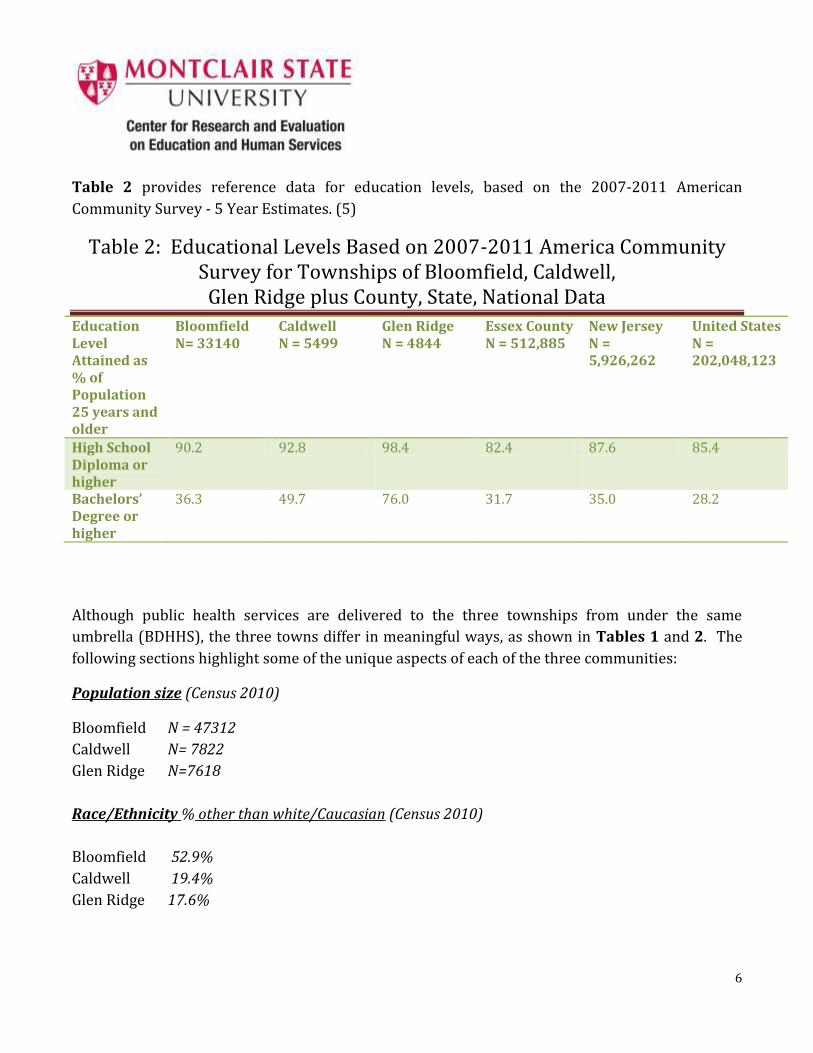
Table 2 provides reference data for education levels, based on the 2007-2011 American
Community Survey - 5 Year Estimates. (5)
Table 2: Educational Levels Based on 2007-2011 America Community Survey for Townships of Bloomfield, Caldwell,
Glen Ridge plus County, State, National Data
Education Level Attained as % of Population 25 years and older
Bloomfield N= 33140
Caldwell N = 5499
Glen Ridge N = 4844
Essex County N = 512,885
New Jersey N = 5,926,262
United States N = 202,048,123
High School Diploma or higher
90.2 92.8 98.4 82.4 87.6 85.4
Bachelors’ Degree or higher
36.3 49.7 76.0 31.7 35.0 28.2
Although public health services are delivered to the three townships from under the same
umbrella (BDHHS), the three towns differ in meaningful ways, as shown in Tables 1 and 2. The
following sections highlight some of the unique aspects of each of the three communities:
Population size (Census 2010)
Bloomfield N = 47312
Caldwell N= 7822
Glen Ridge N=7618
Race/Ethnicity % other than white/Caucasian (Census 2010)
Bloomfield 52.9%
Caldwell 19.4%
Glen Ridge 17.6%
7
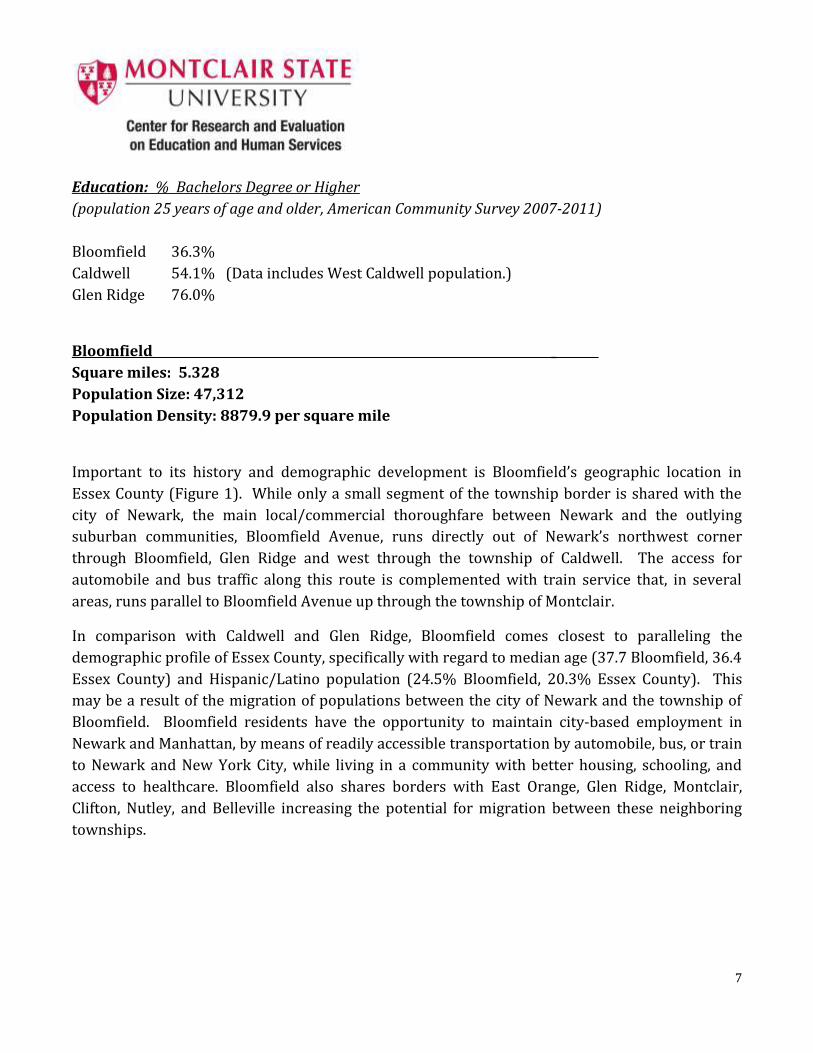
Education: % Bachelors Degree or Higher
(population 25 years of age and older, American Community Survey 2007-2011)
Bloomfield 36.3%
Caldwell 54.1% (Data includes West Caldwell population.)
Glen Ridge 76.0%
Bloomfield _
Square miles: 5.328
Population Size: 47,312
Population Density: 8879.9 per square mile
Important to its history and demographic development is Bloomfield’s geographic location in
Essex County (Figure 1). While only a small segment of the township border is shared with the
city of Newark, the main local/commercial thoroughfare between Newark and the outlying
suburban communities, Bloomfield Avenue, runs directly out of Newark’s northwest corner
through Bloomfield, Glen Ridge and west through the township of Caldwell. The access for
automobile and bus traffic along this route is complemented with train service that, in several
areas, runs parallel to Bloomfield Avenue up through the township of Montclair.
In comparison with Caldwell and Glen Ridge, Bloomfield comes closest to paralleling the
demographic profile of Essex County, specifically with regard to median age (37.7 Bloomfield, 36.4
Essex County) and Hispanic/Latino population (24.5% Bloomfield, 20.3% Essex County). This
may be a result of the migration of populations between the city of Newark and the township of
Bloomfield. Bloomfield residents have the opportunity to maintain city-based employment in
Newark and Manhattan, by means of readily accessible transportation by automobile, bus, or train
to Newark and New York City, while living in a community with better housing, schooling, and
access to healthcare. Bloomfield also shares borders with East Orange, Glen Ridge, Montclair,
Clifton, Nutley, and Belleville increasing the potential for migration between these neighboring
townships.
8
Caldwell _____
Square miles: 1.16
Population Size: 7822
Population Density: 6710.3 per square mile
Caldwell lies slightly less than six miles west of Bloomfield, along the path of Bloomfield Avenue
with the townships of Glen Ridge, Montclair, and Verona lying in between. The agreement
between Caldwell and Bloomfield for BDHHS to supply public health services dates back
approximately 20 years.
The town is home to an 86% white/Caucasian population with a median age of 40.4 years. Of the
three townships, Caldwell has the oldest demographic of the three towns, with 42.5% of the
population at 45 years of age or older.
Glen Ridge
Square miles: 1.287
Population Size: 7618
Density: 5919.2 per square mile
Glen Ridge lies adjacent to Bloomfield along the Glen Ridge eastern border and was, in fact, part of
the township of Bloomfield prior to its incorporation in 1895. Prior to 2008, Bloomfield and Glen
Ridge had contracted for health services, with a several year interruption. The current Glen Ridge
contract with BDHHS began in January 2012.
The majority of the Glen Ridge population is white/Caucasian, at 82.4% of the total. Although
Bloomfield has the lowest median age of the three towns, Glen Ridge has the highest percentage,
among the three towns, of children under the age of 18.
All three townships, as shown in Table 2, are above county, state, and national levels in
attainment of high school diplomas and bachelors’ degrees. However, in comparing the three
townships, the spread between percentages of population achieving a bachelors’ degree or higher
is meaningful. There is a 17.8% spread between Bloomfield and Caldwell and a 39.7% spread
between Bloomfield and the adjacent town of Glen Ridge.
9
Methodology of the Community Health Assessment
For the Community Health Assessment, a mixed method of data collection was used to enable
analysis of both quantitative and qualitative data from the three townships. The methods allowed
for gathering data from different types of participants, including random selection of adults over
18 years of age (N = 604) for participation in a telephone survey, three (3) specific focus groups
(faith-based, senior living, recreation department), and ten (10) key information interviews with
representatives from other Bloomfield agencies involved in the CHA process.
Data collection instruments, prepared by CREEHS, according to the agreement with the BDHHS,
included a Community Health Telephone Survey, a Community Focus Group Protocol, and a Key
Informant Interview Protocol. The Montclair State University Institutional Review Board (MSU
IRB) reviewed these instruments and protocols to ensure that all data collection was performed in
compliance with federal and state laws governing research that is conducted with human
participants.
The instruments and protocols were coordinated to build a strong assessment for presentation to
the PHAB and also to identify the needs of the BDHHS service area (e.g., behaviors, attitudes, and
barriers) relative to accessing available services, healthy eating and active living, and perceptions
of the most pressing public health issues in the community. Data were collected by Braun
Research Inc. (telephone survey) and BDHHS (focus groups and key informant) during the months
of March and April 2013.
The three methods are described in further detail below.
Community Health Telephone Survey
The Community Health Telephone Survey was designed and administered to gather quantitative
data about community members’ behaviors, attitudes, and awareness in the following areas:
access to local public health services, healthy eating and active living, and pressing public health
issues in the local communities. The survey, included in Appendix A, consists of locally developed
items, as well as items adapted from existing, validated survey instruments [e.g., the Center for
Disease Control’s National Behavioral Risk Factor Surveillance Systems (BRFSS, 6) and National
Health and Nutrition Examination Survey (NHANES, 7), and the U.S. Department of
Transportation’s National Survey of Bicyclists and Pedestrian Attitudes and Behavior (8)]. Survey
items were selected and adapted in collaboration with the Bloomfield Department of Health and
Human Services and with Partners for Health program staff.
10
The telephone survey was administered by Braun Research, Inc. of Princeton, to a random sample
of 604 households with a breakdown of 401 households in Bloomfield (zip code 07003), 100 in
Caldwell (zip code 07007) and 103 in Glen Ridge (zip code 07028). The survey was open for a
response by any adult (aged 18 or older) with confirmation that they lived in
Bloomfield/Caldwell/Glen Ridge. The confidence level of the telephone survey sample was +/-5%
for Bloomfield, and +/-9% for Glen Ridge and Caldwell.
In the interest of keeping the time for administration of the telephone survey to no more than 10
minutes, questions regarding public health announcements and disaster preparedness, impact of
local, state and national events on the community, and questions regarding collaboration with
other local agencies were not asked during the telephone survey. These topics were covered in
the focus groups and key informant interviews.
Before the start of each individual survey, participants were asked to consent to their willingness
to participate in this study and informed of their rights as a study participant. Each interview ran
for approximately 10 minutes.
Survey data were processed and analyzed using appropriate quantitative methods (e.g.,
frequencies, descriptive statistics). Summary data are reviewed in this report, with more detailed
survey responses presented in Appendix B.
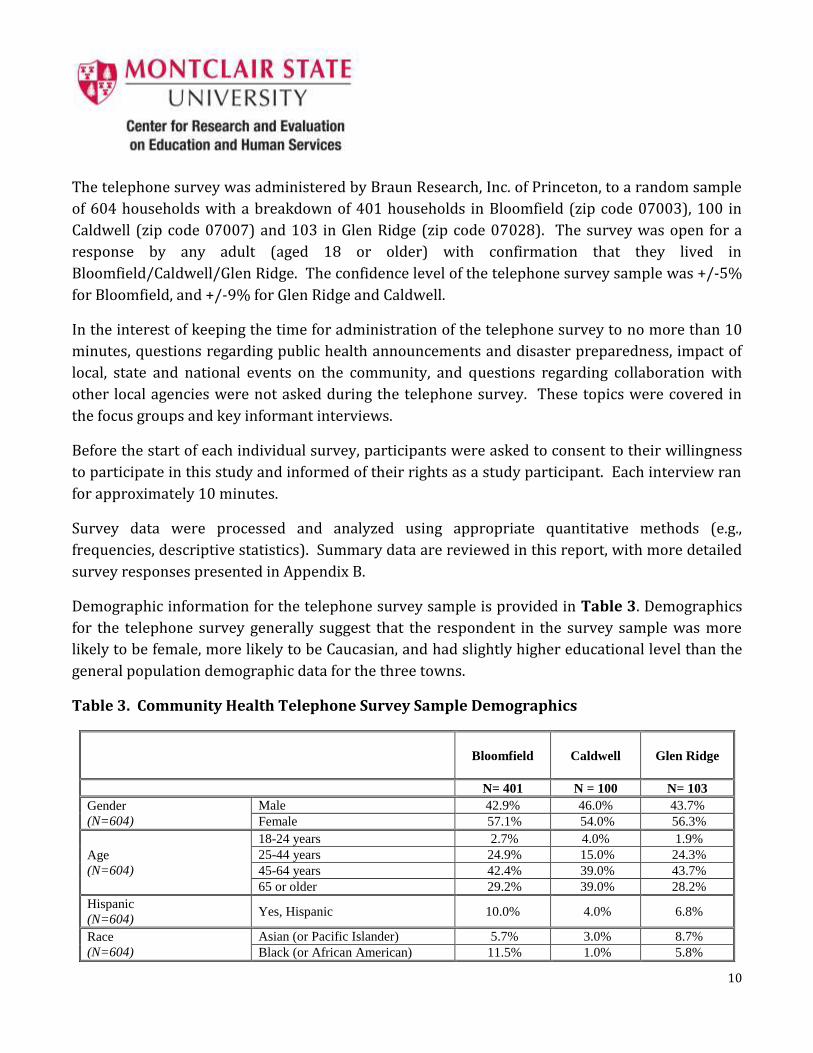
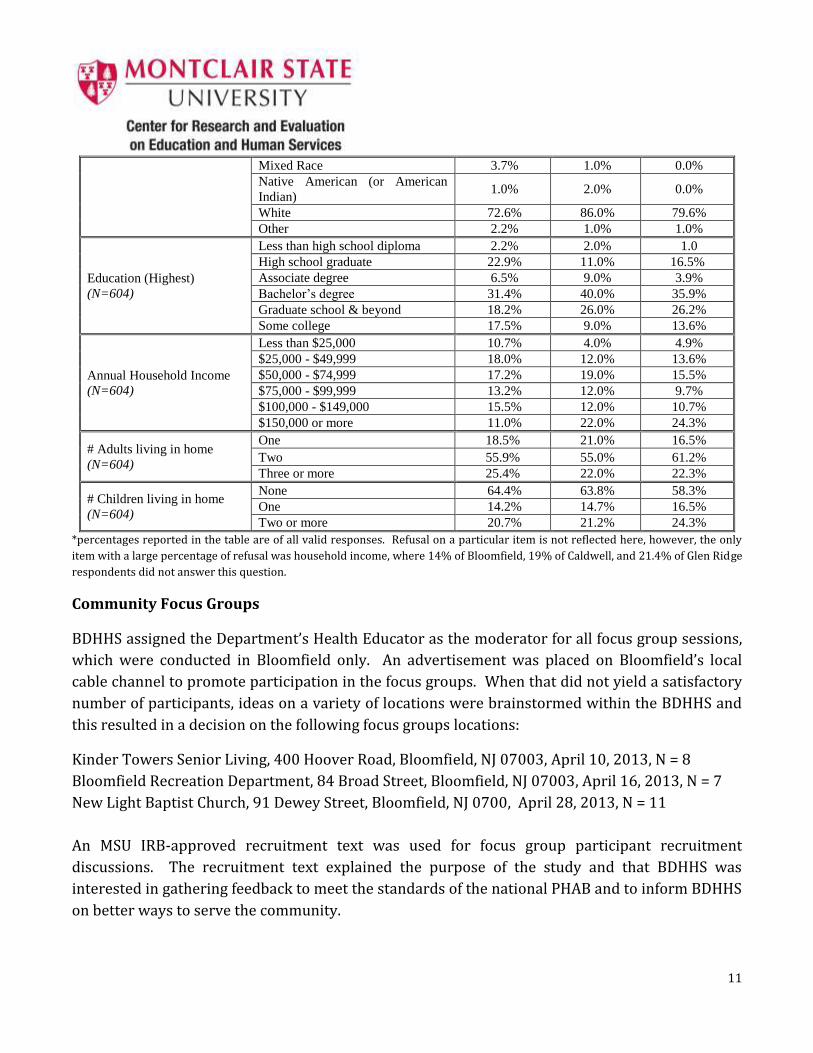
Demographic information for the telephone survey sample is provided in Table 3. Demographics
for the telephone survey generally suggest that the respondent in the survey sample was more
likely to be female, more likely to be Caucasian, and had slightly higher educational level than the
general population demographic data for the three towns.
Table 3. Community Health Telephone Survey Sample Demographics
Bloomfield Caldwell
Glen Ridge
N= 401 N = 100 N= 103
Gender
(N=604)
Male 42.9% 46.0% 43.7%
Female 57.1% 54.0% 56.3%
Age
(N=604)
18-24 years 2.7% 4.0% 1.9%
25-44 years 24.9% 15.0% 24.3%
45-64 years 42.4% 39.0% 43.7%
65 or older 29.2% 39.0% 28.2%
Hispanic
(N=604) Yes, Hispanic 10.0% 4.0% 6.8%
Race
(N=604)
Asian (or Pacific Islander) 5.7% 3.0% 8.7%
Black (or African American) 11.5% 1.0% 5.8%
11
Mixed Race 3.7% 1.0% 0.0%
Native American (or American
Indian) 1.0% 2.0% 0.0%
White 72.6% 86.0% 79.6%
Other 2.2% 1.0% 1.0%
Education (Highest)
(N=604)
Less than high school diploma 2.2% 2.0% 1.0
High school graduate 22.9% 11.0% 16.5%
Associate degree 6.5% 9.0% 3.9%
Bachelor’s degree 31.4% 40.0% 35.9%
Graduate school & beyond 18.2% 26.0% 26.2%
Some college 17.5% 9.0% 13.6%
Annual Household Income
(N=604)
Less than $25,000 10.7% 4.0% 4.9%
$25,000 - $49,999 18.0% 12.0% 13.6%
$50,000 - $74,999 17.2% 19.0% 15.5%
$75,000 - $99,999 13.2% 12.0% 9.7%
$100,000 - $149,000 15.5% 12.0% 10.7%
$150,000 or more 11.0% 22.0% 24.3%
# Adults living in home
(N=604)
One 18.5% 21.0% 16.5%
Two 55.9% 55.0% 61.2%
Three or more 25.4% 22.0% 22.3%
# Children living in home
(N=604)
None 64.4% 63.8% 58.3%
One 14.2% 14.7% 16.5%
Two or more 20.7% 21.2% 24.3%
*percentages reported in the table are of all valid responses. Refusal on a particular item is not reflected here, however, the only
item with a large percentage of refusal was household income, where 14% of Bloomfield, 19% of Caldwell, and 21.4% of Glen Ridge
respondents did not answer this question.
Community Focus Groups
BDHHS assigned the Department’s Health Educator as the moderator for all focus group sessions,
which were conducted in Bloomfield only. An advertisement was placed on Bloomfield’s local
cable channel to promote participation in the focus groups. When that did not yield a satisfactory
number of participants, ideas on a variety of locations were brainstormed within the BDHHS and
this resulted in a decision on the following focus groups locations:
Kinder Towers Senior Living, 400 Hoover Road, Bloomfield, NJ 07003, April 10, 2013, N = 8
Bloomfield Recreation Department, 84 Broad Street, Bloomfield, NJ 07003, April 16, 2013, N = 7
New Light Baptist Church, 91 Dewey Street, Bloomfield, NJ 0700, April 28, 2013, N = 11
An MSU IRB-approved recruitment text was used for focus group participant recruitment
discussions. The recruitment text explained the purpose of the study and that BDHHS was
interested in gathering feedback to meet the standards of the national PHAB and to inform BDHHS
on better ways to serve the community.
12
Before the start of each focus group, participants were asked to review and complete consent
forms indicating their willingness to participate in this study and informing them of their rights as
a study participant. Focus groups ran between 25-55 minutes. With the permission of all
participants, focus groups were digitally recorded. Recordings and hand-written notes were then
content analyzed for common themes and summarized. A copy of the focus group protocol used is
included in Appendix A.
Questions regarding public health announcements and disaster preparedness were asked during
the focus groups, but not during the telephone survey and key informant interviews. Personal
health questions were not asked during the focus groups.
Community Focus Group data was analyzed by identifying typical themes, and triangulating focus
group data, where possible, with interviews, and telephone surveys.
Key Informant Interviews
For the third source of data and to address the PHAB’s strong suggestion for data that reflects
ongoing community collaboration, BDHHS conducted structured interviews with 10 key
informants and stakeholders from other agencies and organizations in the Bloomfield community.
Key informant interviews did not take place in Caldwell or Glen Ridge. The key informants were
representatives of the following organizations and services:
Bloomfield Volunteer Emergency Squad Bloomfield Government
A faith-based organization United Way - Bloomfield
A local business Bloomfield College
Clara Maass Medical Center Bloomfield High School
UMC Hackensack/Mountainside Hospital Bloomfield Recreation Department
BDHHS assigned the Department’s Health Educator and one Health Inspector as the interviewers
for all key informant interviews. An MSU IRB-approved recruitment text was used for interview
participant recruitment discussions. The recruitment text explained the purpose of the study and
that BDHHS was interested in gathering feedback to meet the standards of the national PHAB and
to inform BDHHS on better ways to serve the community. Potential participants were approached
in person and by telephone and email.
Questions regarding the impact of local, state and national events on the community, and
questions regarding collaboration with other local agencies, were asked during the key informant
interviews, but not during the telephone survey and focus groups. Personal health questions were
not asked during the key informant interviews.
13
Before the start of each interview, participants were asked to review and complete consent forms
indicating their willingness to participate in this study and informing them of their rights as a
study participant. Interviews ran from 25-55 minutes. With the permission of the participants,
interviews were digitally recorded. Recordings and hand-written notes were then content
analyzed for common themes and summarized. Common themes from the key informant
Interview data were identified and triangulated with focus group and telephone survey data,
wherever possible. A copy of the key informant interview protocol used is included in Appendix A.
RESULTS OF THE COMMUNITY HEALTH ASSESSMENT
The study was designed to provide an up-to-date Community Health Assessment for the
application requirements of the Public Health Accreditation Board, as well as to secure current
data to inform and improve public health services delivered by BDHHS. A mixed methods
approach, using three different types of data collection was implemented to gather information
about: residents’ current behaviors and attitudes in the areas of personal health, nutrition and
physical activity; community health including significant health issues and barriers; public health
announcements and disaster preparedness; quality of life in the community; and collaboration
among community agencies.
In most cases, the data are discussed by township since the demographics of the townships
involved in the CHA differ in important ways. Aggregate results of data are available in Appendix
B. Note that the telephone survey was conducted in all three townships, while focus groups and
interviews occurred only in Bloomfield.
14
PERSONAL HEALTH
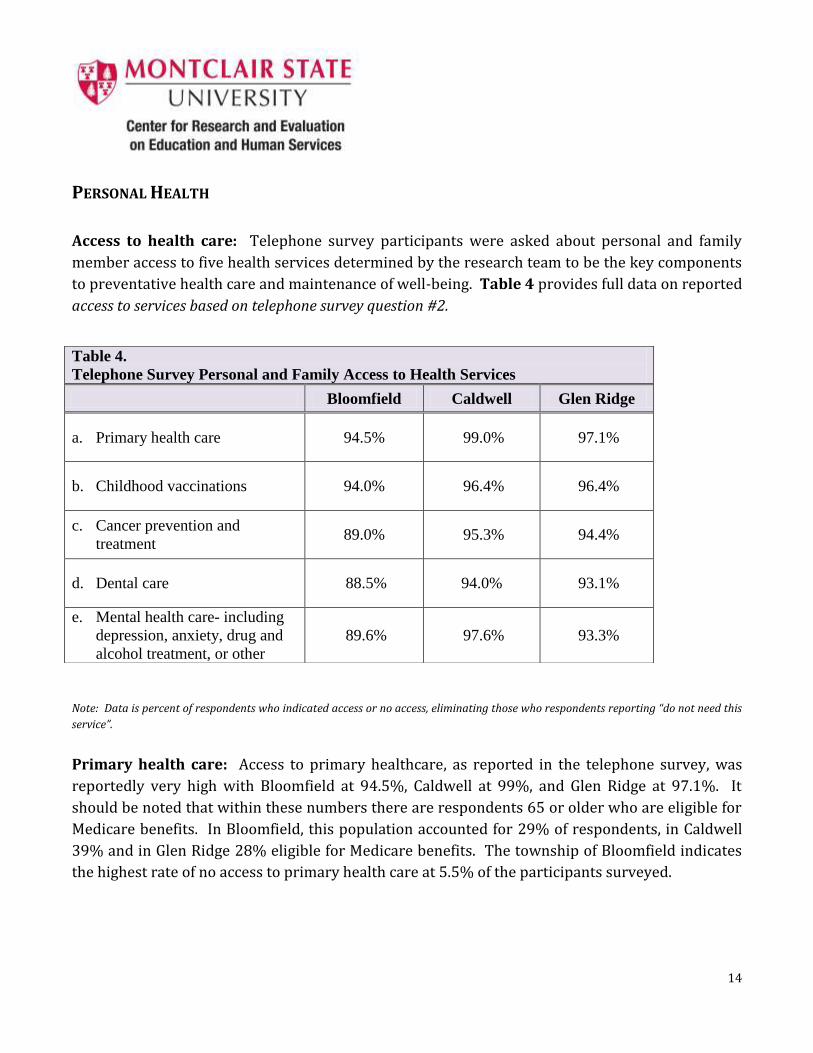
Access to health care: Telephone survey participants were asked about personal and family
member access to five health services determined by the research team to be the key components
to preventative health care and maintenance of well-being. Table 4 provides full data on reported
access to services based on telephone survey question #2.
Note: Data is percent of respondents who indicated access or no access, eliminating those who respondents reporting “do not need this
service”.
Primary health care: Access to primary healthcare, as reported in the telephone survey, was
reportedly very high with Bloomfield at 94.5%, Caldwell at 99%, and Glen Ridge at 97.1%. It
should be noted that within these numbers there are respondents 65 or older who are eligible for
Medicare benefits. In Bloomfield, this population accounted for 29% of respondents, in Caldwell
39% and in Glen Ridge 28% eligible for Medicare benefits. The township of Bloomfield indicates
the highest rate of no access to primary health care at 5.5% of the participants surveyed.
Table 4.
Telephone Survey Personal and Family Access to Health Services
Bloomfield Caldwell Glen Ridge
a. Primary health care 94.5% 99.0% 97.1%
b. Childhood vaccinations 94.0% 96.4% 96.4%
c. Cancer prevention and
treatment 89.0% 95.3% 94.4%
d. Dental care 88.5% 94.0% 93.1%
e. Mental health care- including
depression, anxiety, drug and
alcohol treatment, or other
89.6% 97.6% 93.3%
15
Childhood vaccinations: This question is obviously only relevant to those with children, thus, a
high percentage of respondents in all three townships indicated that they do not require this
service (Bloomfield 40.9%, Caldwell 45%, Glen Ridge 46.6%). Of those that do require the service,
access to childhood vaccines was reported at 94% in Bloomfield, and 96.4% in both Caldwell and
Glen Ridge, similar to their responses for access to primary health care services.
Cancer prevention and treatment services: The overwhelming majority of respondents also
indicated that they had access to cancer prevention and treatment, at 89% in Bloomfield, 95.3% in
Caldwell, and 94.4% in Glen Ridge. Some respondents may have been confused by the inclusion of
both prevention and treatment, since 10-11% of all survey respondents claimed “don’t need this
service”, perhaps focusing more on treatment than prevention.
Dental care: Dental care access was also reportedly high, with 88.5% in Bloomfield, 94% in
Caldwell, and 93.1% in Glen Ridge. Notably, however, is that although primary care was reported
to be very high in all three communities, more than one in ten Bloomfield respondents reported
no access to dental care.
Mental health care: The question about mental health care access included further definition
regarding respondent’s access to treatment for depression, anxiety, drug and alcohol treatment, or
other. Reports of access to mental health care services, were similar or higher than dental care
access, at 89.6% in Bloomfield, 97.6% in Caldwell and 93.3% in Glen Ridge. Notably, however,
more than one in ten respondents indicated that they “don’t need this service” at 11.7% in
Bloomfield, 14% in Caldwell and 13.5% in Glen Ridge.
16
Table 5 supplies the complete data gathered on barriers and lack of access to services based on
Telephone Survey Question 2.
Table 5. Reasons why respondents could not access services? (Respondent was allowed to select
more than one.)
Bloomfield Caldwell Glen Ridge
N = 86 N = 11 N = 10
Lack of time 8.7% 0.0% 0.0%
Lack of motivation 4.3% 0.0% 0.0%
Lack of childcare 4.3% 0.0% 0.0%
Lack of money 40.6% 0.0% 66.7%
Lack of transportation 5.8% 16.7% 0.0%
Not physically capable 2.9% 0.0% 0.0%
Don’t know how to
access these services 30.4% 83.3% 33.3%
Barriers to accessing a variety of services was discussed in the survey, focus groups, and
interviews, but were asked reflective of different groups. That is, the phone survey asked people
to reflect on their own access to services, while the focus groups and interview participants were
asked about general access in the community.
Telephone survey respondents that answered “no” to any portion of the question regarding access
to the above services were further prompted for reasons as to why he/she/family members do not
have access to the services (Table 5). Bloomfield had the highest number of respondents
reporting no to any of the health care items (86), with 29 out of 86 (40.6%) reporting “lack of
money” as a barrier, and 21 out of 86 respondents (30.4%) reporting that they “don’t know how to
access these services.” Only 11 respondents in Caldwell and 10 respondents in Glen Ridge
answered no to any of the questions on access. Although the percentages for these two townships
are based on very small numbers, the barriers mentioned most often for Caldwell and Glen Ridge
were also “lack of money” and “don’t know how to access these services.”
17
Questions about barriers to access were also asked in the focus groups in Bloomfield, however,
responses reflected less on specific health services, and more about what was generally typical of
their community. The following themes were given when asked what barriers are keeping
community members from using “existing services”. Notably, many of the respondents focused on
barriers to personal health behaviors, rather than to services.
Insufficient number of days/week that transportation is available for food shopping
Disability inhibits walking/activity
Need general knowledge of what services are available
Red tape/bureaucracy
Need (more) health, nutrition, exercise classes, overcrowded exercise classes
Similarly, key informant respondents were asked about barriers to services in Bloomfield, and
offered the following general categories or themes:
Lack of awareness, lack of education
Lack of inpatient beds available for mental health patients. Many using ER
Uninsured/underinsured residents
Not enough (free) services, resulting in long waits, and making it harder for the working
poor
Older and student populations do not understand what is available for them
Fear factor for the undocumented population, homeless are ashamed
Lack of enthusiasm to become involved in improving personal health
Lack of time
Payment for health care: Respondents were asked how they currently pay for medical and
dental expenses and prompted to answer to “all that apply” from a list including private health
insurance, Veteran’s Administration, Medicare/Medicaid, NJ Family Care, cash, charity are, and
other. For medical expenses the most common method of payment is private health insurance
(e.g., Horizon, HMO, etc.) with percentages at approximately 79% for Bloomfield, 80% for
Caldwell, 85% for Glen Ridge. Medicare/Medicaid is used by approximately 36% of Bloomfield
respondents, 40% in Caldwell and 28% in Glen Ridge. These Medicare/Medicaid numbers are
directly correlated with the number of telephone survey respondents age 65 and older: 29%
Bloomfield, 39% Caldwell and 28% Glen Ridge.
18
For dental expenses, payment methods differ dramatically from other medical services, with use
of private dental insurance by approximately 62% of Bloomfield respondents, 60% Caldwell, 68%
Glen Ridge, to paying with cash (no insurance, or not covered) by approximately 31% in
Bloomfield, 35% in Caldwell, and 29% in Glen Ridge respondents.
With respondents allowed to state all forms of payment that apply, the number of overall
responses in both the medical (846) and dental (614) categories indicate that many residents are
using more than one form of payment for care. Many, for example, use Medicare plus a private
health insurance supplement, or private health insurance plus cash. In addition, AARP, employers,
military, friends and family that are doctors or dentists, were sources of payment (or free care)
mentioned.
Rating personal health on a 5 point scale: When respondents were asked to rate their personal
health on a five point scale with 1 being very unhealthy and 5 being very healthy, percentages of
respondents who self-rated their health at 5 or 4 were reported as:
Bloomfield: 79%
Caldwell : 82%
Glen Ridge: 90%
Self-ratings at the “1” level, very unhealthy, are limited, but may reflect a slight bias in terms of
who is available for telephone surveys:
Bloomfield 1.2%
Caldwell 1%
Glen Ridge 0%
Health screenings: Respondents to the telephone survey were asked to report which health
screenings she/he had completed during the past year and again were prompted to answer to “all
that apply” from a list including cholesterol, blood sugar for diabetes, blood pressure, dental,
prostate, mammogram, pap smear (the last three dependent on gender) (Table 6).
19
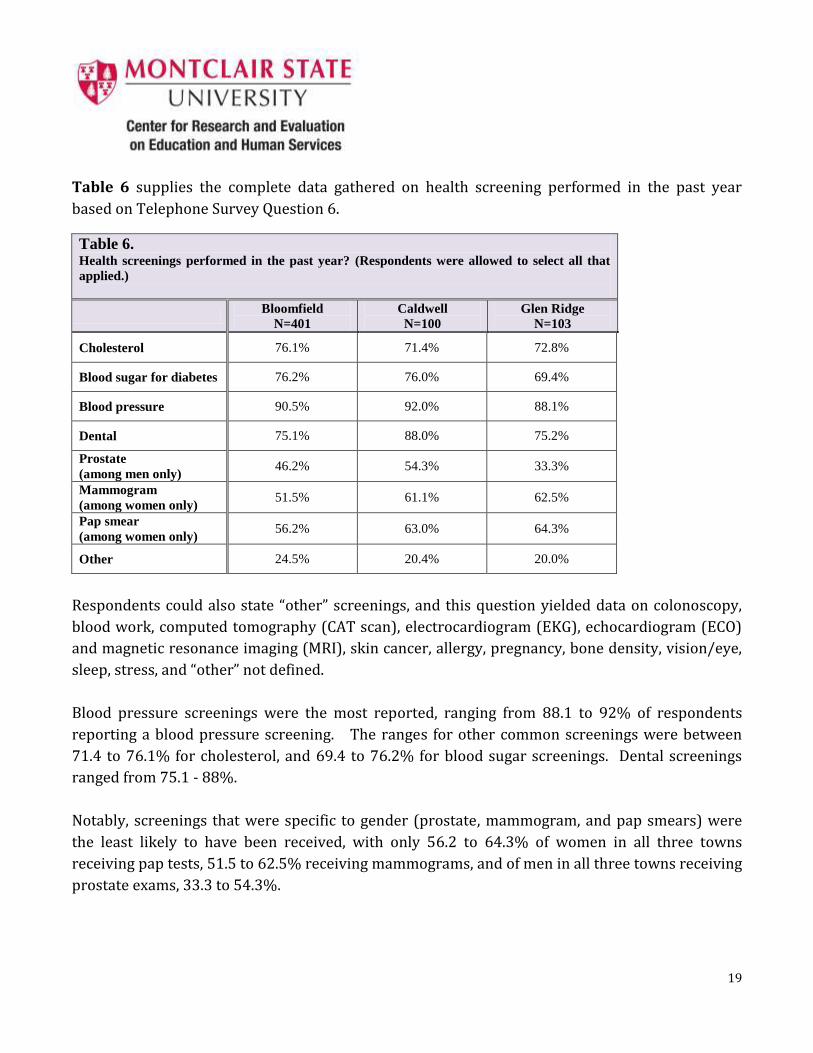
Table 6 supplies the complete data gathered on health screening performed in the past year
based on Telephone Survey Question 6.
Table 6. Health screenings performed in the past year? (Respondents were allowed to select all that
applied.)
Bloomfield
N=401
Caldwell
N=100
Glen Ridge
N=103
Cholesterol 76.1% 71.4% 72.8%
Blood sugar for diabetes 76.2% 76.0% 69.4%
Blood pressure 90.5% 92.0% 88.1%
Dental 75.1% 88.0% 75.2%
Prostate
(among men only) 46.2% 54.3% 33.3%
Mammogram
(among women only) 51.5% 61.1% 62.5%
Pap smear
(among women only) 56.2% 63.0% 64.3%
Other 24.5% 20.4% 20.0%
Respondents could also state “other” screenings, and this question yielded data on colonoscopy,
blood work, computed tomography (CAT scan), electrocardiogram (EKG), echocardiogram (ECO)
and magnetic resonance imaging (MRI), skin cancer, allergy, pregnancy, bone density, vision/eye,
sleep, stress, and “other” not defined.
Blood pressure screenings were the most reported, ranging from 88.1 to 92% of respondents
reporting a blood pressure screening. The ranges for other common screenings were between
71.4 to 76.1% for cholesterol, and 69.4 to 76.2% for blood sugar screenings. Dental screenings
ranged from 75.1 - 88%.
Notably, screenings that were specific to gender (prostate, mammogram, and pap smears) were
the least likely to have been received, with only 56.2 to 64.3% of women in all three towns
receiving pap tests, 51.5 to 62.5% receiving mammograms, and of men in all three towns receiving
prostate exams, 33.3 to 54.3%.
20
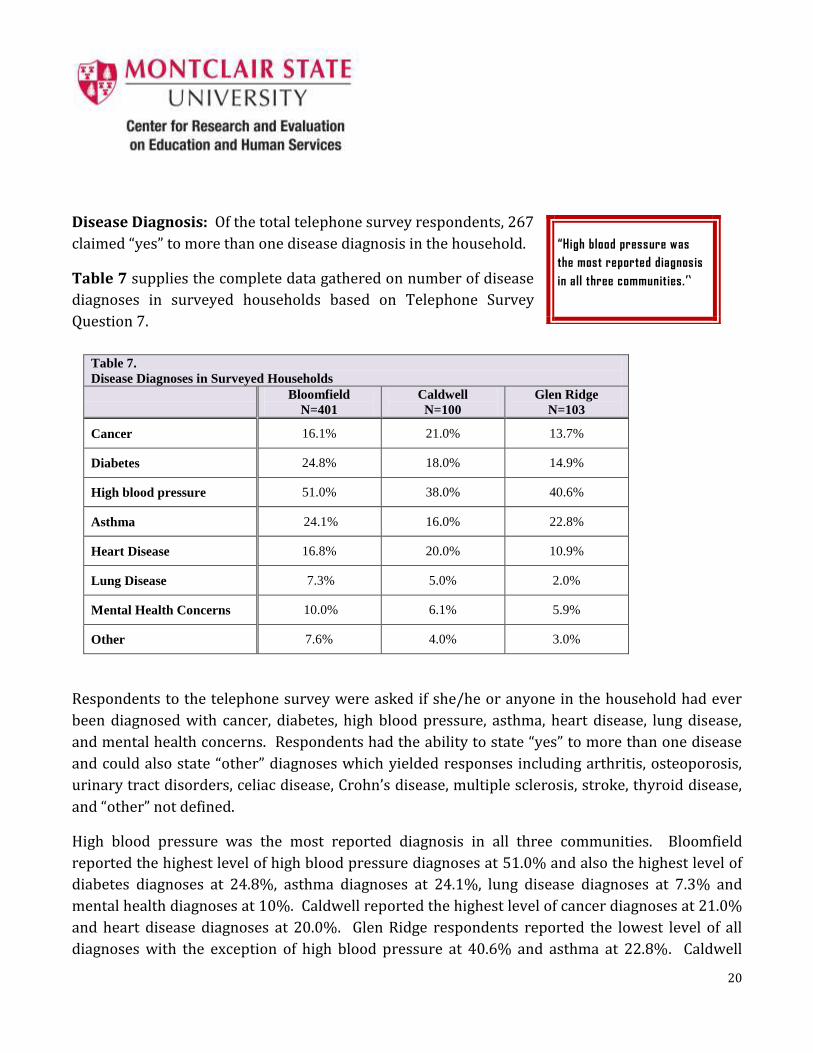
Disease Diagnosis: Of the total telephone survey respondents, 267
claimed “yes” to more than one disease diagnosis in the household.
Table 7 supplies the complete data gathered on number of disease
diagnoses in surveyed households based on Telephone Survey
Question 7.
Table 7.
Disease Diagnoses in Surveyed Households
Bloomfield
N=401
Caldwell
N=100
Glen Ridge
N=103
Cancer 16.1% 21.0% 13.7%
Diabetes 24.8% 18.0% 14.9%
High blood pressure 51.0% 38.0% 40.6%
Asthma 24.1% 16.0% 22.8%
Heart Disease 16.8% 20.0% 10.9%
Lung Disease 7.3% 5.0% 2.0%
Mental Health Concerns 10.0% 6.1% 5.9%
Other 7.6% 4.0% 3.0%
Respondents to the telephone survey were asked if she/he or anyone in the household had ever
been diagnosed with cancer, diabetes, high blood pressure, asthma, heart disease, lung disease,
and mental health concerns. Respondents had the ability to state “yes” to more than one disease
and could also state “other” diagnoses which yielded responses including arthritis, osteoporosis,
urinary tract disorders, celiac disease, Crohn’s disease, multiple sclerosis, stroke, thyroid disease,
and “other” not defined.
High blood pressure was the most reported diagnosis in all three communities. Bloomfield
reported the highest level of high blood pressure diagnoses at 51.0% and also the highest level of
diabetes diagnoses at 24.8%, asthma diagnoses at 24.1%, lung disease diagnoses at 7.3% and
mental health diagnoses at 10%. Caldwell reported the highest level of cancer diagnoses at 21.0%
and heart disease diagnoses at 20.0%. Glen Ridge respondents reported the lowest level of all
diagnoses with the exception of high blood pressure at 40.6% and asthma at 22.8%. Caldwell
“High blood pressure was
the most reported diagnosis
in all three communities.”
21
reported the lowest numbers in high blood pressure diagnoses at 38.0% and asthma diagnoses at
16.0%.
Nutrition: All three methods of the Community Health Assessment included questions regarding
consumption of fruits and vegetables. Telephone survey respondents were also asked about
consumption of sugar sweetened beverages. The structure of the questions regarding fruit and
vegetable consumption differed between methods, however, the data can be reviewed together to
provide depth to the picture of attitudes and behaviors in the community.
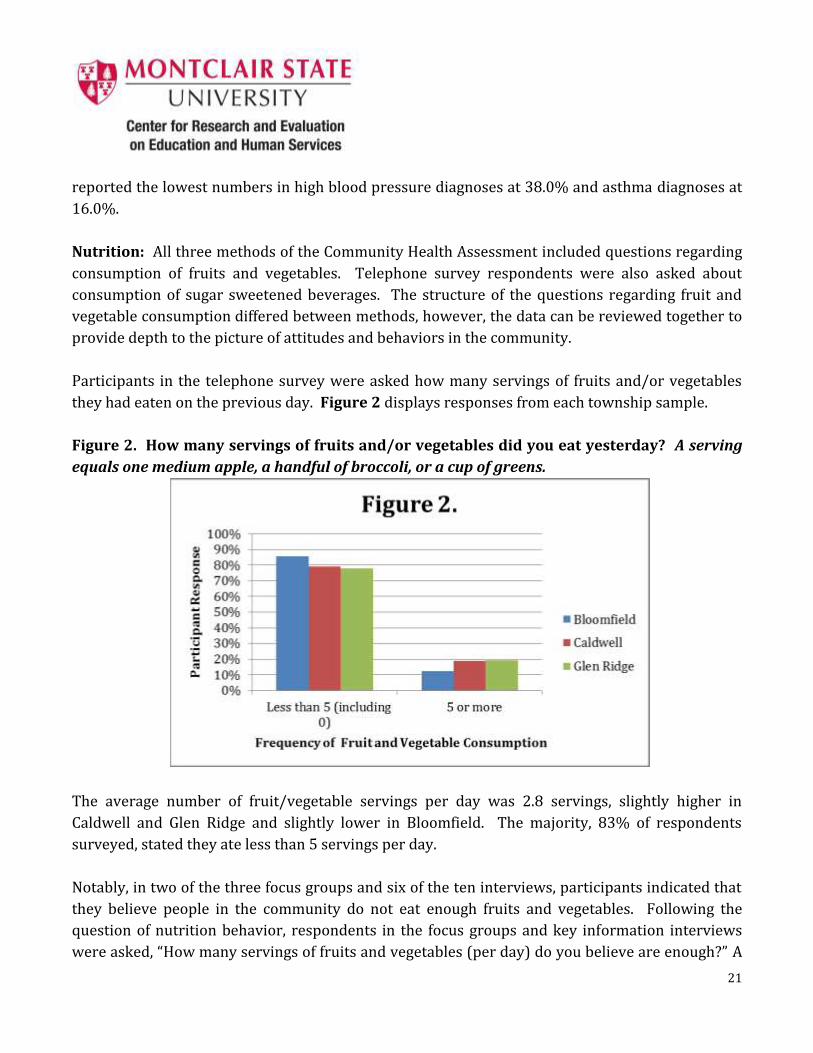
Participants in the telephone survey were asked how many servings of fruits and/or vegetables
they had eaten on the previous day. Figure 2 displays responses from each township sample.
Figure 2. How many servings of fruits and/or vegetables did you eat yesterday? A serving
equals one medium apple, a handful of broccoli, or a cup of greens.
The average number of fruit/vegetable servings per day was 2.8 servings, slightly higher in
Caldwell and Glen Ridge and slightly lower in Bloomfield. The majority, 83% of respondents
surveyed, stated they ate less than 5 servings per day.
Notably, in two of the three focus groups and six of the ten interviews, participants indicated that
they believe people in the community do not eat enough fruits and vegetables. Following the
question of nutrition behavior, respondents in the focus groups and key information interviews
were asked, “How many servings of fruits and vegetables (per day) do you believe are enough?” A

22
total of 36 people were asked this question, across the two data methods with the following
results:
6-11 servings per day 18 respondents, 50%
1-5 servings per day 4 respondents, 11%
Respondents in the focus groups and interviews were also prompted to discuss what would make
it easier for community members to eat more fruits and vegetables. The following themes were
reported as ideas for how to enable community members to eat more fruits and vegetables:
Fruits and vegetables need to be cheaper
It is cheaper to eat “fast” foods
Increase farmers’ markets in number, size, variety of produce, access (now only one
small farmers’ market); Have one on both ends of town, not only in center; Have it for
more than the summer season
Make township bus available for food shopping more than current schedule of 2 times
per week
More conveniently located store that sells fruits and vegetables
Delivery of fruits and vegetables to certain locations (such as Kinder Towers lobby)
Better teaching in the schools about healthy eating
Awareness campaigns (about healthy eating)
United Way and other non-profits can help on an educational level
Partner with a chef; Provide education on how to prepare fruits and vegetables so that
they last for the entire week
Engage a nutritionist and the school newspaper
Specifically, interview respondents noted the following barriers to eating fruits and vegetables in
their communities:
Parents do not have enough time.
Our culture is not active.
Children do not want to exert themselves.
Healthy eating is not made attractive.
More access to green markets, community markets, victory gardens.
There are cultural beliefs about eating certain foods.
23
With regard to healthy eating, the telephone survey respondents were also asked, on average, how
many sugar sweetened sodas or other sweetened drinks do you drink per day? It was further
defined that: One serving equals one 12 ounce can, bottle, or glass. Include sweetened iced tea,
sports drinks, fruit punch or other fruit-flavored drinks. Do NOT include diet soda, seltzer, sugar free
drinks, or 100% juice.
The mean number of servings per day reported for the entire respondent group was .46, or less
than one half serving per day, however 70% or more respondents said that they do not drink any
servings. Thus, among only those who drink sugar sweetened beverages, 16% in Bloomfield,
22.7% in Caldwell, and 1% in Glen Ridge report drinking three or more sugar sweetened
beverages a day.
Physical activity: Respondents to all three data collection methods (telephone survey, focus
groups, key informant interviews) in the Community Health Assessment were asked questions
regarding physical activity. The structure of the questions regarding physical activity differed
slightly between methods, however, the data can be reviewed together to provide more depth to
the picture of physical activity in the community.
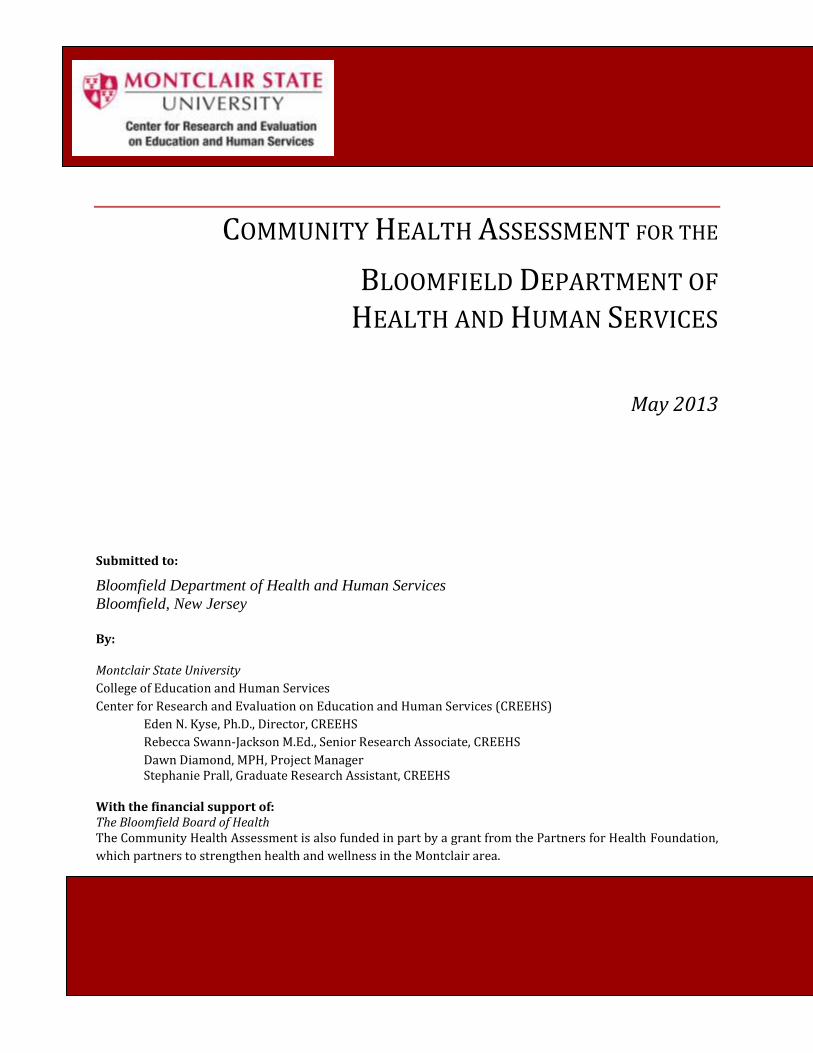
Participants in the telephone survey were asked how frequently they participated in physical
activity during the past month. Figure 3 displays responses from each township sample.
24
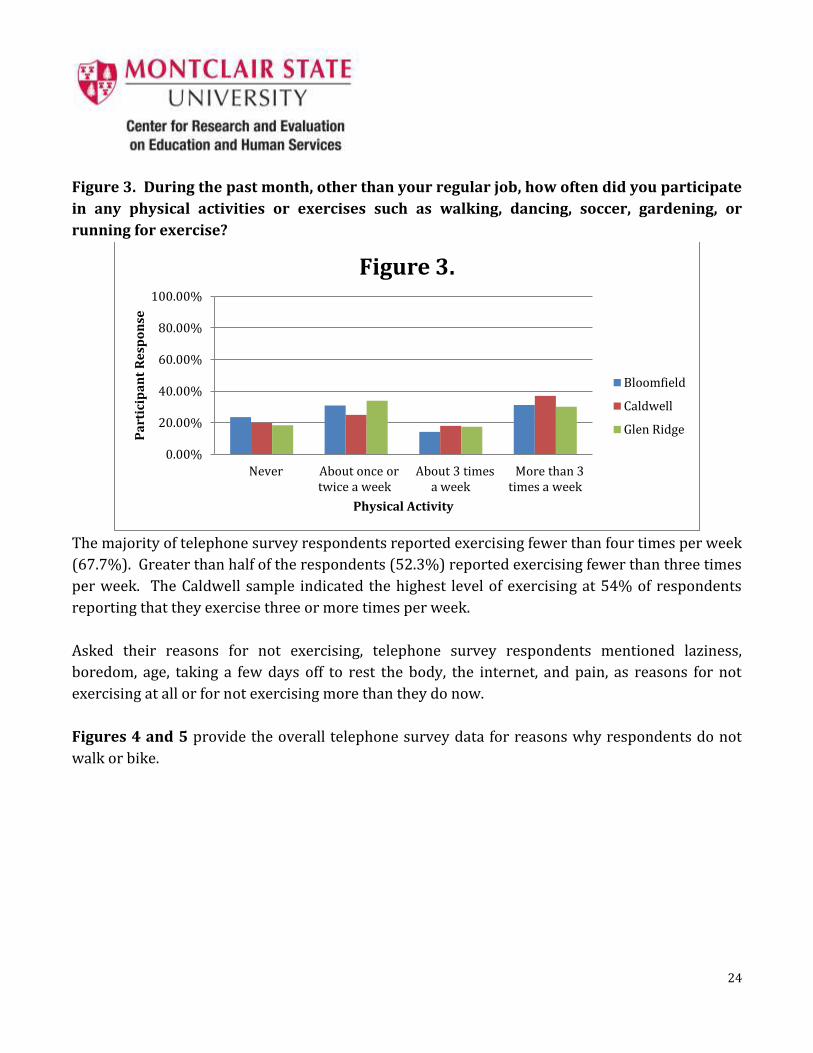
Figure 3. During the past month, other than your regular job, how often did you participate
in any physical activities or exercises such as walking, dancing, soccer, gardening, or
running for exercise?
The majority of telephone survey respondents reported exercising fewer than four times per week
(67.7%). Greater than half of the respondents (52.3%) reported exercising fewer than three times
per week. The Caldwell sample indicated the highest level of exercising at 54% of respondents
reporting that they exercise three or more times per week.
Asked their reasons for not exercising, telephone survey respondents mentioned laziness,
boredom, age, taking a few days off to rest the body, the internet, and pain, as reasons for not
exercising at all or for not exercising more than they do now.
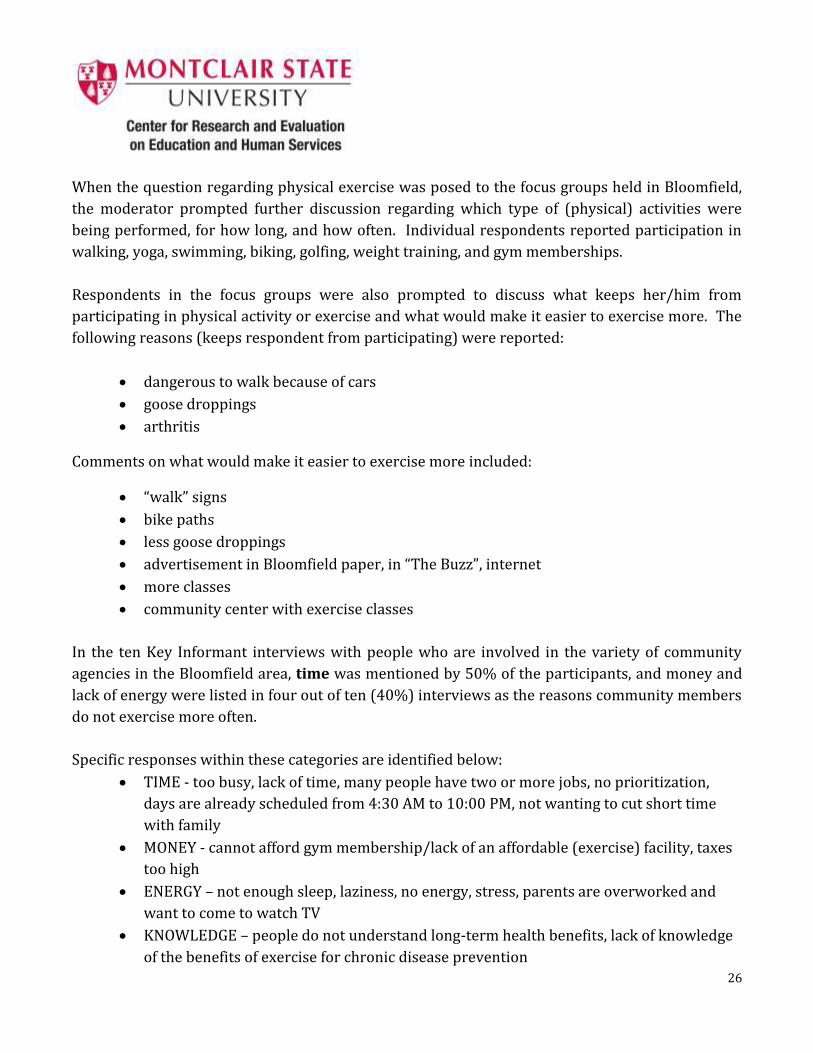
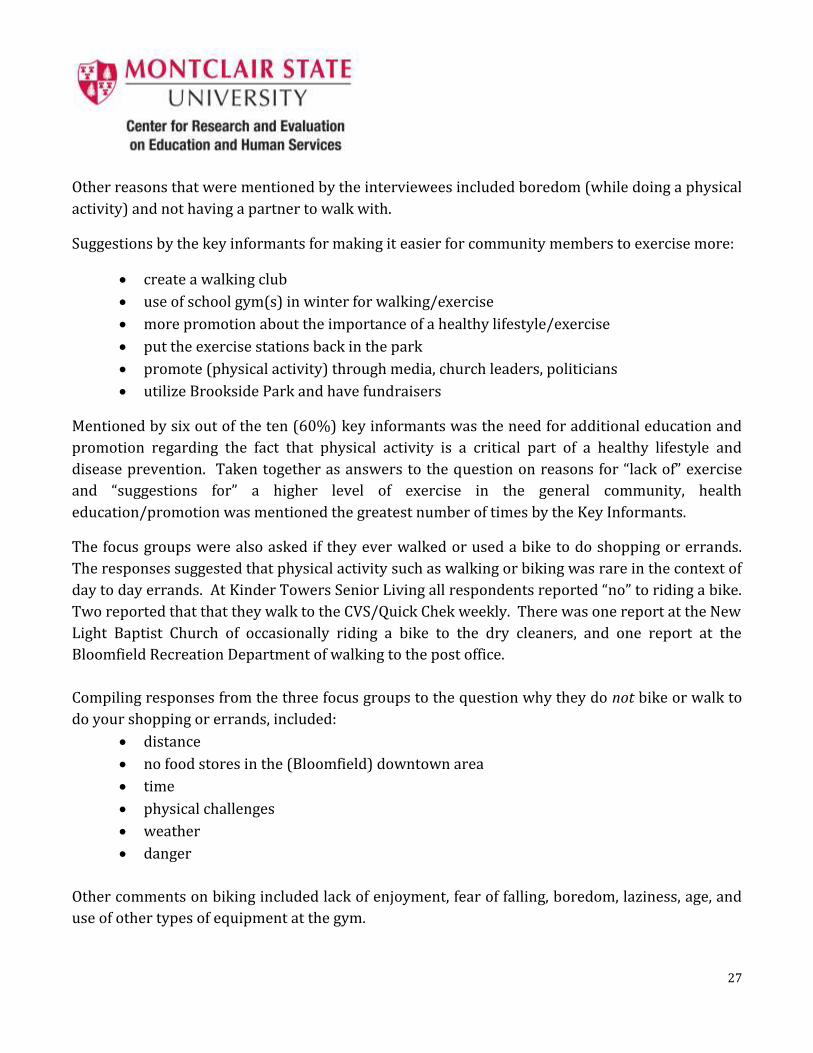
Figures 4 and 5 provide the overall telephone survey data for reasons why respondents do not
walk or bike.
0.00%
20.00%
40.00%
60.00%
80.00%
100.00%
Never About once or twice a week
About 3 times a week
More than 3 times a week
Pa
rtic
ipa
nt
Re
spo
nse
Physical Activity
Figure 3.
Bloomfield
Caldwell
Glen Ridge
25
Figure 4. What are the top reasons that respondents did not walk more frequently?
Figure 5. What are the top 2 reasons that you do not ride a bicycle more frequently?
0% 10% 20% 30% 40% 50% 60% 70% 80% 90%
100%
Bad weather/wrong
season
Too busy/no opportunity
Disability/other
health impairment
Pa
rtic
ipa
nt
Re
spo
nse
Reasons for Not Walking
Figure 4.
Bloomfield
Caldwell
Glen Ridge
0.00%
20.00%
40.00%
60.00%
80.00%
100.00%
Bad weather / Wrong season
Don't have access to a bike
Disability_other health
impairment
Pa
rtic
ipa
nt
Re
spo
nse
Reasons for Not Biking
Figure 5.
Bloomfield
Caldwell
Glen Ridge
26
When the question regarding physical exercise was posed to the focus groups held in Bloomfield,
the moderator prompted further discussion regarding which type of (physical) activities were
being performed, for how long, and how often. Individual respondents reported participation in
walking, yoga, swimming, biking, golfing, weight training, and gym memberships.
Respondents in the focus groups were also prompted to discuss what keeps her/him from
participating in physical activity or exercise and what would make it easier to exercise more. The
following reasons (keeps respondent from participating) were reported:
dangerous to walk because of cars
goose droppings
arthritis
Comments on what would make it easier to exercise more included:
“walk” signs
bike paths
less goose droppings
advertisement in Bloomfield paper, in “The Buzz”, internet
more classes
community center with exercise classes
In the ten Key Informant interviews with people who are involved in the variety of community
agencies in the Bloomfield area, time was mentioned by 50% of the participants, and money and
lack of energy were listed in four out of ten (40%) interviews as the reasons community members
do not exercise more often.
Specific responses within these categories are identified below:
TIME - too busy, lack of time, many people have two or more jobs, no prioritization,
days are already scheduled from 4:30 AM to 10:00 PM, not wanting to cut short time
with family
MONEY - cannot afford gym membership/lack of an affordable (exercise) facility, taxes
too high
ENERGY – not enough sleep, laziness, no energy, stress, parents are overworked and
want to come to watch TV
KNOWLEDGE – people do not understand long-term health benefits, lack of knowledge
of the benefits of exercise for chronic disease prevention
27
Other reasons that were mentioned by the interviewees included boredom (while doing a physical
activity) and not having a partner to walk with.
Suggestions by the key informants for making it easier for community members to exercise more:
create a walking club
use of school gym(s) in winter for walking/exercise
more promotion about the importance of a healthy lifestyle/exercise
put the exercise stations back in the park
promote (physical activity) through media, church leaders, politicians
utilize Brookside Park and have fundraisers
Mentioned by six out of the ten (60%) key informants was the need for additional education and
promotion regarding the fact that physical activity is a critical part of a healthy lifestyle and
disease prevention. Taken together as answers to the question on reasons for “lack of” exercise
and “suggestions for” a higher level of exercise in the general community, health
education/promotion was mentioned the greatest number of times by the Key Informants.
The focus groups were also asked if they ever walked or used a bike to do shopping or errands.
The responses suggested that physical activity such as walking or biking was rare in the context of
day to day errands. At Kinder Towers Senior Living all respondents reported “no” to riding a bike.
Two reported that that they walk to the CVS/Quick Chek weekly. There was one report at the New
Light Baptist Church of occasionally riding a bike to the dry cleaners, and one report at the
Bloomfield Recreation Department of walking to the post office.
Compiling responses from the three focus groups to the question why they do not bike or walk to
do your shopping or errands, included:
distance
no food stores in the (Bloomfield) downtown area
time
physical challenges
weather
danger
Other comments on biking included lack of enjoyment, fear of falling, boredom, laziness, age, and
use of other types of equipment at the gym.
28
Related to these reasons for not walking during day to day activities or errands, Bloomfield focus
group and interview participants varied on whether Bloomfield was suitable for walking, with the
following specific responses:
Not suitable for biking – need a bike lane on the main routes.
Not as a whole; but residential areas are suitable.
(Bloomfield is) a great walking community.
(For walking), Parks are good.
Not safe for children walking when school lets out.
Bloomfield is not suitable for biking or walking.
Uneven sidewalks.
No. Too much traffic.
Summarizing responses from the focus groups and the interviews together, with regard to the
question about what improvements could be made, in order to increase the Bloomfield’s
suitability for walking/biking, the important theme of safety was notable. Following are specific
quotes that reflect this theme:
It would be helpful if there were ‘walk’ signs . It would also be helpful if there were bike paths.
Nicer sidewalks.” And, “Keep sidewalks in better repair.
(Eliminate) fear in society about allowing children to be out of sight (so that the outdoor
activity doesn’t have to be organized activity and/or confined to the (residential) backyard.
Bike lanes.
(Promote) biking in places where there is less traffic.
Promote biking – Tour of Bloomfield day for bicyclists.
Promote use of track at Foley Field.
Bike lanes. We already have ‘Complete Streets’ program
Driver education definitely necessary.
Create and promote bicycle lanes, routes, mile markers. (Install) bike racks.
Make recycled bikes available. Provide helmets.
Clara Maass has walking programs and they are hoping to get the community involved.
More cross walks. Closing of some streets at times.
29
In an overall summary regarding physical exercise, only 3.9% of the
respondents of the total telephone survey sample stated that they
had no safe place to ride a bike. Bloomfield was at 3.7%. The main
reasons for not walking more often were bad weather (34.1%
aggregate) and being too busy (26.6% aggregate). 89.2%
(aggregate) of telephone respondents had not ridden a bicycle in
the past 30 days, possibly a higher percentage due to the survey being administered during the
month of March. For telephone survey respondents, the main reason for not riding a bike was the
weather at 25.3% aggregate (24.6% in Bloomfield). Bloomfield is generally rated as suitable for
walking, far less suitable for riding a bike. Telephone survey respondents were less likely to list
safety concerns, than those in the interviews and focus groups, however, it is likely that this
reflects the nature of the question wording in each of the methods. Notably, in eight out of ten key
respondent interviews and two out of three focus groups, the need for bike lanes was pronounced.
“Notably, in eight out of ten
key informant interviews and
two out of three focus
groups, the need for bike
lanes was pronounced.”
30
RESULTS ON COMMUNITY HEALTH/SIGNIFICANT HEALTH ISSUES AND BARRIERS
All three data collection methods were used to gather data on attitudes about the community’s
health needs and the most pressing health issues facing the
community. The question was similarly phrased in the telephone
questionnaire, focus group and key informant interview protocols.
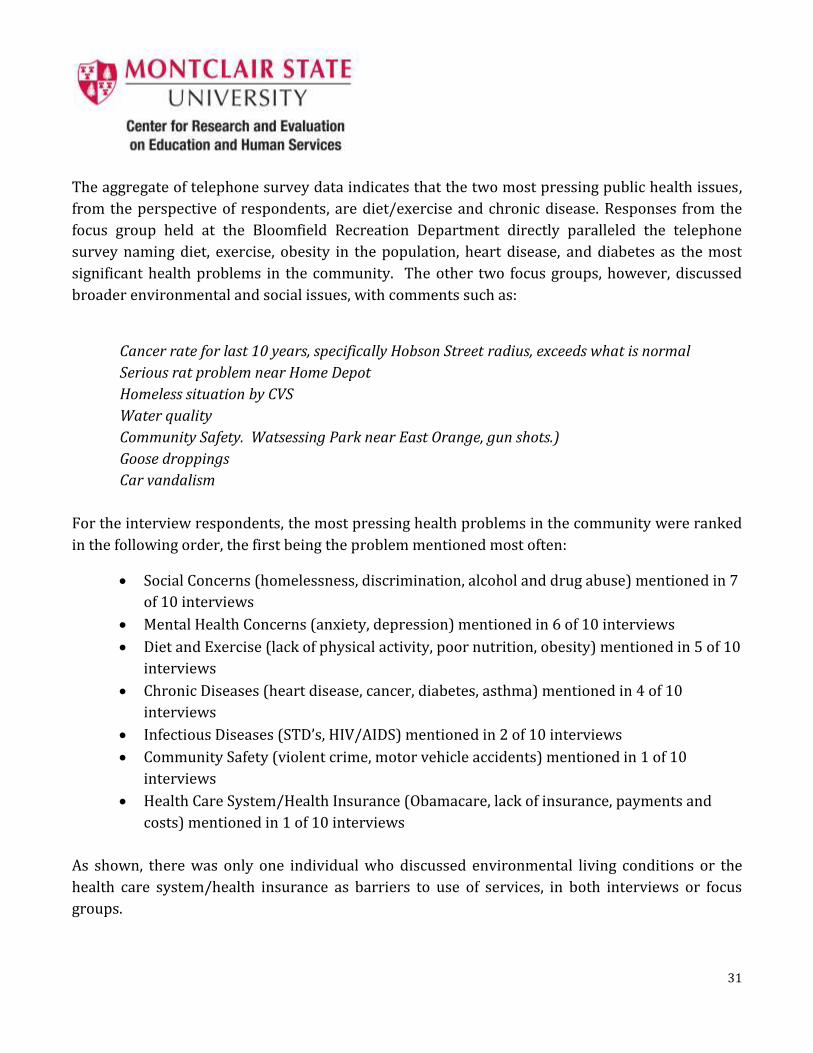
Table 8 supplies the complete data gathered on the most pressing
public health issues in the surveyed community, based on
Telephone Survey Question 15.
“Nearly 50% of the
telephone survey
respondents reported that
they believe nutrition,
exercise, and chronic
disease are the top health
issues in the community.”
Table 8.
Most pressing public health issue in the respondents’ community? (Respondents were allowed to select one.)
Bloomfield
N=401
Caldwell
N=100
Glen Ridge
N=103
Total N
Responding %
Total N
Responding %
Total N
Responding %
Infectious diseases
(STD’s, HIV/AIDS) 36 10.9% 11 11.0% 6 5.8%
Chronic diseases
(for example, heart disease, cancer,
diabetes, and asthma)
91 27.7% 27 27.0% 24 23.3%
Environmental Living
Conditions (for example, air and
water quality, mold, lead)
34
10.3% 4 4.0% 6 5.8%
Mental Health Concerns (for
example, anxiety, depression) 12 3.6% 2 2.0% 3 2.9%
Social Concerns
(for example, homelessness,
discrimination, alcohol and drug
abuse)
22 6.7% 3 3.0% 7 6.8%
Diet and Exercise
(for example, lack of physical
activity, poor nutrition, obesity)
94 28.6% 19 19.0% 34 33.0%
Community Safety
(for example, violent crime and
motor vehicle accidents)
35 10.6% 3 3.0% 8 7.8%
Health Care System/Health
Insurance
(for example, Obama Care, lack of
insurance, payments and costs)
2 0.6% 1 1.4% 0 0.0%
Other 3 0.9% 0 0.0% 1 1.1%
31
The aggregate of telephone survey data indicates that the two most pressing public health issues,
from the perspective of respondents, are diet/exercise and chronic disease. Responses from the
focus group held at the Bloomfield Recreation Department directly paralleled the telephone
survey naming diet, exercise, obesity in the population, heart disease, and diabetes as the most
significant health problems in the community. The other two focus groups, however, discussed
broader environmental and social issues, with comments such as:
Cancer rate for last 10 years, specifically Hobson Street radius, exceeds what is normal
Serious rat problem near Home Depot
Homeless situation by CVS
Water quality
Community Safety. Watsessing Park near East Orange, gun shots.)
Goose droppings
Car vandalism
For the interview respondents, the most pressing health problems in the community were ranked
in the following order, the first being the problem mentioned most often:
Social Concerns (homelessness, discrimination, alcohol and drug abuse) mentioned in 7
of 10 interviews
Mental Health Concerns (anxiety, depression) mentioned in 6 of 10 interviews
Diet and Exercise (lack of physical activity, poor nutrition, obesity) mentioned in 5 of 10
interviews
Chronic Diseases (heart disease, cancer, diabetes, asthma) mentioned in 4 of 10
interviews
Infectious Diseases (STD’s, HIV/AIDS) mentioned in 2 of 10 interviews
Community Safety (violent crime, motor vehicle accidents) mentioned in 1 of 10
interviews
Health Care System/Health Insurance (Obamacare, lack of insurance, payments and
costs) mentioned in 1 of 10 interviews
As shown, there was only one individual who discussed environmental living conditions or the
health care system/health insurance as barriers to use of services, in both interviews or focus
groups.
32
Public Health Announcements: Only the Focus Groups were asked questions regarding public
health announcements and disaster preparedness, this information being particularly of interest
to BDHHS following Hurricane Sandy. While acknowledging to the participants that multiple
sources were available from which to receive important health department notifications, the
groups were asked what sources they used. The predominant response was “Reverse 9-1-1”. The
second most common response was television and specifically the NJ News Channel.
Assessments of the town’s ability to get information to the residents differed dramatically across
the three focus groups. The New Light Baptist Church group responded that efforts are below
average, not so good, and that more notice is needed on road closures. Respondents at the
Bloomfield Recreation Department said that “The Buzz” and television stations are a good source
of township information. Kinder Towers respondents agreed unanimously that Bloomfield does a
very good/excellent job in getting information out to the residents. Participants were also asked if
their experience before, during, or after Hurricane Sandy had impacted their decision in any way.
Responses ranged from “not really” to a belief that Bloomfield did a good job assisting during the
storm.
These differences likely reflect meaningful differences in the living conditions and life experiences
of participants of each of the focus groups. They speak to the importance of gathering information
from across disparate groups, in order to assess the strengths and needs of the community.
Quality of Life in the Community: The Focus Group Protocol and Key Informant Interview
Protocol asked participants to reflect on the overall quality of life in their community. The
questions encourage participants to consider community needs in areas that would not typically
be the responsibility of the public health department. These included, for example, work of the
police or fire department or the department of transportation, that might impact on health. Asked
to rate the township, on a 10 point scale (with 10 being the highest rating) as a healthy and safe
community in which to live, the following responses were received:
Focus Groups
Bloomfield Recreation Department (N= 7): answers ranged from 4 – 9 with the most frequent
response at 8/9.
Kinder Towers (N=8): a unanimous rating of 10.
New Light Baptist Church (N= 11): answers ranged from 3 – 9.
Key Informant Interviews (N=10)
Responses ranged from 5 – 9 with the median ranking at 7
33
Across all three focus groups and interviews, Bloomfield was considered in a range of medium to
high as a healthy and safe community.
Asked for factors that could improve overall quality of life in the community, one focus group did
not supply an answer. The two other focus groups suggested:
better traffic control
better maintenance of roads
environmental cleanup
increased police presence
increased exercise class offerings
In the key informant interviews, asked for the “top three” factors that would improve quality of
life in the town, there was great variability, from safety issues, to employment, to environmental
concerns. “Access to services” and “health education” were each mentioned by 4 of the 10 (40%)
of the respondents, and “cultural activities” by 30%. Below are the additional responses,
mentioned by individual key informants
Population needs to feel embraced and cared for by the community they live in
Community education and understanding of the importance of wellness and
preventative care
Access to healthcare, specifically preventative care.
Safe sidewalks and streets
Improved rates of employment
More parking spaces
Leaf collection done more often
More (public) recreation (programs) for children
Greater police presence
More visible Fire Department
Awareness of the Neighbor-to-Neighbor Program (a local 501c3 organization) and
residents should watch out for each other
More carnivals, festivals, sports events to be held in Bloomfield. Bloomfield needs a
greater sense of community; More cultural activities
34
Continuation of the re-development
Continuation of open government aspect
Homelessness should be reduced; Also renters and owners have different outlook on
upkeep of homes
Impact of Local, State and National Events on the Community: Questions about local, state,
and national events were asked of the key informants, only. Respondents were asked what they
think will have the greatest impact on the local health department, and were given examples
including the Patient Protection and Affordable Care Act (Obamacare), new gun laws, climate
change, etc. In response to mention by the interviewer of the Patient Protection and Affordable
Care Act (Obamacare), comments by interviewees were recorded in seven out of ten interviews.
Responses were mostly positive with respect to the law, as might be anticipated, given the nature
of the key informants (that is, people who were connected to government, social services, and
non-profit organizations ).
“It is vital to the health system. It is creating more visibility and openness because the
general public will seek the local health department more and the local health department
will feel more comfortable dialoging with hospitals. It will also provide more services
traditionally NOT available so the local health department will probably provide more
referrals for those services.”
“Obamacare will cause the local health department to be more pro-active in providing
wellness (services) and education, currently underutilized.”
“Obamacare is a huge plus; (there are) too many people without health insurance. It will
greatly impact the health department.”
Specifically with regard to the Social Security Bill and Medicare/Medicaid: “Seniors barely
have enough and now they will have less. The health department can educate people on
NOT using the ER for primary care and answer questions about Obamacare.”
During the telephone survey administration asking respondents what they thought was the most
pressing public health issue, two respondents provided the following comments which were
calculated in the “Other” category. These are more typical of general public commentary on the
new healthcare law:
“Obamacare is going to kill us all. The Independent Payment Advisory Board set up by the
new senator in Massachusetts will kill all the elderly.”
35
“The healthcare system as a whole is out of whack. If someone gets or has those mentioned
things <the health issues mentioned by interviewer>, they cannot get the care they need
because they can’t afford it.”
The other “event” mentioned was with regard to gun laws. Two Key Informants responded by
simply stating gun laws will have an impact on the community. One informant made the following
comment:
“Gun laws don’t necessarily address the problem of safety (which) goes back to education
and provision of services.”
Collaboration Among Community Agencies: Because of their associations with various
community agencies, key informants were asked, “To what extent do you or your agency
collaborate with other agencies and organizations in Bloomfield, in an effort toward improving
community health outcomes?” Interviewees were asked specifically about the following types of
organizations/agencies (schools, hospitals, local government, etc.) The responses are summarized
below:
Schools: Contact with the Board of Education was reported. Involvement in the “Young
Consumers Program” was mentioned, as well as participation in obesity programs, exercise
programs, gardening programs. Moderate collaboration was mentioned by one respondent.
Three out of ten respondents made no mention of collaboration with schools.
Hospitals/Other Health Agencies: Collaboration between the Volunteer Emergency Squad and
home health care agencies/social workers was mentioned. The need for more interaction
between hospitals and the community was voiced by one informant. The New Light Baptist
Church, Bloomfield High School and Bloomfield College were reported to have collaborations with
Mountainside and Clara Maass Hospitals.
Local Government: Six out of ten respondents mentioned collaboration with local government
agencies including the health department, police department, and one group related to or
perceived to be part of government, the Chamber of Commerce.
Law Enforcement: Seven out of ten respondents, including representatives from the hospitals
and schools and United Way, reported collaboration with law enforcement agencies
Faith-based Organizations: Six out of ten respondents discussed collaboration with faith-based
organizations. Two respondents stated, “Not so much.” One of those two specifically stated that
this organization would be open to future collaboration.
36
Social Service Agencies: Six out of ten respondents reported collaboration with a variety of local
social service agencies.
Local Businesses: Two respondents stated active and current collaboration with local businesses.
Other respondents stated that they had collaborated in the past but not currently, claimed
occasional collaboration, responded that collaboration had recently started, and claimed
membership in the Chamber of Commerce.
37
SUMMARY AND NEXT STEPS
Purpose
The BDHHS decision to apply for accreditation by the national Public Health Accreditation Board
places them in a small, but growing, group of local health departments around the country. A
current Community Health Assessment is required in the PHAB application process, but the CHA is
also a critical baseline step in determining areas where BDHHS can steer the focus of the
department in the coming months and years. Completion of the CHA fulfills one of the
requirements of the PHAB application for accreditation, and can provide important information to
the township on the attitudes and behaviors of the BDHHS audience relative to current health
education and services in the community.
Methods
The mixed method of data collection used for the CHA enabled BDHHS to pull information from
diverse respondents. The Community Health Telephone Survey drew data from a random sample
of 604 residents living in Bloomfield, Caldwell, and Glen Ridge, the three towns being served by
BDHHS at the time of data collection. The Community Focus Groups were performed at three sites
in Bloomfield including a senior living environment, a faith-based organization, and the
Bloomfield Recreation Department. These site choices allowed for input from a group that was >
55 years of age, a multi-aged, faith-based group, and a group of participants already using
township services at the recreation department. The Key Informant Interviews were performed
with Bloomfield community stakeholders from a diverse selection of agencies and organizations in
the township. This agency-specific data collection approach provided an additional perspective on
the potential for collaboration among local agencies for the improvement of health outcomes.
Overall, use of this mixed method of data collection also allowed for triangulation analysis of both
quantitative and qualitative data in order to identify common themes and consistent remarks
across the three methods.
Summary of Findings
ACCESS: To questions regarding access to general health services provided by BDHHS, the
response was between 94.5 - 99% access and, with specific regard to childhood vaccinations,
access was reported to be between 94 - 96.4%. These numbers dropped for access to dental
health services at 88.5 - 94% with 11.5% of Bloomfield respondents reporting no access.
38
Answers regarding access to cancer prevention and treatment services in a range of 89 - 95.3%
access and mental health care services in a range from 89.6 - 97.6% access may have been slightly
biased by the ability for respondents to claim, “don’t need this service.” With regard to cancer
services, respondents may not have differentiated between “prevention” and “treatment” services.
With regard to mental health services, attitudes of privacy and embarrassment may impact
responses.
BARRIERS: For respondents stating no access to certain services, the two key barriers were lack
of money and lack of information on how to access the services. The lack of money response may
reflect lack of information about access to free services and lack of knowledge about the potential
for charity care available under certain circumstances. In the focus groups, lack of knowledge
regarding services was discussed. Lack of awareness of services was a common theme in all three
data collection methods. Key informants also commented on the broader dilemma of the
uninsured and under insured and the correlation to use by these people of emergency room
services for general health care.
SELF-RATED HEALTH: For the state of New Jersey the percentage of respondents who reported
fair or poor health using the 2009 BRFSS question, “Would you say that in general your health
is excellent, very good, good, fair, or poor?”(6) ranged from 13.5 – 15.2% for adults age 18 and
over. For the similar question in the BDHHS telephone survey, “How would you rate your
personal health on a scale from 1 to 5, with 1 being very unhealthy and 5 being very healthy?”, the
aggregate of data from the three townships formed a range of 0.8 – 1.0% of adults age 18 and over
reporting unhealthy/very unhealthy. This may indicate an attitude of better self-rated personal
health in the BDHHS communities. There may be slight bias in the different wording of the
question and in the likelihood that those who participated in the surveys may have been healthier
than the general population
SCREENINGS: Given the importance of screenings to disease prevention and detection/early
treatment, several of the numbers reported in the telephone survey on use of health screenings
appear low. This may be due in part to the question limiting the response to screenings that
occurred during the past year. If that time frame was expanded to two or five years, as some of
these tests are recommended, the percentages would likely increase. For example, in the state of
New Jersey, cholesterol screenings done within the last five years (9) indicate > 80% of
respondents having had a screening while the BDHHS telephone survey response was between
71.4 – 76.1%. At the national level, 76% of respondents indicated that cholesterol screenings had
been done within the last five years. The Healthy People 2020 (10) target for cholesterol
screenings is > 82% population compliance.
39
DIAGNOSIS OF CHRONIC DISEASE: Of the 604 respondents to the telephone survey, there were
267 (44%) positive responses to having one or more chronic disease(s) in the household. High
blood pressure was the most reported diagnosis in all three communities.
Bloomfield reported the highest levels of diabetes, high blood pressure, asthma, lung disease and
mental health concerns. Consideration should be given to the national data on health disparities
that indicate higher levels of diabetes in minority populations, recalling that Bloomfield’s Hispanic
and African American population accounts for 21.5% of those Bloomfield respondents surveyed,
while in Caldwell and Glen Ridge those minority numbers were, respectively, 5% and 12.6% of the
population.
Overall there were 267 diagnoses of chronic diseases in a survey of 604 households, suggesting
that these communities, like much of the US, must be increasingly focused on reducing chronic
disease.
NUTRITION AND PHYSICAL ACTIVITY: The BDHHS health assessment sought data on
consumption of fruits and vegetables and extent of physical exercise by various methods and
specifically walking and/or biking.
For consumption of fruits and vegetables, the telephone survey data indicated that 83% of the
respondents eat less than 5 servings per day while the greater
percentage of participants in the focus groups and key informant
interviews indicated awareness that 6 – 11 servings per day would
be optimum. This may indicate that there has been a small amount
of progress toward the population having an awareness of what
they should be doing, with less progress toward that awareness
being a determinant of behavior change.
COMMUNITY HEALTH & QUALITY OF LIFE/SIGNIFICANT HEALTH ISSUES AND BARRIERS: Diet
and exercise and chronic disease are related in their direct impact to the individual as well as to
the community (as opposed to an issue of broader community impact such as environmental
concerns and social concerns). They are also related in the fact that there is much developing
scientific data that lack of healthy diet and exercise is one of the primary predictors of chronic
disease. Nearly half (47.8%) of telephone survey participants responded that
diet/exercise/chronic diseases are the community’s most pressing issues. This was also
supported by commentary in the Bloomfield Recreation Department focus group.
From the other two focus groups and in the key informant interviews, social concerns emerged as
the most significant health problems in the community. There may be bias in this data due to the
“83% of respondents
surveyed stated that they
ate less than 5 servings
(fruits/vegetables) per day.”
40
fact that the agencies represented in the interviews may have a greater awareness of local social
concerns. Several of the agencies involved are dedicated to addressing social issues such as
education, poverty, drug and alcohol abuse, teen pregnancy, and community safety.
Despite the local data indicating disturbing trends in household wellness (i.e. high rates of chronic
diseases), ratings from focus groups and interviews on quality of life in the community were
generally above average and focus groups indicated that BDHHS had made an above average effort
to inform the residents in times of disaster, for instance, the recent Hurricane Sandy.
LIMITATIONS: As is often the case with the collection of data, limitations must be considered in
understanding and drawing conclusions based on the data collected. First, the telephone survey
sample included more female, more white, and higher educated respondents than the general
population of these towns. Second, focus groups and key informant interviews are relevant for
Bloomfield only, and these, too, were limited in scope and number. Therefore, although the
assessment gathered data that previously were not accessible, conclusions must be considered
carefully, and likely reflect the responses of a healthier and more connected population than
actually exists. Nevertheless, the assessment was carried out in a statistically significant manner
and revealed valuable data that can be used to influence program planning. The confidence level
of the telephone survey sample number is generally regarded as adequate for generalization to the
larger population.
CONCLUSIONS: The demographic differences in the three townships that are serviced by BDHHS
will create challenges in program planning, for instance, Bloomfield requires more attention to
minority populations in order to reduce nationally recognized health care disparities. Caldwell
has a larger population approaching middle-age. Glen Ridge has the highest percentage of
population under 18 years of age making it an area for focus on youth-related health
interventions, for example, driving safety, sex, drug, and alcohol themes. BDHHS needs to move
forward with a constant eye towards these differences in the communities they serve.
As the nation recognizes the impact of education on health and well being, the positive news is
that all three communities appear to be above county, state, and national education levels in
percent of population that have received a high school diploma and that have received bachelors
degrees. These education levels may be viewed as positive factor for the population’s
comprehension of important information about wellness and disease prevention.
Access to primary health care services was reported at 94% or better by telephone survey
respondents. While the question posed to BDHHS respondents differs from data collection
questions used by Healthy People 2020 (10), the data topic is similar. Healthy People 2020
41
reported, in their baseline year of 2007, that 76.3 % of the U.S. population had a usual primary
care provider. The Healthy People 2020 target is 83.9%. At 94% access to primary healthcare
services in the BDHHS communities, it would appear that the population has greater access than
the general U.S. population. This should provide an opportunity for BDHHS from which to launch
new programs through collaboration with local primary care physicians and hospitals.
In a general analysis of most pressing health concerns and chronic disease diagnoses, the data
gathered appears to align with state and national concerns regarding nutrition, exercise, and
chronic disease. In the telephone survey there were 267 reports of chronic disease diagnoses in
604 households. Nearly 50% of the telephone survey respondents reported that they believe
nutrition, exercise, and chronic disease are the top health issues in the communities.
In contrast, self-rated health in the three communities appears to be better than state of New
Jersey data collected through the Behavioral Risk Factor Surveillance System (6). For the state of
New Jersey the percentage of respondents who reported fair or poor health using the 2009 BRFSS
question, “Would you say that in general your health is excellent, very good, good, fair, or poor?”
ranged from 13.5 – 15.2% for adults age 18 and over. For the similar question in the BDHHS
telephone survey, “How would you rate your personal health on a scale from 1 to 5, with 1 being
very unhealthy and 5 being very healthy?”, the aggregate of data from the three townships formed
a range of 0.8 – 1.0% of adults age 18 and over reporting unhealthy/very unhealthy. This may
indicate an attitude of better self-rated personal health in the BDHHS communities and also may
be reflective of the telephone survey sample.
In key respondent interviews (Bloomfield only), social concerns
were reported as the most significant health problems in the
community. Responses reflect concern by other community agency
stakeholders regarding homelessness, discrimination, alcohol and
drug abuse and other social concerns. While these qualitative data
may reflect bias (i.e. the key respondents may have a greater
awareness of the social concerns because the agencies they
represent are closer to the problem then the random public), this portion of the data provides
BDHHS with direction for establishing the social concerns as targets for collaborative efforts by
multiple agencies.
Beyond accomplishing assessment goals for PHAB and BDHHS requirements, the Partners for
Health Foundation should also benefit from the data collection as the PFH service footprint
includes all three townships that were involved in the CHA. Data gathered in response to
questions on nutrition and physical activity should allow the PFH organization to expand their
“In key informant interviews,
social concerns were
reported as the most
significant health problems
in the community.”
42
data base on attitudes and behaviors toward fruit and vegetable consumption, and walking and
biking in the communities surveyed by inclusion of the new data from Bloomfield, Caldwell, and
Glen Ridge .
In conclusion, supported by the quantitative and qualitative analysis of the mixed method data
collected in the Community Health Assessment, the BDHHS is in a good position to pursue the
PHAB accreditation. Empowered with the potential to collaborate with other local agencies to
achieve critical public health objectives, the department will be able to bring a fresh approach to
health education, health interventions, and prevention strategies that will improve the health
status of the communities they serve.
Recommendations for Next Steps
CAMPAIGNS PROMOTING ACCESS: All future campaigns promoting access to BDHHS services
should highlight the importance of including dental health and mental health for overall well being
and longevity. The other key word to be used in all service promotions should be “prevention”.
HEALTH SCREENINGS: Increase health education and promotion regarding all types of health
screenings with targeted information about when and where the screenings are available for free
in or near the community. Collaborate with local agencies and organizations that specialize in
information on targeted screenings. In the program planning and evaluation process, schedule an
online survey for the year 2014 to collect data on health screenings done within the last 2 and 5
years. Compare data to the CDC and Healthy People 2020 targets. Adapt health education and
screening promotions as necessary.
NUTRITION AND PHYSICAL ACTIVITY: Nutrition and physical activity are the national disease
prevention priority to address issues of epidemic proportions. BDHHS should continue and
reinforce health education promotions that encourage higher levels of fruit and vegetable
consumption and higher levels of walking and biking. Investigate with Partners for Health the
potential to bring their “Eat, Play, Live… Better” program to Bloomfield. Collaborate with all
possible local agencies and organizations to push a consistent message based on data and
collateral available from the USDA, the Center for Disease Prevention and Control, and Healthy
People 2020. Focus on school-based programs starting in the pre-school environment.
Consider that BDHHS should become the steering agency to ensure that all other local agencies are
engaged in the same intervention message with regard to nutrition and physical activity. Take a
careful look at all the data (thoughts/suggestions/barriers) discussed in Section III, A. Items 11
and 12 and bring that information into any meetings and collaborations on nutrition and physical
43
exercise. Consider active BDHHS involvement in providing information on the current national
legislation that impacts our food systems.
SOCIAL CONCERNS: BDHHS might give consideration to scheduling/facilitating (at first) monthly
then quarterly meetings with local agency representatives to brainstorm/develop/create
interventions in agreement on the top two most pressing community social concerns.
STAFFING: Prepare targeted job descriptions for full- or part-time staff positions that will support
the health program planning and evaluation in areas mentioned above. Investigate creative ways
of using students, interns, and other low-cost staffing options.
PHAB ACCREDITATION: With the completion of the Comprehensive Community Health
Assessment, the BDHHS is well-positioned to complete other requirements of the PHAB
accreditation process and submit the application for accreditation.
44
APPENDIX A – DATA COLLECTION INSTRUMENTS
Community Health Telephone Survey
Community Focus Group Protocol
Key Informant Interview Protocol
45
A. Instruments
1. Community Health Assessment - Telephone Survey
Township of Bloomfield
Community Health Assessment – Telephone Survey
Hello. My name is _______ and I am calling on behalf of the Township of Bloomfield Department of Health and Human
Services. We’re conducting an important survey to inform and improve public health services in your community. I am not
selling anything, and I will not ask for any contributions or donations.
Your household has been randomly chosen from all households in Bloomfield (or Glen Ridge, Caldwell) to participate in this
survey. All answers you give will be confidential. Your contact information (such as your phone number) will not be shared
with anyone. You can stop the interview at any time or decide not to answer any question. The interview should take about 8-
10 minutes. If you have any questions that I can’t answer, I will give you a telephone number for more information.
Do you agree to participate?
May I please speak to the youngest male aged 18 or older who is now at home?
IF NO MALE AVAILABLE: May I please speak to the youngest female aged 18 or older who is now at home?
S1. To start, let me confirm that you currently live in Bloomfield (Glen Ridge, Caldwell)?
DISASTER PREPAREDNESS
In light of the recent impact of Hurricane Sandy on our community, please tell us your thoughts about emergency
preparedness for such disasters by responding to the following questions.
1. During NON-emergency situations, which source do you primarily rely on for information/notifications?
Television
Radio
Internet
Police loud
speakers
Family/Friend
Local Cable
Channel
Township
Website
Code Red
Other
(specify)____
2. During emergency situations, which source do you primarily rely on for information/notifications?
Television
Radio
Internet
Police loud
speakers
Family/Friend
Local Cable
Channel
Township
Website
Code Red
Other
(specify)____
3. Do you currently have an emergency plan, which includes an emergency supply kit and family communication
plan?
Yes, I have a plan and kit.
I have a plan but no kit. I have a kit but no plan. I have neither.
46
4. Would you like to receive recommendations from the Health Department on how to improve your emergency
plan?
Yes
No
COMMUNITY HEALTH
5. Please select which of the following you think are the most pressing public health issues in your community?
Select up to 3. a. Infectious diseases (for example, flu, sexually transmitted diseases (STD’s), HIV/AIDS
b. Chronic diseases (for example, heart disease, cancer, diabetes, and asthma)
c. Environmental Living Conditions (for example, air and water quality, mold, lead)
d. Social Concerns (for example, homelessness, discrimination, alcohol and drug abuse)
e. Diet and Exercise (for example, lack of physical activity, poor nutrition, obesity)
f. Community Safety (for example, violent crime and motor vehicle accidents
g. Other (specify: ____________)
PERSONAL HEALTH
6. Are you and your family able to access the following services if needed?
a. Primary health care
Yes
No
I don’t use
this service
I don’t know if the
service is available
b. Childhood vaccinations
Yes
No
I don’t use
this service
I don’t know if the
service is available
c. Cancer prevention and treatment services
Yes
No
I don’t need
this service
I don’t know if the
service is available
d. Dental care
Yes
No
I don’t use
this service
I don’t know if the
service is available
e. Mental health care - including for depression, anxiety, drug and alcohol treatment, or other
Yes
No
I don’t use
this service
I don’t know if the
service is available
7. If you or your family are not able to access these services, please check all the reasons why you are not able to do
so.
Lack of time
Lack of energy
Lack of childcare
Lack of money
Lack of transportation
Not physically capable
8. How do you currently pay for your medical care? (select all that apply)
Private Health Insurance (e.g.,
Horizon BCBS, HMO, etc.)
Veteran’s Administration
Medicare/Medicaid
NJ FamilyCare
Pay cash (no insurance)
Charity care
Other (specify:______________)
9. How do you pay for your dental care? (select all that apply)
Private Dental Insurance (e.g.,
Delta Dental, etc.)
Veteran’s Administration
NJ FamilyCare
Pay cash (no insurance)
Charity care
Other (specify:______________)
10. Which screenings have you had in the past year? (select all that apply)
cholesterol
blood sugar for diabetes
blood pressure
dental
prostate or mammogram
pap smear
Other (specify:___________________________)
11. Have you or anyone in your household ever been diagnosed with one of the following illnesses?
Cancer
Diabetes
High blood pressure
Asthma
Heart Disease
Lung Disease
Other (Specify:___)
12. How would you rate your personal health?
Very Healthy Healthy
Somewhat
healthy
Unhealthy Very
unhealthy
Don’t know
13. Thinking about the past 30 days, about how many of those days did you walk?
By “walk”, we mean any outdoor walking, jogging, or running that lasts at least 10 minutes.
________ (Please enter a number between 0 and 30.)
14. What are the top 3 reasons that you do not walk more frequently?
Bad weather/wrong season
Too busy/no opportunity
No safe place to walk
Disability/other health impairment
Other transportation is faster
Other (specify: ______________________)
15. Thinking about the past 30 days, about how many of those days did you ride a bicycle? ________ (Please enter a
number between 0 and 30.)
16. What are the top 3 reasons that you do not ride a bicycle more frequently
Bad weather/wrong season
Too busy/no opportunity
No safe place to ride
No safe place to leave my bike
Disability/other health impairment
Don’t have access to a bike
Other transportation is faster
Other (specify: ____________________)
17. During the past month, other than your regular job, how often did you participate in any physical activities or
exercises? Such as walking, dancing, soccer, gardening, or running for exercise? Would you say…
Never About once or twice
a week
About 3 times
a week
More than 3 times
a week
18. How many servings of fruit and/or vegetables did you eat yesterday?
A serving equals one medium apple, a handful of broccoli, or a cup of greens.
______ servings yesterday
19. On average, how many sugar sweetened sodas or other sweetened drinks do you drink per day?
One serving equals one 12 ounce can, bottle, or glass. Include sweetened iced tea, sports drinks, fruit punch or other
fruit-flavored drinks. Do NOT include diet soda, seltzer, sugar free drinks, or 100% juice.
______ servings per day
DEMOGRAPHICS
Finally, please tell us a little bit about yourself. Remember, your responses are confidential.
This information is being requested so that we can know more about who is responding to this survey so that we can help
the Township of Bloomfield Department of Health and Human Services best direct the services they offer to your
community.
20. How many adults (age 18 or older) currently live in your home (at least most of the time)?
____ Adults (18 years or older)
21. How many how many children (under 18) currently live in your home (at least most of the time)?
____ Children (under 18 years old)
22. What do you consider to be your gender?
23. Into which of the following ranges does your age fall?
18-24
25-44
45-64
65 or older
24. What is your marital status?
Single
Married
Widowed
Separated/Divorced
Domestic Partnership
25. Which of the following is(are) the racial/ethnic group(s) you most identify with:
Hispanic/Latino
White/Caucasian
Black or African American
Asian
Native Hawaiian or Other Pacific Islander
Native American/Alaskan Native
Other (specify: ________________)
Male Female
26. What is your highest level of school completed?
Less than high school diploma
High school graduate(high school
diploma or equivalent – including
GED)
Associate degree or Trade School (for example, AA, AS, Trade
School )
Bachelor’s degree(for example: BA, AB, BS)
Graduate school & beyond (for example: MA, MD, JD, PhD)
27. What is your current employment status?
Employed Full-time
Employed Part-time
Unemployed and currently seeking a job
Unemployed and not currently seeking a job
Retired
28. Which of the following ranges would you say best reflects your total annual household income?
Less than $25,000
$25,000 to less than $50,000
$50,000 to less than $75,000
$75,000 to less than $100,000
$100,000 to less than $150,000
$150,000 or more
29. With regard to the Community Health Survey, do you have any general concerns or questions that you wish
to make known to us?
______________________________________________________________________
______________________________________________________________________
______________________________________________________________________
______________________________________________________________________
______________________________________________________________________
______________________________________________________________________
______________________________________________________________________
30. In the future, would you be willing to participate in this survey via Internet?
Thank you for participating in this survey! Your feedback is greatly appreciated.
Yes No Don’t know
2
2. Community Health Assessment – Community Focus Group Protocol
Township of Bloomfield
Community Focus Group Protocol
Thank you all for taking the time to speak with us today.
My name is ____________________________ and this is __________________________. We are from the Bloomfield Health and Human
Services Department working in conjunction with the Center for Research and Evaluation on Education and Human
Services at Montclair State University. We are conducting a Community Health Assessment as one of the requirements to
receive national accreditation for our local health department. As one of the components of the overall health
assessment, we’re talking to groups of community members, such as yourselves, to gather information about how the
local health department might better serve the community.
This focus group should take less than an hour. If it’s OK with all of you, we would like to audio record the session because
we don’t want to miss any of your comments. Although we may take some notes during this session, we can’t possibly
write fast enough to get it all down. All responses will be kept confidential. We will make sure that any information we
include in our report(s) does not identify any of you individually as the respondent. We will use the recording to
summarize the common themes that come across from all focus groups and other data sources. The recording will not be
shared with anyone outside of the MSU and Bloomfield Health and Human Services Department research team.
Remember that you are a volunteer. We hope you will choose to participate in the focus group because your responses
may help the Bloomfield Health and Human Services Department to improve their programs and better serve you and
your community. But it’s OK if you want to stop at any time and not be in the focus group. You do not have to answer any
questions that you don’t want to answer.
Are there any questions about what I have just explained?
Are you willing to participate in this focus group? (If so, please sign consent form.)
A. Significant Health Issues and Barriers
First, let’s talk about health problems in our community.
1) Which category (or categories) do you think is the most significant health problem in our community and why?
2) Based on the identified health problems that we just discussed, what barriers do you feel are limiting these needed
services to residents? In other words, what keeps community members from using existing services that were
designed to address these health issues?
Now, let’s talk about Bloomfield as a healthy and safe community.
3) On a scale of 1-10, with 10 being the optimal healthy and safe community, how would you rate Bloomfield as a
healthy and safe community to live in? Please share your rating and explain why you gave that rating.
B. Nutrition and Physical Activity
Next, let’s talk about healthy eating and active living.
4) Do you think people in your community eat enough fruits and vegetables? How many fruits and vegetables do you
believe is enough?
a. What would make it easier for them (or you) to eat more fruits and vegetables?
5) Have you participated in any physical activity or exercise in the past month – such as walking, biking, dancing,
soccer, or running?
a. If so, tell me about it. Which activities? How often? For how long did you usually keep at it each time?
b. If not, why not? What keeps you from participating in physical activity or exercise? What would make it
easier to exercise more?
6) Do you ever walk or bike to do your shopping or errands?
a. If so, how often? Where?
b. If not, why not?
c. Do you find Bloomfield suitable for biking/walking? What improvements could be made to make
biking/walking in Bloomfield better?
C. Public Health Announcements and Disaster Preparedness
Now let’s talk about public health announcements and disaster preparedness.
7) During emergency and non-emergency situations, there are multiple sources from which you can receive
important health department notifications. What are your sources?
8) In your opinion, how well does the Township get information to its residents?
a. Has your experience before, during, or after Hurricane Sandy impacted your opinion in any way?
D. Quality of Life in the Community
Finally…
9) What do you believe are the top three factors in improving the overall quality of life in our community?
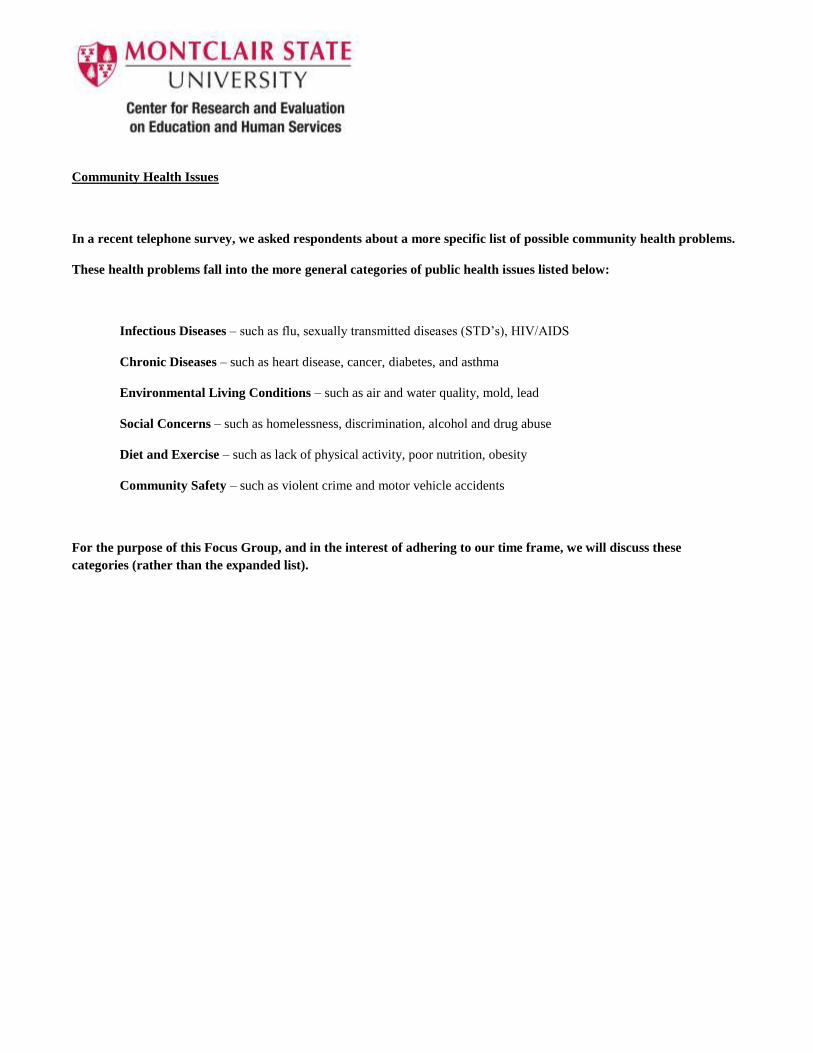
Community Health Issues
In a recent telephone survey, we asked respondents about a more specific list of possible community health problems.
These health problems fall into the more general categories of public health issues listed below:
Infectious Diseases – such as flu, sexually transmitted diseases (STD’s), HIV/AIDS
Chronic Diseases – such as heart disease, cancer, diabetes, and asthma
Environmental Living Conditions – such as air and water quality, mold, lead
Social Concerns – such as homelessness, discrimination, alcohol and drug abuse
Diet and Exercise – such as lack of physical activity, poor nutrition, obesity
Community Safety – such as violent crime and motor vehicle accidents
For the purpose of this Focus Group, and in the interest of adhering to our time frame, we will discuss these
categories (rather than the expanded list).
3. Community Health Assessment – Key Informant Interview Protocol
Township of Bloomfield
Key Informant Interview Protocol
Thank you for taking the time to speak with me today.
My name is ____________________________ and I am from the Bloomfield Health and Human Services Department. I am
working in conjunction with the Center for Research and Evaluation on Education and Human Services at Montclair State
University. We are conducting a Community Health Assessment as one of the requirements to receive national
accreditation for our local health department. As one of the components of the overall health assessment, we’re talking
to representatives from the various community service agencies, such as yourself, to gather information about how the
local health department might better serve the community.
This interview should take less than an hour. If it’s OK with you, I would like to audio record the session because I don’t
want to miss any of your comments. Although I may take some notes during this session, I can’t possibly write fast
enough to get it all down. All responses will be kept confidential. I will make sure that any information I include in my
report does not identify you individually as the respondent. I will use the recording to summarize the common themes
that come across from all interviews and other data sources. The recording will not be shared with anyone outside of the
MSU and Bloomfield Health and Human Services Department research team.
Remember that you are a volunteer. I hope you will choose to participate in the interview because your responses may
help the Bloomfield Health and Human Services Department to improve their programs and better serve you and your
community. But it’s OK if you want to stop at any time and not go further with the interview. You do not have to answer
any questions that you don’t want to answer.
Are there any questions about what I have just explained?
Are you willing to participate in this interview? (If so, please sign consent form.)
A. Significant Health Issues and Barriers
First, let’s talk about health problems in our community.
Hand out the attached printed list of general community health issues.
1) Which category (or categories) do you think is the most significant health problem in our community and
why?
2) Based on the identified health problems that we just discussed, what barriers do you feel are limiting these
needed services to residents? In other words, what keeps community members from using existing services
that were designed to address these health issues?
Now, let’s talk about Bloomfield as a healthy and safe community.
3) On a scale of 1-10, with 10 being the optimal healthy and safe community, how would you rate Bloomfield as
a healthy and safe community to live in? Please share your rating and explain why you gave that rating.
B. Nutrition and Physical Activity
Next, let’s talk about healthy eating and active living.
4) Do you think people in our community eat enough fruits and vegetables? How many fruits and vegetables do
you believe is enough?
a. In your opinion, what would make it easier for residents of our community to eat more fruits and vegetables?
5) What keeps community members from engaging in more physical activity or exercise? What would make it
easier to exercise more?
a. Do you find Bloomfield suitable for biking/walking?
b. What improvements could be made to make biking/walking in Bloomfield better?
C. Public Health Announcements and Disaster Preparedness
Now let’s talk about public health announcements and disaster preparedness.
6) During emergency and non-emergency situations, there are multiple sources from which you can receive
important health department notifications. What are your sources?
Television
Radio
Internet Police loud
speakers Family/Friend
Local Cable
Channel Township
Website Code Red Other
(specify)____
a. In your opinion, how well does the Township get information to its residents?
b. Has your experience before, during, or after Hurricane Sandy impacted your opinion in any way?
D. Quality of Life in the Community
Next, let’s talk about quality of life in the community.
7) What do you believe are the top three factors in improving overall quality of life in our community?
Be open to the informant’s answer. If “none”, then note “no initial comment” followed by a probe, for example;
improvements to the business district, free health screenings, a greater police presence in the township parks,
increased security in the school system, etc.
8) Are you aware of any current local, state, or national events that you believe will impact the health and safety
of our community, for example; The Patient Protection and Affordable Care Act (Obamacare), new gun laws,
climate change? What events do you believe will have the greatest impact on our local health department?
E. Collaboration Among Community Agencies
9) To what extent do you collaborate with other agencies and organizations in Bloomfield in an effort toward
improving community health outcomes? For example,
Schools?
Hospitals and other health agencies?
Local Government?
Law Enforcement?
Faith-based organizations?
Social Service Agencies?
Local Businesses?
Thank you for your participation!
Community Health Issues
In a recent telephone survey, we asked respondents about a more specific list of possible community
health problems.
These health problems fall into the more general categories of public health issues listed below:
Infectious Diseases – such as flu, sexually transmitted diseases (STD’s), HIV/AIDS
Chronic Diseases – such as heart disease and diabetes
Environmental Living Conditions – such as air and water quality, mold, lead
Social Concerns – such as homelessness, discrimination, alcohol and drug abuse
Diet and Exercise – such as lack of physical activity, poor nutrition, obesity
Community Safety – such as violent crime and motor vehicle accidents
For the purpose of this interview, and in the interest of adhering to our time frame, we will discuss
these categories (rather than the expanded list). However, please provide us with any topic that we
may have missed that you believe should be on the list.
Thank you for your participation!
APPENDIX B – DATA TABLES Community Health Telephone Survey Data Tables
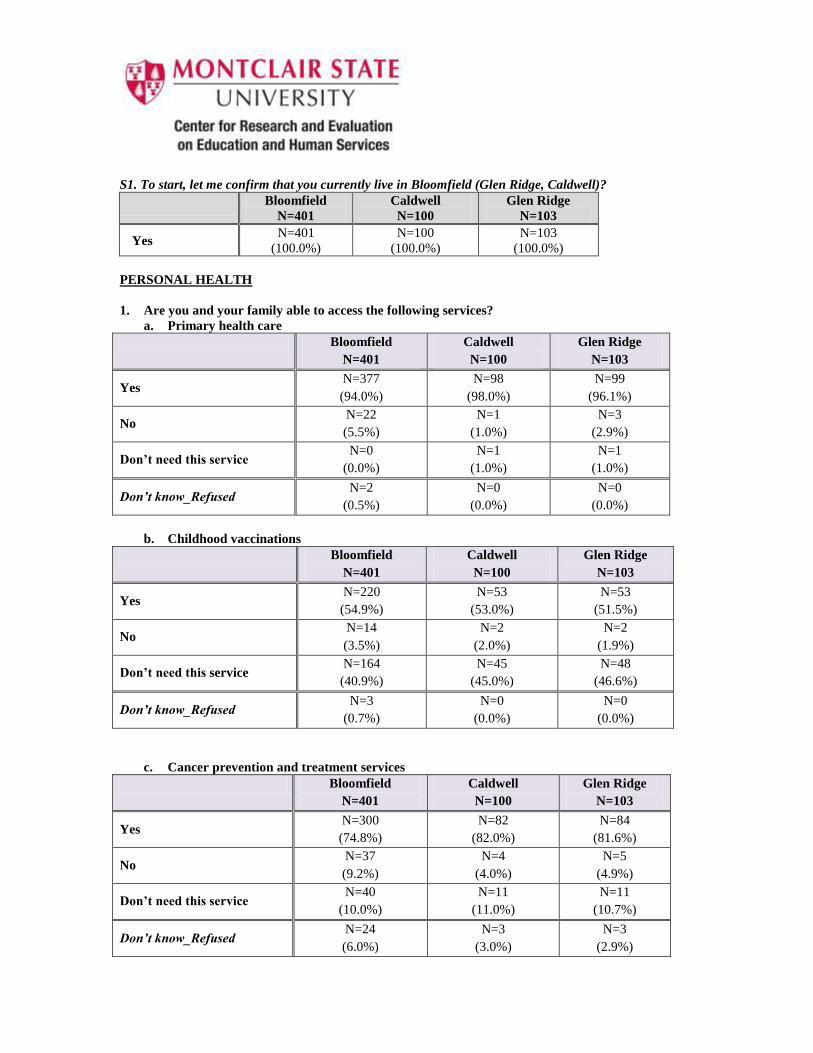
S1. To start, let me confirm that you currently live in Bloomfield (Glen Ridge, Caldwell)?
Bloomfield
N=401
Caldwell
N=100
Glen Ridge
N=103
Yes N=401
(100.0%)
N=100
(100.0%)
N=103
(100.0%)
PERSONAL HEALTH
1. Are you and your family able to access the following services?
a. Primary health care
Bloomfield
N=401
Caldwell
N=100
Glen Ridge
N=103
Yes N=377
(94.0%)
N=98
(98.0%)
N=99
(96.1%)
No N=22
(5.5%)
N=1
(1.0%)
N=3
(2.9%)
Don’t need this service N=0
(0.0%)
N=1
(1.0%)
N=1
(1.0%)
Don’t know_Refused N=2
(0.5%)
N=0
(0.0%)
N=0
(0.0%)
b. Childhood vaccinations
Bloomfield
N=401
Caldwell
N=100
Glen Ridge
N=103
Yes N=220
(54.9%)
N=53
(53.0%)
N=53
(51.5%)
No N=14
(3.5%)
N=2
(2.0%)
N=2
(1.9%)
Don’t need this service N=164
(40.9%)
N=45
(45.0%)
N=48
(46.6%)
Don’t know_Refused N=3
(0.7%)
N=0
(0.0%)
N=0
(0.0%)
c. Cancer prevention and treatment services
Bloomfield
N=401
Caldwell
N=100
Glen Ridge
N=103
Yes N=300
(74.8%)
N=82
(82.0%)
N=84
(81.6%)
No N=37
(9.2%)
N=4
(4.0%)
N=5
(4.9%)
Don’t need this service N=40
(10.0%)
N=11
(11.0%)
N=11
(10.7%)
Don’t know_Refused N=24
(6.0%)
N=3
(3.0%)
N=3
(2.9%)
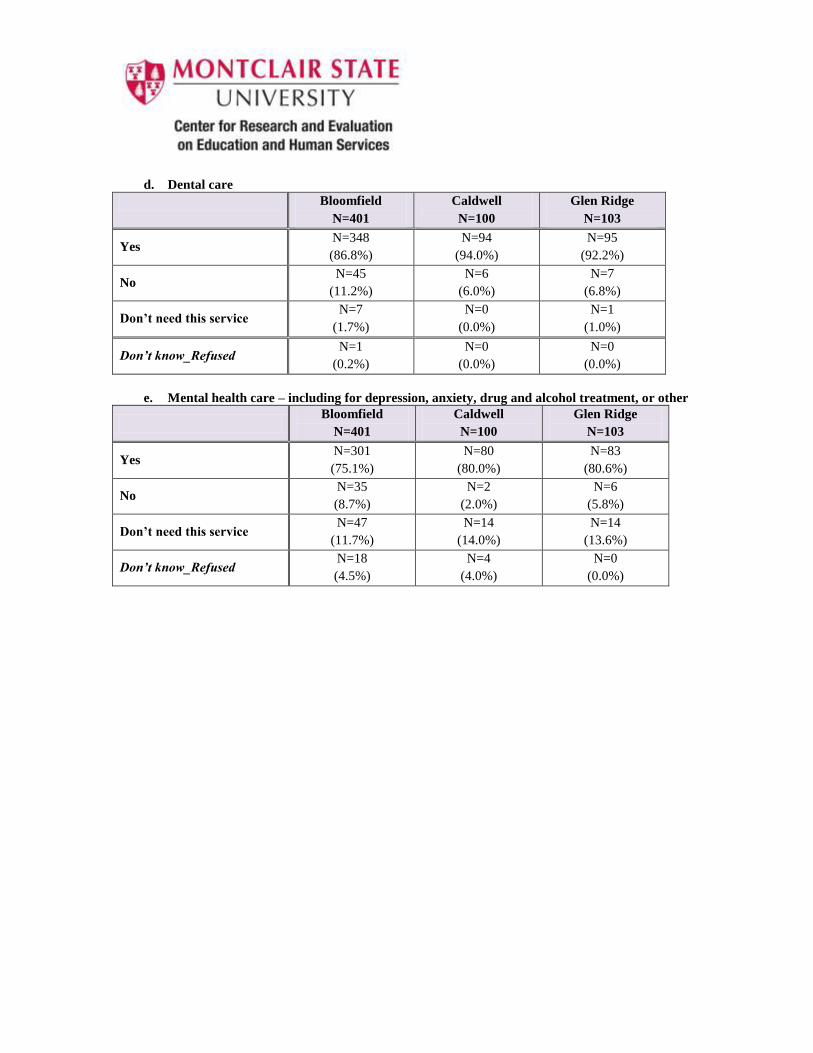
d. Dental care
Bloomfield
N=401
Caldwell
N=100
Glen Ridge
N=103
Yes N=348
(86.8%)
N=94
(94.0%)
N=95
(92.2%)
No N=45
(11.2%)
N=6
(6.0%)
N=7
(6.8%)
Don’t need this service N=7
(1.7%)
N=0
(0.0%)
N=1
(1.0%)
Don’t know_Refused N=1
(0.2%)
N=0
(0.0%)
N=0
(0.0%)
e. Mental health care – including for depression, anxiety, drug and alcohol treatment, or other
Bloomfield
N=401
Caldwell
N=100
Glen Ridge
N=103
Yes N=301
(75.1%)
N=80
(80.0%)
N=83
(80.6%)
No N=35
(8.7%)
N=2
(2.0%)
N=6
(5.8%)
Don’t need this service N=47
(11.7%)
N=14
(14.0%)
N=14
(13.6%)
Don’t know_Refused N=18
(4.5%)
N=4
(4.0%)
N=0
(0.0%)
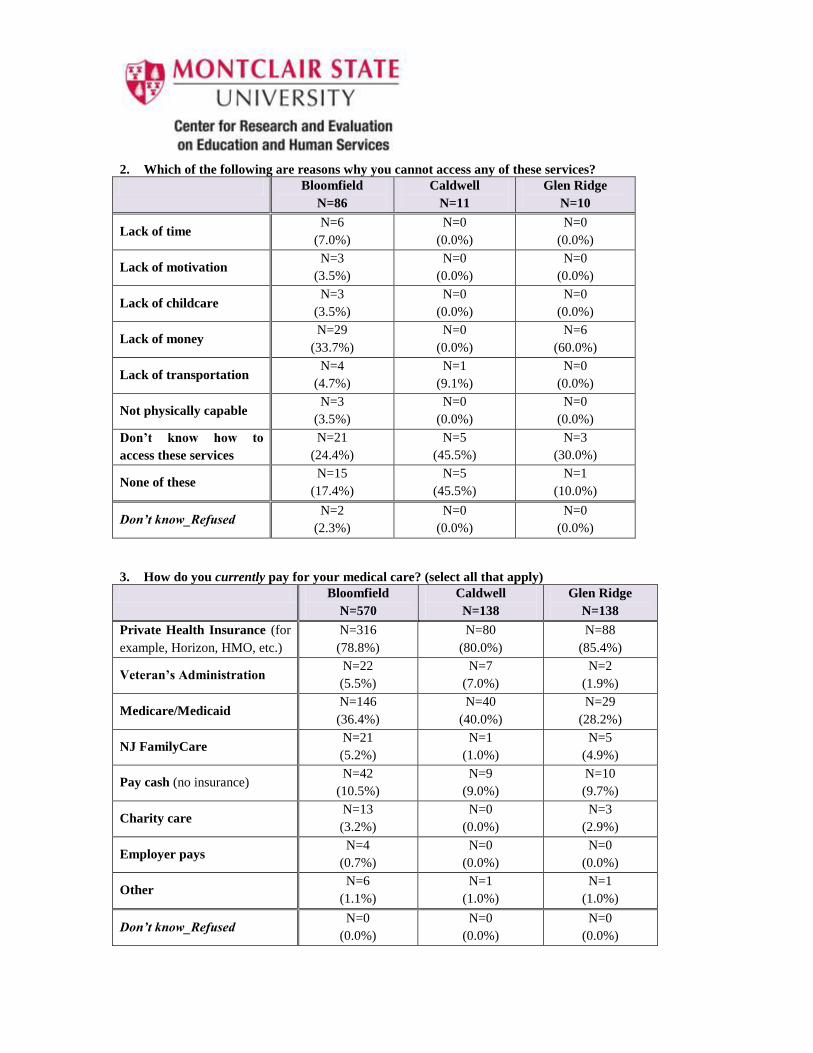
2. Which of the following are reasons why you cannot access any of these services?
Bloomfield
N=86
Caldwell
N=11
Glen Ridge
N=10
Lack of time N=6
(7.0%)
N=0
(0.0%)
N=0
(0.0%)
Lack of motivation N=3
(3.5%)
N=0
(0.0%)
N=0
(0.0%)
Lack of childcare N=3
(3.5%)
N=0
(0.0%)
N=0
(0.0%)
Lack of money N=29
(33.7%)
N=0
(0.0%)
N=6
(60.0%)
Lack of transportation N=4
(4.7%)
N=1
(9.1%)
N=0
(0.0%)
Not physically capable N=3
(3.5%)
N=0
(0.0%)
N=0
(0.0%)
Don’t know how to
access these services
N=21
(24.4%)
N=5
(45.5%)
N=3
(30.0%)
None of these N=15
(17.4%)
N=5
(45.5%)
N=1
(10.0%)
Don’t know_Refused N=2
(2.3%)
N=0
(0.0%)
N=0
(0.0%)
3. How do you currently pay for your medical care? (select all that apply)
Bloomfield
N=570
Caldwell
N=138
Glen Ridge
N=138
Private Health Insurance (for
example, Horizon, HMO, etc.)
N=316
(78.8%)
N=80
(80.0%)
N=88
(85.4%)
Veteran’s Administration N=22
(5.5%)
N=7
(7.0%)
N=2
(1.9%)
Medicare/Medicaid N=146
(36.4%)
N=40
(40.0%)
N=29
(28.2%)
NJ FamilyCare N=21
(5.2%)
N=1
(1.0%)
N=5
(4.9%)
Pay cash (no insurance) N=42
(10.5%)
N=9
(9.0%)
N=10
(9.7%)
Charity care N=13
(3.2%)
N=0
(0.0%)
N=3
(2.9%)
Employer pays N=4
(0.7%)
N=0
(0.0%)
N=0
(0.0%)
Other N=6
(1.1%)
N=1
(1.0%)
N=1
(1.0%)
Don’t know_Refused N=0
(0.0%)
N=0
(0.0%)
N=0
(0.0%)
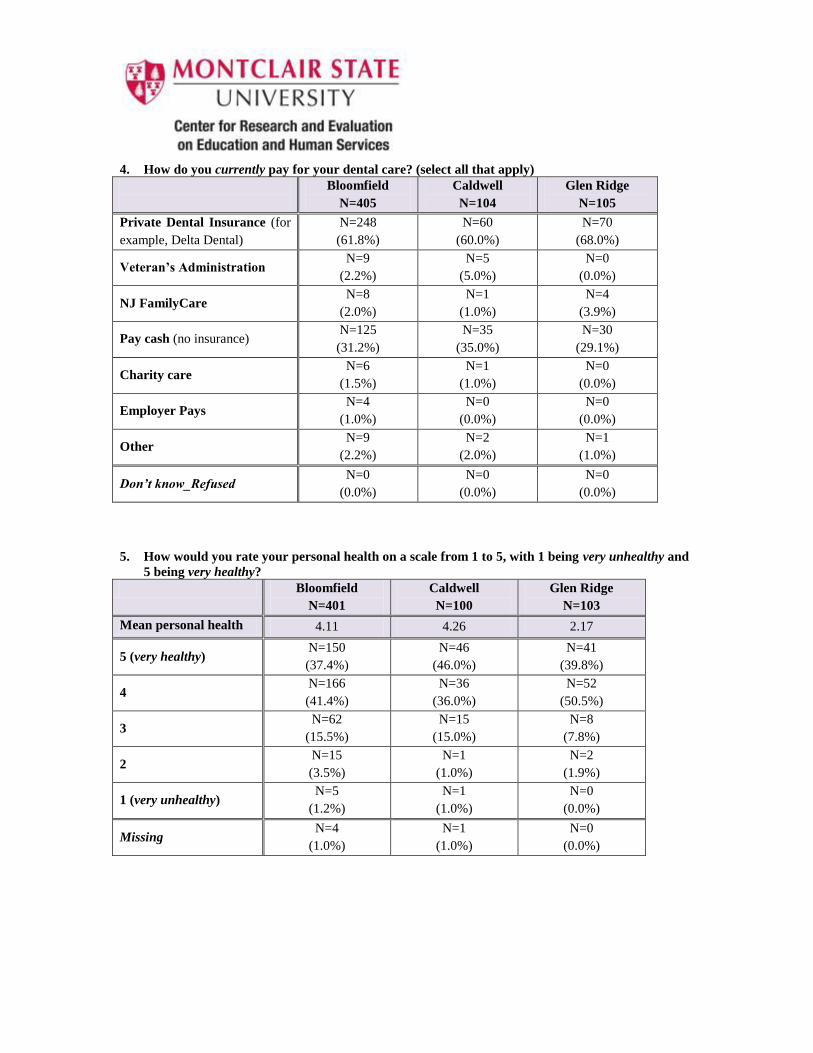
4. How do you currently pay for your dental care? (select all that apply)
Bloomfield
N=405
Caldwell
N=104
Glen Ridge
N=105
Private Dental Insurance (for
example, Delta Dental)
N=248
(61.8%)
N=60
(60.0%)
N=70
(68.0%)
Veteran’s Administration N=9
(2.2%)
N=5
(5.0%)
N=0
(0.0%)
NJ FamilyCare N=8
(2.0%)
N=1
(1.0%)
N=4
(3.9%)
Pay cash (no insurance) N=125
(31.2%)
N=35
(35.0%)
N=30
(29.1%)
Charity care N=6
(1.5%)
N=1
(1.0%)
N=0
(0.0%)
Employer Pays N=4
(1.0%)
N=0
(0.0%)
N=0
(0.0%)
Other N=9
(2.2%)
N=2
(2.0%)
N=1
(1.0%)
Don’t know_Refused N=0
(0.0%)
N=0
(0.0%)
N=0
(0.0%)
5. How would you rate your personal health on a scale from 1 to 5, with 1 being very unhealthy and
5 being very healthy?
Bloomfield
N=401
Caldwell
N=100
Glen Ridge
N=103
Mean personal health 4.11 4.26 2.17
5 (very healthy) N=150
(37.4%)
N=46
(46.0%)
N=41
(39.8%)
4 N=166
(41.4%)
N=36
(36.0%)
N=52
(50.5%)
3 N=62
(15.5%)
N=15
(15.0%)
N=8
(7.8%)
2 N=15
(3.5%)
N=1
(1.0%)
N=2
(1.9%)
1 (very unhealthy) N=5
(1.2%)
N=1
(1.0%)
N=0
(0.0%)
Missing N=4
(1.0%)
N=1
(1.0%)
N=0
(0.0%)
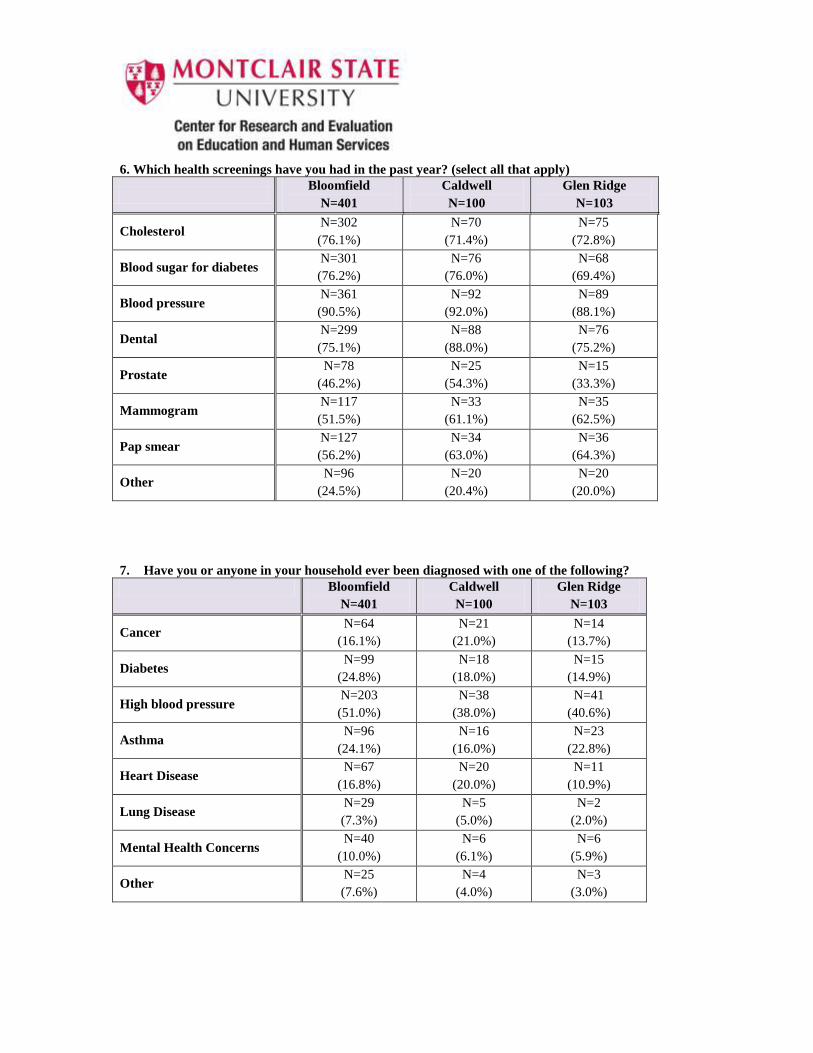
6. Which health screenings have you had in the past year? (select all that apply)
Bloomfield
N=401
Caldwell
N=100
Glen Ridge
N=103
Cholesterol N=302
(76.1%)
N=70
(71.4%)
N=75
(72.8%)
Blood sugar for diabetes N=301
(76.2%)
N=76
(76.0%)
N=68
(69.4%)
Blood pressure N=361
(90.5%)
N=92
(92.0%)
N=89
(88.1%)
Dental N=299
(75.1%)
N=88
(88.0%)
N=76
(75.2%)
Prostate N=78
(46.2%)
N=25
(54.3%)
N=15
(33.3%)
Mammogram N=117
(51.5%)
N=33
(61.1%)
N=35
(62.5%)
Pap smear N=127
(56.2%)
N=34
(63.0%)
N=36
(64.3%)
Other N=96
(24.5%)
N=20
(20.4%)
N=20
(20.0%)
7. Have you or anyone in your household ever been diagnosed with one of the following?
Bloomfield
N=401
Caldwell
N=100
Glen Ridge
N=103
Cancer N=64
(16.1%)
N=21
(21.0%)
N=14
(13.7%)
Diabetes N=99
(24.8%)
N=18
(18.0%)
N=15
(14.9%)
High blood pressure N=203
(51.0%)
N=38
(38.0%)
N=41
(40.6%)
Asthma N=96
(24.1%)
N=16
(16.0%)
N=23
(22.8%)
Heart Disease N=67
(16.8%)
N=20
(20.0%)
N=11
(10.9%)
Lung Disease N=29
(7.3%)
N=5
(5.0%)
N=2
(2.0%)
Mental Health Concerns N=40
(10.0%)
N=6
(6.1%)
N=6
(5.9%)
Other N=25
(7.6%)
N=4
(4.0%)
N=3
(3.0%)
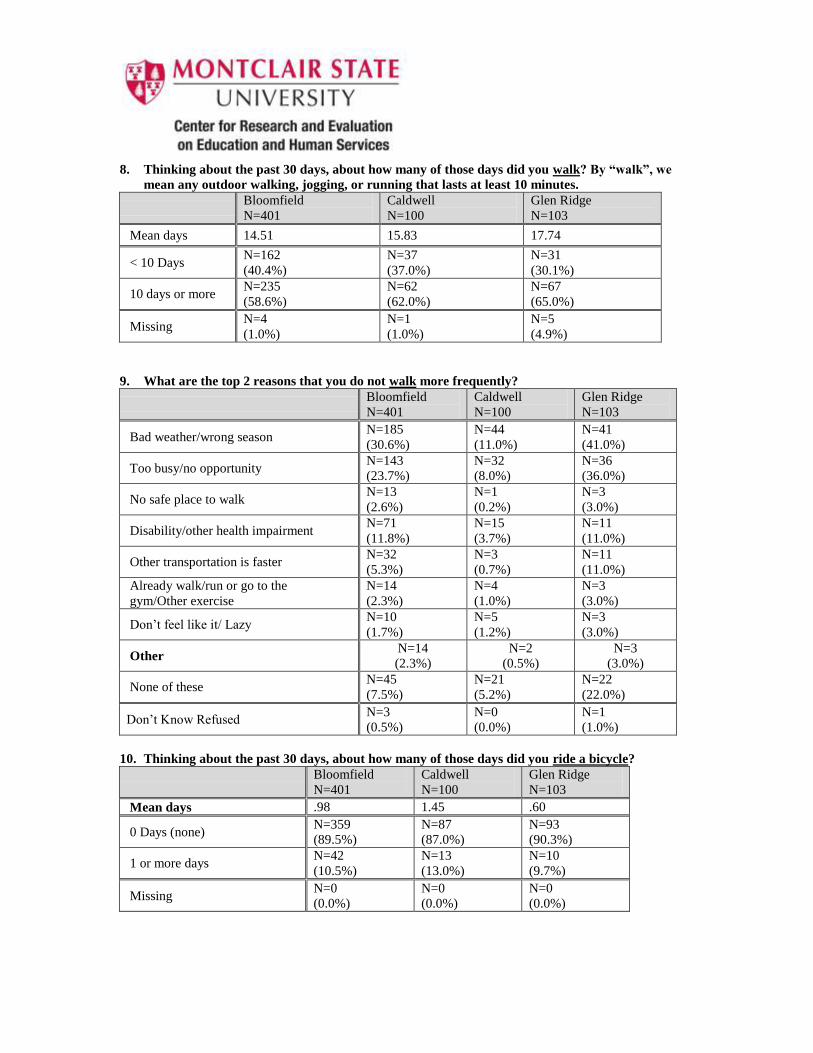
8. Thinking about the past 30 days, about how many of those days did you walk? By “walk”, we
mean any outdoor walking, jogging, or running that lasts at least 10 minutes.
Bloomfield
N=401
Caldwell
N=100
Glen Ridge
N=103
Mean days 14.51 15.83 17.74
< 10 Days N=162
(40.4%)
N=37
(37.0%)
N=31
(30.1%)
10 days or more N=235
(58.6%)
N=62
(62.0%)
N=67
(65.0%)
Missing N=4
(1.0%)
N=1
(1.0%)
N=5
(4.9%)
9. What are the top 2 reasons that you do not walk more frequently?
Bloomfield
N=401
Caldwell
N=100
Glen Ridge
N=103
Bad weather/wrong season N=185
(30.6%)
N=44
(11.0%)
N=41
(41.0%)
Too busy/no opportunity N=143
(23.7%)
N=32
(8.0%)
N=36
(36.0%)
No safe place to walk N=13
(2.6%)
N=1
(0.2%)
N=3
(3.0%)
Disability/other health impairment N=71
(11.8%)
N=15
(3.7%)
N=11
(11.0%)
Other transportation is faster N=32
(5.3%)
N=3
(0.7%)
N=11
(11.0%)
Already walk/run or go to the
gym/Other exercise
N=14
(2.3%)
N=4
(1.0%)
N=3
(3.0%)
Don’t feel like it/ Lazy N=10
(1.7%)
N=5
(1.2%)
N=3
(3.0%)
Other N=14
(2.3%)
N=2
(0.5%)
N=3
(3.0%)
None of these N=45
(7.5%)
N=21
(5.2%)
N=22
(22.0%)
Don’t Know Refused N=3
(0.5%)
N=0
(0.0%)
N=1
(1.0%)
10. Thinking about the past 30 days, about how many of those days did you ride a bicycle?
Bloomfield
N=401
Caldwell
N=100
Glen Ridge
N=103
Mean days .98 1.45 .60
0 Days (none) N=359
(89.5%)
N=87
(87.0%)
N=93
(90.3%)
1 or more days N=42
(10.5%)
N=13
(13.0%)
N=10
(9.7%)
Missing N=0
(0.0%)
N=0
(0.0%)
N=0
(0.0%)
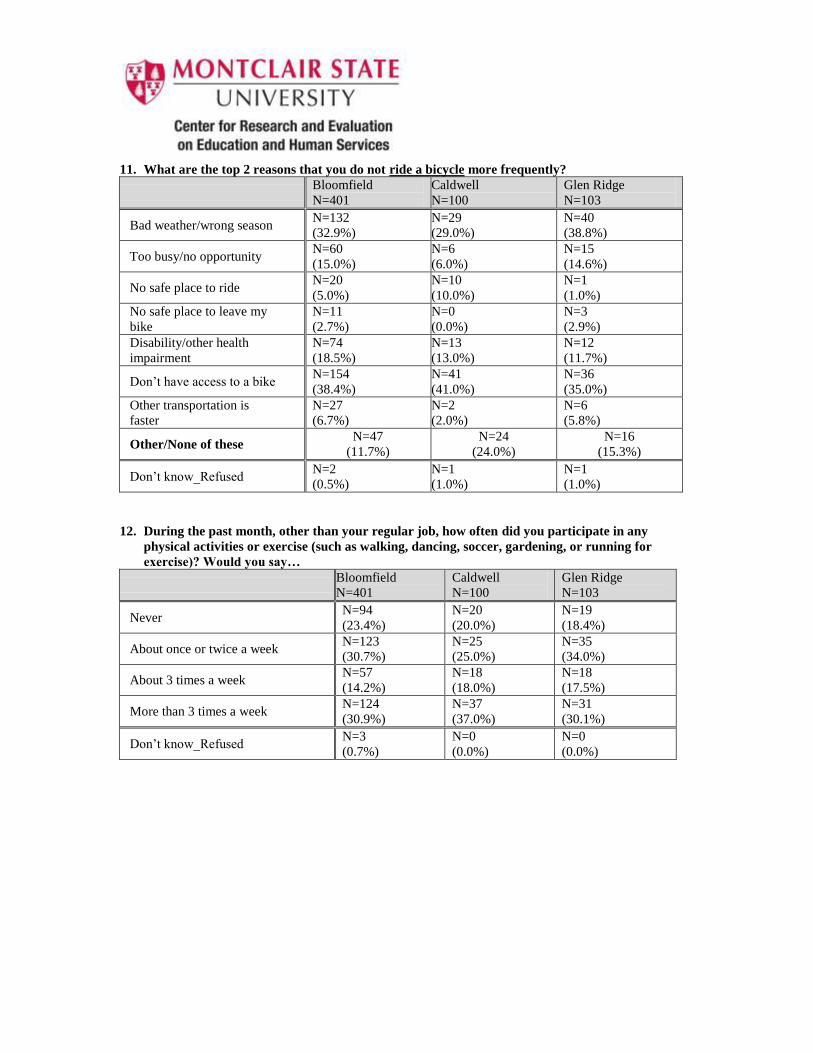
11. What are the top 2 reasons that you do not ride a bicycle more frequently?
Bloomfield
N=401
Caldwell
N=100
Glen Ridge
N=103
Bad weather/wrong season N=132
(32.9%)
N=29
(29.0%)
N=40
(38.8%)
Too busy/no opportunity N=60
(15.0%)
N=6
(6.0%)
N=15
(14.6%)
No safe place to ride N=20
(5.0%)
N=10
(10.0%)
N=1
(1.0%)
No safe place to leave my
bike
N=11
(2.7%)
N=0
(0.0%)
N=3
(2.9%)
Disability/other health
impairment
N=74
(18.5%)
N=13
(13.0%)
N=12
(11.7%)
Don’t have access to a bike N=154
(38.4%)
N=41
(41.0%)
N=36
(35.0%)
Other transportation is
faster
N=27
(6.7%)
N=2
(2.0%)
N=6
(5.8%)
Other/None of these N=47
(11.7%)
N=24
(24.0%)
N=16
(15.3%)
Don’t know_Refused N=2
(0.5%)
N=1
(1.0%)
N=1
(1.0%)
12. During the past month, other than your regular job, how often did you participate in any
physical activities or exercise (such as walking, dancing, soccer, gardening, or running for
exercise)? Would you say…
Bloomfield
N=401
Caldwell
N=100
Glen Ridge
N=103
Never N=94
(23.4%)
N=20
(20.0%)
N=19
(18.4%)
About once or twice a week N=123
(30.7%)
N=25
(25.0%)
N=35
(34.0%)
About 3 times a week N=57
(14.2%)
N=18
(18.0%)
N=18
(17.5%)
More than 3 times a week N=124
(30.9%)
N=37
(37.0%)
N=31
(30.1%)
Don’t know_Refused N=3
(0.7%)
N=0
(0.0%)
N=0
(0.0%)
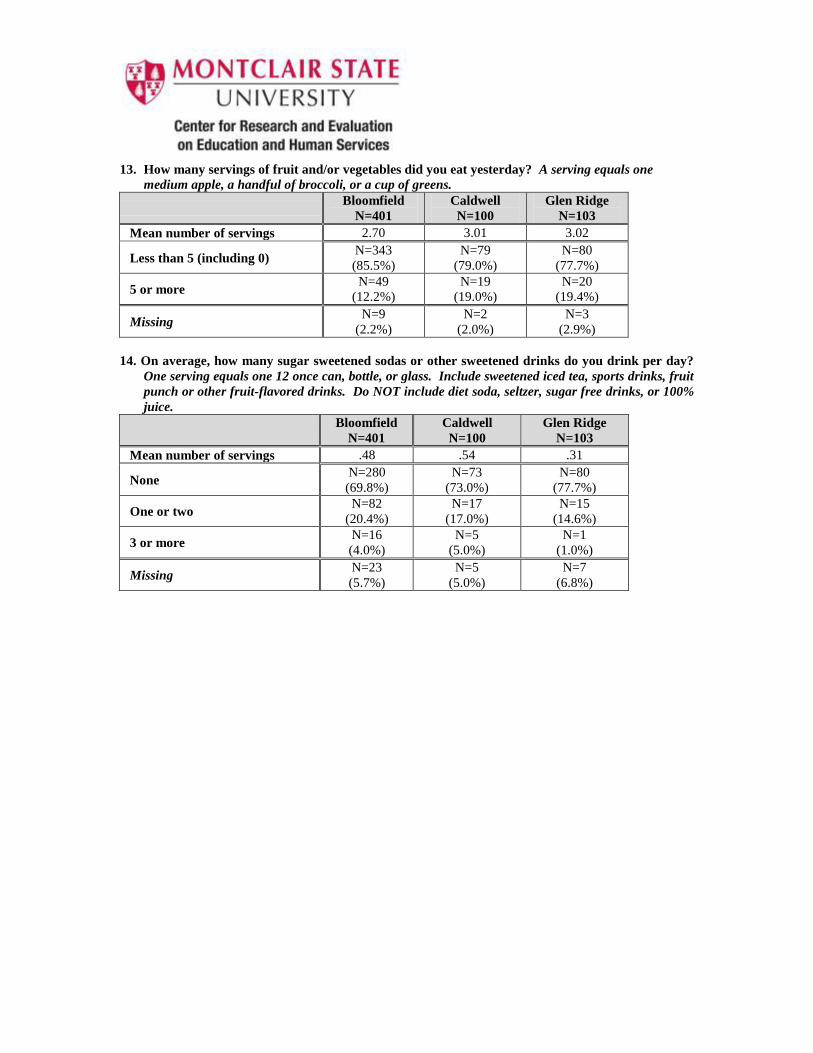
13. How many servings of fruit and/or vegetables did you eat yesterday? A serving equals one
medium apple, a handful of broccoli, or a cup of greens.
Bloomfield
N=401
Caldwell
N=100
Glen Ridge
N=103
Mean number of servings 2.70 3.01 3.02
Less than 5 (including 0) N=343
(85.5%)
N=79
(79.0%)
N=80
(77.7%)
5 or more N=49
(12.2%)
N=19
(19.0%)
N=20
(19.4%)
Missing N=9
(2.2%)
N=2
(2.0%)
N=3
(2.9%)
14. On average, how many sugar sweetened sodas or other sweetened drinks do you drink per day?
One serving equals one 12 once can, bottle, or glass. Include sweetened iced tea, sports drinks, fruit
punch or other fruit-flavored drinks. Do NOT include diet soda, seltzer, sugar free drinks, or 100%
juice.
Bloomfield
N=401
Caldwell
N=100
Glen Ridge
N=103
Mean number of servings .48 .54 .31
None N=280
(69.8%)
N=73
(73.0%)
N=80
(77.7%)
One or two N=82
(20.4%)
N=17
(17.0%)
N=15
(14.6%)
3 or more N=16
(4.0%)
N=5
(5.0%)
N=1
(1.0%)
Missing N=23
(5.7%)
N=5
(5.0%)
N=7
(6.8%)
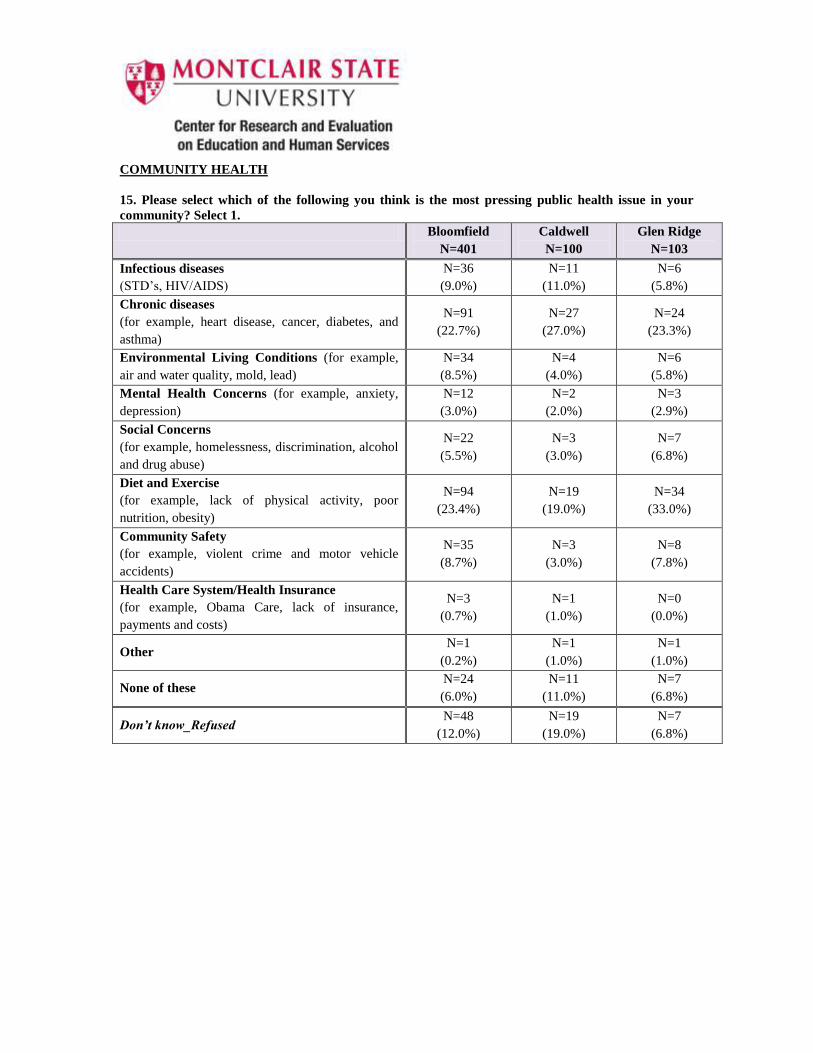
COMMUNITY HEALTH
15. Please select which of the following you think is the most pressing public health issue in your
community? Select 1.
Bloomfield
N=401
Caldwell
N=100
Glen Ridge
N=103
Infectious diseases
(STD’s, HIV/AIDS)
N=36
(9.0%)
N=11
(11.0%)
N=6
(5.8%)
Chronic diseases
(for example, heart disease, cancer, diabetes, and
asthma)
N=91
(22.7%)
N=27
(27.0%)
N=24
(23.3%)
Environmental Living Conditions (for example,
air and water quality, mold, lead)
N=34
(8.5%)
N=4
(4.0%)
N=6
(5.8%)
Mental Health Concerns (for example, anxiety,
depression)
N=12
(3.0%)
N=2
(2.0%)
N=3
(2.9%)
Social Concerns
(for example, homelessness, discrimination, alcohol
and drug abuse)
N=22
(5.5%)
N=3
(3.0%)
N=7
(6.8%)
Diet and Exercise
(for example, lack of physical activity, poor
nutrition, obesity)
N=94
(23.4%)
N=19
(19.0%)
N=34
(33.0%)
Community Safety
(for example, violent crime and motor vehicle
accidents)
N=35
(8.7%)
N=3
(3.0%)
N=8
(7.8%)
Health Care System/Health Insurance
(for example, Obama Care, lack of insurance,
payments and costs)
N=3
(0.7%)
N=1
(1.0%)
N=0
(0.0%)
Other N=1
(0.2%)
N=1
(1.0%)
N=1
(1.0%)
None of these N=24
(6.0%)
N=11
(11.0%)
N=7
(6.8%)
Don’t know_Refused N=48
(12.0%)
N=19
(19.0%)
N=7
(6.8%)
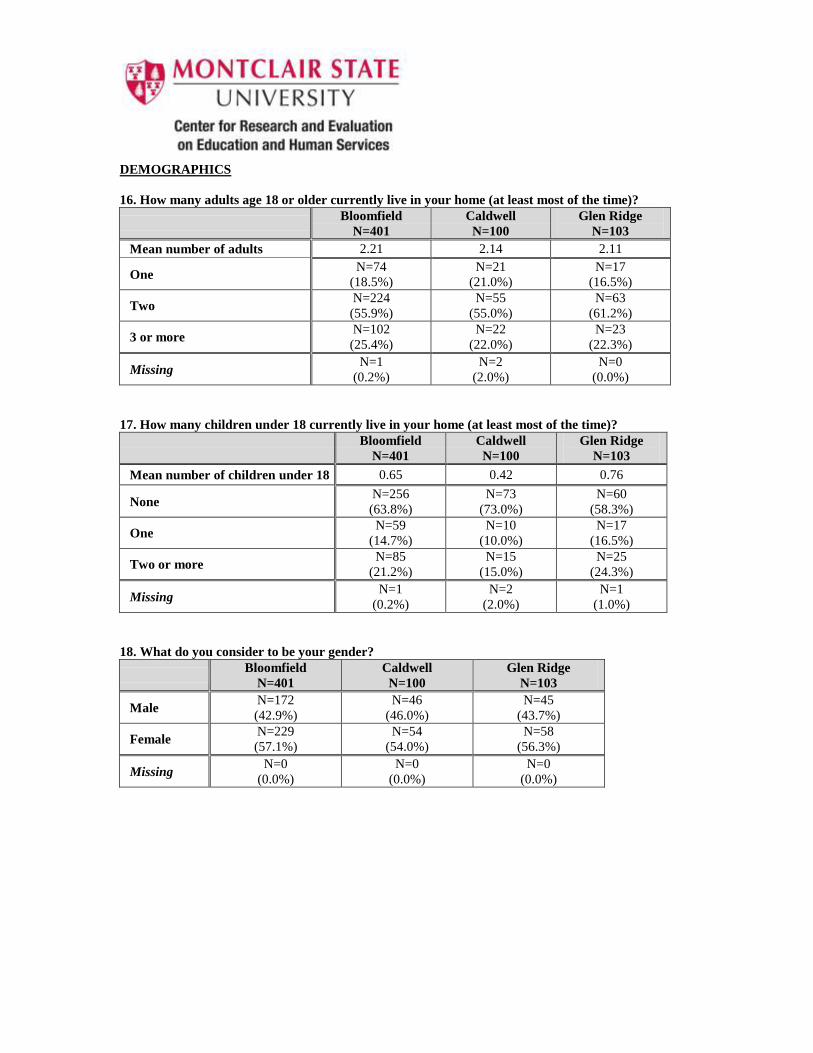
DEMOGRAPHICS
16. How many adults age 18 or older currently live in your home (at least most of the time)?
Bloomfield
N=401
Caldwell
N=100
Glen Ridge
N=103
Mean number of adults 2.21 2.14 2.11
One N=74
(18.5%)
N=21
(21.0%)
N=17
(16.5%)
Two N=224
(55.9%)
N=55
(55.0%)
N=63
(61.2%)
3 or more N=102
(25.4%)
N=22
(22.0%)
N=23
(22.3%)
Missing N=1
(0.2%)
N=2
(2.0%)
N=0
(0.0%)
17. How many children under 18 currently live in your home (at least most of the time)?
Bloomfield
N=401
Caldwell
N=100
Glen Ridge
N=103
Mean number of children under 18 0.65 0.42 0.76
None N=256
(63.8%)
N=73
(73.0%)
N=60
(58.3%)
One N=59
(14.7%)
N=10
(10.0%)
N=17
(16.5%)
Two or more N=85
(21.2%)
N=15
(15.0%)
N=25
(24.3%)
Missing N=1
(0.2%)
N=2
(2.0%)
N=1
(1.0%)
18. What do you consider to be your gender?
Bloomfield
N=401
Caldwell
N=100
Glen Ridge
N=103
Male N=172
(42.9%)
N=46
(46.0%)
N=45
(43.7%)
Female N=229
(57.1%)
N=54
(54.0%)
N=58
(56.3%)
Missing N=0
(0.0%)
N=0
(0.0%)
N=0
(0.0%)
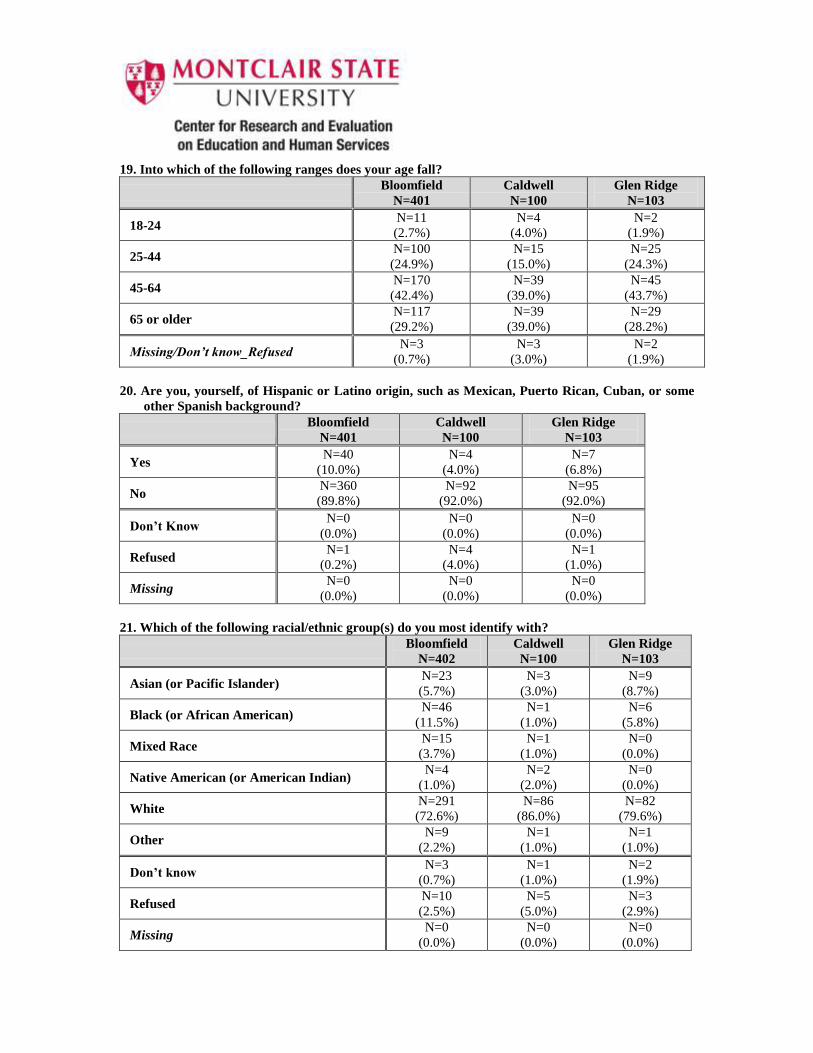
19. Into which of the following ranges does your age fall?
Bloomfield
N=401
Caldwell
N=100
Glen Ridge
N=103
18-24 N=11
(2.7%)
N=4
(4.0%)
N=2
(1.9%)
25-44 N=100
(24.9%)
N=15
(15.0%)
N=25
(24.3%)
45-64 N=170
(42.4%)
N=39
(39.0%)
N=45
(43.7%)
65 or older N=117
(29.2%)
N=39
(39.0%)
N=29
(28.2%)
Missing/Don’t know_Refused N=3
(0.7%)
N=3
(3.0%)
N=2
(1.9%)
20. Are you, yourself, of Hispanic or Latino origin, such as Mexican, Puerto Rican, Cuban, or some
other Spanish background?
Bloomfield
N=401
Caldwell
N=100
Glen Ridge
N=103
Yes N=40
(10.0%)
N=4
(4.0%)
N=7
(6.8%)
No N=360
(89.8%)
N=92
(92.0%)
N=95
(92.0%)
Don’t Know N=0
(0.0%)
N=0
(0.0%)
N=0
(0.0%)
Refused N=1
(0.2%)
N=4
(4.0%)
N=1
(1.0%)
Missing N=0
(0.0%)
N=0
(0.0%)
N=0
(0.0%)
21. Which of the following racial/ethnic group(s) do you most identify with?
Bloomfield
N=402
Caldwell
N=100
Glen Ridge
N=103
Asian (or Pacific Islander) N=23
(5.7%)
N=3
(3.0%)
N=9
(8.7%)
Black (or African American) N=46
(11.5%)
N=1
(1.0%)
N=6
(5.8%)
Mixed Race N=15
(3.7%)
N=1
(1.0%)
N=0
(0.0%)
Native American (or American Indian) N=4
(1.0%)
N=2
(2.0%)
N=0
(0.0%)
White N=291
(72.6%)
N=86
(86.0%)
N=82
(79.6%)
Other N=9
(2.2%)
N=1
(1.0%)
N=1
(1.0%)
Don’t know N=3
(0.7%)
N=1
(1.0%)
N=2
(1.9%)
Refused N=10
(2.5%)
N=5
(5.0%)
N=3
(2.9%)
Missing N=0
(0.0%)
N=0
(0.0%)
N=0
(0.0%)
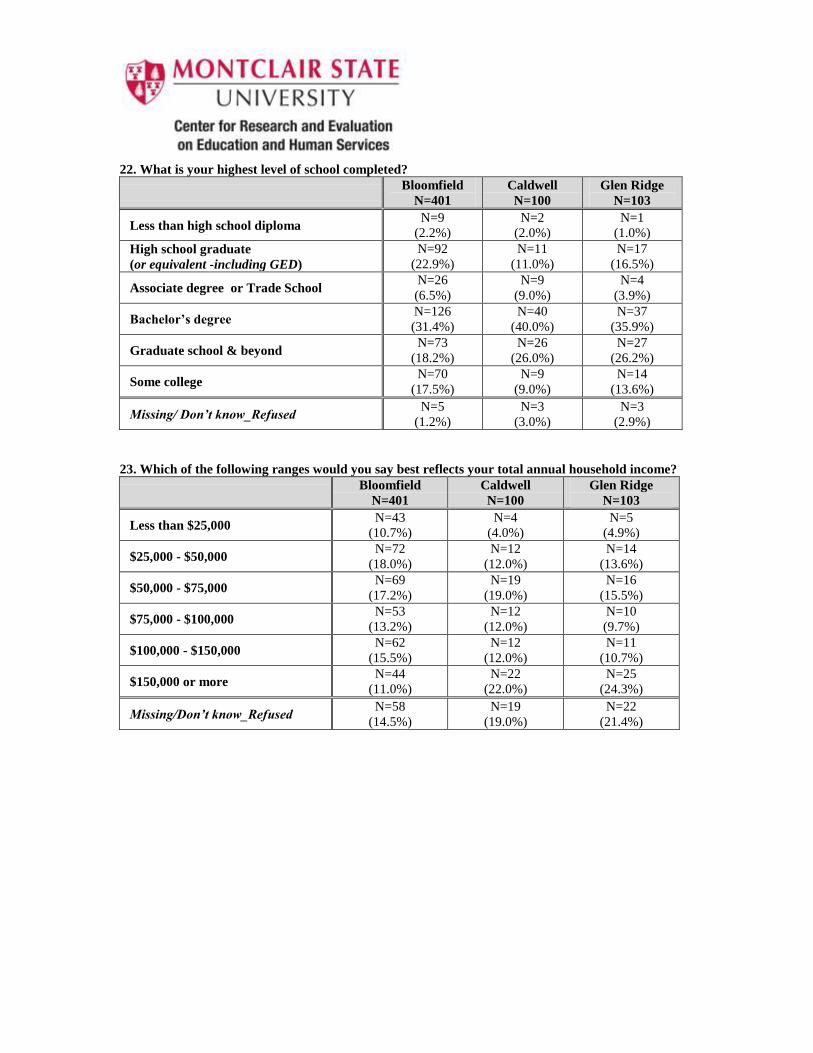
22. What is your highest level of school completed?
Bloomfield
N=401
Caldwell
N=100
Glen Ridge
N=103
Less than high school diploma N=9
(2.2%)
N=2
(2.0%)
N=1
(1.0%)
High school graduate
(or equivalent -including GED)
N=92
(22.9%)
N=11
(11.0%)
N=17
(16.5%)
Associate degree or Trade School N=26
(6.5%)
N=9
(9.0%)
N=4
(3.9%)
Bachelor’s degree N=126
(31.4%)
N=40
(40.0%)
N=37
(35.9%)
Graduate school & beyond N=73
(18.2%)
N=26
(26.0%)
N=27
(26.2%)
Some college N=70
(17.5%)
N=9
(9.0%)
N=14
(13.6%)
Missing/ Don’t know_Refused N=5
(1.2%)
N=3
(3.0%)
N=3
(2.9%)
23. Which of the following ranges would you say best reflects your total annual household income?
Bloomfield
N=401
Caldwell
N=100
Glen Ridge
N=103
Less than $25,000 N=43
(10.7%)
N=4
(4.0%)
N=5
(4.9%)
$25,000 - $50,000 N=72
(18.0%)
N=12
(12.0%)
N=14
(13.6%)
$50,000 - $75,000 N=69
(17.2%)
N=19
(19.0%)
N=16
(15.5%)
$75,000 - $100,000 N=53
(13.2%)
N=12
(12.0%)
N=10
(9.7%)
$100,000 - $150,000 N=62
(15.5%)
N=12
(12.0%)
N=11
(10.7%)
$150,000 or more N=44
(11.0%)
N=22
(22.0%)
N=25
(24.3%)
Missing/Don’t know_Refused N=58
(14.5%)
N=19
(19.0%)
N=22
(21.4%)
References for BDHHS Community Health Assessment
(1) Public Health Accreditation Board website
http://www.phaboard.org/about-phab/public-health-accreditation-background/
Accessed January 15, 2013
(2) Public Health Accreditation Board
Telephone calls and emails for confirmation.
April 8, 2013
(3) Partners for Health Foundation website
http://www.partnersfdn.org/faq_about.html
Accessed January 15, 2013
(4) Census 2010
http://www.zip-codes.com/zip-code/
Accessed April 1, 2013 http://98.130.138.182/ZipCode/07003.php
Accessed June 24, 2013
(5) American Community Survey 2007-2011
http://factfinder2.census.gov/faces/tableservices/jsf/pages/productview.xhtml?pid=ACS_11_5YR_D
P02
Bloomfield, Caldwell, Glen Ridge, Essex County, New Jersey, U.S. Education Levels Data
Accessed April 1, 2013
(6) Center for Disease Control’s National Behavioral Risk Factor Surveillance Systems (BRFSS) 2009
www.cdc.gov/brfss/
Accessed May 15, 2013
(7) National Health and Nutrition Examination Survey (NHANES)
http://www.cdc.gov/nchs/nhanes.htm
(8) U.S. Department of Transportation’s National Survey of Bicyclists and Pedestrian Attitudes and
Behavior
http://www.nhtsa.gov/Driving+Safety/Research+&+Evaluation/National+Survey+of+Bicyclist+and+
Pedestrian+Attitudes+and+Behavior
(9) Morbidity and Mortality Weekly Report
http://www.cdc.gov/mmwr/preview/mmwrhtml/mm6135a2.htm
Accessed April 15, 2013
(10) Healthy People 2020. Proportion of persons with a usual primary care provider
http://www.healthypeople.gov/2020/topicsobjectives2020/nationaldata.aspx?topicId=1
Accessed May 25, 2013
(11) Harvard School of Public Health, Fruits and Vegetable Servings Per Day
http://www.hsph.harvard.edu/nutritionsource/vegetables-full-story/#bottom_line
Accessed May 25, 2013