Embed Size (px)
Citation preview

Community Forum for Rezoning
Tuesday, March 25, 2014

Rezoning Considerations
• In October 2013, the Waxahachie ISD Board of Trustees approved the recommendation of the administration to reconfigure Marvin Elementary to house Pre-Kindergarten (Pre-K) through Fifth Grade beginning August 2014. By utilizing Marvin Elementary as a full elementary campus, this will enable the district to add an additional 396 elementary seats and eliminate overcrowding in several of the district’s elementary campuses.
• Possible Expansion of the Pre-Kindergarten Program• Bilingual programs located at Wedgeworth and Dunaway
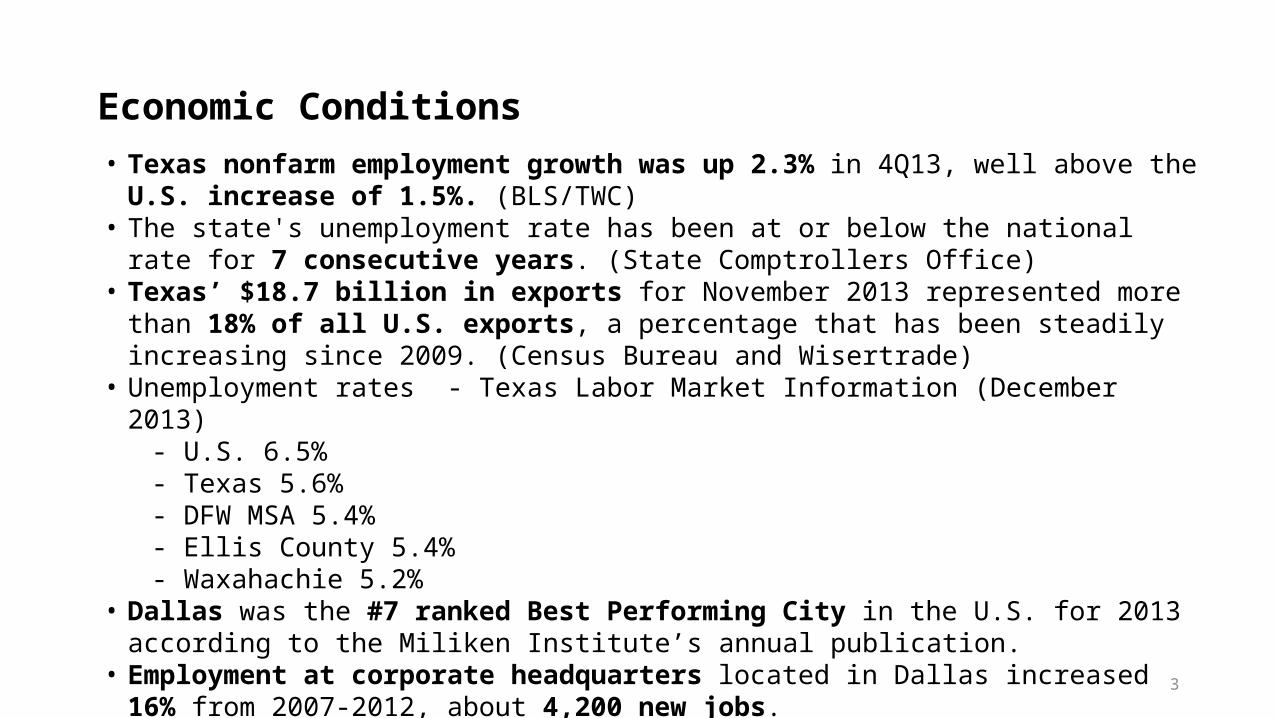
• Texas nonfarm employment growth was up 2.3% in 4Q13, well above the U.S. increase of 1.5%. (BLS/TWC)
• The state's unemployment rate has been at or below the national rate for 7 consecutive years. (State Comptrollers Office)
• Texas’ $18.7 billion in exports for November 2013 represented more than 18% of all U.S. exports, a percentage that has been steadily increasing since 2009. (Census Bureau and Wisertrade)
• Unemployment rates - Texas Labor Market Information (December 2013)- U.S. 6.5%- Texas 5.6%- DFW MSA 5.4%- Ellis County 5.4%- Waxahachie 5.2%
• Dallas was the #7 ranked Best Performing City in the U.S. for 2013 according to the Miliken Institute’s annual publication.
• Employment at corporate headquarters located in Dallas increased 16% from 2007-2012, about 4,200 new jobs.
• DFW builders put up 21,236 new homes in 2013, a 19% increase over 2012. (Metrostudy) 3
Economic Conditions

DFW New Home Ranking Report
4
ISD Ranked by Annual Closings – 4Q13
Rank District Name Annual Starts Annual Closings VDL Future1 Frisco ISD 2,931 2,704 3,794 8,9352 Northwest ISD 1,266 1,187 1,717 21,9743 Denton ISD 1,300 1,152 2,510 13,9024 Lewisville ISD 965 904 1,733 2,9115 Dallas ISD 961 894 2,207 7,3336 Prosper ISD 942 801 1,561 15,6867 Keller ISD 857 795 1,216 3,2178 McKinney ISD 678 718 1,238 7,2039 Eagle Mtn. - Saginaw ISD 733 707 1,515 19,968
10 Mansfield ISD 594 610 745 5,54711 Little Elm ISD 569 599 793 6,69112 Allen ISD 597 581 861 1,25113 Rockwall ISD 562 505 1,639 8,18614 Plano ISD 400 422 778 1,63115 Forney ISD 434 403 1,331 11,47716 Crowley ISD 358 386 1,762 8,27617 Burleson ISD 401 371 873 3,42918 Wylie ISD 336 367 794 5,07919 Fort Worth ISD 358 361 999 4,56720 Midlothian ISD 337 325 925 14,54721 Carrollton-Farmers Branch ISD 302 316 288 96722 Anna ISD 306 314 374 3,61823 Garland ISD 317 308 619 3,92524 Waxahachie ISD 258 256 953 9,11225 HEB ISD 323 243 344 6,199 Totals 21,236 20,019 46,087 280,066
1Q08
2Q08
3Q08
4Q08
1Q09
2Q09
3Q09
4Q09
1Q10
2Q10
3Q10
4Q10
1Q11
2Q11
3Q11
4Q11
1Q12
2Q12
3Q12
4Q12
1Q13
2Q13
3Q13
4Q13
0
50
100
150
200
250
300
Starts Closings Inventory
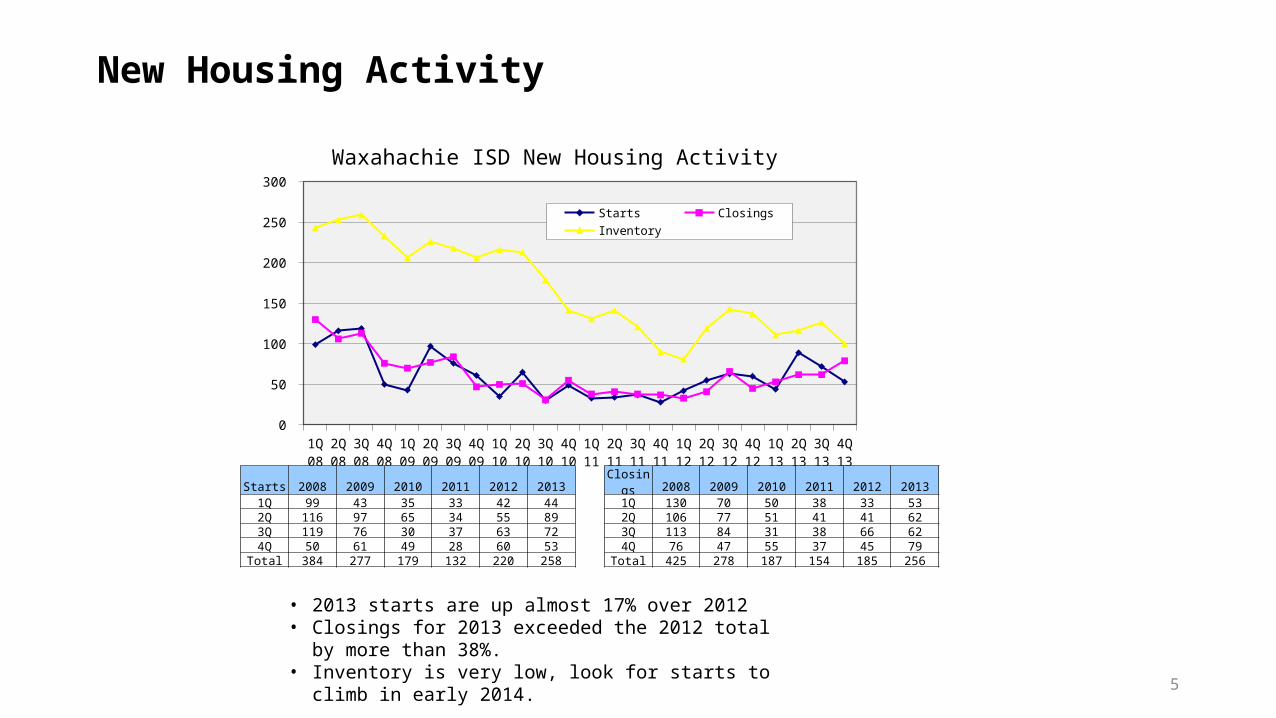
New Housing Activity
• 2013 starts are up almost 17% over 2012• Closings for 2013 exceeded the 2012 total by more than 38%.• Inventory is very low, look for starts to climb in early 2014.
5
Waxahachie ISD New Housing Activity
Starts 2008 2009 2010 2011 2012 2013 Closings 2008 2009 2010 2011 2012 20131Q 99 43 35 33 42 44 1Q 130 70 50 38 33 532Q 116 97 65 34 55 89 2Q 106 77 51 41 41 623Q 119 76 30 37 63 72 3Q 113 84 31 38 66 624Q 50 61 49 28 60 53 4Q 76 47 55 37 45 79
Total 384 277 179 132 220 258 Total 425 278 187 154 185 256

Annual Closing Distribution 4Q13
6
Top 10 Subdivisions - 4Q13 (Ranked by Annual Closings)
Rank SubdivisionAnnual Starts
Quarter Starts
Annual Closings
Quarter Closings
1 Saddlebrook Estates (Waxahachie) 27 2 31 122 North East Meadows 31 8 28 93 Arbor at Willow Grove, The 20 1 26 64 Garden Valley Ranch 16 6 23 95 Mustang Creek (Waxahachie) 15 0 20 36 Windchase East 11 0 16 17 Windchase Addition 16 5 13 38 Oxford Ranch 15 9 12 29 Park Place (Waxahachie) 12 4 10 1
10 Willow Springs (Waxahachie) 7 1 9 3 TOTALS 170 36 188 49
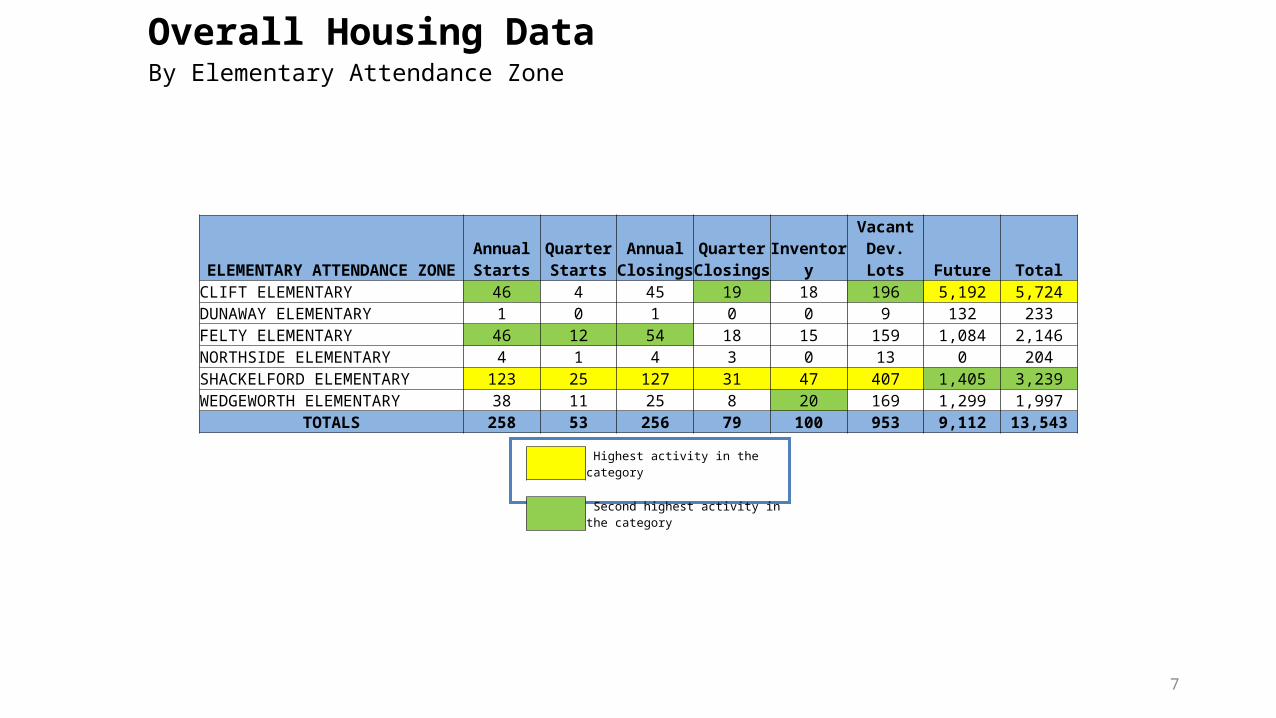
Overall Housing DataBy Elementary Attendance Zone
Highest activity in the category Second highest activity in the category
7
ELEMENTARY ATTENDANCE ZONEAnnual Starts
Quarter Starts
Annual Closings
Quarter Closings Inventory
Vacant Dev. Lots Future Total
CLIFT ELEMENTARY 46 4 45 19 18 196 5,192 5,724DUNAWAY ELEMENTARY 1 0 1 0 0 9 132 233FELTY ELEMENTARY 46 12 54 18 15 159 1,084 2,146NORTHSIDE ELEMENTARY 4 1 4 3 0 13 0 204SHACKELFORD ELEMENTARY 123 25 127 31 47 407 1,405 3,239WEDGEWORTH ELEMENTARY 38 11 25 8 20 169 1,299 1,997
TOTALS 258 53 256 79 100 953 9,112 13,543

Enrollment History
Year (Oct.) EE/PK K 1st 2nd 3rd 4th 5th 6th 7th 8th 9th 10th 11th 12th Total Total
Growth % 2009/10 249 529 560 529 553 493 524 478 500 509 505 518 529 448 6,924 2010/11 263 551 605 541 577 578 522 553 519 534 571 529 528 514 7,385 461 6.7%2011/12 244 575 584 571 525 564 579 531 579 523 624 616 512 489 7,516 131 1.8%2012/13 228 545 614 553 586 543 568 578 548 586 619 607 584 492 7,651 135 1.8%2013/14 220 561 586 624 586 563 549 558 608 550 696 589 567 533 7,790 139 1.8%
2014/15 SCEN. EE/PK K 1st 2nd 3rd 4th 5th 6th 7th 8th 9th 10th 11th 12th Total
Total Growth
Roll-up 220 561 561 586 624 586 563 549 558 608 550 696 589 567 7,818 28
3-yr Avg 220 565 599 568 636 581 567 549 582 613 649 697 560 529 7,913 123Last YR Cohort 220 577 603 596 661 563 569 539 587 610 653 662 550 517 7,909 119
*Yellow box = largest grade per year*Green box = second largest grade per year
^
^
^
^^
^
^
CLIFT
DUNAWAY
WEDGEWORTHFELTY
SHACKELFORD
NORTHSIDE
§̈¦35E
£¤77
£¤287
£¤287B
£¤67
£¤67B
£¤287
34
FM 66
F M 875
FM 8
76
FM 308
287 BUS
35E
FM ROAD 878
OV
ILL
A R
D
FM 55
342
FM 157
IOL
A L
N
WYATT ST
HIGHWAY 34
FM 916
GRAINERY RD
ROGERS ST
GR
AN
D A
VE
9TH
ST
Cam
bell
Rd
FM 66
OV
I LL
AR
D
34
FM 55
287 BUS
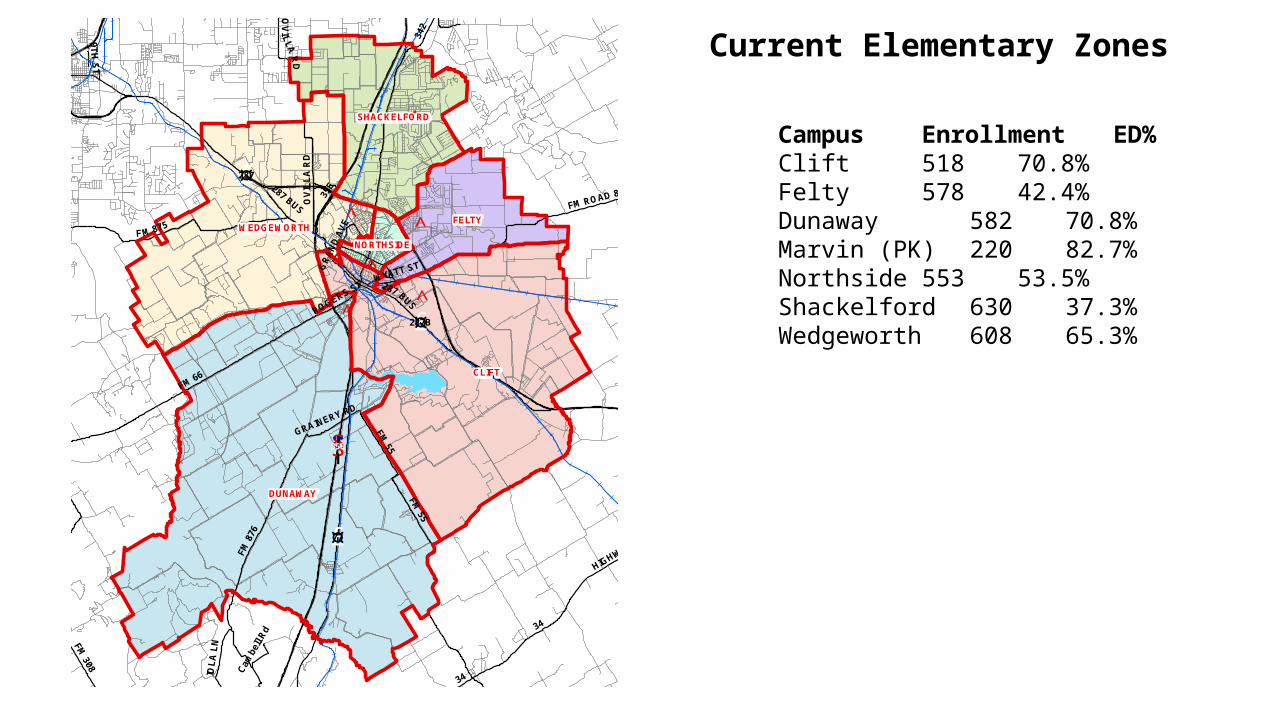
Current Elementary Zones
Campus Enrollment ED%Clift 518 70.8%Felty 578 42.4%Dunaway 582 70.8%Marvin (PK) 220 82.7%Northside 553 53.5%Shackelford 630 37.3%Wedgeworth 608 65.3%

^
^
^
^^
^
^
FINLEY
HOWARD
§̈¦35E
§̈¦35E
£¤77
£¤287
£¤287B
£¤67
£¤67B
£¤287B
£¤287
34
FM 66
F M 875
FM 8
76
FM 308
287 BUS
35E
FM ROAD 878
342
OV
ILL
A R
D
FM 55
FM 157
IOL
A L
N
HIGHWAY 34
FM 916
ROSS ST
GRAINERY RD
ROGERS ST
GR
AN
D A
VE
9T
H S
T
Cam
bell
Rd
FM 66
OV
ILL
AR
D
34
35
E
FM 55
287B
US
Current Junior High Zones
Campus EnrollmentFinley J.H. 801Howard J.H. 915
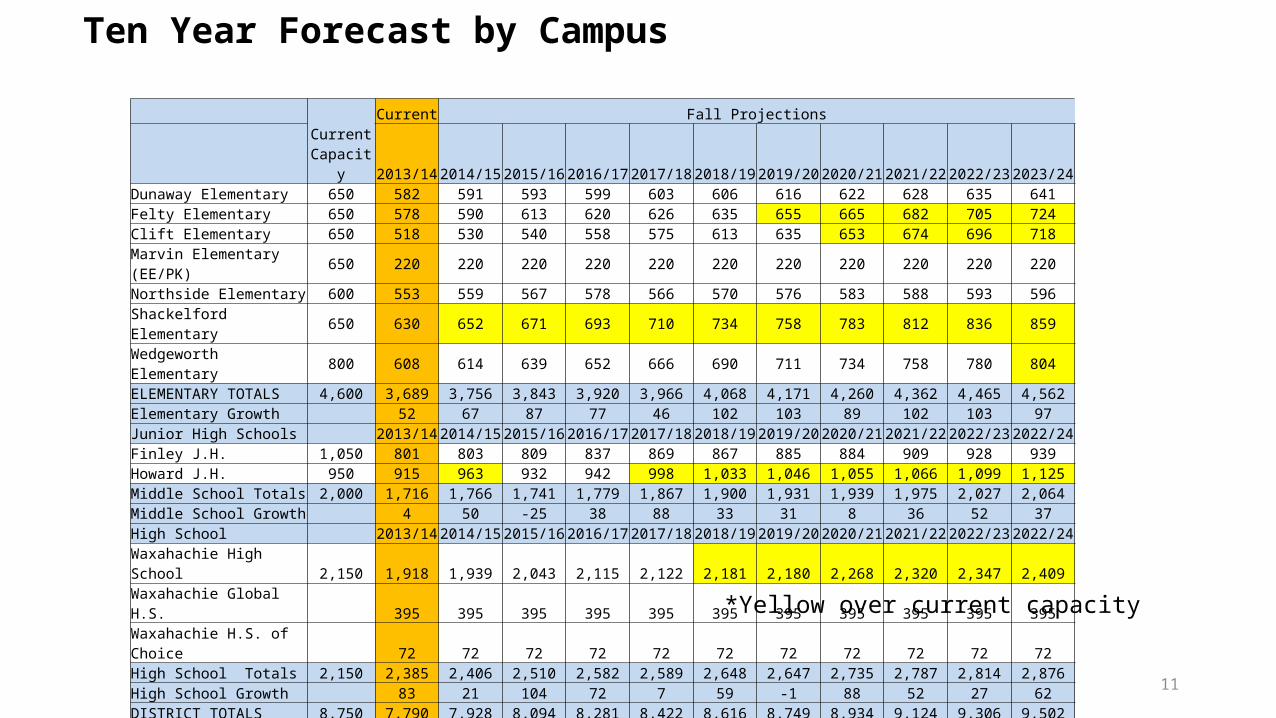
Ten Year Forecast by Campus
11
Current Capacity
Current Fall Projections
2013/14 2014/15 2015/16 2016/17 2017/18 2018/19 2019/20 2020/21 2021/22 2022/23 2023/24Dunaway Elementary 650 582 591 593 599 603 606 616 622 628 635 641Felty Elementary 650 578 590 613 620 626 635 655 665 682 705 724Clift Elementary 650 518 530 540 558 575 613 635 653 674 696 718Marvin Elementary (EE/PK) 650 220 220 220 220 220 220 220 220 220 220 220Northside Elementary 600 553 559 567 578 566 570 576 583 588 593 596Shackelford Elementary 650 630 652 671 693 710 734 758 783 812 836 859Wedgeworth Elementary 800 608 614 639 652 666 690 711 734 758 780 804ELEMENTARY TOTALS 4,600 3,689 3,756 3,843 3,920 3,966 4,068 4,171 4,260 4,362 4,465 4,562Elementary Growth 52 67 87 77 46 102 103 89 102 103 97Junior High Schools 2013/14 2014/15 2015/16 2016/17 2017/18 2018/19 2019/20 2020/21 2021/22 2022/23 2022/24Finley J.H. 1,050 801 803 809 837 869 867 885 884 909 928 939Howard J.H. 950 915 963 932 942 998 1,033 1,046 1,055 1,066 1,099 1,125Middle School Totals 2,000 1,716 1,766 1,741 1,779 1,867 1,900 1,931 1,939 1,975 2,027 2,064Middle School Growth 4 50 -25 38 88 33 31 8 36 52 37High School 2013/14 2014/15 2015/16 2016/17 2017/18 2018/19 2019/20 2020/21 2021/22 2022/23 2022/24Waxahachie High School 2,150 1,918 1,939 2,043 2,115 2,122 2,181 2,180 2,268 2,320 2,347 2,409Waxahachie Global H.S. 395 395 395 395 395 395 395 395 395 395 395Waxahachie H.S. of Choice 72 72 72 72 72 72 72 72 72 72 72High School Totals 2,150 2,385 2,406 2,510 2,582 2,589 2,648 2,647 2,735 2,787 2,814 2,876High School Growth 83 21 104 72 7 59 -1 88 52 27 62DISTRICT TOTALS 8,750 7,790 7,928 8,094 8,281 8,422 8,616 8,749 8,934 9,124 9,306 9,502GROWTH 139 138 166 187 141 194 133 185 190 182 196Percent Growth 1.8% 1.8% 2.1% 2.3% 1.7% 2.3% 1.5% 2.1% 2.1% 2.0% 2.1%
*Yellow over current capacity

^̂
^^
^
^
^^
^ ^
^
^
^
^
CLIFT
DUNAWAY
WEDGEWORTHFELTY
SHACKELFORD
NORTHSIDE
§̈¦35E
£¤77
£¤287
£¤287B
£¤67
£¤67B
£¤287
34
FM 66
F M 875FM
876
FM 308
287 BUS35
E
FM ROAD 878
OV
ILL
A R
D
FM 55
342
FM 157
IOL
A L
N
WYATT ST
HIGHWAY 34
FM 916
GRAINERY RD
ROGERS ST
GR
AN
D A
VE
9TH
ST
Cam
bell
Rd
FM 66
OV
I LL
AR
D
34
FM 55
287 BUS
Proposed Elementary Zones
Campus Enrollment ED%Clift 460 73.3%Felty 455 27.7%Dunaway 590 72.2%Marvin 513 72.9%Northside 445 53.5%Shackelford 538 35.1%Wedgeworth 688 64.5%

^
^
^
^
^
^
^
§̈¦35E
§̈¦35E
£¤287
£¤287B
£¤77
£¤287
35E
287 BUS
FM 66
WYATT ST
MARVIN ST
OV
ILL
A R
D
FM ROAD 878
JEFFERSON ST
RO
SS
ST
ROSS AVE
ROGERS ST
GR
AN
D A
VE
287 BYP
JOH
N A
RD
EN
DR
KAUFMAN ST
FM 875
GETZENDANER AVE
35E
287 BU
S
CLIFT ELEM
FELTY ELEM
MARVIN ELEM
DUNAWAY ELEM
NORTHSIDE ELEM
WEDGEWORTH ELEM
Proposed Elementary Zones
Mustang Creek to Felty
Hunter Cove Apt. to WedgeworthBlue Lake Villas to Wedgeworth
Katy Lake to Northside
Area east of Ross St. to Clift
Bent Tree Apt to Marvin
Area south of Ross St. to Marvin
Vista Hills to Marvin

^
^
FINLEY
HOWARD
§̈¦35E
§̈¦35E
£¤287B
£¤287
£¤77FM 66
287 BUS
35E
FM 875
OV
ILL
A R
D
FMROAD 878
WYATT ST
MARVIN ST
JEFFERSON ST
ROSSS
T
ROSS AVE
ROGERS ST
287 BYP
GR
AN
D A
VE
JOH
N A
RD
EN
DR
KAUFMAN ST
35E
287 BUS
FINLEY JH
HOWARD JH
Proposed Junior High Zones
Campus EnrollmentFinley J.H. 956Howard J.H. 760

Next Steps
• Next Public Forums: Thursday, March 27th, and Monday, March 31st; Both at the WHS Fine Arts Center at 7:00 PM
• Final Plan Approval: Monday, April 14th, Board of Trustees Meeting• Final Plan Communicated to the Community: Beginning on Tuesday,
April 15th
For additional information, please “click” on the “Rezoning 2014” link on the district’s website at www.wisd.org.