Embed Size (px)
Citation preview
Environmental Management (2017) 60:555–573DOI 10.1007/s00267-017-0893-5
PROFILE
Community exposure and vulnerability to water quality andavailability: a case study in the mining-affected PazñaMunicipality, Lake Poopó Basin, Bolivian Altiplano
Megan French1 Natalie Alem2 Stephen J. Edwards 3,4
Efraín Blanco Coariti5
Helga Cauthin2 Karen A. Hudson-Edwards6 Karen Luyckx7,8 Jorge Quintanilla5
Oscar Sánchez Miranda2
Received: 18 June 2016 / Accepted: 23 May 2017 / Published online: 8 June 2017© The Author(s) 2017. This article is an open access publication
Abstract Assessing water sources for drinking and irriga-tion along with community vulnerability, especially indeveloping and rural regions, is important for reducing riskposed by poor water quality and limited water availabilityand accessibility. We present a case study of rural mining-agricultural communities in the Lake Poopó Basin, one ofthe poorest regions on the Bolivian Altiplano. Here, rela-tively low rainfall, high evaporation, salinization andunregulated mining activity have contributed to environ-mental degradation and water issues, which is a situationfacing many Altiplano communities. Social data from 72households and chemical water quality data from 27 surface
water and groundwater sites obtained between August 2013and July 2014 were used to develop locally relevant vul-nerability assessment methodologies and ratings withrespect to water availability and quality, and ChemicalWater Quality Hazard Ratings to assess water quality status.Levels of natural and mining-related contamination in manywaters (CWQHR ≥ 6; 78% of assessed sites) mean thateffective remediation would be challenging and requiresubstantial investment. Although waters of fair to goodchemical quality (CWQHR ≤ 5; 22% of assessed sites) doexist, treatment may still be required depending on use, andaccess issues remain problematic. There is a need to complywith water quality legislation, improve and maintain basicwater supply and storage infrastructure, build and operatewater and wastewater treatment plants, and adequately andsafely contain and treat mine waste. This study serves as aframework that could be used elsewhere for assessing andmitigating water contamination and availability affectingvulnerable populations.
Keywords Water resources management Water quality
Water scarcity Vulnerability Bolivian Altiplano Mining
Introduction
Assessment of water sources used for potable water, irri-gation and livestock along with assessment of communityvulnerability are key steps in reducing risk posed by poorwater quality and inadequate availability. In vulnerablesituations where communities lack the ability to anticipate,resist, survive and recover from any impact of a hazard(Blaikie et al. 1994), there can be a resultant risk—defined
* Stephen J. [email protected]
1 Institute for Risk and Disaster Reduction, University CollegeLondon, Gower Street, London WC1E 6BT, UK
2 Centro de Comunicación y Desarrollo Andino, Avenida TadeoHaenke No. 2231, Cochabamba, Bolivia
3 UCL Hazard Centre, Department of Earth Sciences, UniversityCollege London, Gower Street, London WC1E 6BT, UK
4 Andean Risk & Resilience Institute for Sustainability & theEnvironment, Cerro El Plomo, Las Condes 5630 Santiago, Chile
5 Instituto de Investigaciones Químicas, Universidad Mayor SanAndrés, 303 La Paz, Bolivia
6 Department of Earth and Planetary Sciences, Birkbeck, Universityof London, Malet Street, London WC1E 7HX, UK
7 Catholic Agency for Overseas Development, 55 WestminsterBridge Road, London SE1 7JB, UK
8 Present address: Feedback, 61 Mare Street, London E8 4RG, UK
Electronic supplementary material The online version of this article(doi:10.1007/s00267-017-0893-5) contains supplementary material,which is available to authorized users.
here as the product of hazard and vulnerability—tothe population and the ecosystems and environmentsupon which they depend. This study uses the term hazard torefer to stresses arising from chemical water quality andwater availability. Water quality is central to human, animaland ecosystem health; many chemical (e.g., salts, nutrientsand metals) and biological (e.g., micro-organisms)constituents can pose potential hazards when atelevated concentrations according to exposure and dose(i.e., ingestion of water and food, inhalation, adsorption toskin; WHO 2011). A potential hazard also existsin situations of inadequate water availability (due to limitedresource and/or lack of supply infrastructure) to meet basicrequirements (e.g., for consumption and sanitation) and/orthe needs of activities such as food production (i.e.,irrigation).
Assessment and monitoring of water resources and theirquality is generally routine management protocol in devel-oped countries. However, this is not always the case indeveloping regions or remote areas where vulnerablecommunities are disproportionately affected by poor waterquality (UNEP 2010). Areas suffering from limited waterresource availability (e.g., arid regions; Mohsen 2007) oraccessibility (e.g., lack of boreholes and pipelines; Bonsoret al. 2011) can also be particularly vulnerable to water risk.This is especially the case if limited water resources arecompromised by natural and anthropogenic contamination(e.g., brackish groundwater, high metal concentrations,wastewater and industrial effluent) or changing climate(e.g., glacial recession; Vergara et al. 2007). Additionalsusceptibilities can include poverty (e.g., Hanjra et al.2009), high sector water usage (e.g., irrigation; Cai et al.2003), remoteness (e.g., Garrett et al. 2008), insufficientwater management and lack of treatment facilities orsupply infrastructure, lack of education and significantpresence of sensitive groups (e.g., children and theelderly). Communities affected by such factors maybenefit from support in assessment of their degree of vul-nerability and water situation, both in terms of climatechange adaptation and with regards to health and sanitation,particularly given that improving access to safe watercan be an effective part of poverty alleviation strategies(WHO 2011).
Components of water risk are prevalent in the LakePoopó Basin (~3685 m above sea level (a.s.l.), 24,013 km2,66° 18 ‘ −67° 56’ W; 17° 07 ‘ −20° 01’ S, Fig. 1 inset), oneof the poorest regions on the Bolivian Altiplano, wheremany communities lack access to safe drinking water andsanitation. This largely rural region is characterised by anhistorical and on-going legacy of unregulated mineralmining. This combined with a poor socio-economic situa-tion, relatively low rainfall and high evaporation, havecontributed to environmental degradation and water issues
(e.g., Calizaya 2009). The Lake Poopó Basin is confrontedwith water scarcity in the dry season (as evidenced by thelake drying out in December 2015, National Geographic2016), periodic and heavy rainfall during the wet season,considerable water quality issues due to anthropogenic (e.g.,mining) and natural sources (mineral reactions and thermalsprings), as well as climatic factors (high evaporation andsalinization) (Abarca-Del Rio et al. 2012; Calizaya 2009;CAMINAR 2013; Ekdahl 2007; García et al. 2010;Klartell and Sandholm 2009; Lilja and Linde 2006;Navarro Torres et al. 2012; Pillco and Bengtsson 2006;Quintanilla et al. 2012; Ramos Ramos et al. 2012, 2014;Rosenberg and Stålhammer 2010; Selander and Svan 2007;Tapia et al. 2012; Tapia and Audry 2013; Van Den Berghet al. 2010).
In this paper we report on the evaluation of the exposureand vulnerability to the hazards of water availability andchemical quality in communities of Pazña Municipality(sub-basins of Antequera and Urmiri and the adjacent Pazñafloodplain of the Lake Poopó Basin; Fig. 1). The key tothis study is the unique collaboration between UK andBolivian universities and non-government organisations(NGOs) to examine a complex problem through the inte-gration of natural and social sciences. Through this colla-boration and engagement with communities it has beenpossible to evaluate water risk in the area by developing andapplying some simple methods to measure hazard andvulnerability in ways that are relatively easy for end-usersto understand. This has led to the development of anumber of evidence-based recommendations from com-munity to government level and acts as a case studythat could be transposed to similar environments andsituations elsewhere to aid evidence-based water riskassessments.
Background
Environmental Setting
The study area is located in Pazña Municipality on thecentral eastern margin of the Lake Poopó Basin, ~60 kmsouth east of the city of Oruro (Fig. 1 inset), and includestwo sub-basins (Antequera, 150.4 km2 and Urmiri, 76.2km2; Quintanilla et al. 2012) (Fig. 1). The area is a ruralregion located at elevations of ~3700–4750 m a.s.l. and issemi-arid with relatively high evaporation (e.g., 323 mm/yin Antequera sub-basin; Calizaya 2009) and relatively lowseasonal rainfall. The local rainfall record in Poopó Villagein the adjacent sub-basin to the study area (Fig. 1) in 2013was 470.8 mm/y, and nearly 70% of this occurred inDecember, January and February (SENAMHI 2014; Fig.S1). Minimum average temperatures range from around −3 °C
556 Environmental Management (2017) 60:555–573
Fig. 1 Elevation map (m a.s.l) showing study area, communitiessurveyed (circles; ca-cm) and water quality sample sites (triangles andcodes; ga-gj groundwater well; sa-sf mining-separated surface source;
ma-mi mining-associated surface source; ta-tb thermal water). Insetmap shows location of study area within the Lake Poopó Basin andwithin Bolivia (500 m resolution, SRTM data, 2000)
Environmental Management (2017) 60:555–573 557
in winter to ~7 °C in summer, and maximum averagetemperatures are ~15 °C in winter to ~20 °C in summer(Fig. S1). These factors result in limited surface wateravailability in the dry season (Calizaya 2009; Pillco andBengtsson 2006), salinization of soils and seasonal frost,which, along with erosion, soil compaction, loss of vege-tation cover and loss of soil fertility (Calizaya 2009;Quintanilla et al. 2012; Orsag 2009), limit agricultural andranching activities, the main economic activities in ruralAltiplano communities.
The regional geology comprises steeply folded Palaeo-zoic rocks, which form parallel bands with north-westerlystrike directions (Sergeotecmin 1992). Overlying this areQuaternary deposits that include fluvial sediments, aeoliansediments, and lacustrine deposits that correspond to thepaleolakes that once covered the Altiplano (Argollo andMourguiart 2000; Wirrmann and Mourguiart 1995). Themain hydrogeological unit of the wider Lake Poopó Basin isa Quaternary aquifer composed of sediments that overlielow permeability Palaeozoic sedimentary rocks (e.g., shaleand sandstone) (Quintanilla et al. 2012). The recharge zoneis located in the hills of the Eastern cordillera and at mouthsof the valleys, although the rate of groundwater recharge isunderstood to be generally very low (Montes de Oca 1997).The approximate regional groundwater flow is north tosouth. Generalised hydrogeological information for thestudy area from SERGEOMIN (2000) indicates that theaquifers in the upstream regions of the Antequera andUrmiri sub-basins are thought to be insignificant, and indownstream areas before and after the confluence with thePazña River a large productive aquifer is indicated. Thedownstream area of the Pazña River and the majority ofthe remaining municipality of Pazña are together indicatedas a small aquifer of limited production. The studyarea encompasses two contrasting rivers (Fig. 1): theUrmiri River without mining activity, but with inputsfrom natural thermal waters; the Antequera River that hasseveral mines along its upper reach, and is affected by acidmine drainage (AMD) and significant informal (historicaland new) tailing heaps within the channel (CAMINAR2013).
Mining contributes 31.1% of the GDP of the Departmentof Oruro (INE 2013) in comparison to 6.66% of BolivianGDP in 2013 (INE 2014). There is a history of unregulatedmining activity that has affected the environment bothaesthetically (tailing heaps) and due to contamination of soiland water (Quintanilla et al. 2012). Poly-metallic andmetalloid deposits may contain Cu, Sn, Au, Ag, Sb, W, Bi,Zn and Pb. The most abundant non-metallic mineral issodium chloride salt (NaCl), which is often associated withhigh concentrations of Li, B, K and Mg. Other common saltdeposits include gypsum, potassium carbonate, sodiumcarbonate and sodium sulphate (UNEP 1996).
Socio-Economic Context and Local Water Usage
In 2012, 59.7% of the population of the Municipality ofPazña (5853 inhabitants) was considered as poor (48.3%moderate, 10.8% indigent, 0.6% marginal poverty) (Census2012). The main occupations at this time were in agri-culture, livestock1, forestry and fishery (collectively 46.1%of the labour force) (Census 2012). Other occupationalgroups were services (11.0%) and construction, manu-facturing and industry (10.8%). The municipality and sur-rounding area has been a centre for mining since at least the16th Century, with a focus on Ag up to the 1890s andafterwards Sn. The political and economic strength of themining sector at a national level results in an unequal powerdistribution in relation to the local communities (LIDEMA2008).
In the wider Lake Poopó Basin the main uses of waterare for agricultural irrigation (8.1 m s−1), domestic/house-hold use and consumption (0.2 m s−1), and mining, industryand livestock watering (0.5–0.6 m s−1) (Calizaya 2009).There are no water meters in the rural areas, and in remotecommunities there are no official records of usage orabstraction. In Pazña Municipality, 55.3% of householdswere recorded as receiving water from pipe networks(Census 2012). The (informal) piped network transferschlorinated surface water (spring water, or wetland water inthe case of Pazña Village) (Zacarías Ortega, oficial mayortécnico del Municipio de Pazña pers. comm. February 2015)to communities for drinking and domestic purposes. Somecommunities are served by the municipality, whilst othershave an independent piped network built either by theGovernment’s Proyecto Mi Agua or the NGO VisiónMundial. Communities not receiving piped water largelyobtain (supposedly untreated) water from groundwaterwells and/or directly from springs and/or rivers (Quintanillaet al. 2012). Most irrigation is dominantly rain-fed duringthe wet season, and livestock watering is generally fromwell water or rivers.
Census (2012) reports that only 41.8% of householdswithin the entire Pazña Municipality receive any kind ofsewage service, but for our study area, García (2011) reportsthat there are no operational wastewater treatment systemsother than some septic tanks. Although wastewater lagoonswere developed in Pazña Village, the system is not inoperation, and it would seem that there are no operationalseptic tanks other than in some mining centres. Conse-quently, untreated wastewater is discharged, for example, tothe upper Antequera River (García 2011). The miningcommunities that do have systems in operation include
1 Pazña Municipality is well known for their cattle production, whichis part of Asociación de Ganaderos del Altiplano al Desarrollo(ASAGALDE).
558 Environmental Management (2017) 60:555–573
Bolívar, where septic tanks and anaerobic filters are sup-posedly used, but after separation of solids the residue wateris believed to be discharged untreated to the AntequeraRiver (Ekdahl 2007).
Methods and Materials
Assessment of Community Vulnerability
Vulnerability is understood here as the ability of a person orgroup of persons to anticipate, resist, survive and recoverfrom the impact of a hazard (Blaikie et al. 1994), which weconsider here to be water quality and availability. Indeveloping our vulnerability methodology we draw onvarious approaches to incorporate elements of the physicalresistance of the population (i.e., damage to life and health),economic activity and damages, and political, social, cul-tural, and ecological aspects. We also draw on numerousstudies (Ávila 2004; Barrenechea et al. 2000; Cardona2003; Cutter 1996; Cutter et al. 2003; Eakin andLuers 2006; INDECI 2006; Madrigal 2011; Perles et al.2009; Perona and Rocchi 2001; SDC and PROMIC2006; Wisner and Luce 1993) in order to select anddefine our vulnerability indicators (vi; Table S1), which,as with other studies, are largely defined according tothe study’s objectives and the definition of vulnerabilityused.
Fieldwork was carried out in the study area duringOctober and December 2013, and involved 72 householdsurveys (250 residents; 55.6% female and 44.4% male)within 13 communities (coded here as ca–cm, Fig. 1,Table 1) and interviews with 10 key informants (govern-ment officials, community and institutional leaders, localauthorities, staff of health centres, and teachers and princi-pals of educational units) within Pazña Municipality.Involvement in the survey was largely dependent uponwillingness and availability, but effort was made to solicitresponse in towns and remote communities. We appreciatethat this factor limits somewhat the survey data as we havenot necessarily obtained a representative sample of thepopulation, rather those available and/or interested. Thesurveyed population of 250 represents 6.8% of the totalpopulation of communities studied (3681 inhabitants) and4.3% of the total population of the municipality (5853inhabitants; Census 2012).
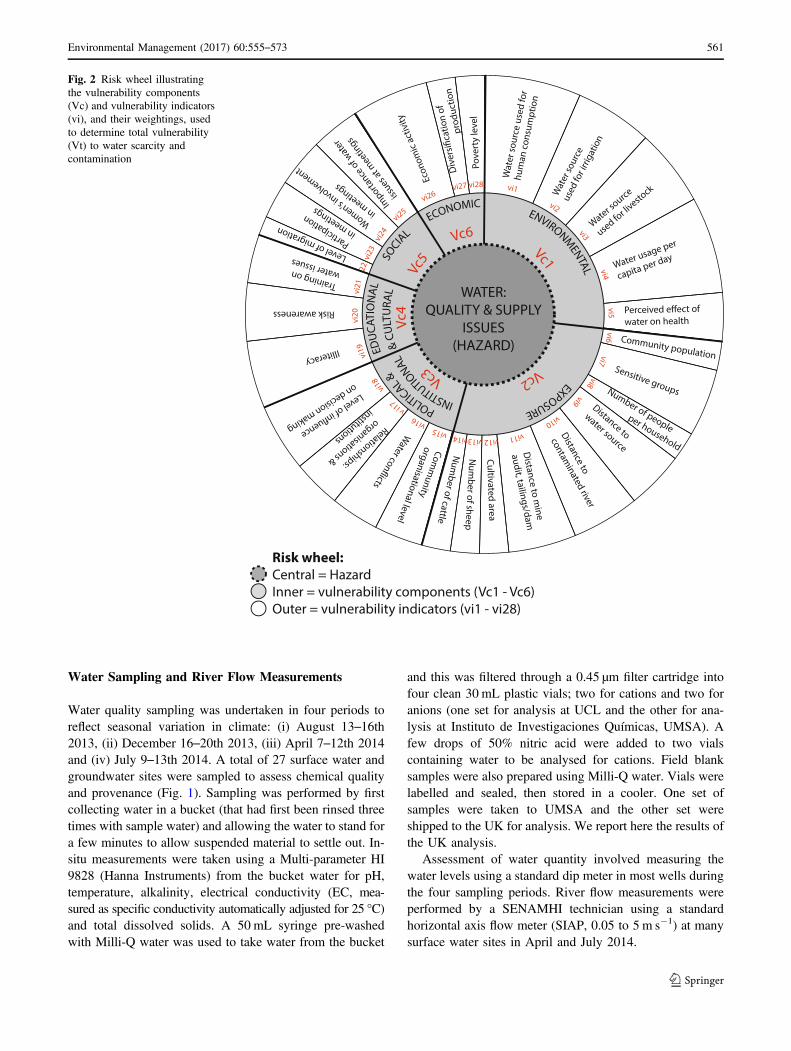
In order to estimate the degree of vulnerability to waterquality and availability, household survey results were usedin conjunction with Census data on municipality populationfigures, poverty rating and provision of piped water networkand sewage services (Census 2012). Together these pro-vided responses to 28 vi (Fig. 2), whereby householdsscored 1, 2, 3 or 4 (i.e., rating low, medium, high or very
high; Table S1) for each vi depending on their responses(e.g., vi= 1 for a household next to their water source,versus vi= 4 if the water is> 1000 m from the house) ortheir community situation. Household vi results (Table S2)were then used to calculate six vulnerability components(Vc) and total vulnerability (Vt) for each household, andsubsequently each community and in turn the entire studyarea. The Vcs and respective vis are as follows: Vc1environmental (vi1–vi5), Vc2 exposure (vi6–vi14), Vc3political and institutional (vi15–vi18), Vc4 educational andcultural (vi19–vi21), Vc5 social (vi22–vi25), and Vc6economic (vi26–vi28) (see Supplementary Information).The proportional representation of each vi to their respec-tive Vcs and to the Vt is illustrated by Fig. 2.
In order to calculate Vcs and Vts, each vi was assigned aweighing factor (wf) of between 1 (least) and 10 (highest) torepresent the relative importance of the indicators to eachother (Fig. 2; Table S1), whereby wfs were decided uponusing information from interviews with key informants andby general knowledge gained during the research. Thedetermination of each household (community and studyarea) Vc (and Vt) was then undertaken by dividingeach household vi score (or mean community vi, ormean study area vi) by the maximum possible score of fourand multiplying this by a ratio of the respective vi wf tothe sum of the wf of each Vc, i.e., Vc wf (or Vt wf). Thecalculated values for each vi associated with each Vc (or all28 vis for Vt) were then summed before multiplying by 10to fall into a 0–10 vulnerability rating (i.e., scale of zero tovery high for consistency with the Chemical Water QualityHazard Ratings (CWQHR scale), as shown in Eq. 1 usingVc1 for h1 as an example, and Eq. 2 to illustrate the cal-culation of Vt for the entire study area (i.e., ca−cm= h1−h72).
Vc1 h1 ¼ ð½vi1 h1=4 vi1 wf =Vc1 wf þ ¼ ½vi5 h1=4 vi5 wf =Vc1 wf Þ 10
ð1Þ
Vt ca cm ¼ ð½mean vi1 h1 h72=4 vi1 wf =Vt wf þ¼ ½mean vi28 h1 h72=4 vi28 wf =Vt wf Þ 10
ð2ÞSubsequently, Vc1–Vc6 and Vt values were obtained foreach of the 72 households, the communities and the entirestudy area (Table 1 and Table S2). The 0–10 rating ofresultant Vt scores expresses overall vulnerability to waterquality and scarcity issues and can be interpreted in ageneral way using the following vulnerability levels; low(<2.5), medium (2.5–4.9), high (5.0–7.4) and very high(>7.5) (after INDECI 2006; Table S3). The details anddefinitions of the Vcs contributing to Vt are summarised inthe Supplementary Information.
Environmental Management (2017) 60:555–573 559
Tab
le1
Vulnerabilitycompo
nent
(Vc)
andtotalvu
lnerability
(Vt)scores
foreach
commun
ityandforthestud
yarea
(based
onaveraged
scores
forho
useholds
with
ineach
commun
ityor
the
stud
yarea;Table
S2forho
useholdscores
andFig.1forcommun
itylocatio
ns)
Com
mun
itycode
andname(surveyedho
useholdcode)
cacb
cccd
cecf
cgch
cicj
ckcl
Cm
ca-cm
Totoral
(h1−
h12)
Avicaya
(h13
−h2
0)Santa
Rosa
(h21
−h2
4)
Kuchu
Avicaya
(h25
)
San
Ignacio
(h26−h3
1)
Sakani
(h32
)Urm
iri
(h33
−h3
6)
Vilaqu
e(h37−h3
9)Pazña
(h40
−h6
2)
San
Martín
(h63
−h6
4)
Santa
Filo
mena
(h65−h7
0)
Canaslupe
(h71
)Ocuri
Chico
(h72
)
Study
area
(h1
−h7
2)
Total
popu
latio
na11
2861
627
4168
1516
87
1407
1136
142
1536
81
Num
berof
peop
lesurveyed
5333
112
163
107
726
314
225
0
Num
berho
useholds
surveyed
128
41
61
43
232
61
172
Average
no.peop
le/
household
4.4
4.1
2.8
2.0
2.7
3.0
2.5
2.3
3.1
3.0
5.2
4.0
2.0
3.5
Vc1(vi1–vi5):
Env
iron
mentalb
6.41
5.69
5.44
7.01
6.88
8.90
5.70
7.58
5.93
6.89
7.42
5.18
7.32
6.31
Vc1
weigh
tedto
Vt
1.72
1.52
1.46
1.88
1.84
2.39
1.53
2.03
1.59
1.85
1.99
1.39
1.96
1.69
Vc2
(vi6
–vi14
):Exp
osure
6.96
7.11
5.27
3.57
4.17
4.82
4.96
5.26
5.28
4.23
6.15
4.46
4.46
5.64
Vc2
weigh
tedto
Vt
1.91
1.95
1.45
0.98
1.14
1.32
1.36
1.44
1.45
1.16
1.69
1.23
1.23
1.55
Vc3
(vi15–vi18
):Political&
institu
tional
7.54
7.66
8.44
7.16
8.11
8.30
7.59
7.73
8.52
8.86
7.82
7.73
8.30
8.05
Vc3
weigh
tedto
Vt
1.08
1.10
1.21
1.03
1.17
1.19
1.09
1.11
1.22
1.27
1.12
1.11
1.19
1.16
Vc4
(vi19–vi21
):Edu
catio
nal&
cultu
ral
4.87
6.01
4.79
2.50
5.76
10.00
3.85
5.56
6.07
4.58
4.63
6.53
4.58
5.45
Vc4
weigh
tedto
Vt
0.57
0.71
0.56
0.29
0.68
1.18
0.45
0.65
0.71
0.54
0.54
0.77
0.54
0.64
Vc5
(vi22–vi24
):Social
4.22
5.29
4.02
2.50
3.65
2.81
4.41
4.84
5.20
5.23
4.30
4.38
2.50
4.60
Vc5
weigh
tedto
Vt
0.44
0.55
0.42
0.26
0.38
0.29
0.46
0.51
0.54
0.55
0.45
0.46
0.26
0.48
Vc6
(vi25–vi28
):Econo
mic
6.52
6.61
6.88
6.07
7.83
6.07
6.88
6.37
7.35
5.54
6.67
6.96
6.96
6.92
Vc6
weigh
tedto
Vt
0.60
0.60
0.63
0.56
0.72
0.56
0.63
0.58
0.67
0.51
0.61
0.64
0.64
0.63
Vt:Total
vulnerability
c6.32
6.44
5.73
5.00
5.93
6.93
5.52
6.33
6.20
5.87
6.41
5.59
5.82
6.15
aCensus(201
2)data
bExampleforca:Vc1
ca=(m
eanvi
h1−h1
2/4×vi1wf/Vc1
wf]+…[m
eanvi5h1
−h1
2/4×vi5wf/Vc1
wf])×
10
Where
wf:weigh
tingfactor
onscale1(least)−
10(highest)of
relativ
eim
portance
ofvisto
each
other(refer
toTable
S1)
cExampleforca:Vtca
=([meanvi1h1−h1
2/4×vi1wf/Vtwf]+…
[meanvi28
h1−h1
2/4×vi28
wf/Vtwf])×
10
560 Environmental Management (2017) 60:555–573
Water Sampling and River Flow Measurements
Water quality sampling was undertaken in four periods toreflect seasonal variation in climate: (i) August 13–16th2013, (ii) December 16–20th 2013, (iii) April 7–12th 2014and (iv) July 9–13th 2014. A total of 27 surface water andgroundwater sites were sampled to assess chemical qualityand provenance (Fig. 1). Sampling was performed by firstcollecting water in a bucket (that had first been rinsed threetimes with sample water) and allowing the water to stand fora few minutes to allow suspended material to settle out. In-situ measurements were taken using a Multi-parameter HI9828 (Hanna Instruments) from the bucket water for pH,temperature, alkalinity, electrical conductivity (EC, mea-sured as specific conductivity automatically adjusted for 25 °C)and total dissolved solids. A 50 mL syringe pre-washedwith Milli-Q water was used to take water from the bucket
and this was filtered through a 0.45 µm filter cartridge intofour clean 30 mL plastic vials; two for cations and two foranions (one set for analysis at UCL and the other for ana-lysis at Instituto de Investigaciones Químicas, UMSA). Afew drops of 50% nitric acid were added to two vialscontaining water to be analysed for cations. Field blanksamples were also prepared using Milli-Q water. Vials werelabelled and sealed, then stored in a cooler. One set ofsamples were taken to UMSA and the other set wereshipped to the UK for analysis. We report here the results ofthe UK analysis.
Assessment of water quantity involved measuring thewater levels using a standard dip meter in most wells duringthe four sampling periods. River flow measurements wereperformed by a SENAMHI technician using a standardhorizontal axis flow meter (SIAP, 0.05 to 5 m s−1) at manysurface water sites in April and July 2014.
Fig. 2 Risk wheel illustratingthe vulnerability components(Vc) and vulnerability indicators(vi), and their weightings, usedto determine total vulnerability(Vt) to water scarcity andcontamination
Environmental Management (2017) 60:555–573 561
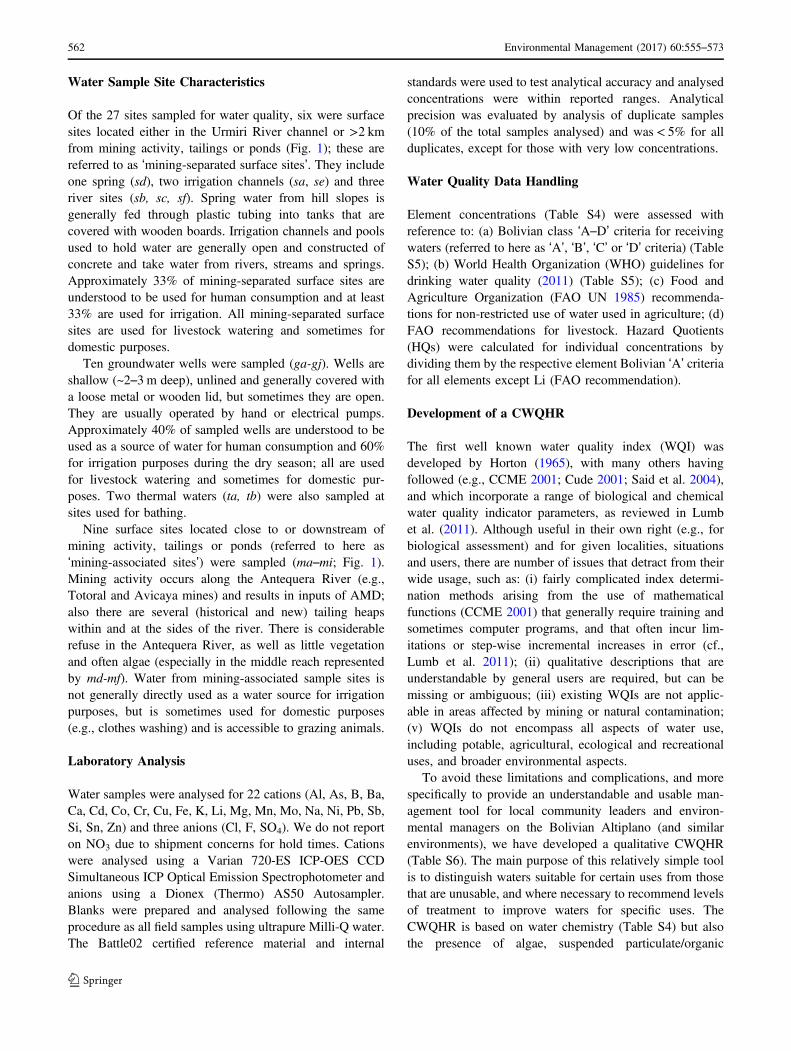
Water Sample Site Characteristics
Of the 27 sites sampled for water quality, six were surfacesites located either in the Urmiri River channel or >2 kmfrom mining activity, tailings or ponds (Fig. 1); these arereferred to as ‘mining-separated surface sites’. They includeone spring (sd), two irrigation channels (sa, se) and threeriver sites (sb, sc, sf). Spring water from hill slopes isgenerally fed through plastic tubing into tanks that arecovered with wooden boards. Irrigation channels and poolsused to hold water are generally open and constructed ofconcrete and take water from rivers, streams and springs.Approximately 33% of mining-separated surface sites areunderstood to be used for human consumption and at least33% are used for irrigation. All mining-separated surfacesites are used for livestock watering and sometimes fordomestic purposes.
Ten groundwater wells were sampled (ga-gj). Wells areshallow (~2–3 m deep), unlined and generally covered witha loose metal or wooden lid, but sometimes they are open.They are usually operated by hand or electrical pumps.Approximately 40% of sampled wells are understood to beused as a source of water for human consumption and 60%for irrigation purposes during the dry season; all are usedfor livestock watering and sometimes for domestic pur-poses. Two thermal waters (ta, tb) were also sampled atsites used for bathing.
Nine surface sites located close to or downstream ofmining activity, tailings or ponds (referred to here as‘mining-associated sites’) were sampled (ma–mi; Fig. 1).Mining activity occurs along the Antequera River (e.g.,Totoral and Avicaya mines) and results in inputs of AMD;also there are several (historical and new) tailing heapswithin and at the sides of the river. There is considerablerefuse in the Antequera River, as well as little vegetationand often algae (especially in the middle reach representedby md-mf). Water from mining-associated sample sites isnot generally directly used as a water source for irrigationpurposes, but is sometimes used for domestic purposes(e.g., clothes washing) and is accessible to grazing animals.
Laboratory Analysis
Water samples were analysed for 22 cations (Al, As, B, Ba,Ca, Cd, Co, Cr, Cu, Fe, K, Li, Mg, Mn, Mo, Na, Ni, Pb, Sb,Si, Sn, Zn) and three anions (Cl, F, SO4). We do not reporton NO3 due to shipment concerns for hold times. Cationswere analysed using a Varian 720-ES ICP-OES CCDSimultaneous ICP Optical Emission Spectrophotometer andanions using a Dionex (Thermo) AS50 Autosampler.Blanks were prepared and analysed following the sameprocedure as all field samples using ultrapure Milli-Q water.The Battle02 certified reference material and internal
standards were used to test analytical accuracy and analysedconcentrations were within reported ranges. Analyticalprecision was evaluated by analysis of duplicate samples(10% of the total samples analysed) and was< 5% for allduplicates, except for those with very low concentrations.
Water Quality Data Handling
Element concentrations (Table S4) were assessed withreference to: (a) Bolivian class ‘A–D’ criteria for receivingwaters (referred to here as ‘A’, ‘B’, ‘C’ or ‘D’ criteria) (TableS5); (b) World Health Organization (WHO) guidelines fordrinking water quality (2011) (Table S5); (c) Food andAgriculture Organization (FAO UN 1985) recommenda-tions for non-restricted use of water used in agriculture; (d)FAO recommendations for livestock. Hazard Quotients(HQs) were calculated for individual concentrations bydividing them by the respective element Bolivian ‘A’ criteriafor all elements except Li (FAO recommendation).
Development of a CWQHR
The first well known water quality index (WQI) wasdeveloped by Horton (1965), with many others havingfollowed (e.g., CCME 2001; Cude 2001; Said et al. 2004),and which incorporate a range of biological and chemicalwater quality indicator parameters, as reviewed in Lumbet al. (2011). Although useful in their own right (e.g., forbiological assessment) and for given localities, situationsand users, there are number of issues that detract from theirwide usage, such as: (i) fairly complicated index determi-nation methods arising from the use of mathematicalfunctions (CCME 2001) that generally require training andsometimes computer programs, and that often incur lim-itations or step-wise incremental increases in error (cf.,Lumb et al. 2011); (ii) qualitative descriptions that areunderstandable by general users are required, but can bemissing or ambiguous; (iii) existing WQIs are not applic-able in areas affected by mining or natural contamination;(v) WQIs do not encompass all aspects of water use,including potable, agricultural, ecological and recreationaluses, and broader environmental aspects.
To avoid these limitations and complications, and morespecifically to provide an understandable and usable man-agement tool for local community leaders and environ-mental managers on the Bolivian Altiplano (and similarenvironments), we have developed a qualitative CWQHR(Table S6). The main purpose of this relatively simple toolis to distinguish waters suitable for certain uses from thosethat are unusable, and where necessary to recommend levelsof treatment to improve waters for specific uses. TheCWQHR is based on water chemistry (Table S4) but alsothe presence of algae, suspended particulate/organic
562 Environmental Management (2017) 60:555–573
material such as animal droppings, and/or stagnation. Itincorporates simple mathematics in the form of HQs andoptional calculation of sodium adsorption ratios (SAR).Although WQIs generally use a percentage ranking,whereby a low percentage indicates poor quality and a highone good quality, our CWQHR uses a 1 (good quality) to 10(highly contaminated) scoring range. The rationale for thisextends to the concept of risk and the usefulness of simul-taneously considering the level of social vulnerability towater issues, which is classified numerically on a scale of0–10 (<2.5 low, >7.5 very high vulnerability; Table S3).
Results
Vulnerability Assessment
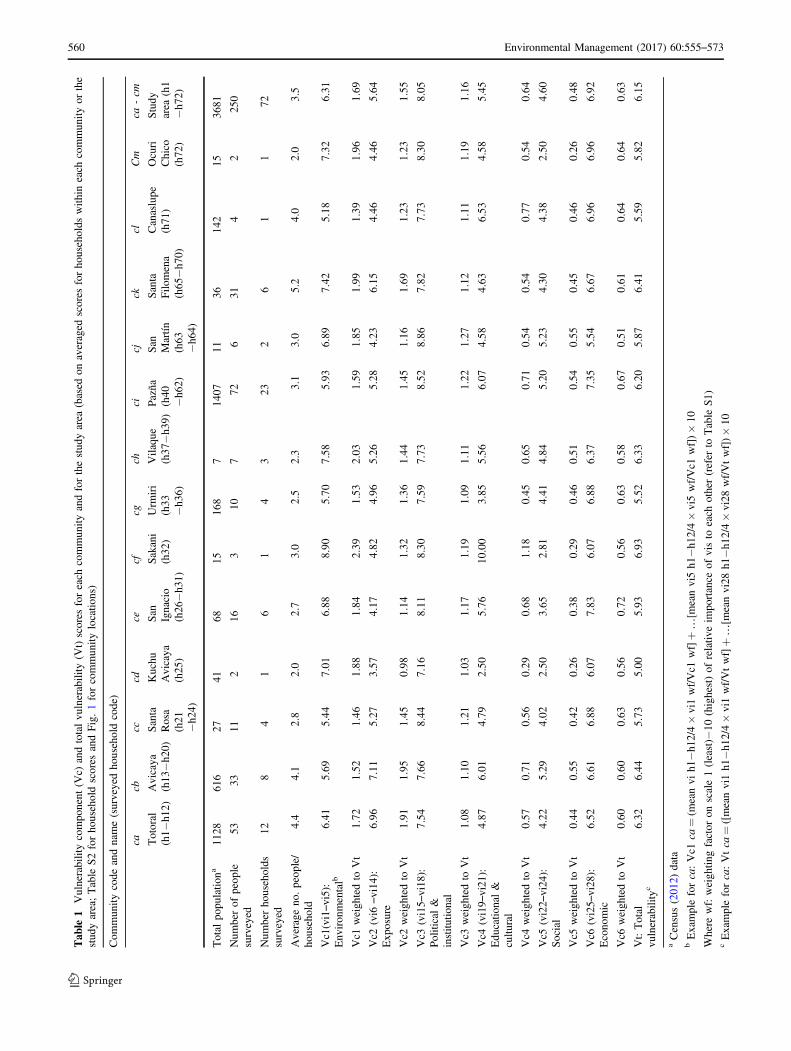
Table 1 provides a summary of the Vc1–Vc6 and Vt scoresfor each of the 13 communities ca–cm (based on the aver-aged vis of households within each community; Table S2)and for the entire study area. All surveyed communities (Vt5.00–6.93) and therefore the entire study area (Vt 6.15)obtained Vt scores corresponding to the category of hightotal vulnerability to water quality and scarcity issues (TableS3). This indicates that the majority of people surveyedhave the following: (i) limited access to potable water; (ii)mainly primary education only; (iii) almost no training onwater issues; (iv) marginal income; (v) some level of socialorganisation, but no autonomy in decision making; (vi) aperception that they and/or their livestock have suffered ill-health due to water contamination (Table S3).
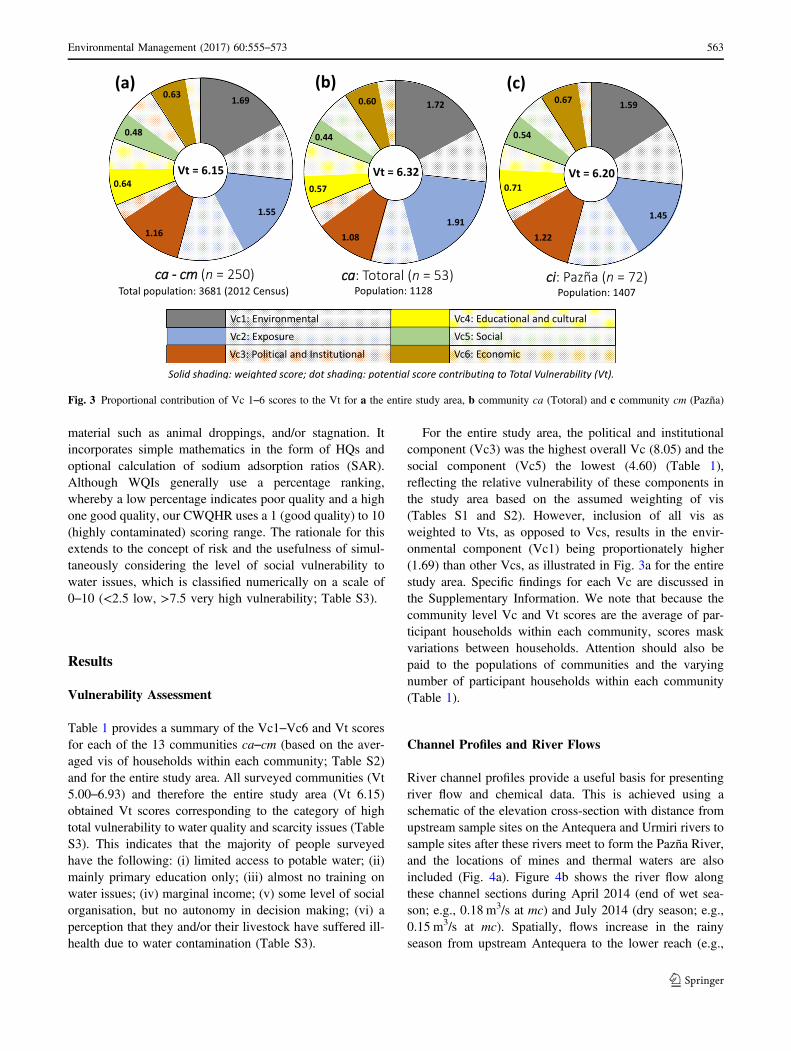
For the entire study area, the political and institutionalcomponent (Vc3) was the highest overall Vc (8.05) and thesocial component (Vc5) the lowest (4.60) (Table 1),reflecting the relative vulnerability of these components inthe study area based on the assumed weighting of vis(Tables S1 and S2). However, inclusion of all vis asweighted to Vts, as opposed to Vcs, results in the envir-onmental component (Vc1) being proportionately higher(1.69) than other Vcs, as illustrated in Fig. 3a for the entirestudy area. Specific findings for each Vc are discussed inthe Supplementary Information. We note that because thecommunity level Vc and Vt scores are the average of par-ticipant households within each community, scores maskvariations between households. Attention should also bepaid to the populations of communities and the varyingnumber of participant households within each community(Table 1).
Channel Profiles and River Flows
River channel profiles provide a useful basis for presentingriver flow and chemical data. This is achieved using aschematic of the elevation cross-section with distance fromupstream sample sites on the Antequera and Urmiri rivers tosample sites after these rivers meet to form the Pazña River,and the locations of mines and thermal waters are alsoincluded (Fig. 4a). Figure 4b shows the river flow alongthese channel sections during April 2014 (end of wet sea-son; e.g., 0.18 m3/s at mc) and July 2014 (dry season; e.g.,0.15 m3/s at mc). Spatially, flows increase in the rainyseason from upstream Antequera to the lower reach (e.g.,
Fig. 3 Proportional contribution of Vc 1–6 scores to the Vt for a the entire study area, b community ca (Totoral) and c community cm (Pazña)
Environmental Management (2017) 60:555–573 563
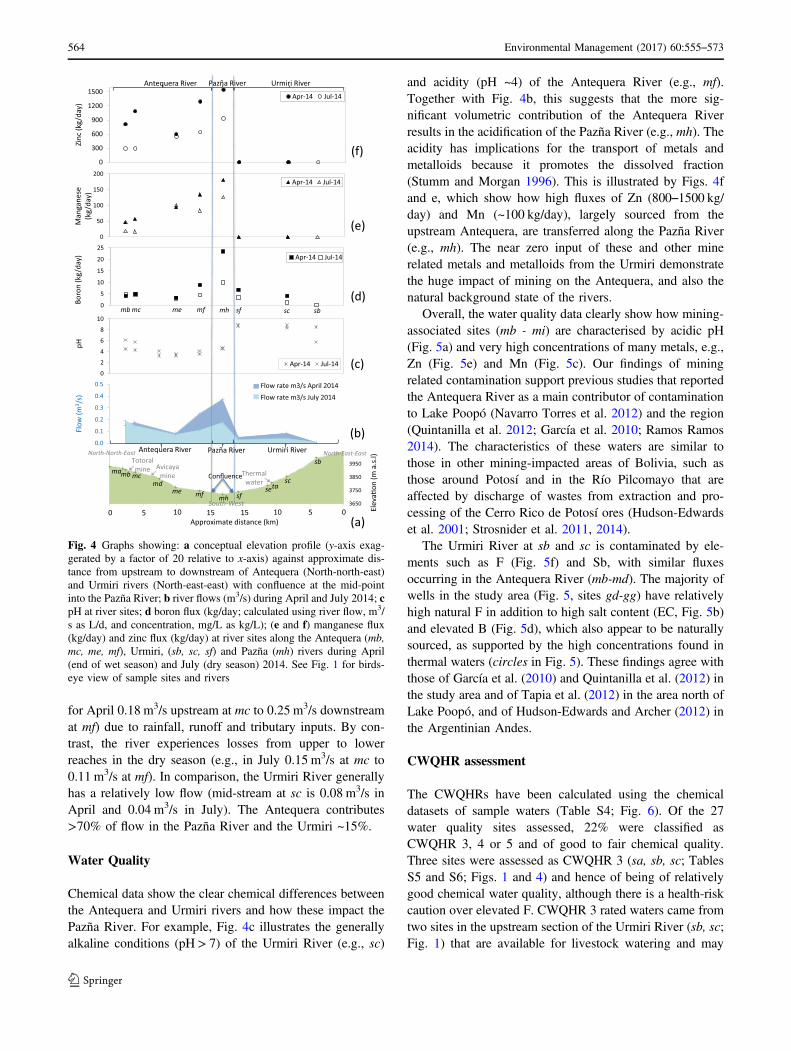
for April 0.18 m3/s upstream at mc to 0.25 m3/s downstreamat mf) due to rainfall, runoff and tributary inputs. By con-trast, the river experiences losses from upper to lowerreaches in the dry season (e.g., in July 0.15 m3/s at mc to0.11 m3/s at mf). In comparison, the Urmiri River generallyhas a relatively low flow (mid-stream at sc is 0.08 m3/s inApril and 0.04 m3/s in July). The Antequera contributes>70% of flow in the Pazña River and the Urmiri ~15%.
Water Quality
Chemical data show the clear chemical differences betweenthe Antequera and Urmiri rivers and how these impact thePazña River. For example, Fig. 4c illustrates the generallyalkaline conditions (pH> 7) of the Urmiri River (e.g., sc)
and acidity (pH ~4) of the Antequera River (e.g., mf).Together with Fig. 4b, this suggests that the more sig-nificant volumetric contribution of the Antequera Riverresults in the acidification of the Pazña River (e.g., mh). Theacidity has implications for the transport of metals andmetalloids because it promotes the dissolved fraction(Stumm and Morgan 1996). This is illustrated by Figs. 4fand e, which show how high fluxes of Zn (800–1500 kg/day) and Mn (~100 kg/day), largely sourced from theupstream Antequera, are transferred along the Pazña River(e.g., mh). The near zero input of these and other minerelated metals and metalloids from the Urmiri demonstratethe huge impact of mining on the Antequera, and also thenatural background state of the rivers.
Overall, the water quality data clearly show how mining-associated sites (mb - mi) are characterised by acidic pH(Fig. 5a) and very high concentrations of many metals, e.g.,Zn (Fig. 5e) and Mn (Fig. 5c). Our findings of miningrelated contamination support previous studies that reportedthe Antequera River as a main contributor of contaminationto Lake Poopó (Navarro Torres et al. 2012) and the region(Quintanilla et al. 2012; García et al. 2010; Ramos Ramos2014). The characteristics of these waters are similar tothose in other mining-impacted areas of Bolivia, such asthose around Potosí and in the Río Pilcomayo that areaffected by discharge of wastes from extraction and pro-cessing of the Cerro Rico de Potosí ores (Hudson-Edwardset al. 2001; Strosnider et al. 2011, 2014).
The Urmiri River at sb and sc is contaminated by ele-ments such as F (Fig. 5f) and Sb, with similar fluxesoccurring in the Antequera River (mb-md). The majority ofwells in the study area (Fig. 5, sites gd-gg) have relativelyhigh natural F in addition to high salt content (EC, Fig. 5b)and elevated B (Fig. 5d), which also appear to be naturallysourced, as supported by the high concentrations found inthermal waters (circles in Fig. 5). These findings agree withthose of García et al. (2010) and Quintanilla et al. (2012) inthe study area and of Tapia et al. (2012) in the area north ofLake Poopó, and of Hudson-Edwards and Archer (2012) inthe Argentinian Andes.
CWQHR assessment
The CWQHRs have been calculated using the chemicaldatasets of sample waters (Table S4; Fig. 6). Of the 27water quality sites assessed, 22% were classified asCWQHR 3, 4 or 5 and of good to fair chemical quality.Three sites were assessed as CWQHR 3 (sa, sb, sc; TablesS5 and S6; Figs. 1 and 4) and hence of being of relativelygood chemical water quality, although there is a health-riskcaution over elevated F. CWQHR 3 rated waters came fromtwo sites in the upstream section of the Urmiri River (sb, sc;Fig. 1) that are available for livestock watering and may
3650
3750
3850
3950
Elev
aon
(m a
.s.l)
Approximate distance (km)
mamb mcmd
memh
sc
sbNorth-East-East
South-West
0.0
0.1
0.2
0.3
0.4
0.5
Flow
(m3 /
s)
Flow rate m3/s April 2014Flow rate m3/s July 2014
0
2
4
6
8
10
pH
Apr-14 Jul-14
0
5
10
15
20
25
)yad/gk(noroB
Apr-14 Jul-14
mf mh sf sc sb
0
50
100
150
200
esenagnaM
(kg/
day)
Apr-14 Jul-14
0
300
600
900
1200
1500
)yad/gk(cniZ
Apr-14 Jul-14
mf sfseta
(a)
(b)
(c)
(d)
(e)
(f)
Urmiri RiverAntequera River Pazña River
Confluence
Antequera River Pazña River Urmiri River
Totoralmine Avicaya
mine Thermal water
0 05 10 51015 15
mbmc me
North-North-East
Fig. 4 Graphs showing: a conceptual elevation profile (y-axis exag-gerated by a factor of 20 relative to x-axis) against approximate dis-tance from upstream to downstream of Antequera (North-north-east)and Urmiri rivers (North-east-east) with confluence at the mid-pointinto the Pazña River; b river flows (m3/s) during April and July 2014; cpH at river sites; d boron flux (kg/day; calculated using river flow, m3/s as L/d, and concentration, mg/L as kg/L); (e and f) manganese flux(kg/day) and zinc flux (kg/day) at river sites along the Antequera (mb,mc, me, mf), Urmiri, (sb, sc, sf) and Pazña (mh) rivers during April(end of wet season) and July (dry season) 2014. See Fig. 1 for birds-eye view of sample sites and rivers
564 Environmental Management (2017) 60:555–573
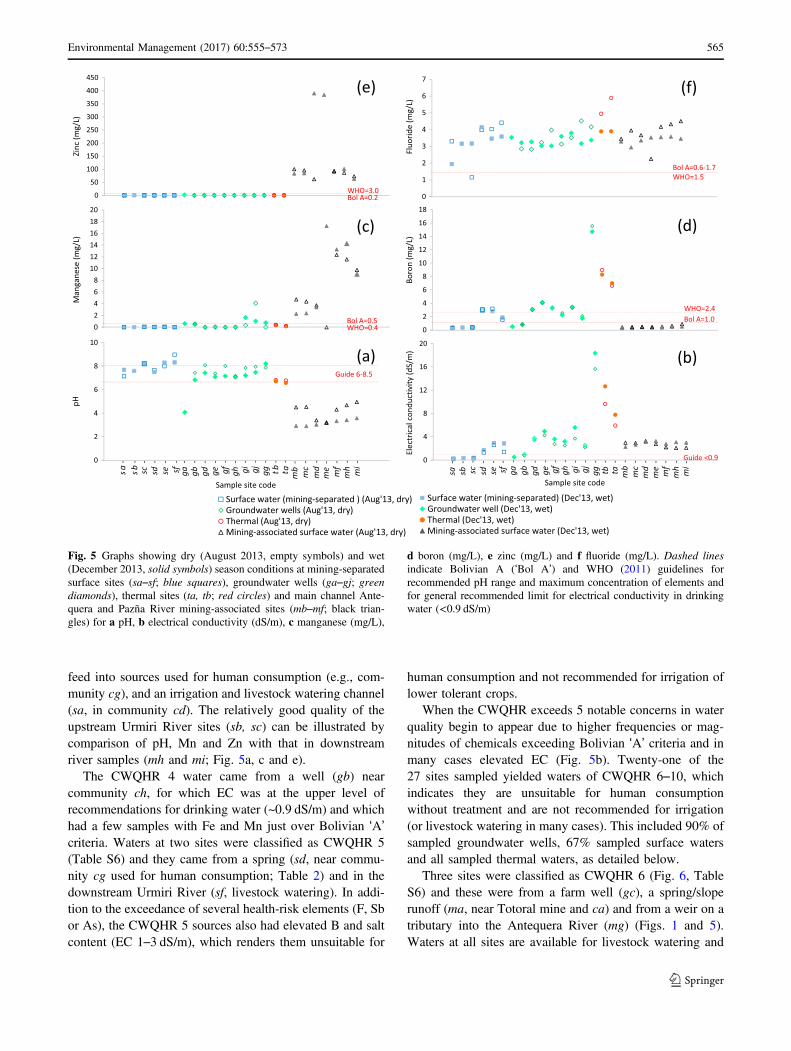
feed into sources used for human consumption (e.g., com-munity cg), and an irrigation and livestock watering channel(sa, in community cd). The relatively good quality of theupstream Urmiri River sites (sb, sc) can be illustrated bycomparison of pH, Mn and Zn with that in downstreamriver samples (mh and mi; Fig. 5a, c and e).
The CWQHR 4 water came from a well (gb) nearcommunity ch, for which EC was at the upper level ofrecommendations for drinking water (~0.9 dS/m) and whichhad a few samples with Fe and Mn just over Bolivian ‘A’criteria. Waters at two sites were classified as CWQHR 5(Table S6) and they came from a spring (sd, near commu-nity cg used for human consumption; Table 2) and in thedownstream Urmiri River (sf, livestock watering). In addi-tion to the exceedance of several health-risk elements (F, Sbor As), the CWQHR 5 sources also had elevated B and saltcontent (EC 1–3 dS/m), which renders them unsuitable for
human consumption and not recommended for irrigation oflower tolerant crops.
When the CWQHR exceeds 5 notable concerns in waterquality begin to appear due to higher frequencies or mag-nitudes of chemicals exceeding Bolivian ‘A’ criteria and inmany cases elevated EC (Fig. 5b). Twenty-one of the27 sites sampled yielded waters of CWQHR 6–10, whichindicates they are unsuitable for human consumptionwithout treatment and are not recommended for irrigation(or livestock watering in many cases). This included 90% ofsampled groundwater wells, 67% sampled surface watersand all sampled thermal waters, as detailed below.
Three sites were classified as CWQHR 6 (Fig. 6, TableS6) and these were from a farm well (gc), a spring/sloperunoff (ma, near Totoral mine and ca) and from a weir on atributary into the Antequera River (mg) (Figs. 1 and 5).Waters at all sites are available for livestock watering and
Fig. 5 Graphs showing dry (August 2013, empty symbols) and wet(December 2013, solid symbols) season conditions at mining-separatedsurface sites (sa–sf; blue squares), groundwater wells (ga–gj; greendiamonds), thermal sites (ta, tb; red circles) and main channel Ante-quera and Pazña River mining-associated sites (mb–mf; black trian-gles) for a pH, b electrical conductivity (dS/m), c manganese (mg/L),
d boron (mg/L), e zinc (mg/L) and f fluoride (mg/L). Dashed linesindicate Bolivian A (‘Bol A’) and WHO (2011) guidelines forrecommended pH range and maximum concentration of elements andfor general recommended limit for electrical conductivity in drinkingwater (<0.9 dS/m)
Environmental Management (2017) 60:555–573 565
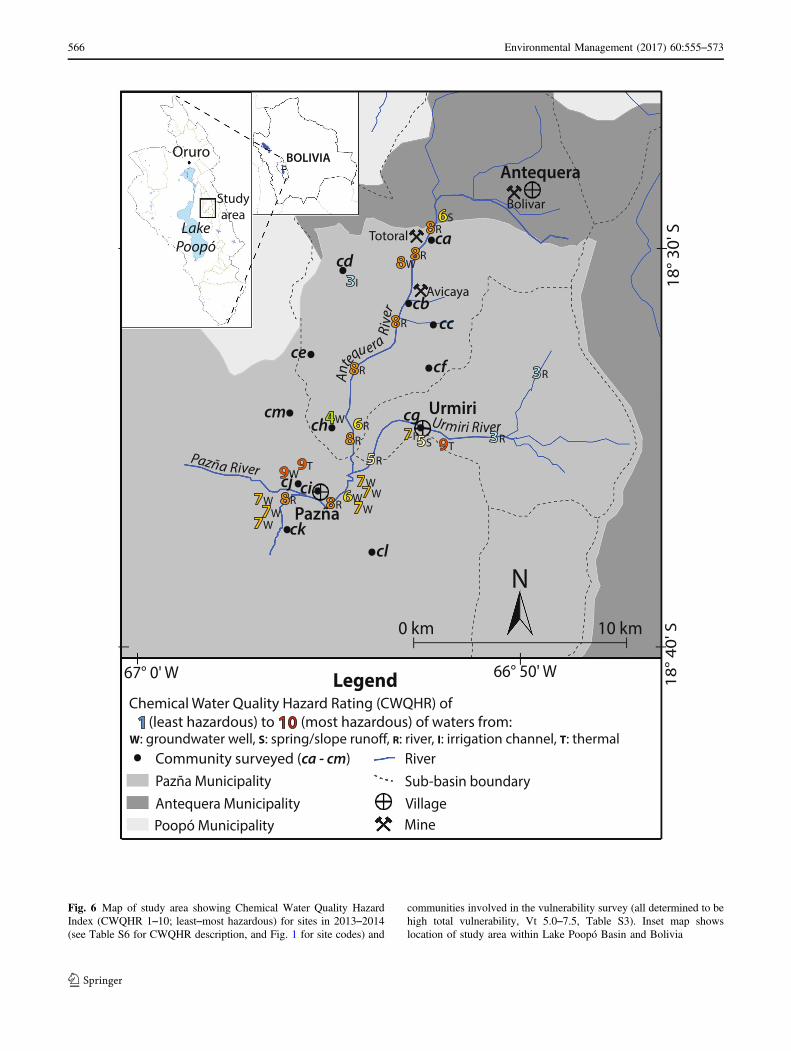
Fig. 6 Map of study area showing Chemical Water Quality HazardIndex (CWQHR 1–10; least–most hazardous) for sites in 2013–2014(see Table S6 for CWQHR description, and Fig. 1 for site codes) and
communities involved in the vulnerability survey (all determined to behigh total vulnerability, Vt 5.0–7.5, Table S3). Inset map showslocation of study area within Lake Poopó Basin and Bolivia
566 Environmental Management (2017) 60:555–573
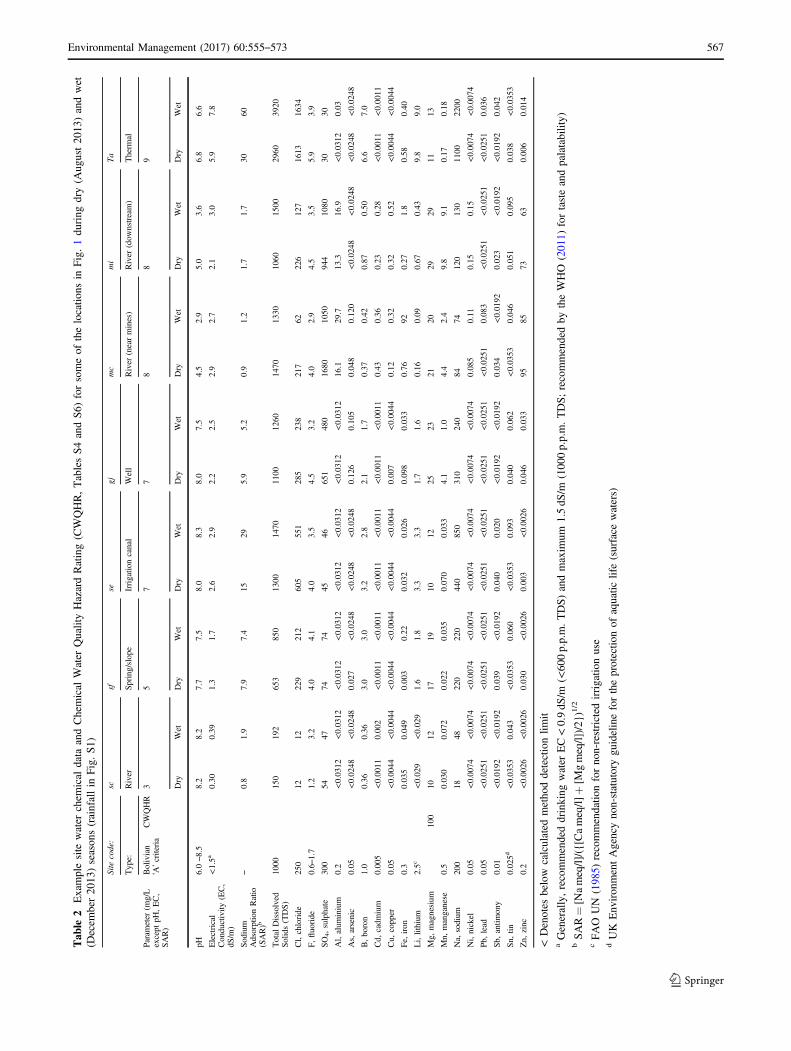
Tab
le2
Examplesite
water
chem
ical
data
andChemical
Water
QualityHazardRating(CWQHR,TablesS4andS6)
forsomeof
thelocatio
nsin
Fig.1du
ring
dry(A
ugust20
13)andwet
(Decem
ber20
13)season
s(rainfallin
Fig.S1)
Site
code:
scsf
segj
mc
mi
Ta
Type:
River
Spring/slope
Irrigatio
ncanal
Well
River
(nearmines)
River
(dow
nstream)
Therm
al
Param
eter
(mg/L
except
pH,EC,
SAR)
Bolivian
‘A’criteria
CWQHR
35
77
88
9
Dry
Wet
Dry
Wet
Dry
Wet
Dry
Wet
Dry
Wet
Dry
Wet
Dry
Wet
pH6.0–8.5
8.2
8.2
7.7
7.5
8.0
8.3
8.0
7.5
4.5
2.9
5.0
3.6
6.8
6.6
Electrical
Conductivity
(EC,
dS/m
)
<1.5a
0.30
0.39
1.3
1.7
2.6
2.9
2.2
2.5
2.9
2.7
2.1
3.0
5.9
7.8
Sodium
AdsorptionRatio
(SAR)b
–0.8
1.9
7.9
7.4
1529
5.9
5.2
0.9
1.2
1.7
1.7
3060
Total
Dissolved
Solids(TDS)
1000
150
192
653
850
1300
1470
1100
1260
1470
1330
1060
1500
2960
3920
Cl,chloride
250
1212
229
212
605
551
285
238
217
62226
127
1613
1634
F,fluoride
0.6–
1.7
1.2
3.2
4.0
4.1
4.0
3.5
4.5
3.2
4.0
2.9
4.5
3.5
5.9
3.9
SO4,sulphate
300
5447
7474
4546
651
480
1680
1050
944
1080
3030
Al,alum
inium
0.2
<0.0312
<0.0312
<0.0312
<0.0312
<0.0312
<0.0312
<0.0312
<0.0312
16.1
29.7
13.3
16.9
<0.0312
0.03
As,arsenic
0.05
<0.0248
<0.0248
0.027
<0.0248
<0.0248
<0.0248
0.126
0.105
0.048
0.120
<0.0248
<0.0248
<0.0248
<0.0248
B,boron
1.0
0.36
0.36
3.0
3.0
3.2
2.8
2.1
1.7
0.37
0.42
0.87
0.50
6.6
7.0
Cd,
cadm
ium
0.005
<0.0011
0.002
<0.0011
<0.0011
<0.0011
<0.0011
<0.0011
<0.0011
0.43
0.36
0.23
0.28
<0.0011
<0.0011
Cu,
copper
0.05
<0.0044
<0.0044
<0.0044
<0.0044
<0.0044
<0.0044
0.007
<0.0044
0.12
0.32
0.32
0.52
<0.0044
<0.0044
Fe,
iron
0.3
0.035
0.049
0.003
0.22
0.032
0.026
0.098
0.033
0.76
920.27
1.8
0.58
0.40
Li,lithium
2.5c
<0.029
<0.029
1.6
1.8
3.3
3.3
1.7
1.6
0.16
0.09
0.67
0.43
9.8
9.0
Mg,
magnesium
100
1012
1719
1012
2523
2120
2929
1113
Mn,
manganese
0.5
0.030
0.072
0.022
0.035
0.070
0.033
4.1
1.0
4.4
2.4
9.8
9.1
0.17
0.18
Na,
sodium
200
1848
220
220
440
850
310
240
8474
120
130
1100
2200
Ni,nickel
0.05
<0.0074
<0.0074
<0.0074
<0.0074
<0.0074
<0.0074
<0.0074
<0.0074
0.085
0.11
0.15
0.15
<0.0074
<0.0074
Pb,
lead
0.05
<0.0251
<0.0251
<0.0251
<0.0251
<0.0251
<0.0251
<0.0251
<0.0251
<0.0251
0.083
<0.0251
<0.0251
<0.0251
0.036
Sb,
antim
ony
0.01
<0.0192
<0.0192
0.039
<0.0192
0.040
0.020
<0.0192
<0.0192
0.034
<0.0192
0.023
<0.0192
<0.0192
0.042
Sn,
tin0.025d
<0.0353
0.043
<0.0353
0.060
<0.0353
0.093
0.040
0.062
<0.0353
0.046
0.051
0.095
0.038
<0.0353
Zn,
zinc
0.2
<0.0026
<0.0026
0.030
<0.0026
0.003
<0.0026
0.046
0.033
9585
7363
0.006
0.014
<Denotes
below
calculated
metho
ddetectionlim
itaGenerally,recommendeddrinking
water
EC<0.9dS
/m(<60
0p.p.m.TDS)andmaxim
um1.5dS
/m(100
0p.p.m.TDS;recommendedby
theWHO
(201
1)fortasteandpalatability)
bSAR=[N
ameq/l]/([Cameq/l]
+[M
gmeq/l])/2)1/2
cFAO
UN
(198
5)recommendatio
nforno
n-restricted
irrigatio
nuse
dUK
Env
iron
mentAgencyno
n-statutorygu
idelinefortheprotectio
nof
aquatic
life(surface
waters)
Environmental Management (2017) 60:555–573 567
domestic use, and may in some cases contribute to waterused for human consumption. In addition to the exceedanceof Bolivian ‘A’ criteria for health-risk elements (F, Sb and insome cases As and Cd) that may be naturally sourced,concern is heightened due to at least one significantly ele-vated element that may be linked to mine water migration orinfiltration (e.g., Zn, Ni, Fe or SO4).
Waters at seven sites were classified as CWQHR 7(Fig. 6, Table S6) and these came from an irrigation channel(se, in community cg) and six wells (gd, ge, gf, gh, gi, andgj-east of community ci and near community ck) (Figs. 1and 5, see Table 2 for example of se and gj). The irrigationchannel (se) is used both for irrigation and domestic pur-poses, and has high EC (~3 dS/m), Na, Cl, B, Li, F and,sometimes, Sb. The wells gd, ge and gf are understood to beused for human consumption, livestock watering and irri-gation. Samples from these wells had high EC (2–7 dS/m),Na, Cl, B, Li and F. The gh, gi and gj wells are supposedlyused for irrigation in the dry season, and samples had highEC (2–6 dS/m), Na, SO4, F, B, As and, sometimes, Sb.Also, gi and gj have high Mn, and gi sometimes high Li.Particular concern for all of these wells relates to excee-dance of Bolivian ‘A’ criteria for health-risk elements F, Sband As, which appear to be of natural origin.
Eight sites were categorised as CWQHR 8 (Fig. 6, TableS6) and appear to have been significantly affected bymining, as they contain high SO4 and very high con-centrations of many metals and metalloids often orders ofmagnitude above Bolivian ‘A’ guidelines: (i) AntequeraRiver sites (ga, mb, mc, md, me and mf) with extremely highconcentrations and fluxes of Zn (Figs. 4e and 5c), Fe, Aland Cd (HQs > 100), and high EC (Fig. 5b) and Mn(Figs 4e and 5c), Cu, As, Ni, Sb, F (Fig. 5f), Pb and SO4
concentrations (see Table 2 for example of mc); (ii) thecontinuation of the Antequera River to sites on the PazñaRiver (mh and mi), with extremely high concentrations andfluxes of Zn (Figs. 4f and 5e), Al, Cd and Mn (Figs. 4e and5c), and high SO4, Cu, Fe, Ni, Sb and Co (see Table 2 forexample of mi). Although rivers are not generally directlyused as water sources other than for domestic purposes(e.g., clothes washing), livestock watering does occur andhence food-chain impacts may be a concern. The rivers maycarry contamination significant distances downstream andthus there is also concern over infiltration into groundwater(e.g., as suggested by Mn in gi and gj wells; Fig. 5c) andpossible tributary inputs to Lake Poopó or the lake bedwhen dry.
Sites classified as CWQHR 9 were for the two thermalwaters (ta near cg, and tb near cj) and one well site (gg nearcj) (Fig. 6, Table S6). These waters all exhibited a similarchemical signature of extremely high EC (Fig. 5b), Na andCl, and very high B (Fig. 5d), high Li, F (Fig. 5f) and Sb,and sometimes high Fe (see Table 2 for example of ta).
Thermal waters (see Fig. 5) are known to contain naturallyelevated concentrations of elements of health significance(e.g., F, B, and Sb) (Stauffer and Thompson 1984; Hudson-Edwards and Archer 2012).
Discussion
Use of Vulnerability and Water Quality Assessments toPrioritise Areas for Assistance
Population centres that were assessed to be of the poorestwater quality can be regarded as priority areas for assis-tance. With this in mind, the discussion here focuses on datafrom the two highest population centres, ca and ci, whoserivers were assessed as CWQHR 8, as a means of drawingtogether the main findings of the vulnerability and waterquality assessments.
Half of the surveyed population (125/250 people) werefrom ca, Totoral (53 surveyed out of 1128 people), and ci,Pazña (72 surveyed out of 1407 people). These commu-nities collectively represent 69% of the total population ofthe study area communities (2535/3681) and 43% of thepopulation of the municipality (2535/5853) and live in anenvironment characterised by waters unacceptable forhuman consumption (and often for livestock and irrigation)without significant treatment (Fig. 6); 21 of the 27 sitessampled yielded waters of CWQHR 6–10, including 90% ofsampled groundwater wells, 67% of sampled surface watersand all sampled thermal waters.
Communities ca and ci and the entire study area yieldedVt scores (Vt 6.32, 6.20 and 6.15, respectively) corre-sponding to high total vulnerability to water quality andscarcity (Fig. 3, Table S3). For the entire study area theweighted environmental (Vc1) score of 1.69 contributed thehighest to the Vt, reflecting in particular the large number ofhouseholds with insufficient water available for personaluse (average 13 vs. 20 L/c/d minimum WHO recommen-dation), livestock and/or irrigation. This was especially thecase for ca as this community’s Vc1 score was above theaveraged study area score (Table 1), which was also due topeople’s perception of water contamination being respon-sible for illness in humans and animals (cg, Fig.1 and vi5 inTable S2) and because many surveyed households do nothave access to the piped network and rely solely onuntreated water (e.g., from springs, such as sd). The find-ings of the chemical water quality assessment supportresidents’ concern over the quality of water in their envir-onment, although many of the reported human health con-cerns (e.g., gastrointestinal) may be bacteria related andwarrant investigation. Rivers and groundwater in commu-nities close to and downstream of mining activity arecharacterised by mine-related (e.g., Zn, Al, Mn, Fe, Cd, SO4
568 Environmental Management (2017) 60:555–573
etc., as in Fig. 5c and e) and natural contamination (e.g., F,B, Sb, high salt content; Fig. 5b, d and f) above Bolivian ‘A’and WHO guidelines. Although some populations who relyon water from upper catchment areas (e.g., cd) that is ofrelatively good chemical quality, some rivers, irrigationchannels and springs near communities unaffected by mineactivity (e.g., cg, sf, se, sd) are also found to have naturalcontamination at levels above guidelines (e.g., Fig. 5f),possibly due to the influence of local thermal waters (e.g., ta).
Also problematic for the area is the dependence of peopleon rainwater during the rainy season, as this limits theamount available for crop production, which necessitatesthe use of naturally saline irrigation waters that potentiallycontain elevated metals and metalloids (e.g., se, gh-gj). Thisin turn has implications for the economy of the area,including the way people work (i.e., irregular, unguaranteedincome based on seasonal shifts between agriculture andmining) and high migration. Furthermore, uptake of metalsand metalloids by livestock watering also represents anissue for agricultural production.
Figure 3 shows the weighted Vc2 (exposure) contribu-tion to the study area and communities’ ca and ci Vts(Table 1, Fig. 1). Community ca obtained the highestweighted Vc2 score and is therefore most vulnerable withrespect to the exposure component. This is primarily due tothe fact that ca is a high population mining community andis <500 m from the Antequera River and main mineworkings (CWQHR 8; Fig. 6, sites mb-mc). In contrast, ciobtained a weighted score below the study area average(Fig. 3). This was due to its being> 2 km downstream ofmain mining activity (Fig. 1) and >500 m away from a riverassessed as CWQHR 8 (mh-mi), and also because surveyedresidents are on average fewer per household, travel lessthan the study area average for water and have both lowerthan average number of livestock and area of cultivated landbeing exposed than the study area average (Table S2).However, ci is still <1000 m from the Pazña River (mh-mi),also assessed as CWQHR 8 (Fig. 6), in addition to havingaccess to groundwater wells determined as unfit for mostpurposes without treatment. As such, people (and theiranimals) living along the entire Antequera and Pazña riverreaches remain highly vulnerable to mining-related andnatural contamination (Figs. 4 and 5). Of particular concernis the potential for migration of contaminants into ground-water for all communities close to and downstream ofmining activity (e.g., Mn in gi and gj groundwater wells;Fig. 5c).
The weighted political and institutional componentcontribution (Vc3 1.16, Fig. 3a) to the study area Vt indi-cates the importance of related topics to residents. Of par-ticular concern is the population centre of ci, whereaveraged surveyed households considered (i) themselves tohave no influence on water related decision making, (ii)
their community to be poorly organised, and (iii) theircommunity to have no relationship with mining operators orthe municipality. This suggests that local residents feelpowerless to tackle the issues relating to, for example, thecontamination of the Pazña River (mh-mi) but also toscarcity issues, which has become a dominant issue in 2016following the drying out of Lake Poopó (National Geo-graphic 2016), and illustrates residents’ very real concernsand doubts over the restoration and preservation of theirenvironment. This is also true of ca, the main differencefrom ci being that surveyed ca residents considered them-selves fairly well organised and, as detailed below, that caresidents were also determined as less vulnerable in terms ofeducational, social and economic components than sur-veyed ci residents.
Although educational and cultural (Vc4 0.64; Fig. 3a,Table 1), social (Vc5 0.48) and economic (Vc6 0.63)components were lesser contributors to the study area Vt,numerous aspects stand out from the indicators used todetermine these Vcs, including for Vc4, lack of training onwater issues (vi21), for Vc5, high migration (vi22), and forVc6, diversification of production (crops mainly for self-consumption, vi27) and high poverty level (vi28).
In ci, where in addition to <5% of averaged surveyedhouseholds having a family member with training on waterissues, levels of illiteracy are higher than in ca and the studyarea average. Therefore, the overall Vc4 score for ci is alsohigher than ca and the study area average. Also, ci house-holds had a much higher migration score (vi22) than ca,possibly relating to different dominant employment sectors;this is reflected in Vc6, whereby the main economic activityof ci surveyed households was on average dominantly(seasonal) agricultural work, versus mining and technicalroles in ca (vi26, Table S2). Both communities producecrops mainly for self-consumption as opposed to sellingthem, and for the entire study area are dominantly ranked aspoor (Census 2012). Hence, ci obtained Vc3, Vc4, Vc5 andVc6 scores that were higher than for ca and the study areaaverage, whereas ca scored below average on these Vcs, buthigher than ci and the study area average on Vc1 and Vc2,reflecting the different vulnerabilities of these communities.As a mining centre, the vulnerability of ca is characterisedby above average scores in environmental and exposureelements, whereas the downstream vulnerability of ci ischaracterised by above average political, educational, socialand economic factors.
Recommendations for Management and Remediation
Of the 27 water sample sites assessed in the Bolivian LakePoopó Basin, 78% were classified as CWQHR ≥ 6 andtherefore unsuitable for human consumption without sig-nificant treatment due to high levels of metals and/or salt;
Environmental Management (2017) 60:555–573 569
90% of groundwater sites, 67% of surface water sites, and100% of thermal water sites fell into this category. Many ofthese waters are also not recommended for irrigationor livestock watering. Natural contamination is char-acterised by high concentrations of salts and exceedance ofBolivian ‘A’ criteria for some elements of health sig-nificance (e.g., F, B and Sb). Very high concentrations ofmining-related contaminants (e.g., Zn, Al, Mn, Fe, SO4 andCd) make many waters unsuitable for any use withoutsignificant treatment, and this represents a considerableenvironmental problem.
Surveyed households in the study area were on averagefound to be highly vulnerable to water hazards, withrestricted access to basic water related services and onlysufficient quantities of water to meet basic health require-ments. The majority of surveyed people only complete abasic level of education and few have received training onwater issues. Additionally, income levels are generally verylow and as a result human and animal health may be at riskfrom insufficient water and/or poor water quality. Ourfindings demonstrate an urgent need to improve access towater and to ensure that the water available is safe enoughfor various end-users and intended purposes, includinghuman and animal consumption and irrigation foragriculture.
Overall, the severity of the levels of natural and minecontamination in many waters in the region demonstrate theneed for compliance with water quality legislation and forstakeholders to take increased action on their water relatedand environmental responsibilities. In the more immediatefuture, priorities might therefore include the following:placing use restrictions on sites assessed as CWQHR ≥ 5;routinely assessing bacterial quality; taking steps to protectwater sources against further contamination; exploring foradditional sources of fair to good chemical quality water;expanding water harvesting and conservation; and improv-ing and maintaining basic water treatment, storage andsupply infrastructure. Desalination treatment and minewaste and water remediation on the other hand are optionsfor the longer term that would be both challenging andrequire substantial investment.
When considering the CWQHR of assessed sites (Fig. 6,Table S6), two main areas stand out as priority importancefor intervention for increasing the supply of potable water aswell as livestock and irrigation waters. The first area is thatin close proximity to the Pazña River (CWQHR 8) andfloodplain wells (CWQHR 7) and includes Santa Filomena(ck), Pazña (ci; high population centre) and San Martín (cj).The second area includes communities near the AntequeraRiver (CWQHR 8), such as Totoral (ca; high populationcentre) and Avicaya (cb). Given that we find the AntequeraRiver to be highly contaminated by metals and metalloidsand that we assess the communities as highly vulnerable,
we recommend the undertaking of a detailed groundwaterstudy to assess any related contamination and contaminantpathways. In addition, given that livestock (that often laterenter the food-chain) openly graze and frequent the river forwatering, we also highlight the need for investigationsrelating to food-chain impacts and possibly health risk inanimals and people.
Conclusions
This study has presented methods developed through aninnovative academic-NGO-community collaboration toassess hazards and vulnerabilities linked to water avail-ability and quality. The results produced exemplify howsuch assessments can yield information that has the poten-tial to generate positive change for communities that lacksufficient water of safe quality for maintaining human,animal and ecosystem health. Such communities are manyon the Altiplano and within the Andean mining belt (e.g.,Miller and Villarroel 2011; Perreault 2012; Rojas andVandecasteele 2007; Salvarredy-Aranguren et al. 2008) andmay benefit from assessment using our methodologicalframework. Likewise, the methodology could also beapplied to benefit similar situations and environmentselsewhere, for example, the Río Tapajós (Brazil; Barbienand Gardon 2009), the Mekong River (Cambodia; Berget al. 2007) and the Odiel catchment (Spain; SánchezEspaña et al. 2005), where communities may requireassessment and assistance regarding vulnerability to naturalor mine related contamination of their water and environ-ment. Undertaking of this type of assessment could alsohelp mitigate environmental disasters and contaminationrelated to, for example, mine dam failings (e.g., Río Doce,Brazil, November 2015; WISE 2016).
General responsibilities of specific stakeholders thatcould improve access to water and help ensure that water issafe enough for various purposes are highlighted as follows.Ideally, regional authorities (e.g., in our study, the Gov-ernment of Oruro) should meet legal requirements to pre-vent contamination of water bodies; in addition, theyshould: identify, monitor and manage major sources ofcontamination; undertake risk assessments of waterresources (and the food-chain) and implement appropriatemanagement strategies, including monitoring and chemicaland bacterial certification of water sources; improve andmaintain basic water supply infrastructure and expand watercollection, conservation and treatment systems throughregional investment in appropriate infrastructure. Munici-palities (e.g., local authorities) should meet legal require-ments to identify and manage sources of contamination(including monitoring and controlling wastewater dis-charges) and undertake periodic chemical and bacterial
570 Environmental Management (2017) 60:555–573
monitoring of potable water sources and build and operatewater and wastewater treatment facilities. Communitiesshould have individuals who are informed and trained incollecting, analysing and interpreting water quality data andform river-basin management committees with the otherstakeholders. Finally, mining cooperatives and companiesshould build infrastructure to adequately and safely containand treat mine waste and water, monitor environmentaldischarges and make information publicly available andadhere to national or international legislation for dischargesto receiving waters.
Acknowledgements This project was funded by the UniversityCollege London (UCL) Institute for Risk and Disaster Reduction andthe Catholic Agency for Overseas Development (CAFOD) under theinitiative of water risk and its management in Bolivia’s Altiplanodevelopment strategy, which was led by Stephen Edwards. The Nat-ural Environment Research Council Probability, Uncertainty and Riskin the Environment grant PA13-010 (risk visualisation and quantifi-cation for enhanced disaster risk reduction) to Stephen Edwardsinformed the approach to and outputs from the project. Help andsupport were provided by the CAFOD office in Bolivia, especiallythrough Marcella Vallejos, Jennifer Hadley and María del CarmenLópez. Special thanks are due to Gary Tarbuck (UCL-BirkbeckWolfson Laboratory, UK) for laboratory analyses, Israel Quino Lima(Universidad Mayor San Andrés, Bolivia) for assistance with fieldsampling and Franklin Mujica Quispe (SENAMHI, Bolivia) for rivergauging. A very special acknowledgement is given to the communitiesin the Pazña Municipality that participated in the project. The helpfulcomments of two anonymous reviewers helped improve the paper.
Compliance with ethical standards
Conflict of interest The authors declare that they have no competinginterests.
Open Access This article is distributed under the terms of theCreative Commons Attribution 4.0 International License (http://creativecommons.org/licenses/by/4.0/), which permits unrestricted use,distribution, and reproduction in any medium, provided you giveappropriate credit to the original author(s) and the source, provide alink to the Creative Commons license, and indicate if changes weremade.
References
Abarca-Del Rio R, Crètaux J-F, Berge-Nguyen M, Maisongrande P(2012) Does Lake Titicaca still control the Lake Poopó systemwater levels? An investigation using satellite altimetry andMODIS data (2000–2009). Remote Sens Lett 3:707–714
Argollo J, Mourguiart P (2000) Late quaternary climate history of theBolivian Altiplano. Quat Int 72:37–51
Ávila P (2004) Agua y vulnerabilidad socio ambiental. Carta Eco-nómica Regional, Año 17, núm. 90, 6. http://cartaeconomica.cucea.udg.mx/administracion/uploads/articulo913.pdf. Accessed21 Feb 2013
Barbien FL, Gardon J (2009) Hair mercury levels in Amazonianpopulations: spatial distribution and trends. Int J Health Geogr8:71
Barrenechea J, Gentile E, González S, Natenzon C (2000) Una pro-puesta metodológica para el estudio de la vulnerabilidad social enel marco de la teoría social del riesgo. Paper presented at the IVªJornadas de Sociología. Facultad de Ciencias Sociales, UBA,Buenos Aires.
Berg M, Stengel C, Trang PTK, Viet PH, Sampson ML, Leng M,Samreth S, Fredericks D (2007) Magnitude of arsenic pollution inthe Mekong and Red River Deltas–Cambodia and Vietnam. SciTotal Environ 372:413–425
Blaikie P, Cannon T, Davis I, Wisner B (1994) At risk: naturalhazards, people’s vulnerability, and disasters. Routledge, London
Bonsor H, MacDonald A, Calow R (2011) Potential impact of climatechange on improved and unimproved water supplies in Africa. In:Hester RE, Harrison RM (eds) Sustainable water. Issues inEnvironmental Science and Technology series, 31: 25–49. RSCPublishing. doi:10.1039/9781849732253-00025.
Cai X, McKinney DC, Rosegrant MW (2003) Sustainability analysisfor irrigation water management in the Aral sea region. Agr Syst76:1043–1066
Calizaya A (2009) Water Resources Management efforts for best waterallocation in the Lake Poopó Basin, Bolivia. PhD thesis, LundUniversity, LUTVDG/TVRL-1048
Cardona O (2003) The need for rethinking the concepts of vulner-ability and risk from a holistic perspective: a necessary reviewand criticism for effective risk management. In: Bankoff G,Frerks G, Hilhorst D (eds) Mapping vulnerability: disasters,development and people. Earthscan Publishers, London,Chapter 3
Catchment Management and Mining Impacts in Arid and Semi-aridSouth America (CAMINAR) (2013) In: Quintanilla J, Quino I (eds)Atlas cartografico Cuenca del Lago Poopó–Uru Uru, Bolivia
Canadian Council of Minister of the Environment (CCME) (2001)Canadian water quality guidelines for the protection of aquaticlife: CCME water quality index 1.0 user manual. http://www.ccme.ca/files/Resources/calculators/WQI%20User’s%20Manual%20(en).pdf. Accessed 10 Feb 2015
Census (2012) Instituto Nacional de Estadística, Censo de Población yVivienda. http://datos.ine.gob.bo/binbol/RpWebEngine.exe/Por-tal?&BASE=CPV2012COM. Accessed 4 May 2015
Cude CG (2001) Oregon water quality index: a tool for evaluatingwater quality management effectiveness. J Am Wat Res Assoc37:125–137
Cutter SL (1996) Vulnerability to environmental hazards. Prog HumanGeog 20:529–539
Cutter SL, Boruff BJ, Shirley WL (2003) Social vulnerability toenvironmental hazards. Soc Sci Quart 84:242–261
Eakin H, Luers AL (2006) Assessing the vulnerability of social-environmental systems. Ann Rev Environ Resour 31:365–394
Ekdahl A (2007) Water utilisation in a river basin in the Lake Poopóregion of Bolivia: problems and conflicts. MSc thesis, LundUniversity, TVVR 07/5017
Food and Agriculture Organization of the United Nations (FAO UN)(1985) Water quality for agriculture. http://www.fao.org/docrep/003/T0234E/T0234E00.HTM. Accessed 4 Sept 2014
García DA (2011) Verificacion de las instalaciones de la ptar de Orurodiseño de los nuevos equipos de bombeo en la estación elevadorade la ptar y evaluación de tratamiento de aguas servidas en cincolocalidades. Gobierno Autónomo Departamental de Oruro. Pro-grama de Gestión Sostenible de los Recursos Naturales de laCuenca del Lago Poopó. EuropeAid contract: 129288/C/Ser/BO.http://www.cuencapoopo.com/atiweb/verinstaptarorudisnueequibombeo.pdf. Accessed 2 May 2015
García ME, Bengtsson L, Persson KM (2010) On the distribution ofsaline groundwater in the Poopó Basin, central bolivian highland.VATTEN 66:199–203
Environmental Management (2017) 60:555–573 571
Garrett V, Ogutu P, Mabonga P, Ombeki S, Mwaki A, Aluoch G,Phelan M, Quick RE (2008) Diarrhoea prevention in a high-riskrural Kenyan population through point-of-use chlorination, safewater storage, sanitation, and rainwater harvesting. Epidem Infect136:1463–1471
Hanjra MA, Ferede T, Gutta DG (2009) Reducing poverty in sub-Saharan Africa through investments in water and other priorities.Agr Wat Manag 96:1062–1070
Horton RK (1965) An index number system for rating water quality. p300–305. In: Jacobs HL, Gabrielson IN, Horton RK, Lyon WA,Hubbard EC, McCallum GE (eds) Water quality criteria-streamvs. effluent standards. J Wat Pollut Contr Fed 37: 3, part I pp292–315. Published by: Water Environment Federation. StableURL: http://www.jstor.org/stable/25035251
Hudson-Edwards KA, Archer J (2012) Geochemistry of As-, F- and B-bearing waters in and around San Antonio de los Cobres,Argentina, and implications for drinking and irrigation waterquality. J Geochem Explor 112:276–284
Hudson-Edwards KA, Macklin MG, Miller JR, Lechler PJ (2001)Sources, distribution and storage of heavy metals in the RíoPilcomayo, Bolivia. J Geochem Explor 72:229–250
Instituto Nacional de Defensa Civil. Dirección Nacional de Prevención(INDECI) (2006) Manual básico para la estimación del riesgo.http://www.indeci.gob.pe/prev_desat/pdfs/man_bas_est_riesgo.pdf. Accessed 13 Feb 2014
Instituto Nacional de Estadística (INE) (2014) El productointerno bruto de Bolivia creció en 6,66%. Nota de prensa. http://www.ine.gob.bo/pdf/boletin/NP_2014_12.pdf. Accessed 4 May2015
Instituto Nacional de Estadística (INE) (2013) Oruro: Participación enel Producto Interno Bruto, según actividad económica. http://www.ine.gob.bo/indice/general.aspx?codigo=40203. Accessed27 Feb 2015
Klartell K, Sandholm M (2009) Low-cost remediation method fortrace element contaminated surface waters in the Lake Poopówatershed, Bolivia. MSc thesis, LWR-EX-09-10, ISSN 1651-064X
Liga de Defensa del Medio Ambiente (LIDEMA) (2008) Informe delestado ambiental de Bolivia 2007-2008. http://www.bicusa.org/wp-content/uploads/2013/02/Libro+Estado+Ambiental+Bolivia+2007+-+2008.pdf. Accessed 6 Apr 2015
Lilja A, Linde G (2006) Occurrence and distribution of heavy metalsin three rivers on the Bolivian high plateau. MSc thesis, LundUniversity, TVRL 2006:12
Lumb A, Sharma TC, Bibeault J-F (2011) A review of genesis andevolution of water quality index (CWQHR) and some futuredirections. Wat Qual Expos Health 3:11–24
Madrigal S (2011) Estimación participativa del riesgo de desastres enel sitio RAMSAR Laguna Olomega, El Salvador. RevistaOIDLES, 5:4–8
Miller JR and Villarroel LF (2011) Bolivia: mining, river con-tamination, and human health. Encyclopaedia of Environ Health421–441. doi:10.1016/b978-0-444-52272-6.00375-5
Mohsen MS (2007) Water strategies and potential of desalination inJordan. Desal 203:27–46
Montes de Oca I (1997) Geología y recursos naturales de Bolivia, 3rdedn. Edobol, La Paz, Bolivia
National Geographic (2016) http://news.nationalgeographic.com/2016/01/160121-lake-poopo-bolivia-dried-out-el-nino-climate-change-water/. Accessed 16 Dec 2016)
Navarro Torres VF, Echenique GZ, Singh RN (2012) Environmentalhazards associated with mining activities in the vicinity of Boli-vian Poopó Lake. J Min Environ 3:15–26
Orsag V (2009) Degradación de Suelos en el Altiplano Boliviano:Causas y medidas de mitigacion. Análisis-IBEPA 1(3):27–30.
http://www.revistasbolivianas.org.bo/pdf/ra/v1n3/v1n3a06.pdfAccessed 5 Apr 2014
Perles MJ, Vías JM, Andreo B (2009) Vulnerability of human envir-onment to risk: case of groundwater contamination risk. EnvironInt 35:325–335
Perona N, Rocchi G (2001) Vulnerabilidad y Exclusión social. Unapropuesta metodológica para el estudio de las condiciones de vidade los hogares. Kairos revista de temas sociales N° 8-8. ISSN1514–9331
Perreault T (2012) Dispossession by accumulation?Mining, water andthe nature of enclosure on the Bolivian Altiplano. Antipode45:1050–1069. ISSN 0066-4812
Pillco R, Bengtsson L (2006) Long-term and extreme water levelvariations of the shallow Lake Poopó. Bolivia J Hydrol Sci51:98–114
Quintanilla J, García ME, Ramos Ramos O, Niura A, Lorini J, PelaezC, Rotting T (2012) Sintesis del diagnóstic ambiental de laCuenca del Lago Poopó. CAMINAR Proyecto publication,Oruro, Bolivia
Ramos Ramos OE (2014) Geochemistry of trace elements in theBolivian Altiplano: effects of natural processes and anthro-pogenic activities. PhD thesis, Lund University. TITA-LWR-PHD-2014:04, ISSN 1650-8602, ISBN 978-91-7595-177-5
Ramos Ramos OE, Cáceres LF, Ormachea Muñoz MR, BhattacharyaP, Quino I, Quintanilla J, Sracek O, Thunvik R, Bundschuh J,García ME (2012) Sources and behavior of arsenic and traceelements in groundwater and Surface water in the Poopó LakeBasin, Bolivian Altiplano. Environ Earth Sci 66:793–807
Ramos Ramos OE, Rotting TS, French M, Sracek O, Bundschuh J,Quintanilla J, Bhattacharya P (2014) Geochemical processescontrolling mobilization of arsenic and trace elements inshallow aquifers and surface waters in the Antequera andPoopó mining regions, Bolivian Altiplano. J Hydrol 518(Part C):421–433
Rojas JC, Vandecasteele C (2007) Influence of mining activities in thenorth of Potosi, Bolivia on the water quality of the ChayantaRiver, and its consequences. Environ Monit Assess 132:321–330
Rosenberg M, Stålhammer K (2010) Evaluation of heavy metals inwaters influenced by mining in the Poopó and Antequera RiverBasins, Oruro–Bolivia. A minor field study. MSc thesis, LundUniversity, TVVR-10/5001. ISSN-1101-9824
Said A, Stevens DK, Sehlke G (2004) Environmental assessment: aninnovative index for evaluating water quality in streams. EnvironManage 34:406–414
Salvarredy-Aranguren MM, Probst A, Roulet M, Isaure M-P (2008)Contamination of surface waters by mining wastes in the MilluniValley (Cordillera Real, Bolivia): Mineralogical and hydrologicalinfluences. Applied Geochem 23:1299–1324
Sánchez España J, López Pamo E, Santofimia E, Aduvire O, Reyes J,Barettine D (2005) Acid mine drainage in the Iberian Pyrite Belt(Odiel river watershed, Huelva, SW Spain): geochemistry,mineralogy and environmental implications. Appl Geochem20:1320–1356
SDC, PROMIC (2006) Metodología para análisis de riesgos: Muni-cipio de Tiquipaya, Cochabamba Proyecto: Promoción e institu-cionalización participativa de la Gestión del Riesgo en laplanificación municipal de Tiquipaya. Cochabamba, p 9
Selander L, Svan P (2007) Occurrence and distribution of heavymetals in Lake Poopó, Bolivia. MSc thesis, Lund University,TVVR 07/5010
Sergeotecmin (1992) Mapa geologico de Uncia número 6238(AeCGN6238C001). Escala 1:100,000. Publicacion SGB Serie I-CGB-15
Servicio Nacional de Meteorologia e Hidrologia – Bolivia (SENAMHI)(2014) http://www.senamhi.gob.bo/. Accessed 8 Sept 2014
572 Environmental Management (2017) 60:555–573
Servicio Nacional de Geologia y Minería (SERGEOMIN) (2000)Mapa hidrogeológico, Departmento de Oruro. PublicationSGM SERIE II-MTB-DEP-1F. Purchased July 2014, La Paz,Bolivia
Stauffer RE, Thompson JM (1984) Arsenic and antimony in geo-thermal waters of Yellowstone National Park, Wyoming, USA.Geochim Cosmochim Acta 48:2547–2561
Strosnider WHJ, Llanos López FS, Nairn RW (2011) Acid minedrainage at Cerro Rico de Potosí II: Severe degradationof the Upper Rio Pilcomayo watershed. Environ Earth Sci64:911–923
Strosnider WHJ, Llanos López FS, LaBar JA, Palmer KF, Nairn RW(2014) Unabated acid mine drainage from Cerro Rico dePotosí, Bolivia: uncommon constituents of concern impactthe Río Pilcomayo headwaters. Environ Earth Sci 71:3223–3234
Stumm W, Morgan JJ (1996) Aquatic chemistry: chemical equilibriaand rates in natural waters, 3rd edn. Wiley, London
Tapia J, Audry S (2013) Control of early diagenesis processeson trace metal (Cu, Zn, Cd, Pb and U) and metalloid(As, Sb) behaviours in mining- and smelting-impactedlacustrine environments of the Bolivian Altiplano. Appl Geo-chem 31:60–78
Tapia J, Audry S, Townley B, Duprey JL (2012) Geochemical back-ground, baseline and origin of contaminants from sediments inthe mining-impacted Altiplano and Eastern Cordillera of Oruro,Bolivia. Geochem: Explor Environ Anal 12:3–20
United Nations Environment Programme (UNEP) (1996) DiagnósticoAmbiental del Sistema Titicaca-Desaguadero-Poopó-Salar de
Coipasa (Sistema TDPS) Bolivia - Peru. Department of RegionalDevelopment and Environment, General Secretariat of theOrganisation of American States, Washington DC
United Nations Environment Programme (UNEP) (2010) Clearing theWaters: A focus on water quality solutions. http://www.unep.org/PDF/Clearing_the_Waters.pdf. Accessed 30 Oct 2014
Van Den Bergh K, Du Laing G, Montoya JC, De Deckere E, TackFMG (2010) Arsenic in drinking water wells on the Bolivian highplain: field monitoring and effect of salinity on removal efficiencyof iron-oxides-containing filters. J Environ Sci Health Pt A45:1741–1749
Vergara W, Deeb AM, Valencia AM, Bradley RS, Francou B, ZarzarA, Grunwaldt A, Haeussling SM (2007) Economic impacts ofrapid glacier retreat in the Andes. EOS 88(25):261–268
Wirrmann D, Mourguiart P (1995) Late Quaternary spatio-temporallimnological variations in the Altiplano of Bolivia and Peru. QuatRes 43:344–354
WISE World Information Service on Energy Uranium Project (2016)Major Tailings Dam Failures, http://www.wise-uranium.org/mdaf.html. Accessed 23 May 2016
Wisner B, Luce H (1993) Disaster vulnerability: scale, power anddaily life. Geo J 30:127–140
World Health Organization (WHO) (2011) Guidelines for Drinking-water Quality. 4th Edition. ISBN 978 92 4 154815.1. http://www.who.int/water_sanitation_health/publications/2011/dwq_guidelines. Accessed 4 Sept 2014
Environmental Management (2017) 60:555–573 573