Embed Size (px)
Citation preview

Fall 2013VOLUME 25NUMBER 2
Federal Reserve Bank of San Francisco
Community Development in Native CommunitiesPlus:A Model for Neighborhood Level Micro-Enterprise Economic Development
Planning for Senior Transportation Alternatives

CI Notebookby Gabriella Chiarenza
Finding a way to improve conditions and opportunities in Native American communities is an exceptionally tall order, given the displacement, deepening poverty, and outside interference with which Native peoples have struggled for generations. Though they
suffer from some of the highest rates of chronic illness and unemployment in the country, Native communities are often overlooked when it comes to crucial economic, social, and infrastructural investments. Many Native communities have been forced to consider how best to tackle entrenched problems, often in isolated areas, with far too few financial resources.
Even through decades of hardship, however, American Indians, Alaska Natives, and Native Hawaiians have continuously drawn on the enduring strength of their peoples’ traditional values and practices to rally their communities and work toward solutions. Today, many tribal nations are rebuilding their relationship with the federal government and launching valuable new partnerships with foundations, non-profit organizations, and others to put new resources and ideas into action in Indian Country. At the same time, a renewed emphasis on tribal self-determination ensures that even as Native communities connect with outside partners, they also retain a leadership role in their own initiatives. Native communities are also investing in their own members with community-based career training, which enhances overall capacity in the community and introduces the important elements of accommodation and respect for each individual tribe’s cultural norms and Native languages.
In this issue of Community Investments, we look at a selection of Native initiatives across the country that illustrate the effectiveness and forward momentum of these efforts. We learn how Native communities are partnering with federal agencies to build and support sustainable housing in Indian Country, and establish modern water and sewer systems for remote Native communities in Alaska. The articles also examine a community-based health worker initiative that extends culturally-sensitive health care to the farthest reaches of Navajo Nation, and a Native Hawaiian financial education program and community-based lending institution. In addition, we discover how a community center in Portland, Oregon is bringing urban Native Americans together and preserving community ties in a city environment.
The initiatives discussed in this issue are just a few of the many successful programs operating in Native communities across the United States. Though still contending with the many challenges left by centuries of cultural and economic upheaval, Native communities are simultaneously looking inward and reaching outward to improve conditions, build resources, and create opportunity for Native peoples in Indian Country and beyond.
Community Development DepartmentFederal Reserve Bank of San Francisco
101 Market Street, Mail Stop 215San Francisco, CA 94105
Scott TurnerVice President Community Engagement [email protected]
Laurel GourdConference and Administrative [email protected]
Esther FishmanAdministrative [email protected]
RESEARCH STAFFDavid EricksonManager, Center for Community Development Investments [email protected]
Ian GallowaySenior Investment Associate [email protected]
Naomi CytronSenior Research [email protected]
Laura ChoiSenior Research [email protected]
Gabriella ChiarenzaResearch [email protected]
William DowlingResearch [email protected]
FIELD STAFFJohn MoonDistrict [email protected]
Joselyn CousinsRegional ManagerArizona, Nevada, [email protected]
Melody Winter HeadRegional ManagerSouthern [email protected]
Craig NolteRegional ManagerAlaska, Hawaii, Idaho, Oregon, [email protected]
Lena RobinsonRegional ManagerNorthern California [email protected]
Darryl RutherfordRegional ManagerSan Joaquin Valley [email protected]
This publication is produced by the Community Development Department of the Federal Reserve Bank of San Francisco. The magazine serves as a forum to discuss issues relevant to community development in the Federal Reserve’s 12th District, and to highlight innovative programs and ideas that have the potential to improve the communities in which we work.

Federal Reserve Bank of San Francisco
In this IssueSpecial Focus: Community Development in Native Communities
Current Challenges and New Pathways for Community Development in Indian Country ............................ 2By Gabriella Chiarenza, Federal Reserve Bank of San Francisco
Investing in Community-Driven Native American Social and Economic Development Initiatives ................ 9By Joshuah Marshall and Michelle Sauve, Administration for Native Americans
Building Green and Respecting Native American Identity: Housing, Culture, and Sustainability in Native American Communities .......................................................................................... 13By Mike Blanford and Brian Gillen, HUD; Lynda Lantz, FirstPic Inc.; Robert Pyatt, University of Colorado- Boulder; and Jamie Blosser, Sustainable Native Communities Collaborative
Making the Invisible Visible: Urban Indian Community Development ......................................................... 18By Janeen Comenote, National Urban Indian Family Coalition and Megan Bang, University of Washington
Community Outreach and Patient Empowerment: A Collaborative Initiative for Chronic Disease Management in Navajo Nation ....................................................................................................... 23By Mae Gilene Begay, Navajo Nation Community Health Representative Outreach Program; Rebecca Hutchinson, Lankenau Medical Center; Maricruz Merino, Gallup Indian Medical Center, Sara Selig, Brigham and Women’s Hospital; and Hannah Sehn, Jamy Malone, Christine Hamann, and Sonya Shin, COPE Project
Investing in Our Next Generation: A Native Hawaiian Model for Economic Self-Sufficiency ...................... 26By Jeff Gilbreath and Lahela Williams, Hawaiian Community Assets
Eye on Community Development
You Have to Scale Down Before You Can Scale Up: A Micro-Enterprise Story ............................................. 30By Iosefa Alofaituli, Oak View Renewal Partnership and Michael Connors, AmeriCorps VISTA
Planning for Driving Retirement: Context and Considerations ..................................................................... 35By Laura E. Mason, Jewish Community Federation of San Francisco, the Peninsula, Marin and Sonoma Counties
Quarterly Features
Research Briefs............................................................................................................................................. 40
Data Snapshot: Native Americans in the 12th District and Across the United States ................................... 42

Current Challenges and New Pathways for Community Development in Indian CountryBy Gabriella Chiarenza, Federal Reserve Bank of San Francisco
2 Community Investments, Fall 2013 – Volume 25, Number 2
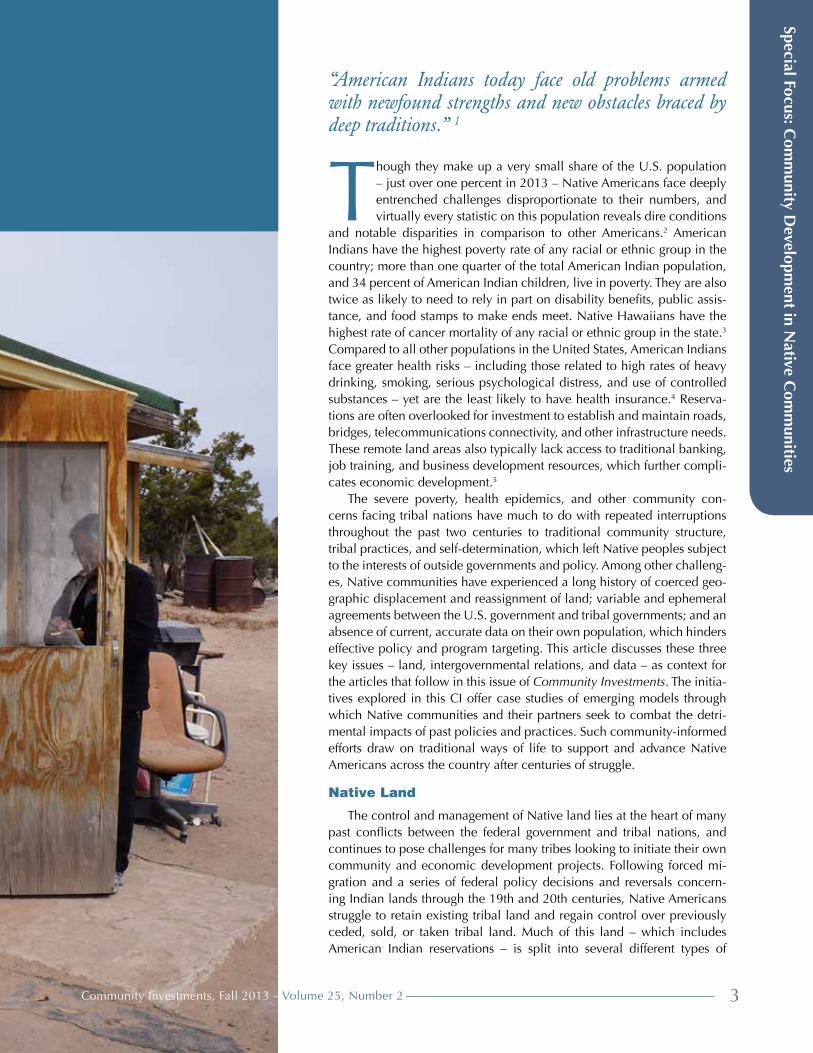
Photo credit: Bec Rollins
Current Challenges and New Pathways for Community Development in Indian CountryBy Gabriella Chiarenza, Federal Reserve Bank of San Francisco
“American Indians today face old problems armed with newfound strengths and new obstacles braced by deep traditions.” 1
Though they make up a very small share of the U.S. population – just over one percent in 2013 – Native Americans face deeply entrenched challenges disproportionate to their numbers, and virtually every statistic on this population reveals dire conditions
and notable disparities in comparison to other Americans.2 American Indians have the highest poverty rate of any racial or ethnic group in the country; more than one quarter of the total American Indian population, and 34 percent of American Indian children, live in poverty. They are also twice as likely to need to rely in part on disability benefits, public assis-tance, and food stamps to make ends meet. Native Hawaiians have the highest rate of cancer mortality of any racial or ethnic group in the state.3 Compared to all other populations in the United States, American Indians face greater health risks – including those related to high rates of heavy drinking, smoking, serious psychological distress, and use of controlled substances – yet are the least likely to have health insurance.4 Reserva-tions are often overlooked for investment to establish and maintain roads, bridges, telecommunications connectivity, and other infrastructure needs. These remote land areas also typically lack access to traditional banking, job training, and business development resources, which further compli-cates economic development.5
The severe poverty, health epidemics, and other community con-cerns facing tribal nations have much to do with repeated interruptions throughout the past two centuries to traditional community structure, tribal practices, and self-determination, which left Native peoples subject to the interests of outside governments and policy. Among other challeng-es, Native communities have experienced a long history of coerced geo-graphic displacement and reassignment of land; variable and ephemeral agreements between the U.S. government and tribal governments; and an absence of current, accurate data on their own population, which hinders effective policy and program targeting. This article discusses these three key issues – land, intergovernmental relations, and data – as context for the articles that follow in this issue of Community Investments. The initia-tives explored in this CI offer case studies of emerging models through which Native communities and their partners seek to combat the detri-mental impacts of past policies and practices. Such community-informed efforts draw on traditional ways of life to support and advance Native Americans across the country after centuries of struggle.
Native Land
The control and management of Native land lies at the heart of many past conflicts between the federal government and tribal nations, and continues to pose challenges for many tribes looking to initiate their own community and economic development projects. Following forced mi-gration and a series of federal policy decisions and reversals concern-ing Indian lands through the 19th and 20th centuries, Native Americans struggle to retain existing tribal land and regain control over previously ceded, sold, or taken tribal land. Much of this land – which includes American Indian reservations – is split into several different types of
Special Focus: Com
munity D
evelopment in N
ative Com
munities
3Community Investments, Fall 2013 – Volume 25, Number 2

4 Community Investments, Fall 2013 – Volume 25, Number 2
Major U.S. Legislation impacting American Indian Nations
1789
1886
1933
1945
1968
Present
1790 Indian Trade and Intercourse Act This act, passed by the first U.S. Congress, dictated that states or individuals were forbidden from buying Indian lands without the explicit permission of the federal government.
1828-1832 The Marshall Trilogy This set of three Supreme Court decisions established the Federal Trust Doctrine, which obligated the U.S. Government, under federal law, to protect tribal self-governance and retain lands, culture, assets, and resources, in exchange for the cessation of millions of acres of tribal land to the U.S. Government.
1800
1850
1900
1950
2000
1830 Indian Removal Act of 1830 This act gave President Andrew Jackson the power to push remaining Indian tribes east of the Mississippi River to lands in the west, leading to the forcible removal of some tribes.
1887 General Allotment of 1887 Tribal lands held collectively by entire tribes were sliced up into small plots for ownership by individual Indians, purportedly to encourage landownership and farming among Indians. Additionally, tribal land determined by the U.S. Government to be “surplus” was ceded to or purchased by the U.S. government for non-Indian settlement with few tribes receiving fair compensation for their land.
1934 Indian Reorganization Act Discovering that assimilation policies were in fact inflicting great damage and deepening poverty among the Indian population, the federal government called for the return of Indian lands to tribes that had been forced to relinquish them. To help stimulate economic development among tribes, the U.S. Government also established several programs which were intended to restore some sense of self-rule to tribes, but had the ultimate effect of imposing a Western model of governmental structure on tribes.
1952 Urban Indian Relocation Program The federal government directly encouraged American Indians to leave reservations and rural areas and move to urban centers through the Urban Indian Relocation Program, beginning in 1952.
1975 Indian Self-Determination and Educational Assistance Act Along with and parallel to the broader civil rights struggle of the 1960s, American Indians pushed back against decades of U.S. assimilation attempts to design their own civil rights effort: a movement for self-determination. In 1975 the U.S. Government established an official U.S. policy focused on tribal self-determination, under which the U.S. government still operates today.
1953 House Concurrent Resolution 108 This resolution terminated U.S. recognition of over 100 tribes, effectively cutting off their members from federal protections over tribal land and designated federal assistance for Indians.

ownership, which complicates acquisition, development, preservation, and community cohesion. Until tribes are able to assemble (or reassemble) contiguous land bases, other landholders and interests may block their initiatives and hinder community development efforts.6
More than two-thirds of all American Indians and Alaska Natives now live outside of Native areas.7 There are numerous reasons that this majority of the population no longer lives on Native land. For some, it may be the result of losing, ceding, or selling their individual allot-ments (or a larger tribe’s loss of land); others now live in cities due to former federal relocation programs that encouraged Native Americans to move to urban areas; still others may be unable to find employment on their reservations and thus move to areas where jobs are more readily available. Additionally, some tribes do not have reservations or other tribal lands.8 At the same time, the overall majority of residents living within the boundar-ies of reservations and other Native lands are not Native Americans. In 2010, 77 percent of those living in Ameri-can Indian areas and 68 percent of those living in Alaska Native villages did not identify as American Indians or Alaska Natives.9
This unexpected population distribution in Native areas is due not only to the migration of Native Americans off of reservations as noted above, but also to the complex assortment of land ownership types and accompanying regulations commonly found within reservation bound-aries. This land tenure pattern causes two key problems for Native Americans living on reservations and for those who may wish to return to their tribe’s Native lands: frac-tionation and checkerboarding.
Fractionation frequently complicates the development of plots that were allotted to individual American Indians with the implementation of the General Allotment Act of 1887 (also known as the Dawes Act). After the individual to whom the parcel was allotted dies, each generation of heirs receives an equal interest in the land title, but the land itself is never divided, meaning that all of the heirs share interest in one common piece of property. Fraction-ation creates a difficult situation across many reservations as each plot of land may be tied up by hundreds or even thousands of interest holders.10 A 1992 U.S. General Ac-counting Office survey of fractionation on twelve reserva-tions found that 60 percent of the 1.1 million individu-als associated with the land in the study held an interest of two percent or less of a given parcel’s title.11 A ma-jority of interest holders must consent to any housing or business development plan before a proposal can move forward, and establishing this majority consent for frac-tionated property is time-consuming, cumbersome, and in some cases may be impossible, inhibiting economic and housing development plans.12
Many tribes also contend with the widely varied land-scape of ownership types abutting one another within their reservation boundaries – a common reservation pattern known as checkerboarding. In such cases, tribal lands may be interspersed with lands held in trust by the federal government on behalf of a tribe or individual Native American, or individually-owned plots, including some held by non-Native individuals. Checkerboarding can often render it impossible for tribes to secure larger con-tiguous parcels of land for grazing, farming, and economic development efforts. Each ownership type is accompanied by its own rules and restrictions, and often each is under the jurisdiction of different government bodies, leading to regular confusion and clashes between owners and gov-erning agencies. In this context, merely acquiring land for any kind of development or community purpose – or re-acquiring sacred sites or areas with natural resources to be preserved – becomes a wearying challenge for tribes.13
Moreover, these conditions often make the reserva-tion environment less attractive to outside investors or consultants with whom tribes may seek to develop part-nerships and can inhibit development in other ways. For instance, the restrictions and legal complications associ-ated with trust lands and fractionated properties prevent them from being used as collateral for business and de-velopment loans in many cases.14 Individual American Indian landowners also must endure the lengthy process of U.S. Bureau of Indian Affairs (BIA) review and approval of many property-related matters due to federal oversight requirements of trust and restricted lands; even simple re-quests such as a land title certificate may take years to approve, while outside Native lands this request can be processed in a few days.15
Still, many tribes are finding ways to buy back or reclaim lost land. Some also aim to use the land they have to promote conservation and efficient uses of resources. Several tribes have worked toward this goal in partnership with the U.S. Department of Housing and Urban Devel-opment (HUD), through HUD’s Sustainable Construction in Indian Country (SCinIC) program, profiled at length in a following article in this issue of CI. SCinIC draws on strong tribal leadership and community participation and training, building partnerships with Native communities to develop sustainable housing that reflects traditional values and beliefs around respect and preservation of land and resources.16
5Community Investments, Fall 2013 – Volume 25, Number 2
Fractionation creates a difficult situation across many reservations as each plot may be tied up by hundreds or even thousands of interest holders
Special Focus: Com
munity D
evelopment in N
ative Com
munities

Intergovernmental Relations
The relationship between the federal government and tribal governments is another issue significantly affecting tribes’ ability to foster and maintain community and eco-nomic development initiatives. Throughout decades of in-teractions, the federal government took on a guardian role with responsibility to protect tribes’ land, resources, and assets and to preserve tribes’ rights to self-determination.17 Over time, this trust relationship has become impractical, inefficient, and in many cases, a stumbling block for tribes seeking to quickly and effectively jumpstart their own ini-tiatives.18
The BIA and a multitude of divisions within other federal departments oversee and administer programs related to Native American health, education, housing, in-frastructure, and public safety and criminal justice. While the federal government continues to play a key role in Indian Country and is expected to carry out its oversight and protective duties as established by the trust respon-sibility, some researchers, advocates, and tribes contend that existing programs are underfunded, and ill-equipped to address the complexities of modern economic develop-ment and the critical challenges resulting from rampant, long-term poverty in Indian Country.19 As a result, in recent decades, an increasing number of tribes are pressing for a newly defined federal-tribal relationship that would main-tain the recognition and, to some degree, the partnership of the federal government but allow self-determination and control over their own tribal nations and initiatives with less interference from the United States.20
The recent economic crisis and federal budget crunch further accelerated the push for tribal self-determination, as these economic issues only deepened poverty and disinvestment in Indian Country. Advocates stressed that though $3 billion was designated for tribal community programs and investments in the American Recovery and Reinvestment Act (ARRA) in 2009, funding was nowhere near enough to address the longstanding need on many reservations. The National Congress of American Indians (NCAI) explains that for many tribes, “economic crisis is not an occasional disaster; it is a daily reality” and that “drop in the bucket” investments are not effective on their own. For instance, in 2009 unmet funding for in-frastructure alone stood at $50 billion. And despite the disproportionately high rates of many diseases and health
6 Community Investments, Fall 2013 – Volume 25, Number 2
concerns in Indian Country, combined with a severe scar-city of health resources, ARRA provided $415 million for health care facilities, falling far short of the estimated $3.5 billion in unmet health facility investments on Native land.21 Such shortfalls are seen across departments and program categories impacting Native communities, both with ARRA and in annual federal budget appropriations.22
This year, federal budget sequestration threw addition-al salt on Indian Country’s wounds. Federal programs for American Indians are considered treaty obligations rather than optional welfare programs, and as such represent part of the U.S. government’s trust responsibility to tribes. These programs are discretionarily funded, however, making them vulnerable to annual federal budget adjust-ments. Reservations were strongly impacted due to their significant dependence on federal discretionary funds, and the lack of a local or tribal tax base on many reser-vations compounded the funding shortfall.23 Congress ex-empted from sequestration some key programs supporting low-income Americans, including Medicaid, Temporary Aid for Needy Families, and the Supplemental Nutrition Assistance Program (food stamps). Yet while Native Ameri-can communities have the highest rates of poverty, none of the discretionary programs focused on Indian Country were spared from sequestration, resulting in layoffs and significant funding losses affecting schools, police, health services, and housing across Native areas that were already struggling with few resources.24
Additionally, the dispersion of programs for American Indians across multiple federal departments can make it difficult for tribes to successfully pursue their community and economic development goals. These agencies are not always coordinated with one another, and a project that requires funding through several programs may also be subject to several different compliance timelines and monitoring procedures. Such complexities slow down the development process and can present challenges for tribes attempting to secure additional funding from non-governmental financial institutions, which may not be accustomed to working with federal programs or may require action within a tighter timeframe. The confusion among departments can even make it hard for tribes to know which programs can be used together to help get an initiative off the ground.25
Tribal leaders and other observers note that the un-derfunding of federal Indian Country programs is stunt-ing the progress that the federal government has made on policy fronts since 1975’s Indian Self-Determination and Educational Assistance Act, which refocused federal American Indian policy on support of tribal initiatives and self-determination.26 Yet many recent projects dem-onstrate that well-designed tribal-federal partnerships, particularly those operating under strong Native leader-
The recent economic crisis and federal budget crunch only deepened poverty and disinvestment in Indian Country

7Community Investments, Fall 2013 – Volume 25, Number 2
ship and backed by sufficient federal and tribal resources, participation, and support, can efficiently and success-fully tackle the complex problems facing modern Native communities.27 For instance, the Administration for Native Americans (ANA), a division of the U.S. Department of Health and Human Services, provides grant funding to support the community-determined priority projects of a wide range of tribes, working with strong tribal leadership in these communities and a focus on Native self-sufficien-cy. The ANA’s partnership model is discussed in a follow-ing article in this issue of CI.
The Data Challenge
In order to effectively identify and manage community issues in Indian Country, and to ensure federal programs are responding to real needs at the appropriate scale, both the U.S. government and tribal governments require ac-curate data. Unfortunately, very little data on the Native American population is publicly available. Native com-munities are among the most researched groups in the country – often in privately-funded, health-related studies – but most tribes and Native individuals who participate in studies are never provided with the final report or raw data from the research.28 A lengthy history of outside re-searchers coming into Native communities to collect data without sharing their results with tribal leaders has left many Native groups skeptical of study proposals and the goals of the researchers.29 With some of the most press-ing economic and health needs in the country, Native communities struggle to be recognized in federal priori-ties because so little information is available to them with which to make their case to policy makers.
Tribes have also expressed frustration with missing or mismatched data in their interactions with federal de-partments handling American Indian programs, and with independent researchers. Because the Native American population is such a small percentage of the overall U.S. population, research models that employ random sam-pling of this population often produce numbers too small to be considered statistically accurate or significant for national studies. In many cases, this leads researchers to assign Native Americans to an “other” category along with non-Native populations, making it impossible to identify data trends specific to Native Americans.30
Missing or inaccurate data also impacts funding for federal programs. A United States Commission on Civil Rights study on conditions and programs in Indian Country observed that in many cases, it is difficult to discern which specific community needs programs are intended to meet, and how much is being spent on these programs. This confusion may threaten programs that are succeeding and inhibit adjustments to programs that are not adequately providing assistance to Native communities; without
accurate data, it is nearly impossible to identify and track Native assistance programs, a serious issue when federal resources are both scarce and critically important to tribal development and community services.31
Moreover, Native community representatives are sometimes concerned with the handling of data that tribes submit in response to federal program requests. For example, in 2010 the Department of the Interior (DOI) requested tribes’ participation in a regular study of the Native labor force. In 2012, however, DOI determined the data collection methodology needed to be redesigned, rendering the 2010 data unusable.32 The last available DOI report on tribal employment is from 2005, meaning that existing data is quite outdated, particularly in light of post-recession unemployment. A Navajo lawyer inter-viewed about the survey explained, “when the govern-ment compiles reports detailing unemployment and work-force statistics for urban, suburban, and rural areas, those areas tend to get federal and state resources,” and added, “the impact seems to be that problems in Indian country are misunderstood and, as a result, the task of dealing with them gets shelved.”33 Tribal leaders and advocates have emphasized that reliable data is a key priority for Indian Country. Recommendations from a Federal Reserve convening with over 100 tribal representatives in 2011 observed that “participants expressed a strong desire for better Indian Country data and research . . . [to] support more thorough assessments of current programs and the development of sound policies and new programs.”34
While significant data and research challenges still remain, the federal government and individual tribes are already addressing these problems and working to improve data collection and analysis. For instance, the American Community Survey (ACS) administered by the U.S. Census Bureau now allows respondents to self-iden-tify as American Indian, Alaska Native, or Native Hawai-ian, and also gives respondents the opportunity to identi-fy their tribal affiliation (from a list of federally recognized tribes and Native villages). Such detailed data, publically available through the 2010 ACS Selected Population Tables, provides accessible information that tribes can use going forward in community planning for individual tribal nations.35
Many recent projects demonstrate that well-designed tribal-federal partnerships can tackle the complex problems facing modern Native communities
Special Focus: Com
munity D
evelopment in N
ative Com
munities

8 Community Investments, Fall 2013 – Volume 25, Number 2
Additionally, many tribes are taking steps to conduct their own research, independently or in partnership with government agencies or universities, by training tribal representatives in surveying techniques and research methodology, and developing culturally sensitive tech-niques and review procedures to responsibly obtain more accurate data on Native communities. Such an approach can help tribes to ensure that sensitive data is not released without their knowledge and is used ap-propriately by third parties, and also provides valuable tailored information on the specific issues about which individual tribes are most concerned.36 Some tribes, in-cluding the Cherokee, Chickasaw, Choctaw, Ho-Chunk, and Navajo Nations, have formed their own Institutional Review Boards (IRBs) to establish formal research review processes and acceptable practices within their commu-nities.37 Others, like the Passamaquoddy Tribe in Maine, have developed strict tribal protocols with regard to re-search. Such protocols may call for members of the tribe rather than outside researchers to conduct any interviews with research subjects, and may reserve the tribe’s right to protect confidentiality and to refuse any questions that it may find culturally inappropriate or overly inva-sive.38 These practices and many other newly emerging tribal research models help to provide accurate data on Native communities while still maintaining tribal control of sensitive information. They may also rebuild trust in the research process and a willingness to participate in research projects among Native community members.
Conclusion
The long history of damaging policy impacts, harsh living conditions, and underinvestment that Native com-munities have faced over two centuries leaves a legacy of formidable challenges and human costs that cannot be underestimated or quickly remedied. Yet Native Ameri-can tribes in the United States remain deeply dedicated to their people, their land, and their traditions, and are developing new partnerships and undertaking innova-tive initiatives to invest in their communities. The articles that follow in this issue of CI highlight a few of the many diverse projects that hundreds of tribes are taking on across the country. Framing their efforts with community-determined goals, and slowly reinventing their relation-ship with federal agencies and local partners through in-depth work and consultation, Native communities are not only restoring core traditional values to their ways of life, but also designing new paths forward to lift and support their people.
Photo credit: Bec Rollins

9Community Investments, Fall 2013 – Volume 25, Number 2
D espite decades of progress on community and economic development for Native Ameri-cans, many American Indian, Alaska Native, Native Hawaiian and Native Pacific Islanders
continue to trail behind the U.S. population as a whole, as well as most other racial and ethnic subgroups, on various socioeconomic indicators. These include homelessness, unemployment, educational attainment, poverty, and rates of home ownership. For example, in Alaska, huge dispari-ties exist between Alaska Natives and the rest of the state. The Alaska Native household median income is about two-thirds that of all Alaska households, and roughly 20 percent below the U.S. median of $50,046. The poverty
Investing in Community Driven Native American Social and Economic Development InitiativesBy Joshuah Marshall (Northern Arapahoe) and Michelle Sauve (Mohawk), Administration for Native Americans
rate among Alaska Natives is nearly twice as high as the overall state average of 9.5 percent. In terms of education, Alaska Natives have double the state high school dropout rate, and have a bachelor’s degree attainment rate of 10 percent, compared to 32 percent among white Alaskans.
To help address these long standing disparities and support Native American community development, the Administration for Native Americans (ANA) was estab-lished as a program office in the Department of Health and Human Services. ANA was created through the passage of the Native American Programs Act (NAPA) in 1975, which provided funding directly to Tribes and other American Indian community organizations.1
Photo credit: The Administration for Native Americans
Special Focus: Com
munity D
evelopment in N
ative Com
munities

10 Community Investments, Fall 2013 – Volume 25, Number 2
ANA’s mission is to support Native communities to be self-determining, healthy, culturally and linguistically vibrant, and economically self-sufficient. This philosophy of self-sufficiency is based on the following core beliefs:
• A Native community is self-sufficient when it can generate and control the resources necessary to meet its social and economic goals and the needs of its members;
• The responsibility for achieving self-sufficiency resides with native governing bodies and local leadership;
• And Progress towards self-sufficiency is based on efforts to plan and direct resources in a comprehensive manner consistent with long range goals.
ANA supports self-determination through three discre-tionary grant programs, a revolving loan fund to Native Hawaiians, and technical assistance and training. The three grant areas are Native American languages, envi-ronmental regulatory enhancement, and social and eco-nomic development strategies (SEDS).
Community economic development is primarily ad-dressed through the SEDS grants, which are based on the idea that Tribal governments should decide how to al-locate resources. The underlying rationale is that to in-crease social and economic development, there needs to be a foundation of self-governance to determine how to organize resources for self-sufficiency. Self-sufficiency in-creases with a holistic, community driven approach. Eco-nomic development will not succeed unless governance, organizational issues, and social conditions are addressed in concert. Key elements of this approach are: community involvement in the development of projects; accounting for community priorities, needs, and capacity from the beginning; and, keeping the community involved and in-formed throughout implementation.
Funding Process
Each year ANA receives four to five times the number of applicants it can fund. In our most recently completed funding competition, ANA received 78 SEDS applications that dealt primarily with economic development out of 256 total applications in this category. Of those applica-tions, 16 were funded from nine states and the District of Columbia. Applicants requested over $18 million in Year One funding, and ANA was able to award $3.6 million.
Although ANA’s funding cannot meet all of the need, grants are awarded on a competitive basis in order to fund community-designed and community-driven projects that have the best hope of reaching people and affecting sus-tainable change. ANA determines funding through a peer panel review process and federal review of applications.
Review panelists are experienced professionals who possess subject matter expertise and qualifications rel-Photo credit:
The Administration for Native Americans

11Community Investments, Fall 2013 – Volume 25, Number 2
evant to the program areas, and have direct experience working with the native communities and populations that ANA serves. Successful applicants attend post-award training to learn about managing an ANA grant and tips for project management. ANA program specialists then monitor the grant, suggesting technical assistance if grant-ees are not meeting their stated objectives, or if grantees request it.
Project Impact
ANA’s Division of Policy Planning and Evaluation (DPPE) conducts impact evaluation visits with one-third of its current grantees each year, amounting to approxi-mately 70 percent of all ending grants. Since 2009, the 71 economic development projects DPPE visited led to the creation of over 1,000 full-time employment (FTE) opportunities – an average of 15 FTE per project – and 343 new businesses. The projects generated $6.5 million in revenue, leveraged an additional $23.8 million in re-sources, and led to the formation of just over1,500 new partnerships.
Assessing the projects in action and returning with stories from the field is a major component of the visits, enabling the public to learn about important the work of the grantees. The following project provides an example of ANA funding in action in Alaska.
The Alaska Native Tribal Health Consortium (ANTHC)
With a grant funding from ANA, ANTHC, the nation’s largest tribal health organization, partnered with the Yukon-Kuskokwim Health Corporation (YKHC) and nine Yukon-Kuskokwim Delta area Yupik villages to pilot the Alaska Rural Utility Cooperative (ARUC). ARUC works to bring modern water and sewer systems to many of the 60-plus Alaska Native villages that have difficulty pro-viding safe drinking water and properly treating and dis-charging sewage waste due to a variety of issues, includ-ing limited cash economies and lack of infrastructure.
The purpose of the project was to develop cooperatives capable of facilitating the day-to-day operations of a state-wide network of local water and sewer utilities. Operat-ing with community buy-in, billing programs were imple-mented in member villages, and local operators became full-time ANTHC employees with benefits. Twenty-three villages were recruited, signed memoranda of agreement with ANTHC and joined the ARUC. Each village was re-quired to join the ARUC billing assistance program which enabled ANTHC managers to determine if a village was financially ready to participate fully in the program.
In each of the 23 villages, the ANTHC team oriented, trained, and hired village residents as water and sewer operators, creating 104 new jobs in these communities.
Utilizing these new staff members, ARUC took over day-to-day operation of the village’s water system and sewer systems, providing reliable water and sanitation services to 7,461 people in 1,988 households. Following the in-stallation and community-based operation of the im-proved water and sanitation system, community leaders have noticed improvements in public health.
Over the long term they expect to see lower infant mortality rates, fewer illnesses and deaths related to infectious diseases, and higher life expectancies in their villages. Several village councils are planning for new economic development opportunities, including hunting and fishing lodges, fish hatcheries, cultural and eco-tourism, oil contracts and construction. The project has had both an economic and emotional impact on people. They are confident they will get clean, potable water and reliable services, and that any problems with their systems can be fixed.
Funding Factors that Assist or Hinder Economic Development
ANA supports community-driven development, and knows that an economic development model that suc-ceeds in one community may not necessarily fit another community’s conditions. In light of this, rather than focus-ing on a specific sector (such as agriculture or the arts) or a single approach (job development or entrepreneurship) ANA funding is flexible and projects are locally designed. In a typical SEDS project, the grantee determines the out-comes they hope to achieve and defines how they will measure these outcomes.
ANA also completes a parallel analysis of the trends and outcomes of the various projects throughout the year. DPPE looks at challenges, best practices, participants and beneficiaries assisted, and realized impacts, among other factors. Analyzing the data collected on these economic development projects provides ANA with key information on factors that assist or hinder grantees.
While each project is unique, common challenges include late project starts; hiring delays; lack of expertise in the local community; geographic isolation and travel issues; staff turnover; infrastructure; and political turmoil
The most successful projects typically make a long-term commitment to sustainable economic development through microenterprise, skill development and local capacity building
Special Focus: Com
munity D
evelopment in N
ative Com
munities

12 Community Investments, Fall 2013 – Volume 25, Number 2
and tribal elections. Factors that assist in project success include strong and productive partnerships; substantial levels of leveraged resources; well-planned and deliber-ate objective work plans; and community involvement in developing, planning, and implementing the project.
Sustainable Employment and Economic Development Strategies
Data collected on ANA grantees’ economic devel-opment projects between 2006 and 2011 show that or-ganizations with the most successful projects typically make a long-term commitment to sustainable economic development programs through microenterprise, skill-development, and local capacity-building projects. These projects often stress job creation, business development, and business expansion that help to support the long-term economic and social well-being of Native Americans in their communities.
In 2013, ANA created a new funding opportunity, Sus-tainable Employment and Economic Development Strate-gies (SEEDS), dedicating $4.5 million in funding per year to new economic development grants. These grants have a specific focus on job creation and training, business de-velopment and incubation, and retaining capital within the community or reservation.
Each project has a ceiling of $500,000 and a maximum project length of five years. SEEDS projects must measure at least one of the following outcomes:
1. Full-time equivalent positions created. Grantees will provide information on the type of positions being created, the duration of each position, and the extent to which each position will be sustained beyond the project period. Grantees can include FTEs gained with partnering organizations or external entities if the in-creased staffing capacity is a direct result of the ANA project.
2. Native Americans employed. ANA will track the number and percentage of FTEs that are filled by Native Americans both during and beyond the project period.
3. Businesses developed. ANA will collect data re-garding businesses that are created during the project period, as well as any businesses that are substantively expanded as a result of project activities.
4. Revenues generated. For projects anticipating rev-enues (for example, through the creation of a tribally owned business), an ongoing tally of revenues will be tracked.
5. Percentage of revenues retained within the com-munity being served. The mechanism for tracking this outcome will be project-specific, but all revenues generated from the completion of project activities should be monitored with regard to the percentage that gets reinvested in the community being served.
By collecting the same data across the funded SEEDS projects, ANA will be able to track the results of these projects as a group. In addition to tracking common outcome elements, ANA will be assisting these grantees with enhanced technical assistance opportunities, peer learning, and guidance and support in obtaining resources and support from other federal agencies. ANA plans to compare the success of SEEDS grantees with economic development projects that are funded under SEDS to de-termine if the changes to the funding make a difference in community outcomes. Where possible, ANA will also look at past projects that were similar in design or in the same community to determine whether the enhanced supports will generate better outcomes. ANA plans to share its find-ings with other federal agencies and Native communities.
ANA is a key federal supporter of Native control over the development of Native communities, a goal it serves through grant funding, capacity building, training, and technical assistance. The success of Native communi-ties depends on the preservation of Native language and culture and a community-driven approach to economic development. By supporting the wide range of creative energies in Indian Country to bring about sustainable eco-nomic development, ANA is working toward achieving its vision of thriving Native communities.

13Community Investments, Fall 2013 – Volume 25, Number 2
Native American tribes have long faced chal-lenges in providing safe, decent, and afford-able housing for tribal members.1 A study con-ducted by the U.S. Department of Housing
and Urban Development (HUD) in 1996 found that 40 percent of Native Americans lived in physically deficient or overcrowded housing as compared with 6 percent of the U.S. population. HUD has partnered with Native American communities since the Department’s creation in 1965 and Federal monies still fund the majority of housing
Building Green and Respecting Native American Identity: Housing, Culture, and Sustainability in Native American CommunitiesBy Mike Blanford, HUD Office of Policy Development and Research; Brian Gillen, HUD Office of Public and Indian Housing; Lynda Lantz, FirstPic, Inc.; Robert Pyatt, University of Colorado Boulder; and Jamie Blosser, Sustainable Native Communities Collaborative
built or rehabilitated in Indian Country today. This is due in part to the special relationship of tribes and the Federal Government, but is also related to the extreme housing need, poverty, and continued under representation of private financial capital in tribal communities. HUD’s Office of Policy Development and Research (PD&R) is cur-rently conducting an assessment of housing needs in tribal communities that will gauge the progress being made in alleviating deficient or overcrowded housing conditions, and will help identify locations that are in greatest need of
The Port Gamble S’Klallam Tribal Housing Authority designed and built Teekalet Village adjacent to key historic salmon fishing grounds on the Puget Sound
Photo credit: Nathaniel Corum
Special Focus: Com
munity D
evelopment in N
ative Com
munities

14 Community Investments, Fall 2013 – Volume 25, Number 2
targeted assistance. In addition, HUD is actively engaged in a number of initiatives aimed at improving conditions on the ground in Native American communities through-out the U.S.
One such effort is Sustainable Construction in Indian Country (SCinIC), a joint effort of PD&R and HUD’s Office of Native American Programs (ONAP). The initia-tive seeks to promote and support sustainable construc-tion in Native communities through demonstration, train-ing, and dissemination of best practices and program results. HUD launched SCinIC in response to a fiscal year 2010 Congressional appropriation and the program builds on previous work by HUD and other intermedi-aries that focused on sustainable construction in Indian Country, specifically techniques and technologies that make homes more energy efficient and healthy while re-specting Native American cultural heritage. Issues of sus-tainability are particularly relevant in Indian Country as tribes may already face high fuel costs because of their remote locations, a challenge which is exacerbated by volatile fuel prices.
Background
Changes in the way that the Federal government funds tribes under the Native American Housing and Self De-termination Act of 1996 have opened the door for tribes to explore development of affordable housing that is both more culturally adapted and more sustainable (defined in terms of durability, environmental impact, and energy efficiency). Many tribes are adapting sustainable design and construction practices to meet the housing needs of 21st century tribal life; however, there are barriers which slow the scale of adoption. At the beginning of the ini-tiative, to help guide training and technical assistance (TA), SCinIC hosted focus group discussions examining impediments to the acceptance of sustainable construc-tion practices by tribes or tribal housing entities. Focus group representatives identified four key impediments, discussed below.
Building codes
Communities and states develop building codes to protect health and safety and to show commitment to particular issues, including green building. As sovereign nations, tribes also possess the power to adopt existing green building codes and standards or to create their own, but many tribes currently do not have such codes in place and are just beginning to develop them. For instance, the Navajo Housing Authority, a SCinIC participant, is working to create culturally relevant green building stan-dards, but has faced delays due to pressing housing need and internal issues.
Costs/Funding
The perceived cost of sustainable construction can be an impediment, as higher costs are often realized upfront, with potential savings from improved health, energy con-servation, and more durable housing realized later in the life of the building. However, some sustainable construc-tion technologies do not impose additional upfront costs. Education can change perspectives and life cycle assess-ments, and benefit analyses can provide tools to deter-mine the technologies that provide the greatest return on investment. SCinIC is providing such assessments as technical assistance (TA) to the Akwesasne Housing Au-thority of the St. Regis Mohawk Tribe and Cocopah Indian Housing and Development.
Capacity Building
Tribal housing authorities may have difficulty build-ing and/or maintaining capacity for a variety of reasons. For example, changes in key personnel because of tribal council elections or decreases in Federal funds may have enormous impacts on capacity. Smaller tribes may lack the staffing to develop sufficient housing to keep pace with community need. Repeated training, onsite TA, and partnerships with other organizations are ways to build lasting organizational capacity; SCinIC implemented all of these methods to strengthen tribal communities.
Planning
There are times when Federal funds suddenly become available, creating opportunities for tribes to plan projects. However, such unpredictability can lead to a mismatch in community need and available resources, such as land, staff time, housing, or funds. Long-term master planning can help rebalance that mismatch, ease the flow of devel-opment, avoid costly delays, and support a tribe’s overall goals. For example, the Pokagon Band of Potawatomi In-dian’s master plan addresses the tribe’s long-term housing and self-sufficiency goals. It also emphasizes their com-mitment to protect the watershed through environmentally friendly water conservation and management. The Ohkay Owingeh Pueblo has a master plan that both revitalizes and protects community within the historic Pueblo core.
SCinIC has funded projects with university, nonprofit, and for-profit entities whose activities focus on different ways of supporting sustainable construction in Indian Country and breaking down some of these barriers. These activities include offering opportunities for Native and non-native young people to participate in sustainable housing development in Native American communities, providing partnership development and TA to tribes de-veloping housing, and creating case studies to highlight best practices.

15Community Investments, Fall 2013 – Volume 25, Number 2
Service Learning Partnership
Over the past few years, students and faculty from the University of Colorado Boulder (CU) Program in En-vironmental Design have traveled to South Dakota to collaborate with students and faculty from the Oglala Lakota College and the South Dakota School of Mines and Technology to research and design four energy-efficient homes. Each prototype house will be built using differ-ent materials and construction methods and will lay the foundation for training the next generation of sustainable construction professionals.
“Designing for People and Place: Sustainable & Af-fordable Housing for the Pine Ridge Indian Reservation” is a service-learning program through CU’s Native American Sustainable Housing Initiative, funded through SCinIC. By providing a unique experiential learning opportunity for students to work on a community-based sustainable housing research project, Designing for People and Place is an example of CU’s commitment to community en-gagement and aligns with CU’s Flagship 2030 Initiative, reflecting “a strong commitment to serving the needs of Colorado while simultaneously becoming a global pres-ence in education and discovery for the benefit of the larger world.”
Cultural Understanding Integrated
This interdisciplinary team of students and faculty, working with the Pine Ridge community, integrated the Lakota culture’s deep respect for the natural environment and sustainability into the design process through a series of community-based focus groups and design workshops held both on Pine Ridge and at the CU campus. This approach to collaborative planning is seen throughout various SCinIC-funded efforts. One example of culturally sensitive design is the use of frost-protected shallow slab foundations to connect the housing to the land—a new technology for the community that is both affordable, energy efficient, and closer to the natural grade. The units are 100 percent compliant with the Americans with Dis-abilities Act (ADA), which addresses the Lakota emphasis on resilience and kinship of extended family by support-ing access for elders. Unlike many non-Native construc-tion projects, each day of construction included Lakota ceremonies and prayers intended to allow team members to become more present with themselves and their team.
Net-Zero Energy Strategy
The team designed the four homes with an emphasis on energy efficiency to demonstrate sustainable alterna-tives to the current conventional wood-frame houses found across Pine Ridge. The homes are designed to be net-zero energy – producing more energy over the course
of a year than they use – and include cost-effective passive strategies like natural ventilation and passive solar ori-entation in addition to a combination of active renew-able energy systems like photovoltaic panels (PV), solar thermal hot water and wind turbines. All four homes were designed using the Leadership in Energy and Environmen-tal Design (LEED) for Homes rating system criteria. The homes produce 20 percent more energy than they use.
Short and Long-Term Goals of the Service Learning Partnership
The first alternative home being built this year will use straw-bale construction. The three additional homes will be built using structural insulated panels, which are wall or roof panels composed of an insulating core sandwiched by two structural boards; an optimized wood-frame that increases stud placement and eliminates extraneous wood not needed for load bearing; and compressed earth block. The project will collect life-cycle costs and compare the durability of the materials over time. In addition, in-house energy-monitoring sensors will collect real-time climate data and energy usage from the residents. Existing conven-tional wood-frame houses and mobile homes common on Pine Ridge will provide the baseline for comparison re-search of the four prototypes.
The Kikunol multifamily housing project honors shapes and symbols important to the Passamaquoddy tribe in Pleasant Point, Maine.
Photo credit: Design Group Collaboration
Special Focus: Com
munity D
evelopment in N
ative Com
munities

16 Community Investments, Fall 2013 – Volume 25, Number 2
A key objective of the project will be to develop a com-prehensive case study to help inform the future housing choices for community organizations such as the Thunder Valley Community Development Corporation and the Oglala Sioux (Lakota) Housing Authority. The project will also establish an applied research laboratory to educate students of the three partnering educational institutions in the design and construction of sustainable, affordable, culturally adapted, and regionally appropriate housing for Pine Ridge. The research findings will be published in an academic paper, presented at future academic confer-ences, and shared with the community through an open access website.
Future research opportunities identified include data monitoring; analysis of patterns of energy use by occu-pants and links between energy-use patterns and occu-pant behavior; as well as improved energy-modeling ca-pabilities, web-based tools, and innovative systems for construction to accommodate the unique conditions and challenges specific to Pine Ridge.
Technical Assistance Under SCinIC
HUD selected supportive TA as one vehicle for nur-turing the use of sustainable technologies under SCinIC. HUD specifically structured the TA to supplement the se-lected projects. This stipulation ensured ownership of the project by the community, supported capacity building within the tribe’s project team, and allowed the project team to continue work once SCinIC TA ended.
The nine demonstration projects represented diverse climate regions and locations, housing types, and sustain-able technologies. They were located in Alaska, Oklaho-ma, Michigan, New York, Arizona, Idaho, and Mississippi. Projects could either be planned or already completed. To support program success, HUD also considered the status of construction funding and tribal leadership’s support for the project.
The remote Native Village of Kwinhagak on Alaska’s western coast sought TA to combat the effects of wet and windy weather on its housing and high fuel costs. One-third of the community’s 160 housing units need to be replaced. When bad weather causes fuel to run out faster than anticipated, the cost of barging in additional fuel pushes prices well above the normal level of $7 to $8 a gallon. SCinIC team members in the Cold Climate Housing Research Center worked with Kwinhagak to adapt two designs. One design is an octagon shape that resembles traditional rounded sod houses, which decreas-es the buildup of snow around houses. The housing wall design includes a continuous layer of soy-foam insula-tion to decrease air leakage. The prototype of the octagon house has been measured as 80 percent more energy ef-ficient than the current housing stock.
Technical Assistance ProvidedThe SCinIC team worked with the demonstration site
project staff to determine TA requirements. The tribes or tribally designated housing entities with completed proj-ects primarily requested post construction-related TA. This included energy assessments that test current energy usage and project future usage, as well as blower door testing to reveal air leakage results.
The planned construction or rehabilitation projects primarily requested assistance in making their housing or site plans more energy efficient. This included design review (changes to site plans and housing orientation) and recommendations of regionally appropriate sustain-able materials, products, and technologies, which often included computer-based energy modeling that simulates energy usage. For the Nez Perce Tribal Housing Authority in Idaho, energy modeling comparing cost and usage of heating and energy technology options helped the housing authority decide to pursue a straw-bale design, but not to include solar technologies at this time. In Arizona, Cocopah Indian Housing and Development, which was budgeting to begin making efficiency upgrades, received TA to link up with its utility provider to access incentive programs. These programs provided 60 faucet aerators, 38 low-flow showerheads, and 360 CFLs at no cost.
Effect of Technical AssistanceThe energy modeling and post-construction testing
provided communities with baseline assessments of energy usage against which to measure and compare data as the housing ages. The TA included potential or esti-mated payback and other cost-effectiveness information on products or materials that communities can compare against the real-world costs or longevity of their own in-stalled technologies. Similarly, communities planning future projects can use the recommendations to determine how to invest the upfront dollars for a cost-effective return.
All demonstration projects consisting of planned proj-ects received TA, but not all reached their anticipated construction goals during the two-year contract period. Reasons for delays included the need for additional TA, scaling back because of lack of anticipated funding, or the need to pursue additional funding for added sustainable elements or additional specialists because of lack of local capacity. Additionally, some demonstration projects faced other challenges such as having to learn to work with new techniques or equipment, weather or archeological delays, or internal politics.
Current Best Practices
It is important to acknowledge the innovative and impactful work being accomplished by American Indian communities around the country. In this vein, the Sus-

17Community Investments, Fall 2013 – Volume 25, Number 2
tainable Native Communities Collaborative, an initia-tive of Enterprise Community Partners, completed its Case Studies 2013 project, with funding provided in part through SCinIC. The Case Studies documented exempla-ry tribal housing projects all over the country that took a comprehensive approach to design and construction which could be replicated in other communities. The 17 projects featured represent an emerging trend of sustain-able building practices that promise to transform tribal housing projects while preserving their communities’ cul-tural heritage. Best practices from this work show a focus on good design and site planning, successful collabora-tions and partnerships, community engagement, and in-novative financing and construction techniques.
Community-Specific Housing
Many project teams opened a dialogue with the com-munity to discuss specific family, cultural, and heritage needs in order to ensure that the homes were built to meet the goals of their community and geography. For example, the Place of Hidden Waters project is an updated version of the traditional Coastal Salish longhouse characteristic of the Pacific Northwest, and the Guadalupe and Nageezi demonstration homes adopt the adobe-style construction and massing typical of traditional desert homes in the Southwest. Thoughtful site planning, as practiced in the Place of Hidden Waters, Teekalet Village, and Penobscot LEED Homes, can help protect and celebrate the natural habitats central to Native American tribes’ heritage and ways of life. Access to healthy food is an important aspect of site planning, and the Place of Hidden Waters is reaping the rewards of onsite community gardens.
Creative Approaches
Building sustainable and healthy communities re-quires innovative thinking, and many of the project teams demonstrated creative approaches to developing partner-ships, technologies, research, and financing. The Apsaa-looke (Crow) Tribe partnered with the University of Colo-rado at Boulder to develop an earth block house built by a tribal workforce. The Pinoleville Pomo Nation collabo-rated with many partners to develop a prototype home and tribally based building codes. Straw-bale homes at Northern Cheyenne in Montana are part of a larger Red Feather Development Group initiative to build super-in-sulated housing using all-volunteer crews. The Ysleta del Sur Pueblo was the first tribal housing project in Texas to take advantage of low-income housing tax credits, which required considerable partnership building and tenacity.
Comprehensive Approaches
All of the projects take comprehensive approaches to green building, including connections to long-term plan-ning initiatives. In most cases, cultural and economic sustainability were as important as environmental sustain-ability. Tribal enterprise and employment are crucial to economic sustainability, and many projects incorporated locally-produced or traditional materials such as Navajo FlexCrete (a solid fiber reinforced aerated fly-ash concrete material), earth, straw bales, and SIPs. The project team for Kumuhau Subdivision modified the AirScape whole house fan, which provides an air circulation system in place of air conditioning, to produce a quieter ventilation system called the Kohilo fan. The Navajo Housing Authority’s Sustainable Community Planning Manuals were designed to improve the development of more than 34,000 new homes, and more than half the homes in the sacred and cultural core of Ohkay Owingeh have been rehabilitated by tribal members who relearned the traditional method of building with adobe and mud plaster.
Several projects have been catalysts for other com-munity revitalization projects, and many are considered national and regional models. The Place of Hidden Waters and Owe’neh Bupingeh are recipients of the international Social Economic Environmental Design award as well as other national awards for design, planning, and green building. Devine Legacy on Central was the first mixed-income, transit-oriented development built along the light rail line in Phoenix, Arizona.
Conclusion
HUD’s SCinIC initiative has used multiple approaches to demonstrate high-quality sustainable housing in tribal communities and assist tribes in overcoming some of the continuing obstacles to implementing sustainable con-struction practices and technologies. Approaches that emphasized collaborative planning emerged as a particu-larly promising strategy for developing internal capacity, community ownership, acceptance of sustainable tech-nologies, and a unique expression of cultural vision in housing. The collaboration continued from community workshops through master planning processes and the de-velopment of full-fledged integrated designs. Through the dissemination of these best practices and research results, more tribal communities will be able to create their own culturally appropriate and environmentally responsible housing – providing hope and strength in sometimes des-perate conditions.
Special Focus: Com
munity D
evelopment in N
ative Com
munities

18 Community Investments, Fall 2013 – Volume 25, Number 2
“Instead of waiting for Washington, many of our cities have already become their own laboratories for change, some leading the world in coming up with innovative new ways to solve the problems of our time.” —President Barack Obama1
C ontrary to common perceptions, the vast ma-jority of American Indians and Alaska Natives (AI/AN) live in cities, not on reservations. To meet their urgent needs, organizations serving
AI/ANs in metropolitan areas are working to exemplify the pursuit noted in President Obama’s statement by de-veloping innovative and holistic models for solving the current challenges that AI/AN peoples face in urban areas despite a significant lack of resources. These groups put
Making the Invisible Visible:Urban Indian Community Development By Janeen Comenote (Quinault), National Urban Indian Family Coalition; and Megan Bang (Ojibwe), University of Washington
considerable heart, persistence and ingenuity into devel-oping programs that have measurable positive impacts on their constituencies’ quality of life. This article provides some background and context on the particular challeng-es faced by AI/AN peoples in urban areas, and presents four key areas for support and community development in urban Indian communities: education, housing, health and wellness, and economic development and employ-ment. We conclude with a profile of a community that has developed a remarkable model for tackling these issues that may be replicable in other communities.
Urban American Indians and Alaska Natives: An Overview
In 2010, according to the U.S. Census Bureau, 5.2
Groundbreaking for Kah San Chako Haws multifamily affordable housing development in Portland, Oregon
Photo credit: Native American Youth and Family Center

19Community Investments, Fall 2013 – Volume 25, Number 2
million people in the United States identified as American Indian and Alaska Native, either alone or in combination with one or more other races. Within the AI/AN popula-tion, there are essentially two subcategories: the on-reser-vation population, governed by tribal governments; and the off-reservation population, serviced by off reservation or “urban Indian” organizations. Fully 78 percent of all AI/ANs live off-reservation, and the majority of these AI/ANs live in cities.2 This group is often very migratory, moving back and forth between the city and reservation. As we define it, the urban AI/AN community encompasses any and all self-identified or Tribally-enrolled American Indian or Alaskan Native people who are residents of a local met-ropolitan community and do not live on a reservation. In many urban centers the AI/AN population can represent hundreds of federally recognized Tribes and Bands. These factors make it difficult for urban Indians to have a collec-tive national voice and as such, they are often invisible to policy makers focused on urban communities.
An important point to note is that many resources and services available to Native families living on reservations or tribal territories are not accessible to Native peoples in urban areas. In place of those resources, urban Indian social service organizations provide essential cultural and social services to Native people living in the cities. Many of the urban Indian organizations currently in operation were established to support families brought to urban areas by the Federal Relocation Program of the 1950s, and provide the means for Native American families to adjust to a new way of life in a much different environment than reservations and tribal homelands. Many urban Indian centers are located in key geographies that were once thriving homelands for tribal communities, and many communities are acknowledging and drawing strength from this fact. Most importantly, since their inception, urban Indian centers have proven a bastion of cultural life for many urban Indians, and have been the focal point for Native families in maintaining their values, traditions, and communal ties to one other. In essence, the centers have provided a place for this geographically disparate popula-tion to gather and call “home.”
Understanding the Unique Circumstances of Urban American Indians and Alaska Natives
The circumstances of AI/ANs bear some resemblance to other urban communities of color and on-reservation populations, but also carry some unique characteristics and challenges. AI/AN populations, including those who now live in urban communities, have a specific socio-his-torical relationship and status in the United States unlike any other group, and struggle to maintain their unique cultural traditions and values, especially in off-reservation
contexts. Urban Indian populations must deal with the effects of significant inter-generational trauma and poverty, and those who find themselves at the bottom of the eco-nomic ladder often struggle in isolation. This is because unlike many other minority populations in the U.S., urban American Indians are rarely found residentially clustered. Instead, AI/ANs are widely dispersed throughout metro-politan areas, and are often quite mobile. This lack of geo-graphic connectivity intensifies urban AI/ANs’ invisibility. Because AI/ANs are both a small minority of the popu-lation and geographically dispersed, larger institutions serving low-income populations often do not prioritize the development of appropriate and effective services for Native peoples, leaving small and often-underfunded AI/AN organizations to meet diverse needs across very large geographic areas. This is a serious challenge, as popula-tion dispersion can can make outreach and service pro-vision prohibitively expensive for community-based or-ganizations. By the same token, the lack of widespread community infrastructure for Native populations means that AI/AN populations often have to travel great distances to obtain culturally relevant services, increasing the costs and stressors of urban life.
Targeted public and private investments will be re-quired to build the capacity of Native-serving organi-zations and to holistically improve conditions for urban Indians. In addition, efforts to improve outcomes will need to be strategic and multi-dimensional. The National Urban Indian Family Coalition has identified four core dimensions of community development around which urban Indian organizations should focus to address criti-cal needs in urban Native communities. Below, we discuss these areas of concern in greater detail.
Education
In 2010, 39 percent of Native children under the age of 5 lived in poverty, nearly twice the rate for U.S. chil-dren on the whole. It is widely recognized that poverty poses a serious challenge to children’s access to quality learning opportunities and their potential to succeed in school. The urban AI/AN community’s experience reflects a growing body of research indicating that parents of very young children who live below the poverty line often do
Urban Indian centers have proven a bastion of cultural life, and been the focal point for Native families in maintaining their values, traditions, and communal ties to one another
Special Focus: Com
munity D
evelopment in N
ative Com
munities

20 Community Investments, Fall 2013 – Volume 25, Number 2
not have the tools and resources needed to support cog-nitive growth and school readiness. As a result, children in these families start well behind their peers even in the earliest grades, and suffer from underachievement as this disparity continues to widen with each additional school year. The effects of these disparities are not just limited to schoolgrounds, as statistics show that less than half of the Native students in the public school system graduate from high school, thus limiting economic opportunity across the lifespan.2
Housing
The lack of affordable housing is a significant hardship for low income households preventing them from meeting their other basic needs such as nutrition and healthcare, or saving for their future and that of their families. While this holds true for all disadvantaged communities in the United States, it is particularly glaring for American Indian and Alaska Native communities, considering the federal government’s legal and trust responsibility to provide ad-equate housing for Native people.
Some of the housing-related statistics are particularly striking. In AI/AN communities, 8.1 percent of homes are overcrowded, compared to 3.1 percent of homes among the general U.S. population. In 2012, AI/ANs had a denial rate for conventional home purchase loans of 36 percent, compared with a rate of 15 percent for Caucasians.4 Ad-ditionaly, nearly every city represented in the National Urban Indian Family Coalition reports a disproportionate number of Natives in shelter care but very few transitional housing projects serving the Native community.
These statistics paint a clear picture of the need for expansion of housing programs specifically oriented to AI/AN households. This situation also reflects a need for capacity building in the Native non-profit sector, and for tribal governments to participate in the development of collaborative national strategies to address housing poli-cies and practices targeted for urban AI/AN populations.
Health & Wellness
AI/ANs face disproportionately high risks and rates of disease across many conditions. For instance, American Indian/Native Alaskan children aged two to five years old
show the highest rates of childhood obesity among young Americans, and the disease is twice as common in AI/AN children as it is in non-Hispanic white or Asian children.5 To help reverse these health challenges, urban Indian or-ganizations can and should spur action in the areas of health, wellness, nutrition and physical activity.
Economic Development and Employment
Already grappling with historically high rates of un-employment, American Indians living on and off reser-vations are seeing even higher rates due to the country’s recent economic downturn. According to a new survey6, in the last half of 2007, just before the economy began its downward spiral, unemployment averaged 7.8 percent for Native Americans. In the first half of 2009, it had climbed to 13.6 percent, well above the national rate. That average that masks even sharper differences in various regions of the country; the western region, encompassing Hawaii, California, Oregon and Washington, went from lowest to highest unemployment among American Indians, soaring from 6.4 percent to 18.7 percent in the same time period. Many factors stemming from inter-generational poverty create artificial ceilings on community members’ poten-tial career advancement, or may even impede individuals’ ability to work at all. These issues, which include locating and paying providers for child and/or elder care; securing a stable housing situation; and addressing health, includ-ing mental health and substance abuse; must be addressed for any education or job training program to be successful.
Despite these stark statistics, many urban Indian or-ganizations are developing effective initiatives to help improve conditions for AI/AN households in their cities. We describe one organization’s successful efforts below.
A Successful Example: The Native American Youth and Family Center (NAYA), Portland, Oregon
NAYA Family Center in Portland, Oregon works to enrich the lives of Native youth and families through edu-cation, community involvement, and culturally specific programming. Since its founding nearly 40 years ago, it has grown from a small-scale social service agency to a comprehensive community development organization, with an $8 million annual operating budget and over 100 full time staff members. NAYA’s main areas of focus are youth services (cultural, arts, recreation), youth develop-ment (education), family services (domestic violence pre-vention, child welfare, and Elder care), housing (stability, homeownership, and rent assistance), finance (individual development accounts), and economic development (mi-crolending, social enterprise and housing and commercial community development).
Nearly every city represented in the NUIFC reports a disproportionate number of Natives in shelter care but very few transitional housing projects serving the Native community

21Community Investments, Fall 2013 – Volume 25, Number 2
Assets: Strategic Relations and Partnerships
NAYA has developed a multi-tiered network of re-lations and partnerships, significantly improving their ability to develop effective and sustainable programs and services. NAYA has a healthy funding portfolio, and has established important relationships with grant-making in-stitutions, local government, and other community-based organizations. In addition, they are closely connected to other communities of color, forming two collaborative networking groups that work across Portland: the Housing Organizations of Color Coalition and the Coalition of Communities of Color. The development of strategic and respectful relationships across the broad range of sectors in urban centers has been central to NAYA’s success.
Notable NAYA Accomplishments
• Community and Economic Development: NAYA has worked with more than 100 first-time homebuy-ers as well as homeowners in need of refinancing. Since 2008, the organization has created 53 units of housing, and worked with HUD’s Sustainable Com-munities program on building green housing. NAYA planned, financed, and constructed Kah San Chako Haws (meaning “East House” in Chinook), a LEED Gold-certified modular housing site that was recent-ly named the Building of the Week by the Modular Building Institute. The multifamily, affordable housing units were constructed in five months and installed in just three days. Over the last three fiscal years, NAYA has offered nearly 20,000 hours of service in programs such as Rent Well, small business classes, direct assis-tance for utilities, microlending, and individual devel-opment accounts, among other CED efforts.
• Social enterprise: NAYA Construction is a work ex-perience and training program which introduces par-ticipants to the construction trades, then puts them to work maintaining NAYA properties. The program is currently developing an in-house general contractor service. NAYA Kitchen and Nawitka Catering is a com-
mercial-grade kitchen that provides nutritious meals to students, Elders, staff and community members, and provides contract catering services for events.
• Education: In response to disastrous graduation rates, NAYA runs a private, state-accredited high school, and offers youth advocacy programming to guide students to better educational outcomes, along with summer school programming for younger children. NAYA has worked with the public schools to co-develop an Early Learning Center.
• Community Investment: NAYA’s ten acre campus acts as an educational center, community hub, and gath-ering place for the Portland Native American com-munity. NAYA is one of the largest employers in the neighborhood and to date has invested more than $70 million in programming and assets back into the community.
• Cultural Development: Portland Youth and Elders Council serves to unite the generations with cultur-al programming, providing education in traditional culture and values.
Conclusion
As exemplified here, NAYA has achieved key accom-plishments in the four core community development areas discussed earlier in this article. Their remarkable progress demonstrates that with appropriate and strategic invest-ments in these core areas, significant progress can be made to assist and elevate urban AI/AN communities. In a wide variety of cities, urban Indian service organizations like these often serve as “tribal embassies,” providing not just transformative social and economic services, but also a sense of home and cultural identity for the millions of Native people living in urban areas across the United States. Despite scarce resources, these organizations bring together AI/AN communities that might otherwise be lost in urban communities, enriching their lives through com-munity connection and empowerment.
Special Focus: Com
munity D
evelopment in N
ative Com
munities

22 Community Investments, Fall 2013 – Volume 25, Number 2
Introduction
In recent decades, American Indian/Alaska Native (AI/AN) communities have experienced a dramatic epi-demic of cardiovascular disease,1 with rates nearly twice as high as the overall US population.2 These
alarming trends in heart disease are linked disproportion-ately to high rates of obesity, high blood pressure, high cholesterol, and diabetes among AI/AN populations.3
Community Outreach and Patient Empowerment: A Collaborative Initiative for Chronic Disease Management in Navajo NationBy Mae Gilene Begay (Navajo), Navajo Nation Community Health Representative Outreach Program; Rebecca Hutchinson, Lankenau Medical Center; Maricruz Merino, Gallup Indian Medical Center, Sara Selig, Brigham and Women’s Hospital; and Hannah Sehn, Jamy Malone (Navajo), Christine Hamann, and Sonya Shin, COPE Project
Most tribal members are keenly aware that these health disparities are closely linked to the social and economic challenges that their communities face. For instance, in Navajo Nation—the largest federally-recognized tribal nation—over one-third of residents live below the federal poverty line, one-third of the homes lack plumbing, and two-thirds do not have telephone service. Such conditions
A Navajo Nation Community Health Representative meets with a client
Photo credit: Bec Rollins

23Community Investments, Fall 2013 – Volume 25, Number 2
have led to lifestyle changes in traditional communities, with a rise in low nutritional value diets and sedentary lifestyles. Many individuals living on the Navajo reserva-tion also struggle to receive regular healthcare services, due to lack of transportation, vast travel distances, and chronic understaffing at health facilities.4 Furthermore, patients face barriers to cross-cultural communication with their Indian Health Service (IHS) providers.5 Health education is often weak, with a lack of patient educational materials appropriate to AI/AN populations.6
It is important to note that most healthcare delivery systems (including the IHS) operate under the assumption that individuals are able to engage in healthcare services and make behavior changes if they are sufficiently knowl-edgeable and motivated about their health. However, for many AI/AN individuals, barriers to health services and self-management are rooted in larger structural (social, eco-nomic, and geographic) challenges that are difficult to over-come, even for the most knowledgeable and motivated.
To help individuals overcome these structural bar-riers to health, the Navajo Nation Community Health Representative (CHR) Outreach Program employs tribal outreach workers to provide home-based support to high-risk clients, including elders and clients living with un-controlled chronic diseases. The Navajo Nation is one of more than 250 tribes in the United States that operates a CHR program, supported by federal funding provided through the IHS. Established in 1968 with a mission to improve the general health status of the AI/AN people through direct home health care, community, and patient-centered health promotion, the CHR Program provides an important additional level of support to high-risk indi-viduals who might otherwise not be able to improve their health on their own. A unique strength of this program is that CHRs are members of the communities that they serve. Thus, they are able to understand, advocate, and respond to the needs and wishes of the community in a way that other health providers cannot. All CHRs speak Navajo and are members of the clan network within their communities, and therefore share strong bonds of trust, respect, and culture with their clients.
Despite all of these assets, CHR programs are often un-derfunded and have limited ability to work closely with provider teams at health facilities. Seeking to strengthen the CHR Program through technical assistance, the Community Outreach and Patient Empowerment (COPE) Program was established as a formal collaboration among the Navajo Nation CHR Program (NNCHR), Navajo Area Indian Health Services (NAIHS), Brigham and Women’s Hospital (BWH) and Partners In Health (PIH) in Boston, MA. The COPE Project began as a series of discussions and needs assess-ments from 2008 to 2009, and was formally established in May of 2010. Initial activities focused on two service units
(healthcare service regions). Based on positive feedback and encouraging preliminary data, the program has expanded to eight units throughout Navajo Nation. As a model of cross-institutional collaboration, the COPE Project highlights how community health workers (CHWs) can effectively integrate into formal healthcare service delivery.
The COPE Program
The objectives of COPE are to provide the CHRs with the training, support and resources necessary to enhance their ability to promote the health of community members living in Navajo Nation and other AI/AN communities; to improve the overall health of high-risk AI/ANs living with poorly-controlled chronic conditions; and to prevent chronic conditions among at-risk individuals in these communities. COPE activities are focused in three areas: CHR training, health promotion materials, and a team-based approach.
CHR training focuses on health promotion and ap-proaches to behavior change such as motivational in-terviewing and goal setting. Training includes role-play exercises and periodic competency assessments. Health promotion materials for high-risk patients consist of struc-tured, home-based sessions delivered by CHRs over the course of 12 to 18 months. Teaching aids have been de-veloped for low-literacy, non-English speaking popula-tions. COPE’s team-based approach allows for increased coordination between clinic- and community-based teams, more effective CHR supervision, and comprehen-sive evaluation. Models for referral, communication, and CHR documentation within electronic health records are explored at each facility. Here, we describe the program design, implementation challenges, and lessons learned.
Program Design The design and implementation of COPE activities has
been informed by iterative feedback from stakeholders - including program leaders, CHRs, supervisors, providers, educators, and clients - to ensure that the program design truly meets the needs of CHRs and their communities.
CHR Training
A strong understanding of core health worker compe-tencies is essential to CHRs’ effectiveness as public health leaders in their communities. In Navajo Nation, CHRs are trained as Certified Nursing Assistants and First Re-sponders; many are working toward a Certificate in Public Health. CHRs receive monthly training on specific health topics, such as diabetes, blood pressure, nutrition, and medication adherence, taught whenever possible by bi-lingual providers and educators to ensure that CHRs can explain complex medical concepts in English and Navajo. Training lasts approximately two hours and includes in-
Special Focus: Com
munity D
evelopment in N
ative Com
munities

24 Community Investments, Fall 2013 – Volume 25, Number 2
teractive exercises such as role-play. CHRs also complete competency assessments before and after each session, and receive their graded assessments with an answer key. CHRs who do not pass receive additional training until they obtain a passing grade. CHRs also receive reinforce-ment training on frequently-missed questions as well as trainer feedback.
However, CHRs in COPE expressed the need for ad-ditional training on health issues commonly affecting their community, such as diabetes, high blood pressure, cancer, dementia, and caregiver support. Likewise, providers voiced the concern that education provided to patients by outreach workers, such as CHRs, should be harmonized across clinic- and community-based health educators.
Training in behavior change develops the counseling skills of CHRs in the areas of patient goal setting, harm reduction, and motivational interviewing (MI). MI is a cornerstone of COPE’s training to CHRs, as this counsel-ing method has been shown to effectively bring about behavior change among clients across a broad spectrum of chronic health conditions. MI focuses on “meeting the client where they are,” using non-judgmental dialogue (such as open-ended questions, affirmations, and reflec-tions) to elicit the client’s own feelings about their health rather than telling the client what they should do. COPE is currently using a “Train the Trainer” model to build local capacity in MI and health promotion topics among Nava-jo-speaking CHR trainers. In this model, all MI trainings are led by Navajo trainers and framed within the Navajo cultural perspective. This culturally-attuned system in-cludes such techniques as acknowledging traditional customs that are consistent with MI (e.g. listening to a client quietly, respecting an elder’s opinion), practicing MI role-plays in Navajo, and exploring challenges that might be unique in the Navajo context (e.g. how to do open-ended questions and reflections in the Navajo language).
Health Promotion Materials The COPE program features a series of modules that
together form a longitudinal curriculum to coach patients in making healthy changes and accessing healthcare ser-vices. Each module is developed closely with IHS experts to be consistent with standard of care practices. Respond-ing to CHR feedback, patient teaching materials are for-matted as printed flipcharts and are designed as “conver-sation guides.” Each flipchart utilizes MI and goal-setting techniques and incorporates visual imagery and Navajo terminology to maximize comprehension among Navajo-speaking clients.
Team-based Approach Strengthening linkages between the clinic care team
and CHRs is essential to maximizing the impact of com-
munity-based activities, and provides a cohesive experi-ence for the patient. Each Service Unit identifies a “COPE liaison,” a point-person for coordinating clinical and training efforts. Each site has found different solutions to facilitate increased dialogue between CHRs and provid-ers, such as case management meetings; documentation of CHR visits on electronic health records; team meetings and informal lunches; and physician-CHR home visits.
The referral process requires close communication between clinic-based providers (here defined broadly as physicians, nurse practitioners, pharmacists, nurses, health technicians, case managers and other health professionals who care for patients at the clinics), CHRs, and patients. Criteria for patient referral are not rigid: any patient living with an uncontrolled chronic health condition may be se-lected by their provider, public health nurse, or CHR. Both clinic providers and CHRs are encouraged to explain the program and obtain the patient’s verbal consent to par-ticipate in COPE. Patients may alternatively decline home visits or accept CHR visits without participating in COPE. The clinic provider is asked to provide a summary of rel-evant clinical information, including a list of medical con-cerns, medications, appointments, and recent laboratory data. CHRs are encouraged to perform an initial intake that elicits information from the patient’s perspective on their own health and socioeconomic issues, and identi-fies health changes that the patient and CHR would work on together, such as diet, exercise, medication adherence, and getting to appointments.
Supportive supervision is also essential for CHRs to function optimally, especially in light of their broad scope of work and time demands. COPE supports these areas by providing training on management skills to CHRs’ super-visors, and encouraging each site to collectively identify program evaluation indicators. In addition, annual re-treats for the CHRs are held to strengthen team building, analyze quality improvement and COPE progress, as well as nourish CHRs’ own mental and physical health as care-givers and “front-line” responders.
Program Evaluation
Annual surveys and focus groups with key stakehold-ers assess program performance and identify areas for improvement. Qualitative data have been instrumental in helping COPE to identify activities or health topics with limited uptake. For instance, we found that CHRs were un-comfortable talking about alcohol abuse, because they felt that they did not have sufficient knowledge about alcohol use and might offend their clients by breaching this topic. In response, we carried out CHR refresher trainings em-phasizing role-plays until CHRs became more comfortable opening the conversation with their clients. The alcohol module was also modified for easier use, providing more

25Community Investments, Fall 2013 – Volume 25, Number 2
information on treatment options, which allowed CHRs to encourage patients to talk with their providers about any options that interested them. We also track enrollment and attrition among COPE participants, as well as clinical out-comes. To date, more than 525 clients have been enrolled in COPE. Preliminary data from the first 43 clients enrolled in COPE have shown an average drop of one percent in the hemoglobin A1c and an average drop of 10 mg/dl in cho-lesterol, indicating above average improvements in control of diabetes and high cholesterol. A comprehensive analy-sis of clinical outcomes, health service utilization and cost is currently underway.
Lessons learned
Integrating community outreach into formal health-care services is challenging for many reasons. First, health care workers often face inherent structural impediments to collaboration: clinic-based providers and outreach workers are located in different places with minimal time to engage in new activities or approaches; responsibilities and competencies of community health workers are often poorly defined and not understood by clinic providers; and historical precedence and organizational structures make collaboration between tribal and federal institutions challenging. We have found it is essential to understand perspectives of stakeholders at all levels, from leadership to providers to outreach workers, and to design an inter-vention that meets the needs of these partners.
Another challenge is bringing about a cultural shift in how providers approach improving their area’s health system. Initially, providers in both AI/AN and non-AI/AN communities may be surprised to know that communi-ty health workers exist and that they are at work in the homes of their patients. Validating the efforts of outreach workers and empowering CHRs to deliver high-quality services is an essential function of COPE, requiring pro-active work over time.
Another important aspect of this intervention has been the adaptation of the program to the specific cultural needs and desires of the community. The COPE Project built upon the strengths of the Navajo community: the au-thority and respect of CHRs within their communities, the power of communicating in Navajo (both to train CHRs and to teach clients), and the dedication of many IHS pro-viders to serve marginalized communities. In addition, COPE also sought to overcome some of the barriers faced by some of the most vulnerable members of the Navajo community. The profound geographic distances and lack of basic resources such as telephones, healthy food and utilities faced by many households requires a patient-cen-tered approach in which CHRs pro-actively check on pa-tients, relay information back to providers, and work with clients to make realistic health behavior changes that are
achievable within their home environment. To this end, we worked to facilitate communication between CHRs and clinical providers, trained CHRs on behavior change (MI instead of simply instructing patients on what to do), and developed culturally-sensitive teaching materials that were appropriate for the population, including individuals who did not speak English and had limited health literacy.
Finally, any attempt at improving the health of mar-ginalized populations must adopt a patient-centered ap-proach to care. This means shifting the locus of interven-tion from the clinic walls to the home, where patients living in poverty often make behavioral decisions pri-oritizing household survival over self-care. As commu-nity members themselves, community health workers are uniquely capable of empowering patients through individ-ualized coaching and education, providing social support and help navigating access to health care services.
Conclusion
COPE is a collaboration between an academic institu-tion (BWH), tribal entity (NNCHR) and regional IHS that has enhanced existing activities and built bridges to better serve the Navajo community. The CHRs have been em-powered to take ownership of this program, which has resulted in a system that is sensitive to the needs of their community. Given the ongoing challenges of poverty, limited healthcare resources, and limited professional human resources in rural tribal settings, COPE provides a promising model for expanding the role and impact of CHRs when integrated into team-based care.
Photo credit: Bec Rollins
Special Focus: Com
munity D
evelopment in N
ative Com
munities

26 Community Investments, Fall 2013 – Volume 25, Number 2
In 1999, Blossom Feiteira and Kehaulani Filimoeatu met after both waiting for years to claim their lease awards on Hawaiian Home Lands, only to be denied. Feiteira had been fighting homelessness with her
family, living on the beach and out of her car, while Fili-moeatu was working with the Maui Police Department and, in her free time, organizing her community to help get Hawaiians back to the land. With no credit, no savings, and too much debt, the mortgage lending institutions in-volved told the two women they were not financially qual-ified to secure their awards.
That same year, the U.S. Department of Housing and Urban Development produced its first Housing Prob-lems and Needs of Native Hawaiians Study analyzing the housing and economic disparities experienced by Native Hawaiian1 families residing in Hawaii. The study
Investing in Our Next Generation:
A Native Hawaiian Model for Economic Self-SufficiencyBy Jeff Gilbreath and Lahela Williams, Hawaiian Community Assets
found that 49 percent of Native Hawaiians had housing problems, the highest percentage of any group in the United States. Per capita income for Native Hawaiians was $10,600, relative to $16,000 for non-Natives, and the unemployment rate for Native Hawaiians was twice that of non-Natives in the state. Already limited homeowner-ship opportunities for Native Hawaiians decreased even further due to rapid increases in housing costs, and 2,300 Native Hawaiians were homeless, constituting 30 percent of the state’s total homeless population.
Feiteira and Filimoeatu were living, breathing exam-ples of these numbers.
The difficulties native Hawaiians face in securing leases in their own communities persist despite efforts to estab-lish dedicated lease opportunities. The Hawaiian Home Lands include 203,000 acres of land across Hawaii spe-
A participant in a Native Hawaiian youth financial education workshop
Photo credit: Hawaiian Community Assets

27Community Investments, Fall 2013 – Volume 25, Number 2
cifically designated for the social, economic, and cultural rehabilitation of the Native Hawaiian people. The Home Lands were set aside for Native Hawaiian residential and community development uses in 1920 as a result of the Hawaiian Homes Commission Act, sponsored by Prince Jonah Kuhio Kalanianaole, Hawaii’s first U.S. Represen-tative. Eighty years later, though, only 3,689 residential leases had been awarded to native Hawaiian Beneficia-ries, while approximately 15,000 native Hawaiians were on the waiting list for their leases.
Given their experience being denied Hawaiian Home Lands leases due to their financial standing, Feiteira and Filimoeatu understood first-hand the need to build fi-nancial skills among the native Hawaiian community. In 2000, they founded Hawaiian Community Assets (HCA), a Native housing counseling agency and lending institu-tion. Implementing a holistic approach to helping native families achieve and sustain affordable housing, HCA's comprehensive service delivery model included outreach and client intake, homebuyer education workshops, pre-purchase counseling, referral to down payment assistance programs, and community mortgage lending services – all in the context of Native Hawaiian culture.
The service delivery model roots itself in a philosophy shared by the founders called Kahua Waiwai, which es-pouses the basic philosophy of "A Sense of Place." In this philosophy, the home is viewed as a foundation (Kahua). Upon this foundation is built the family's spiritual values and teachings (Waiwai). It is the spiritual value of the home and its surroundings that provides stability and the opportunity for families to build a secure future. Opportu-nities that help stabilize family life help to create a more stable community. A strong foundation, if built properly, will serve generations to come.
“At the beginning it seemed simple. You have our Trust lands. You have the Beneficiaries of the Trust,” said Filimoeatu.
“And HCA was created to bring the two together,” finished Feiteira.
Feiteira and Filimoeatu conducted group workshops using the organization’s Kahua Waiwai Homebuyer Edition©, a curriculum co-authored by the two women that bridged the natural and social resource management practices of traditional Hawaii and the modern financial world to help Native Hawaiians become qualified to pur-chase homes. Individualized counseling and case man-agement for savings, debt reduction, and credit allowed families to address their specific financial issues. Hawaii Community Lending, the organization’s nonprofit mort-gage brokerage, completed the service continuum by helping families identify affordable mortgage financing options. Revenue generated through lending supported free delivery of HCA’s financial education and housing
counseling services statewide.In the first seven months of the program, HCA origi-
nated five construction and fifteen mortgage loans total-ing $3.2 million. By 2003, these key outcomes resulted in HCA serving as the lead lender and partner in the devel-opment of Waiehu Kou Phase III, a 113-home Hawaiian Home Lands development.
The success of the Kahua Waiwai model became nationally recognized and Feiteira and Filimoeatu were honored with the Ford Foundation’s Leadership for a Changing World Award. The award included a significant grant to seed fund the program. Ten years later, Ford has realized a return on their investment.
Youth Financial Education
In 2008, the Federal Administration for Native Ameri-cans and State Office of Hawaiian Affairs invested in HCA to engage community leaders, teachers, service provid-ers, parents, and youth in statewide focus groups and test workshops to develop the Kahua Waiwai Opio Edition©, a culturally-relevant, place-based financial education curriculum to address the economic and financial needs of Hawaii youth, ages 13 and older. HCA’s vision was to expand its founders’ philosophy of Kahua Waiwai beyond a homeownership service delivery model to one that aligned with the blueprint for economic self-sufficiency practiced by our ancestors. In particular, the youth program was to carry forward the practice of sharing knowledge, a practice that was established by ordinance during the reign of legendary Oahu alii (chief) Mailikukahi, in which the first-born male child of every family was taught by the Oahu alii of their community. The goal of this traditional teaching model was to instill the values and skills neces-sary to manage resources wisely in order to ensure Hawai-ian communities prospered for generations.
A primary example of this model was the teaching of the kapu system. The system functioned as a traditional Native Hawaiian resource conservation system in which a konohiki (land manager) would have the responsibility of surveying the land within a watershed, stretching from mountain to ocean, in order to inventory the available natural resources. Before a resource began to show deple-tion, the konohiki would place a kapu, or taboo, on the resource to inform the community that it should not be harvested, gathered, or hunted to allow for its natural re-generation. If community members did not adhere to the kapu, they would be punished by the alii. It was through the passing of knowledge of the kapu system that rising generations of Native Hawaiians were able to masterfully manage the natural resources and establish sustainable, self-sufficient communities that prospered for generations.
In bringing these best practices into our modern com-munities, the organization engaged over 100 youth in
Special Focus: Com
munity D
evelopment in N
ative Com
munities

28 Community Investments, Fall 2013 – Volume 25, Number 2
shaping the Kahua Waiwai Opio Edition© during the focus groups and test workshops. Seven teenagers from a youth leadership development nonprofit, YouthVision Hawaii, were then contracted to design, illustrate and layout the curriculum.
The hard work of the youth was rewarded on March 9, 2009, when HCA unveiled the curriculum and conducted statewide train-the-trainer sessions applying a service de-livery model that included community outreach, training, technical assistance, group workshops, and asset building products to prepare future generations of homeowners, college graduates, and small business owners. With this model in place, 40 trainers from 25 community-based or-ganizations joined HCA in April 2009 to launch the Kahua Waiwai Opio Collaborative to support the free delivery of culturally-relevant, place-based financial education to Hawaii youth across the state. In the first two weeks, the collaboration provided educational trainings for 70 youth on Oahu, Hawaii Island, and Molokai.
Sixteen weeks later the first class—a group of eight Native Hawaiian youth from the Hawaiian Homestead of Panaewa on Hawaii Island—completed the program. Chevlyn Wooley, one of the graduates, shared her ex-citement during the opening invocation, “I am proud to say I have a job! I started the class clueless and jobless. Now I have the knowledge to make better decisions about money.”
Together, the students had completed the eight lessons of Kahua Waiwai Opio Edition© covering the traditional and modern economics of Hawaii, employment and pay-checks, budgeting, saving, banking, managing credit, credit cards and cars, planning for a financial emergency, post-secondary education, micro-business development, and buying versus renting a home. With family, friends, and local service providers present at the graduation, the Panaewa youth celebrated their collective successes: all eight had identified long-term savings goals and opened savings accounts, three had secured jobs during enroll-ment in the program, and one obtained a Minor’s Work Permit to pursue employment.
On the opposite side of the island chain, on Kauai, Ho’omana Inc. reported results from their program launched at the same time as Panaewa’s pilot. The non-profit youth development organization had provided fi-nancial and life skills education to fifteen Native Hawaiian youth with special needs. Highlighting the importance of hands-on experiential learning, all fifteen youth built job skills as employees at the organization’s Kapaa thrift store. They also learned how to open and maintain bank ac-counts through “role playing” activities, and applied wise financial decision making skills during an end-of-year field trip to the mall, where they had to develop and follow a budget. In actions that revealed the impact that hands-on
experiential learning can have on the independent living skills of Native Hawaiian youth, two participants signed up for Hawaii Public Housing and one signed up as a Ben-eficiary of Hawaiian Home Lands during enrollment in the program.
With this groundswell of support from community stakeholders like the Panaewa Hawaiian Home Lands Community Association and Ho’omana Inc., HCA suc-cessfully trained 138 trainers over the next three years. By 2012, HCA staff and trained trainers had delivered free youth financial education workshops in their own communities, using the Kahua Waiwai© curriculum, col-lectively serving 930 native Hawaiian teenagers. Key in-vestments from Hawaii County and First Nations Devel-opment Institute expanded the program by supporting a county pilot and statewide demonstration project, respec-tively. The pilot and demonstration projects reported the following results:
• 423 youth, ages 13+, were served with at least 4 hours of Kahua Waiwai Financial Education;
• 233 youth participants reported a feeling of increased career readiness after developing resumes and/or par-ticipating in job/career training programs;
• 181 youth participants reported an increase in posi-tive financial habits by identifying savings goals and actively saving while enrolled in the program; and
• 121 youth participants accessed asset building programs.
The Kahua Waiwai Youth Financial Education Program went on to achieve surprising results. Eight families of Kahua Waiwai youth participants reached out to HCA to file their taxes through the organization’s Volunteers in Tax Assistance Program. An additional twenty families partici-pated with their children to enroll in HCA’s Youth MATCH (Managing Assets to Change Hawaii) Savings Account, which provides a 3:1 match on savings up to $100 to help secure goals related to housing, education, micro-busi-ness development or career training.
Culturally Relevant Financial Education Makes a Difference
HCA collected data from 121 youth participants on the impacts of the program on their cultural knowledge. Analysis showed that the 113 participants who complet-ed at least four hours of Kahua Waiwai Financial Educa-tion were able to identify practices and values families utilized in traditional Hawaii (pre-Western contact) to ensure economic sustainability for future generations. When asked to share the key practices and values of tra-ditional Native Hawaiian community that can be used today to build the economic sustainability of families, youth participants identified land and natural resource

29Community Investments, Fall 2013 – Volume 25, Number 2
management, responsibility to family and community, and sharing or resources and knowledge as integral to the prosperity of future generations.
Moving Forward
As HCA celebrated the successes of the county pilot and statewide demonstration projects for its youth program, the organization continued to collect data on Native Hawaiian and low-income Hawaii families assisted by a housing counseling program to secure rental housing, purchase homes, or prevent foreclosure. Unfortunately, trends in the data pointed to the reality that native Hawai-ian people were still experiencing housing and economic disparities similar to those reported by HUD in the 1990s, and felt by the community since before the passing of the Hawaiian Homes Commission Act of 1920.
Data collected through the 2012 Hawaii State Home-less Utilization Report, the Department of Hawaiian Home Lands Fiscal Year 2012 Financial Audit, and HCA’s housing counseling programs from January 2011 through December 2012, showed the following ongoing issues:
• Over 12 percent of native Hawaiian Beneficiaries and 9.7 percent of Native Hawaiians overall were identi-fied as unemployed at intake into HCA programs;
• Native Hawaiians represented 28 percent of the state’s total homeless population;
• The average mortgage qualification of Native Hawai-ian households enrolled in HCA’s homebuyer educa-tion program was $185,631;
• Yet the median market sales price for all single-family homes in Hawaii stood at $416,792 in 2010, while homes on Hawaiian Home Lands – the primary afford-able housing option for native Hawaiian Beneficiaries – had a median sales price of $238,958; and
• An estimated 26,000 native Hawaiian Beneficiaries are still waiting to secure their lease awards on Hawaiian Home Lands.
To address the underlying causes of these issues within native Hawaiian communities, HCA piloted a family fi-nancial education program starting October 2010 with homeless families living in transitional shelters on the Waianae Coast of Oahu. The pilot utilized the Kahua Waiwai Opio Edition© to teach basic financial skills to the entire family as a way to encourage broader participa-tion in the economic self-sufficiency of Native Hawaiian households, while also connecting the families to HCA’s housing counseling, asset building products, and commu-nity lending services. During a specific pilot workshop,
children and their parents were brought together to learn about savings goals and financial decision making. Then they were separated to cover topics related to employ-ment, gross versus net pay, budgeting, credit and quali-fying for a loan. Post-workshop evaluations reflected a 27 percent increase among participants in knowledge of budgeting and spending plans as well as a 72 percent in-crease in money management capabilities. Overall, the pilot family financial education model has resulted in 64 homeless families successfully securing rental housing from October 2010 through June 2013.
Expanding the family financial education program model beyond homeless families living in transitional shelters, HCA established a partnership with Keiki O Ka Aina Family Learning Center, a Native Hawaiian early childhood education and family strengthening nonprofit organization, to provide Kahua Waiwai Financial Educa-tion to parents enrolled in financial assistance and mar-riage strengthening classes. After completing four hours of family financial education featuring the Kahua Waiwai Opio Edition©, families have reported increases in finan-cial and cultural knowledge. In a random sampling of eighteen Keiki O Ka Aina participants, 61 percent agreed or strongly agreed that they gained knowledge of Hawai-ian culture, traditions, history, or language, while 100 percent agreed or strongly agreed that the knowledge gained from the workshop was relevant to their daily life and would be used by their family.
These promising results have led to a discovery. It is through investing in the teaching of the community’s chil-dren that families can find the key to building commu-nity-wide economic self-sufficiency. Kahua Waiwai was established as a service delivery philosophy. Today, it has transformed into a holistic approach to achieving com-munity economic self-sufficiency in Hawaii and based in the Native Hawaiian culture. This approach starts, as dem-onstrated by our ancestors during the time of alii Mailiku-kahi, with our next generation.
“Our Kahua Waiwai Youth Financial Education Program has become an entry point for broader family and community well-being,” shared Lahela Williams, Program Coordinator and Native Hawaiian youth leader. “By seeing our next generation as the cornerstone of the Kahua Waiwai philosophy, we are recognizing the impor-tant role our children will play in helping our families and communities achieve and sustain economic self-sufficien-cy. It is through the next generation, and their sharing of knowledge with the family, that we will re-establish our connection to the land and reignite our Native Hawaiian model for economic self-sufficiency as created and per-fected by our ancestors.”
Special Focus: Com
munity D
evelopment in N
ative Com
munities

30 Community Investments, Fall 2013 – Volume 25, Number 2
You Have to Scale Down Before You Can Scale Up: A Micro-Enterprise StoryBy Iosefa Alofaituli, Oak View Renewal Partnership and Michael Connors, AmeriCorps VISTA
Introduction
When Margarita got pregnant at 17, she was told by many she would not amount to anything. Proving her critics wrong, she graduated from high school on time with
a close-to-perfect GPA. That was just the beginning. Now, at 20, the budding entrepreneur is engaged, a college student, and—with the help of a micro-enterprise program run by Oak View Renewal Partnership (OVRP)—the busi-ness manager for her family’s newly incorporated small business.
A high teenage pregnancy rate is only one of the many challenges facing the Oak View neighborhood in Hun-tington Beach, California. “Surf City USA,” as it is known,
epitomizes the suburban-meets-beach lifestyle of Southern California. The one-square-mile, 10,000-resident neigh-borhood is centrally located in the city, but is hidden by a busy business corridor on one side and an industrial zone on the other. Though it is encircled by more affluent neigh-borhoods, Oak View has not ridden the wave of economic success that the rest of Huntington Beach has enjoyed.
The neighborhood, though on the rise, has struggled with a multitude of problems over the years, including gang activity, high unemployment, low incomes, over-crowded and unfit housing, a significant high school dropout rate, and a generally low level of educational achievement. The community hit a low point in violence
Micro-enterprise business Ricos Tacos Dona Mari opens in the Oak View neighborhood of Huntington Beach, California
Photo credit: Michael Connors

31Community Investments, Fall 2013 – Volume 25, Number 2
and public safety concerns when its police substation was firebombed April 30, 1992—the second day of the Rodney King riots. Following this incident, however, a communi-ty-policing model introduced in the 1990s eventually pre-vailed in significantly reducing crime and gang presence. This relative stability paved the way for additional services and improvements in education to take hold. Increasing collaboration between residents and neighborhood or-ganizations brought about the success of individuals and families, as well as measureable improvement across the spectrum in Oak View in public safety, health, education, employment, and housing. Yet with all the progress that had been made in public safety and access to services, there remained a shortage of long-term, systemic commu-nity development efforts in the neighborhood.
Developing the Oak View Renewal Partnership
In 1997, Jack Shaw, retired vice-chairman of Deloitte and a resident of nearby Newport Beach, was looking for a way to get involved in crafting such community initia-tives. Inspired by Eugene Lang’s work in Harlem and the subsequent “I Have a Dream” Foundation, Shaw and his wife, Ellen Shockro, a college professor, started a similar academic program in Oak View called El Viento Founda-tion. Lang popularized the approach of pairing long-term educational enrichment with an eventual college scholar-ship: a child must be ready to succeed for a scholarship to make a difference. Today, the program in Oak View is still going strong and its first members, who started as fourth graders in the late ‘90s, are now finishing college.
El Viento’s success led Shaw to consider the overall condition of Oak View and why, after the delivery of millions of dollars in social services, it was still mired in poverty. Shaw realized that the focus of all the money and initiatives mainly fell on individuals and families rather than the community at large. This observation was the impetus for the Oak View Renewal Partnership (OVRP). Spearheaded by Shaw, the place-based nonprofit was for-mally constituted in 2006 to help close the gap between Oak View and the rest of Huntington Beach through com-munity-development initiatives.
OVRP’s efforts have included a youth soccer league, mobile medical clinics, farmers markets, community gardens, community cleanup, and afterschool programs. By 2011, the needle was moving in Oak View: per capita income, school test scores, and education-level attain-ment, among other indicators, showed increases, while the incidence of property damage decreased.1 These modest gains marked community-wide improvement. The tempta-tion at this point for OVRP was to scale up its existing ini-tiatives, both within the community and outward to similar communities.
However, improvements in these indicators could not obscure the realization that the gaps between Oak View and surrounding neighborhoods would never be signifi-cantly and sustainably narrowed until Oak View saw a considerable and sustained upward shift in its employ-ment rate and per capita income. The 2011 data show a 48 percent employment rate and a per capita income of $16,700 in the neighborhood, compared to 60 percent and $31,400, respectively, for Orange County.2
With these disparities in mind, the mantra around the office became, “You have to scale down before you can scale up,” and OVRP went back to the drawing board to address Oak View’s most pressing need: jobs. OVRP staff selected employment as its key focus issue after door-to-door grassroots surveying verified its importance among residents, and also identified the specific needs residents had in regard to improving their employment prospects.
Thus, OVRP’s most ambitious undertaking so far—its comprehensive Workforce Initiative—currently addresses multiple needs: case management; job readiness, training, and placement; and alternately, for residents interested in starting their own businesses, a Micro-Enterprise Develop-ment Program.
All aspects of the Workforce Initiative are producing early results and important lessons, but the development of the Micro-Enterprise Development Program best illus-trates OVRP’s approach and growth.
Best Practices: Building Partnerships, Leveraging Multiple Initiatives, and Engaging the Media
As it developed its Micro-Enterprise Development Program in 2011, OVRP partnered with Goodwill of Orange County, which had existing training available around micro-enterprise. An agreement was struck to hold classes within Oak View in order to ensure accessibil-ity for residents, thanks to in-kind space provided by the local elementary school and school district. In late 2011, ten residents completed the first iteration of the 15-week program. It was offered again in 2012, with ten more com-pleting the program, and a third iteration is scheduled for later this year.
At the end of the first session, one of the prospec-tive businesses stood out as the most prepared to move forward. It would become Ricos Tacos Doña Mari, a
It is crucial to scale down and focus on leadership and capacity, so that when the time comes to scale up, an initiative will be highly attractive to funders
Eye on Com
munity D
evelopment

family catering business run by Margarita and her parents, Maria and Juan. OVRP could have decided to simultane-ously help many businesses get off the ground from the first group who completed the training, but OVRP ulti-mately chose to begin with a single-business pilot. Con-sistent with the scaling down approach, the idea was that additional businesses would most effectively be assisted by OVRP in the future if they could first focus on the key factors that enable a business to thrive and develop a set of best practices around lessons learned. Even though OVRP is only formally involved with one business at this time, many of the program graduates are moving forward with their businesses independently.
OVRP turned to additional collaborators to help make the family’s dream a reality. Prior to starting the Micro-Enterprise Development Program, they had been running a fledgling catering business within the neighborhood. Some of the challenges now were licensing, incorporation, bookkeeping, and marketing. OVRP helped them navigate the licensing and incorporation process. Employees from Wells Fargo, one of OVRP’s primary funders, generously donated their time to mentor the family in financial and administrative matters. And a local marketing firm offered pro-bono services to create professional collateral.
At the same time, OVRP was operating a farmers market in Oak View, and Ricos Tacos Doña Mari initially launched as a food vendor at the market. This turned out to be a critical step for the business because of the ready-made customer base, and as a result, built the confidence of the first-time business owners. This initial positive ex-perience in their own neighborhood propelled them into independent catering jobs across the county.
In this way, OVRP’s multi-initiative approach has been advantageous. OVRP did not necessarily plan to plug the micro-enterprise pilot business into the farmers market, but it happened to be the perfect launching point for Ricos Tacos Doña Mari. OVRP has discovered that over time, systemically focused organizations can be particularly successful running multiple interrelated initiatives simul-taneously. This strategy requires flexibility and adaptabil-ity, but produces greater opportunity for cross-pollination, or integration of initiatives, making them stronger and more sophisticated overall.
Today, Ricos Tacos Doña Mari is flourishing. The family reports that before they completed the Micro-Enterprise Development Program and the incorporation process in mid-2012, revenue was only about $200-$300 a month. Since then, it is averaging over $1,000 a month, operating primarily as a weekend business that supplements their regular household income. The family plans to continue growing the catering business, so they can someday lever-age it into a restaurant.
32 Community Investments, Fall 2013 – Volume 25, Number 2
Micro-enterprise business owner Margarita Ruiz of Ricos Tacos Dona Mari
Photo credit: Michael Connors

The final, but certainly not least important, component for success is effective media outreach. Since late 2011, OVRP has taken a professional and deliberate approach to media relations across all its initiatives. It starts at the top with the board of directors, which has a communications committee to plan efforts. At the staff level, output in-cludes consistent media alerts, press releases, media kits, invitations to events, and lunch meetings with individual reporters and editors.
Traditionally, media relations has been something of an afterthought for some nonprofit organizations. Execu-tive directors may sometimes categorize it as part of over-head, where it may be overlooked. Or the responsibility for media outreach may be designated as an additional task for an already overworked staff member with no communications experience—whose inadvertent errors could lead to disastrous media gaffes. For these reasons, and due to its perception as a high-risk endeavor, organi-zations may not fully pursue or may even actively avoid media opportunities. OVRP, however, feels that nonprofits that are ambivalent toward or eschew the media do so at their own peril. OVRP considers the media to be an important outlet through which it can communicate its work to the public, and this attitude has paid off. The or-ganization found it beneficial to enlist media professionals to develop and carry out its plan. These individuals are able to foresee vulnerabilities and to mitigate unintended consequences. Since OVRP started sending press releases in May of 2012, highlights include five front-page local newspaper stories; a story in a national on-line publica-tion; and even coverage on TV news in Los Angeles, one of the world’s biggest media markets. The latest front-page story was on the Micro-Enterprise Development Program and Ricos Tacos Doña Mari, which should help strengthen the program and the business even further.
Anecdotally, morale is up among residents, and OVRP has more name recognition due to the media coverage. Most importantly, the coverage is helping in the ongoing effort to break down the isolation between Oak View and the rest of Huntington Beach. Some from outside the neigh-borhood have even said that they have gotten involved in Oak View due to the media stories. Quantitatively, since implementing a media plan, OVRP’s funding is up 39 percent; name recognition and communication of accom-plishments have indirectly enhanced fund development.
Lessons Learned
Some time ago, one of our board members remarked, “Money is the easy part.” This is not to be taken literally, because OVRP has had to work extremely hard for its funding, and it is currently hoping to attract a national foundation so all aspects of the Workforce Initiative will be realized. Rather, what the board member meant was that
leadership and capacity building should be the top priori-ties for an organization like OVRP, which in turn should help funding to more easily fall into place. He noted that there can in fact be additional money on the sidelines in some cases, because funders often hold back until they are convinced that an organization has the leadership and capacity to make good use of the financial resources.
This focus on leadership and capacity is another reason OVRP decided to scale down by starting with a pilot busi-ness in its Micro-Enterprise Development Program. Ca-pacity was redefined as building partnerships, not build-ing the size of the program. As mentioned earlier, Wells Fargo, Goodwill of Orange County, and a local marketing firm partnered with OVRP to develop the pilot business. In regard to leadership, OVRP focused on managing a tight network of the partners and pilot business. In addition to internal leadership, external leadership is stressed: the Micro-Enterprise Development Program’s model requires a business manager for each enterprise. OVRP discovered that it is crucial to scale down and focus on leadership and capacity, so that when the time comes to scale up, your initiative will be highly attractive to funders.
Another lesson learned is the importance of being place-based. This is not a new concept in community development, but the Micro-Enterprise Development Program serves to reinforce this lesson. OVRP feels strong-ly that the partnership would not have come together and the successful pilot business would not have been formed had it not been for the place-based emphasis. It went all the way back to the initial partnership with Goodwill of Orange County and its agreement to offer the program in the Oak View neighborhood. In other words, initiatives should engage residents where they are. Typically, po-tential program participants work long hours, are raising families, and do not have adequate transportation. Even bus fare can be a burden, so an easily accessible program location is critical to an initiative’s success.
The importance of agility also tops the list of lessons learned. OVRP, by design, is a lean nonprofit. In fact, its executive director position is its only full-time permanent position. The nonprofit also has two full-time AmeriCorps VISTAs, three part-time employees, and one part-time contracted position. The aim of this staffing strategy is to leverage partners and resident leadership, instead of be-coming a large organization. OVRP’s goal is to eventually put itself out of business when the neighborhood becomes self-sufficient. This will never happen if the nonprofit becomes an entrenched neighborhood institution.
Another aspect of agility is OVRP’s funding stream. From the start, the nonprofit made the decision not to apply for public funding, instead relying on grants from corporate and family foundations. The primary reason for this decision was to “make the pie bigger.” OVRP does
33Community Investments, Fall 2013 – Volume 25, Number 2
Eye on Com
munity D
evelopment

not wish to compete with existing neighborhood organi-zations for limited public funding. A secondary consid-eration was to avoid tax-payer support of programs that some may find controversial. But the decision also resulted in more agility. Grants for public funding can be relatively laborious to administer and may restrict programming. The advantage of private funding came into play with the Micro-Enterprise Development Program. After the first it-eration, Goodwill of Orange County could no longer offer the program. Because most of OVRP’s funds are unre-stricted and internal bureaucracy is minimal, OVRP was able to contract directly with the instructor to continue the program for additional sessions in the neighborhood, seamlessly avoiding a potential pitfall.
The final, and perhaps most important, lesson is the im-portance of amenability. The program accommodates resi-dents’ needs, yet expectations remain high. Small examples include allowing some room for tardiness and absences. Again, because most residents in Oak View lead extremely challenging lives with many competing demands on their time, their involvement in OVRP programs can be tenuous, and a hardline approach could turn them off for good.
This emphasis on amenability resulted from a hot-but-ton initial discussion of English-only instruction. Some in the conversation insisted such instruction would highlight the importance of learning English to succeed. A second consideration was the potential controversy of holding the classes in Spanish. But English-only was not realistic if the program was to include those from the entire neighbor-hood, as a high proportion of middle-aged and older resi-dents do not speak English fluently. In the end, the deci-sion was made to offer instruction in Spanish, so that all of those who were interested in the program could partici-pate. Organizationally, this was a bold move, and one that
was not made without a sense of conflict, because OVRP still believes that it is important for all residents to learn English. However, being amenable to the reality of the neighborhood’s situation and needs allowed the program to move forward and take hold in the community.
Conclusion
OVRP prides itself on being a grassroots organization that is in touch with the residents of Oak View. However, an anecdote from Ricos Tacos Doña Mari’s development shows that even OVRP can miss what is most important to residents if it does not pay attention.
The business recently had the privilege to take part in Taste of Huntington Beach, a prominent local event that showcases the city’s best restaurants and catering compa-nies. One of OVRP’s staff members who could not attend saw one of the family members in the neighborhood the next day and was quick to ask her how it went: Did people like the food? Did a lot of people take your card? Do you think you will get a lot of catering jobs from it? While these were important questions in light of the family’s hard work building their business, they were not the only outcomes that the family member wished to focus on. She wanted to talk about how fun it was and the antics of the attendees who, in addition to the food at the event, were enjoying the beer and wine. And she concluded, “The best part was seeing my parents having a good time. They like living (in Oak View), but they hardly ever get out of the neighbor-hood. They had a lot of fun.”
Isn’t that what it’s all about? If we can move the needle and have fun in the process, there is no telling what can be accomplished. The lessons have now been learned from scaling down. It is time to scale up by developing more businesses in Oak View.
34 Community Investments, Fall 2013 – Volume 25, Number 2
Photo credit: Michael Connors

35Community Investments, Fall 2013 – Volume 25, Number 2
Planning for Driving Retirement: Context and ConsiderationsBy Laura E. Mason, Jewish Community Federation of San Francisco, the Peninsula, Marin and Sonoma Counties
In American culture, the age at which one may legally drive a car is a milestone. The private automobile, for a variety of reasons, has become a potent symbol of adulthood, independence, and relative success.
For many, entire lifestyles—including where one resides, works and socializes are predicated on the capacity to drive. And while as a society, we look forward to receiving a driver’s license in our youth, often we fail to consider the inevitable moment later in life when driving will no longer be an option.
The scope of the issue is magnified given that Ameri-can society is on the cusp of a major demographic shift. By 2030, the number of people who are 65 and older in the United States will double. More than 70 million Amer-icans, 20 percent of the total population, will be consid-
ered an older adult. Notably, the fastest growing segment within the older adult population is the 85-and-over age group, which is expected to grow by 100 percent during the same period. Further compounding the issue, the pool of caregivers (often the key transportation provider) has been decreasing for the last three decades, as children live further away from parents, parents have fewer children, and the home health care field suffers from a shortage of professional caregivers.
These facts, coupled with the reality that life expec-tancy will exceed driving expectancy by an average of 7 to 10 years, make it imperative for public, private, and community-based organizations to plan for and provide a strong continuum of health, human, and social services in order to meet the needs of this sizeable and growing
Eye on Com
munity D
evelopment

36 Community Investments, Fall 2013 – Volume 25, Number 2
senior population. In many respects, success in meeting these needs depends on bringing transportation issues to the forefront of this effort. This article explores some of the basic concepts in the field of transportation for older adults, such as driving cessation, variances in the needs of seniors who live in suburban and urban environments, and specific considerations in terms of offering “senior friendly” transportation services.
The Need for Affordable Transportation as Seniors’ Economic Insecurity Grows
A growing number of older adults are low income or face new economic insecurities after retirement, which directly impacts their transportation needs and choices. While just under 10 percent of adults aged 65 and older live below the federal poverty line, many more live only slightly above it, with 23 million American seniors living on incomes of less than $28,000 per year.1 Social Security benefits compose a large part of older adults’ financial re-sources, with 92 percent of all adults aged 65 and older claiming Social Security income. Only 34 percent of older adults still have annual earnings from active employment, and fewer than half have retirement income set aside. This leaves a significant number of older adults heavily reliant on Social Security to cover much of the cost of their daily needs. For those seniors who are low-income, however, the median Social Security benefit is just $6,400 per year.2 The American Association of Retired Persons (AARP) proj-ects that for the baby boomer generation, this Social Secu-rity benefit could constitute 60 percent of lower income older adults’ financial resources.3
Economic insecurity among older adults is also on the rise. The Institute on Assets and Social Policy (IASP) conducted a study using their Senior Financial Stability Index, which assesses the ability of seniors to manage es-sential costs with available resources, and found that fully 36 percent of older adults in 2008 were facing economic insecurity, compared to 27 percent in 2004.4 Older female adults and African American and Latino seniors are even more vulnerable to financial instability, with 47, 52, and 56 percent of older adults in these groups, respectively, designated as economically insecure in IASP’s report.5
These trends toward increased economic instability among older adults make the need for affordable transpor-tation alternatives even more pressing. Even among older adults who are still able to safely drive their own cars, the expense of owning and maintaining a car may become more than they can afford. AAA estimates that the annual cost of owning and operating a car averages at $9,122. For lower-income seniors who must live on roughly $15,000 per year, this cost would amount to nearly two-thirds of their income.6 With over 30 percent of older adults—both homeowners and renters—spending more than 30 percent

37Community Investments, Fall 2013 – Volume 25, Number 2
of their income on housing costs, the combined expense of housing and transportation could place lower-income seniors in an extremely precarious financial situation.7 Af-fordable transportation alternatives therefore play an im-portant role in lowering the overall cost of living for older adults, particularly those with ever more limited incomes.
Driving Cessation
There is also an important emotional health com-ponent to consider when older adults transition from independent driving to reliance on other forms of trans-portation. For adults who have enjoyed a lifetime of inde-pendence behind the wheel of their own car, transitioning to life as a passenger can be a traumatic experience. Ac-cording to one older adult, losing her license was analo-gous to losing a loved one. “When I lost my license…that loss built on previous losses…my spouse, and dear friends. The grief felt like a little death, but I didn’t think others would understand. After all, a driver’s license is not the same as losing someone you love, but the sense of loss was similar for me.”8
This description and many similar accounts from other older adults who have ceased driving indicate the psycho-logical adjustments at play, and illustrate how driving and reliance on the automobile have shaped lives. Such ac-counts make clear the profound link between transporta-tion and very notion of freedom. The loss of one’s driver’s license translates to a fundamental loss of control and the downgrading of one’s own decision-making, whether it is when to go, the route to take to get there, or whether one can decide to take an extra moment to visit a friend or venture somewhere new. Data confirms that this change in status translates to reduced travel in very specific ways. Compared with older adults who drive, older non-drivers make 15% fewer trips to the doctor, 59% fewer shopping and restaurant trips, and 65% fewer social, family, and religious trips.9 For many older adults, driving cessation means a narrowing of their world -- a potentially danger-ous shift that can introduce a host of negative implications.
Driving cessation is a transition in life that is rarely planned for, and therefore presents a difficult situation to navigate. Katherine Freund, the president and executive director of Independent Transportation Network located in Westbrook, Maine notes, “Anyone who has attempted to discuss driving cessation knows how painful, awkward…tearful, and sometimes ugly the experience can be…That is because a discussion about driving is almost always a direct threat to fundamental mobility and therefore to being alive.”10 Freund has also likened the difference between the private automobile and public transporta-tion to that of one’s own backyard and a public park. “Just as we need private and public landscapes, so we need private and public transportation systems,” adding that, in
terms of the apparent decreases in mobility and indepen-dence, the end of driving, for older people, is analogous to the loss of this personal space. This point is further under-scored by an American Public Transportation Association statistic that indicates four out of five older adults aged 65 and older worry that they will be stranded and unable to get around when they can no longer drive.11
In order to ease the transition to non-driving status, we must begin to plan for this inevitability. Just as financial planning for retirement is a necessity as we age, so too must be cultivating an understanding of the driving alter-natives that exist in our communities and how they may be utilized to ensure continuity in lifestyle.
As transportation is a key functional bridge that brings people together with the programs and services they need, and the means by which they are able to fulfill obligations and engage in the social and cultural activities they enjoy, seniors -- especially the frail elderly and older adults who are no longer able to drive a car -- are at risk of becoming isolated. Isolation contributes to a host of other negative outcomes among older adults, from depression, decline in mental and physical health, and a diminished sense of well-being. The current generation of older adults has typ-ically lived in suburban areas where services are spread out over a larger area and public transportation is less available, making them more dependent on the automo-bile for the satisfaction of daily transportation needs. The discussion of transportation for suburban seniors, there-fore, must place the concept of personal independence at its very core and focus on the transportation alternatives most similar to the private automobile.
For urban seniors, there are more choices. City-dwell-ing seniors are more apt to use traditional fixed-route public transportation because they are more familiar with it, even if it has not been their primary means of transpor-tation. Also, public transportation in a city is often more robust and reliable given the higher rates of use by urban dwellers, and services and programs are easier to access via transit in cities, as they tend to be clustered together in dense urban environments. It should be noted that while older adults in urban environments are more likely to use public transportation, the rates are of use are still relatively low among this demographic. Barriers to public transpor-tation use are discussed in the following sections.
Home Is Where the Heart Is
Where we age has much to do with how we age and which transportation options are needed to ensure both safety and quality of life. Aging in place—remain-ing in one’s own home environment—continues to be the leading preference of older adults. The disposition to remain living in the community speaks to a fundamen-tal human inclination to live in older age just as we have
Eye on Com
munity D
evelopment

38 Community Investments, Fall 2013 – Volume 25, Number 2
lived during the earlier stages of life—intermingled with all generations, and in the familiar comfort of an estab-lished home that we have worked in some way to create, secure and maintain for ourselves and/or our family.
The field of aging recognizes that for reasons related to personal preference and the cost of service delivery, enabling seniors to age in place for as long as possible is preferable to moving seniors to an institutionalized care setting. However, seniors’ ability to age in place depends on the availability of supportive services, and thus, on the availability of senior-friendly transportation services.
Senior housing is a complex issue that requires its own focused discussion. Yet, from a community development and investment perspective, it is important to acknowl-edge that many seniors place a high value on single-fam-ily residences, and to consider how this affect the provi-sion of high-quality driving alternatives for the growing population of older adults.
Planning Considerations & Barriers
There are many alternative modes of transportation that may fit seniors’ lifestyles, needs, and preferences; however, seniors may hesitate to use them for several key reasons. For example, ridesharing—a seemingly simple solution can elicit feelings of dependence and spark con-cerns about imposing on others, especially for “non-es-sential” trips, such as social events.
With traditional fixed-route public transportation, there are both real and perceived barriers including limited des-tinations, difficulty boarding and disembarking, and con-cerns for personal safety. Public para-transit systems are required as part of the Americans with Disabilities Act to complement traditional, fixed route public transportation options. While these programs are important lifelines for many non-drivers, advance scheduling requirements (any-where from 24-72 hours), long wait and lengthy ride times can be frustrating and impractical. Conversely, taxis are demand-responsive, meaning that they can be called on short notice, and offer a degree of privacy to the individ-ual rider; however, cost may be prohibitive for seniors on fixed incomes, and drivers often lack the necessary sensi-tivity to appropriately attend to the needs of an older pas-senger, particularly those who are frail or require a helping hand to get to and from the vehicle.
Any successful approach to the issue must take into account these barriers, and consider that seniors are often reluctant to give up their cars and, in many cases, the same health and mobility problems that force seniors to stop driving often make it difficult for them to access other forms of transportation.12 In general, seniors feel that al-ternative modes of transportation do not meet their needs because of inconvenience, time constraints, poor mainte-nance of trains and buses, fear for personal security, and, perhaps, a sense that they deserve better.
What makes transportation senior friendly?
Beyond specific transportation modes, it is also useful to identify the qualities that make transportation alterna-tives appropriate and successful in serving seniors. Dr. Helen Kerschner of the Beverly Foundation has offered a framework for transportation service providers to use when developing or marketing services to an older adult demographic. It lays out the “Five A’s” of Senior Friendly Transportation:13
1) Availability: Transportation options must be available when needed, including evenings and weekends.
2) Accessibility: Services must be accessible and safe (e.g. bus stop is reachable by foot, stairs can be negoti-ated, bus seats high enough to move from seated to standing to position.
3) Acceptability: Conditions such as cleanliness, user-friendliness, and safety are essential For example, en-suring that bus stops are located in safe areas, vehicles are clean and well-maintained, and that transit opera-tors are attentive, courteous and helpful.
4) Affordability: Fares must be affordable; either com-parable or less than driving a car.
5) Adaptability: Ensure that transportation can be modi-fied or adjusted to meet special needs. Wheelchairs and other mobility aides must be accommodated while on board and easily accessed for disembarking.
Kerschner also notes that communities can act in two ways to meet the transportation needs of seniors: adapt-ing or modifying existing transit options, or creating new options. Basic modifications include purchasing “kneel-ing” buses, developing flexible routes and pick-up and drop-off locations, creating linkages with volunteer groups to provide additional assistance for senior passengers, in-creasing driver sensitivity training, and promoting the need for both quality and quantity of life transit services. Many community groups and facilities want to keep seniors active in the community and offer their own transporta-tion options for seniors. As Kerschner remarks, “There are countless illustrations of new options . . . in communities throughout the country. Hospitals often organize transpor-
Transportation is a matter of health and financial stability, and also a key factor in allowing older adults to age with dignity

39Community Investments, Fall 2013 – Volume 25, Number 2
tation services for helping seniors access health services . . . Churches initiate transportation programs to help seniors get to religious services . . . Shopping centers and grocery stores create transportation services to help enable seniors to participate in the economy”14.
No One Size Fits All Approach
No single solution will address all seniors’ mobility needs. A combination of public transit, para-transit, private vans, taxi options, and volunteer programs—together with appropriate marketing, consultation, education and refer-ral services—together can address a community’s diverse needs.
Senior transportation is a complex, cross-agency, and region-wide need, with successful strategies requiring multiple program models and funding sources. Private funders, including foundations and faith-based organiza-tions, have played a leadership role in developing strat-egies, building partnerships, and allocating resources to this issue. Beyond funding, high priority community in-vestments should include:
Help Older Drivers to Drive Longer: Develop programs or increase referrals to existing community programs that provide driving refresher courses and introduce seniors to new strategies and technologies that enable them to retain their driver’s license when possible.
Plan for Driving Cessation: Begin the conversation about driving cessation while older adults are still driving, or before limited mobility becomes the norm. This is and always will be a difficult topic to broach, but the act of planning for “driving retirement” must become part of the standard dialogue about the aging process. This will help combat isolation before it begins.
Raise Awareness: Raising the visibility of senior transporta-tion as a community-wide issue is vital for the current pop-ulation of non-driving older adults, and future generations as well. By elevating the issue and incorporating senior transit needs from the outset can make all the difference.
Offer Travel Counseling and Information & Referral Services: Offering a single entry portal to driving alterna-tives is critical to creating a transportation safety net.
Coordination and development of services: Local gov-ernment and other stakeholders in the field must convene around this issue to address short-term needs, as well as long-term community strategies for the growing popula-tion of older adults.
Seed new volunteer driver programs: Community and faith-based organizations are natural channels through
which to develop volunteer driver programs, given that people are traveling to common destinations.
Expand successful programs: Public and private funders must invest in the expansion of successful programs with strong outcomes to ensure that high quality programs remain active and have the capacity to meet growing demand in the future.
Leverage public funding opportunities and other resources: Educating and working with public and non-profit agencies to access public funding opportunities (e.g., Section 5310 program provides significant matching funds for purchasing vehicles to transport seniors and other with special transit needs).
Conclusion
Provision of senior-friendly affordable transportation services is a significant unmet need now, and is projected to grow exponentially in the coming decades as the pop-ulation ages. As we seek to understand and address this communal need, it is essential to create a framework that treats transportation as both a matter of health, financial stability, and survival, enabling individuals to access core activities such as medical appointments and grocery shop-ping, and also as a key factor in allowing older adults to age with dignity, maintain their quality of life, and con-tinue to be active and engaged with the community.
As the public, private and nonprofit sectors work to plan for the needs of an exponentially larger senior popu-lation, transportation must be considered alongside other program goals. It is promising that awareness of the issue is growing, both in the aging field and broader social and nonprofit sector. As recently as July 2013, the United States of Aging, a joint project of the National Council on the Aging, United Healthcare and USA Today, released results of a survey distributed to 4,000 U.S. adults to explore their perspectives on aging and the needs of the growing senior population. Among the key findings of the survey, trans-portation was identified as one of five essential areas that communities need to address. In a related article, Sandy Atkins of San Francisco’s Partners in Care powerfully sum-marized the issue: “Every survey ever done of older adults shows that transportation is a problem. It's the No. 1 unmet need. Seniors need reliable, affordable transportation that does not require long waits."15
Transportation is and always will be a critical need for all communities and people of all ages. While the needs of older adults may be somewhat specialized, they are in keeping with the standards of high quality, affordable transportation in the most basic sense, and therefore ben-eficial to all.
Eye on Com
munity D
evelopment

Uncertainty About Risk Keeps Mortgage Credit Conditions Tight
Despite some recent improvement in the U.S. housing market, mortgage lenders remain wary of all but the lowest risk borrowers, preventing
many potential first-time homebuyers from entering the market. In their recent article for Moody’s Analytics and the Urban Institute, Jim Parrott and Mark Zandi discuss the reasons behind the consistently tight mortgage credit situation, and address how it might be remedied to allow more borrowers to secure a mortgage loan and keep the housing recovery on track.
Parrott and Zandi list several key reasons for tight credit conditions. First, lenders are avoiding high risk loans because many of them learned a painful lesson during the Recession about how expensive and time-con-suming such loans can be to service; the average non-performing loan is eight times more expensive to service than the average performing loan. Second, many lenders are only making loans to the best-positioned borrowers – by June 2013 the average borrower credit score was at a new high of 766 – and funneling much of the rest of their resources into the home refinance market. While the increase in refinancing activity has been beneficial to the overall economy, the authors explain that in many cases, lenders are focusing on refinancing at the expense of the purchase origination side of their portfolios. Finally, Parrott and Zandi suggest that the most significant driver of the tight credit situation may be lender uncertainty about the higher risk loans they could be required to take back if Fannie Mae, Freddie Mac, or the Federal Housing Administration (FHA) discover any errors or noncompli-ance issues with these loans after the fact. The authors explain that Fannie, Freddie, and FHA guidelines about what lenders must do to ensure loan compliance are not
always clear or consistently interpreted, increasing confu-sion and risk for lenders, who then avoid making loans to any borrowers they see as higher risk and more likely to default.
Overall, Parrott and Zandi stress that taken together, these factors create a substantial “risk blind spot” for lenders, against which lenders feel they cannot comfort-ably protect themselves from default and expense. As a result, these lenders are limiting their mortgage lending to the lowest-risk, most predictable borrowers.
Parrott and Zandi acknowledge that some of the issues behind tight credit conditions will only be resolved in re-lation to natural market shifts. For instance, the rise in re-financing activity is slowing down, and many lenders are returning their attention to new purchase loans. However, the authors also identify a role policymakers can play to help encourage lenders to expand their purchase origi-nation loans to more borrowers. They suggest that Fannie Mae, Freddie Mac, and the FHA should work with lenders to make the process of reviewing loans to higher risk bor-rowers much more predictable for lenders, to reduce the number of loans for which lenders must cover the cost when problems occur. Reducing lender uncertainty in this manner, Parrott and Zandi note, could extend market access to more first-time borrowers and those with slightly lower credit scores, to keep the U.S. housing market re-covery moving safely and steadily forward.
Parrott, Jim and Mark Zandi, “Opening the Credit Box,” Moody’s Analytics and the Urban Institute, September 30, 2013, http://www.urban.org/UploadedPDF/412910-Opening-the-Credit-Box.pdf
RESEARCH BRIEFS
40 Community Investments, Fall 2013 – Volume 25, Number 2

Quarterly Features
Los Angeles Area Exurbs Surprising Host to More Racially Integrated Neighborhoods
In research discussions, exurban communities are rarely seen as lands of opportunity. Rather, they are characterized in many cases as unfortunate byprod-
ucts of urban sprawl; places into which low- and mod-erate-income residents wishing to become homeowners may be forced as home prices and rents rise in urban core and nearby suburban areas. Yet a new study suggests that these exurban towns may feature an unexpected combi-nation of inherent traits that allow for more racially bal-anced communities to form.
Deirdre Pfeiffer of Arizona State University inter-viewed 70 African Americans who moved from Los Angeles to exurban communities in Southern Califor-nia’s Inland Empire region (Riverside and San Bernardino Counties), and analyzed Census Bureau data to deter-mine the extent of and reasons for improved racial in-tegration in these Inland Empire areas. She notes that between 1990 and 2007, African Americans moved from Los Angeles to suburban and exurban communities in large numbers, often to escape areas plagued with high crime rates and to find more affordable homeownership opportunities. While the residents Pfeiffer interviewed expressed that from their experience, the Los Angeles communities they migrated from tended to be racially segregated, they felt that the new Inland Empire commu-nities they moved to were often much more racially het-erogeneous, observations supported by Pfeiffer’s findings in U.S. Census and American Community Survey data. Pfeiffer also found that poverty levels between middle class white and African American residents varied by as many as eight percentage points in Los Angeles County, compared to a two percentage point gap in the Inland Empire.
Pfeiffer explains that a key reason for lower levels of racial segregation in the Inland Empire communities she studied is that they are recently-established neigh-borhoods developed in a tract style, rather than the infill
development that is now more common in Los Angeles. If exurban neighborhoods are developed quickly, with the housing built all at once in subdivisions, those who move in are unlikely to know who their neighbors will be, so neighborhoods do not tend to be dominated by one race, a dynamic Pfeiffer’s interviewees noted was typical of their former Los Angeles neighborhoods. Another factor, according to Pfeiffer, is that those who move into the se-lected Inland Empire communities tend to earn similar mid-level incomes, making class more of a determining factor for residency than race.
Pfeiffer also identifies some important caveats. Im-proved racial equity, she notes, is not necessarily corre-lated with greater opportunity to build intergenerational wealth for people of color. The Inland Empire communi-ties she studied have been among the hardest hit by the foreclosure crisis, which is a concern, Pfeiffer explains, because many African American homeowners in these towns have concentrated their wealth in their homes. Additionally, the general instability of exurban housing markets and the cumulative expense of the car-dependent lifestyle common in exurban communities may prevent residents of color in the Inland Empire from building long-term wealth.
In conclusion, Pfeiffer suggests that further study on exurban communities showing a similar trend toward improved racial equity in areas around Oakland, CA and Dallas, TX, among others, is essential to understand whether and to what extent these characteristics and caveats seen in the Inland Empire also play out in other exurban towns.
Pfeiffer, Deirdre, “Has Exurban Growth Enabled Greater Racial Equity in Neighborhood Quality? Evidence from the Los Angeles Region,” Journal of Urban Affairs, 2012, Volume 34, Number 4, pages 347-371.
41Community Investments, Fall 2013 – Volume 25, Number 2

DATA SNAPSHOTPopulation Living in American Indian Areas and Alaska Native Villages in the United States, 2010
42 Community Investments, Fall 2013 – Volume 25, Number 2
23% 32%
77% 68%
0%
25%
50%
75%
100%
American Indian Areas Alaska Native Villages
American Indian / Alaska Native Not American Indian / Alaska Native
34%
91%
79%
66%
9%
21%
0%
25%
50%
75%
100%
American Indian Alaska Native Native Hawaiian
12th District Remainder of U.S.
Distribution of the Native American Population within the United States, 2010
Source U.S. Census Bureau, American Community Survey 5-Year Selected Population Tables, 2010
Source U.S. Census Bureau, American Community Survey 5-Year Selected Population Tables, 2010

35Community Investments, Fall 2013 – Volume 25, Number 2
Quarterly Features
Source U.S. Census Bureau, American Community Survey 5-Year Selected Population Tables, 2010
0
250,000
500,000
750,000
1,000,000
Alaska Arizona California Hawaii Idaho Nevada Oregon Utah Washington
American Indian Alaska Native Native Hawaiian
Native American Population in the 12th District, 2010
43Community Investments, Fall 2013 – Volume 25, Number 2

Endnotes
44 Community Investments, Fall 2013 – Volume 25, Number 2
Prioritizing Self-Determination and Strategic Partnerships: Current Community Development Challenges Facing Native American Nations 1 The Harvard Project on American Indian Economic Development (HPAIED),
The State of the Native Nations: Conditions Under U.S. Policies of Self-Determination. New York: Oxford University Press, 2008.
2 U.S. Census Bureau, American Community Survey (ACS) 2006-2010. A note on terminology: The above-cited Harvard Project volume keenly explains the difficulty in using collective terms to refer to Native populations: “[collective terms] can obscure the tremendous variety of distinctive cultures and polities that make up Indian America. Indeed, on the ground, Native self-conceptions and self-references are often dominated by less encompassing identifica-tion as citizens of specific [tribal] nations” (xxii). With this in mind, specific tribal nation affiliations are noted wherever possible. For the purposes of this article and to reference existing data sources, however, “American Indian” or “Indian” refers to those who self-identify as descendants or members of tribes within the lower 48 states in the U.S. “Alaska Native” refers to those who self-identify as descendants of the indigenous peoples of Alaska. “Native Hawaiian” refers to those who self-identify as descendants of the indigenous peoples of Hawaii. “Native American” refers to American Indians and Alaska Natives as a group; this term is used to reflect Census and other agencies’ groupings by race for data purposes. “Native peoples/communi-ties” refers generally to the collective population of American Indians, Alaska Natives, and Native Hawaiians. “Indian Country” refers to tribal lands and geographical areas that are home to Native communities.
3 Cancer Research Center of Hawaii and Hawaii State Department of Health, “Hawai’i Cancer Facts & Figures 2010,” September 2010.
4 U.S. Centers for Disease Control and Prevention (CDC), Health, United States, 2012 Trend Tables.
5 U.S. Census, Selected Population Tables, 2010; Federal Reserve 2012; NCAI 2013.
6 HPAIED, 2008.
7 U.S. Census Bureau, “The American Indian and Alaska Native Population, 2010,” January 2012. “Native areas” in this Census report include federal reservations and off-reservation trust lands, tribal designated statistical areas, state reservations and state designated American Indian statistical areas, and Alaska Native village statistical areas.
8 Native American Public Telecommunications, “The Urban Relocation Pro-gram,” retrieved on September 19, 2013 from http://www.pbs.org/indian-country/history/relocate.html; HPAIED, 2008.
9 U.S. Census, 2012.
10 Indian Land Tenure Foundation, “Fractionated Ownership,” retrieved on September 18, 2013 from www.iltf.org
11 U.S. General Accounting Office, “Profile of Land Ownership at 12 Reservations,” February 1992.
12 HPAIED, 2008.
13 National Congress of American Indians (NCAI), “An Introduction to Indian Nations in the United States,” 2013; ILTF 2013; Harvard Project 2008.
14 Board of Governors of the Federal Reserve System, “Growing Economies in Indian Country: Taking Stock of Progress and Partnerships,” April 2012.
15 HPAIED 2008.
16 See “Building Green and Respecting Native American Identity: Housing, Culture, and Sustainability in Native American Communities,” in this issue.
17 NCAI, 2013.
18 Miller, Robert J., Reservation “Capitalism:” Economic Development in Indian Country. Santa Barbara: Praeger, 2012.
19 Miller, 2012; NCAI, 2013; Federal Reserve 2012; U.S. Commission on Civil Rights, “A Quiet Crisis: Federal Funding and Unmet Needs in Indian Coun-try,” 2003; NCAI, “Investing in Tribal Governments: An Analysis of Impact and Remaining Need Under the American Recovery and Reinvestment Act,” March 2010; The United Nations Human Rights Council (UN HRC), “Report of the Special Rapporteur on the rights of indigenous peoples, James Anaya: The situation of indigenous peoples in the United States of America,” August 30, 2012.
20 HPAIED, 2008; Miller, 2012; UN HRC, 2012.
21 NCAI, 2010.
22 NCAI, 2010; US Commission on Civil Rights, 2003.
23 National Public Radio, “Indian Nations Squeezed by Sequester,” March 26, 2013.
24 Lowrey Annie, “Pain on the Reservation,” The New York Times, July 12, 2013.
25 Federal Reserve, 2012.
26 Miller 2012; Federal Reserve, 2012; UN HRC, 2012.
27 HPAIED, 2008; Miller, 2012; NCAI, 2010.
28 Cross, Terry, Kathleen Fox, Jody Becker-Green, Jaime Smith, and Angela A. A. Willeto, “Case Studies in Tribal Data Collection and Use,” National Indian Child Welfare Association, February 2004.
29 Sahota, Puneet Chawla, “Research Regulation in American Indian/Alaska Native Communities: Policy and Practice Considerations,” NCAI Policy Research Center, 2007; Cross et. al., 2004.
30 Cross et. al., 2004.
31 U.S. Commission on Civil Rights, 2003.
32 Letter to tribal leaders from Donald E. Laverdure, Acting Assistant Secretary for Indian Affairs, Department of the Interior, July 2, 2012.
33 Capriccioso Rob, “Legal and Political Questions Surround Interior’s Decision Not to Release Tribal Jobs Survey,” Indian Country Today Media Network, July 5, 2012.
34 Federal Reserve, 2012.
35 U.S. Census Bureau, American Community Survey, 2010 Selected Population Tables.
36 Sahota, 2007; Cross et. al., 2004.
37 Sahota, 2007.
38 Cross et. al., 2004.
The Administration for Native Americans: Nearly 40 years of Community-Driven Support for Social and Economic Development1 In NAPA, entities eligible for assistance include federally and state recog-
nized Tribes, Alaska Natives, consortia of Indian Tribes, urban Indian centers, nonprofit native organizations in Alaska, national, regional, or local nonprofit Native American organizations with Native American community specific objectives, public and private agencies serving native peoples from Hawaii, Guam, American Samoa, or the Commonwealth of the Northern Mariana Islands, Tribal Colleges and Universities, and colleges and universities located in Hawaii, Guam, American Samoa serving Native American Pacific Islanders.

Making the Invisible Visible:Urban Indian Community Development1 Remarks to Metropolitan Policy Roundtable, White House Office of Urban
Affairs and Domestic Policy Council, July 13, 2009.
2 U.S. Census Bureau, American Community Survey, Selected Population Tables 2006-2010; U.S. Census Bureau, Census 2010, American Indian/Alaska Native Summary File.
3 NCES, Status and Trends in the Education of American Indians and Alaska Natives, 2005.
4 U.S. Census Bureau, ACS 2010
5 Robert Wood Johnson Foundation, “Overweight and Obesity Among Ameri-can Indian and Alaska Native Youths,” May 2010.
6 Austin, Algernon, “American Indians and the Great Recession,” Economic Policy Institute, December 2009.
Community Outreach and Patient Empowerment: A Collaborative Initiative for Chronic Disease Management in Navajo Nation1 Howard, B.V., et al., Rising tide of cardiovascular disease in American
Indians. The Strong Heart Study. Circulation, 1999. 99: p. 2389-95.
2 Liao, Y., et al., Surveillance of health status in minority communities - Racial and Ethnic Approaches to Community Health Across the U.S. (REACH U.S.), in Risk Factor Survey2011: United States. p. 1-44.
3 Ibid.
4 Sequist, T.D., T. Cullen, and K.J. Acton, Indian health service innovations have helped reduce health disparities affecting american Indian and alaska native people. Health Aff 2011. 30: p. 1965-73.
5 Ibid.
6 Simonds, V.W., et al., An assessment of printed diabetes-prevention materi-als available to a Northern Plains tribe. J Health Commun, 2011. 16: p. 431-47.
Investing in Our Next Generation: A Native Hawaiian Model for Economic Self-Sufficiency1 “Native Hawaiian” refers to an individual with ancestry of the native people
of Hawaii, while “native Hawaiian” refers to an individual with 50% or more ancestry of the native people of Hawaii. Only “native Hawaiians” are eligible to secure lease awards on Hawaiian Home Lands.
You Have to Scale Down Before You Can Scale Up: A Micro-Enterprise Story1 Nielsen Claritas SiteReport (2011 estimates), California Department of
Education, Huntington Beach Police Department.
2 Nielsen Claritas SiteReport (2011 estimates), 2010 Census.
Planning for Driving Retirement: Context and Considerations1 U.S. Census Bureau, “Population 65 Years and Over in the United States,”
2007-2011 American Community Survey 5-Year Estimates; National Council on Aging, “Economic Security for Seniors,” 2012.
2 U.S. Census, ACS 2007-2011.
3 AARP Public Policy Institute, “Boomers at the Bottom: How Will Low-Income Boomers Cope in Retirement?” April 2008.
4 Institute on Assets and Social Policy, “From Bad to Worse: Senior Economic Insecurity on the Rise,” 2011. Economic insecurity is defined as the inabil-ity to afford essential costs of living related to housing, health care, food, and utilities.
5 IASP 2011.
6 AAA, “Your Driving Costs,” April 2013.
7 U.S. Census, ACS 2007-2011.
8 Coughlin, Joseph, “Transportation and Older Persons: Perceptions and Preferences,” AARP Public Policy Institute, 2001.
9 Bailey, Linda, “Aging Americans: Stranded without Options,” Surface Trans-portation Policy Project, 2004.
10 Freund, Katherine, “Independent Transportation Network®: The Next Best Thing to Driving,” Generations, Journal of the American Society on Aging, pp. 70-71, Summer 2003.
11 American Public Transportation Association, “Public Transportation: Moving America Forward,” 2005, p. 10.
12 Burkhardt, J.E. Improving Public Transit Options for Older Persons, 2003.
13 www.beverlyfoundationlegacy.org/wp-content/uploads/Fact-Sheet-5-the-5-as-pdf
14 Jayson, Sharon, “5 must-do’s as age wave bears down on the USA,” USA Today, October 21, 2013.
45Community Investments, Fall 2013 – Volume 25, Number 2

Free sub
scriptio
ns an
d ad
ditio
nal co
pies are
available u
po
n req
uest fro
m th
e Co
mm
un
ity D
evelopment D
epartment, Federal R
eserve Bank of
San Francisco, 10–1 Market Street, San Francisco,
California 94105, or call (415) 974-2765.
Change-of-address and subscription cancellations
should be sent directly to the Com
munity D
evelop-m
ent Departm
ent. Please include the current mail-
ing label as well as any new
information.
The views expressed are not necessarily those of the
Federal Reserve B
ank of San Francisco or the Federal R
eserve System. M
aterial herein may be reprinted
or abstracted as long as Com
munity Investm
ents is credited. Please provide G
abriella Chiarenza in the
Com
munity D
evelopment D
epartment w
ith a copy of any publication in w
hich such material is reprinted.
Fed
eral r
eserve B
an
k oF s
an F
ran
cisc
o101 M
ARK
ET STREETSA
N FRA
NC
ISCO
, CA
94105
AD
DRESS SERV
ICE REQ
UESTED
AU
10252