Embed Size (px)
Citation preview

FINANCIAL STATEMENTS AND
INDEPENDENT AUDITORS’ REPORT
COMMUNITY DEVELOPMENT ADMINISTRATION
RESIDENTIAL REVENUE BONDS
JUNE 30, 2012 AND 2011

Community Development Administration
Residential Revenue Bonds
TABLE OF CONTENTS
PAGE
INDEPENDENT AUDITORS’ REPORT 3
FINANCIAL STATEMENTS
STATEMENTS OF NET ASSETS 5
STATEMENTS OF REVENUE, EXPENSES AND
CHANGES IN NET ASSETS 6
STATEMENTS OF CASH FLOWS 7
NOTES TO FINANCIAL STATEMENTS 9
SUPPLEMENTAL DISCLOSURES OF CHANGE IN FAIR VALUE OF
INVESTMENTS AND MORTGAGE-BACKED SECURITIES 54

- 3 -
INDEPENDENT AUDITORS’ REPORT
Office of the Secretary
Department of Housing and Community Development
We have audited the accompanying financial statements of the Community Development
Administration Residential Revenue Bonds (the Fund) of the Department of Housing and
Community Development of the State of Maryland as of and for the years ended June 30, 2012
and 2011, as listed in the table of contents. These financial statements are the responsibility of
the Fund’s management. Our responsibility is to express an opinion on these financial
statements based on our audits.
We conducted our audits in accordance with auditing standards generally accepted in the
United States of America. Those standards require that we plan and perform the audit to obtain
reasonable assurance about whether the financial statements are free of material misstatement.
An audit includes examining, on a test basis, evidence supporting the amounts and disclosures in
the financial statements. An audit also includes assessing the accounting principles used and
significant estimates made by management, as well as evaluating the overall financial statement
presentation. We believe that our audits provide a reasonable basis for our opinion.
As discussed in Note 1, the financial statements present only the Community
Development Administration Residential Revenue Bonds and do not purport to, and do not,
present fairly the financial position of the Department of Housing and Community Development
of the State of Maryland as of June 30, 2012 and 2011, and the changes in its net assets and cash
flows for the years then ended, in conformity with accounting principles generally accepted in
the United States of America.
In our opinion, the financial statements referred to in the first paragraph present fairly, in
all material respects, the financial position of the Community Development Administration
Residential Revenue Bonds of the Department of Housing and Community Development of the
State of Maryland as of June 30, 2012 and 2011, and the changes in its net assets and its cash
flows for the years then ended, in conformity with accounting principles generally accepted in
the United States of America.
- 4 -
Our audits were conducted for the purpose of forming an opinion on the basic financial
statements taken as a whole. The Supplemental Disclosures of Change in Fair Value of
Investments and Mortgage-Backed Securities, which is the responsibility of management, are
presented for purposes of additional analysis and are not a required part of the basic financial
statements. Such information has not been subjected to the auditing procedures applied in our
audits of the basic financial statements and, accordingly, we express no opinion or provide any
assurance on it.
Baltimore, Maryland
September 28, 2012

Community Development Administration
Residential Revenue Bonds
STATEMENTS OF NET ASSETS
(in thousands)
June 30, 2012 and 2011
See notes to financial statements
- 5 -
2012 2011
RESTRICTED ASSETS
Restricted current assets
Cash and cash equivalents on deposit with trustee 329,651$ 301,405$
Mortgage-backed securities 426 566
Single family mortgage loans 36,213 35,883
Multi-family mortgage loans 1,545 1,392
Accrued interest and other receivables 21,411 20,139
Claims receivable on foreclosed and other loans,
net of allowance 87,028 92,742
Real estate owned 6,558 19,226
Total restricted current assets 482,832 471,353
Restricted long-term assets
Investments 29,593 26,499
Mortgage-backed securities, net of current portion 17,026 53,878
Single family mortgage loans, net of current portion
and allowance 1,867,850 2,031,222
Multi-family mortgage loans, net of current portion 29,132 30,901
Accrued interest receivable, net of current portion 11 9
Deferred bond issuance costs 14,108 15,296
Deferred outflow on interest rate swap agreements 35,862 26,475
Total restricted long-term assets 1,993,582 2,184,280
Total restricted assets 2,476,414$ 2,655,633$
LIABILITIES AND NET ASSETS
Current liabilities
Accrued interest payable 30,596$ 33,022$
Accounts payable 1,403 695
Rebate liability 59 637
Bonds payable 66,795 79,350
Deposits by borrowers 2,138 2,102
Total current liabilities 100,991 115,806
Long-term liabilities
Rebate liability, net of current portion 6,836 6,571
Bonds payable, net of current portion 1,961,603 2,127,025
Deposits by borrowers, net of current portion 2,396 2,151
Interest rate swap agreements 35,862 26,475
Total long-term liabilities 2,006,697 2,162,222
Total liabilities 2,107,688 2,278,028
NET ASSETS
Restricted 368,726 377,605
Total liabilities and net assets 2,476,414$ 2,655,633$

Community Development Administration
Residential Revenue Bonds
STATEMENTS OF REVENUE, EXPENSES AND
CHANGES IN NET ASSETS
(in thousands)
Years ended June 30, 2012 and 2011
See notes to financial statements
- 6 -
2012 2011
Operating revenue
Interest on mortgage loans 117,437$ 125,772$
Interest on mortgage-backed securities 827 131
Increase in fair value of mortgage-backed securities 3,980 -
Interest income on investments, net of rebate 1,377 1,384
Increase (decrease) in fair value of investments, net of rebate 1,309 (2,186)
Fee income 510 632
Gain on early retirement of debt 5,866 1,584
Gain on sale of mortgage loans - 513
Other operating revenue 1,212 250
132,518 128,080
Operating expenses
Interest expense on bonds 96,232 99,384
Professional fees and other operating expenses 6,940 4,362
Provision for loan losses 16,965 5,169
Origination expenses 2,336 2,762
Losses and expenses on real estate owned, net 8,261 5,780
Loss on foreclosure claims, net 350 547
Amortization of bond issuance costs 582 561
131,666 118,565
Operating income 852 9,515
Nonoperating revenue (expenses)
Increase (decrease) in fair value of mortgage-backed securities 512 (585)
Total nonoperating revenue (expenses) 512 (585)
Transfers of funds, net, as permitted by the various
bond indentures (10,243) 81,237
Changes in net assets (8,879) 90,167
Net assets - restricted at beginning of year 377,605 287,438
Net assets - restricted at end of year 368,726$ 377,605$

Community Development Administration
Residential Revenue Bonds
STATEMENTS OF CASH FLOWS
(in thousands)
Years ended June 30, 2012 and 2011
(continued)
- 7 -
2012 2011
Cash flows from operating activities
Principal and interest received on mortgage loans 194,660$ 212,553$
Principal and interest received on mortgage-backed securities 1,450 39
Escrow funds received on multi-family loans 1,999 2,121
Escrow funds paid on multi-family loans (1,718) (3,036)
Mortgage insurance claims received 89,924 63,115
Foreclosure expenses paid (8,626) (8,182)
Transfer claims receivable on foreclosed and
other loans - (775)
Loan fees received - 152
Loan fees disbursed (18) (1,374)
Purchase of mortgage loans (3,245) (116,173)
Purchase of mortgage-backed securities (174,179) (55,106)
Transfer of single family loans, net of deferred fees - (106,114)
Transfer of mortgage-backed securities 153,129 -
Funds received from sale of mortgage-backed securities 62,030 -
Professional fees and other operating expenses (6,787) (4,241)
Funds received from sale of mortgage loans - 15,488
Other income received 1,212 250
Other reimbursements (395) (332)
Net cash provided by (used in) operating activities 309,436 (1,615)
Cash flows from investing activities
Proceeds from maturities or sales of investments 971 72,128
Purchases of investments (2,695) (2,777)
Transfer of investments - 5,562
Transfer arbitrage rebate liability - 5,993
Arbitrage rebates paid (646) (815)
Interest received on investments 1,586 2,395
Net cash (used in) provided by investing activities (784) 82,486
Cash flows from noncapital financing activities
Proceeds from sale of bonds - 132,193
Payments on bond principal (171,080) (142,365)
Bond issuance costs (133) (1,362)
Transfer refunded bond issuance costs - (352)
Interest on bonds (98,950) (100,080)
Transfers among Funds (10,243) 81,237
Net cash used in noncapital financing activities (280,406) (30,729)
NET INCREASE IN CASH AND CASH
EQUIVALENTS ON DEPOSIT WITH TRUSTEE 28,246 50,142
Cash and cash equivalents on deposit with trustee at beginning of year 301,405 251,263
Cash and cash equivalents on deposit with trustee at end of year 329,651$ 301,405$

Community Development Administration
Residential Revenue Bonds
STATEMENTS OF CASH FLOWS - CONTINUED
(in thousands)
Years ended June 30, 2012 and 2011
See notes to financial statements
- 8 -
2012 2011
Reconciliation of operating income to net cash provided by
(used in) operating activities
Operating income 852$ 9,515$
Adjustments to reconcile operating income to net cash
provided by (used in) operating activities
Decrease (increase) in assets
Mortgage loans 158,914 (25,967)
Mortgage-backed securities 38,850 (55,029)
Accrued interest and other receivables (1,274) (1,997)
Claims receivable on foreclosed and other loans (7,315) (20,310)
Real estate owned 12,668 (12,641)
Due from other Funds - 39
(Decrease) increase in liabilities
Accrued interest payable (2,426) (363)
Accounts payable 708 298
Rebate liability (313) 5,549
Deposits by borrowers 281 (915)
Amortizations
Deferred income and expense on loans 1,826 2,130
Investment discounts and premiums 4 154
Bond original issue discounts and premiums (292) (333)
Deferred bond issuance costs 582 561
Loan fees and expenses deferred (18) (1,222)
Loan fees and expenses transferred and sold - 580
Provision for loan losses 16,965 5,169
(Increase) decrease in fair value of investments (1,374) 2,244
Arbitrage rebates paid 646 815
Transfer arbitrage rebate liability - (5,993)
Increase in fair value of mortgage-backed securities (3,980) -
Realized gains on mortgage-backed securities sold 2,634 -
Gain on early retirement of debt (5,866) (1,584)
Interest received on investments (1,586) (2,395)
Interest on bonds 98,950 100,080
Net cash provided by (used in) operating activities 309,436$ (1,615)$

Community Development Administration
Residential Revenue Bonds
NOTES TO FINANCIAL STATEMENTS
(in thousands)
June 30, 2012 and 2011
- 9 -
NOTE 1 - AUTHORIZING LEGISLATION AND PROGRAM DESCRIPTION
The Community Development Administration (CDA) was created in 1970 by Sections 266
DD-1 to 266 DD-8 of Article 41 (now in Sections 4-101 through 4-255 of the Housing and
Community Development Article) of the Annotated Code of Maryland to meet the shortage
of adequate, safe and sanitary housing in the State of Maryland, particularly for persons or
families of limited income. CDA is in the Division of Development Finance in the
Department of Housing and Community Development (DHCD) of the State of Maryland.
The accompanying financial statements only include CDA’s Residential Revenue Bonds (the
Fund). CDA’s other Funds are not included. The Fund was established to issue bonds
primarily to originate or purchase single family mortgage loans.
NOTE 2 - SUMMARY OF SIGNIFICANT ACCOUNTING POLICIES
Basis of Presentation
The Fund is accounted for as an enterprise fund. Accordingly, the accompanying financial
statements have been prepared using the accrual method of accounting and on the basis of
accounting principles generally accepted in the United States of America (GAAP).
Generally Accepted Accounting Principles
CDA reports its financial activities by applying Standards of Governmental Accounting and
Financial Reporting as promulgated by the Governmental Accounting Standards Board
(GASB). Consequently, CDA applies all applicable GASB pronouncements as well as
Financial Accounting Standards Board (FASB) Statements and Interpretations, APB
Opinions, and ARBS of the Committee on Accounting Procedure issued on or prior to
November 30, 1989, unless those pronouncements conflict with or contradict GASB
pronouncements.

Community Development Administration
Residential Revenue Bonds
NOTES TO FINANCIAL STATEMENTS - CONTINUED
(in thousands)
June 30, 2012 and 2011
- 10 -
NOTE 2 - SUMMARY OF SIGNIFICANT ACCOUNTING POLICIES (Continued)
In accordance with accounting guidance issued by GASB, net assets should be reported as
restricted when constraints placed on net asset use are either: externally imposed by creditors
(such as through debt covenants), grantors, contributors, or laws or regulations of other
governments; or are imposed by law through constitutional provisions or enabling legislation.
Accordingly, all net assets of the Fund are restricted as to their use as all net assets are
pledged to bondholders.
The Annual Financial Report may include a Management’s Discussion and Analysis. Since
CDA is an enterprise fund included in the State of Maryland’s Comprehensive Annual
Financial Report, a separate Management’s Discussion and Analysis is not required in these
financial statements. CDA prepares a Management’s Discussion and Analysis for the
General Accounting Division of the State of Maryland that is not part of these financial
statements.
Cash and Cash Equivalents on Deposit with Trustee
Cash equivalents may include money market funds, repurchase agreements, investment
agreements and any other investments, primarily obligations of the U.S. Treasury and U.S.
Government Agencies, which have maturities of 90 or less days at the time of purchase. As
of June 30, 2012 and 2011, the Fund’s cash equivalents were invested in money market
mutual funds. Cash equivalents are more fully described in Note 3.
Investments
Investments are principally governmental debt securities or investment agreements
collateralized by governmental debt securities. Debt securities are stated at fair value, based
on quoted market prices. Investments are classified as current or long-term based on the
maturity date or call date. Callable investments are classified as current, if exercise of the
call within the next fiscal year is probable. Investments are more fully described in Note 3.

Community Development Administration
Residential Revenue Bonds
NOTES TO FINANCIAL STATEMENTS - CONTINUED
(in thousands)
June 30, 2012 and 2011
- 11 -
NOTE 2 - SUMMARY OF SIGNIFICANT ACCOUNTING POLICIES (Continued)
Mortgage-Backed Securities
These guaranteed securities are issued in connection with mortgage loans on single family
homes. They are stated at fair value, based on quoted market prices. Mortgage-backed
securities are more fully described in Note 3.
Mortgage Loans
Mortgage loans are carried at their unpaid principal balances, net of allowance and
unamortized loan fees and expenses. Loan fees and expenses are deferred and amortized
over the life of the related loans using the effective interest method. Any single family
mortgage loan in foreclosure with a pending insurance claim is recorded as claims
receivables. See Notes 4 and 14 for additional information on mortgage loans and mortgage
insurance, respectively.
Accrued Interest and Other Receivables
Accrued interest and other receivables include interest on loans and investments. On insured
single family loans, interest ceases to accrue after foreclosure. On insured multi-family
mortgage loans that are in default, CDA continues to accrue interest until receipt of a
mortgage insurance claim. See Note 5 for additional information.
Claims Receivable on Foreclosed and Other Loans
Claims receivable on foreclosed and other loans include insured single family loans that are
in foreclosure or other single family loans with pending insurance claims, recorded net of
allowance. These loans are primarily insured by U.S. Government Agencies or private
mortgage insurers. Foreclosed loans insured by private mortgage insurers are held in this
account until the insurer has made a final determination as to claim payment or transfer of the
property to CDA.

Community Development Administration
Residential Revenue Bonds
NOTES TO FINANCIAL STATEMENTS - CONTINUED
(in thousands)
June 30, 2012 and 2011
- 12 -
NOTE 2 - SUMMARY OF SIGNIFICANT ACCOUNTING POLICIES (Continued)
Real Estate Owned
Real estate owned represents real estate acquired through foreclosure or deeds-in-lieu and is
stated at the lower of cost or fair value less estimated costs to sell. Expenses incurred related
to real estate owned are reported on the Statements of Revenue, Expenses and Changes in
Net Assets.
Allowance for Loan Losses
Substantially all of the single family mortgage loans of the Fund are insured or guaranteed by
agencies of the U.S. Government, the Maryland Housing Fund (MHF), or private mortgage
insurers. As of June 30, 2012 and 2011, CDA has established an allowance for loan losses
on the uninsured portions of single family mortgage loans with private mortgage insurance.
CDA has also established an allowance for loan losses on single family loans with private
mortgage insurance that are in foreclosure. Management believes the allowance established
is adequate based on prior experience and evaluations from DHCD’s asset management
group and a current assessment of probability and risk of loss due to default or deteriorating
economic conditions. Multi-family mortgage loans of the Fund are insured or guaranteed; as
such, no allowance for loans losses was necessary as of June 30, 2012 and 2011. See Note 4
for additional information on allowance for loan losses.
Deferred Bond Issuance Costs
Costs incurred in issuing bonds are capitalized and amortized using the effective interest
method for each respective bond issue. When bonds are redeemed early with mortgage
prepayments, a proportionate share of the remaining unamortized costs is recognized as a
loss on the Statements of Revenue, Expenses and Changes in Net Assets. If unamortized
original issue premiums exceed unamortized deferred issuance costs and original issue
discounts, CDA records a gain. However, in an economic refunding, CDA defers
unamortized costs and redemption premiums as an offset to the new bonds as more fully
described in Note 10.

Community Development Administration
Residential Revenue Bonds
NOTES TO FINANCIAL STATEMENTS - CONTINUED
(in thousands)
June 30, 2012 and 2011
- 13 -
NOTE 2 - SUMMARY OF SIGNIFICANT ACCOUNTING POLICIES (Continued)
Bonds Payable
Bonds payable are carried at their unpaid principal balances, net of unamortized deferred
gain or loss for bonds refunded for economic purposes and original issue discounts or
premiums. See Notes 6, 7, 8, 9, 10 and 12 for more information.
Deposits by Borrowers
This account consists of escrows and reserves held by CDA on behalf of multi-family
housing developments. CDA invests these deposits and, for reserves, allows earnings to
accrue to the benefit of the mortgagor. Escrows represent amounts held by CDA for
mortgage insurance and hazard insurance premiums and real estate taxes, all of which are
generally paid annually and which are classified as a current liability. Based on the current
year’s reserve disbursements, CDA has estimated the current reserve liability. The balance
of the reserves is classified as long-term. See Note 12 for further information on changes in
long-term obligations.
Rebate Liability on Investments
Regulations governing the issuance of tax-exempt debt place limitations on permitted
investment yield on borrowed funds. Based on these regulations, CDA is required to
periodically rebate excess earnings from investments to the United States Treasury. In
addition, the liability also includes an estimate of the rebate obligation related to unrealized
gains as a result of recording investments at fair value. Rebate liability is more fully
described in Note 11.

Community Development Administration
Residential Revenue Bonds
NOTES TO FINANCIAL STATEMENTS - CONTINUED
(in thousands)
June 30, 2012 and 2011
- 14 -
NOTE 2 - SUMMARY OF SIGNIFICANT ACCOUNTING POLICIES (Continued)
Interest Rate Exchange Agreements (Swaps)
Interest rate exchange agreements (swaps) are derivative instruments which are entered into
as cash flow hedges to reduce exposure to identified financial risks associated with assets,
liabilities or expected transactions or to lower the costs of borrowings and are considered to
be hedging derivative instruments. Swaps are reported at fair value in the Statements of Net
Assets and are tested quarterly for hedge effectiveness. Effectiveness is established if the
changes in cash flows of the swaps substantially offset the changes in cash flows of the
hedgeable items. The changes in fair values of the swaps that are determined to be effective
hedges will be recognized as deferred inflows or outflows in the Statements of Net Assets.
The changes in fair value of the swaps that are determined not to be effective hedges will be
reported in the Statements of Revenue, Expenses and Changes in Net Assets. CDA’s swaps
are more fully described in Note 9.
Mortgage Yield Limitations
All mortgage loans are subject to yield limitations under the Internal Revenue Service Code
(the Code) in order for the associated bonds to maintain their tax-exempt status. At the time
of bond issuance and over the term of the bonds, CDA determines and maintains compliance
with the permitted mortgage yield on the loans. In certain bond refunding transactions, CDA
transfers loans from prior series of bonds to the refunding series. CDA monitors the yield on
these transferred loans to ensure that the composite yield over the term of the bonds is within
the yield limitations of the Code. If at any time the composite yields on the transferred loans
are out of compliance with the Code, CDA has certain remedies available to bring the yield
into compliance. As of June 30, 2012 and 2011, all mortgage loan yields were in compliance
with the Code.

Community Development Administration
Residential Revenue Bonds
NOTES TO FINANCIAL STATEMENTS - CONTINUED
(in thousands)
June 30, 2012 and 2011
- 15 -
NOTE 2 - SUMMARY OF SIGNIFICANT ACCOUNTING POLICIES (Continued)
Interest on Mortgage Loans and Mortgage-Backed Securities
Interest on mortgage loans and mortgage-backed securities is calculated using the effective
interest method.
Fee Income
CDA receives single family commitment fees and multi-family financing fees at loan
origination. These fees are deferred and amortized over the life of the loan.
Origination Expenses
CDA pays originators of its single family loans an origination fee and a servicer release fee.
On some single family loans CDA provides the borrowers with grants toward loan down
payment and closing costs. These CDA expenses are deferred and amortized over the life of
the loan.
Administrative Support
In addition to expenses incurred directly by the Fund, CDA receives certain support services
from other divisions of DHCD. Support services and the operating expenses of CDA have
been allocated to CDA’s General Bond Reserve Fund and reported in the financial statements
of CDA’s Revenue Obligation Funds. The General Bond Reserve Fund records these
expenses as invoiced by DHCD for the fiscal year.
The employees of CDA are covered by the Maryland State Retirement and Pension System
and the costs of employees’ retirement benefits are included in the salaries and related costs
charged to CDA’s General Bond Reserve Fund. See Note 15 for additional information.

Community Development Administration
Residential Revenue Bonds
NOTES TO FINANCIAL STATEMENTS - CONTINUED
(in thousands)
June 30, 2012 and 2011
- 16 -
NOTE 2 - SUMMARY OF SIGNIFICANT ACCOUNTING POLICIES (Continued)
Revenue and Expenses
CDA distinguishes operating revenue and expenses from nonoperating items in accordance
with accounting guidance issued by GASB. Operating revenue and expenses are identified
as those activities that are directly related to financing affordable housing in the State of
Maryland. All of the Fund’s activities are considered to be operating except for increases
and decreases in the fair value of mortgage-backed securities that are held within the
portfolio.
Use of Estimates
The preparation of financial statements in conformity with accounting principles generally
accepted in the United States of America requires management to make estimates and
assumptions. These estimates and assumptions affect the reported amounts of assets and
liabilities and disclosures of contingent assets and liabilities at the date of the financial
statements and the reported amounts of revenue, expenses, gains and losses during the
reporting period. Actual results could differ from these estimates.
Recent Accounting Pronouncements
GASB has issued Statement No. 63 Financial Reporting of Deferred Outflows of Resources,
Deferred Inflows of Resources, and Net Position, which will be effective for CDA beginning
with its year ending June 30, 2013 and Statement No. 65 Items Previously Reported as Assets
and Liabilities, which will be effective for CDA beginning with its year ending June 30,
2014. CDA will implement these statements as necessary as of their effective date. While
CDA is still in-process of determining the effect of implementing these GASB statements,
they are not expected to have a material effect on the financial position of CDA.

Community Development Administration
Residential Revenue Bonds
NOTES TO FINANCIAL STATEMENTS - CONTINUED
(in thousands)
June 30, 2012 and 2011
- 17 -
NOTE 3 - CASH, CASH EQUIVALENTS, INVESTMENTS AND MORTGAGE-BACKED
SECURITIES
Bond proceeds and revenues from mortgages, mortgage-backed securities and investments
are invested in authorized investments as defined in the Residential Revenue Bond
Resolution (the Resolution) and in CDA’s Investment Policy until required for purchasing
mortgage-backed securities or originating mortgage loans, funding reserves, paying bond
debt service or redeeming outstanding bonds and notes, and funding program expenses.
Authorized investments include obligations of the U.S. Treasury, U.S. Government
Agencies, repurchase agreements, investment agreements, money market funds and
certificates of deposit.
The following assets, reported at fair value and held by the Fund as of June 30, 2012 and
2011, are evaluated in accordance with GASB accounting guidance for interest rate risk,
credit risk, concentration of credit risk and custodial credit risk.
Assets 2012 2011
Cash and Cash Equivalents:
Federated Prime Cash Obligations Fund 329,651$ -$
Federated Treasury Obligations Fund - 301,405
Investments:
Obligations of U.S. Government Agencies 9,961 8,590
Repurchase and Investment Agreements 19,632 17,909
GNMA Mortgage-backed Securities 17,452 54,444
Total 376,696$ 382,348$
Interest Rate Risk
Interest rate risk is the risk that changes in interest rates will adversely affect the fair value of
an investment. As a means of limiting its exposure to fair value losses from rising interest
rates, CDA’s Investment Policy requires that the maturities of the investment portfolio are
scheduled to meet the cash requirements for bond debt service, projected loan originations
and ongoing operations.

Community Development Administration
Residential Revenue Bonds
NOTES TO FINANCIAL STATEMENTS - CONTINUED
(in thousands)
June 30, 2012 and 2011
- 18 -
NOTE 3 - CASH, CASH EQUIVALENTS, INVESTMENTS AND MORTGAGE-BACKED
SECURITIES (Continued)
As of June 30, 2012, the amortized cost, fair value and maturities for these assets were as
follows:
Amortized Fair Less More
Asset Cost Value than 1 1 - 5 6 - 10 11 - 15 than 15
Federated Prime Cash
Obligations Fund 329,651$ 329,651$ 329,651$ -$ -$ -$ -$
Obligations of U.S.
Government Agencies 7,064 9,961 - - 2,671 - 7,290
Repurchase agreements/
Investment agreements 19,632 19,632 - - - - 19,632
GNMA mortgage-backed
securities 16,179 17,452 - - - - 17,452
Total 372,526$ 376,696$ 329,651$ -$ 2,671$ -$ 44,374$
Maturities (in years)
As of June 30, 2011, the amortized cost, fair value and maturities for these assets were as
follows:
Amortized Fair Less More
Asset Cost Value than 1 1 - 5 6 - 10 11 - 15 than 15
Federated Treasury
Obligations Fund 301,405$ 301,405$ 301,405$ -$ -$ -$ -$
Obligations of U.S.
Government Agencies 7,067 8,590 - - 2,493 - 6,097
Repurchase agreements/
Investment agreements 17,909 17,909 - - - - 17,909
GNMA mortgage-backed
securities 55,029 54,444 - - - - 54,444
Total 381,410$ 382,348$ 301,405$ -$ 2,493$ -$ 78,450$
Maturities (in years)

Community Development Administration
Residential Revenue Bonds
NOTES TO FINANCIAL STATEMENTS - CONTINUED
(in thousands)
June 30, 2012 and 2011
- 19 -
NOTE 3 - CASH, CASH EQUIVALENTS, INVESTMENTS AND MORTGAGE-BACKED
SECURITIES (Continued)
The Federated Prime Cash Obligations Fund invests primarily in short-term, high-quality,
fixed-income securities issued by banks, corporations and the U.S. Government. The
Federated Treasury Obligations Fund invests primarily in repurchase agreements
collateralized by Treasury securities and U.S. Treasuries. Both operate in accordance with
Rule 2a-7 of the Investment Company Act of 1940, as amended. Both can reasonably be
expected to have a fair value that will be unaffected by interest rate changes because the
interest rates are variable and the principal can be recovered on demand. As noted above, as
of June 30, 2012 and 2011, the cost of the money market mutual fund approximated fair
value.
Credit Risk and Concentration of Credit Risk
Credit risk is the risk that an issuer or other counterparty to an investment will not fulfill its
obligations. Neither CDA’s Investment Policy nor the Resolution requires investment
agreements or deposits to be collateralized. CDA’s Investment Policy places no limit on the
amount that CDA may invest in any one issuer or counterparty. According to the Resolution
and CDA’s Investment Policy, securities must be at a rating no lower than the rating on the
bonds or, if an investment maintains only a short-term rating, a rating not less than F1/P-1;
and financial institutions who are a counterparty to CDA in investment agreements must be
rated at least comparable to the existing rating on CDA bonds unless counterparty ratings
lower than the bond ratings are permitted and do not affect the ratings on the bonds. In
addition, certain investment and repurchase agreements require counterparty ratings no less
than the ratings on the bonds. As of June 30, 2012 and 2011, all counterparty ratings were at
least equal to the ratings on the Fund’s bonds. The ratings on Residential Revenue Bonds as
of June 30, 2012 and 2011 were Aa2 by Moody’s Investors Service and AA by Fitch Ratings.
The following table provides credit quality rating information for the investment portfolio
and individual issuers, if they represent 5 percent or more of total investments in accordance
with accounting guidance issued by GASB.
Community Development Administration
Residential Revenue Bonds
NOTES TO FINANCIAL STATEMENTS - CONTINUED
(in thousands)
June 30, 2012 and 2011
- 20 -
NOTE 3 - CASH, CASH EQUIVALENTS, INVESTMENTS AND MORTGAGE-BACKED
SECURITIES (Continued)
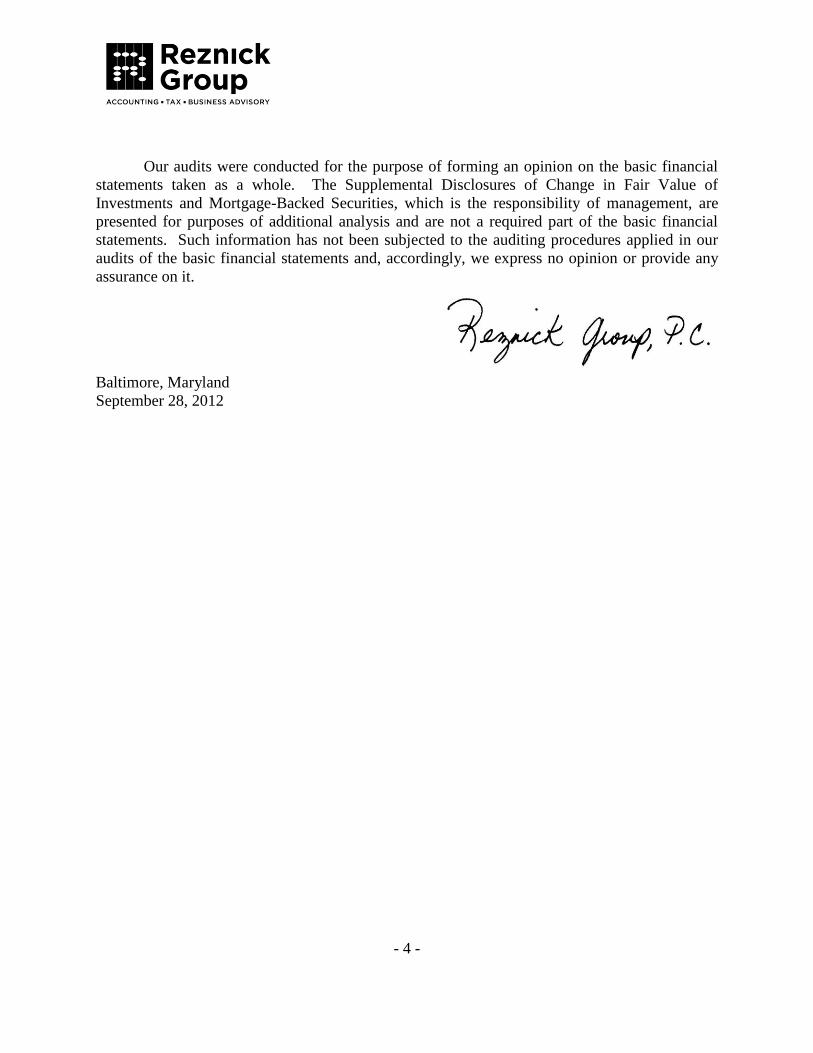
As of June 30, 2012, credit ratings and allocation by type of investments for the following
assets were:
Percentage Securities
Fair of total Money market credit Rating
Asset Value investments fund rating rating agency
Federated Prime Cash Obligations Fund 329,651$ 87.51% Aaa Moody’s
Government National Mortgage Association Direct U.S.
Mortgage-backed securities 17,452 4.63% Obligations
Obligations of U.S. Government Agencies 9,961 2.65% Aaa Moody’s
Underlying
Collateralized repurchase agreements and securities
investment agreements: credit rating
WestLB rated Aaa by Moody’s* 19,632 5.21% Aaa Moody’s
Total 376,696$ 100.00%
* WestLB AG is formerly known as “Westdeutsche Landesbank Gironzentrale.” This investment agreement was entered into prior to July 19, 2001
and is therefore governed by guarantor liability in accordance with the agreement reached between the German Federal Government and the European
Commission (Letter of Understanding I). The current rating of Aaa by Moody's for this investment agreement is based on such guarantor liability. As
of July 19, 2005, all contracts entered into with West LB AG between July 19, 2001 and July 18, 2005 which mature after December 31, 2015, and
contracts entered into after July 18, 2005 are not covered by the guarantor liability, and therefore carry WestLB’s current Moody’s rating of A3.
Subsequent to June 30, 2012, WestLB AG has changed its name to Portigon AG effective July 2, 2012. All existing contractual agreements with
WestLB AG will continue to exist unchanged.

Community Development Administration
Residential Revenue Bonds
NOTES TO FINANCIAL STATEMENTS - CONTINUED
(in thousands)
June 30, 2012 and 2011
- 21 -
NOTE 3 - CASH, CASH EQUIVALENTS, INVESTMENTS AND MORTGAGE-BACKED
SECURITIES (Continued)
As of June 30, 2011, credit ratings and allocation by type of investments for the following
assets were:
Percentage Securities
Fair of total Money market credit Rating
Asset Value investments fund rating rating agency
Federated Treasury Obligations Fund 301,405$ 78.83% Aaa Moody’s
Government National Mortgage Association Direct U.S.
Mortgage-backed securities 54,444 14.24% Obligations
Obligations of U.S. Government Agencies 8,590 2.25% Aaa Moody’s
Underlying
Collateralized repurchase agreements and securities
investment agreements: credit rating
WestLB rated Aa1 by Moody’s* 17,909 4.68% Aaa Moody’s
Total 382,348$ 100.00%
* WestLB AG is formerly known as “Westdeutsche Landesbank Gironzentrale.” This investment agreement was entered into prior to July 19, 2001
and is therefore governed by guarantor liability in accordance with the agreement reached between the German Federal Government and the European
Commission (Letter of Understanding I). The current rating of Aa1 by Moody's for this investment agreement is based on such guarantor liability. As
of July 19, 2005, all contracts entered into with West LB AG between July 19, 2001 and July 18, 2005 which mature after December 31, 2015, and
contracts entered into after July 18, 2005 are not covered by the guarantor liability, and therefore carry WestLB’s current Moody’s rating of A2.
The market value of the underlying collateralized securities in repurchase agreements and
investment agreements is maintained at a minimum of 102 percent of the principal of and
accrued interest on the invested funds by marking to market at least weekly and using an
immediate under value cure provision.

Community Development Administration
Residential Revenue Bonds
NOTES TO FINANCIAL STATEMENTS - CONTINUED
(in thousands)
June 30, 2012 and 2011
- 22 -
NOTE 3 - CASH, CASH EQUIVALENTS, INVESTMENTS AND MORTGAGE-BACKED
SECURITIES (Continued)
All mortgage-backed securities held by CDA are guaranteed by the Government National
Mortgage Association (GNMA), an instrumentality of the United States Government.
GNMA securities are “fully modified pass-through” mortgage-backed securities which
require monthly payments by a Federal Housing Administration (FHA) lender, as the issuer
of the guaranteed security to CDA. GNMA guarantees timely payment of principal and
interest on Guaranteed Securities.
As an investor of GNMA I mortgage-backed securities (MBS), CDA receives separate
principal and interest payments on the 15th of each month; however, for GNMA II MBS,
CDA receives the total principal and interest from a central paying agent on the 20th of each
month. All mortgages backing a GNMA I MBS have the same mortgage rate equal to 50
basis points greater than the coupon, with 44 basis points of servicing fee and 6 basis points
of guaranty fee. Similarly, GNMA II MBS also have 6 basis points of guaranty fee, but the
mortgage rate for the loans backing the security can vary between 25 to 75 basis points
greater than the coupon which may result in a variety of servicing fees.
In January 2012, CDA expanded the sources of financing for its mortgage-backed securities
program through the ongoing sale of forward contracts of GNMA mortgage-backed
securities. These securities are comprised of single family mortgage loans originated by
CDA’s network of approved lender partners. As part of this program, CDA periodically
enters into forward contracts to sell GNMA mortgage-backed securities to investors before
the securities are ready for delivery (referred to as “to-be-announced” or “TBA Mortgage-
Backed Security Contract”). These forward contracts are settled monthly, using funds held
in Residential Revenue Bonds’ additional collateral account, prior to being sold into the
secondary market. As of June 30, 2012, CDA entered into TBA Mortgage-Backed Security
Contracts with a notional amount of $50,037 outstanding. The increase/decrease in the fair
value of GNMA mortgage-backed securities that are part of the TBA program is classified as
operating revenue on the Statements of Revenue, Expenses and Changes in Net Assets.
Community Development Administration
Residential Revenue Bonds
NOTES TO FINANCIAL STATEMENTS - CONTINUED
(in thousands)
June 30, 2012 and 2011
- 23 -
NOTE 3 - CASH, CASH EQUIVALENTS, INVESTMENTS AND MORTGAGE-BACKED
SECURITIES (Continued)
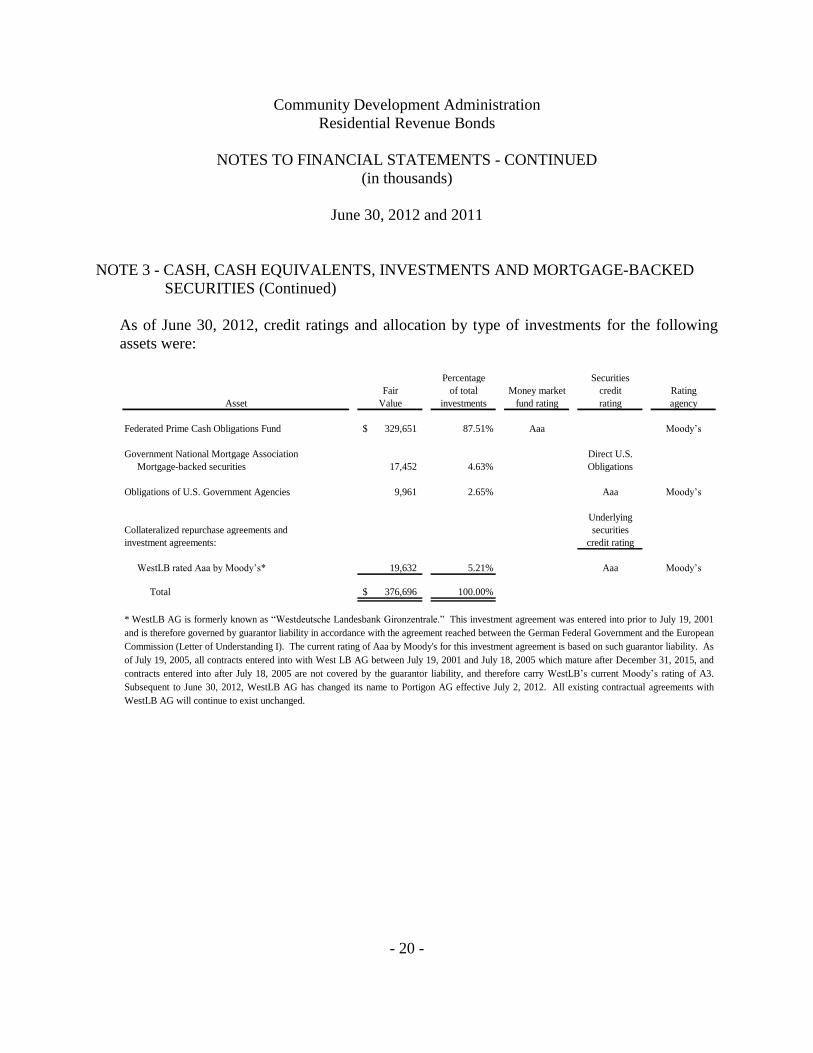
Custodial Credit Risk
Custodial credit risk is the risk that in the event of a bank or counterparty failure, CDA will
not be able to recover its deposits or the value of its collateral securities that are in the
possession of an outside party. As of June 30, 2012 and 2011, the Fund’s investments were
not subject to custodial credit risk under accounting guidance issued by GASB. CDA’s
investments and collateralized securities are held in trust by the trustee or the trustee’s agent,
kept separate from the assets of the bank and from other trust accounts and are held in CDA’s
name.
NOTE 4 - MORTGAGE LOANS
Substantially all single family mortgage loans of the Fund are secured by first liens on the
related property. Approximately 98% of all the single family mortgage loans are credit
enhanced through the FHA mortgage insurance programs, the Veterans Administration and
USDA/RD guarantee programs, the Maryland Housing Fund (MHF) or by private mortgage
insurers. As of June 30, 2012 and 2011, interest rates on such loans ranged from 1.0% to
13.9% and remaining loan terms ranged from approximately 1 to 40 years.
All of the Fund’s multi-family mortgage loans are credit enhanced through FHA, FHLMC or
MHF. Interest rates on such loans range from 5.25% to 12%. As of June 30, 2012 and 2011,
remaining loan terms ranged from approximately 1 to 21 years and less than 3 to 22 years,
respectively.

Community Development Administration
Residential Revenue Bonds
NOTES TO FINANCIAL STATEMENTS - CONTINUED
(in thousands)
June 30, 2012 and 2011
- 24 -
NOTE 4 - MORTGAGE LOANS (Continued)
For the years ended June 30, 2012 and 2011, the single family mortgage loan and claims
receivable balances and changes in the allowance for loan losses on the uninsured portions of
single family loans with private mortgage insurance, including loans in foreclosure and other
loans with pending insurance claims, were as follows:
2012 2011
Single family mortgage loans 1,917,626$ 2,076,732$ Allowance for loan losses
Beginning balance 9,627 10,480 Provision for loan losses 3,936 (853)
Ending balance 13,563 9,627
Single family mortgage loans, net 1,904,063$ 2,067,105$
Claims receivable on foreclosed andother loans 105,150$ 105,905$
Allowance for loan lossesBeginning balance 13,163 9,541 Provision for loan losses 13,029 6,022 Charge offs (8,070) (2,400)
Ending balance 18,122 13,163
Claims receivable on foreclosed andother loans, net 87,028$ 92,742$

Community Development Administration
Residential Revenue Bonds
NOTES TO FINANCIAL STATEMENTS - CONTINUED
(in thousands)
June 30, 2012 and 2011
- 25 -
NOTE 5 - ACCRUED INTEREST AND OTHER RECEIVABLES
Accrued interest and other receivables as of June 30, 2012 and 2011 were as follows:
2012 2011
Accrued mortgage loan interest 19,946$ 18,727$
Accrued investment interest 587 524
Accrued mortgage-backed securities interest 50 169
Funds due from mortgage insurers for loan
modifications 82 366
Reimbursement due for state-funded loans 498 362
Miscellaneous billings 259 -
21,422$ 20,148$
NOTE 6 - SHORT-TERM DEBT
CDA issues short-term debt to preserve volume cap when prepayments and payments from
mortgages exceed the demand for new mortgages. Proceeds of the short-term debt are used
to refund and to pay at maturity prior series of bonds. At the time of the refunding,
prepayments and repayments of mortgage loans financed by these prior bonds are transferred
to accounts in the short-term series. CDA expects to make these funds available to purchase
mortgage loans upon the maturity or earlier redemption of the short-term bonds with
proceeds of additional long-term bonds. By issuing the short-term debt, CDA more closely
matches the rates on the short-term debt with the rates on short-term investments. When
there is sufficient mortgage demand, CDA issues long-term refunding bonds to redeem the
short-term debt and the prepayments and repayments are used to fund new mortgages. For
the years ended June 30, 2012 and 2011, CDA did not issue any short-term debt.

Community Development Administration
Residential Revenue Bonds
NOTES TO FINANCIAL STATEMENTS - CONTINUED
(in thousands)
June 30, 2012 and 2011
- 26 -
NOTE 7 - BONDS PAYABLE
The bonds and notes issued by CDA are special obligations of CDA and are payable from the
revenue and special funds of the Resolution. These bonds and notes do not constitute debt of
and are not guaranteed by the State of Maryland or any other program of the State of
Maryland or any political subdivision.
The provisions of the Resolution require or allow for the special redemption of bonds at par
through the use of unexpended bond proceeds and excess funds accumulated primarily
through prepayment of mortgage loans. All outstanding bonds are subject to optional
redemption, in whole or in part at any time, after certain dates, as specified in the respective
series resolutions, at a redemption price equal to the principal amount thereof to be
redeemed.
The following lists those bonds which are at variable rates and the terms by which the
variable rates change. All other bonds have fixed interest rates.
2003 Series C; 2004 Series F and I; 2006 Series G and J; 2007 Series F, J and M;
and 2008 Series D
The rate is set weekly by a remarketing agent so that the market value of the
bonds is as close as possible to 100% of the principal amount of the bonds,
except for 2007 Series J and M which were remarketed on March 8, 2012
converting the interest rate from a weekly mode to a daily mode. On July
26, 2012, 2007 Series J and M were remarketed again and the interest rate
was converted back to a weekly mode. In no event will the bonds bear
interest at a rate in excess of 12%.
2011 Series B
The rate is set weekly at an index rate equal to a SIFMA index, plus 0.95%.
(SIFMA stands for the Securities Industry and Financial Markets
Association). In no event will the bonds bear interest at a rate in excess of
12%.
The following bonds are taxable. All other bonds are tax-exempt.
2006 Series S and 2007 Series B, E and I

Community Development Administration
Residential Revenue Bonds
NOTES TO FINANCIAL STATEMENTS - CONTINUED
(in thousands)
June 30, 2012 and 2011
(continued)
- 27 -
NOTE 7 - BONDS PAYABLE (Continued)
The following is a summary of the bond activity for the year ended June 30, 2012, and the
debt outstanding and bonds payable as of June 30, 2012:
Discounts/
Debt Debt premiums Bonds
Outstanding Scheduled Outstanding and other payable
Issue at June 30, New bonds maturity Bonds at June 30, deferred at June 30,
dated 2011 issued payments redeemed 2012 costs 2012
Residential Revenue
Bonds
1998 Series A 01/01/98 4.80% - 4.90% 2011 - 2012 485$ -$ (350)$ (135)$ -$ -$ -$
1998 Series D 12/01/98 5.15% - 5.25% 2018 - 2029 25,765 - (1,670) (345) 23,750 - 23,750
1999 Series C 05/01/99 4.70% - 4.95% 2011 - 2015 2,665 - (645) - 2,020 - 2,020
1999 Series D 05/01/99 4.90% - 5.40% 2011 - 2031 24,900 - (630) (195) 24,075 (2) 24,073
2001 Series A 03/01/01 4.50% - 5.00% 2011 - 2017 8,825 - (1,460) - 7,365 - 7,365
2001 Series B 03/01/01 4.65% - 5.375% 2011 - 2022 7,095 - (30) (930) 6,135 - 6,135
2001 Series E 06/01/01 130 - (130) - - - -
2001 Series G 08/15/01 1,435 - (1,435) - - - -
2001 Series H 08/15/01 4.40% - 5.35% 2011 - 2033 31,500 - (310) (440) 30,750 - 30,750
2003 Series A 11/01/03 3.55% - 4.05% 2011 - 2015 4,745 - (880) - 3,865 - 3,865
2003 Series B 11/01/03 4.75% - 5.00% 2019 - 2026 3,440 - - (940) 2,500 90 2,590
2003 Series C 12/09/03 20,000 - - - 20,000 - 20,000
2004 Series A 05/13/04 3.45% - 4.20% 2011 - 2016 6,500 - (990) - 5,510 - 5,510
2004 Series B 05/13/04 2023 - 2028 4,800 - - (1,230) 3,570 84 3,654
2004 Series D 08/12/04 3.65% - 4.40% 2011 - 2016 7,665 - (1,160) - 6,505 - 6,505
2004 Series E 08/12/04 5.15% - 5.25% 2023 - 2030 10,960 - - (1,565) 9,395 105 9,500
2004 Series F 08/12/04 20,000 - - - 20,000 - 20,000
2004 Series G 11/10/04 3.00% - 3.65% 2011 - 2016 7,835 - (1,205) - 6,630 - 6,630
2004 Series H 11/10/04 4.55% - 5.00% 2023 - 2029 10,920 - - (1,145) 9,775 228 10,003
2004 Series I 11/10/04 20,000 - - - 20,000 - 20,000
2005 Series A 03/30/05 3.25% - 3.90% 2011 - 2016 8,065 - (1,230) - 6,835 - 6,835
2005 Series B 03/30/05 4.55% - 5.25% 2023 - 2029 17,255 - - (2,195) 15,060 214 15,274
2005 Series D 11/10/05 3.50% - 4.05% 2011 - 2017 9,160 - (1,170) - 7,990 - 7,990
2005 Series E 11/10/05 4.75% - 5.50% 2025 - 2036 37,615 - - (2,665) 34,950 322 35,272
2006 Series A 02/23/06 3.60% - 4.10% 2011 - 2017 8,835 - (1,130) - 7,705 - 7,705
2006 Series B 02/23/06 4.75% - 5.50% 2025 - 2037 40,900 - - (4,275) 36,625 275 36,900
2006 Series E 05/24/06 3.80% - 4.35% 2011 - 2017 17,365 - (2,210) - 15,155 - 15,155
2006 Series F 05/24/06 4.80% - 6.00% 2021 - 2039 43,130 - - (8,150) 34,980 855 35,835
2006 Series G 05/24/06 40,000 - - - 40,000 - 40,000
2006 Series H 07/13/06 3.80% - 4.15% 2011 - 2017 13,055 - (1,655) - 11,400 - 11,400
2006 Series I 07/13/06 4.05% - 6.00% 2011 - 2041 113,990 - (1,650) (13,905) 98,435 1,617 100,052
2006 Series J 07/13/06 60,000 - - - 60,000 - 60,000
2006 Series K 09/14/06 3.80% - 4.15% 2011 - 2017 11,110 - (1,400) - 9,710 - 9,710
2006 Series L 09/14/06 4.10% - 5.75% 2011 - 2041 144,400 - (1,485) (11,515) 131,400 1,122 132,522
2006 Series O 12/13/06 3.55% - 3.85% 2011 - 2017 7,380 - (940) - 6,440 - 6,440
2006 Series P 12/13/06 3.95% - 5.75% 2011 - 2037 73,995 - (1,560) (7,525) 64,910 728 65,638
2006 Series S 12/13/06 21,540 - - (1,715) 19,825 - 19,825
Variable rate 9/1/2040
Variable rate 9/1/2040
6.07% 9/1/2037
5.00%
Variable rate 9/1/2035
Variable rate 9/1/2035
Bond Activity
Range of Range of
interest rates maturities
4.55% 9/1/2011
4.20% 9/1/2011
Variable rate 9/1/2035

Community Development Administration
Residential Revenue Bonds
NOTES TO FINANCIAL STATEMENTS - CONTINUED
(in thousands)
June 30, 2012 and 2011
- 28 -
NOTE 7 - BONDS PAYABLE (Continued)
Discounts/
Debt Debt premiums Bonds
Outstanding Scheduled Outstanding and other payable
Issue at June 30, New bonds maturity Bonds at June 30, deferred at June 30,
dated 2011 issued payments redeemed 2012 costs 2012
Residential Revenue
Bonds (continued)
2007 Series A 03/28/07 3.90% - 5.75% 2012 - 2047 242,560$ -$ (1,730)$ (28,030)$ 212,800$ 5,189$ 217,989$
2007 Series B 03/28/07 27,300 - - (3,685) 23,615 - 23,615
2007 Series C 06/20/07 3.70% - 3.95% 2011 - 2017 36,720 - (4,880) - 31,840 - 31,840
2007 Series D 06/20/07 4.65% - 5.50% 2022 - 2048 157,345 - - (14,255) 143,090 1,707 144,797
2007 Series E 06/20/07 5.04% - 6.11% 2011 - 2042 45,570 - (1,405) - 44,165 - 44,165
2007 Series F 06/20/07 44,305 - - (2,285) 42,020 - 42,020
2007 Series G 08/09/07 3.90% - 4.30% 2011 - 2017 45,635 - (5,745) - 39,890 - 39,890
2007 Series H 08/09/07 4.95% - 5.20% 2022 - 2048 61,490 - - (2,110) 59,380 - 59,380
2007 Series I 08/09/07 5.51% - 6.56% 2011 - 2043 58,875 - (1,745) - 57,130 - 57,130
2007 Series J 08/09/07 55,705 - - (2,210) 53,495 - 53,495
2007 Series K 12/12/07 3.35% - 3.85% 2011 - 2017 23,155 - (3,085) (585) 19,485 - 19,485
2007 Series M 12/12/07 29,050 - - - 29,050 - 29,050
2008 Series A 06/19/08 2.95% - 4.00% 2011 - 2017 52,960 - (4,000) (110) 48,850 - 48,850
2008 Series B 09/04/08 2.95% - 4.20% 2011 - 2017 15,860 - (2,035) - 13,825 - 13,825
2008 Series C 09/04/08 4.45% - 5.65% 2019 - 2048 66,335 - - (1,365) 64,970 - 64,970
2008 Series D 09/04/08 49,890 - - - 49,890 - 49,890
2008 Series E 12/17/08 3.35% - 4.55% 2011 - 2017 20,500 - (2,500) - 18,000 - 18,000
2008 Series F 12/17/08 4.75% - 5.40% 2018 - 2023 7,795 - - (205) 7,590 - 7,590
2009 Series A 09/24/09 1.10% - 5.05% 2011 - 2039 39,230 - (770) - 38,460 - 38,460
2009 Series B 10/08/09 1.00% - 4.75% 2011 - 2039 44,100 - (905) - 43,195 - 43,195
2009 Series C 10/27/09 0.90% - 4.55% 2011 - 2039 15,665 - (325) - 15,340 - 15,340
2010 Series A 06/09/10 3.95% - 4.45% 2018 - 2021 27,965 - - (1,325) 26,640 (279) 26,361
2010 Series B 12/16/10 5.125% - 5.25% 2030 - 2035 39,990 - - (470) 39,520 (349) 39,171
2011 Series A 05/05/11 0.375% - 5.375% 2012 - 2041 70,825 - (1,050) (75) 69,700 1,383 71,083
2011 Series B 05/05/11 20,000 - - - 20,000 (96) 19,904
Total 2,186,285$ -$ (55,500)$ (115,580)$ 2,015,205$ 13,193$ 2,028,398$
Indexed Rate 3/1/2036
Variable rate 9/1/2038
6.00% 9/1/2037
Variable rate 9/1/2031
Variable rate 9/1/2031
Variable rate 9/1/2043
Bond Activity
Range of Range of
interest rates maturities

Community Development Administration
Residential Revenue Bonds
NOTES TO FINANCIAL STATEMENTS - CONTINUED
(in thousands)
June 30, 2012 and 2011
(continued)
- 29 -
NOTE 7 - BONDS PAYABLE (Continued)
The following is a summary of the bond activity for the year ended June 30, 2011, and the
debt outstanding and bonds payable as of June 30, 2011:
Discounts/
Debt Debt premiums Bonds
Outstanding Scheduled Outstanding and other payable
Issue at June 30, New bonds maturity Bonds at June 30, deferred at June 30,
dated 2010 issued payments redeemed 2011 costs 2011
Residential Revenue
Bonds
1998 Series A 01/01/98 4.80% - 5.00% 2011 - 2014 1,630$ -$ -$ (1,145)$ 485$ -$ 485$
1998 Series D 12/01/98 5.15% - 5.25% 2018 - 2029 27,275 - (800) (710) 25,765 - 25,765
1999 Series C 05/01/99 4.70% - 4.95% 2011 - 2015 2,665 - - - 2,665 - 2,665
1999 Series D 05/01/99 4.90% - 5.40% 2011 - 2031 25,270 - - (370) 24,900 (3) 24,897
2000 Series F 08/01/00 515 - - (515) - - -
2001 Series A 03/01/01 4.50% - 5.00% 2011 - 2017 8,825 - - - 8,825 - 8,825
2001 Series B 03/01/01 4.65% - 5.375% 2011 - 2022 8,330 - - (1,235) 7,095 - 7,095
2001 Series E 06/01/01 780 - - (650) 130 - 130
2001 Series G 08/15/01 1,435 - - - 1,435 - 1,435
2001 Series H 08/15/01 4.40% - 5.35% 2011 - 2033 32,050 - - (550) 31,500 - 31,500
2003 Series A 11/01/03 3.25% - 4.05% 2010 - 2015 5,595 - (850) - 4,745 - 4,745
2003 Series B 11/01/03 4.75% - 5.00% 2019 - 2026 4,455 - - (1,015) 3,440 140 3,580
2003 Series C 12/09/03 20,000 - - - 20,000 - 20,000
2004 Series A 05/13/04 3.20% - 4.20% 2010 - 2016 7,460 - (960) - 6,500 - 6,500
2004 Series B 05/13/04 2023 - 2028 6,310 - - (1,510) 4,800 139 4,939
2004 Series C 05/13/04 20,000 - - (20,000) - - -
2004 Series D 08/12/04 3.50% - 4.40% 2010 - 2016 8,785 - (1,120) - 7,665 - 7,665
2004 Series E 08/12/04 5.15% - 5.25% 2023 - 2030 13,120 - - (2,160) 10,960 166 11,126
2004 Series F 08/12/04 20,000 - - - 20,000 - 20,000
2004 Series G 11/10/04 2.80% - 3.65% 2010 - 2016 9,005 - (1,170) - 7,835 - 7,835
2004 Series H 11/10/04 4.55% - 5.00% 2023 - 2029 11,805 - - (885) 10,920 296 11,216
2004 Series I 11/10/04 20,000 - - - 20,000 - 20,000
2005 Series A 03/30/05 3.05% - 3.90% 2010 - 2016 9,255 - (1,190) - 8,065 - 8,065
2005 Series B 03/30/05 4.55% - 5.25% 2023 - 2029 18,625 - - (1,370) 17,255 332 17,587
2005 Series C 03/30/05 20,000 - - (20,000) - - -
2005 Series D 11/10/05 3.35% - 4.05% 2010 - 2017 10,290 - (1,130) - 9,160 - 9,160
2005 Series E 11/10/05 4.75% - 5.50% 2025 - 2036 38,745 - - (1,130) 37,615 483 38,098
2006 Series A 02/23/06 3.50% - 4.10% 2010 - 2017 9,930 - (1,095) - 8,835 - 8,835
2006 Series B 02/23/06 4.75% - 5.50% 2025 - 2037 41,610 - - (710) 40,900 500 41,400
2006 Series E 05/24/06 3.70% - 4.35% 2010 - 2017 19,495 - (2,130) - 17,365 - 17,365
2006 Series F 05/24/06 4.80% - 6.00% 2021 - 2039 45,925 - - (2,795) 43,130 1,453 44,583
2006 Series G 05/24/06 40,000 - - - 40,000 - 40,000
2006 Series H 07/13/06 3.75% - 4.15% 2010 - 2017 14,645 - (1,590) - 13,055 - 13,055
2006 Series I 07/13/06 3.95% - 6.00% 2010 - 2041 119,050 - (885) (4,175) 113,990 2,657 116,647
2006 Series J 07/13/06 60,000 - - - 60,000 - 60,000
2006 Series K 09/14/06 3.70% - 4.15% 2010 - 2017 12,455 - (1,345) - 11,110 - 11,110
2006 Series L 09/14/06 4.10% - 5.75% 2011 - 2041 148,445 - - (4,045) 144,400 1,878 146,278
2006 Series O 12/13/06 3.50% - 3.85% 2010 - 2017 8,285 - (905) - 7,380 - 7,380
2006 Series P 12/13/06 3.90% - 5.75% 2010 - 2037 76,995 - (1,500) (1,500) 73,995 1,276 75,271
2006 Series S 12/13/06 22,175 - - (635) 21,540 - 21,540 6.07% 2037
Variable rate 2040
Variable rate 2040
Variable rate 2035
Bond Activity
Range of Range of
interest rates maturities
5.00%
4.90% 2011
Variable rate 2035
Variable rate
Variable rate 2035
2035
Variable rate 2035
4.55% 2011
4.20% 2011

Community Development Administration
Residential Revenue Bonds
NOTES TO FINANCIAL STATEMENTS - CONTINUED
(in thousands)
June 30, 2012 and 2011
- 30 -
NOTE 7 - BONDS PAYABLE (Continued)
Discounts/
Debt Debt premiums Bonds
Outstanding Scheduled Outstanding and other payable
Issue at June 30, New bonds maturity Bonds at June 30, deferred at June 30,
dated 2010 issued payments redeemed 2011 costs 2011
Residential Revenue
Bonds (continued)
2007 Series A 03/28/07 3.80% - 5.75% 2010 - 2047 250,090$ -$ (1,630)$ (5,900)$ 242,560$ 7,518$ 250,078$
2007 Series B 03/28/07 27,415 - - (115) 27,300 - 27,300
2007 Series C 06/20/07 3.65% - 3.95% 2010 - 2017 41,415 - (4,695) - 36,720 - 36,720
2007 Series D 06/20/07 4.65% - 5.50% 2022 - 2048 161,500 - - (4,155) 157,345 2,579 159,924
2007 Series E 06/20/07 4.97% - 6.11% 2010 - 2042 46,955 - (1,385) - 45,570 - 45,570
2007 Series F 06/20/07 44,305 - - - 44,305 - 44,305
2007 Series G 08/09/07 3.80% - 4.30% 2010 - 2017 50,880 - (5,245) - 45,635 - 45,635
2007 Series H 08/09/07 4.95% - 5.20% 2022 - 2048 62,265 - - (775) 61,490 - 61,490
2007 Series I 08/09/07 5.35% - 6.56% 2010 - 2043 60,585 - (1,710) - 58,875 - 58,875
2007 Series J 08/09/07 56,390 - - (685) 55,705 - 55,705
2007 Series K 12/12/07 3.30% - 3.85% 2010 - 2017 26,150 - (2,805) (190) 23,155 - 23,155
2007 Series M 12/12/07 29,050 - - - 29,050 - 29,050
2008 Series A 06/19/08 2.60% - 4.00% 2010 - 2017 55,710 - (2,000) (750) 52,960 - 52,960
2008 Series B 09/04/08 2.45% - 4.20% 2010 - 2017 17,280 - (1,420) - 15,860 - 15,860
2008 Series C 09/04/08 4.45% - 5.65% 2019 - 2048 77,150 - - (10,815) 66,335 - 66,335
2008 Series D 09/04/08 50,000 - (110) - 49,890 - 49,890
2008 Series E 12/17/08 2.95% - 4.55% 2010 - 2017 21,500 - (1,000) - 20,500 - 20,500
2008 Series F 12/17/08 4.75% - 5.90% 2018 - 2038 18,500 - - (10,705) 7,795 - 7,795
2009 Series A 09/24/09 0.65% - 5.05% 2010 - 2039 40,000 - (770) - 39,230 - 39,230
2009 Series B 10/08/09 0.65% - 4.75% 2010 - 2039 45,000 - (900) - 44,100 - 44,100
2009 Series C 10/27/09 0.45% - 4.55% 2010 - 2039 15,985 - (320) - 15,665 - 15,665
2010 Series A 06/09/10 3.95% - 4.45% 2018 - 2021 28,465 - - (500) 27,965 (320) 27,645
2010 Series B 12/16/10 5.125% - 5.25% 2030 - 2035 - 40,000 - (10) 39,990 (361) 39,629
2011 Series A 05/05/11 0.375% - 5.375% 2012 - 2041 - 70,825 - - 70,825 1,456 72,281
2011 Series B 05/05/11 - 20,000 - - 20,000 (99) 19,901
Total 2,197,825$ 130,825$ (40,660)$ (101,705)$ 2,186,285$ 20,090$ 2,206,375$
6.00% 2037
Variable rate
Bond Activity
Range of Range of
interest rates maturities
2031
Variable rate 2031
Indexed Rate 2036
Variable rate 2038
Variable rate 2043

Community Development Administration
Residential Revenue Bonds
NOTES TO FINANCIAL STATEMENTS - CONTINUED
(in thousands)
June 30, 2012 and 2011
- 31 -
NOTE 8 - DEBT SERVICE REQUIREMENTS
As of June 30, 2012, the required principal payments for bonds (including mandatory sinking
fund payments and special and optional redemptions that occurred subsequent to June 30,
2012 and excluding the effect of unamortized discounts/premiums and other deferred costs as
shown in Note 7) and interest payments for each of the next five years and in 5-year
increments thereafter, were as follows:
Years ended June 30, Interest Principal
2013 80,697$ 66,795$
2014 78,273 64,550
2015 75,677 68,165
2016 72,828 72,035
2017 69,865 73,105
2018 - 2022 306,347 314,790
2023 - 2027 243,757 252,685
2028 - 2032 185,752 351,815
2033 - 2037 121,826 389,630
2038 - 2042 48,885 240,755
2043 - 2047 8,449 118,145
2048 - 2052 98 2,735
Totals 1,292,454$ 2,015,205$
The interest calculations on outstanding variable rate bonds in the amount of $354,455 are
based on the variable rates in effect on June 30, 2012, and are not indicative of the actual
interest expense that will be incurred in future years. As rates vary, variable rate bond
interest payments will vary. See Note 9 for additional information on interest rate exchange
agreements (swaps) associated with the variable rate debt in the Fund.

Community Development Administration
Residential Revenue Bonds
NOTES TO FINANCIAL STATEMENTS - CONTINUED
(in thousands)
June 30, 2012 and 2011
- 32 -
NOTE 8 - DEBT SERVICE REQUIREMENTS (Continued)
As of June 30, 2011, the required principal payments for bonds (including mandatory sinking
fund payments and special and option redemptions that occurred subsequent to June 30, 2011
and excluding the effect of unamortized discounts/premiums and other deferred costs as
shown in Note 7) and interest payments for each of the next five years and in 5-year
increments thereafter, were as follows:
Years ended June 30, Interest Principal
2012 87,299$ 79,350$
2013 85,137 59,250
2014 82,803 64,550
2015 80,206 68,165
2016 77,356 72,050
2017 - 2021 342,434 339,365
2022 - 2026 276,077 264,740
2027 - 2031 214,731 278,830
2032 - 2036 146,736 506,820
2037 - 2041 64,449 317,575
2042 - 2046 14,570 126,680
2047 - 2051 512 8,910
Totals 1,472,310$ 2,186,285$
The interest calculations on outstanding variable rate bonds in the amount of $358,950 are
based on the variable rates in effect on June 30, 2011, and are not indicative of the actual
interest expense that will be incurred in future years. As rates vary, variable rate bond
interest payments will vary. See Note 9 for additional information on interest rate exchange
agreements (swaps) associated with the variable rate debt in the Fund.

Community Development Administration
Residential Revenue Bonds
NOTES TO FINANCIAL STATEMENTS - CONTINUED
(in thousands)
June 30, 2012 and 2011
- 33 -
NOTE 9 - INTEREST RATE EXCHANGE AGREEMENTS (SWAPS)
Objective of the Swaps
As a means to lower its borrowing costs, CDA issues variable rate bonds. In order to protect
against the potential increases in interest rates, CDA has entered into pay-fixed, receive-
variable interest rate swap agreements in connection with certain variable rate bond series.
CDA anticipates that the net swap payments and interest payments on underlying bonds will
be lower than what CDA would have paid if it had issued fixed rate debt at the time of the
underlying bond issuances. All of CDA’s swaps are intended to be cash flow hedges.
Terms and Fair Value
The terms, including the fair values of the outstanding swaps as of June 30, 2012 and 2011,
are provided in the tables on the following pages. The counterparty credit ratings for all
outstanding swaps as of June 30, 2012 and 2011 are listed under the Credit Risk section. For
each of the outstanding swap agreements the variable rates are reset monthly, and it is the
intent of CDA to match the maturity of the swaps with the maturity of the underlying bonds.
The fair values are based on the market values and are affirmed by an independent advisor
who used valuation methods and assumptions in accordance with accounting guidance issued
by GASB.

Community Development Administration
Residential Revenue Bonds
NOTES TO FINANCIAL STATEMENTS - CONTINUED
(in thousands)
June 30, 2012 and 2011
- 34 -
NOTE 9 - INTEREST RATE EXCHANGE AGREEMENTS (SWAPS) (Continued)
As of June 30, 2012, the terms, including fair values of the outstanding swaps, were:
Swap Associated Original Outstanding Fixed Variable Swap Final
Counter- Bond Notional Notional Effective Rate Rate Fair Termination
party Issue Amount Amount Date Paid Received (1) Value Date
JPMorgan 2004 $20,000 $20,000 9/1/2005 3.8525% 64% of ($1,345) 9/1/2035
Chase Bank, Series I LIBOR (2)(7)
N.A. (JPM) plus .29%
2006 $40,000 $40,000 5/24/2006 4.4030% 64% of ($5,201) 9/1/2040
UBS AG Series G LIBOR (3)
plus .29%
JPMorgan 2006 $40,000 $40,000 7/13/2006 4.4030% 64% of ($5,184) 9/1/2040
Chase Bank, Series J LIBOR (3)(7)
N.A. (JPM) plus .29%
JPMorgan 2006 $20,000 $20,000 7/13/2006 4.4550% 64% of ($2,925) 9/1/2040
Chase Bank, Series J LIBOR (3)(7)
N.A. (JPM) plus .29%
Merrill Lynch 2007 $46,485 $35,590 10/27/2009 4.4300% 64% of ($4,986) 3/1/2026
Derivative Series F (amended) (amended) (amended) LIBOR (4)(6)(9)(12)
Products AG plus .22%
(MLDP) (amended)
Merrill Lynch 2007 $58,680 $45,635 9/1/2009 4.8350% 64% of ($7,174) 9/1/2025
Derivative Series J (amended) (amended) (amended) LIBOR (4)(6)(9)(10)
Products AG plus .22%
(MLDP) (amended)
The Bank of 2007 $26,990 $16,115 10/8/2009 4.3350% 64% of ($1,808) 9/1/2043
New York Series M (amended) (amended) (amended) LIBOR (5)(6)(11)
Mellon plus .22% (13)
(BNYM) (amended)
Merrill Lynch 2008 $50,000 $49,890 9/4/2008 3.6880% 64% of ($7,239) 9/1/2038
Derivative Series D LIBOR (8)(9)
Products AG plus .31%
(MLDP)
Notes to 2012 Table on next page

Community Development Administration
Residential Revenue Bonds
NOTES TO FINANCIAL STATEMENTS - CONTINUED
(in thousands)
June 30, 2012 and 2011
- 35 -
NOTE 9 - INTEREST RATE EXCHANGE AGREEMENTS (SWAPS) (Continued)
Notes to 2012 Table
(1) “LIBOR” means the 1 month London Interbank Offered Rate.
(2) CDA has the option to terminate this interest rate swap transaction in whole or in part without any termination payment
on September 1, 2014 and on each March 1 and September 1 thereafter (Optional Termination Dates). If the option is
exercised in part, the applicable notional amounts shall be reduced pro rata.
(3) CDA has the option to terminate this interest rate swap transaction in whole or in part without any termination payment
on March 1, 2016 and on each September 1 and March 1 thereafter (Optional Termination Dates). If the option is
exercised in part, the applicable notional amounts shall be reduced pro rata.
(4) CDA has the option to terminate this interest rate swap transaction in whole or in part without any termination payment
on March 1, 2017 and on each September 1 and March 1 thereafter (Optional Termination Dates). If the option is
exercised in part, the applicable notional amounts shall be reduced pro rata.
(5) CDA has the option to terminate a portion of this interest rate swap transaction without any termination payment up to
the Maximum Optional Early Termination Amounts on each March 1 and September 1 until September 1, 2017. CDA
has exercised its option to partially terminate the notional amount of this interest rate swap in the amount of $2,060
effective September 1, 2009, $1,515 effective March 1, 2010, $1,735 effective September 1, 2010, $1,700 effective
March 1, 2011, $1,425 effective September 1, 2011 and $1,185 effective March 1, 2012. CDA has the option to
terminate this interest rate swap transaction in whole or in part without any termination payment on September 1, 2017
and on each March 1 and September 1 thereafter (Optional Termination Dates). If the option is exercised in part, the
applicable notional amounts shall be reduced pro rata.
(6) The outstanding notional amount reflects the amount that has been amortized as of March 1, 2012.
(7) On May 14, 2009, all swap agreements with Bear Stearns Financial Products Inc. were assigned to JPMorgan Chase
Bank, N.A. All terms and conditions of the contracts remain in force.
(8) CDA has the option to terminate this interest rate swap transaction in whole or in part without any termination payment
on September 1, 2018 and on each March 1 and September 1 thereafter (Optional Par Termination Dates). If the option
is exercised in part, the applicable notional amounts shall be reduced pro rata.
(9) On January 1, 2009, Bank of America Corporation acquired Merrill Lynch & Co., Inc. Notwithstanding this acquisition,
Merrill Lynch Derivative Products AG remains in existence and continues as a swap provider on this swap agreement.
(10) On September 24, 2009, 2007 Series J bonds, with an outstanding balance of $58,680, were remarketed and the related
swap agreement was amended effective September 1, 2009.
(11) On October 8, 2009, 2007 Series M bonds, with an outstanding balance of $29,050, were remarketed and the related
swap agreement with an outstanding balance of $26,990 was amended effective October 8, 2009 (refer to note 5 above).
The Bank of New York Mellon replaced UBS AG as counterparty to the agreement.
(12) On October 27, 2009, 2007 Series F bonds, with an outstanding balance of $46,485, were remarketed and the related
swap agreement was amended effective October 27, 2009.
(13) Subsequent to June 30, 2012, CDA exercised its option and partially terminated the interest rate swap in the amount of
$975 effective September 1, 2012.

Community Development Administration
Residential Revenue Bonds
NOTES TO FINANCIAL STATEMENTS - CONTINUED
(in thousands)
June 30, 2012 and 2011
- 36 -
NOTE 9 - INTEREST RATE EXCHANGE AGREEMENTS (SWAPS) (Continued)
As of June 30, 2011, the terms, including fair values of the outstanding swaps, were:
Swap Associated Original Outstanding Fixed Variable Swap Final
Counter- Bond Notional Notional Effective Rate Rate Fair Termination
party Issue Amount Amount Date Paid Received (1) Value Date
JPMorgan 2004 $20,000 $20,000 9/1/2005 3.8525% 64% of ($850) 9/1/2035
Chase Bank, Series I LIBOR (2)(7)
N.A. (JPM) plus .29%
2006 $40,000 $40,000 5/24/2006 4.4030% 64% of ($3,800) 9/1/2040
UBS AG Series G LIBOR (3)
plus .29%
JPMorgan 2006 $40,000 $40,000 7/13/2006 4.4030% 64% of ($3,770) 9/1/2040
Chase Bank, Series J LIBOR (3)(7)
N.A. (JPM) plus .29%
JPMorgan 2006 $20,000 $20,000 7/13/2006 4.4550% 64% of ($2,080) 9/1/2040
Chase Bank, Series J LIBOR (3)(7)
N.A. (JPM) plus .29%
Merrill Lynch 2007 $46,485 $39,760 10/27/2009 4.4300% 64% of ($4,450) 3/1/2026
Derivative Series F (amended) (amended) (amended) LIBOR (4)(6)(9)(12)
Products AG plus .22%
(MLDP) (amended)
Merrill Lynch 2007 $58,680 $50,860 9/1/2009 4.8350% 64% of ($6,600) 9/1/2025
Derivative Series J (amended) (amended) (amended) LIBOR (4)(6)(9)(10)
Products AG plus .22%
(MLDP) (amended)
The Bank of 2007 $26,990 $19,975 10/8/2009 4.3350% 64% of ($1,505) 9/1/2043
New York Series M (amended) (amended) (amended) LIBOR (5)(6)(11)
Mellon plus .22% (13)
(BNYM) (amended)
Merrill Lynch 2008 $50,000 $49,890 9/4/2008 3.6880% 64% of ($3,420) 9/1/2038
Derivative Series D LIBOR (8)(9)
Products AG plus .31%
(MLDP)
Notes to 2011 Table on next page
Community Development Administration
Residential Revenue Bonds
NOTES TO FINANCIAL STATEMENTS - CONTINUED
(in thousands)
June 30, 2012 and 2011
- 37 -
NOTE 9 - INTEREST RATE EXCHANGE AGREEMENTS (SWAPS) (Continued)
Notes to 2011 Table
(1) “LIBOR” means the 1 month London Interbank Offered Rate.
(2) CDA has the option to terminate this interest rate swap transaction in whole or in part without any termination payment
on September 1, 2014 and on each March 1 and September 1 thereafter (Optional Termination Dates). If the option is
exercised in part, the applicable notional amounts shall be reduced pro rata.
(3) CDA has the option to terminate this interest rate swap transaction in whole or in part without any termination payment
on March 1, 2016 and on each September 1 and March 1 thereafter (Optional Termination Dates). If the option is
exercised in part, the applicable notional amounts shall be reduced pro rata.
(4) CDA has the option to terminate this interest rate swap transaction in whole or in part without any termination payment
on March 1, 2017 and on each September 1 and March 1 thereafter (Optional Termination Dates). If the option is
exercised in part, the applicable notional amounts shall be reduced pro rata.
(5) CDA has the option to terminate a portion of this interest rate swap transaction without any termination payment up to
the Maximum Optional Early Termination Amounts on each March 1 and September 1 until September 1, 2017. CDA
has exercised its option to partially terminate the notional amount of this interest rate swap in the amount of $2,060
effective September 1, 2009, $1,515 effective March 1, 2010, $1,735 effective September 1, 2010 and $1,700 effective
March 1, 2011. CDA has the option to terminate this interest rate swap transaction in whole or in part without any
termination payment on September 1, 2017 and on each March 1 and September 1 thereafter (Optional Termination
Dates). If the option is exercised in part, the applicable notional amounts shall be reduced pro rata.
(6) The outstanding notional amount reflects the amount that has been amortized as of March 1, 2011.
(7) On May 14, 2009, all swap agreements with Bear Stearns Financial Products Inc. were assigned to JPMorgan Chase
Bank, N.A. All terms and conditions of the contracts remain in force.
(8) CDA has the option to terminate this interest rate swap transaction in whole or in part without any termination payment
on September 1, 2018 and on each March 1 and September 1 thereafter (Optional Par Termination Dates). If the option
is exercised in part, the applicable notional amounts shall be reduced pro rata.
(9) On January 1, 2009, Bank of America Corporation acquired Merrill Lynch & Co., Inc. Notwithstanding this acquisition,
Merrill Lynch Derivative Products AG remains in existence and continues as a swap provider on this swap agreement.
(10) On September 24, 2009, 2007 Series J bonds, with an outstanding balance of $58,680, were remarketed and the related
swap agreement was amended effective September 1, 2009.
(11) On October 8, 2009, 2007 Series M bonds, with an outstanding balance of $29,050, were remarketed and the related
swap agreement with an outstanding balance of $26,990 was amended effective October 8, 2009 (refer to note 5 above).
The Bank of New York Mellon replaced UBS AG as counterparty to the agreement.
(12) On October 27, 2009, 2007 Series F bonds, with an outstanding balance of $46,485, were remarketed and the related
swap agreement was amended effective October 27, 2009.
(13) Subsequent to June 30, 2011, CDA exercised its option and partially terminated the interest rate swap in the amount of
$1,425 effective September 1, 2011.

Community Development Administration
Residential Revenue Bonds
NOTES TO FINANCIAL STATEMENTS - CONTINUED
(in thousands)
June 30, 2012 and 2011
- 38 -
NOTE 9 - INTEREST RATE EXCHANGE AGREEMENTS (SWAPS) (Continued)
Basis Risk
The swaps would expose CDA to basis risk should the relationship between the London
Interbank Offered Rate and the Securities Industry and Financial Markets Association Rate
converge. If a change occurs that results in the rates moving towards convergence, the
expected cost savings may not be realized. In order to mitigate this risk, prior to the
execution of the swap agreements, CDA and its independent financial advisor reviewed
historical trading differentials between the Securities Industry and Financial Markets
Association Rate and the London Interbank Offered Rate.
Credit Risk
Credit risk is the risk that a swap counterparty will not fulfill its obligations. The fair value
of the swaps represented CDA’s credit exposure to each counterparty as of June 30, 2012 and
2011. As of June 30, 2012, CDA was not exposed to credit risk under the swap agreements
with JPM, UBS AG, MLDP or BNYM since the fair value of each counterparty’s swap
portfolio was negative. However, should the valuation of any of the individual swaps
change, and the fair values turn positive, CDA may become exposed to credit risk in the
amount of the swaps’ fair values. To mitigate the potential for credit risk, the fair value of
the swaps will be fully collateralized by the counterparties if a counterparty’s credit quality
falls below the designated credit rating thresholds. As of June 30, 2011, CDA was not
exposed to credit risk under the swap agreements with JPM, UBS AG, MLDP or BNYM
since the swaps had negative fair values.

Community Development Administration
Residential Revenue Bonds
NOTES TO FINANCIAL STATEMENTS - CONTINUED
(in thousands)
June 30, 2012 and 2011
- 39 -
NOTE 9 - INTEREST RATE EXCHANGE AGREEMENTS (SWAPS) (Continued)
The credit rating details for each swap counterparty, including credit rating thresholds, and
the total fair value amounts as of June 30, 2012 are summarized below:
Swap
Counterparty
Outstanding
Notional
Amount
Current Credit
Rating
Collateral Posting
Credit Rating Threshold Fair Value
JPMorgan Chase
Bank, N.A.
(JPM) $80,000
Aa3 from Moody’s
A+ from Standard
and Poor’s
A1 or below from
Moody’s or
A+ or below from
Standard and Poor’s
($9,454)
UBS AG $40,000
A2 from Moody’s
A from Standard and
Poor’s
A from Fitch
A1 or below from
Moody’s or
A+ or below from
Standard and Poor’s or
Fitch
($5,201)
Merrill Lynch
Derivative
Products AG
(MLDP)
$131,115
Aa3 from Moody’s
AAA from Standard
and Poor’s
A1 or below from
Moody’s or
A+ or below from
Standard and Poor’s or
Fitch
($19,399)
The Bank of New
York Mellon
(BNYM) $16,115
Aa1 from Moody’s
AA- from Fitch
A1 or below from
Moody’s or
A+ or below from
Fitch
($1,808)

Community Development Administration
Residential Revenue Bonds
NOTES TO FINANCIAL STATEMENTS - CONTINUED
(in thousands)
June 30, 2012 and 2011
- 40 -
NOTE 9 - INTEREST RATE EXCHANGE AGREEMENTS (SWAPS) (Continued)
The credit rating details for each swap counterparty, including credit rating thresholds, and
the total fair value amounts as of June 30, 2011 are summarized below:
Swap
Counterparty
Outstanding
Notional
Amount
Current Credit
Rating
Collateral Posting
Credit Rating Threshold Fair Value
JPMorgan Chase
Bank, N.A.
(JPM) $80,000
Aa1 from Moody’s
AA- from Standard
and Poor’s
A1 or below from
Moody’s or
A+ or below from
Standard and Poor’s
($6,700)
UBS AG $40,000
Aa3 from Moody’s
A+ from Standard
and Poor’s
A+ from Fitch
A1 or below from
Moody’s or
A+ or below from
Standard and Poor’s or
Fitch
($3,800)
Merrill Lynch
Derivative
Products AG
(MLDP)
$140,510
Aa3 from Moody’s
AAA from Standard
and Poor’s
A1 or below from
Moody’s or
A+ or below from
Standard and Poor’s or
Fitch
($14,470)
The Bank of New
York Mellon
(BNYM) $19,975
Aaa from Moody’s
AA- from Fitch
A1 or below from
Moody’s or
A+ or below from
Fitch
($1,505)
Termination Risk
Termination risk is the risk that, due to some event or exercise of a right, the swaps may
terminate prior to the scheduled expiration which could result in a payment due from CDA.
Furthermore, if a swap is terminated, the underlying variable rate bonds may be exposed to
the rising variable interest rates.

Community Development Administration
Residential Revenue Bonds
NOTES TO FINANCIAL STATEMENTS - CONTINUED
(in thousands)
June 30, 2012 and 2011
- 41 -
NOTE 9 - INTEREST RATE EXCHANGE AGREEMENTS (SWAPS) (Continued)
According to the termination provisions of the swap agreements, CDA or the counterparty
may terminate the swap if the other party fails to perform under the terms of the contract.
The counterparty can terminate the contract if the ratings on the related bonds fall below the
credit rating thresholds. In addition, CDA has an option to terminate the swaps in part or in
whole without any payment except for accrued interest on the respective Optional
Termination Dates. Regardless of the above, CDA has a unilateral right to terminate swaps
at any time upon adequate notification to the counterparty. If at the time of such termination
a swap has a negative fair value, CDA would be liable to the counterparty for a payment
equal to the swap’s fair value along with any accrued interest.
Rollover Risk
CDA is exposed to rollover risk on the swap agreements if the agreement terminates prior to
the maturity of the associated debt. CDA evaluates the range of reasonably expected
repayment patterns for the financed assets to best match the swap schedule. Terminating an
existing swap may enable CDA to enter a new swap or other financing mechanism that may
be better tailored to the actual financed assets and repayment experience. It is the intent of
CDA to match the maturity of the swaps with the maturity of the underlying bonds.
Amortization Risk
Amortization risk is the risk that the actual redemption pattern of the bonds may differ from
the swap schedule, producing a mismatch between the principal amount of the bonds
outstanding and the outstanding notional amount of the swap. To address this risk, CDA has
structured all swap transactions to provide for optional termination on the respective Optional
Termination Dates and automatic incremental amortization of the swap notional amounts.
Mortgage loan prepayments can also be directed to the variable rate series to match the
outstanding notional swap amount to the outstanding amount of the underlying bonds.

Community Development Administration
Residential Revenue Bonds
NOTES TO FINANCIAL STATEMENTS - CONTINUED
(in thousands)
June 30, 2012 and 2011
- 42 -
NOTE 9 - INTEREST RATE EXCHANGE AGREEMENTS (SWAPS) (Continued)
Tax Risk
Tax risk is the risk that the value of tax exemption may decline through tax law changes and
that variable interest rates would then rise toward taxable levels and the expected cost
savings of the swaps may not be realized.
Counterparty Risk
Counterparty risk is the risk that a counterparty will fail to make required payments. In order
to limit this type of risk, CDA diversifies its exposure across several counterparties.
Swap Payments and Associated Debt
As of June 30, 2012, the following table provides a summary of debt service requirements for
hedged variable rate bonds and net swap payments for the next five years and in 5-year
increments thereafter. The interest calculations are based on the variable rates in effect on
June 30, 2012, and may not be indicative of the actual interest expense that will be incurred.
As rates vary, variable rate bond interest payments and net swap payments will vary.
Hedged
Year ending Variable Rate Bonds Interest Rate
June 30, Principal Interest Swaps, Net Total
2013 7,000$ 687$ 10,251$ 17,938$
2014 - 667 9,852 10,519
2015 - 667 9,495 10,162
2016 - 668 9,162 9,830
2017 - 666 8,713 9,379
2018 - 2022 10,065 3,291 37,244 50,600
2023 - 2027 10,950 3,203 30,745 44,898
2028 - 2032 108,790 2,893 25,862 137,545
2033 - 2037 72,605 1,190 14,945 88,740
2038 - 2042 41,705 589 3,465 45,759
2043 - 2047 16,115 133 25 16,273
Totals 267,230$ 14,654$ 159,759$ 441,643$

Community Development Administration
Residential Revenue Bonds
NOTES TO FINANCIAL STATEMENTS - CONTINUED
(in thousands)
June 30, 2012 and 2011
- 43 -
NOTE 9 - INTEREST RATE EXCHANGE AGREEMENTS (SWAPS) (Continued)
As of June 30, 2011, the following table provides a summary of debt service requirements for
hedged variable rate bonds and net swap payments for the next five years and in 5-year
increments thereafter. The interest calculations are based on the variable rates in effect on
June 30, 2011, and may not be indicative of the actual interest expense that will be incurred.
As rates vary, variable rate bond interest payments and net swap payments will vary.
Hedged
Year ending Variable Rate Bonds Interest Rate
June 30, Principal Interest Swaps, Net Total
2012 2,335$ 417$ 10,869$ 13,621$
2013 - 279 10,447 10,726
2014 - 279 10,040 10,319
2015 - 279 9,673 9,952
2016 - 280 9,332 9,612
2017 - 2021 8,275 1,378 39,884 49,537
2022 - 2026 9,860 1,321 32,209 43,390
2027 - 2031 28,345 1,233 27,727 57,305
2032 - 2036 158,440 641 17,651 176,732
2037 - 2041 53,255 231 5,515 59,001
2042 - 2046 19,975 45 48 20,068
Totals 280,485$ 6,383$ 173,395$ 460,263$

Community Development Administration
Residential Revenue Bonds
NOTES TO FINANCIAL STATEMENTS - CONTINUED
(in thousands)
June 30, 2012 and 2011
- 44 -
NOTE 9 - INTEREST RATE EXCHANGE AGREEMENTS (SWAPS) (Continued)
Fair Values
The table below summarizes the total fair values for CDA’s interest rate exchange
agreements at June 30, 2011 and June 30, 2012, and the changes in fair values for the period
ending June 30, 2012.
Total Total Change in
Fair Value at Fair Value at Fair Value
June 30, 2011 June 30, 2012 for the Period
Interest Rate Exchange Agreements:
Cash Flow Hedges (26,475)$ (35,862)$ (9,387)$
Investment Derivatives - - -
Total (26,475)$ (35,862)$ (9,387)$
In accordance with accounting guidance issued by GASB, the fair value balances of
derivative instruments (interest rate exchange agreements) outstanding at June 30, 2012,
classified by type, and the changes in fair value of such derivative instruments as presented
on the financial statements for the period ending June 30, 2012, are as follows:
Outstanding
Notional
Classification Amount Classification Amount Amounts
Cash Flow Hedges:
Pay fixed interest Deferred
rate swaps Outflow (9,387)$ Debt (35,862)$ 267,230$
Investment Derivatives:
Pay fixed interest Investment
rate swaps Revenue -$ Investment -$ -$
Change in Fair Value Fair Value at June 30, 2012
As of June 30, 2012, all of CDA’s swaps do meet the criteria for effectiveness and the swap
fair values are classified as deferred outflow.

Community Development Administration
Residential Revenue Bonds
NOTES TO FINANCIAL STATEMENTS - CONTINUED
(in thousands)
June 30, 2012 and 2011
- 45 -
NOTE 9 - INTEREST RATE EXCHANGE AGREEMENTS (SWAPS) (Continued)
The table below summarizes the total fair values for CDA’s interest rate exchange
agreements at June 30, 2010 and June 30, 2011, and the changes in fair values for the period
ending June 30, 2011.
Total Total Change in
Fair Value at Fair Value at Fair Value
June 30, 2010 June 30, 2011 for the Period
Interest Rate Exchange Agreements:
Cash Flow Hedges (32,630)$ (26,475)$ 6,155$
Investment Derivatives - - -
Total (32,630)$ (26,475)$ 6,155$
In accordance with accounting guidance issued by GASB, the fair value balances of
derivative instruments (interest rate exchange agreements) outstanding at June 30, 2011,
classified by type, and the changes in fair value of such derivative instruments as presented
on the financial statements for the period ending June 30, 2011, are as follows:
Outstanding
Notional
Classification Amount Classification Amount Amounts
Cash Flow Hedges:
Pay fixed interest Deferred
rate swaps Outflow 6,155$ Debt (26,475)$ 280,485$
Investment Derivatives:
Pay fixed interest Investment
rate swaps Revenue -$ Investment -$ -$
Change in Fair Value Fair Value at June 30, 2011
At June 30, 2010, CDA had terminated the original swap agreements for the 2007 Series F, J
and M swaps. The new agreements were restructured based on the remarketing of the
underlying bonds from taxable to tax-exempt. As of June 30, 2011, all of CDA’s swaps do
meet the criteria for effectiveness and the swap fair values are classified as deferred outflow.

Community Development Administration
Residential Revenue Bonds
NOTES TO FINANCIAL STATEMENTS - CONTINUED
(in thousands)
June 30, 2012 and 2011
- 46 -
NOTE 9 - INTEREST RATE EXCHANGE AGREEMENTS (SWAPS) (Continued)
The fair values of the interest rate swaps were estimated using the zero-coupon method. This
method calculates the future net settlement payments required by the swap, assuming that the
current forward rates implied by the yield curve correctly anticipate future spot interest rates.
These payments are then discounted using the spot rates implied by the current yield curve
for hypothetical zero-coupon bonds due on each future net settlement on the swaps.
NOTE 10 - BOND REFUNDINGS
Certain refundings of debt are due to the prepayments of single family mortgage loans. In
these cases, CDA transfers the proceeds of the refunding bonds to a redemption account to
redeem previously issued bonds and, simultaneously, transfers the prepayments of single
family mortgage loans financed by these prior bonds to the refunding bonds’ accounts for the
purpose of originating new loans. This recycling of prepayments enables CDA to originate
new loans that are not subject to the limitations of the IRS volume cap. CDA does not pay
call premiums on these special redemptions, and the refundings are not undertaken to reduce
interest rates, revise payment schedules or modify restrictions. CDA writes off any
unamortized deferred issuance costs or original issue discounts, net of unamortized original
issue premiums, as a loss in the accompanying Statements of Revenue, Expenses and
Changes in Net Assets. If unamortized original issue premiums exceed unamortized deferred
issuance costs and original issue discounts, CDA records a gain.
For current refundings of debt in an optional redemption, CDA replaces previously issued
bonds with lower cost debt. This type of transaction is commonly known as an economic
refunding. For the year ended June 30, 2011, CDA had redeemed, on July 9, 2010, $28,465
of Single Family Program 1999 Third Series bonds which were refunded when CDA issued
$28,465 of Residential Revenue Bonds 2010 Series A on June 9, 2010. This refunding
reduced total debt service payments over the next 11 years by $2,625 and resulted in an
economic gain of $1,596.

Community Development Administration
Residential Revenue Bonds
NOTES TO FINANCIAL STATEMENTS - CONTINUED
(in thousands)
June 30, 2012 and 2011
- 47 -
NOTE 10 - BOND REFUNDINGS (Continued)
In economic refundings, CDA defers the difference between the reacquisition price (i.e., the
principal of the old debt, plus the call premium) and the net carrying amount of the old debt
(i.e., the amount due at maturity, adjusted for any unamortized premium or discount and
issuance costs related to the old debt) as an offset to the new bonds on the accompanying
Statements of Net Assets in accordance with accounting guidance issued by GASB. This
deferral is amortized, using the effective interest method, over the remaining life of the old
debt or the life of the new debt, whichever is shorter. As a result of the refunding described
above, CDA deferred $352 of unamortized costs of issuance and call premium. The period
of amortization is 128 months.
Also, for the year ended June 30, 2011, CDA issued $40,000 of Residential Revenue Bonds
2010 Series B on December 16, 2010 which refunded Residential Revenue Bonds 2004
Series C and 2005 Series C variable rate bonds, each with a balance of $20,000. The
refunding allowed CDA to convert the variable rate debt to fixed rate debt while preserving
the full permitted yield on the underlying mortgages. There was no economic gain on the
transaction. As a result of this refunding, CDA deferred $364 of unamortized costs of
issuance. The period of amortization is 296 months.
For the year ended June 30, 2012, CDA did not issue any refunding bonds for the purpose of
lowering its cost of debt.
NOTE 11 - REBATE LIABILITY
In accordance with the Internal Revenue Service Code (the Code), the Fund has recorded a
rebate liability for excess investment earnings in tax-exempt bond and note issues. The
excess investment earnings arise due to actual investment yields earned by the Fund being
greater than yields permitted to be retained by the Fund under the Code. The Code requires
90% of such excess investment earnings to be remitted to the United States Treasury every
five years and in full at the final redemption of the bonds. Interest income on the Statements
of Revenue, Expenses and Changes in Net Assets is reduced by the rebate liability due to
excess investment earnings. The increase/decrease in fair value of investments on the
Statements of Revenue, Expenses and Changes in Net Assets is adjusted by the change in the
estimated rebate liability due to change in fair value of investments.

Community Development Administration
Residential Revenue Bonds
NOTES TO FINANCIAL STATEMENTS - CONTINUED
(in thousands)
June 30, 2012 and 2011
- 48 -
NOTE 11 - REBATE LIABILITY (Continued)
Rebate liability activity for the years ended June 30, 2012 and 2011 was as follows:
2012 2011
Beginning rebate liability 7,208$ 1,659$
Change in estimated liability due
to excess investment earnings 268 429
Change in estimated liability
due to change in fair value
of investments 65 (58)
Transfer rebate liability - 5,993
Less - payments made (646) (815)
Ending rebate liability 6,895$ 7,208$
Total rebate liability is allocated as follows:
2012 2011
Estimated liability due to excess
investment earnings 6,830$ 7,208$
Estimated liability due to change
in fair value of investments 65 -
Ending rebate liability 6,895$ 7,208$

Community Development Administration
Residential Revenue Bonds
NOTES TO FINANCIAL STATEMENTS - CONTINUED
(in thousands)
June 30, 2012 and 2011
- 49 -
NOTE 12 - LONG-TERM OBLIGATIONS
Changes in long-term obligations for the years ended June 30, 2012 and 2011 were as
follows:
2012 2011
Rebate liability
Beginning balance 7,208$ 1,659$
Additions 333 6,422
Reductions (646) (873)
Ending balance 6,895 7,208
Less due within one year (59) (637)
Total long-term rebate liability 6,836 6,571
Bonds payable
Beginning balance 2,206,375 2,219,608
Additions - 130,825
Reductions (171,080) (142,365)
Change in deferred amounts for
issuance discounts/premiums (6,949) (1,012)
Change in deferred amounts on refundings 52 (681)
Ending balance 2,028,398 2,206,375
Less due within one year (66,795) (79,350)
Total long-term bonds payable 1,961,603 2,127,025
Deposits by borrowers
Beginning balance 4,253 5,168
Additions 1,999 2,121
Reductions (1,718) (3,036)
Ending balance 4,534 4,253
Less due within one year (2,138) (2,102)
Total long-term deposits
by borrowers 2,396 2,151
Interest rate exchange agreements
Beginning balance 26,475 32,630
Additions 9,387 -
Reductions - (6,155)
Ending balance 35,862 26,475
Total long-term interest rate
exchange agreements 35,862 26,475
Total long-term liabilities 2,006,697$ 2,162,222$

Community Development Administration
Residential Revenue Bonds
NOTES TO FINANCIAL STATEMENTS - CONTINUED
(in thousands)
June 30, 2012 and 2011
- 50 -
NOTE 13 - INTERFUND ACTIVITY
In accordance with the Resolution, net assets in Residential Revenue Bonds are restricted and
pledged to bondholders. However, restricted assets may be transferred to other Funds,
subject to the provisions of the Resolution. Generally, an officer of CDA must authorize
such withdrawals and a cash flow analysis must demonstrate that sufficient monies remain in
the Resolution to meet the obligations of the Fund in current and future years.
During the years ended June 30, 2012 and 2011, the Fund transferred the following amounts,
as permitted, among Funds:
2012 2011
Excess revenue transferred from
Single Family Program Bonds -$ 15,361$
Cost of issuance on bonds and other expenses
transferred from Single Family Program Bonds - 15
Transfer mortgage loans and mortgage loan-related
activity from Single Family Program Bonds - 101,297
Transfer funds for the refunding of bonds to the
Single Family Program Bonds indenture - (28,113)
Excess revenue transferred to the
General Bond Reserve Fund (6,875) (7,300)
Cost of issuance on bonds and other expenses
transferred to Single Family Housing Revenue Bonds (3,346) -
Transfer to separate account in accordance
with HUD agreement (22) (23)
(10,243)$ 81,237$
Community Development Administration
Residential Revenue Bonds
NOTES TO FINANCIAL STATEMENTS - CONTINUED
(in thousands)
June 30, 2012 and 2011
- 51 -
NOTE 14 - MORTGAGE INSURANCE
Substantially all mortgage loans in the Fund have mortgage insurance as described in Note 4.
Multi-family mortgagors pay premiums for mortgage insurance and insurance coverage is
100% of the unpaid principal balance of the loan.
For a single family loan insured by an agency of the U.S. Government the primary mortgage
insurance covers an amount substantially equal to the unpaid principal amount of the loan.
Almost all other loans have primary mortgage insurance in an amount that is at least 25% of
the loan amount. Approximately 2% of all first lien loans either did not have primary
mortgage insurance due to their original loan-to-value ratios of less than 80% or have
cancelled primary mortgage insurance due to their outstanding balance falling below 80% of
the original loan amount. About 43% of all loans are insured by agencies of the U.S.
Government in an amount substantially equal to the unpaid principal amount of the loan.
Approximately 55% of total loans are insured by private mortgage insurers or MHF.
Approximately 81% of the total loans insured by private mortgage insurers or MHF are
covered at 35% of the loan amount. The remaining 19% of this group of loans is insured by
three different private mortgage insurers who, due to financial constraints or receivership, are
currently paying to CDA half of the 35% or approximately 18% of the loan amount. An
allowance for loan losses has been established for loans insured by private mortgage insurers.
Premiums are paid by single family mortgagors.

Community Development Administration
Residential Revenue Bonds
NOTES TO FINANCIAL STATEMENTS - CONTINUED
(in thousands)
June 30, 2012 and 2011
- 52 -
NOTE 14 - MORTGAGE INSURANCE (Continued)
CDA has entered into an agreement (the Reinsurance Agreement) with MHF effective
January 1, 2011, in order to provide supplemental insurance coverage in the Fund for all
private mortgage insured loans and post-2005 MHF primary insured loans residing in the
active portfolio as of December 31, 2010. Insured loans in the private mortgage insurance
portfolio have 35% coverage from the private mortgage insurer. Upon receipt of the primary
mortgage insurance claim, MHF will pay 100% of the remaining claim amount for all private
mortgage insured loans and post-2005 MHF primary insured loans that have foreclosure
dates occurring after December 31, 2010. Once the claim is paid by MHF, the property is
transferred to MHF for disposal and is no longer an asset of CDA. Upon sale of the property
and if the sale results in a loss, CDA and MHF will share equally in any such loss incurred.
The Reinsurance Agreement shall terminate when the total amount of MHF net losses (the
amount calculated after all claims are paid and expenses are realized) reaches $12,500 or on
December 31, 2020, whichever occurs first.
NOTE 15 - PENSION AND OTHER POST-RETIREMENT BENEFITS
Eligible employees of CDA and employees of the State of Maryland are covered under the
retirement plans of the State Retirement and Pension System of Maryland (the System) and
are also entitled to certain healthcare benefits upon retirement. CDA’s only obligation for
retirement and post-employment benefits is its required annual contribution, which was paid
in full by CDA to the State of Maryland prior to year end. The System prepares a separate
audited Comprehensive Annual Financial Report which can be obtained from the State
Retirement and Pension System of Maryland, 120 East Baltimore Street, Baltimore,
Maryland 21202 or by visiting the website at www.sra.state.md.us.

Community Development Administration
Residential Revenue Bonds
NOTES TO FINANCIAL STATEMENTS - CONTINUED
(in thousands)
June 30, 2012 and 2011
- 53 -
NOTE 16 - SUBSEQUENT EVENTS
Events that occur after the date of the statement of net assets but before the financial
statements were available to be issued must be evaluated for recognition or disclosure. The
effects of subsequent events that provide evidence about conditions that existed at the date of
the statement of net assets are recognized in the accompanying financial statements.
Subsequent events which provide evidence about conditions that existed after the date of the
statement of net assets require disclosure in the accompanying notes. Management evaluated
the activity of CDA through September 28, 2012 (the date the financial statements were
available to be issued) and concluded that no subsequent events have occurred that would
require recognition in the financial statements or disclosure in the notes to the financial
statements, except for the following activity that occurred subsequent to June 30, 2012.
Subsequent to the year ended June 30, 2012, the following bond activity took place:
On August 23, 2012, CDA issued the following bonds:
2012 Series A $44,450
2012 Series B $45,000
On September 4, 2012, CDA redeemed the following bonds:
2006 Series S $145
2007 Series A $200
2007 Series B $170
2007 Series F $2,865
2007 Series H $30
2007 Series J $4,135

Community Development Administration
Residential Revenue Bonds
SUPPLEMENTAL DISCLOSURES OF CHANGE
IN FAIR VALUE OF INVESTMENTS AND
MORTGAGE-BACKED SECURITIES
(in thousands)
(unaudited)
June 30, 2012 and 2011
- 54 -
In accordance with accounting guidance issued by GASB, CDA reflects investments and
mortgage-backed securities at fair value, and the increase or decrease in fair value is included in
the Statements of Revenue, Expenses and Changes in Net Assets.
For investments (obligations of U.S. Government Agencies) held by the Fund as of June 30,
2012, the following schedule summarizes annual increases/decreases in fair value and the
cumulative difference between fair value and amortized cost:
Fiscal year ended Annual increases Cumulative
June 30, /decreases total
2000 (227)$ (227)$
2001 551$ 324$
2002 97$ 421$
2003 544$ 965$
2004 (674)$ 291$
2005 403$ 694$
2006 (1,567)$ (873)$
2007 1,062$ 189$
2008 785$ 974$
2009 46$ 1,020$
2010 2,747$ 3,767$
2011 (2,244)$ 1,523$
2012 1,374$ 2,897$

Community Development Administration
Residential Revenue Bonds
SUPPLEMENTAL DISCLOSURES OF CHANGE
IN FAIR VALUE OF INVESTMENTS AND
MORTGAGE-BACKED SECURITIES - CONTINUED
(in thousands)
(unaudited)
June 30, 2012 and 2011
- 55 -
For mortgage-backed securities held by the Fund as of June 30, 2012, the following schedule
summarizes annual increases/decreases in fair value and the cumulative difference between fair
value and cost:
Fiscal year ended Annual increases Cumulative
June 30, /decreases total
2011 (585)$ (585)$
2012 1,858$ 1,273$
Reconciliation to the Statements of Revenue, Expenses and Changes in Net Assets for the year
ended June 30, 2012:
Increase in fair value of investments held
at June 30, 2012 1,374$ Adjustment due to rebate liability (see Note 11) (65)
Increase in fair value of investments, net of rebate, asreported on the Statements of Revenue, Expenses and
Changes in Net Assets for the year ended June 30, 2012 1,309$
Reconciliation to the Statements of Revenue, Expenses and Changes in Net Assets for the year
ended June 30, 2011:
Decrease in fair value of investments held
at June 30, 2011 (2,244)$ Adjustment due to rebate liability (see Note 11) 58
Decrease in fair value of investments, net of rebate, asreported on the Statements of Revenue, Expenses and
Changes in Net Assets for the year ended June 30, 2011 (2,186)$