Embed Size (px)
Citation preview
7/27/2019 Community Dev J 2013 Ennis 40 57
http://slidepdf.com/reader/full/community-dev-j-2013-ennis-40-57 1/18
Using social network analysisin community development
practice and research: a
case study
Gretchen Ennis* and Deborah West
Abstract In 2010, we proposed that integrating social network analysis into
community development practice may be a useful way to make overt the
links between micro- and macro-level issues in communities, and for
researching the impacts of community development work [Ennis, G. and
West, D. (2010) Exploring the potential of social network analysis in
asset-based community development practice and research, Australian
Social Work, 63 (4), 404–417]. This article presents research drawn from
a community case study and provides a real example of how network
analysis can be embedded in community development processes. The
research demonstrates that social network analytic techniques can be
useful in a range of ways, including: facilitating a critical analysis of ‘the
community’; focusing community work processes; and providing
particular understandings about the outcomes and impacts of
community work. In summary, the findings demonstrate that social
network analysis is a useful tool for facilitating community developmentand measuring the efficacy of community development projects.
Introduction
In the first instance, we wish to make clear that by ‘social network analysis’
we are discussing a research methodology and not the analysis of online
social networks (such as Facebook or Myspace, etc). Social network analysis
provides particular understandings about how people or other entities are
* Address for correspondence: Gretchen Ennis, School of Health, Faculty of Engineering, Health, Science
and the Environment, Charles Darwin University, Northern Territory 0909, Australia; email: gretchen.
& Oxford University Press and Community Development Journal. 2012
All rights reserved. For permissions, please email: [email protected]
doi:10.1093/cdj/bss013
Advance Access publication 10 May 2012
40 Community Development Journal Vol 48 No 1 January 2013 pp. 40–57
a
t T h e A u s t r a l i a n N a t i on a l Uni v e r s i t y onM a y2 6 ,2 0 1 3
h t t p : / / c d j . oxf or d j o ur n a l s . or g /
D o wnl o a d e d f r om
7/27/2019 Community Dev J 2013 Ennis 40 57
http://slidepdf.com/reader/full/community-dev-j-2013-ennis-40-57 2/18
connected and therefore is a way to consider social structures of
various kinds.
Social network analysis and theory (with its links to social capital ideas)
has been discussed by a range of community work authors who have
articulated network approaches to community development (for example:
Trevillion, 1992, 1999; Gilchrist, 2000, 2004, 2009; Hardcastle, Powers and
Wenocur, 2004; Gilchrist, Bowles and Wetherell, 2010). Such authors have
argued that building and maintaining positive connections between
diverse groups of people and organizations can facilitate dialogue and
open up access to resources, information and ideas. Extending these
ideas, we have argued that integrating social network analysis techniques
into community development practice and research (particularly strengths
and network approaches) may assist in better understanding the processes,impacts and efficacy of community development work (Ennis and West,
2010).
Social network analysis is concerned with examining social structures.
As we have previously discussed:
Within social network theory, social structure can be conceptualised as a
network of social ties or relationships (de Nooy, Mrvar and Bategelj, 2005).
A social network is social structure which consists of two elements; these
are generally known as actors (or nodes or points) and ties (sometimesreferred to as links or relationships) (Ennis and West, 2010, p. 408).
Thinking in terms of the connections between people, groups and organiza-
tions can assist workers and communities to focus not only internally on
their communities (and the strengths and resources within them) but exter-
nally to consider the links to broader social structures that impact them
(Ennis and West, 2010). Drawing on the work of sociologists such as
Bourdieu (1977, 1986) and Giddens (1984), a network focus can provide
understanding about how our micro-level relationships combine to createand/or challenge broader social structures. Such an understanding of
the patterns of links and flows in smaller scale personal interactions can
assist in critical thinking about how these interactions may either reproduce
or challenge larger scale oppressive social systems.
We have previously proposed a range of ideas for the use of social
network analysis in community development work (Ennis and West,
2010). The current article provides a discussion of the use of one of those
ideas: the analysis of a participant network, before and after a communitydevelopment project. This analysis is drawn from research undertaken by
Gretchen (Ennis, 2011) as part of a larger case study. The case used is a
project undertaken by a grassroots, volunteer-based community network
called Ludmilla Neighbourhood Connections (LNC). LNC embraced a
Social network analysis in community development practice and research 41
a t T h e A u s t r a l i a n N a t i on a l Uni v e r s i t y onM a y2 6 ,2 0 1 3
h t t p : / / c d j . oxf or d j o ur n a l s . or g /
D o wnl o a d e d f r om
7/27/2019 Community Dev J 2013 Ennis 40 57
http://slidepdf.com/reader/full/community-dev-j-2013-ennis-40-57 3/18
‘strengths’ or ‘assets’ approach to community development. Such an
approach highlights and mobilizes community strengths in working
towards meaningful change (Kretzmann and McKnight, 1993). The creation
and maintenance of positive relationships is a critical element of the
approach, as such relationships are viewed as ‘assets’.
Background
LNC: the ‘case’
The case in question was a community project located in a suburban neigh-
bourhood in Darwin, Northern Territory, Australia, which took place
between January 2009 and July 2010. The project involved the formationof a community network comprised of citizens from Bagot Community
(an Aboriginal community, located within the suburb of Ludmilla) and
other parts of Ludmilla1 as well as representatives from a range of local gov-
ernment and non-government organizations.
The LNC network formed as a result of long-term issues concerning the
social separation of Aboriginal and non-Aboriginal people in the area. This
separation is complex and multi-faceted, beginning with colonization and
reinforced by subsequent government policies which at various times ac-
tively sought separation of different cultures. Of the approximately 1700
people that live in the suburb, 430 are Aboriginal and 252 were born over-
seas (Australian Bureau of Statistics, 2007), with the balance identifying as
non-Aboriginal, Australian born residents. The majority of Aboriginal resi-
dents live in Bagot Community.
Gretchen was part of the formation of the LNC network in 2007 and took
on the role of facilitator as part of her PhD studies. The project primarily
relied on the work of volunteers and the in-kind support of the organiza-
tions involved, with some small community grants to undertake particularactivities.
The primary aim of the project (developed by the people involved) was to
increase supportive social networks between people of different cultures in
the neighbourhood and to broadly ‘create a sense of community’ in the area.
Participants agreed that the primary resources in the community were the
people: their knowledge, culture, skills and commitment to the area.
Other resources or assets identified by participants were focused upon
the natural environment, local school facilities and the passion and
resources of a range of individuals and community organizations in the
local area.
1 The participants in this study have indicated that the communities can be named.
42 Gretchen Ennis and Deborah West
a t T h e A u s t r a l i a n N a t i on a l Uni v e r s i t y onM a y2 6 ,2 0 1 3
h t t p : / / c d j . oxf or d j o ur n a l s . or g /
D o wnl o a d e d f r om
7/27/2019 Community Dev J 2013 Ennis 40 57
http://slidepdf.com/reader/full/community-dev-j-2013-ennis-40-57 4/18
Social network theory
Theoretically, the aim of increasing supportive social networks is linked to
ideas from social capital theory:
The links between individuals and organisations, are key to sharing of information and resources, and mobilisation for change. Social networks
are a central concept in social capital literature, and are generally
considered to be the ‘structure’ within which social capital can exist
(Bourdieu, 1986; Putnam, 1993; Lin, 2001; Stone, 2001). (Ennis and West,
2010, p. 408)
Based upon the assumption that there were few relationships linking
people in Bagot Community and people in the rest of the suburb, the
LNC project focused on developing links of communication and dialogue.
These types of relationships have been called ‘bridging ties’ in social capital
literature (Putnam, 2000; Healy and Hampshire, 2002).
In order to ‘build bridges’, a range of activities were undertaken. Over
nineteen months, LNC held ten community meetings involving thirty-one
individual community members, three schools, a youth arts organization,
four non-government community/welfare organizations, a church group,
two local environment groups, members of local council and a member
of the Northern Territory government. Through these meetings, LNC orga-
nized a number of events and activities: gardeners’ mornings, a guided bushwalk and a family fun day, neighbourhood breakfasts, Christmas gath-
erings, a large public information meeting and a large community DVD
launch celebration. We also worked in partnership with other local organi-
zations on various community events, including the development of an
‘edible garden’ project and the production of a local neighbourhood
DVD. LNC also put together and distributed thirteen editions of a neigh-
bourhood newsletter to over 400 households and developed an online infor-
mation network via email and social networking sites.
As per a strengths philosophy, these activities and events were focused
on sharing empowering stories, understanding diverse local histories, iden-
tifying and highlighting neighbourhood assets and linking people and
organizations to achieve the aims of the project (Kretzmann and McKnight,
1993; McCashen, 2005).
Methodology
In order to understand changes in community networks, a pre- and post-
project network analysis design was employed for the research. The
network analysis software, Pajek (de Nooy, Mrvar and Bategelj, 2005),
Social network analysis in community development practice and research 43
a t T h e A u s t r a l i a n N a t i on a l Uni v e r s i t y onM a y2 6 ,2 0 1 3
h t t p : / / c d j . oxf or d j o ur n a l s . or g /
D o wnl o a d e d f r om
7/27/2019 Community Dev J 2013 Ennis 40 57
http://slidepdf.com/reader/full/community-dev-j-2013-ennis-40-57 5/18
was used to develop the diagrams and network frequency distributions
presented here.
Collecting network dataThe LNC project targeted the neighbourhood as a whole; however, the
social network analysis was used to gain an understanding of the relation-
ships among active project participants and their local networks at the be-
ginning and end of the project.
A snowballing technique provided data about relationships (as people
only referred others they knew) and demonstrated who was connected to
the LNC project via the LNC members. We called the network of active
LNC members and their contacts in the neighbourhood the ‘LNC commu-nity network’.
To gather the snowball sample, we began with ‘active’ participants
(people attending meetings or communicating with the facilitator regular-
ly) and asked them to refer other people they communicate with in the
area who might agree to be interviewed. Participants were asked if they
would call this person ‘close friend or family’; if so, the relationship was
registered as a ‘strong tie’, if not it was registered as a ‘weak tie’. At the
end of this data collection process, information about actors and the
‘strength’ of their communication relationship was available for analysis.This technique provided a snapshot of the LNC community network at a
point in time (December 2008). There were forty-nine participants in this
pre-project network.
The same process of snowball sampling occurred after the project ended
in August 2009. The post-project network was made up of sixty-one people.
Only thirty-two of the forty-nine people in the pre-project network were
present in the post-project network. This is discussed in more detail later.
Analysing network data
Because we were interested in understanding cross-cultural social connec-
tions, the focus of this particular study was upon network structure and
composition. The structure of the network includes network size, connect-
edness of the actors, concentration or dispersion of actors, accessibility of
the network, degree of clustering in the network and the heterogeneity or
homogeneity of the actors (Wasserman and Faust, 1994). As this project
was aimed at increasing connections between different cultural groups,the various cultural groups identified by the participants are the attribute
included on these diagrams and analysis. For the analysis presented
here, the diverse cultural groups have been clustered into people who
44 Gretchen Ennis and Deborah West
a t T h e A u s t r a l i a n N a t i on a l Uni v e r s i t y onM a y2 6 ,2 0 1 3
h t t p : / / c d j . oxf or d j o ur n a l s . or g /
D o wnl o a d e d f r om
7/27/2019 Community Dev J 2013 Ennis 40 57
http://slidepdf.com/reader/full/community-dev-j-2013-ennis-40-57 6/18
identify as ‘Aboriginal’, ‘born overseas’ and ‘Australian, no other cultural
group’.2
In terms of network composition, it is useful to consider how reflective
the LNC community network is in terms of the broader suburb. Network
composition data have been added to the diagram legends for both the
pre- and post-project participants.
Findings
Network diagrams were generated using the Fructerman Reingold energy
command for creating drawings in Pajek (de Nooy, Mrvar and Bategelj,
2005). The results of the pre- and post-network project network analysisare presented in a diagrammatic and descriptive statistical form.
The LNC participant network is not particularly reflective of the cultural
diversity in the suburb of Ludmilla. Twenty-five percent of the population
of Ludmilla identifies as Aboriginal Australian; however, in the LNC
participant network, only 10 percent identifies as Aboriginal Australian.
In terms of people born overseas, the LNC participant network almost
exactly reflects the 14.8 percent of people in Ludmilla born overseas. The
cultural diversity of the LNC participant network is reflective of the
suburb in terms of people born overseas, but not in terms of AboriginalAustralians.
The elements of interest in terms of network structure are network size
(the number of actors and the number of ties); the components of the
network (the sub-groups or sections of the network) and their linkages;
and the cohesion of the network, which is measured via the average
degree (number of connections) of network actors.
In terms of size, there are forty-nine actors joined by sixty-one ties in the
pre-project participant network. It is generally useful to explore the dia-grams to see if there are any components (or subgroups) because, as de
Nooy, Mrvar and Bategelj (2005, p. 61) discuss:
Social networks usually contain dense pockets of people who “stick
together”. We call them cohesive subgroups and we hypothesize that the
people involved are joined by more than interaction. Social interaction is
the basis of solidarity, shared norms, identity, and collective behaviour, so
people who interact intensively are likely to consider themselves a social
group.
2 The authors acknowledge that such clustering can serve to ‘make invisible’ distinct cultural groups.
The original analysis, used in the first stage of the community work, included the multiple cultural
groups as they were identified by participants. However, for the sake of visual clarity, the diagrams in
this article are clustered.
Social network analysis in community development practice and research 45
a t T h e A u s t r a l i a n N a t i on a l Uni v e r s i t y onM a y2 6 ,2 0 1 3
h t t p : / / c d j . oxf or d j o ur n a l s . or g /
D o wnl o a d e d f r om
7/27/2019 Community Dev J 2013 Ennis 40 57
http://slidepdf.com/reader/full/community-dev-j-2013-ennis-40-57 7/18
Locating components is a particularly useful process in exploratory
network analysis, where the researcher might be interested in finding out
whether structural sub-groups correlate with other attributes or variables,
such as gender or age.
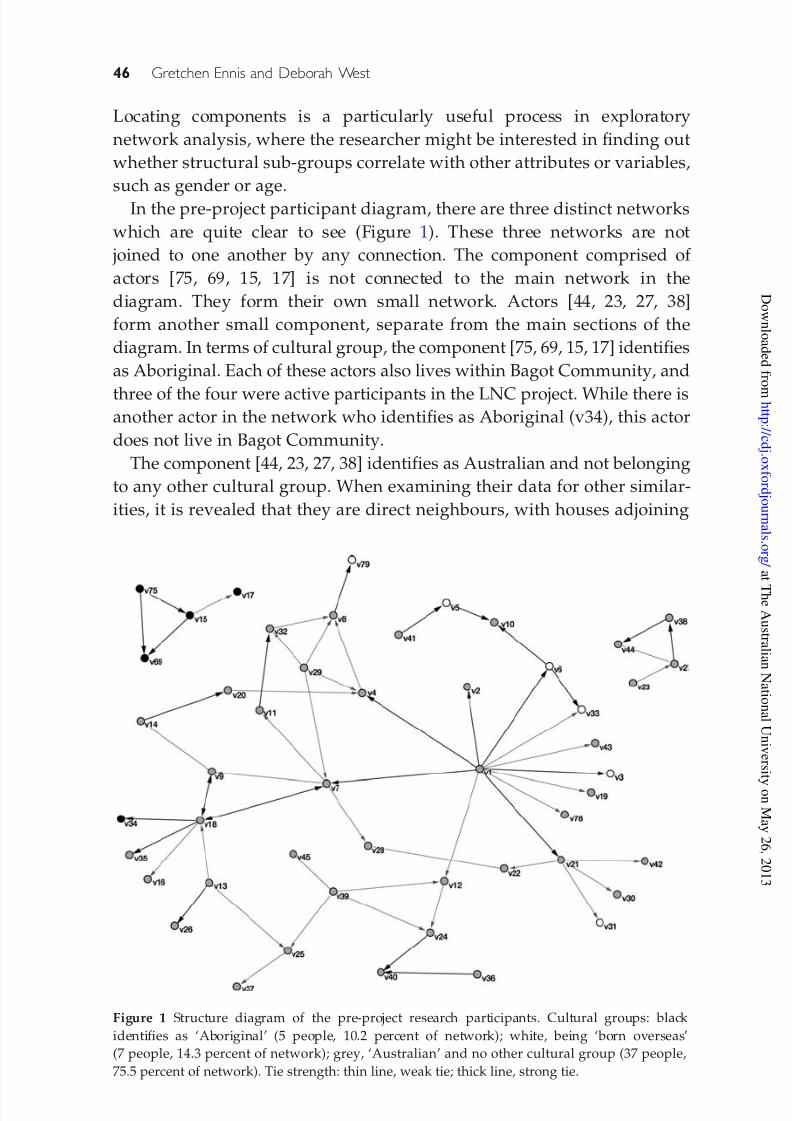
In the pre-project participant diagram, there are three distinct networks
which are quite clear to see (Figure 1). These three networks are not
joined to one another by any connection. The component comprised of
actors [75, 69, 15, 17] is not connected to the main network in the
diagram. They form their own small network. Actors [44, 23, 27, 38]
form another small component, separate from the main sections of the
diagram. In terms of cultural group, the component [75, 69, 15, 17] identifies
as Aboriginal. Each of these actors also lives within Bagot Community, and
three of the four were active participants in the LNC project. While there isanother actor in the network who identifies as Aboriginal (v34), this actor
does not live in Bagot Community.
The component [44, 23, 27, 38] identifies as Australian and not belonging
to any other cultural group. When examining their data for other similar-
ities, it is revealed that they are direct neighbours, with houses adjoining
Figure 1 Structure diagram of the pre-project research participants. Cultural groups: black
identifies as ‘Aboriginal’ (5 people, 10.2 percent of network); white, being ‘born overseas’
(7 people, 14.3 percent of network); grey, ‘Australian’ and no other cultural group (37 people,
75.5 percent of network). Tie strength: thin line, weak tie; thick line, strong tie.
46 Gretchen Ennis and Deborah West
a t T h e A u s t r a l i a n N a t i on a l Uni v e r s i t y onM a y2 6 ,2 0 1 3
h t t p : / / c d j . oxf or d j o ur n a l s . or g /
D o wnl o a d e d f r om
7/27/2019 Community Dev J 2013 Ennis 40 57
http://slidepdf.com/reader/full/community-dev-j-2013-ennis-40-57 8/18
one another (we will call them X-street residents). Other variables such as
age, gender, profession and family status did not reveal commonalities
between all four from that small network.
It is possible, therefore, to say that these two small components are
based on geography, or small geographic sub-communities, and perhaps
on cultural group (as both components contain only one cultural group
each). There is a Bagot Community component and an ‘X-street’ com-
ponent. The main component of the diagram, containing all other actors,
does not appear to have any significant similarities among actors, although
it is predominantly filled by the group ‘Australian and no other cultural
group’.
It is useful to consider the ‘average degree’ of the pre-project participant
diagram. An actor’s ‘degree’ ‘is the number of lines that are incident withit’, and equivalently ‘it is the number of actors adjacent to it’ (Wasserman
and Faust, 1994, p. 100). That is, the degree of an actor is the number of
ties coming to or from it. In a network of forty-nine actors, an actor with
a degree of 0 is connected to no one. An actor with a degree of forty-eight
is connected to every other actor in the network (other than themselves).
The average degree of a network is a good indicator of the cohesiveness
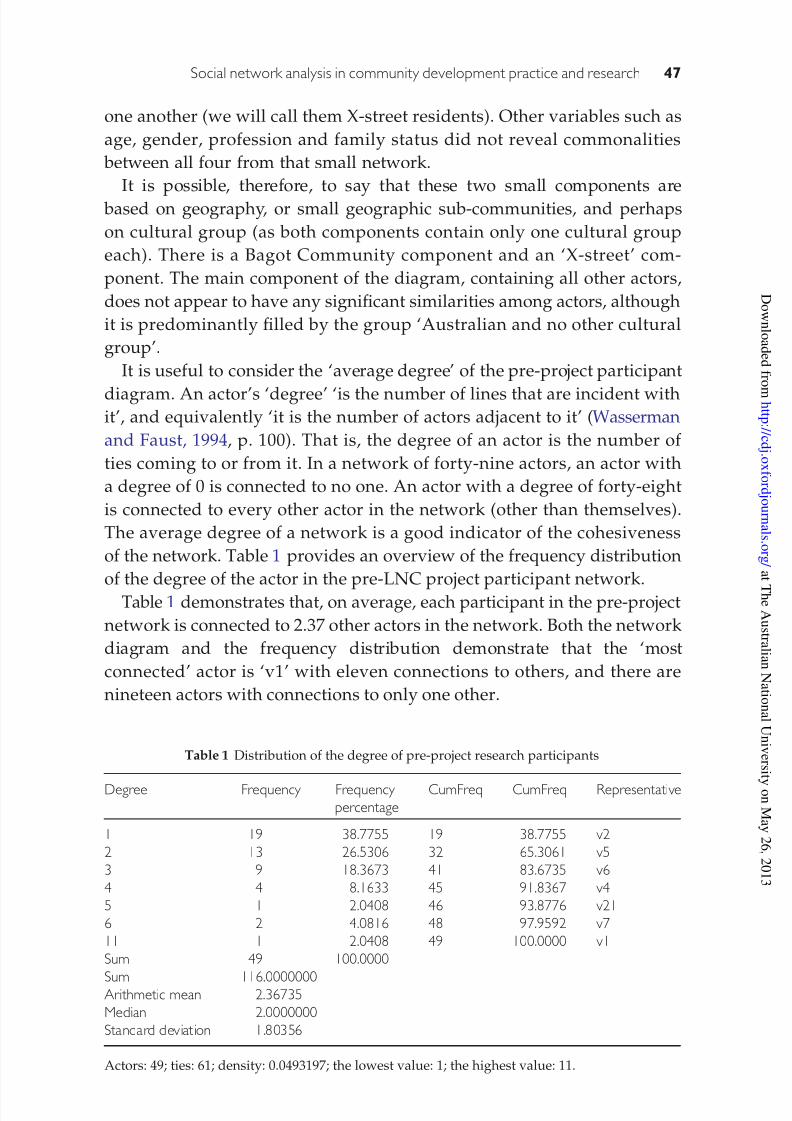
of the network. Table 1 provides an overview of the frequency distribution
of the degree of the actor in the pre-LNC project participant network.
Table 1 demonstrates that, on average, each participant in the pre-project
network is connected to 2.37 other actors in the network. Both the network
diagram and the frequency distribution demonstrate that the ‘most
connected’ actor is ‘v1’ with eleven connections to others, and there are
nineteen actors with connections to only one other.
Table 1 Distribution of the degree of pre-project research participants
Degree Frequency Frequency percentage
CumFreq CumFreq Representative
1 19 38.7755 19 38.7755 v2
2 13 26.5306 32 65.3061 v5
3 9 18.3673 41 83.6735 v6
4 4 8.1633 45 91.8367 v4
5 1 2.0408 46 93.8776 v21
6 2 4.0816 48 97.9592 v7
11 1 2.0408 49 100.0000 v1
Sum 49 100.0000
Sum 116.0000000Arithmetic mean 2.36735
Median 2.0000000
Standard deviation 1.80356
Actors: 49; ties: 61; density: 0.0493197; the lowest value: 1; the highest value: 11.
Social network analysis in community development practice and research 47
a t T h e A u s t r a l i a n N a t i on a l Uni v e r s i t y onM a y2 6 ,2 0 1 3
h t t p : / / c d j . oxf or d j o ur n a l s . or g /
D o wnl o a d e d f r om
7/27/2019 Community Dev J 2013 Ennis 40 57
http://slidepdf.com/reader/full/community-dev-j-2013-ennis-40-57 9/18
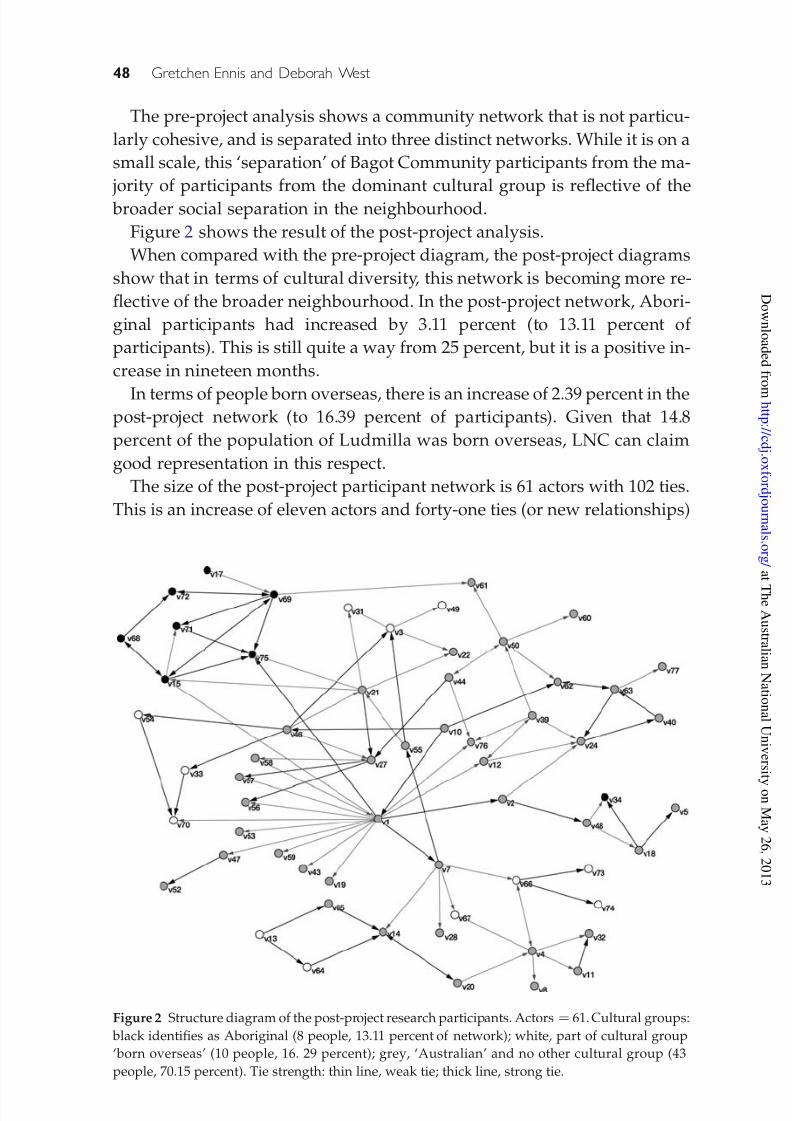
The pre-project analysis shows a community network that is not particu-
larly cohesive, and is separated into three distinct networks. While it is on a
small scale, this ‘separation’ of Bagot Community participants from the ma-
jority of participants from the dominant cultural group is reflective of the
broader social separation in the neighbourhood.
Figure 2 shows the result of the post-project analysis.
When compared with the pre-project diagram, the post-project diagrams
show that in terms of cultural diversity, this network is becoming more re-
flective of the broader neighbourhood. In the post-project network, Abori-
ginal participants had increased by 3.11 percent (to 13.11 percent of
participants). This is still quite a way from 25 percent, but it is a positive in-
crease in nineteen months.
In terms of people born overseas, there is an increase of 2.39 percent in thepost-project network (to 16.39 percent of participants). Given that 14.8
percent of the population of Ludmilla was born overseas, LNC can claim
good representation in this respect.
The size of the post-project participant network is 61 actors with 102 ties.
This is an increase of eleven actors and forty-one ties (or new relationships)
Figure 2 Structure diagram of the post-project research participants. Actors ¼ 61. Cultural groups:
black identifies as Aboriginal (8 people, 13.11 percent of network); white, part of cultural group
‘born overseas’ (10 people, 16. 29 percent); grey, ‘Australian’ and no other cultural group (43
people, 70.15 percent). Tie strength: thin line, weak tie; thick line, strong tie.
48 Gretchen Ennis and Deborah West
a t T h e A u s t r a l i a n N a t i on a l Uni v e r s i t y onM a y2 6 ,2 0 1 3
h t t p : / / c d j . oxf or d j o ur n a l s . or g /
D o wnl o a d e d f r om
7/27/2019 Community Dev J 2013 Ennis 40 57
http://slidepdf.com/reader/full/community-dev-j-2013-ennis-40-57 10/18
when compared with the pre-project participant network. However, only
thirty-two of the people in the pre-project network are present in the post-
project network. Seventeen of the people in the pre-project network were no
longer in the network by the time of the post-project data collection, and
there were twenty-nine new people in the post-project network. Seventeen
is a significant number of people to ‘drop out’ of a network. Further inves-
tigation revealed that nine people had left the area (reflecting the high
population turnover in the Northern Territory), three experienced personal
issues and five were unable to be contacted.
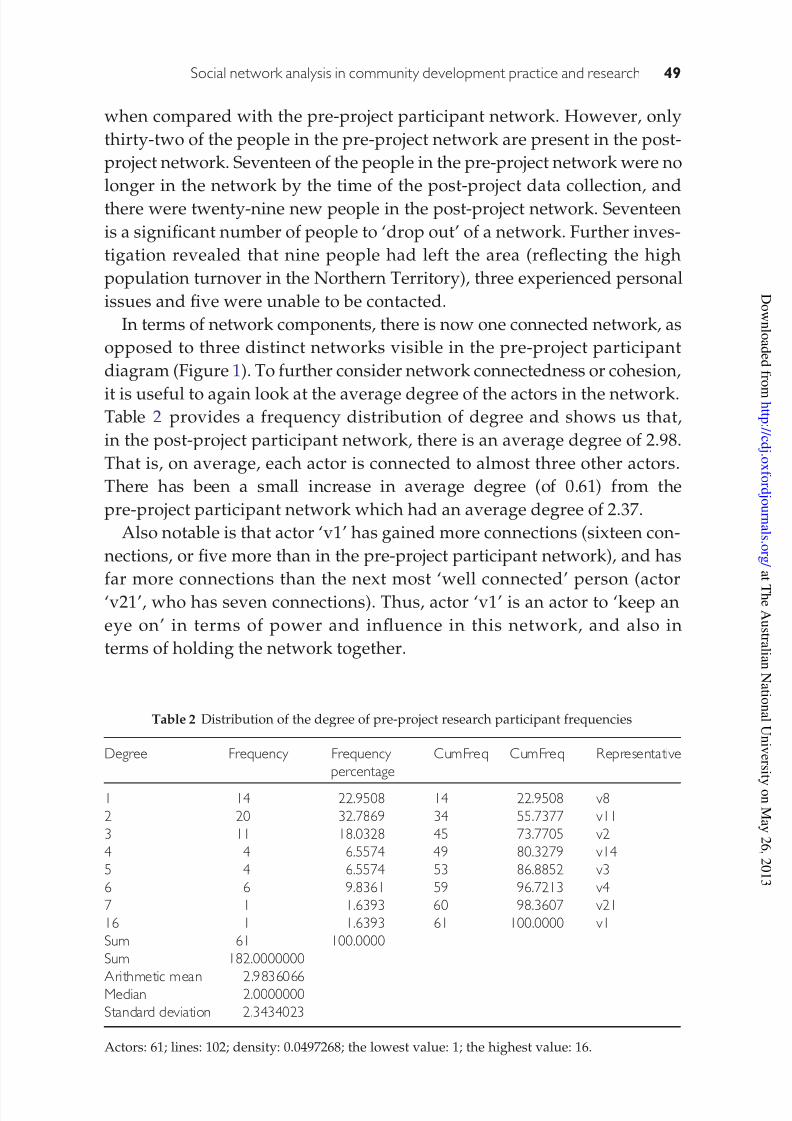
In terms of network components, there is now one connected network, as
opposed to three distinct networks visible in the pre-project participant
diagram (Figure 1). To further consider network connectedness or cohesion,
it is useful to again look at the average degree of the actors in the network.Table 2 provides a frequency distribution of degree and shows us that,
in the post-project participant network, there is an average degree of 2.98.
That is, on average, each actor is connected to almost three other actors.
There has been a small increase in average degree (of 0.61) from the
pre-project participant network which had an average degree of 2.37.
Also notable is that actor ‘v1’ has gained more connections (sixteen con-
nections, or five more than in the pre-project participant network), and has
far more connections than the next most ‘well connected’ person (actor
‘v21’, who has seven connections). Thus, actor ‘v1’ is an actor to ‘keep an
eye on’ in terms of power and influence in this network, and also in
terms of holding the network together.
Table 2 Distribution of the degree of pre-project research participant frequencies
Degree Frequency Frequency
percentage
CumFreq CumFreq Representative
1 14 22.9508 14 22.9508 v8
2 20 32.7869 34 55.7377 v11
3 11 18.0328 45 73.7705 v2
4 4 6.5574 49 80.3279 v14
5 4 6.5574 53 86.8852 v3
6 6 9.8361 59 96.7213 v4
7 1 1.6393 60 98.3607 v21
16 1 1.6393 61 100.0000 v1
Sum 61 100.0000
Sum 182.0000000
Arithmetic mean 2.9836066Median 2.0000000
Standard deviation 2.3434023
Actors: 61; lines: 102; density: 0.0497268; the lowest value: 1; the highest value: 16.
Social network analysis in community development practice and research 49
a t T h e A u s t r a l i a n N a t i on a l Uni v e r s i t y onM a y2 6 ,2 0 1 3
h t t p : / / c d j . oxf or d j o ur n a l s . or g /
D o wnl o a d e d f r om
7/27/2019 Community Dev J 2013 Ennis 40 57
http://slidepdf.com/reader/full/community-dev-j-2013-ennis-40-57 11/18
Increased connections can be seen in the post-project network. In the
post-LNC project participant network, 22.95 percent were connected to
only one person, whereas in the pre-project network, 38.76 percent had
only one connection; therefore, more people had more connections in the
post-LNC project network.
It is quite clear in Figure 2 that while the previously ‘cut off’ component
of Aboriginal residents from Bagot Community is now connected to the
broader network, it is a fragile link. The links between the cluster of Abori-
ginal cultural group actors and the broader network are to only three other
actors, actors ‘v21’, ‘v61’ and ‘v1’. While five connections have been made
that did not previously exist, more are needed to strengthen the network.
The ‘X-street’ component in the pre-project diagram (Figure 1) has
changed dramatically, with two actors no longer in the network [23 and38] and the remaining two actors [44 and 27] quite well linked into the
network.
In summary, some significant differences between the pre- and post-LNC
project networks can be seen. The post-project network is larger, with more
actors and more connections between them; it is also slightly more cohesive
and there are bridging ties evident between various clusters in the network
that were not seen in pre-project diagram. The LNC participant network has
also become more representative of the various cultural groups in the
neighbourhood.
Discussion: using network analysis in communitydevelopment practice
A meaningful sample population to ‘measure’
‘Community’ is difficult to define as there are multiple meanings and uses
of the term embracing vastly different philosophical and political values
(Young, 1990; Lynn, 2006). There are often assumptions about community being a universally positive thing, with little reflection upon whose under-
standing of community is being touted. Aside from defining communities
as those ‘of interest’ or those ‘of place’, much community work literature
and research does not clearly define the community it is concerned with.
Drawing a sample from a ‘community’ then also becomes problematic.
As previously explained, asset and network models of community devel-
opment place high value on relationships. The snowball sample technique
is in itself a useful way to gain an understanding of the relationships between people who are involved with the project, and their communica-
tion networks in the neighbourhood. The networks that are ‘revealed’ via
the diagrams provide information about a new network being created
within the neighbourhood. This is useful for understanding the ‘assets’
50 Gretchen Ennis and Deborah West
a t T h e A u s t r a l i a n N a t i on a l Uni v e r s i t y onM a y2 6 ,2 0 1 3
h t t p : / / c d j . oxf or d j o ur n a l s . or g /
D o wnl o a d e d f r om
7/27/2019 Community Dev J 2013 Ennis 40 57
http://slidepdf.com/reader/full/community-dev-j-2013-ennis-40-57 12/18
LNC can currently, and potentially, access, and we are able to see the ‘reach’
of the LNC into the neighbourhood via direct relationships.
Using network diagrams to focus practice
Almost all community development literature emphasizes the importance
of linking up, and building networks. Similarly with this project, there
was an emphasis on locating, acknowledging and joining up the various
people, programmes and organizations operating within, or providing ser-
vices to, Ludmilla. A network focus, including the use of the network dia-
grams, assisted in being more strategic in the networking activities.
Network analysis has been proposed as a useful resource for practice and
research by a range of social work and community development authors
since the 1980s (for example, McIntyre, 1986; Seed, 1990; Folgheratier,2004; Gilchrist, 2004; Hardcastle, Powers and Wenocur, 2004; Kirke, 2009;
O’Connor et al., 2006). Yet, there has been little research aimed at exploring
its use in community practice. For LNC, social network diagrams
helped to provide a sense of strategy to the ‘linking up’ aspect of the
community work.
Network diagrams were used twice in practice with LNC members. This
was because network diagrams were only generated twice (before and after
the project). At the outset, the diagrams helped LNC to explore and thinkabout the network we were working with. The initial pre-project social
network diagrams contributed to the LNC’s ‘network thinking’, through
a visual representation of who was involved and linked to the LNC
network. This provided an opportunity to think-through who was and
was not in the network and how people within it were linked. The pre-
project diagrams showed that while participants from Bagot Community
were connected to each other, there were no connections to others in
Ludmilla. This suggested a lack of bridging connections in social capital
terms. LNC members were able to consider the causes of the networkstructure, the implications and what might be done about it.
The facilitator encouraged LNC participants to consider new connections
as opportunities for dialogue and activity. Attempting to get people into the
same space and perhaps fostering some understanding about each other
was a basic goal of many of the activities. New connections forged
through organizing and/or attending various activities enabled partici-
pants to share knowledge and culture.
When the post-project diagrams were first drafted, they were discussedwith LNC members at various formal and informal meetings. A community
presentation of all the results of this case study, including network
diagrams, was also given in March 2011. The comparisons between the
pre- and post-project diagrams provided people with clear evidence of
Social network analysis in community development practice and research 51
a t T h e A u s t r a l i a n N a t i on a l Uni v e r s i t y onM a y2 6 ,2 0 1 3
h t t p : / / c d j . oxf or d j o ur n a l s . or g /
D o wnl o a d e d f r om
7/27/2019 Community Dev J 2013 Ennis 40 57
http://slidepdf.com/reader/full/community-dev-j-2013-ennis-40-57 13/18
the formation of a more connected and growing LNC network. This infor-
mation, combined with other (qualitative) data, was a great way to visualize
and understand some of the impacts of the project on individuals and on
the network structure.
Through integrating the use of network diagrams into the community
work, we were able to take network approaches to community develop-
ment a little further by using network analysis as a tool for practice. The
network ideas linked nicely to the strengths approach in terms of focusing
on what the community has rather than what the community needs (Kretzmann
and McKnight, 1993) and the network diagrams provided a focus for
linking up those identified assets (including people and their culture).
The social network diagrams and analysis were very useful in terms of
better understanding the need for bridging ties, and being able tomeasure the development of these.
Using social network diagrams to facilitate critical thinking
One of the key criticisms of asset and network approaches to community
development is their lack of useful frameworks for working with difference
or oppression in communities (Healy, 2005, 2006; Curtis, 2010). This
criticism has real relevance to the project discussed here. While the
project facilitator respected diversity and difference, some participantsdid not. Very different political and philosophical views were expressed
by participants – some were blatantly racist and aimed at assimilating all
cultures into the dominant (‘white Australian’) one. These views reflected
broader issues in Darwin, Australia, specifically around colonization and
(perhaps unconscious) attempts to ‘homogenize’ the community in order
to make it more cohesive.
The social network diagrams opened up discussion and were used to en-
courage critical reflection upon difference, and how processes of coloniza-
tion might be impacting our local-level relationships. Projects with goalsof community cohesion can sometimes focus upon ‘sameness’ and suppress
differences, while asserting ‘the need for unity based on the integration of
different cultures and experiences within society’ (Gilchrist, 2004, p. 53).
This may serve to enforce the norms of one (more dominant) group on
the other groups, resulting in new connections simply reproducing the so-
cially unjust aspects of society that already exist. Australia has a troubled
history of government policies aimed at the assimilation of Aboriginal
people into mainstream society, and the LNC project had to be very waryof potentially colonizing practices.
In this research, we found that building cross-cultural group contact can
be considered a strategy for addressing deep-seated racisms at a local rela-
tionship level. Through the construction of social bridges, and simply
52 Gretchen Ennis and Deborah West
a t T h e A u s t r a l i a n N a t i on a l Uni v e r s i t y onM a y2 6 ,2 0 1 3
h t t p : / / c d j . oxf or d j o ur n a l s . or g /
D o wnl o a d e d f r om
7/27/2019 Community Dev J 2013 Ennis 40 57
http://slidepdf.com/reader/full/community-dev-j-2013-ennis-40-57 14/18
attempting to ‘get people into the same space’ (either physically or psycho-
logically), the LNC could open up the beginnings of a dialogue aimed at
understanding rather than influencing. This required specific facilitation
skills (such as mediation, and community education) to assist in addressing
some existing power imbalances. In many ways, this was the most challen-
ging aspect of the project. However, through using a range of ‘linking up’
tools that also sought to promote diverse views and understandings of dif-
ferent groups in the area (such as a neighbourhood newsletter and a neigh-
bourhood DVD), LNC was able to start the fragile process of creating
a new, more empowering narrative about the different cultures in the
neighbourhood.
Using network analysis to understand project outcomesIn terms of measuring the outcomes of the project in line with its aims to
increase social connections across diverse cultural groups, the network ana-
lysis showed that, on average, connections have been increased.
Social network analysis also provided a method for understanding the
cohesiveness in the LNC network. While there were slight increases in
the cohesiveness of the LNC network over the nineteen-month time
frame, none of the networks are particularly cohesive. This is not surpris-
ing, however; as other literature has demonstrated, communities withdiverse groups of people who have little in common with one another are
rarely highly cohesive (Cheong, 2006; Jaffe, 2006; Letki, 2008). What is im-
portant is that new links have been formed between diverse groups, and
these open up opportunities for information and other resources to flow
between groups where none previously existed.
Social network analysis was useful in demonstrating structural change in
the LNC network over the nineteen months of the project. Compared with
other qualitative methods (that were used in the broader case study), the
network analysis provided a more ‘zoomed out’ view that allows the re-searcher to step back and consider how relationship changes translate
into structures.
Such analysis provides a different kind of understanding about commu-
nity work outcomes. Knowing what participants think about a programme
is important, but network analysis allows the exploration of changing com-
munity structures. We believe that this adds both depth and focus to other
evaluative methods.
Social network analysis is not so much interested in aggregates of actorattributes, but in the relationships between actors. The focus is not on indi-
viduals, but on relationships. The social network analysis has provided a
measure of the relationships in the network prior to, and after, the project.
Such an analysis can shed light on how the relationships between people
Social network analysis in community development practice and research 53
a t T h e A u s t r a l i a n N a t i on a l Uni v e r s i t y onM a y2 6 ,2 0 1 3
h t t p : / / c d j . oxf or d j o ur n a l s . or g /
D o wnl o a d e d f r om
7/27/2019 Community Dev J 2013 Ennis 40 57
http://slidepdf.com/reader/full/community-dev-j-2013-ennis-40-57 15/18
in the LNC networks reflect and/or reproduce wider social structures. The
new connections between Aboriginal and non-Aboriginal people in the
LNC can be viewed as a positive change, facilitating dialogue and
opening up new opportunities and resources in terms of cross-cultural
understanding for all those involved. These new connections can also be
viewed as a disruption to the disempowering history of separation
between Aboriginal and non-Aboriginal people in the broader suburb
traditionally.
The limitations of social network analysis in community development
Social connections are not always positive, they can serve to oppress and
reproduce dominant and unjust ideologies and systems (Bourdieu, 1986;
Portes and Landolt, 1996; Wilson, 2005). As others have discussed, socialnetwork analysis cannot provide an understanding of culture, or human
agency (Wellman, 1983; Emirbayer and Goodwin, 1994), and their influence
upon communities. We too believe that important understandings about the
meaning of community networks, and the dynamics of power, culture and
history operating within them, must come from combining social network
analysis with more qualitative methods.
As discussed previously, this network analysis was only one of multiple
methodologies embedded with a case study framework used to exploreand understand the processes and impacts of the LNC project. What we
hope to have demonstrated is that network analysis enables us to do some-
thing that other methods cannot, that is, to capture snapshots of social struc-
tures. These snapshots allow us to consider what exists in terms of the links
and ties between people in a given network at a particular point in time,
and to subsequently understand changes over time. Network analysis can
assist in exploring the way we create and are created by social structures.
Conclusion
Undertaking social network mapping can provide useful information about
community network structure which communities can ‘work with’. Evalu-
ation of community projects can be more comprehensive and meaningful if
changes are understood in a range of ways. We have argued that changes in
community relationships and structure can be measured meaningfully and
effectively using social network analysis.
In summary, the integration of social network analysis into the commu-nity development project overviewed here assisted in understanding the
community we were working with and in helping to focus and inform
aims and practice of this project. The integration of social network analysis,
as a tool for assisting network thinking, provided a strong link between
54 Gretchen Ennis and Deborah West
a t T h e A u s t r a l i a n N a t i on a l Uni v e r s i t y onM a y2 6 ,2 0 1 3
h t t p : / / c d j . oxf or d j o ur n a l s . or g /
D o wnl o a d e d f r om
7/27/2019 Community Dev J 2013 Ennis 40 57
http://slidepdf.com/reader/full/community-dev-j-2013-ennis-40-57 16/18
practice and research so that workers and community members could
better understand the impacts of their efforts.
Funding
The research was carried out as part of a PhD program undertaken by
Gretchen Ennis at Charles Darwin University. Gretchen received an Aus-
tralian Postgraduate Award (Australian Government, Department of Indus-
try, Innovation, Science, Research and Tertiary Education) Scholarship to
assist her in undertaking her PhD studies.
Gretchen Ennis is a Lecturer, Social Work and Community Studies Theme, School of Health,
Faculty of Engineering, Health, Science and the Environment, Charles Darwin University,
Northern Territory 0909, Australia.
Deborah West is an Associate Professor, Director of Education and Training Development,
Office of Learning, Teaching and Community Engagement, Charles Darwin University,
Northern Territory 0909, Australia.
References
Australian Bureau of Statistics (2007) Basic community profile: Ludmilla (SLA
705051054). Census Community Profile Series, Canberra, Commonwealth of
Australia, accessed at: http://www.censusdata.abs.gov.au (8 December 2008).
Bourdieu, P. (1977) Cultural reproduction and social reproduction, in J. Karabel and
A. Halsey, eds, Power and Ideology in Education, Greenwood Press, New York, NY,
pp. 487–510.
Bourdieu, P. (1986) The forms of capital, in J. Richardson, ed., Handbook of Theory and
Research for the Sociology of Education, Greenwood Press, New York, pp. 241–258.Cheong, P. H. (2006) Communication context, social cohesion and social capital
building among Hispanic immigrant families. Community Work & Family, 9 (3),
367–387.
Curtis, A. (2010) Book review. The well-connected community, Community Development
Journal, (1– 3), 45 (4), 521–523.
de Nooy, W., Mrvar, A. and Bategelj, V. (2005) Exploratory Social Network Analysis with
Pajek: Structural Analysis in the Social Sciences, Cambridge University Press,
New York, NY.
Emirbayer, M. and Goodwin, J. (1994) Network analysis, culture, and the problem of agency, American Journal of Sociology, 99 (6), 1411–1454.
Ennis, G. (2011) Neighbourhood networking: a critical social work approach to
‘creating community’ in a culturally diverse setting, PhD thesis, Charles Darwin
University, Darwin.
Social network analysis in community development practice and research 55
a t T h e A u s t r a l i a n N a t i on a l Uni v e r s i t y onM a y2 6 ,2 0 1 3
h t t p : / / c d j . oxf or d j o ur n a l s . or g /
D o wnl o a d e d f r om
7/27/2019 Community Dev J 2013 Ennis 40 57
http://slidepdf.com/reader/full/community-dev-j-2013-ennis-40-57 17/18
Ennis, G. and West, D. (2010) Exploring the potential of social network analysis in
asset-based community development practice and research, Australian Social Work,
63 (4), 404–417.
Folgheratier, F. (2004) Relational Social Work: Toward Network and Societal Practices, Jessica
Kingsley Publications, London.
Giddens, A. (1984) The Constitution of Society: Outline of the Theory of Structuration, Polity
Press, Cambridge.
Gilchrist, A. (2000) The well-connected community: networking to the ‘edge of chaos’,
Community Development Journal, 35 (3), 264–275.
Gilchrist, A. (2004) The Well-Connected Community: A Networking Approach To
Community Development, Policy Press, Bristol.
Gilchrist, A. (2009) The Well-Connected Community: A Networking Approach to Community
Development, 2nd edn, Policy Press, Bristol.
Gilchrist, A., Bowles, M. and Wetherell, M. (2010) Identities and Social Action: ConnectingCommunities for a Change, Economic and Social Research Foundation: Indentities and
Social Action Programme, London.
Hardcastle, D. A., Powers, P. R. and Wenocur, S. (2004) Community Practice: Theories and
Skills for Social Workers, Oxford University Press, New York, NY.
Healy, K. (2005) The Strengths Perspective Social Work Theories in Context: Creating
Frameworks for Practice, Palgrave, Basingstoke, UK, pp. 151–171.
Healy, K. (2006) Asset-based community development: recognising and building on
community strengths, in A. O’Hara and Z. Weber, eds, Skills for Human Service
Practice: Working with Individuals, Groups and Communities, Oxford University Press,South Melbourne, Vic, pp. 247–266.
Healy, K. and Hampshire, A. (2002) Social capital: a useful concept for social work?
Australian Social Work, 55 (3), 227–239.
Jaffe, J. (2006) Social cohesion, neoliberalism, and the entrepreneurial community in
rural Saskatchewan. American Behavioural Scientist, 50 (2), 206–225.
Kirke, D. M. (2009) Social network analysis, in M. Gray and S. A. Webb, eds, Social Work
Theories and Methods, Sage, London, pp. 131–141.
Kretzmann, J. P. and McKnight, J. L. (1993) Building Communities from the Inside Out: A
Path toward Finding and Mobilizing A Community’s Assets, ABCD Institute,Evanston, IL.
Letki, N. (2008) Does diversity erode social cohesion? Social capital and race in British
neighbourhoods. Political Studies, 56 (1), 99–126.
Lynn, M. (2006) Discourses of community: challenges for social work. International
Journal of Social Welfare, 15 (2), 110– 120.
McCashen, W. (2005) The Strengths Approach: A Strengths-based Resource for Sharing
Power and Creating Change, St Lukes Innovative Resources, Bendigo, Australia.
McIntyre, E. L. G. (1986) Social networks: potential for practice, Social Work, 31
(Nov.-Dec.), 421–427.O’Connor, I., Hughes, M., Turney, D. et al. (2006) Social Work and Social Care Practice,
Sage, London.
Portes, A. and Landolt, P. (1996) The downside of social capital. The American Prospect,
26, 18– 21.
56 Gretchen Ennis and Deborah West
a t T h e A u s t r a l i a n N a t i on a l Uni v e r s i t y onM a y2 6 ,2 0 1 3
h t t p : / / c d j . oxf or d j o ur n a l s . or g /
D o wnl o a d e d f r om
7/27/2019 Community Dev J 2013 Ennis 40 57
http://slidepdf.com/reader/full/community-dev-j-2013-ennis-40-57 18/18
Putnam, R. (2000) Bowling Alone: The Collapse and Revival of Civic America, Simon and
Schuster, New York, NY.
Seed, P. (1990) Introducing Network Analysis in Social Work, Jessica Kingsley Publishers,
London.
Trevillion, S. (1992) Caring in the Community: A Networking Approach to Community
Partnership, Longman Group UK Ltd, Essex.
Trevillion, S. (1999) Networking and Community Partnerships, 2nd edn, Ashgate,
Aldershot, UK.
Wasserman, S. and Faust, K. (1994) Social Network Analysis: Methods and Applications,
Cambridge University Press, New York, NY.
Wellman, B. (1983) Network analysis: some basic principals, in R. Collins, ed.,
Sociological Theory, Jossey-Bass, San Francisco, pp. 155–199.
Wilson, L. (2005) ‘Social exclusion and social capital in Northern Adelaide: the role of
social networks in reproducing social inequity’, paper presented at the SocialChange in the 21st Century Conference, Queensland University of Technology,
Carseldine, Qld, 28 October 2005, Queensland University of Technology (QUT),
Queensland, Australia.
Young, I. (1990) Justice and the Politics of Difference, Princeton University Press,
Princeton, NJ.
Social network analysis in community development practice and research 57
a t T h e A u s t r a l i a n N a t i on a l Uni v e r s i t y onM a y2 6 ,2 0 1 3
h t t p : / / c d j . oxf or d j o ur n a l s . or g /
D o wnl o a d e d f r om