Embed Size (px)
Citation preview

COMMUNITY DETERMINANTS OF IMMIGRANT SELF-EMPLOYMENT: HUMAN CAPITAL SPILLOVERS AND ETHNIC ENCLAVES
by
Liliana Sousa* U.S. Census Bureau
CES 13-21 April, 2013
The research program of the Center for Economic Studies (CES) produces a wide range of economic analyses to improve the statistical programs of the U.S. Census Bureau. Many of these analyses take the form of CES research papers. The papers have not undergone the review accorded Census Bureau publications and no endorsement should be inferred. Any opinions and conclusions expressed herein are those of the author(s) and do not necessarily represent the views of the U.S. Census Bureau. All results have been reviewed to ensure that no confidential information is disclosed. Republication in whole or part must be cleared with the authors. To obtain information about the series, see www.census.gov/ces or contact Fariha Kamal, Editor, Discussion Papers, U.S. Census Bureau, Center for Economic Studies 2K132B, 4600 Silver Hill Road, Washington, DC 20233, [email protected].

Abstract
I find evidence that human capital spillovers have positive effects on the proclivity of low human capital immigrants to self-employ. Human capital spillovers within an ethnic community can increase the self-employment propensity of its members by decreasing the costs associated with starting and running a business (especially, transaction costs and information costs). Immigrants who do not speak English and those with little formal education are more likely to be self-employed if they reside in an ethnic community boasting higher human capital. On the other hand, the educational attainment of co-ethnics does not appear to affect the self-employment choices of immigrants with a post-secondary education to become self-employed. Further analysis suggests that immigrants in communities with more human capital choose industries that are more capital-intensive. Overall, the results suggest that the communities in which immigrants reside influences their self-employment decisions. For low-skilled immigrants who face high costs to learning English and/or acquiring more education, these human capital spillovers may serve as an alternative resource of information and labor mobility. i
i *Any opinions and conclusions expressed herein are those of the author and do not necessarily represent the views of the U.S. Census Bureau. The research in this paper does not use any confidential Census Bureau information. Many thanks are due to John Abowd, Francine Blau, Larry Kahn, Kevin McKinney, Kristin Sandusky, participants at SOLE/EALS and PAA conferences, and participants in seminars at the U.S. Census Bureau, Cornell University, and Vassar College.
3
Self-employment may play an important role in the economic assimilation of some immigrants
by providing an income stream outside of the formal wage/salary market. This outside option is
especially important for immigrants who face barriers to entry in the formal labor market due to
foreign education1 or weak English skills. Though it is an inherently riskier occupational choice
defined by more uncertainty over future income, self-employment has been found to result in
steeper earnings growth relative to wage/salary employment for immigrants (Lofstrom 2002,
2009). Rates of self-employment, however, vary dramatically between different immigrant
groups. While less than 8% of the Mexican-born in the U.S. are self-employed, nearly a quarter
of the Korean-born are self-employed. Clearly, differences in individual human capital levels
among immigrants from different countries of origin provide some explanation for the divergent
self-employment rates. However, there are also dramatic differences in self-employment rates of
communities from the same country of birth. This research exploits these variations in local
ethnic self-employment rates to show that another factor in the self-employment decision of
immigrants is the aggregate levels of human capital within immigrant communities. I find
evidence that human capital spillover effects, specifically education and English skills, may
encourage and facilitate self-employment of community members with low levels of human
capital.
Several studies have found positive enclave effects on self-employment among Hispanic
immigrants (Borjas 1986; Lofstrom 2002; Toussaint-Comeau 2008) and among African-
Americans (Borjas and Bronars 1989). These enclave effects are empirically estimated using the
size of the ethnic community in which an individual resides. The argument is that the ethnic
community can serve both as a consumer of a co-ethnic’s goods and as a source of inputs into the
1 Friedberg (2000) finds that foreign schooling is valued less by the labor market than similar domestic schooling.
4
production of these goods. Borjas (1986) finds that the enclave effect is much stronger for
foreign-born Hispanics than their U.S.-born counterparts, implying a stronger relationship
between immigrant small business owners and their ethnic communities. This result is not
universal, however. For example, Clark and Drinkwater (2002) find that self-employment falls
with ethnic concentration in England and Wales. They also find that, while the educational
attainment of a group affects other employment outcomes, it does not affect self-employment.
Yuengert (1995), on the other hand, finds no evidence that self-employment rates are higher in
U.S. cities with large immigrant populations.
Borjas (1992) argues that the production of human capital can be influenced not just by
individual heterogeneity and family human capital, but also by externalities from the human
capital of the ethnic group. He refers to this externality as “ethnic capital.” He finds that the
average educational level of an individual’s ethnic group in the father's generation affects the
individual’s educational attainment. Toussaint-Comeau (2008) combines this notion of ethnic
capital with the neighborhood effects methodology in Bertrand, Luttmer and Mullainathan
(2000) to measure the impact of ethnic networks on self-employment. She creates an ethnic
network measure by combining the size and concentration of the ethnic community with the
“entrepreneurial ethnic capital” of the immigrant group. Entrepreneurial ethnic capital is
calculated as the percent of the adult ethnic population that is self-employed in the country. As in
Borjas (1992), this measure reflects an individual’s access to self-employment ethnic capital;
members of groups with greater numbers of self-employed have access to more self-employment
information and business connections, possibly influencing their occupational choice or success
in entrepreneurship. Multiplying this entrepreneurial ethnic capital measure by the availability of
contacts, in the spirit of Bertrand, Luttmer and Mullainathan (2000), results in a measure of the
5
availability of entrepreneurial information in one’s local ethnic network. Toussaint-Comeau
finds a positive effect on self-employment, suggesting that effective ethnic capital transmitted
via ethnic networks facilitates self-employment for some groups. She further interacts this ethnic
network variable with the individual’s education and language skills and finds that immigrants
with a high school diploma or lower education benefit from having access to more self-employed
co-ethnics while those with higher education do not.
In this paper, I build on this previous literature by considering how human capital spillovers
within local ethnic communities can impact individual self-employment decisions. While the
papers cited above focused on the size of the ethnic community or on the overall entrepreneurial
ethnic capital available via ethnic networks, I consider whether local ethnic human capital,
measured in English-skills and education, affects the self-employment decisions of members of
the community. Specifically, I address the following two questions: Are immigrants with low
English-skills more likely to become self-employed when residing near co-ethnics who speak
English? And, are immigrants with little formal schooling more likely to become self-employed
if they have access to highly educated co-ethnics?
Human capital spillovers might influence an individual’s decision to become self-employed by
lowering transaction costs, lowering capital or information costs, and by influencing the quality
of one’s job referral networks. Transaction costs incurred by the self-employed include
interactions with suppliers, property owners, regulators, customers, and, in larger enterprises,
employees. As demonstrated by Lazear (1999), the ability to interact with co-ethnics in these
different roles can decrease transaction costs through shared language and culture. Transaction
costs are influenced by both the size of the local community (more trade partners implies more
possibility for trade) and the quality of the local community (more co-ethnics with business

6
connections can decrease costs, for example). An ethnic community can also serve as a source of
informal lending, an especially important consideration for credit-constrained immigrants
starting small enterprises.2 Being able to tap into co-ethnic channels may result in lower
borrowing costs, or increased borrowing opportunities.
Co-ethnics with strong labor market attachment can serve as conduits for local market and
industry-specific information – better information, in turn, can decrease costs faced by small
businesses. On the other hand, better work referral networks can provide better wage
opportunities, thus increasing the opportunity costs of becoming self-employed. One last
important role that the local ethnic community can play is as a market for ethnic goods. Since co-
ethnics have a comparative advantage in providing ethnic goods, the existence of an ethnic
market for such goods results in expanded business opportunities. This is, in essence, the enclave
effects found by Borjas and others as cited above.
In order to test these theories, I consider the effect of the community’s educational attainment, a
measure of human capital and a good proxy for financial capital stocks, and the effect of
language skills on the self-employment propensities of immigrants with different levels of
schooling and English-skills. Previous research has consistently found that one’s English
language skills and formal schooling are important in predicting self-employment (Borjas 1986,
Borjas and Bronars 1989, Evans and Leighton 1989). I now consider how these two types of
human capital at the community-level interact with an individual’s own human capital to impact
self-employment. I find that immigrants with lower levels of human capital are more sensitive to
human capital spillover than immigrants with higher levels of human capital. I also find that,
2 Bohn and Pearlman (2009) find lower rates of formal banking in areas with higher concentrations of co-ethnics
while Bates (1998) documents Chinese and Korean immigrant entrepreneurship’s reliance on informal lending and
on ethnic credit associations in addition to financial institutions.

7
with the exception of college educated immigrants, immigrants are more likely to be self-
employed if they reside in communities with higher educational attainment. Similarly, among
Spanish-speaking immigrants, individuals opt into self-employment at greater rates if more of
their co-ethnics speak English.
Speaking the host country language yields higher returns in the labor market (Chiswick and
Miller 1995; Carliner 2000). However, learning a new language can present formidable costs,
particularly for individuals who immigrate as adults and for those with little schooling.3
Similarly, acquiring more education as an adult can also be prohibitively expensive – often
requiring at least a partial exit from the labor force in addition to financial expenditures. The
human capital spillover effects identified in this paper may present an alternative strategy for
reaping the rewards of more education and better language skills for immigrants who face high
costs of acquiring these skills for themselves.
Theoretical Framework
The decision to become self-employed is a choice between an unpredictable income stream via
self-employment and a relatively predictable income stream through wage employment. Building
on fundamental models of self-employment (de Wit 1993), this decision boils down to an
essential comparison between the utility derived from self-employment and the utility derived
from labor employment:4
3 Cognitive research has shown that languages are learned more easily by children than by adults (for example,
Johnson and Newport 1989). Rosenzweig (1995) finds that an increase in schooling results in an increased ability to
absorb new knowledge and learn new skills. 4 We abstract from other factors that affect the utility of self-employment and wage employment, particularly the
utility from “being your boss” and the disutility associated with increased uncertainty. We can think of these
individual preferences as being randomly distributed within immigrant groups, such that the distributions may vary
between different groups. This is seen in cultural preferences for self-employment, for example.

8
(I)
Specifically, an individual chooses to pursue self-employment if his or her expected utility from
self-employment, a function of the business’s profits, , is greater than the expected
utility of future wage earnings, , the opportunity cost of being self-employed. It implies three
fundamental ways in which individual s self-employment likelihood can increase: 1) higher
revenue, 2) lower costs, and 3) lower opportunity cost. This basic framework provides a starting
point from which to illustrate the role that social networks/ethnic enclaves may play in the
decision to become self-employed.
1. Ethnic Demand
An increase in revenue, , must result from an increase in (higher prices), an increase in
(more units sold), or a combination of the two. By generating a protected market for goods and
services provided by co-ethnics, an ethnic enclave can lead to both higher prices and higher
demand. This protected market arises when the consumer has a preference for the good/service
being provided based on the producer’s ethnicity, the preference for a co-ethnic doctor, for
example (Borjas and Bronars 1989).
This demand effect is partly a function of the size of the community; this is the enclave effect
found by Borjas and others, as cited above. All else equal, a larger ethnic community can support
more ethnic businesses. It is also a function of the cultural distance, differences in language,
preferences, and tastes, between the community and other local residents. Communities where
fewer members speak English are more socially isolated than communities with more English
speakers. Hence, lower rates of English-speaking ability would imply greater demand for ethnic
goods and services. On the other hand, to the extent that linguistic isolation is associated with

9
low-income workers, this type of protected market may generate limited demand for ethnic
goods and services due to lower disposable income.
2. Production Costs
Immigrant-specific obstacles such as linguistic and cultural barriers, poor information regarding
local regulations or preferences, limited financial knowledge/access, and a limited credit history
result in immigrants facing higher self-employment costs than similar natives (Bowles and
Colton 2007). An ethnic community can increase the likelihood of self-employment by lowering
production costs. Ethnic communities can promote informal business arrangements and lending
resulting in lower search and information costs (Bond and Townsend 1996). Additionally,
effective ethnic capital having access to self-employment experience or industry-specific
knowledge, results in lower information costs (Borjas 1998; Toussaint-Comeau 2008). This
exposure to information or financing is greater in the community populated with individuals with
higher levels of education and who speak English. On the other hand, residing in a low human
capital co-ethnic community might imply access to a low-wage labor pool with low transaction
costs due to common language/culture (in the spirit of Lazear 1999). This too would decrease
production costs. Note that, unlike the enclave effects on expected revenue, the enclave effects
on expected costs are primarily driven by quality of co-ethnics (as measured by human capital
and capital stocks) not quantity.
3. Opportunity Costs
Forgone wages are the opportunity cost incurred by the self-employed. Evans and Leighton
(1989), for example, find that men with poor employment outcomes are more likely to become
self-employed since they face lower opportunity costs when leaving the formal labor market. If

10
an enclave or locality can provide members of a certain group with relatively high wage
opportunities, either via well-established job referral networks or the existence of successful
ethnic-owned businesses, then we can expect less new self-employment in this group.5
Furthermore, the impact of community human capital on an individual will vary by one’s own
level of human capital. For example, an immigrant who speaks English but is part of a
community with low levels of English skills has an advantage in providing goods and services to
his linguistically isolated community - both relative to non-English speakers within the ethnic
community and to English speakers outside of the community. He might also have access to a
low-wage labor pool by hiring co-ethnics who do not speak English, without incurring additional
transaction and management costs. Similarly, an individual with higher education may have an
advantage in accessing information regarding the local economy or industries. Immigrants with
little formal schooling, facing higher costs to procuring information, will benefit more than
educated immigrants from having access to these individuals. On the other hand, educated
professionals residing in ethnic communities with low educational attainment might be able to
profit by providing ethnic goods and services demanded by their co-ethnics (for example, a
lawyer with roots in the ethnic community).
Empirical Model
The primary hypothesis is that aggregate human capital within an immigrant community can
have a direct impact on an individual’s propensity to become self-employed, with this effect
being dependent on the individual’s own level of human capital. For notational simplicity,
5 Beaman (2007), for example, finds evidence that the social networks of refugees in the U.S. impact the wage draws
of their members; communities with longer tenure result in higher wage draws for new members than those with
shorter tenure.

11
suppose individuals are of types, where represents country of birth. Let
represent the city (MSA) in the U.S. in which the individual resides. A pair
is an ethnic community composed of individuals born in country and residing in city . An
important and reasonable assumption that runs through both this research and other work done in
this field is that immigrants from the same country residing in the same metropolitan area in the
U.S. are more likely to have social ties to local co-ethnics than to the rest of the local population.
Suppose the effect of community-level human capital on an individual’s propensity to self-
employ is captured by a reduced-form regression, equation (II), where is a 0/1 indicator of
self-employment and is a type of human capital, either education or English-language skills. I
include the individual’s level of human capital as and the community’s level, measured as the
percentage of the local adult co-ethnic population that reported having graduated from high
school or having strong English-language skills, as .6 Since community-level human capital
may have differential effects on an individual based on his own level of human capital, I include
an interaction term, . is a vector of observable characteristics that have been shown to
be correlated with self-employment: age, age squared, years since migration, years since
migration squared, race, Hispanic ethnicity, the presence of a spouse in the household, American
naturalization status, and either own educational attainment or own English-language skills.7
(II)
6 Community-level measures were calculated using data from all adults in the country of birth MSA group, though
the regressions are run only on a male subsample. 7 Regressions are limited to male immigrants since they have more homogeneous employment patterns across
country of birth groups than female immigrants.
12
where the parameters of interest are , and .8
Controlling for Self-selection
Selection into immigration is origin-country specific: Borjas (1987) finds significant variation in
skill-distribution among immigrant groups resulting from the income differentials between skill
groups within the source and destination countries and the cost of immigration. Though the
drastic differences in self-employment rates of immigrants by country of birth may, in part,
reflect cultural differences in taste for self-employment or entrepreneurship (Light 1979), it may
also reflect the endogeneity of the migration decision. Specifically, country of birth (as observed
among U.S. self-employed immigrants) may be endogeneous if individuals who wish to become
self-employed choose to emigrate to the U.S. at varying rates based on the source country’s
characteristics.
To address this potential endogeneity most literature in this field includes a set of region of birth
control dummy variables (for example, Borjas 1986; Lofstrom 2002). The underlying
assumption is that there is enough similarity between different countries of birth within each
region to account for differences in selection into migration. This assumption, however, is
questionable, with neighboring countries providing very different immigration streams: for
example, in spite of geographical proximity, 35% of Vietnamese immigrants have not completed
high school, whereas only 11% of immigrants from the Philippines fall into this group. However,
including country-specific dummy variables is problematic since the large number of source
countries quickly eats up degrees of freedom, generating unreliable test statistics.
8 Due to the interaction design of the logit regressions, marginal effects are not easily interpreted (Norton, Wange
and Ai 2004). Instead, I report the logit coefficients and then present graphed predicted probabilities of self-
employment for each specification.

13
Instead of using a set of region of birth dummy variables as is customary in the literature, I
include , the average self-employment rate of a country of birth group in the United States, as a
control variable in the basic regression model. This is the realized self-employment rate among
those who were born in country j and chose to immigrate to the United States. By using the
immigrant-specific self-employment rate rather than the country of birth self-employment rate, I
am implicitly controlling for the selection mechanisms that generated this immigrant stream.
That is, since immigrants are not drawn randomly from their country of birth, I control not for
the average of the people who did not emigrate, but rather, the average of those who did
emigrate. To test this strategy, I also run the regressions with a full set of country of birth dummy
variables and compare the coefficients between specifications.9
To address the potential selection of members of a country of birth group with high propensity
for self-employment into areas with high demand for self-employment, I control for local
demand for self-employment. This can be disaggregated into two different demands: the demand
for ethnic goods and services generated by the ethnic community, as discussed above, and the
demand in the local product and service markets. I control for ethnic demand by including two
measures of the ethnic community: , the relative size of the country of origin group in the
MSA, and , the median years since migration for the enclave members. The first of these
controls addresses the size of the local ethnic demand while the second addresses the expected
levels of assimilation and income within the community, assuming that assimilation of
preferences and income increases the longer a group resides in the source country.
For non-ethnic demand, I use an MSA self-employment index, . Certain industries, such as
9 The lack of degrees of freedom only affects the veracity of the test statistics.

14
manufacturing, require heavy capital investment resulting in high costs to entry. Other industries
require relatively little capital investment, making them more attractive to small business owners.
In the spirit of Berman, Bound and Griliches (1994), who use a similar index to look at skill
distributions within manufacturing, I create an MSA-index of demand for self-employment by
multiplying the overall U.S. self-employment rates in each industry by the percent of the local
labor force in MSA employed within each industry. This MSA-level index allows for a
comparison of local labor market demand for self-employment, taking the distribution of
employment within local industries as exogenous.10
As a result of these sources of self-selection, four aggregate controls are included in every
regression:
1. (the percent of country of birth (COB) group in the U.S. that is self-employed),
2. (MSA ’s self-employment demand index),
3. (the percent of the MSA population born in COB) and
4. (the median years since migration of the MSA population born in COB)
The final empirical specification can be written as
(III)
Suppose that a high human capital immigrant wishes to become self-employed, and hence
chooses to move to a city where the ethnic community has low levels of human capital in the
hopes of taping into the protected ethnic market. In this situation, the causality between and
would be reversed. To address this type of endogeneity, I rerun model (III) using an
10
Due to the tendency of different immigrant groups to cluster in particular industries, one might be concerned that
the high concentration of an immigrant group in a specific industry might impact the relative size of the labor force
in that industry. Indeed, some of the largest ethnic communities in the data, such as the Mexican-born in El Paso
and the Cuban-born in Miami, represent over 25% of their MSA populations. However, the 90th
percentile only
represents 3.46% of the MSA population. Thus, for the vast majority of communities, this index will not suffer from
country of birth endogeneity.
15
instrumental variable analysis, relying on a strategy similar to Bertrand, Luttmer and
Mullainathan (2000). Specifically, I use the U.S. level of human capital measure for group ,
, to instrument for .
Data
This paper uses data from the 2000 U.S. Census 5% Public Use Microdata Sample. The sample
of interest is restricted to foreign-born men between the ages of 25 and 65 who immigrated as
adults, are in the labor force and have not been in school for at least 2 months as of April 2000.
Limiting the sample to those who immigrated as adults minimizes sample composition issues
that may arise due to differences between child and adult immigrants, especially selection into
immigration and differences in U.S.-specific human capital. Some additional sample restrictions
were made limiting individuals to those who reside in a MSA with a significant co-ethnic
sampled population in both the 1990 and 2000 U.S. Censuses. Only immigrants belonging to an
ethnic community with more than 50 sampled adult men were included since the empirical
specification relies heavily on variables measured at the country of birth and MSA level. This
resulted in dropping about 20% of the sample.11
The resulting sample is made up of 233,000
men, representing 5.1 million individuals. Nearly 12% of these are self-employed. In line with
previous research (for example, Bartel 1989), Table 1 shows that these individuals are highly
clustered in traditional immigrant cities with half of the sample residing in only seven primary
metropolitan statistical areas.
Table 2 presents basic demographic information on the sample used in the analysis. The sample
represents about 600,000 self-employed immigrant men and 4.5 million who are in the labor
11
Detailed comparisons between the dropped and retained samples are available upon request.

16
force and not self-employed. On average, the self-employed are nearly 4 years older, far more
likely to be white, non-Hispanic or Asian men, and have lived in the U.S. for longer. As in
previous research (Borjas 1986; Le 1999; Georgarakos and Tatsiramos 2009), married men are
more likely to be self-employed by about 15 percentage points.
I identify self-employment using the self-reported class of worker variable, where individuals
report being self-employed in either an incorporated or not incorporated business. The reported
self-employment and labor earnings reflect the fact that many self-employed men supplement
their self-employment earnings with part-time or seasonal wage employment, and vice versa.
The average self-employed man in this sample reported total earnings of $42,000 in 1999 (from
both self-employment income and wages) while the average wage/salary employee reported
earnings of $31,400. Immigrant men who reported being self-employed also reported over
$21,200 in wage/salary earnings, almost the same as their average reported self-employment
earnings. Those who did not report being self-employed yet reported some income from self-
employment only reported an average of $300 in self-employment earnings.
Of particular interest to this research project is the educational attainment and language skills of
immigrants and their communities. Over a quarter of immigrant men in this sample have 8 years
or less of schooling. This group is considerably less likely to be self-employed. On the other
hand, men who completed high school are overrepresented among the self-employed. About
10% of the immigrants in this sample report speaking only English at home, though these are
primarily immigrants from English-speaking countries. Roughly 60% who reported speaking a
language other than English at home also reported speaking English well or very well. The
17
remaining 30% reported speaking English poorly or not at all.12
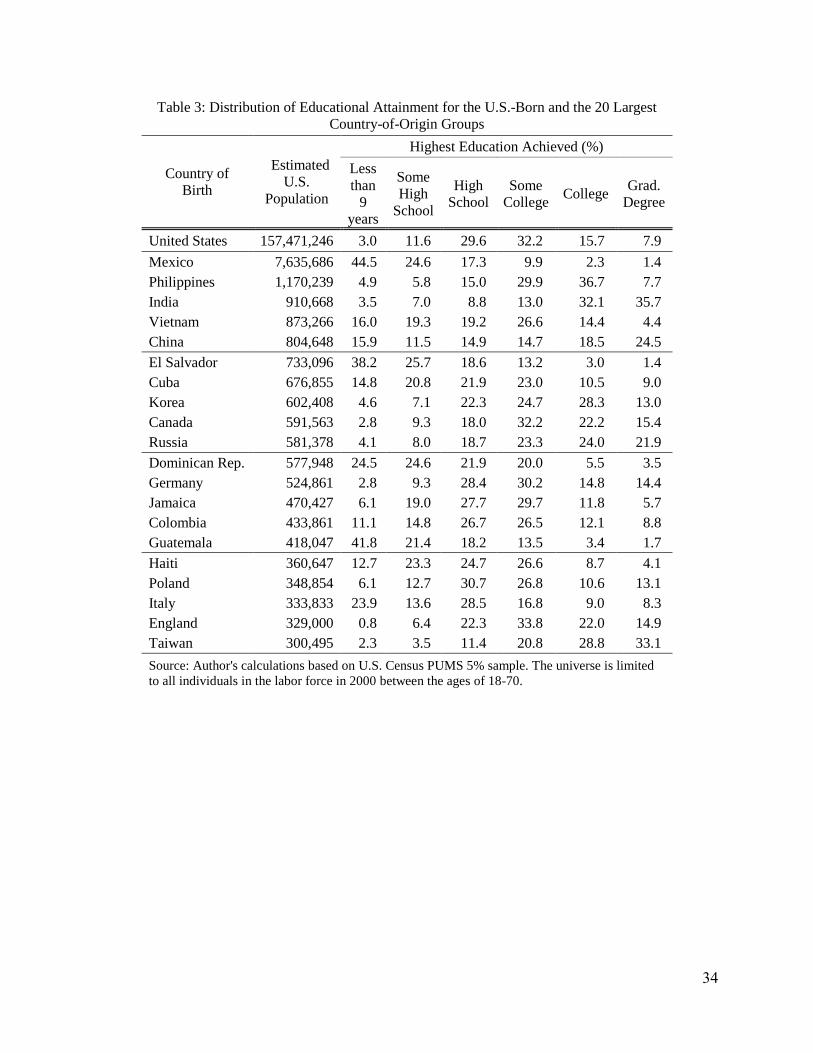
In terms of educational attainment, immigrants are bimodal: they are far more likely to have
either very low education or very high education when compared to the U.S. born population.
Table 3 shows the educational distribution of the twenty largest immigrant groups in the 2000
Census and the native-born population, clearly illustrating the dramatic differences in
educational attainment between country of birth groups in the United States. Nearly half of
Mexican immigrants and two out of every five immigrants from El Salvador and Guatemala had
8 years or less of formal schooling. At the other extreme, over 30% of Indian and Taiwanese
immigrants had an advanced degree.
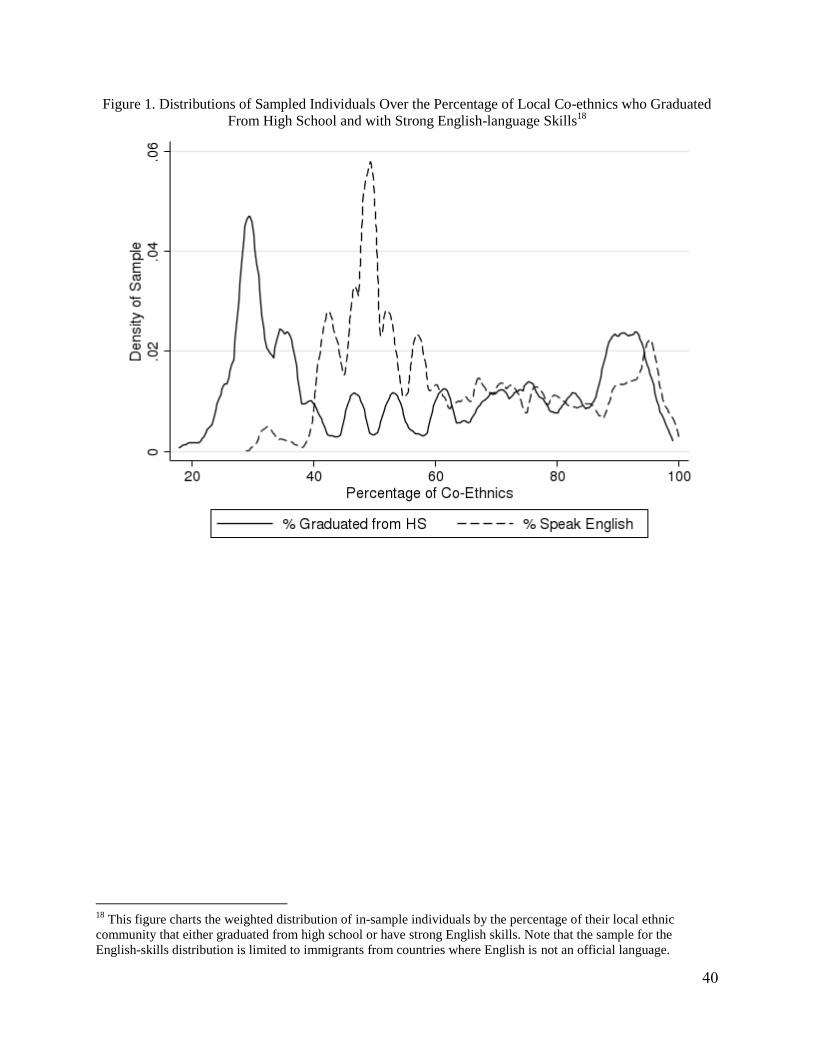
The empirical strategy relies on differences in self-employment rates and aggregate human
capital levels between communities of immigrants from the same country of birth. Figure 1
displays the distribution of sampled individuals by the proportion of their co-ethnic community
that either graduated from high school or reports strong English skills. In line with the results
shown in Table 3, the distribution of individuals by the proportion of their co-ethnics who
graduated from high school is obviously bimodal, peaking around 30% and around 90%. To
some extent, the distribution along the English-skills dimension is also bimodal, with a peak at
50% and another in the high 90% range. Table 4 illustrates the extent to which self-employment
rates vary by community, even within country of birth group. The first column of numbers
reports the overall self-employment rate among all adults born in each country residing in the
U.S. in 1999. While immigrants from the Philippines and Mexico are far less likely to be self-
employed than the average U.S. resident, nearly a quarter of all Korean-born adults reported
12
Note that the 2000 U.S. Census was administered in five languages besides English. Furthermore, a guide in
another 49 languages was provided.
18
being self-employed. However, within each group, there is considerable variability. For Mexican
immigrants, for example, some communities have virtually no self-employment while nearly
40% of adults in others are self-employed. Similarly, Taiwanese immigrants reside in
communities with as little as 2% self-employment and as high as 87%. Recall that the
communities included here are limited to those with more than 50 sampled adult men in both
1990 and 2000, thus excluding very small outliers.
Results13
As discussed above, an increase in community human capital may encourage self-employment in
two ways: 1) better and cheaper access to information/financing resulting in lower production
costs, and 2) the higher earnings associated with higher human capital imply a greater demand
for ethnic goods. On the other hand, a community with higher human capital may dampen the
probability of self-employment since: 1) as human capital increases, assimilation may also
increase, resulting in less demand for ethnic goods, and 2) since higher human capital implies
higher wages, both the opportunity costs of self-employment and the associated cost of co-ethnic
labor in the production function increase.
Self-Employment and the English Skills of the Community
I ran a series of logit regressions using equation III measuring the impact of the percent of the
adult enclave population that reported speaking English14
on the likelihood that a member of that
community is self-employed. For obvious reasons, the sample for this set of regressions is
13
Complete regression results available from author upon request. All regressions in this paper are based on
weighted data, and include clustered errors at the country of birth and MSA level. 14
The percent of the community who reports speaking English is made up of all foreign-born adults who reported
speaking only English at home plus those who reported speaking a different language at home, but speaking English
well or very well.

19
limited to men who emigrated from countries where English is not a dominant language.15
Since
Spanish is widely spoken in the U.S., I also look separately at the impact of English skills on
Spanish-speaking immigrant communities.16
If social interactions are dictated by language rather
than country of origin, a Spanish-speaking immigrant will be less affected by his or her own
country of birth group than an immigrant who speaks a less common language. Finally, each
regression measures the effects of community human capital on three English ability types: those
with limited or no English skills (the omitted group), those who speak a different language at
home but report strong English skills, and those who speak only English at home.
Table 5 reports the resulting coefficients from six logit regressions, two for each of the three
universes: all non-English speaking country of birth groups, Spanish-speaking groups, and all
others. For each of these, two regressions are reported: the first is based on regression model III
using and to control for country of birth and local MSA conditions, while the second,
labeled FE, replaces these continuous variables with two full sets of dummy variables. As
discussed above, though the test statistics in the second regression are unreliable due to
insufficient degrees of freedom, a comparison of the coefficients tests how well the continuous
variable strategy is absorbing the country-specific and locality effects.
A comparison of the two specifications run for each data universe reveals that, though in general
the coefficients that rely on the continuous control variable approach are slightly biased upwards,
the results are qualitatively very similar in both specifications. In fact, much of the difference
15
English speaking COB is empirically defined as a COB with English as the official language and with over 50%
of all adult immigrants in the 2000 Census speaking only English at home, as in Bleakley and Chin (2004) and Blau,
Kahn, and Papps (2011). 16
The following are designated Spanish-speaking countries: Argentina, Bolivia, Chile, Colombia, Costa Rica, Cuba,
Dominican Republic, Ecuador, El Salvador, Guatemala, Honduras, Mexico, Nicaragua, Panama, Paraguay, Peru,
Spain, Uruguay, and Venezuela. Mexican immigrants account for two-thirds of all immigrants from Spanish-
speaking countries.
20
between the two specifications is explained by separating immigrants from Spanish-speaking
countries from all other non-Anglophone country of origin groups. For immigrants from
Spanish-speaking countries, specification III yields nearly identical coefficients as specification
FE – implying that country of birth dummy variables for Spanish-speaking countries add little
relative to including . The only coefficient of interest that differs between the two
specifications is the net effect of community English skills17
on immigrants who speak only
English at home, though both estimates are very small. Similarly, for countries where English is
not a dominant language, the coefficient for immigrants with strong English skills are very
similar while the coefficient for immigrants who speak only English at home are substantially
smaller in the FE specification. Though the inclusion of the complete sets of the country of birth
and MSA dummy variables results in some differences in the estimated coefficients,
specification III captures much of the same story, particularly for those who report speaking a
different language at home, without sacrificing the quality of test statistics. While keeping in
mind these limitations, the following discussion and subsequent results will rely on specification
III.
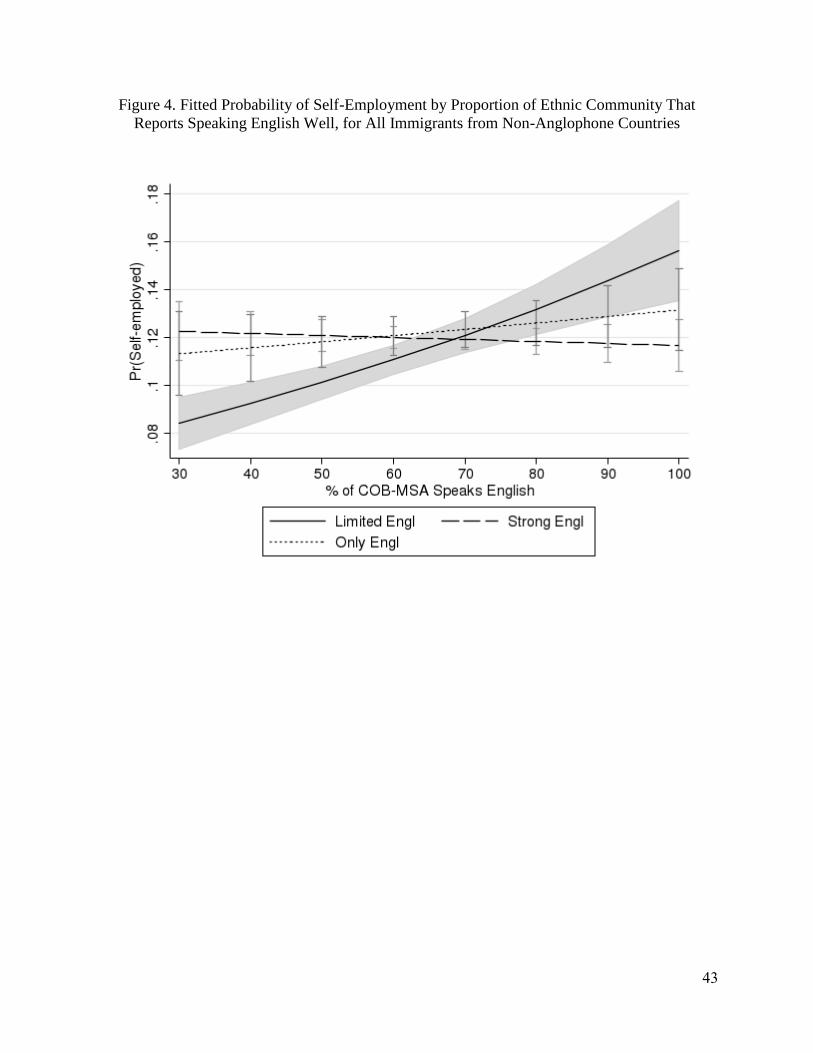
The magnitude of the coefficients reported in the first column of Table 5 is illustrated in Figure
4, which graphs the predicted probability of self-employment for each of the three English-skill
types as the proportion of local co-ethnics who speak English increases from 30% (the sample
minimum) to 100%. Individuals with limited English-skills who live in communities where 90%
of their co-ethnics speak English are five percentage points more likely to be self-employed than
similar immigrants who live in communities where only 30% of co-ethnics speak English. The
confidence interval around the fitted probability of self-employment, the shaded area in Figure 4,
17
% Speak Engl (MC) + [Only Engl * % Speak Engl (MC)]

21
clearly indicates that this difference is statistically significant. Immigrants who speak English
(either as their primary language at home or in addition to their primary language), however,
show no differences in their likelihood of self-employment when residing in communities with
limited English skills versus those where all members speak English.
When the universe of immigrants from non-Anglophone countries is split between those from
Spanish-speaking countries and all other immigrants, we see that the this relationship between
community English skills and self-employment only exists in the Spanish-speaking sample. The
predicted probabilities arising from specification III for both groups are graphed in Figure 5. In
the Spanish-speaking group, there is a very clear and statistically significant increase in the
likelihood of self-employment for immigrants with limited English skills. Though the effect is
also positive for immigrants who report speaking English well or very well and significant at the
5% level, the magnitude is only about half as for those with weak English skills. Specifically, the
fitted probability of self-employment rises by under 8 percentage points for English speakers and
16 percentage points for those with limited English skills when comparing communities with
30% English speakers to those with 100% English speakers. Immigrants who report speaking
only English at home show no relationship between their self-employment decisions and the
language skills of the community. This illustrates the extent to which the language spoken at
home is a good proxy for assimilation: this group’s self-employment decisions are not based on
local ethnic demand or ethnic labor pools. A similar result is found for immigrants with a college
education or higher, as described in the next section. Note, however, that the fitted probabilities
in communities with very high levels of English-fluency for Spanish-speaking immigrants is
largely out of sample, as illustrated in Figure 2.
The second graph in Figure 5 shows the predicted self-employment propensity of immigrants

22
from countries where neither English nor Spanish is the dominant language. The shaded area in
this graph is the 95% confidence interval for immigrants who report strong English skills though
they speak a different language at home. This is the only group that shows a statistically
significant difference in propensity to self-employ depending on the language skills of their co-
ethnics. Unlike in the Spanish-language sample, this group of immigrants shows a decline in the
likelihood of self-employment as the local co-ethnic community becomes more likely to speak
English. The change in probability of self-employment for an individual in this group falls by 4.3
percentage points as the proportion of their co-ethnics who speak English rises from 30% to
100%. Recall that immigrants from Europe and Asia, the bulk of this group, are more likely to
be self-employed than the U.S. native-born. Hence, this decline in predicted self-employment as
the community speaks more English is consistent with a move towards greater assimilation and
may reflect the increased opportunity costs of self-employment as the human capital level of a
community rises. Figure 2 shows that, for this group, predictions for communities with very low
levels of English-fluency are out of sample.
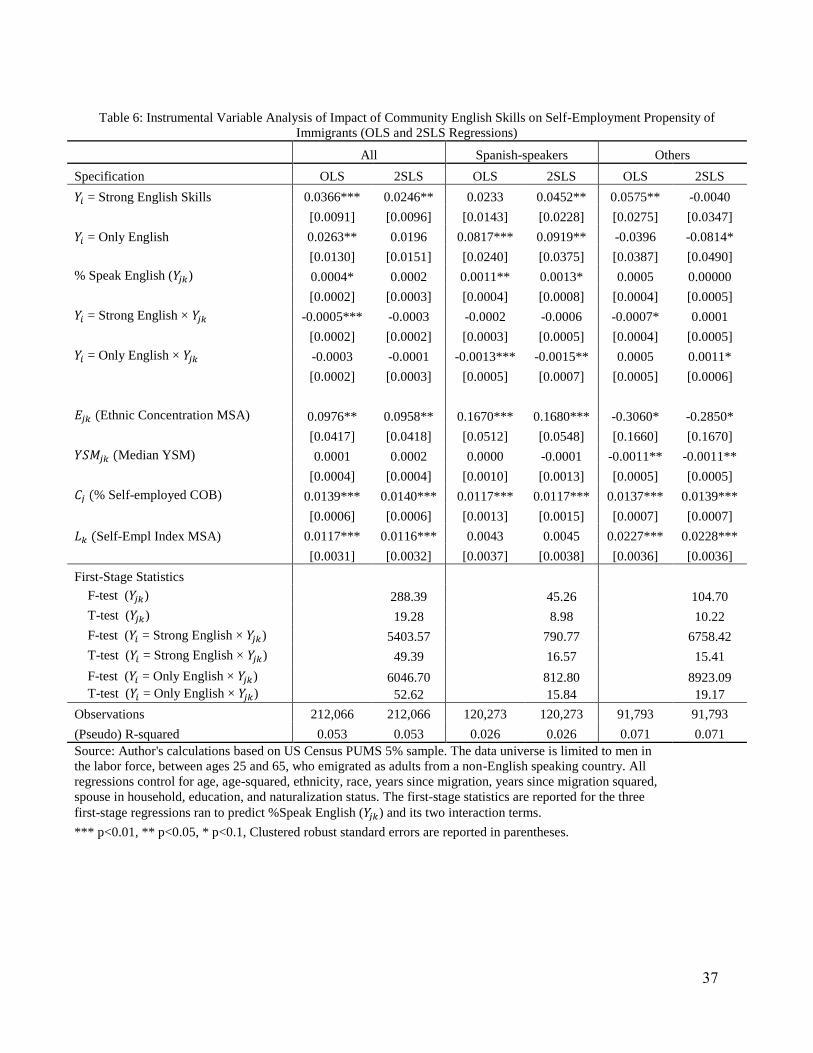
Instrumental Variable Analysis
It is possible that the relationships found between self-employment propensity and community
English skills are not causal but rather the result of immigrants strategically choosing an ethnic
community based on their desire to become self-employed. Table 6 reports the estimated
coefficients from the instrumental variables analysis (2SLS) described above and, for direct
comparison, the results from a linear probability model using the same specification as
regression III. The high first-stage test statistics reported show that these regressions do not
suffer from weak instrument bias. Looking at all immigrants from countries where English is not
a dominant language, the IV results show that the enclave effects are no longer statistically
23
significant, suggesting that many immigrants select into a given community based on their
predetermined desire to start their own business. However, limiting the data universe to only
immigrants from Spanish-speaking countries shows that, for this group, the community’s English
skills have a statistically significant positive effect on self-employment for both immigrants with
poor English skills and for those who speak Spanish at home but report speaking English well
even after controlling for self-selection. The effect for those who speak English at home, the
most assimilated, is close to 0, suggesting that, for this group, the decision to become self-
employed is made independently from the ethnic community’s human capital. For immigrants
from countries where neither English nor Spanish is the dominant language, the only statistically
significant effect of community English skills on self-employment is for those immigrants who
speak only English at home: their probability of self-employment increases slightly as their local
co-ethnic community reports higher levels of English fluency.
Overall, the story that emerges from the regressions in Tables 5 and 6 and Figures 4 and 5 is that
higher community language skills appear to encourage self-employment among Spanish-
speaking immigrants. This result suggests a degree of segregation between different Spanish-
speaking groups in the U.S. rather than one large Spanish-language product/services market.
Subsequent neighborhood-level analysis has revealed strong tendencies for immigrants from
Spanish-speaking countries to cluster with fellow co-ethnics and little evidence of Spanish-
language or Hispanic clustering (Sousa 2012). This suggests, then, that rather than catering to a
linguistically isolated community, self-employment among Spanish-speaking immigrants
benefits more from greater access to linguistically assimilated co-ethnics, potentially via better
information and lending channels, especially for immigrants who themselves lack English skills.
24
Self-Employment and the Educational Attainment of the Community
As in the language skills analysis, the individual’s education level is interacted with the
community’s high school graduation rate. Figure 3 displays the distributions of each of the three
education types (less than a high school diploma, high school graduates, and those with post-
secondary training) as the percent of the local co-ethnics with a high school diploma increases
from 20 to 100%. Note the low density of immigrants without a high school diploma among
communities where over 80% completed high school. As above, Table 7 reports the coefficients
from regressions III, regression III with the full set of MSA and country of birth dummy
variables (FE), the linear probability regression version of model III (labeled OLS), and the
corresponding IV regression.
Overall, a similar pattern emerges as that found for English-skills. Notably, immigrants with
post-secondary education show no sensitivity to the educational attainment of their community
when deciding whether to become self-employed or not. This is consistent throughout the four
specifications reported in Table 7: the coefficient on % Graduated from HS (MC) is consistently
small and statistically indistinguishable from zero. Additionally, all four regressions show that
immigrants without a post-secondary education are less likely to become self-employed than
those with higher education in communities with relatively low levels of overall educational
attainment. However, as the proportion of co-ethnics with a high school diploma increases, so
does the likelihood of self-employment for high school dropouts and high school graduates with
no additional schooling.
These results are illustrated in Figure 6, where the shaded area is the 95% confidence interval for
the propensity of self-employment for immigrants without a high school diploma. The graph

25
clearly shows that in communities where less than half of the adults completed high school,
immigrants with some post-secondary education are more likely to be self-employed than all
others. However, in communities where at least 80% completed high school, immigrants with a
high school education or less are more likely to be self-employed than others (recall that for
communities higher than 80%, there are very few high school dropouts). The change in
probability of self-employment for high school dropouts is sizeable: it jumps by about 5
percentage points if the underlying ethnic community changes from 40% to 80% high school
graduates. Though this effect on self-employment is smaller when MSA and country of birth
fixed effects are included and in the IV specification, they remain statistically significant and
positive. This suggests that though there may be some selection and some unaddressed country
of birth effects in the main results graphed in Figure 6, the overall story remains unchanged:
immigrants with a high school education or less are more likely to become self-employed in
communities where more of their co-ethnics have completed high school.
Industry Analysis of Self-Employment and Community Educational Attainment
To get a better sense of the businesses being created in communities with low and high levels of
educational attainment, Table 8 reports the distribution of the primary industry of self-
employment by community-level and individual education. The industries are sorted by the ratio
of self-employment to employment (that is, the proportion of workers in each industry that are
self-employed). Besides this column, all other columns sum to 100, thus reporting what
proportion of each group is self-employed in each industry.
From the results above, we noted that the educational attainment of the community does not
affect whether immigrants with some post-secondary education become self-employed.

26
However, Table 8 shows that the level of community education affects the type of self-
employment chosen by these high education individuals. For example, in communities where
only a third of adults have some post-secondary education, an immigrant with some post-
secondary education is more than twice as likely to be self-employed in construction than a
similarly-educated immigrant in a community where over 61% have some post-secondary
training. On the other hand, he is about twice as likely to be in the medical field, a field requiring
significant capital investment, if he lives in a community with higher education relative to living
in one with lower educational attainment. For immigrants with low levels of human capital, the
industry of self-employment also varies significantly depending on the educational attainment of
the ethnic community. High school dropouts in highly educated communities are more likely to
be in industries with higher barriers to entry, such as being a taxi/limo driver or starting a
restaurant, while those in low education groups are far more likely to enter into less formal
industries such as landscaping and construction.
Conclusion
Human capital externalities have been found to increase wages (e.g., Acemoglu and Angrist
2001), productivity (e.g., Moretti 2004), and to lead to greater city-level employment growth
(e.g., Simon 1998). Research on the impact of human capital externalities on self-employment
has focused primarily on immigrant and ethnic/racial groups. The size of the local ethnic
community (e.g., Borjas 1986) and the amount of entrepreneurial capital within ethnic
communities (Toussaint-Comeau 2008) have been shown to affect an individual’s propensity to
opt into self-employment. This paper extends this research by considering the impact of human
capital externalities, measured as community-level English skills and formal schooling, on the
likelihood of self-employment for different groups of immigrants. Both of the community human

27
capital measures tested above support the hypothesis that immigrants with low levels of human
capital benefit from co-ethnic human capital externalities, as measured by their willingness to
enter self-employment. Furthermore, they show greater sensitivity to these externalities than
immigrants with either a college education or those who report speaking only English at home
(the most assimilated). The results based on community English-language skills indicate the
presence of positive human capital externalities affecting self-employment among immigrants
who report speaking Spanish at home. I also find that communities with more high school
graduates encourage self-employment for those without any post-secondary training, potentially
by reducing business costs (such as those related to information and financing) or by increasing
ethnic disposable income (and hence demand). This effect is far stronger than the potential
negative impact on the likelihood of self-employment that may arise from expected increases in
the outside wage opportunities generated by a community with more human capital.
Though the regressions reported above do not directly differentiate between the mechanisms by
which the human capital levels of communities may impact self-employment, they do suggest
the relative importance of some. Since self-employment is either unaffected or increases as the
community English-skills and educational attainment increase, we can postulate that the effects
of ethnic demand or business costs from having access to a wealthier community dominate any
effects on the opportunity cost of self-employment based on access to better job networks. This
is further supported by the industry analysis, which suggests that immigrants from communities
with higher levels of human capital enter industries that require more capital stock/better
financing. Similarly, immigrants with post-secondary education are unaffected by their
community’s human capital levels when deciding whether to become self-employed. This
suggests that the story of the bilingual lawyer or similarly high-skilled individual choosing self-

28
employment based on a protected ethnic market of linguistically isolated individuals is not a
significant part of immigrant self-employment.
Both community-level human capital measures tested, the English skills and educational
attainment, indicate the presence of strong human capital externalities at play within ethnic
communities in the United States. These externalities play an important role in the economic
assimilation of low human capital immigrants by potentially offsetting some of the economic
costs associated with low education and limited English skills. Since acquiring these skills might
be prohibitively expensive for some groups, especially immigrants with the lowest levels of
education, having access to a co-ethnic community with higher human capital might serve as an
affordable alternative. To the extent that self-employment can serve as a vehicle for economic
assimilation for immigrants in the U.S., human capital externalities from co-ethnics can serve as
a social tool for economic assimilation as well.
29
REFERENCES
Acemoglu, Daron and Joshua Angrist. 2001. How Large are Human-Capital Externalities?
Evidence from Compulsory-Schooling Laws. In NBER Macroeconomics Annual 2000,
Vol.15, Ben S. Bernanke and Kenneth Rogoff (eds). MIT Press.
Bartel, Ann P. 1989. Where do the new U.S. immigrants live? Journal of Labor Economics 7:4.
Bates, Timothy. 1997. Financing Small Business Creation: The Case of Chinese and Korean
Immigrant Entrepreneurs. Journal of Business Venturing 12:2.
Beaman, Lori A., 2009. Social Networks and the Dynamics of Labor Market Outcomes:
Evidence from Refugees Resettled in the U.S. Revise and Resubmit, Review of Economic
Studies.
Berman, Eli, John Bound and Zvi Griliches. 1994. Changes in the Demand for Skilled Labor
within U.S. Manufacturing: Evidence from the Annual Survey of Manufacturers. The
Quarterly Journal of Economics 109:2.
Bertrand, Marianne, Erzo Luttmer, and Sendhil Mullainathan. 2000. Network Effects and
Welfare Cultures. The Quarterly Journal of Economics 115:3.
Blau, Francine D., Lawrence M. Khan, and Kerry L. Papps. 2011. Gender, Source Country
Characteristics and Labor Market Assimilation Among Immigrants: 1980 - 2000. The
Review of Economics and Statistics 93:1.
Bleakley, Hoyt and Aimee Chin. 2004. Language Skills and Earnings: Evidence from Childhood
Immigrants. The Review of Economics and Statistics 86:2.
Bohn, Sarah and Sarah Pearlman. 2009. Ethnic Concentration and Bank Use in Immigrant
Communities. Public Policy Institute of California Working Paper.
Borjas, George J., 1986. The Self-Employment Experience of Immigrants. The Journal of

30
Human Resources 21:4.
--- 1987. Self-Selection and the Earnings of Immigrants. The American Economic Review
77:4.
--- 1992. Ethnic Capital and Intergenerational Mobility. The Quarterly Journal of Economics
107:1.
Borjas, George J., and Stephen G. Bronars. 1989. Consumer Discrimination and Self-
Employment. The Journal of Political Economy 97:3.
Bowles, Jonathan and Tara Colton. 2007. A World of Opportunity. Center for an Urban Future.
New York, NY.
Carliner, Geoffrey. 2000. The Language Ability of U.S. Immigrants: Assimilation and Cohort
Effects. International Migration Review 34:1.
Chiswick, Barry R. and Paul W. Miller. 1995. The Endogeneity Between Language and
Earnings: International Analyses. Journal of Labor Economics 13:2.
Evans, David S. and Linda S. Leighton. 1989. Some Empirical Aspects of Entrepreneurship. The
American Economic Review 79:3.
Friedberg, Rachel M. 2000. You Can’t Take It With You? Immigrant Assimilation and the
Portability of Human Capital. Journal of Labor Economics 18:2.
Georgarakos, Dimitris and Konstantinos Tatsiramos. 2009. Immigrant Self-Employment: Does
Intermarriage Matter? Working Paper 4350, IZA Discussion Paper.
Johnson, Jacqueline S. and Elissa L. Newport. 1989. Critical Period Effects in Second Language
Learning: The Influence of Maturational State on the Acquisition of English as a Second
Language. Cognitive Psychology 21.
Lazear, Edward P. 1999. Culture and Language. The Journal of Political Economy 107:6, part II.

31
Le, Anh T. 1999. Empirical Studies of Self-Employment. Journal of Economic Surveys 13:4.
Lofstrom, Magnus. 2002. Labor Market Assimilation and the Self-Employment Decision of
Immigrant Entrepreneurs. Journal of Population Economics 15:1.
--- 2009. Low-skilled Immigrant Entrepreneurship. Working Paper 4560, IZA Discussion
Paper.
Moretti, Enrico. 2004. Workers' Education, Spillovers and Productivity: Evidence from Plant-
Level Production Functions. American Economic Review 94:3.
Norton, Edward C., Hua Wange and Chunrong Ai. 2004. Computing Interaction Effects and
Standard Errors in Logit and Probit Models. The STATA Journal 4:2.
Rosenzweig, Mark R. 1995. Why Are There Returns to Schooling? American Economic Review
85:2.
Simon, Curtis. 1998. Human Capital and Metropolitan Employment Growth. Journal of Urban
Economics 43.
Sousa, Liliana. 2012. Identifying Ethnic Enclaves Using Linked Employer-Household Data.
PAA 2012 Annual Meeting, http://paa2012.princeton.edu/papers/122369
Toussaint-Comeau, Maude. 2008. Do Ethnic Enclaves and Networks Promote Immigrant Self-
Employment? Economic Perspectives IV.
de Wit, Gerrit. 1993. Models of Self-Employment in a Competitive Market. Journal of Economic
Surveys 7:4.
Yuengert, Andrew. 1995. Testing Hypotheses of Immigrant Self-Employment. The Journal of
Human Resources 30:1.

32
Table 1: Top 20 Primary Metropolitan Statistical Areas, by Size of the Sampled Population
Primary Metropolitan Statistical Area Estimated
Population % Sample Size %
Los Angeles-Long Beach, CA PMSA 767,745 15.1 37,638 16.2
New York, NY PMSA 717,073 14.1 29,421 12.6
Chicago, IL PMSA 326,346 6.4 13,110 5.6
Miami, FL PMSA 223,077 4.4 10,365 4.5
Houston, TX PMSA 191,629 3.8 8,067 3.5
Washington, DC-MD-VA-WV PMSA 188,297 3.7 8,836 3.8
Orange County, CA PMSA 172,060 3.4 9,041 3.9
Dallas, TX PMSA 136,098 2.7 5,957 2.6
San Jose, CA PMSA 129,630 2.5 6,220 2.7
Oakland, CA PMSA 119,093 2.3 5,815 2.5
Riverside-San Bernardino, CA PMSA 113,690 2.2 5,186 2.2
San Diego, CA MSA 103,708 2.0 4,994 2.1
San Francisco, CA PMSA 102,773 2.0 4,867 2.1
Boston, MA-NH PMSA 92,491 1.8 4,279 1.8
Atlanta, GA MSA 90,347 1.8 3,710 1.6
Phoenix-Mesa, AZ MSA 83,713 1.6 4,115 1.8
Newark, NJ PMSA 81,614 1.6 3,812 1.6
Nassau-Suffolk, NY PMSA 77,461 1.5 3,759 1.6
Fort Lauderdale, FL PMSA 67,315 1.3 3,069 1.3
Bergen-Passaic, NJ PMSA 67,078 1.3 3,189 1.4
Total Top 20 3,851,238 75.5 175,450 75.3
Source: Author's calculations based on U.S. Census PUMS 5% sample. The universe is limited to
male immigrants who report being in the labor force, not in school and between the ages of 25 and
65 who immigrated as adults.

33
Table 2: Demographic Characteristics of Foreign Born Men, in the Labor
Force and not in School, Ages 25-65, who Immigrated as Adults, by Self-
Employment Status
Total Not Self-
Employed Self-
Employed
Sample Size 232,988 205,577 27,411
Weighted Total 5,100,024 4,504,342 595,682
Average Age 41.5 41.0 44.7
White (%) 13.9 12.7 22.6
Black (%) 6.2 6.3 5.3
Hispanic (%) 54.5 56.1 42.5
Other Race (%) 25.4 24.8 29.7
Spouse in Household (%) 64.1 62.7 74.7
Naturalized (%) 34.3 32.8 45.6
Years since migration 13.8 13.4 16.8
Did not move in past 5 years (%) 41.2 39.9 51.4
No High School 27.8 28.7 21.3
Some High School 17.2 17.4 15.6
High School 17.5 17.4 18.6
Some College 14.2 13.8 17.0
College 12.2 11.9 14.5
Advanced Degree 11.1 10.8 13.1
Speaks English at home 10.3 10.1 11.1
Speaks English very well 25.4 25.0 28.0
Speaks English well 26.7 26.1 30.9
Limited English ability 37.7 38.7 30.1
Speaks Spanish at home 52.5 54.0 41.0
Household Income , Average 64,730 63,352 75,155
Median 49,000 49,000 50,000
Personal Income , Average 32,658 31,409 42,101
Median 22,000 22,000 23,200
Average Wage Income 29,974 31,133 21,209
Average Self-Employed Income 2,684 276 20,892 Source: Author's calculations based on U.S. Census PUMS 5% sample. All
monetary values reported in 1999 dollars.
34
Table 3: Distribution of Educational Attainment for the U.S.-Born and the 20 Largest
Country-of-Origin Groups
Country of
Birth
Estimated
U.S.
Population
Highest Education Achieved (%)
Less
than
9
years
Some
High
School
High
School Some
College College
Grad.
Degree
United States 157,471,246 3.0 11.6 29.6 32.2 15.7 7.9
Mexico 7,635,686 44.5 24.6 17.3 9.9 2.3 1.4
Philippines 1,170,239 4.9 5.8 15.0 29.9 36.7 7.7
India 910,668 3.5 7.0 8.8 13.0 32.1 35.7
Vietnam 873,266 16.0 19.3 19.2 26.6 14.4 4.4
China 804,648 15.9 11.5 14.9 14.7 18.5 24.5
El Salvador 733,096 38.2 25.7 18.6 13.2 3.0 1.4
Cuba 676,855 14.8 20.8 21.9 23.0 10.5 9.0
Korea 602,408 4.6 7.1 22.3 24.7 28.3 13.0
Canada 591,563 2.8 9.3 18.0 32.2 22.2 15.4
Russia 581,378 4.1 8.0 18.7 23.3 24.0 21.9
Dominican Rep. 577,948 24.5 24.6 21.9 20.0 5.5 3.5
Germany 524,861 2.8 9.3 28.4 30.2 14.8 14.4
Jamaica 470,427 6.1 19.0 27.7 29.7 11.8 5.7
Colombia 433,861 11.1 14.8 26.7 26.5 12.1 8.8
Guatemala 418,047 41.8 21.4 18.2 13.5 3.4 1.7
Haiti 360,647 12.7 23.3 24.7 26.6 8.7 4.1
Poland 348,854 6.1 12.7 30.7 26.8 10.6 13.1
Italy 333,833 23.9 13.6 28.5 16.8 9.0 8.3
England 329,000 0.8 6.4 22.3 33.8 22.0 14.9
Taiwan 300,495 2.3 3.5 11.4 20.8 28.8 33.1
Source: Author's calculations based on U.S. Census PUMS 5% sample. The universe is limited
to all individuals in the labor force in 2000 between the ages of 18-70.

35
Table 4: Percent Self-Employed at the National and MSA Level
for Ten of the Largest Country of Origin Groups
Country of Birth National Lowest
MSA Highest
MSA
Philippines 5.29 0.83 64.71
Mexico 7.69 0.77 37.85
El Salvador 9.28 1.34 40.84
Guatemala 9.81 0.47 47.76
India 10.93 2.24 59.15
Vietnam 11.33 0.88 74.42
Canada 13.65 3.37 55.26
Taiwan 15.27 2.04 87.37
Italy 18.02 3.44 76.09
Korea 24.61 2.94 76.00
Source: Author's calculations based on U.S. Census PUMS 5% sample.
The universe is limited to all individuals in the labor force in 2000, who
were between the ages of 18-70. National reports the overall percent of
the country of birth population that is self-employed in the U.S., Lowest
and Highest MSA report the percentage self-employed in the MSA with
the lowest and highest self-employment rates, respectively.

36
Table 5: Impact of Community English Skills on Self-Employment Propensity of Immigrants (Logit Regressions)
Universe All Spanish-speakers Others
Specification III FE III FE III FE
= Strong English Skills 0.779*** 0.546*** 0.8050*** 0.8030*** 0.508* 0.4180*
[0.0995] [0.101] [0.1640] [0.1740] [0.2650] [0.2160]
= Only English 0.581*** 0.578*** 1.3600*** 1.4830*** -0.4390 -0.1850
[0.151] [0.165] [0.2920] [0.3400] [0.3660] [0.3170]
% Speak English ( ) 0.0105*** 0.00551 0.0230*** 0.0225*** 0.0013 0.0004
[0.0021] [0.0034] [0.0053] [0.0072] [0.0042] [0.0049]
= Strong English × -0.0114*** -0.0074*** -0.0121*** -0.0121*** -0.0065* -0.0052*
[0.0016] [0.0017] [0.0032] [0.0034] [0.0037] [0.0030]
= Only English × -0.0079*** -0.0078*** -0.0227*** -0.0254*** 0.0055 0.0019
[0.0023] [0.0026] [0.0056] [0.0067] [0.0048] [0.0041]
Ethnic Concentration MSA) 1.230*** -0.0563 1.7450*** 0.7940** -6.242*** -3.613
[0.426] [0.349] [0.5110] [0.3590] [1.750] [2.244]
Median YSM) -0.0046 -0.0047 0.0051 -0.0266** -0.0146*** -0.0155
[0.0035] [0.0073] [0.0096] [0.0107] [0.0041] [0.0096]
% Self-employed COB) 0.0981*** 0.0850*** 0.0887***
[0.0038] [0.0146] [0.0042]
Self-Empl Index MSA) 0.148*** 0.0800* 0.2000***
[0.0353] [0.0451] [0.0307]
COB Fixed Effects X X X
MSA Fixed Effects X X X
Observations 212,066 187,653 120,273 113,967 91,793 73,686
(Pseudo) R-squared 0.0688 0.0752 0.0415 0.0523 0.0843 0.0913
Source: Author's calculations based on US Census PUMS 5% sample. The data universe is limited to men in the labor force, between ages
25 and 65, who emigrated as adults from a non-English speaking country. All regressions control for age, age-squared, ethnicity, race,
years since migration, years since migration squared, spouse in household, education, and naturalization status.
*** p<0.01, ** p<0.05, * p<0.1, Clustered robust standard errors are reported in parentheses.
37
Table 6: Instrumental Variable Analysis of Impact of Community English Skills on Self-Employment Propensity of
Immigrants (OLS and 2SLS Regressions)
All Spanish-speakers Others
Specification OLS 2SLS OLS 2SLS OLS 2SLS
= Strong English Skills 0.0366*** 0.0246** 0.0233 0.0452** 0.0575** -0.0040
[0.0091] [0.0096] [0.0143] [0.0228] [0.0275] [0.0347]
= Only English 0.0263** 0.0196 0.0817*** 0.0919** -0.0396 -0.0814*
[0.0130] [0.0151] [0.0240] [0.0375] [0.0387] [0.0490]
% Speak English ( ) 0.0004* 0.0002 0.0011** 0.0013* 0.0005 0.00000
[0.0002] [0.0003] [0.0004] [0.0008] [0.0004] [0.0005]
= Strong English × -0.0005*** -0.0003 -0.0002 -0.0006 -0.0007* 0.0001
[0.0002] [0.0002] [0.0003] [0.0005] [0.0004] [0.0005]
= Only English × -0.0003 -0.0001 -0.0013*** -0.0015** 0.0005 0.0011*
[0.0002] [0.0003] [0.0005] [0.0007] [0.0005] [0.0006]
Ethnic Concentration MSA) 0.0976** 0.0958** 0.1670*** 0.1680*** -0.3060* -0.2850*
[0.0417] [0.0418] [0.0512] [0.0548] [0.1660] [0.1670]
Median YSM) 0.0001 0.0002 0.0000 -0.0001 -0.0011** -0.0011**
[0.0004] [0.0004] [0.0010] [0.0013] [0.0005] [0.0005]
% Self-employed COB) 0.0139*** 0.0140*** 0.0117*** 0.0117*** 0.0137*** 0.0139***
[0.0006] [0.0006] [0.0013] [0.0015] [0.0007] [0.0007]
Self-Empl Index MSA) 0.0117*** 0.0116*** 0.0043 0.0045 0.0227*** 0.0228***
[0.0031] [0.0032] [0.0037] [0.0038] [0.0036] [0.0036]
First-Stage Statistics
F-test ( ) 288.39 45.26 104.70
T-test ( ) 19.28 8.98 10.22
F-test ( = Strong English × ) 5403.57 790.77 6758.42
T-test ( = Strong English × ) 49.39 16.57 15.41
F-test ( = Only English × ) 6046.70 812.80 8923.09
T-test ( = Only English × ) 52.62 15.84 19.17
Observations 212,066 212,066 120,273 120,273 91,793 91,793
(Pseudo) R-squared 0.053 0.053 0.026 0.026 0.071 0.071
Source: Author's calculations based on US Census PUMS 5% sample. The data universe is limited to men in
the labor force, between ages 25 and 65, who emigrated as adults from a non-English speaking country. All
regressions control for age, age-squared, ethnicity, race, years since migration, years since migration squared,
spouse in household, education, and naturalization status. The first-stage statistics are reported for the three
first-stage regressions ran to predict %Speak English ( ) and its two interaction terms.
*** p<0.01, ** p<0.05, * p<0.1, Clustered robust standard errors are reported in parentheses.

38
Table 7: Impact of Community Schooling Attainment on Self-Employment Propensity of
Immigrants (Logit Regressions)
Specification III FE OLS 2SLS
= No High School Diploma (No HS) -0.683*** -0.556*** -0.0500*** -0.0442***
[0.0891] [0.0709] [0.0075] [0.0079]
= High School Diploma (HS) -0.483*** -0.368*** -0.0392*** -0.0347***
[0.0821] [0.0752] [0.0074] [0.0075]
% More than HS ( ) 0.0006 -0.0007 -0.0000 -0.0001
[0.0012] [0.0028] [0.000] [0.0001]
= No HS × % More than HS ( ) 0.0108*** 0.0087*** 0.0008*** 0.0006***
[0.0013] [0.0012] [0.0001] [0.0001]
= HS × % More than HS ( ) 0.0079*** 0.0060*** 0.0007*** 0.0006***
[0.0012] [0.0012] [0.0001] [0.0001]
Ethnic Concentration MSA) 1.525*** 0.170 0.125*** 0.115***
[0.417] [0.342] [0.0422] [0.0415]
Median YSM) -0.0041 -0.0043 -0.0001 -0.0000
[0.0030] [0.0059] [0.0003] [0.0003]
% Self-employed COB) 0.0932*** 0.0135*** 0.0137***
[0.0042] [0.0007] [0.0007]
Self-Empl Index MSA) 0.150*** 0.0125*** 0.0124***
[0.0315] [0.0029] [0.0029]
COB Fixed Effects X
MSA Fixed Effects X
Constant -7.058*** -4.841*** -0.308*** -0.306***
[0.360] [0.340] [0.0338] [0.0344]
First Stage Statistics
F-test ( ) 666.63
T-test ( ) 37.99
F-test ( = No HS × ) 2148.09
T-test ( = No HS × ) 36.95
F-test ( = HS × ) 3042.78
T-test ( = HS × ) 56.96
Observations 225,544 197,453 225,544 225,544
(Pseudo) R-squared 0.0676 0.0736 0.052 0.052
Source: Author's calculations based on US Census PUMS 5% sample. The data universe is limited
to men in the labor force, between ages 25 and 65, who emigrated as adults. All regressions control
for age, age-squared, ethnicity, race, years since migration, years since migration squared, spouse
in household, English-language ability, and naturalization status. The first-stage statistics are
reported for the three first-stage regressions ran to predict %More than HS (MC) and its two
interaction terms.
*** p<0.01, ** p<0.05, * p<0.1, Clustered robust standard errors are reported in parentheses.

39
Table 8. The Distribution of Primary Industry for the Self-Employed, by Type of Enclave and Own Educational
Attainment
Overall
Distribution of
Self-Empl
SE/E
Ratio
Enclave has Post-
secondary Education
Rate of 31% or Lower
Enclave has Post-
secondary Education
Rate of 61% or Higher
Industry < HS HS > HS < HS HS > HS
Taxi/Limo Service 4.92 6.31 2.51 3.42 4.02 10.58 7.14 4.25
Auto Repair 4.96 2.48 7.77 8.8 5.34 3.99 3.29 1.82
Other Services* 5.35 2.48 3.83 5.92 3.82 8.67 10.21 5.00
Landscaping 5.19 2.13 14.32 6.35 3.61 2.23 2.14 0.59
Retail (excl groceries) 10.47 1.68 8.11 9.24 10.11 11.65 14.11 12.52
Construction 20.6 1.50 30.22 29.93 21.02 16.22 16.58 7.71
Finance/Professional 5.5 1.47 0.71 1.13 8.08 1.46 2.14 12.41
Groceries 2.32 1.25 1.78 1.42 2.21 4.71 3.9 2.97
Other transportation 3.98 1.15 5.18 6.93 4.13 2.8 3.77 1.49
Wholesale 5.18 1.03 2.64 3.63 4.54 4.66 6.44 8.2
Health care 4.4 1.03 0.44 0.27 5.77 0.97 0.76 11.35
Restaurant 6.12 0.81 5.14 6.74 5.14 14.3 10.11 5.02
Arts/Recreation 2.7 0.79 1.88 1.6 2.82 3.15 3.87 3.59
Professional support 3.69 0.78 2.66 3.63 3.74 2.63 2.94 5.06
Communications 6.01 0.76 1.54 3.2 6.89 3.67 4.68 10.51
Farming/Utilities 1.93 0.55 5.15 1.48 1.69 1.81 0.66 0.43
Education 0.68 0.28 0.14 0.4 0.39 0.24 0.64 1.46
Manufacturing 4.89 0.26 4.48 4.64 5.6 5.73 5.78 4.8
Furniture 0.35 0.33 0.46 0.25 0.49 0.05 0.3 0.2
Electronics 0.21 0.12 0.03 0.17 0.15 0.23 0.24 0.49
Other 0.57 0.17 1.01 0.85 0.44 0.24 0.3 0.13 Source: Author's calculations based on U.S. Census PUMS 5% sample. The data universe is limited to men who report being
self-employed, between 25 and 65, who immigrated as adults. Each column reports the industrial distribution of the self-
employed men in low-education or high-education communities with own education either less than a high school diploma
(<HS), exactly high school (HS), or some post-secondary education (>HS). The SE/E Ratio measures the relative rate of self-
employment among the universe in each of the industries. All cells in which the difference between men in low education
enclaves and those in high education enclaves exceeds 5 percentage points are highlighted in grey.
* The category "Other Services" includes nail salons, hair salons and dry cleaners.
40
Figure 1. Distributions of Sampled Individuals Over the Percentage of Local Co-ethnics who Graduated
From High School and with Strong English-language Skills18
18
This figure charts the weighted distribution of in-sample individuals by the percentage of their local ethnic
community that either graduated from high school or have strong English skills. Note that the sample for the
English-skills distribution is limited to immigrants from countries where English is not an official language.

41
Figure 2. Distribution of Sampled Individuals Over the Percentage of Local Co-ethnics who Speak
English Well, by Own-English Skills and Language of Country of Birth19
19
This figure charts the weighted distributions of in-sample individuals (by their English-skill type) over the
percentage of their local ethnic community that reports having strong English skills. Note that the sample is limited
to immigrants from countries where English is not an official language, with immigrants from Spanish-speaking
countries on the left and all other non-Anglophone countries on the right. The peak in the Spanish-speaking COB
graph is due to the significant size of the Mexican-born population in Los Angeles. Even if we abstract from the
significant peaks on the Spanish-speaking COB graph, which reflect very large ethnic communities, it is obvious
that the bulk of COB-MSA cells for immigrants from Spanish-speaking countries report lower levels of English-
fluency than other COB groups.

42
Figure 3. Distribution of Sampled Individuals Over the Percentage of Local Co-ethnics who
Graduated from High School, by Own-Educational Attainment20
20
This figure charts the weighted distribution of in-sample individuals (by own educational attainment) over the
percentage of their local ethnic community that graduated from high school.
43
Figure 4. Fitted Probability of Self-Employment by Proportion of Ethnic Community That
Reports Speaking English Well, for All Immigrants from Non-Anglophone Countries

44
Figure 5. Fitted Probability of Self-Employment by Proportion of Ethnic Community That
Reports Speaking English Well, for All Immigrants from Non-Anglophone Countries

45
Figure 6. Fitted Probability of Self-Employment by Proportion of Ethnic Community with Post-
Secondary Education, for All Immigrants