Embed Size (px)
Citation preview

COMMUNITY COLLEGE RESEARCH CENTER | JULY 2019
As community colleges across the country implement large-scale reforms to improve student success, they need timely and actionable metrics to determine if the changes they are making in a given year or term will likely improve student outcomes in the long run. In this brief, we examine how well nine measures of students’ progress in their first year predict student completion in subsequent years and thus how suitable these early momentum metrics, or EMMs, are as leading indicators of the effectiveness of institutional reforms.
Based on analysis of student data from all community colleges in three states, we find that EMMs do predict longer term success for students. We also find that a key factor in low completion rates, as well as in equity gaps in completion rates, is that many students do not gain early momentum in their first year. College outcomes would be substantially higher if more students met EMMs. Our findings indicate the need for comprehensive reforms to community college organization and practice to help more students gain early momentum on their way to earning a credential.
First-Year Indicators of Longer-Term SuccessThroughout the nation, two-year and four-year colleges are recognizing that to “move the needle” on collegewide measures of success (e.g., completion rates) major redesign across the entire institution may be required to ensure that its programs, policies, and practices are well designed and aligned to promote student success. Hundreds of community colleges across the country are adopting whole-college reforms commonly referred to as “guided pathways” (Bailey, Jaggars, & Jenkins, 2015). As part of these reforms, colleges are mapping requirements and options for programs of study so that they are aligned with desired employment and transfer outcomes, redesigning the onboarding process to help new students explore options and interests and develop an academic completion plan, and revamping advising to better support students in making timely progress toward completion of a credential. Faculty are also working together across disciplines to ensure that curricula and teaching prepare students to succeed in employment and transfer in their field of study.
Because they involve a redesign of college practices at scale, guided pathways reforms take several years to implement (Jenkins, Lahr, Fink, & Ganga, 2018, pp. 2–3). Given that whole-college
Early Momentum MetricsLeading Indicators for Community College ImprovementBy Clive R. Belfield, Davis Jenkins, and John Fink
Based on analysis in three states, we find that measures of student progress in the first year predict student completion in subsequent years.

2
COMMUNITY COLLEGE RESEARCH CENTER | TEACHERS COLLEGE, COLUMBIA UNIVERSITY
reforms like guided pathways take so much time to carry out, lagging metrics of student performance, such as three- or six-year graduation rates, are not timely enough for college leaders to use to monitor and improve the reforms as they are being implemented. To formatively assess whether reforms being implemented in the present are likely to improve student outcomes several years hence, college leaders need leading metrics of longer-term success. These indicators need to be measurable over a relatively short time frame, and they should strongly predict success in college.
Previous research shows that students’ “momentum” in their first year is strongly associated with higher rates of completion in the longer term (Adelman, 1999, 2006; Attewell, Heil, & Reisel, 2012; Wang, 2017). If indeed first-year momentum is predictive of completion, college leaders can examine year-over-year trends in early momentum metrics for first-time entering student cohorts to see if the reforms they are implementing are likely to improve completion rates in the future.
Here we use student transcript data from three community college state systems to assess the validity of early (first-year) momentum metrics, or EMMs, as leading indicators of student completion. In particular, we examine three sets of EMMs that previous research suggests should be predictive of completion. In addition to their potential usefulness as metrics for examining the effects of whole college reforms, these metrics may also help focus the attention of colleges implementing whole-college reforms on creating the early conditions for longer-term student success (Jenkins & Bailey, 2017). Conceptually, the metrics are grouped as follows:
• Credit momentum metrics: Rates at which students complete a substantial number of college-level credits in their first year. These metrics focus colleges on reforms to new student advising, academic planning, and scheduling that help ensure that students are—from the start—making timely progress toward program completion.
• Gateway course momentum metrics: Rates at which students take and pass college-level math and English courses in their first year. These metrics discourage colleges from relying on long sequences of prerequisite remediation courses, which too often fail to build students’ skills for college, and instead encourage them to integrate and contextualize academic support into college-level courses, an approach for which there is a growing body of evidence (see Ganga, Mazzariello, & Edgecombe, 2018).
• Persistence momentum metric: Rate at which students are retained from the first to the second term. This metric encourages colleges to examine why so many students stop out before the end of the first term and to implement practices that help students to persist into the second term and beyond.
EMMs Used in the Current Analysis
Credit Momentum• Completed 6 or more college-level credits in
the first semester (6 credits S1)• Completed 12 or more college-level credits in
the first semester (12 credits S1)• Completed 15 or more college-level credits in
the first year (15 credits Y1)• Completed 24 or more college-level credits in
the first year (24 credits Y1)• Completed 30 or more college-level credits in
the first year (30 credits Y1)
Gateway Course Momentum• Completed college-level English in the first
year (English Y1)• Completed college-level math in the first year
(Math Y1)• Completed both college-level English and
math in the first year (English & math Y1)
Persistence Momentum• Fall to spring persistence in the first year
(Persist S1 S2)

3
EARLY MOMENTUM METRICS | CCRC RESEARCH BRIEF | JULY 2019
Student success can be measured in different ways. In this analysis, we use two measures that define student success in terms of credential completion: (1) completion of any community college award (including associate degrees and certificates) within three years of starting at the community college, and (2) completion of any award (including bachelor’s degrees) from any postsecondary institution (using matched data from the National Student Clearinghouse) within six years of starting at the community college. These measures capture the direct effectiveness of community colleges and how well these colleges prepare students for baccalaureate programs. Furthermore, given the potential role of EMMs as leading indicators of whether or not equity gaps will close in the longer term, we report analyses for two combined racial/ethnic subgroups of students to examine whether we find evidence that EMM attainment is predictive of longer-term success for these groups. We chose the first subgroup, Black/African American students and Hispanic/Latino students combined, as a proxy for historically underrepresented minority (URM) students, and the second subgroup, Asian students and White students combined, as a proxy for non-URM students.1
Overall, for cohorts of community college students and for student racial/ethnic subgroups, we investigate:
• How many students meet each EMM?
• How strong are associations between EMMs and student success?
• What are predicted outcomes if more students were to meet each EMM?
Data From Three Community College SystemsWe use data from all community colleges across three anonymous state systems (X, Y, and Z). The dataset is composed of student transcripts, which include information on all postsecondary remedial and college-level courses taken and all credentials earned at each community college, as well as data on transfer and four-year degree completion. Transcripts also include student demographic (but not high school performance) information. The sample students are first-time entrants in 2010-12 at all colleges in the three state community college systems; these students are followed for up to six years after first enrollment. In total, the sample includes over 500,000 students across more than 75 colleges.
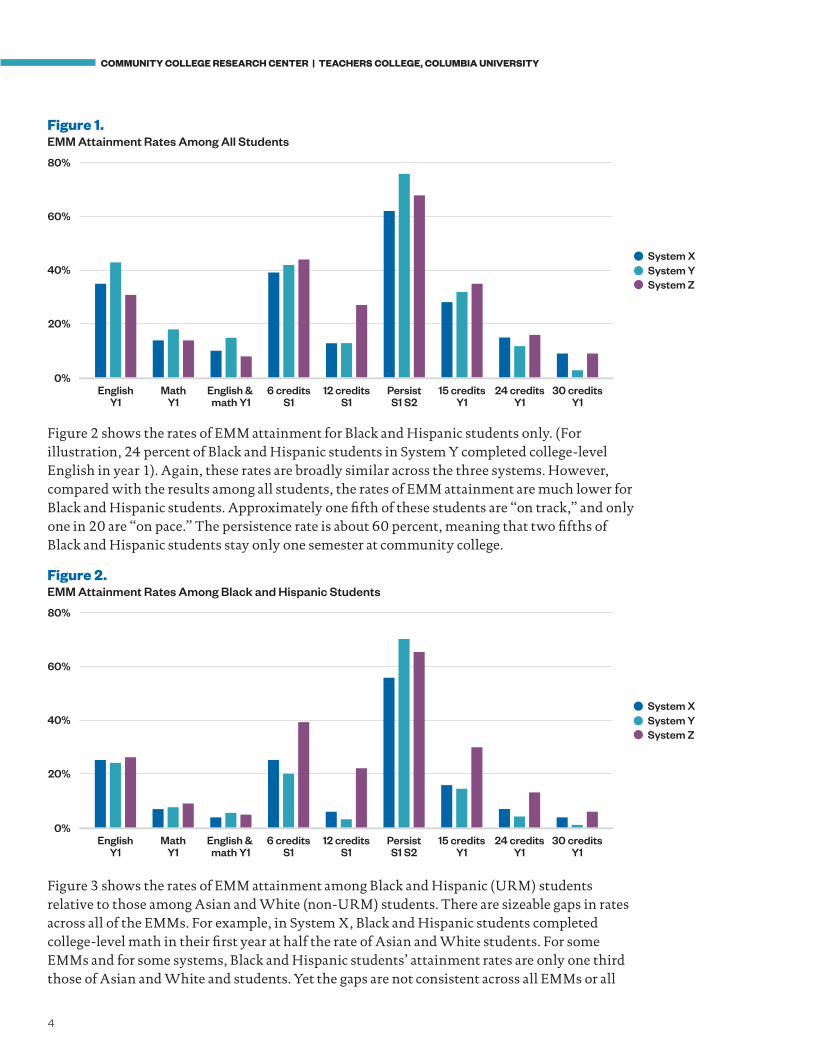
EMM Attainment RatesFigure 1 shows the rates of EMM attainment across each college system. (For illustration, 43 percent of students in System Y completed college-level English in year 1.) Interestingly, these attainment rates are very similar across the three systems. With the exception of the persistence EMM, far fewer than half of all students are “on track” in the sense that they have met any EMM. Roughly, about one in ten students are “on pace” in the sense that they have passed math and English gateway courses, or earned 12 credits in their first semester or 30 credits in their first year. Even in terms of persistence, the attainment rates are far from ideal—about one third of students do not persist from their first to second semester.
4
COMMUNITY COLLEGE RESEARCH CENTER | TEACHERS COLLEGE, COLUMBIA UNIVERSITY
System Z
System XSystem Y
EnglishY1
20%
0%
40%
60%
80%
MathY1
English & math Y1
6 creditsS1
12 creditsS1
PersistS1 S2
15 creditsY1
24 creditsY1
30 creditsY1
Figure 1.EMM Attainment Rates Among All Students
Figure 2 shows the rates of EMM attainment for Black and Hispanic students only. (For illustration, 24 percent of Black and Hispanic students in System Y completed college-level English in year 1). Again, these rates are broadly similar across the three systems. However, compared with the results among all students, the rates of EMM attainment are much lower for Black and Hispanic students. Approximately one fifth of these students are “on track,” and only one in 20 are “on pace.” The persistence rate is about 60 percent, meaning that two fifths of Black and Hispanic students stay only one semester at community college.
System Z
System XSystem Y
EnglishY1
MathY1
English & math Y1
6 creditsS1
12 creditsS1
PersistS1 S2
15 creditsY1
24 creditsY1
30 creditsY1
20%
40%
60%
80%
0%
Figure 2.EMM Attainment Rates Among Black and Hispanic Students
Figure 3 shows the rates of EMM attainment among Black and Hispanic (URM) students relative to those among Asian and White (non-URM) students. There are sizeable gaps in rates across all of the EMMs. For example, in System X, Black and Hispanic students completed college-level math in their first year at half the rate of Asian and White students. For some EMMs and for some systems, Black and Hispanic students’ attainment rates are only one third those of Asian and White and students. Yet the gaps are not consistent across all EMMs or all

5
EARLY MOMENTUM METRICS | CCRC RESEARCH BRIEF | JULY 2019
state systems. For example, for the EMM on earning 12 credits in the first semester, the relative rates of URM to non-URM attainment in Systems X, Y, and Z are 48 percent, 24 percent, and 80 percent, respectively. Hence, a range of different improvements may be needed in order for college systems to close gaps.
System Z
System XSystem Y
EnglishY1
MathY1
English & math Y1
6 creditsS1
12 creditsS1
PersistS1 S2
15 creditsY1
24 creditsY1
30 creditsY1
20%
40%
60%
80%
100%
0%
Figure 3.EMM Attainment Rates: Relative Rates of URM to Non-URM Students
EMMs and Student SuccessToo few students succeed in college. Consistent with national figures, the three state systems report successful completion for substantially fewer than half of all students. Systems X, Y, and Z had three-year community college completion rates of 28, 20, and 25 percent, respectively. (These rates include completion of any community college degree or certificate, denoted as CC Award.) Tracking students’ attainment of any degree or certificate (including four-year degrees, denoted as Any Award) for six years, Systems X, Y, and Z had completion rates of 32, 22, and 30 percent, respectively. We focus on how well EMMs predict these success rates.
We estimate student success rates (three- and six-year completion rates, as described above) among those students who meet each EMM, controlling for other factors. These rates are adjusted from logit and propensity score matching estimators that account for student characteristics (gender, race/ethnicity, residence, intent, and socioeconomic status, as well as college, semester-entry, and year indicators). The estimates reported here are averages across sets of comparisons between students who meet each EMM and five different samples of students who do not meet the respective EMM. These five comparison samples are: all students, students who took English and math in their first year, students who ever took English and math, students who were designated college-ready in English, and students who were designated college-ready in math. The baseline rates indicate the average actual success rates for all students. For each estimate, we compare the success rate for students who meet the EMM against the baseline success rate.

6
COMMUNITY COLLEGE RESEARCH CENTER | TEACHERS COLLEGE, COLUMBIA UNIVERSITY
Adjusted three-year CC Award rates are shown in Figure 4. These success rates are estimated for students who meet each EMM, controlling for student characteristics. (For example, controlling for student characteristics, 50 percent of students who earned 15 college-level credits in their first year completed a CC Award within three years [compared to the baseline rate of 28 percent] in System X.)
System Z
System XSystem Y
English Math English & math
6 creditsS1
12 creditsS1
PersistS1 S2
15 creditsY1
24 creditsY1
30 creditsY1
Baseline
20%
40%
60%
80%
0%
Figure 4.Three-Year CC Award Rates Among EMM Attainment Students
Figure 5 shows the respective estimates for students who meet each EMM for Any Award. (For example, controlling for student characteristics, 61 percent of students who completed 15 college-level credits in the first year completed Any Award within six years [compared to the baseline rate of 32 percent] in System X).
System Z
System XSystem Y
English Math English & math
6 creditsS1
12 creditsS1
PersistS1 S2
15 creditsY1
24 creditsY1
30 creditsY1
Baseline
20%
40%
60%
80%
0%
Figure 5.Six-Year Any Award Rates Among EMM Attainment Students
Students who meet EMMs have substantially higher award rates. Broadly, the results are robust and consistent across methods, samples, and state systems. The magnitudes are very large, with most rates increasing over baseline rates by at least a factor of 0.5 and up to a factor of 3. And

7
EARLY MOMENTUM METRICS | CCRC RESEARCH BRIEF | JULY 2019
the effects across EMMs are incremental: Meeting a “stricter” EMM is associated with a greater increase in award rates.
The corresponding estimates of success for Black and Hispanic students combined are given in Figures 6 and 7. These results too are robust and consistent across methods, samples, and state systems. They show that Black and Hispanic students who meet EMMs have substantially higher CC Award and Any Award rates. The magnitudes are very large, and the effects are again incremental across EMMs. The similarity of these estimates to those of the full sample is important in light of the low EMM attainment rates generally. If Black and Hispanic students meet the EMMs, the estimated increase in their chances of completing an award are of a similar magnitude as those for Asian and White students who meet the EMMs. Together, these findings imply that a promising approach to improving completion rates for Black and Hispanic students, as for other students, is to help them to start strong and gain early momentum, as measured here by the EMMs.
System Z
System XSystem Y
English Math English & math
6 creditsS1
12 creditsS1
PersistS1 S2
15 creditsY1
24 creditsY1
30 creditsY1
Baseline
20%
40%
60%
80%
0%
Figure 6.Three-Year CC Award Rates Among Black and Hispanic EMM Attainment Students
System Z
System XSystem Y
English Math English & math
6 creditsS1
12 creditsS1
PersistS1 S2
15 creditsY1
24 creditsY1
30 creditsY1
Baseline
20%
40%
60%
80%
0%
Figure 7.Six-Year Any Award Rates Among Black and Hispanic EMM Attainment Students

8
COMMUNITY COLLEGE RESEARCH CENTER | TEACHERS COLLEGE, COLUMBIA UNIVERSITY
Overall, students who meet EMMs are more successful, controlling for characteristics such as race/ethnicity, gender, and socioeconomic status. The key issue is the rate of EMM attainment by students in the first year (not how students perform later in college). Thus, getting students to meet EMMs should boost success.
Moreover, each type of EMM has independent—additive—effects. For example, students who complete gateway math or pass 15 credits in year 1 have greater success than students who do not meet these EMMs, but students who complete gateway math and pass 15 credits in year 1 have even greater success.
Simulated Outcomes for Meeting EMM TargetsThe predictive relationships can be used to model what would happen to longer-term success if more students met each EMM. To illustrate, we estimate predicted completion rates if 50 percent more students meet each EMM. (For example, the gateway math EMM rate might increase from 10 to 15 percent, with all other EMM rates fixed. We do not simulate effects for persistence, as rates already exceed 50 percent.) These simulations require two key assumptions to keep in mind while interpreting results: (1) We assume that many more students will meet each EMM, and (2) we assume that the additional students meeting each EMM will complete college credentials at the same rate as the relatively smaller group of students meeting the EMM historically. Thus, these simulations are approximate—they illustrate the potential magnitude of change for substantially increasing EMM attainment.
The simulation results for CC Award are shown in Figure 8. (For example, the CC Award rate is predicted to increase by approximately 5 percentage points in System Y if 50 percent more students completed 15 college-level credits in their first year.) If 50 percent more students met a particular EMM, the CC Award rates would increase by at least 1 percentage point, on average 3 percentage points, and as high as 5 percentage points. Given baseline CC Award rates of 20–28 percent, these are significant changes in college-level outcomes.
System Z
System XSystem Y
EnglishY1
MathY1
English & math Y1
6 creditsS1
12 creditsS1
15 creditsY1
24 creditsY1
30 creditsY1
2 pp
4 pp
6 pp
0 pp
Figure 8.Predicted Percentage Point Increase in Three-Year CC Award Rate If EMM Attainment Rate Increased by 50 Percent

9
EARLY MOMENTUM METRICS | CCRC RESEARCH BRIEF | JULY 2019
The simulation results for Any Award are shown in Figure 9. (For example, the Any Award completion rate is predicted to increase approximately 6 percentage points in System Y if 50 percent more students completed 15 college-level credits in the first year.) If 50 percent more students met a particular EMM, the Any Award rate would be approximately 3 percentage points higher on average. Again, these results suggest that if EMM rates increased by 50 percent, we might expect substantial improvements in college-level outcomes.
System Z
System XSystem Y
EnglishY1
MathY1
English & math Y1
6 creditsS1
12 creditsS1
15 creditsY1
24 creditsY1
30 creditsY1
2 pp
4 pp
6 pp
0 pp
Figure 9.Predicted Percentage Point Increase in Six-Year Any Award Rate If EMM Attainment Rate Increased by 50 Percent
An alternative approach is to look at what changes would be needed to increase the Any Award rate by 10 percentage points. (Again, these simulations are subject to the two assumptions noted above, and persistence is not modelled.) These changes are shown in Figure 10. (For example, in order to increase the Any Award rate by 10 percentage points, the percentage of System Z students completing 15 college-level credits in their first year would need to double, or increase by a factor of 2.) Looking at each EMM, to increase the Any Award rate by 10 percentage points would require significant increases in the rate of EMM attainment. For most EMMs, the rate of EMM attainment would need to double, holding the other EMM attainment rates constant. For the EMMs with the lowest rates of attainment (i.e., the “strictest” EMMs), such as passing both gateway English and math or completing 30 credits in the first year, the rate of EMM attainment would need to increase by a factor of about 4 or more. (While it might be reasonable to think that “stricter” EMMs should require less of a factor increase to yield the same increase in completion rates, our simulations suggest that the opposite is the case. Because these EMMs have much lower rates of attainment [such as 10 percent of the cohort] than other EMMs, they need to be increased substantially in these simulations to have an equal impact on completion rates.)

10
COMMUNITY COLLEGE RESEARCH CENTER | TEACHERS COLLEGE, COLUMBIA UNIVERSITY
System Z
System XSystem Y
EnglishY1
MathY1
English & math Y1
6 creditsS1
12 creditsS1
15 creditsY1
24 creditsY1
30 creditsY1
4.00
6.00
8.00
2.00
0.00
Figure 10.Factor Increase in EMM Attainment Rate Needed to Increase Six-Year Any Award Rate by 10 Percentage Points
Overall, higher attainment across any of the EMMs is expected to increase student outcomes. However, colleges face a trade-off in which students to target. For some EMMs, increasing attainment by 50 percent will affect few students; yet these students will then be much more likely to graduate. For other EMMs, increasing attainment by 50 percent will affect many students; yet these students will be only modestly more likely to graduate. Thus, some EMMs affect fewer students, but they do so strongly; other EMMs affect more students, but the average effect is relatively weak.
ConclusionOur investigation is motivated to validate leading indicators that colleges can track within students’ first year that strongly predict their eventual success and that colleges can therefore use to evaluate the likely longer-term effects of large-scale reforms. We examine nine early momentum metrics or EMMs that measure credit accumulation, gateway course completion, and persistence. These EMMs strongly predict completion rates at two- and four-year colleges. Our findings suggest that these EMMs are valid leading indicators of students’ future credential completion outcomes (at the starting institution or at another college).
However, too few students are currently “on track” or “on pace” with regard to these EMMs. This is the case for students generally and especially for Black and Hispanic students, for whom gaps in EMM attainment are very large. Encouragingly, we observe that the EMMs strongly predict longer-term completion rates not only for students generally but also for Black and Hispanic students, suggesting that college efforts to close racial equity gaps in early momentum represent a crucial step toward closing gaps in credential completion.
Community colleges have considerable scope for improving rates of EMM attainment and thereby promoting student success. To improve student success, colleges need to rethink how they teach and support students throughout their entire experience with the college. The findings from this brief highlight the importance of reforms to the early part of students’ experience. But even after meeting EMMs and thus making early progress, students still need to complete their programs. Hence, students need intensive guidance and academic support as

11
EARLY MOMENTUM METRICS | CCRC RESEARCH BRIEF | JULY 2019
they enter college and throughout their first year, but they also need sustained support and a clear path to completion.
Many community colleges across the country are implementing guided pathways (GP) reforms to improve their effectiveness in helping students gain early momentum and sustain that momentum through to completion. GP involves a set of organizational changes that transform how students navigate through programs of study to earn credentials (see Bailey et al., 2015). GP offers colleges a framework for reform that is both comprehensive (addressing each step in students’ educational journey at college) and holistic (engaging cross-functional units within college, like student/academic affairs, transfer/workforce programs, and credit/noncredit offerings).
Essential features of GP reforms align with our analysis of how meeting EMMs influence success. First, GP affects how students connect with and enter college: Passing gateway courses gets students started on a guided pathway. Second, GP involves significant changes to first-year advisement and supports to enable students to earn more credits: Accumulating credits early on moves students forward on a path to completion. Finally, reforms to teaching and learning in gateway courses (including math and English but also Biology 101, Accounting 101, and other introductory programmatic courses) are crucial to boosting other components of early momentum not explicitly addressed in this analysis, such as students’ aspirational or motivational momentum (Wang, 2017).
Colleges need information to determine how successful whole-college reforms like GP are likely to be in improving completion rates following full implementation. The credit, gateway course, and persistence EMMs described here meet this need—they are early, leading indicators that strongly predict student completion over a longer term. Furthermore, colleges are unlikely to close racial/ethnic and other equity gaps in longer-term completion rates if they do not first close these gaps in these leading indicators. By disaggregating subgroups and using EMMs as leading indicators, colleges can formatively assess what changes in practices are effective in the short term and are therefore likely to increase completion rates and close equity gaps in the longer term. Our analysis suggests that colleges that are able to implement practices that increase attainment of these EMMs are likely to see improved completion rates over the longer term.
Endnotes1. Our use of these two categories—historically underrepresented minority (URM) students
and non-URM students—is imprecise in that students from racial/ethnic groups other than the ones we include may be considered URM students and that persons from some Asian populations, such as Vietnamese, may be more aptly described as URM than non-URM students.
Colleges need information to determine how successful whole-college reforms are likely to be in improving completion rates following full implementation. The credit, gateway course, and persistence EMMs described here meet this need—they are early, leading indicators that strongly predict student completion.
Community College Research Center
Teachers College, Columbia University
525 West 120th Street, Box 174
New York, New York 10027
212.678.3091
@CommunityCCRC
ccrc.tc.columbia.edu
ReferencesAdelman, C. (1999). Answers in the toolbox: Academic intensity, attendance patterns, and bachelor’s degree attainment. Washington, DC: U.S. Department of Education.
Adelman, C. (2006). The toolbox revisited: Paths to degree completion from high school through college. Washington, DC: U.S. Department of Education.
Attewell, P., Heil, S., & Reisel, L. (2012). What is academic momentum? And does it matter? Educational Evaluation and Policy Analysis, 34(1), 27– 44. doi: 10.3102/0162373711421958
Bailey, T. R., Jaggars, S. S., & Jenkins, D. (2015). Redesigning America’s community colleges: A clearer path to student success. Cambridge, MA: Harvard University Press.
Ganga, E., Mazzariello, A., & Edgecombe, N. (2018). Developmental education: An introduction for policymakers. Denver, CO: Education Commission of the States.
Jenkins, D., & Bailey, T. (2017). Early momentum metrics: Why they matter for college improvement (CCRC Brief No. 65). New York, NY: Columbia University, Teachers College, Community College Research Center.
Jenkins, D., Lahr, H., Fink, J., & Ganga, E. (2018). What we are learning about guided pathways. Part 3: Timeline and tips for implementing pathways reforms. New York, NY: Columbia University, Teachers College, Community College Research Center.
Wang, X. (2017). Toward a holistic theoretical model of momentum for community college student success. In M. B. Paulsen (Ed.), Higher education: Handbook of theory and research (pp. 259–308). New York, NY: Springer.
Funding for this research was provided by the Bill & Melinda Gates Foundation. We are grateful to the community college systems for sharing the data used in this analysis.