Embed Size (px)
Citation preview

Community Assessment Report
Lexington-Fayette County Health Department
April 2012

Community Assessment Report Page 2
OVERVIEW
This document is a compilation of all of the community assessment information that has been compiled
at the Lexington-Fayette County Health Department and will serve as the foundation for the community
health improvement plan for the Lexington-Fayette County area.
The assessments include:
1) Themes and Strengths Assessment, compiled June 2011 (pages 2-3; Appendix A pages 25-35)
2) Local Public Health Performance Assessment, compiled July 2011 (page 4; Appendix B pages 36-63)
3) Forces of Change Assessment, compiled June 2011 (pages 4-8)
4) Focus Group Assessment, compiled January 2010 (pages 8-19; Appendices C & D pages 64-67)
5) Community Health Status Report, compiled 2011 (pages 19-22)
6) Community Resources and Assets, compiled 2012 (pages 23-24)
THEMES AND STRENGTHS ASSESSMENT
Objectives: The objective of this study was to identify the community’s opinion about 10 important
health, social, and environmental issues in Fayette County. Furthermore, the study results articulated
specific needs related to health insurance and quality of life of Fayette County residents.
Methods: A random sample of 6000 households was selected. Disproportionate stratified sampling
was applied to three strata to control the number of minority households in the sample. Under this
design, there were 2000 Hispanics (33%), 1000 African Americans (16.6%), and 3000 White households
(50%) in the total sample. Surveys with cover letters were mailed to 6000 households in Fayette County
on June 17, 2010. The cover letter was provided in English and Spanish to accommodate for the
language barrier among Hispanic population. Postcard reminders about the survey were sent to the
households on July 6, 2010.
Results: A total of 1228 completed surveys were obtained providing an overall response rate of 20.4%
and a margin error of +/- 2.8 at the 95% confidence level. Unemployment, drug and alcohol abuse,
health care costs, obesity, and safe neighborhoods were identified as important issues by the majority
of survey respondents. Similarly, littering, energy efficiency, clean drinking water, recycling, and flood
drainage problems were identified as important environmental issues by the majority of survey
respondents. About 15.4% of survey respondents reported being uninsured, whereas 46.4% and 57.7%
reported being without dental and vision insurance. Only 3.7% survey respondents reported poor
health status. About 21% of respondents were 65 or older and 40% of respondents were between the
ages of 45-64 years. About 32.1 % respondents were between ages of 25-44 years. In terms of gender
distribution, 26.2 % of survey respondents were male and 70% were female. About 74.1% of the survey

Community Assessment Report
respondents were White, 17.5% were Black
Hispanic. In terms of household income distribution, 13.8 % reported income
27.4% reported household income between $10,000 and
Conclusion: This assessment provides a wealth of data about the opinions of Fayette County residents
about various health, social, and environmental issues in Fayette County.
Fayette County residents reported excellent or good health status
about 13.3% survey respondents reported being uninsured. Moreover, 46.4% and 57.7% of survey
respondents reported no dental and vision insurance.
Recommendations/Next Step: These survey results can be used to strengthen ad
stakeholder engagement in the community
conducted five focus groups with targeted community residents in October and November 2010 to
determine the issues that residents feel are most impor
participants were asked to discuss what they see as their main issues and concerns before exploring the
primary themes. They were asked to prioritize issues and concerns and were given the opportunity to
offer suggestions for how concerns could be most effectively addressed.
Health Department shared the results of this survey with other community stakeholders at
in June 2011. A local public health system assessment was conduc
the many agencies within a local public health system are collectively performing based on elements of
the 10 Essential Public Health Services. The data from this survey and qualitative data from f
were reviewed with other stakeholders at a meeting for local public health system assessment. In
fall of 2011, the Lexington Fayette County Health Departmen
community members and community stakeholders to develop goals
identified by community members in the survey and five focus groups. During this retreat, the
participants identified potential strategies for achieving each goal and for achieving the community
vision.
More detailed frequency data and graphical representations of the survey findings can be found in
Appendix A (pages 23-33).
ite, 17.5% were Black, 2.1% were Asian or Pacific Islander, and about 2.5% were
Hispanic. In terms of household income distribution, 13.8 % reported income of less than
ome between $10,000 and $34,999.
is assessment provides a wealth of data about the opinions of Fayette County residents
about various health, social, and environmental issues in Fayette County. By and large, the majority of
Fayette County residents reported excellent or good health status and insurance coverage. However,
about 13.3% survey respondents reported being uninsured. Moreover, 46.4% and 57.7% of survey
respondents reported no dental and vision insurance.
These survey results can be used to strengthen advocacy efforts and
stakeholder engagement in the community. The Lexington Fayette County Health Department
conducted five focus groups with targeted community residents in October and November 2010 to
determine the issues that residents feel are most important to their community. The focus groups
were asked to discuss what they see as their main issues and concerns before exploring the
primary themes. They were asked to prioritize issues and concerns and were given the opportunity to
estions for how concerns could be most effectively addressed. The Lexington
Health Department shared the results of this survey with other community stakeholders at
A local public health system assessment was conducted in June 2011 to evaluate how well
the many agencies within a local public health system are collectively performing based on elements of
the 10 Essential Public Health Services. The data from this survey and qualitative data from f
other stakeholders at a meeting for local public health system assessment. In
Lexington Fayette County Health Department conducted a one day retreat with selected
community members and community stakeholders to develop goals related to community issues
identified by community members in the survey and five focus groups. During this retreat, the
potential strategies for achieving each goal and for achieving the community
data and graphical representations of the survey findings can be found in
Page 3
2.1% were Asian or Pacific Islander, and about 2.5% were
of less than $10,000 and
is assessment provides a wealth of data about the opinions of Fayette County residents
By and large, the majority of
and insurance coverage. However,
about 13.3% survey respondents reported being uninsured. Moreover, 46.4% and 57.7% of survey
vocacy efforts and
The Lexington Fayette County Health Department
conducted five focus groups with targeted community residents in October and November 2010 to
tant to their community. The focus groups
were asked to discuss what they see as their main issues and concerns before exploring the
primary themes. They were asked to prioritize issues and concerns and were given the opportunity to
The Lexington-Fayette County
Health Department shared the results of this survey with other community stakeholders at a retreat
ted in June 2011 to evaluate how well
the many agencies within a local public health system are collectively performing based on elements of
the 10 Essential Public Health Services. The data from this survey and qualitative data from focus groups
other stakeholders at a meeting for local public health system assessment. In the
a one day retreat with selected
related to community issues
identified by community members in the survey and five focus groups. During this retreat, the
potential strategies for achieving each goal and for achieving the community
data and graphical representations of the survey findings can be found in

Community Assessment Report Page 4
LOCAL PUBLIC HEALTH PERFORMANCE ASSESSMENT
The National Public Health Performance Standards Program (NPHPSP) provides a framework with which
to assess the performance and activities of local public health departments. The Lexington Fayette
County Health Department utilized the criteria put forth by the NPHPSP to assess its own processes and
activities. A full summary of the results from the performance assessment can be found in Appendix B
(pages 34-61).
FORCES OF CHANGE ASSESSMENT
The findings from this assessment were organized into 8 categories that are summarized in tables
below. The tables focus on the following categories: 1) Demographics, 2) Economics, 3) Environment,
4) Health Care, 5) Housing, 6) Infrastructure, 7) Social Issues, and 8) Public Health System.

Community Assessment Report Page 5
Demographics
Trends, Factors, Events Threats Opportunities
Aging Population Limited Services for Seniors Services for Aging Population
War Veterans Soldiers returning with
injuries
Services of war veterans
Population Increasing More demand of employment Train skilled workforce
University student population Not enough job placements at
local level
Highly educated workforce
Migrant Workers Limited health care and social
services
Improve health and social
services
Homeless population Deficient mental health
services
Improve mental and other
social support services
Highly educated population Challenges to match skilled
workforce with jobs
Stable economy
Diverse population Initial hardship for new
immigrants to adjust in new
culture
Need for Diverse services
Increase in poverty Need for more services Efficient use of existing
services
Economics
Trends, Factors, Events Threats Opportunities
Funding cuts Limited funding resources Use existing resources efficiently
Unemployment Increase need for services • Use existing resources
efficiently
• Job market for
professionals
World Equestrian Games 2010 none New infrastructure for local
economy
High gas prices Squeezed budgets for individuals
and community organizations
Better public transportation
infrastructure
Horse industry Services for migrant workers in
horse industry
Improved economy
Slow and steady stable local
economy
none No excuse for limited resources
to invest in our community

Community Assessment Report Page 6
Environment
Trends, Factors, Events Threats Opportunities
High carbon dioxide print due to
low cost of utilities
Health and environmental issues Raise awareness about
environment conservation
Health Care
Trends, Factors, Events Threats Opportunities
Health care services Limited mental health services Collaborate to improve
availability of mental health
services
High health care costs Poor health status of community
residents
Improves access to health care
Increase in chronic diseases • Increase in health care
services
• Poor health status
• Jobs in health care
sector
• Improve health related
screening for early
intervention
• Health promotion
Federal Money for health care
facilities
None identified Build/expand community health
centers
Health care reform None Identified Improve health care access
Increase demand for health care
services
Limited resources Seek funding resources to
improve health care access
Increase health care costs and
increase in number of uninsured
Citizens not seeking health care
services on timely manner
Improve access to health care
Increase in obesity rates More chronic diseases down the
road
Health promotion
Housing
Trends, Factors, Events Threats Opportunities
High Rents and foreclosures Limited affordable housing Make housing affordable
Community Assessment Report Page 7
Infrastructure
Trends, Factors, Events Threats Opportunities
Geographical proximity to
interstates, airports
Emerging infectious diseases • Infectious disease
• surveillance a improved
economy
Newtown Pike expansion None identified Better services in North end of
Lexington
Limited access to public
transportation
High energy costs for citizens
Improve public transportation
Intersections I-64 and I-75 None identified Connects Lexington to other
cities
Technology Digital divide for poor
population
New ways to communicate with
community residents
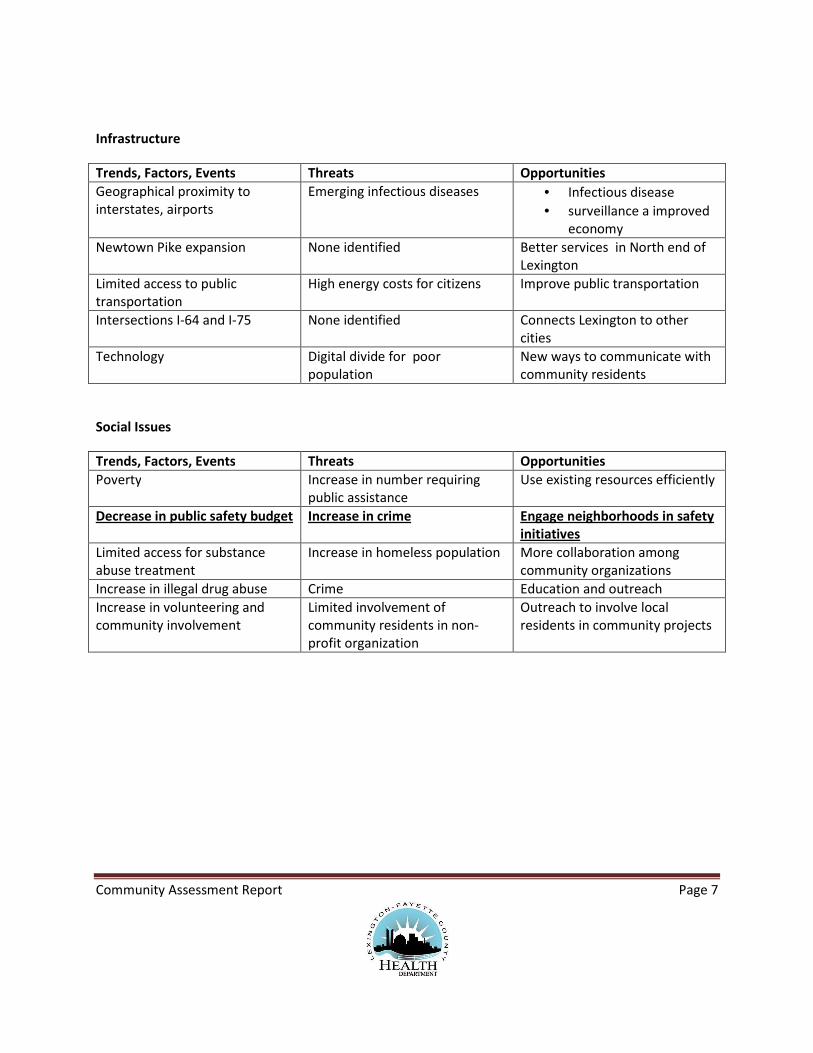
Social Issues
Trends, Factors, Events Threats Opportunities
Poverty Increase in number requiring
public assistance
Use existing resources efficiently
Decrease in public safety budget Increase in crime Engage neighborhoods in safety
initiatives
Limited access for substance
abuse treatment
Increase in homeless population More collaboration among
community organizations
Increase in illegal drug abuse Crime Education and outreach
Increase in volunteering and
community involvement
Limited involvement of
community residents in non-
profit organization
Outreach to involve local
residents in community projects

Community Assessment Report Page 8
Public Health System
Trends, Factors, Events Threats Opportunities
Weather related emergencies Community not prepared for
weather related emergency
Organize for weather related
emergency preparation
Budget cuts Dwindling public health services Collaborate to use existing
resources efficiently
Smoking ban None identified Highlight positive outcomes
related to smoking ban
Low Health literacy Local population not educated
about resources related health
care access and prescription
drug
Educate low population about
different resources
Increase in Sexually Transmitted
Diseases
Increase demand for services Health education and outreach
Increase in global travel Threat of emerging infectious
diseases
Better surveillance
Chronic diseases Increase in health care services Health promotion
Diverse and rich institutions Not enough collaboration Collaborative partnerships
FOCUS GROUP ASSESSMENT
Three focus groups were conducted across the Lexington Fayette County area during the timeframe of
October 16 through November 1, 2010. Willing participants were recruited in collaboration with the
neighborhood associations and Hispanic population advocates in Fayette County. All focus group
participants were: 1) Winburn, Central Parkway, or Cardinal Valley area residents, 2) African Americans
or Hispanics, 3) low-income households. A total 77 adults participated in these focus groups.
Questions were developed and used to provide a framework for the discussion, but the focus groups
were designed to encourage participants to identify the issues important to their communities. The
full report contains the themes generated from a broad discussion of issues, concerns, and solutions to
the issues identified in Fayette County 2010 Survey.
People politely and thoughtfully answered the questions, although they were more inclined to talk
about the issues they considered to be most significant in their communities. See Appendix C (page 62)
for the list of questions that were posed to the focus groups. The following is a summary of the
themes that participants identified during the focus group process.

Community Assessment Report Page 9
The focus group participants also completed a brief survey about health department services. See
Appendix D (pages 63-65) for the results of this survey. The focus group participants were given $20
Wal-Mart Gift cards for their participation. The Health Equity team of Lexington Fayette County Health
Department will develop goals and action items to address the issues highlighted during the focus
groups.
Issues and Concerns in Winburn Area (African American Population)
The questions were developed about three important issues in focus group participants’ neighborhood.
The issue of drugs and safety was identified as number one issue by two focus groups. Seniors, health
issues and trash were some other issues highlighted by one other focus group.
Drugs & Safety
In every focus group and from every one of the participants there was unanimous viewpoint that drug
use is an important issue of concern in their neighborhood. Youth of neighborhood walks openly in
neighborhood with open alcohol containers and throw empty containers in neighborhood yards. Almost
all age groups are involved in drugs. There is lot traffic of strangers in cars on neighborhood streets. Very
often the Winburn area residents see youth (men) driving too fast in the neighborhood with loud music
in cars. Also, youth are sitting idly in the corners and becoming troublemakers. There is buying and
selling of drugs at Green Acres Park. People in the neighborhood are scared to call police for drug
related offences due to retaliation from trouble makers.
Seniors
In Green Acres area, lots of seniors live with family members instead of nursing homes. Seniors are also
vulnerable to violence because of their prescription drugs in this neighborhood. A lot of seniors are
unable to take care of their houses because of aging. Seniors are prone to extreme cold and hot weather
because their homes are not well insulated.
Chronic Health Issues
Residents of Green Acres were curious to compare the cancer incidence and mortality rate of this area
with the rest of Fayette County. Also, residents wanted an organization to conduct a study see if
environmental factors (mainly related to Lexmark) play any role in high incidence of cancer in this
neighborhood. Majority of participants in this focus group believed that cancer incidence in their
neighborhood is high compared to rest of the Fayette County. The focus group participants also wanted
to get information on coronary heart diseases, strokes, diabetes, high cholesterol, high blood pressure,
dental care, and cancer. Majority of people wanted to address the obesity issue in their neighborhood
through healthy cooking and physical activity.

Community Assessment Report Page 10
Trash
In Winburn area, trash is a big problem on the streets. Participants specifically mentioned that trash
containers are disposed openly on streets and parks. McDonald cups are dumped on streets. There is
trash spilled near apartment complexes. The trash collectors drop trash on streets on pick up day. Junk
collectors are also responsible for spilling trash out of trashcans.
Suggested Solutions for Issues and Concerns in Winburn Area (African-Americans)
Drug and Safety
Most participants in this focus suggested improving the neighborhood watch and increasing the police
patrol in this neighborhood. The suggestions included: neighbors should look for one another, know
each other, and get together more often. The group suggested offering English classes for Hispanic
population so that two groups (African Americans and Hispanics) can communicate with each other and
addresses the misconceptions about these two ethnic groups. Participants from Green Acres suggested
putting speed bumps on Hollowcreek and Asbury to reduce the speed of fast moving cars in this
neighborhood. Also, recommended to place big STOP sign at the entrance of shopping plaza center on
Russell Cave Road to avoid accidents. Safe place signs should be placed on houses and businesses in
the neighborhoods.
In order to address the issue of drug use among youth the participants suggested that local community
should provide positive activities for youth through role models in the community. One participant
suggested that football and basketball players from University of Kentucky should provide mentorship
for youth in this neighborhood. The participants recommended job training and job fairs for youth in this
community.
Seniors
The participants recommended neighborhood watch to address issue of safety among seniors. The
community organizations and churches should provide more social activities for seniors. The local
organizations also need to do more outreach about resources for seniors. Seniors in this neighborhood
need weatherization assistance programs.
Chronic Health Issues
The health departments and other hospitals should set up free clinic in this neighborhood once a month.
Furthermore, the neighborhood population needs to learn about healthy eating for African-American
population through cooking classes. The local organizations should partner with local churches to
provide more social and physical activities for children in this area. The community needs more
information on health care resources that are available for low-income population. A health fair should

Community Assessment Report Page 11
be organized in this neighborhood to provide more information on coronary heart diseases, diabetes,
strokes, high cholesterol, high blood pressure, dental care, and cancer.
Trash
Participants in two focus groups mentioned that there is lot trash on the streets in this neighborhood.
Most people buy products from local businesses and throw trash outside on the streets. The stores
should hire somebody to clean up trash outside of the stores. There is also spilled trash near apartment
complexes. The apartment management should have somebody to clean up trash spilled near the
apartment buildings. The neighborhood should organize a neighborhood cleanup day.
Issues and Concerns in Winburn Area (Hispanic Population)
The focus group participants were asked to discuss three important issues in their community. The
participants listed safety and security, housing and trash as three issues of concern in their
neighborhood.
Safety & Security
Most people in the focus group reported about group of young people trespassing private properties,
stealing, and vandalizing cars in their neighborhood. The group also mentioned that some people in the
community have reported to the police but most people are scared to call police because of their
immigration status. Furthermore, there are safety concerns on roads because people drive cars through
the neighborhood streets at very high speed. Most drivers ignore stop sighs and this creates a hazard for
children who are walking on the streets. Also, there is loud music from parties creating noise pollution in
the neighborhood.
Housing
Almost all group members voiced concerns about their housing conditions. Cockroaches, bedbugs,
humidity, poor or missing insulations are problems that everybody living in apartments is
experiencing in this neighborhood. In some apartments, basements are littered with garbage and thus
creating breeding ground for cockroaches. Many residents of these apartment complexes are afraid to
notify their apartment landlords because of fear of consequences related to their illegal immigration
status. Furthermore, many residents are spraying toxic chemicals in their apartments to get rid of
bedbugs and cockroaches. Many are afraid these chemicals can harm their children. Many residents
have also experienced problems with maintenance services and housing contracts.

Community Assessment Report Page 12
Trash
There is trash in hallways, common areas, and parking lots of apartment complexes. The apartment
complexes are without any trash services/trash bins. Therefore, some residents throw beer bottles on
the ground. All this is creating a safety hazard for young children. Also, the trash attracts insects and
pets.
Suggested Solutions for Issues and Concerns in Winburn Area (Hispanics)
Safety and Security
Group members believe that they need more lights in streets and parking lots near the apartments.
The participants want increased police surveillance on continuing basis for their neighborhood. Group
members want the police and other local organizations to encourage Hispanic population to call the
police about safety concerns. Most people in the neighborhood are afraid to call police because of their
illegal immigration status. Furthermore, the group wants to address the issue of language barrier in this
neighborhood. Most members of this community only speak Spanish. English classes and bilingual
representatives can address concerns of language barrier for this community.
Housing
The community members want their housing contracts in Spanish for clarification. Most landlords are
not addressing the complaints because people are unable to understand their lease contracts in English.
The Hispanic population in this community should be able to contact bilingual representatives to
address outstanding issues related to housing contracts. The community wants fumigation of all
apartments at same time instead of one apartment at a time to address issue of pest control.
Furthermore, the owners of these apartments should be required to provide maintenance for
apartment complexes.
Trash
The community needs more maintenance workers in this neighborhood. The children and adults in
neighborhood should be educated about keeping the living areas neat and clean. The maintenance staff
of apartment complexes should post notice around apartments about no littering and related fines of
those who don’t follow the rules. The apartment owners and health department should conduct an
educational campaign to educate community members about no littering.

Community Assessment Report Page 13
Issues and Concerns in Central Parkway Area
Safety
There are no cross-guards at the junction of Central Parkway and Appian Way. Many students of
schools in this area cross streets at this junction. The students are vulnerable to traffic accidents very
early in the morning in this area.
Unattended Children
Children run unattended in this neighborhood. It is a safety hazard for drivers and children.
Neighborhood Safety
Neighbors in this neighborhood don’t know what is going in their community. Neighborhood residents
are not aware of crimes taking place in their community
Suggested Solutions for Issues and Concerns in Central Parkway Area
Safety
The councilman from this neighborhood should be involved in addressing cross-guards placement
near schools in Central Parkway area. The neighborhood association should invite councilman to
neighborhood meeting to propose solution for this problem.
Unattended Children
Parents need to aware of activities for children. There should be after school programs for children. The
summer camps in summer should start 8 a.m. so that working parents can take benefit of this program
for their children. Their Gainesway Empowerment Center needs to additional staff.
Neighborhood Safety
The neighborhood association only allows home owners to participate in neighborhood association
monthly meetings. Everybody who lives in Central Parkway area should be able to become member of
Central Parkway Neighborhood Association. Community members need to make each other aware of
crime in this neighborhood. The community needs to work with schools and community to fix problems
in Central Parkway neighborhood. There should be a neighborhood watch in the Central Parkway area.

Community Assessment Report Page 14
Issues and Concerns in Cardinal Valley Area
Gangs
Gangs are big issue in Cardinal Valley area. Community is afraid of these gangs
Unemployment
This community needs more employment opportunities.
Healthcare Access
Healthcare access needed for people with limited resource. We need more health centers because
timely medical appointments are not available for uninsured individuals
Suggested Solutions for Issues and Concerns in Central Parkway Area
Gangs
Neighborhood watch is needed for Cardinal Valley area. Parents should set curfew times for youth
under the age of 18. Due to cultural issues Hispanic parents have limited ability to punish their children
in United States. They should be educated on how to communicate with their children effectively.
Unemployment
Allow undocumented workers work with special permits. Address language barriers among Hispanic
population.
Healthcare Access
More healthcare services are needed for uninsured adults and children. Raise taxes on tobacco and
alcohol to provide funds for these services. More primary care centers are needed to provide timely
medical appointments for low-income families.
Actions to Address Health & Social Issues in Fayette County
In June 2010, a survey was mailed to random sample of 6000 households in Fayette County. Total of
1214 completed surveys were obtained providing an overall response rate of 20.23% and a margin error
of +/- 2.8 at the 95% confidence level. Unemployment, drug and alcohol abuse, health care costs,
obesity and safe neighborhood were identified as important issues by majority of survey respondents.
The focus group participants were provided an opportunity to further explore these five issues revealed
in the survey.

Community Assessment Report Page 15
Unemployment
Most focus group members believe we need to train the youth with needed skills for job placement.
The community should be made aware of available resources for job training and job placement. The
Fayette County residents need more GED, CPR training, health safety, nursing assistant training classes.
Provide education sessions on how to get ready for job interviews. Youth from low-income
neighborhoods need reliable transportation to work in different neighborhoods. Fayette County need
more job fairs to match skilled labor with jobs. Specifically, neighborhood employers should be more
involved in job placement. The Fayette County government should apply for more grants to bring job
training services to Fayette County. The low-income neighborhood should have reliable public
transportation so that youth from this community commute for job in other areas of Fayette County.
Provide special permits for undocumented workers to work in Fayette County. Address language barrier
issue for Hispanic community
Drugs and Alcohol Abuse
Most group participants want the community leaders to discuss drug and alcohol abuse issues with the
community members in different neighborhoods. Furthermore, the community members within these
neighborhoods need to start a dialogue around these issues. Family education, after school activities for
adolescents can keep youth busy and thus prevent drug involvement. Most importantly address
unemployment issue to address the drug and alcohol abuse issue. These two issues are interconnected
because when people are unemployed and hopeless they are more prone to drug abuse. Furthermore,
police need to enforce existing laws to address the issue. Police patrol in vulnerable areas should not be
compromised during University of Kentucky football and basketball games.
Healthcare Costs
In every focus group and from each one of the participants, there was the unanimous viewpoint that
medical and related costs (especially prescription drugs) are too high. Affordable healthcare premiums
are must for this community. The community needs to be educated about health care services. For
example, there is perception in the community that primary care center of Lexington Fayette County
Health Department does not accept uninsured patients and all health insurances. The community
should be made aware of available health care resources in Fayette County. For example, many people
are unaware that they can get discounted prescription drugs form health department pharmacy and
pharmaceutical companies. The group discussed the complexity of health insurance policies and billing
payments. People in this community should be able understand what their financial obligations are for
medical services received from healthcare providers. Patients should be empowered to communicate
more with their health care providers. The group members mentioned that some people in our

Community Assessment Report Page 16
community are using emergency care due to high cost. The Hispanic populations should have access to
Spanish speaking translators, timely medical appointments, and assistance and promptness during the
phone calls to Lexington Fayette County Health Department primary care center.
Obesity
The participants reported that community should be educated about healthy eating and importance of
physical activity to address issue of obesity in our community. Specifically, we should have healthy
cooking and exercise classes in our community. Most importantly, the community members should be
educated about ill effects of fast food and should be taught time management to cook healthy meals at
home. The schools should implement mandatory physical education programs in school to address
childhood obesity. The Hispanic population should have access to exercise and nutrition classes in
Spanish to address issue of Obesity among Hispanic population. Summer sports camps should have
appropriate times for children of working adults. Raise awareness about free exercise classes offered in
this community.
Neighborhood Safety
Fayette County needs more police patrols and neighborhood watch in unsafe neighborhoods.
Furthermore, the community needs to address issue traffic and drug related violence in certain
neighborhoods of Fayette County. For Hispanic community, bilingual representatives should be
available to address issue of language barrier. Seniors in this community are at risk of being take
advantage because of the prescription drugs. They should have protection to defend themselves. The
community members in general watch out for each other.
Actions to Address Environmental Issues in Fayette County
In June 2010, a survey was mailed to random sample of 6000 household in Fayette County. Total of 1214
completed surveys were obtained providing an overall response rate of 20.23% and a margin error of +/-
2.8 at the 95% confidence level. Littering, energy efficiency, clean drinking water, recycling, and flood
drainage problems were identified as important issues by majority of survey respondents. The focus
group participants were provided an opportunity to further explore these five issues revealed in the
survey.
Trash/Littering
The neighborhoods should have neighborhood cleanup days to address the issue of trash in the
community. The businesses and apartment complex owners should hire maintenance staff to clean up
trash outside of their buildings. Many communities in this county have trash on their streets dropped by
trash collectors on trash pickup day. The community needs to start a dialogue with the Urban County

Community Assessment Report Page 17
government to address this issue. People (especially Hispanic population) should be educated about
recycling. Most importantly, the community needs bigger recycling bins and trash cans. Increase and
enforce fines for littering. Some
Energy Efficiency
Most focus group participants believed low-income houses should receive assistance for home
insulation and high utility costs. The community organizations should raise awareness about the
weatherization programs available for low-income households. The churches and local businesses can
provide the supplies for volunteers to complete the weatherization assistance programs in the
community. The Hispanic community should be educated in Spanish on how to save energy. Encourage
use of energy efficient appliances.
Water
The community needs to address the issue of negative effect of storm water drainage on the water
quality. Educate people about negative effects of oil change drains into storm drains. The old and rusty
pipes should be inspected and replaced in old houses. The community in Winburn wants the local
government to address issue of stinky creek near Hollowcreek Street. The creek near this area has been
disposal ground for syringes, needles, and Lexmark waste run off. The sewage backs up in Green Acres
Park neighborhood houses.
Recycling
The community needs bigger recycling bins for effective recycling program. The trash pickup services do
not pick up very heavy recyclable bins. This rule needs modification. The Hispanic community should be
educated about recycling in Spanish language. Furthermore, in Winburn area, the recycle containers
should be placed at specific locations near the apartment complexes. Raise awareness and educate
people about recycling.
Flooding
There should be better mosquito control in summer. The health department needs better animal
control in Winburn area. There are lot stray cats and rodents in this area. The community in Winburn
area wants the local government to address issue of open drain near Russell Cave. The creek near
Hollowcreek Road in Winburn areas is dumping ground for animals and recyclables. The Community
needs to be educated about keeping creeks free of trash. Furthermore, the creek near Hollowcreek
Road gets flooded during heavy rains and flooded waters gets into the houses in this area. The Hispanic
community should have representatives to speak on their behalf on flood issues. The pipes, tubes, and
drains should be inspected in apartment complexes of Winburn area.

Community Assessment Report Page 18
Assets in Winburn Area
The group participants believe that children in Winburn area are protected. The public schools are in
close proximity. The area is diverse because there is big Hispanic and African-American community in
this area. The home owners in Winburn area take good care of their houses and tenants. The Green
Acres area is peaceful and quiet neighborhood at night. There are basketball and baseball games at the
Green Acres Park. The houses in this area are not rented to troublemaking tenants. The neighborhood
association in Winburn area is bringing positive change to this area. The area has annual neighborhood
cleanup day. There are lots of recreational activities for children in this area. For example, the children
got help with air cuts before they went back to school. The children also participated in back to school
rally. There are lots of physical activity programs in this neighborhood. The community action council
and 8 churches in neighborhood can provide an opportunity for collaboration. The Lextran service is big
positive for this neighborhood. However, the Hispanic community would like to see better school bus
services for children in winter. There are plenty of outreach programs at the community center in this
neighborhood
Other Issues
The Winburn area has only one way out of this neighborhood. Another road should be added in this
neighborhood to avoid traffic hazards. There should be annual health fair in Winburn area. The health
department should provide health care for unemployed and uninsured people in timely manner. The
population in Green Acres Area is aging and they are unable to keep their houses clean. Parents in this
neighborhood need help to provide more activities for youth. This community needs education
campaign and regulations to keep streets clean in this area. The water shed project was not helpful in
this area.
Assets in Central Parkway Area
Presence of Community Empowerment Center and schools is big advantage for this neighborhood.
Low crime and good neighbors is another asset in this area. Community members appreciate back to
school rallies, Thanksgiving baskets, and transportation to Southern Lights festival.
Other Issues
The Community needs primary mobile clinic in the area to screen people for high blood pressure, high
cholesterol, diabetes and other chronic health issues.

Community Assessment Report Page 19
Assets in Cardinal Valley Area
Good library and programs for children are the important assets in this neighborhood. The Hispanic
community values peace, greenery, good transportation, low cost of living and affordable rent in
Lexington, KY.
Other Issues
Lexington needs more bus routes to decrease traffic in this city.
COMMUNITY HEALTH STATUS REPORT
This report also highlights the general demographic characteristics and provides a description of some
of the leading contributing causes of community health issues (or risk factors) of the Lexington-
Fayette County community.
Population Size: 295,803
Population density: 1040 people per sq mi
Individuals Below Poverty Level: 20.4%
Families Below Poverty Level: 3.0%
Age distribution (Average age: 37.2)
Less than 20: 24.9%
20-34: 27.0%
35-64: 37.5%
65 and over: 10.5%
Race and ethnicity
White: 75.7%
Black: 14.5%
American Indian: 0.2%
Asian/Pacific Islander: 3.3%
Hispanic: 6.9%
Educational attainment
No high school diploma: 11.2%
High school diploma: 22.1%

Community Assessment Report Page 20
2008-2010 BRFFS Survey Data—Fayette County

Community Assessment Report Page 21
Risk Factors for Poor Health
Access To Care

Community Assessment Report Page 22
Preventive services are a precursor to a healthy community. Fayette County currently engages in a
number of preventive services with the graphs below focusing on vaccination and preventive
screening programs. It is evident that Fayette County performs well in preventive services but
continued outreach and education should be focused on those most at-risk and least likely to seek
preventive care.
Child Preventive Services
Adult Preventive Services

Community Assessment Report Page 23
COMMUNITY ASSETS AND RESOURCES TO ADDRESS HEALTH ISSUES
• Obesity
o Bluegrass Mental Health—can help create a resource directory to identify physical
activity venues
o Saint Joseph Hospital—can help create a resource directory to identify physical activity
venues
o Kentucky Pink Connection—create a program directory for physical activity venues and
identify mechanisms of assistance for participation in programs; identify schools that do
not have active wellness councils; identify barriers to participation in wellness councils;
assist schools in overcoming barrier to participation in wellness councils and link them
with existing wellness councils in order to develop a wellness council implementation
strategy.
o Bluegrass Community and Technical College (BCTC)—create a program directory for
physical activity venues and identify mechanisms of assistance for participation in
programs; identify schools that do not have active wellness councils; identify barriers to
participation in wellness councils; assist schools in overcoming barrier to participation in
wellness councils and link them with existing wellness councils in order to develop a
wellness council implementation strategy.
o United Way of Bluegrass—disseminate physical activity resource and program
directories
o Medical professional associations—disseminate physical activity resource and program
directories
o Partner with Cooperative Extension (University of Kentucky) —disseminate physical
activity resource and program directories—disseminate physical activity resource and
program directories
o Groups represented on MAPP Coalition/CHIP Governance/Advisory Board—disseminate
physical activity resource and program directories
o City Council/Mayor’s Office —disseminate physical activity resource and program
directories
o Lexington Tweens Nutrition and Fitness Coalition—gather existing data regarding food
deserts and transfer findings to partners and public
o Lexington Clinic—gather existing data regarding food deserts and transfer findings to
partners and public
o Central Baptist Hospital—identify stakeholders to partner with existing initiatives to
invest in the Lexington Tweens Nutrition and Fitness Coalition’s Healthy Corner Store
initiative; Identify existing worksite wellness programs in Fayette County; partner with
and support existing effort by the Chamber of Commerce to improve worksite wellness

Community Assessment Report Page 24
and disseminate available resources and information to partners; assist schools in
overcoming barrier to participation in wellness councils and link them with existing
wellness councils in order to develop a wellness council implementation strategy.
• Safe Neighborhoods
o CHIP Governance/Advisory Board—increase awareness through physicians informing
patients of days and locations of Med Toss Programs; include medical community as
volunteers at collection sites; use churches; ensure compliance with “safe by design”
standards for new developments; increase alcohol education programs in schools
o Lexington Police Department—increase awareness through physicians informing
patients of days and locations of Med Toss Programs; include medical community as
volunteers at collection sites; use churches; ensure compliance with “safe by design”
standards for new developments
o Mayor’s Alliance on Substance Abuse—assist with physician compliance in Kentucky
All Schedule Prescription Electronic Reporting (KASPER) program
o Fayette County Public Schools—identify evidence-based alcohol education programs for
schools
• Unemployment
o Fayette County Adult Education—increase educational attainment level by making
contacts with BCTCS, KET Study at Home, LFUCG-Beth Mills and by obtaining data from
the Department of Education on enrollment, graduation rates, barriers, etc.
o Bluegrass Area Development District (BGADD)—assist with decreasing drug abuse by:
surveying employment leaders; working with the Mayor’s Substance Abuse Task Force
on a county needs assessment on barriers to employment; contacting office of
employment/EOT; contacting Lexington Commerce (Business Education Network-BEN);
contacting Industrial Authority (BIF)
Community Assessment Report Page 25
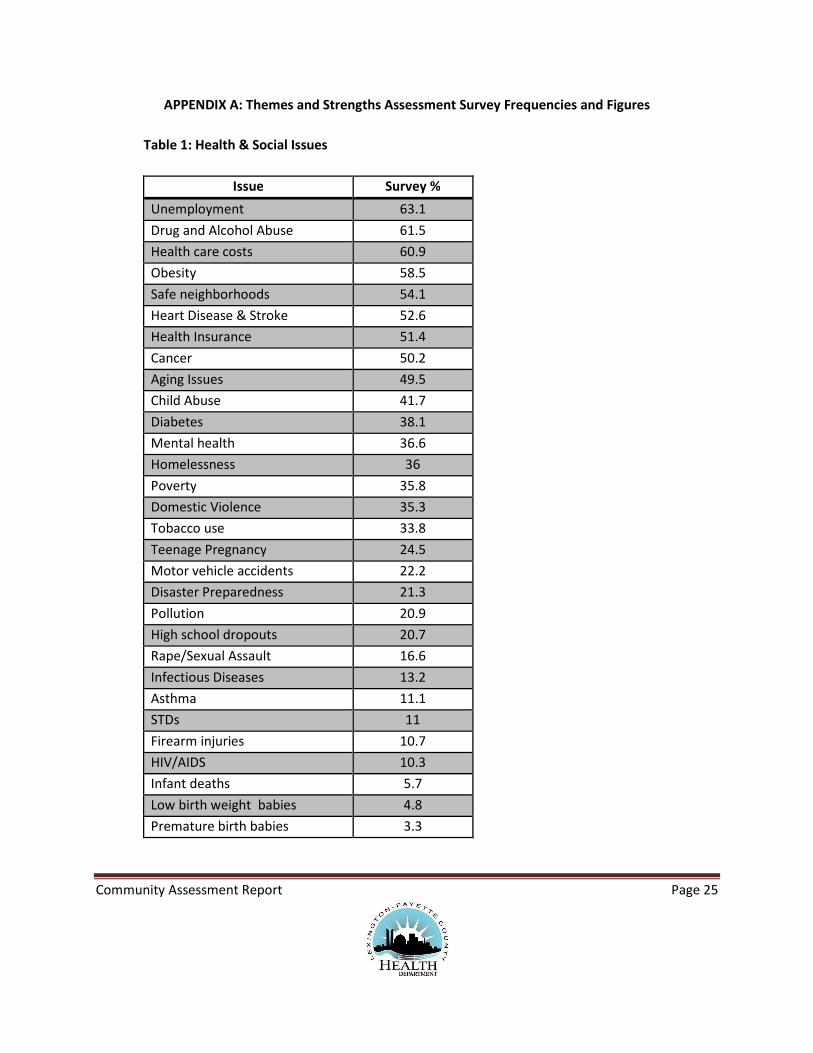
APPENDIX A: Themes and Strengths Assessment Survey Frequencies and Figures
Table 1: Health & Social Issues
Issue Survey %
Unemployment 63.1
Drug and Alcohol Abuse 61.5
Health care costs 60.9
Obesity 58.5
Safe neighborhoods 54.1
Heart Disease & Stroke 52.6
Health Insurance 51.4
Cancer 50.2
Aging Issues 49.5
Child Abuse 41.7
Diabetes 38.1
Mental health 36.6
Homelessness 36
Poverty 35.8
Domestic Violence 35.3
Tobacco use 33.8
Teenage Pregnancy 24.5
Motor vehicle accidents 22.2
Disaster Preparedness 21.3
Pollution 20.9
High school dropouts 20.7
Rape/Sexual Assault 16.6
Infectious Diseases 13.2
Asthma 11.1
STDs 11
Firearm injuries 10.7
HIV/AIDS 10.3
Infant deaths 5.7
Low birth weight babies 4.8
Premature birth babies 3.3

Community Assessment Report Page 26
Table 2: Environmental Issues
Issue %
Littering 63.2
Energy efficiency 59.6
Clean drinking water 59.5
Recycling 58.6
Flood drainage problems 54.7
Clean outdoor air 50.8
Mosquitoes 47.9
Safe food at restaurants 47.4
Green space and urban parks 44.6
Availability of local fresh produce 42.6
Bike and walking trails 41.5
Animal control 40.9
Sidewalks 38.2
Exposure to second hand smoke 37.8
Noise pollution 35
Release of untreated sewage 32.2
Climate change 30.1
Clean water for recreation 27.6
Mold 26.6
Clean indoor air 24.3
Bed bugs 21.4
Child lead exposure 11.6
Rats 9.8
Radon 7.7
Rabies 4.4

Community Assessment Report Page 27
Table 3: Insurance
Insurance Yes No
Health Insurance 84.6 15.4
Dental Insurance 53.6 46.4
Vision Insurance 42.3 57.7
Table 4: Health Status
Health Status %
Excellent 16
Very Good 36
Good 29.9
Fair 13.3
Poor 3.7
Did not answer 1.2
Table 5: Age Distribution
Age Group Survey % US Census %
18-24 5.2 18.5
25-34 17.2 21.7
35-44 14.9 20.4
45-54 20.1 16.8
55-64 20.3 9.7
65+ 21.3 12.7
Did not answer 1
Table 6: Gender Distribution
Gender Survey % US Census %
M 26.2 48.5
F 70.8 51.4
Did not answer 3

Community Assessment Report Page 28
Table 7: Race Distribution
Race Survey % US Census %
White 74.1 82.8
African American 17.5 12.2
Asian/Pacific Islander 2.1 2.54
American Indian/Alaska
Native
0.2 0.2
Other 3.8 2.15
Did not answer 2.3
Table 8: Ethnicity Distribution
Ethnicity Survey % US Census %
Hispanic 2.5 3.13
Not Hispanic 91.8 96.8
Did not answer 5.7
Table 9: Household Income Distribution
Income Fayette Survey % US Census %
Less than $10,000 13.8 10.21
$10,000-$24,000 16.3 21.3
$25,000-$34,999 11.1 12.7
$35,000-$49,999 12.9 16.1
$50,000-$74,999 17.1 18.5
$75,000-$99,999 10.5 9.5
$100,000 or more 13.4 11.5
Did not answer 4.9

Community Assessment Report Page 29
Figure 1: Health & Social Issues
3.3
4.8
5.7
10.3
10.7
11
11.1
13.2
16.6
20.7
20.9
21.3
22.2
24.5
33.8
35.3
35.836
36.6
38.1
41.7
49.5
50.2
51.4
52.6
54.1
58.5
60.9
61.5
63.1
0 10 20 30 40 50 60 70
Premature birth babies
Low birthweight babies
Infant deaths
HIV/AIDS
Firearm injuries
STDs
Asthma
Infectious Diseases
Rape/Sexual Assault
High school dropouts
Pollution
Disaster Preparedness
Motor vehicle accidents
Teenage Pregnancy
Tobacco use
Domestic Violence
Poverty
Homelessness
Mental health
Diabetes
Child Abuse
Aging Issues
Cancer
Health Insurance
Heart Disease & Stroke
Safe neighborhoods
Obesity
Health care costs
Drug and Alcohol Abuse
Unemployment
% Response
Health & Social Issues

Community Assessment Report Page 30
Figure 2: Environmental Issues
4.4
7.7
9.8
11.6
21.4
24.3
26.6
27.6
30.1
32.2
35
37.8
38.2
40.9
41.5
42.6
44.6
47.4
47.9
50.8
54.7
58.6
59.5
59.6
63.2
0 10 20 30 40 50 60 70
Rabies
Radon
Rats
Child lead exposure
Bed bugs
Clean indoor air
Mold
Clean water for recreation
Climate change
Release of untreated sewage
Noise pollution
Exposure to second hand smoke
Sidewalks
Animal control
Bike and walking trails
Availability of local fresh produce
Green space and urban parks
Safe food at restaurants
Mosquitoes
Clean outdoor air
Flood drainage problems
Recycling
Clean drinking water
Energy efficiency
Littering
% Response
Environmental Issues

Community Assessment Report Page 31
Figure 3: Health, Dental and Vision Insurance
Figure 4: Health Status
84.6
53.6
42.3
15.4
46.4
57.7
0
10
20
30
40
50
60
70
80
90
Health Insurance Dental Insurance Vision Insurance
%
Insurance
Yes
No
16
36
29.9
13.3
3.71.2
0
5
10
15
20
25
30
35
40
Excellent Very Good Good Fair Poor Did not
answer
%
Health Status

Community Assessment Report Page 32
Figure 5: Age
Figure 6: Gender
0
5
10
15
20
25
%
Age
Survey Data For Age Vs Census Data for Age
Survey %
US Census Fayette %
0
10
20
30
40
50
60
70
80
M F Did not answer
%
Gender
Survey Data For Gender Vs Census Data for
Gender
Survey %
US Census Fayette %

Community Assessment Report Page 33
Figure 7: Race
Figure 8: Ethnicity
74.1
17.5
2.1 0.2 3.8 2.3
82.8
12.2
2.5 0.2 2.15
0
10
20
30
40
50
60
70
80
90
White African
American
Asian/Pacific
Islander
American
Indian/Alaska
Native
Other Did not
answer
%
Race
Survey Data for Race Vs US Census Data for RaceSurvey %
US Census Fayette %
2.5
91.8
5.73.13
96.8
0
20
40
60
80
100
120
Hispanic Not Hispanic Did not answer
%
Ethnicity
Survey Data for Ethinicity Vs US Census Data for
Ethnicity
Survey %
US Census Fayette %

Community Assessment Report Page 34
Figure 9: Household Income
Health & Social Issues
The following issues were identified as important health and social issues in Fayette County by majority
of survey respondents. The issues are ranked by % response from the survey.
1. Unemployment
2. Drug and Alcohol Abuse
3. Health Care Costs
4. Obesity
5. Safe Neighborhoods
6. Heart Diseases and Stroke
7. Health Insurance
8. Cancer
9. Aging Issues
10. Child Abuse
0
5
10
15
20
25
%
Household Income
Survey Data for Household Income Vs US Census Data
for Household Income
Survey %
US Census
Fayette %

Community Assessment Report Page 35
Environmental Issues
The following issues were identified as important environmental issues in Fayette County by majority of
survey respondents. The issues are ranked by % response from the survey.
1. Littering
2. Energy Efficiency
3. Clean Drinking Water
4. Recycling
5. Flood Drainage Problems
6. Clean Outdoor Air
7. Mosquitoes
8. Safe Food at Restaurants
9. Green Space/Urban Parks
10. Availability of Local Fresh Produce

Community Assessment Report Page 36
APPENDIX B: Results from the Local Public Health Performance Assessment
B. Performance Assessment Instrument Results
I. How well did the system perform the ten Essential Public Health Services (EPHS)?
Table 1: Summary of performance scores by Essential Public Health Service (EPHS)
EPHS Score
1 Monitor Health Status To Identify Community Health Problems
46
2 Diagnose And Investigate Health Problems and Health Hazards
77
3 Inform, Educate, And Empower People about Health Issues
52
4 Mobilize Community Partnerships to Identify and Solve Health Problems
49
5 Develop Policies and Plans that Support Individual and Community Health
Efforts 76
6 Enforce Laws and Regulations that Protect Health and Ensure Safety
64
7 Link People to Needed Personal Health Services and Assure the Provision of
Health Care when Otherwise Unavailable 57
8 Assure a Competent Public and Personal Health Care Workforce
48
9 Evaluate Effectiveness, Accessibility, and Quality of Personal and Population-
Based Health Services 40
10 Research for New Insights and Innovative Solutions to Health Problems
50
Overall Performance Score 56

Community Assessment Report Page 37
Figure 1: Summary of EPHS performance scores and overall score (with range)
Table 1 (above) provides a quick overview of the system's performance in each of the 10 Essential
Public Health Services (EPHS). Each EPHS score is a composite value determined by the scores given to
those activities that contribute to each Essential Service. These scores range from a minimum value of
0% (no activity is performed pursuant to the standards) to a maximum of 100% (all activities
associated with the standards are performed at optimal levels).
Figure 1 (above) displays performance scores for each Essential Service along with an overall score
that indicates the average performance level across all 10 Essential Services. The range bars show the
minimum and maximum values of responses within the Essential Service and an overall score. Areas of
wide range may warrant a closer look in Figure 4 or the raw data.
The image cannot be displayed. Your computer may not have enough memory to open the image, or the image may have been corrupted. Restart your computer, and then open the file again. If the red x still appears, you may have to delete the image and then insert it again.
Community Assessment Report Page 38
Local Public Health System Performance Assessment - Report of Results
Lexington Fayette County Health Department
7/20/2011
Figure 2: Rank ordered performance scores for each Essential Service
The image cannot be displayed. Your computer may not have enough memory to open the image, or the image may have been corrupted. Restart your computer, and then open the file again. If the red x still appears, you may have to delete the image and then insert it again.
The image cannot be displayed. Your computer may not have enough memory to open the image, or the image may have been corrupted. Restart your computer, and then open the file again. If the red x still appears, you may have to delete the image and then insert it again.

Community Assessment Report Page 39
Local Public Health System Performance Assessment - Report of Results
Lexington Fayette County Health Department
7/20/2011
Figure 3: Rank ordered performance scores for each Essential Service, by level of activity
No Activity Minimal Moderate Significant Optimal
Figure 2 (above) displays each composite score from low to high, allowing easy identification of service
domains where performance is relatively strong or weak.
Figure 3 (above) provides a composite picture of the previous two graphs. The range lines show the
range of responses within an Essential Service. The color coded bars make it easier to identify which of
the Essential Services fall in the five categories of performance activity.
Figure 4 (next page) shows scores for each model standard. Sites can use these graphs to pinpoint
specific activities within the Essential Service that may need a closer look. Note these scores also have
range bars, showing sub-areas that comprise the model standard.
The image cannot be displayed. Your computer may not have enough memory to open the image, or the image may have been corrupted. Restart your computer, and then open the file again. If the red x still appears, you may have to delete the image and then insert it again.
The image cannot be displayed. Your computer may not have enough memory to open the image, or the image may have been corrupted. Restart your computer, and then open the file again. If the red x still appears, you may have to delete the image and then insert it again.

Community Assessment Report Page 40
Local Public Health System Performance Assessment - Report of Results
Lexington Fayette County Health Department
7/20/2011
II. How well did the system perform on specific model standards?
Figure 4: Performance scores for each model standard, by Essential Service
The image cannot be displayed. Your computer may not have enough memory to open the image, or the image may have been corrupted. Restart your
computer, and then open the file again. If the red x still appears, you may have to delete the image and then insert it again.
The image cannot be displayed. Your computer may not have enough memory to open the image, or the image may have been corrupted. Restart your computer, and then open the file again. If the red x still appears, you may have to delete the image and then insert it again.
The image cannot be displayed. Your computer may not have enough memory to open the image, or the image may have been corrupted. Restart your computer, and then open the file again. If the red x still appears, you may have to delete the image and then insert it again.
The image cannot be displayed. Your computer may not have enough memory to open the image, or the image may have been corrupted. Restart your computer, and then open the file again. If the red x still appears, you may have to delete the image and then insert it again.

Community Assessment Report Page 41
Local Public Health System Performance Assessment - Report of Results
Lexington Fayette County Health Department
7/20/2011
The image cannot be displayed. Your computer may not have enough memory to open the image, or the image may have been corrupted. Restart your
computer, and then open the file again. If the red x still appears, you may have to delete the image and then insert it again.
The image cannot be displayed. Your computer may not have enough memory to open the image, or the image may have been corrupted. Restart your computer, and then open the file again. If the red x still appears, you may have to delete the image and then insert it again.
The image cannot be displayed. Your computer may not have enough memory to open the image, or the image may have been corrupted. Restart your computer, and then open the file again. If the red x still appears, you may have to delete the image and then insert it again.
The image cannot be displayed. Your computer may not have enough memory to open the image, or the image may have been corrupted. Restart your computer, and then open the file again. If the red x still appears, you may have to delete the image and then insert it again.
The image cannot be displayed. Your computer may not have enough memory to open the image, or the image may have been corrupted. Restart your computer, and then open the file again. If the red x still appears, you may have to delete the image and then insert it again.

Community Assessment Report Page 42
Local Public Health System Performance Assessment - Report of Results
Lexington Fayette County Health Department
7/20/2011
The image cannot be displayed. Your computer may not have enough memory to open the image, or the image may have been corrupted. Restart your
computer, and then open the file again. If the red x still appears, you may have to delete the image and then insert it again.
The image cannot be displayed. Your computer may not have enough memory to open the image, or the image may have been corrupted. Restart your computer, and then open the file again. If the red x still appears, you may have to delete the image and then insert it again.
The image cannot be displayed. Your computer may not have enough memory to open the image, or the image may have been corrupted. Restart your computer, and then open the file again. If the red x still appears, you may have to delete the image and then insert it again.
The image cannot be displayed. Your computer may not have enough memory to open the image, or the image may have been corrupted. Restart your computer, and then open the file again. If the red x still appears, you may have to delete the image and then insert it again.

Community Assessment Report Page 43
Local Public Health System Performance Assessment - Report of Results
Lexington Fayette County Health Department
7/20/2011
Table 2: Summary of performance scores by Essential Public Health Service (EPHS) and model standard
Essential Public Health Service Score
EPHS 1. Monitor Health Status To Identify Community Health Problems 46
1.1 Population-Based Community Health Profile (CHP) 47
1.1.1 Community health assessment 47
1.1.2 Community health profile (CHP) 70
1.1.3 Community-wide use of community health assessment or CHP data 25
1.2 Access to and Utilization of Current Technology to Manage, Display, Analyze and
Communicate Population Health Data 38
1.2.1 State-of-the-art technology to support health profile databases 25
1.2.2 Access to geocoded health data 38
1.2.3 Use of computer-generated graphics 50
1.3 Maintenance of Population Health Registries 53
1.3.1 Maintenance of and/or contribution to population health registries 31
1.3.2 Use of information from population health registries 75
EPHS 2. Diagnose And Investigate Health Problems and Health Hazards 77
2.1 Identification and Surveillance of Health Threats 64
2.1.1 Surveillance system(s) to monitor health problems and identify health threats 67
2.1.2 Submission of reportable disease information in a timely manner 50
The image cannot be displayed. Your computer may not have enough memory to open the image, or the image may have been corrupted. Restart your computer, and then open the file again. If the red x still appears, you may have to delete the image and then insert it again.

Community Assessment Report Page 44
Local Public Health System Performance Assessment - Report of Results
Lexington Fayette County Health Department
7/20/2011
2.1.3 Resources to support surveillance and investigation activities 75
2.2 Investigation and Response to Public Health Threats and Emergencies 81
2.2.1 Written protocols for case finding, contact tracing, source identification, and
containment 75
2.2.2 Current epidemiological case investigation protocols 75
2.2.3 Designated Emergency Response Coordinator 88
2.2.4 Rapid response of personnel in emergency / disasters 69
2.2.5 Evaluation of public health emergency response 100
2.3 Laboratory Support for Investigation of Health Threats 84
2.3.1 Ready access to laboratories for routine diagnostic and surveillance needs 75
2.3.2 Ready access to laboratories for public health threats, hazards, and emergencies 63
2.3.3 Licenses and/or credentialed laboratories 100
2.3.4 Maintenance of guidelines or protocols for handling laboratory samples 100
EPHS 3. Inform, Educate, And Empower People about Health Issues 52
3.1 Health Education and Promotion 42
3.1.1 Provision of community health information 44
3.1.2 Health education and/or health promotion campaigns 44
3.1.3 Collaboration on health communication plans 38
3.2 Health Communication 55
The image cannot be displayed. Your computer may not have enough memory to open the image, or the image may have been corrupted. Restart your computer, and then open the file again. If the red x still appears, you may have to delete the image and then insert it again.

Community Assessment Report Page 45
Local Public Health System Performance Assessment - Report of Results
Lexington Fayette County Health Department
7/20/2011
3.2.1 Development of health communication plans 43
3.2.2 Relationships with media 54
3.2.3 Designation of public information officers 69
3.3 Risk Communication 60
3.3.1 Emergency communications plan(s) 66
3.3.2 Resources for rapid communications response 50
3.3.3 Crisis and emergency communications training 75
3.3.4 Policies and procedures for public information officer response 50
The image cannot be displayed. Your computer may not have enough memory to open the image, or the image may have been corrupted. Restart your computer, and then open the file again. If the red x still appears, you may have to delete the image and then insert it again.

Community Assessment Report Page 46
Local Public Health System Performance Assessment - Report of Results
Lexington Fayette County Health Department
7/20/2011
Essential Public Health Service Score
EPHS 4. Mobilize Community Partnerships to Identify and Solve Health Problems 49
4.1 Constituency Development 53
4.1.1 Identification of key constituents or stakeholders 56
4.1.2 Participation of constituents in improving community health 69
4.1.3 Directory of organizations that comprise the LPHS 63
4.1.4 Communications strategies to build awareness of public health 25
4.2 Community Partnerships 46
4.2.1 Partnerships for public health improvement activities 63
4.2.2 Community health improvement committee 50
4.2.3 Review of community partnerships and strategic alliances 25
EPHS 5. Develop Policies and Plans that Support Individual and Community Health Efforts 76
5.1 Government Presence at the Local Level 71
5.1.1 Governmental local public health presence 83
5.1.2 Resources for the local health department 80
5.1.3 Local board of health or other governing entity (not scored) 0
5.1.4 LHD work with the state public health agency and other state partners 50
5.2 Public Health Policy Development 79
The image cannot be displayed. Your computer may not have enough memory to open the image, or the image may have been corrupted. Restart your computer, and then open the file again. If the red x still appears, you may have to delete the image and then insert it again.

Community Assessment Report Page 47
Local Public Health System Performance Assessment - Report of Results
Lexington Fayette County Health Department
7/20/2011
5.2.1 Contribution to development of public health policies 88
5.2.2 Alert policymakers/public of public health impacts from policies 75
5.2.3 Review of public health policies 75
5.3 Community Health Improvement Process 57
5.3.1 Community health improvement process 72
5.3.2 Strategies to address community health objectives 13
5.3.3 Local health department (LHD) strategic planning process 88
5.4 Plan for Public Health Emergencies 97
5.4.1 Community task force or coalition for emergency preparedness and response plans 100
5.4.2 All-hazards emergency preparedness and response plan 92
5.4.3 Review and revision of the all-hazards plan 100
EPHS 6. Enforce Laws and Regulations that Protect Health and Ensure Safety 64
6.1 Review and Evaluate Laws, Regulations, and Ordinances 63
6.1.1 Identification of public health issues to be addressed through laws, regulations, and
ordinances 75
6.1.2 Knowledge of laws, regulations, and ordinances 75
6.1.3 Review of laws, regulations, and ordinances 25
6.1.4 Access to legal counsel 75
6.2 Involvement in the Improvement of Laws, Regulations, and Ordinances 58
The image cannot be displayed. Your computer may not have enough memory to open the image, or the image may have been corrupted. Restart your computer, and then open the file again. If the red x still appears, you may have to delete the image and then insert it again.

Community Assessment Report Page 48
Local Public Health System Performance Assessment - Report of Results
Lexington Fayette County Health Department
7/20/2011
6.2.1 Identification of public health issues not addressed through existing laws 50
6.2.2 Development or modification of laws for public health issues 50
6.2.3 Technical assistance for drafting proposed legislation, regulations, or ordinances 75
6.3 Enforce Laws, Regulations and Ordinances 70
6.3.1 Authority to enforce laws, regulation, ordinances 75
6.3.2 Public health emergency powers 75
6.3.3 Enforcement in accordance with applicable laws, regulations, and ordinances 50
6.3.4 Provision of information about compliance 75
6.3.5 Assessment of compliance 75
The image cannot be displayed. Your computer may not have enough memory to open the image, or the image may have been corrupted. Restart your computer, and then open the file again. If the red x still appears, you may have to delete the image and then insert it again.

Community Assessment Report Page 49
Local Public Health System Performance Assessment - Report of Results
Lexington Fayette County Health Department
7/20/2011
Essential Public Health Service Score
EPHS 7. Link People to Needed Personal Health Services and Assure the Provision of Health Care
when Otherwise Unavailable 57
7.1 Identification of Populations with Barriers to Personal Health Services 71
7.1.1 Identification of populations who experience barriers to care 100
7.1.2 Identification of personal health service needs of populations 63
7.1.3 Assessment of personal health services available to populations who experience barriers
to care 50
7.2 Assuring the Linkage of People to Personal Health Services 44
7.2.1 Link populations to needed personal health services 50
7.2.2 Assistance to vulnerable populations in accessing needed health services 50
7.2.3 Initiatives for enrolling eligible individuals in public benefit programs 50
7.2.4 Coordination of personal health and social services 25
EPHS 8. Assure a Competent Public and Personal Health Care Workforce 48
8.1 Workforce Assessment Planning, and Development 25
8.1.1 Assessment of the LPHS workforce 25
8.1.2 Identification of shortfalls and/or gaps within the LPHS workforce 25
8.1.3 Dissemination of results of the workforce assessment / gap analysis 25
8.2 Public Health Workforce Standards 75
The image cannot be displayed. Your computer may not have enough memory to open the image, or the image may have been corrupted. Restart your
computer, and then open the file again. If the red x still appears, you may have to delete the image and then insert it again.

Community Assessment Report Page 50
Local Public Health System Performance Assessment - Report of Results
Lexington Fayette County Health Department
7/20/2011
8.2.1 Awareness of guidelines and/or licensure/certification requirements 75
8.2.2 Written job standards and/or position descriptions 75
8.2.3 Annual performance evaluations 75
8.2.4 LHD written job standards and/or position descriptions 75
8.2.5 LHD performance evaluations 75
8.3 Life-Long Learning Through Continuing Education, Training, and Mentoring 56
8.3.1 Identification of education and training needs for workforce development 75
8.3.2 Opportunities for developing core public health competencies 50
8.3.3 Educational and training incentives 25
8.3.4 Interaction between personnel from LPHS and academic organizations 75
8.4 Public Health Leadership Development 38
8.4.1 Development of leadership skills 50
8.4.2 Collaborative leadership 25
8.4.3 Leadership opportunities for individuals and/or organizations 50
8.4.4 Recruitment and retention of new and diverse leaders 25
The image cannot be displayed. Your computer may not have enough memory to open the image, or the image may have been corrupted. Restart your
computer, and then open the file again. If the red x still appears, you may have to delete the image and then insert it again.

Community Assessment Report Page 51
Local Public Health System Performance Assessment - Report of Results
Lexington Fayette County Health Department
7/20/2011
Essential Public Health Service Score
EPHS 9. Evaluate Effectiveness, Accessibility, and Quality of Personal and Population-Based
Health Services 40
9.1 Evaluation of Population-based Health Services 56
9.1.1 Evaluation of population-based health services 75
9.1.2 Assessment of community satisfaction with population-based health services 50
9.1.3 Identification of gaps in the provision of population-based health services 50
9.1.4 Use of population-based health services evaluation 50
9.2 Evaluation of Personal Health Care Services 50
9.2.1.In Personal health services evaluation 50
9.2.2 Evaluation of personal health services against established standards 75
9.2.3 Assessment of client satisfaction with personal health services 50
9.2.4 Information technology to assure quality of personal health services 25
9.2.5 Use of personal health services evaluation 50
9.3 Evaluation of the Local Public Health System 13
9.3.1 Identification of community organizations or entities that contribute to the EPHS 50
9.3.2 Periodic evaluation of LPHS 0
9.3.3 Evaluation of partnership within the LPHS 0
The image cannot be displayed. Your computer may not have enough memory to open the image, or the image may have been corrupted. Restart your
computer, and then open the file again. If the red x still appears, you may have to delete the image and then insert it again.

Community Assessment Report Page 52
Local Public Health System Performance Assessment - Report of Results
Lexington Fayette County Health Department
7/20/2011
9.3.4 Use of LPHS evaluation to guide community health improvements 0
EPHS 10. Research for New Insights and Innovative Solutions to Health Problems 50
10.1 Fostering Innovation 44
10.1.1 Encouragement of new solutions to health problems 50
10.1.2 Proposal of public health issues for inclusion in research agenda 50
10.1.3 Identification and monitoring of best practices 50
10.1.4 Encouragement of community participation in research 25
10.2 Linkage with Institutions of Higher Learning and/or Research 50
10.2.1 Relationships with institutions of higher learning and/or research organizations 50
10.2.2 Partnerships to conduct research 50
10.2.3 Collaboration between the academic and practice communities 50
10.3 Capacity to Initiate or Participate in Research 56
10.3.1 Access to researchers 75
10.3.2 Access to resources to facilitate research 75
10.3.3 Dissemination of research findings 50
10.3.4 Evaluation of research activities 25
The image cannot be displayed. Your computer may not have enough memory to open the image, or the image may have been corrupted. Restart your
computer, and then open the file again. If the red x still appears, you may have to delete the image and then insert it again.

Community Assessment Report Page 53
Local Public Health System Performance Assessment - Report of Results
Lexington Fayette County Health Department
7/20/2011
III. Overall, how well is the system achieving optimal activity levels?
Figure 5: Percentage of Essential Services scored in each level of activity
Figure 5 displays the percentage of the
system's Essential Services scores that fall
within the five activity categories. This chart
provides the site with a high level snapshot
of the information found in Figure 3.
Figure 6: Percentage of model standards scored in each level of activity
Figure 6 displays the percentage of the
system's model standard scores that fall
within the five activity categories.
The image cannot be displayed. Your computer may not have enough memory to open the image, or the image may have been corrupted. Restart your computer, and then open the file again. If the red x still appears, you may have to delete the image and then insert it again.
The image cannot be displayed. Your computer may not have enough memory to open the image, or the image may have been corrupted. Restart your computer, and then open the file again. If the red x still appears, you may have to delete the image and then insert it again.
The image cannot be displayed. Your computer may not have enough memory to open the image, or the image may have been corrupted. Restart your computer, and then open the file again. If the red x still appears, you may have to delete the image and then insert it again.

Community Assessment Report Page 54
Local Public Health System Performance Assessment - Report of Results
Lexington Fayette County Health Department
7/20/2011
Figure 7: Percentage of all questions scored in each level of activity
Figure 7 displays the percentage of all
scored questions that fall within the five
activity categories. This breakdown
provides a closer snapshot of the system's
performance, showing variation that may
be masked by the scores in Figures 5 and 6.
The image cannot be displayed. Your computer may not have enough memory to open the image, or the image may have been corrupted. Restart your computer, and then open the file again. If the red x still appears, you may have to delete the image and then insert it again.
The image cannot be displayed. Your computer may not have enough memory to open the image, or the image may have been corrupted. Restart your computer, and then open the file again. If the red x still appears, you may have to delete the image and then insert it again.

Community Assessment Report Page 55
Local Public Health System Performance Assessment - Report of Results
Lexington Fayette County Health Department
7/20/2011
D. Optional agency contribution results
How much does the Local Health Department contribute to the system's performance, as perceived by assessment
participants?
Tables 5 and 6 (below) display Essential Services and model standards arranged by Local Health Department (LHD)
contribution (Highest to Lowest) and performance score. Sites may want to consider the questions listed before these
tables to further examine the relationship between the system and Department in achieving Essential Services and
model standards. Questions to consider are suggested based on the four categories or "quadrants" displayed in Figures
10 and 11.
Quadrant Questions to Consider
I. Low Performance/High
Department Contribution
• Is the Department's level of effort truly high, or do
they just do more than anyone else?
• Is the Department effective at what it does, and does
it focus on the right things?
• Is the level of Department effort sufficient for the
jurisdiction's needs?
• Should partners be doing more, or doing different
things?
• What else within or outside of the Department might
be causing low performance?
II. High Performance/High
Department Contribution
• What does the Department do that may contribute to
high performance in this area? Could any of these
strategies be applied to other areas?
• Is the high Department contribution appropriate, or is
the Department taking on what should be partner
responsibilities?
• Could the Department do less and maintain
satisfactory performance?
The image cannot be displayed. Your computer may not have enough memory to open the image, or the image may have been corrupted. Restart your computer, and then open the file again. If the red x still appears, you may have to delete the image and then insert it again.

Community Assessment Report Page 56
Local Public Health System Performance Assessment - Report of Results
Lexington Fayette County Health Department
7/20/2011
III. High Performance/Low
Department Contribution
• Who are the key partners that contribute to this area?
What do they do that may contribute to high
performance? Could any of these strategies be
applied to other areas?
• Does the low Department contribution seem right for
this area, or are partners picking up slack for
Department responsibilities?
• Does the Department provide needed support for
partner efforts?
• Could the key partners do less and maintain
satisfactory performance?
IV. Low Performance/Low
Department Contribution
• Who are the key partners that contribute to this area?
Are their contributions truly high, or do they just do
more than the Department?
• Is the total level of effort sufficient for the
jurisdiction's needs?
• Are partners effective at what they do, and do they
focus on the right things?
• Does the low Department contribution seem right for
this area, or is it likely to be contributing to low
performance?
• Does the Department provide needed support for
partner efforts?
• What else might be causing low performance?
The image cannot be displayed. Your computer may not have enough memory to open the image, or the image may have been corrupted. Restart your computer, and then open the file again. If the red x still appears, you may have to delete the image and then insert it again.
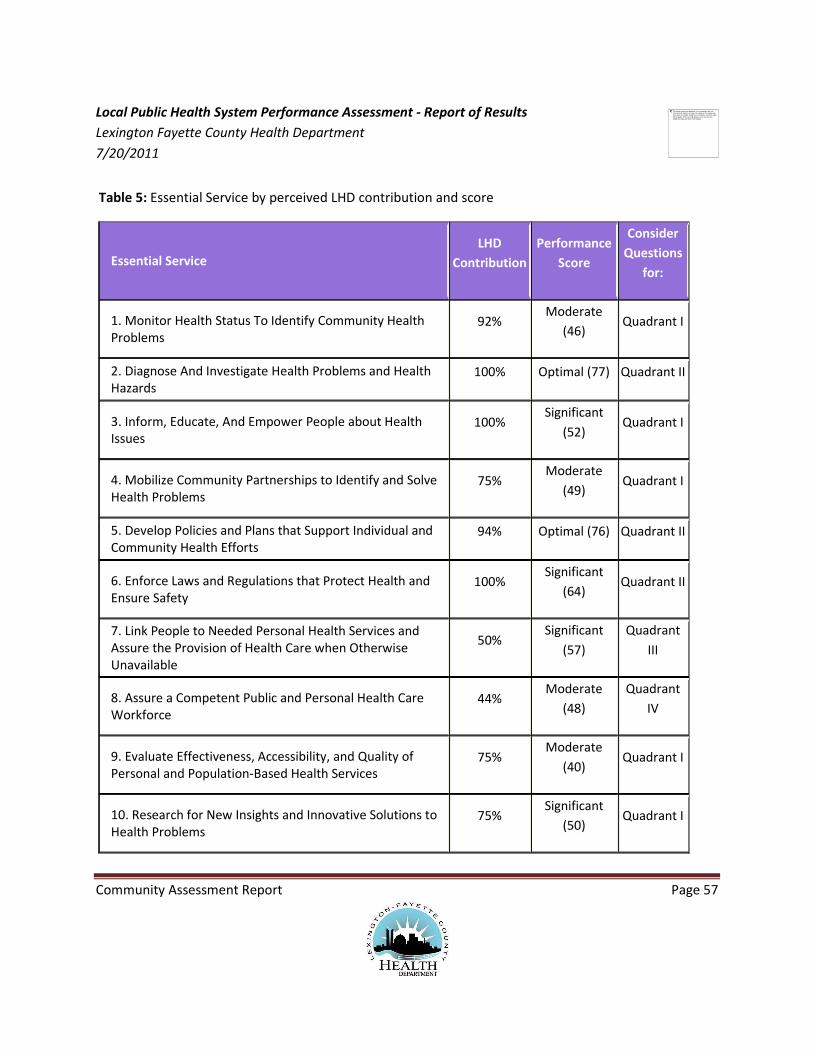
Community Assessment Report Page 57
Local Public Health System Performance Assessment - Report of Results
Lexington Fayette County Health Department
7/20/2011
Table 5: Essential Service by perceived LHD contribution and score
Essential Service
LHD
Contribution
Performance
Score
Consider
Questions
for:
1. Monitor Health Status To Identify Community Health
Problems
92% Moderate
(46) Quadrant I
2. Diagnose And Investigate Health Problems and Health
Hazards
100% Optimal (77) Quadrant II
3. Inform, Educate, And Empower People about Health
Issues
100% Significant
(52) Quadrant I
4. Mobilize Community Partnerships to Identify and Solve
Health Problems
75% Moderate
(49) Quadrant I
5. Develop Policies and Plans that Support Individual and
Community Health Efforts
94% Optimal (76) Quadrant II
6. Enforce Laws and Regulations that Protect Health and
Ensure Safety
100% Significant
(64) Quadrant II
7. Link People to Needed Personal Health Services and
Assure the Provision of Health Care when Otherwise
Unavailable
50% Significant
(57)
Quadrant
III
8. Assure a Competent Public and Personal Health Care
Workforce
44% Moderate
(48)
Quadrant
IV
9. Evaluate Effectiveness, Accessibility, and Quality of
Personal and Population-Based Health Services
75% Moderate
(40) Quadrant I
10. Research for New Insights and Innovative Solutions to
Health Problems
75% Significant
(50) Quadrant I
The image cannot be displayed. Your computer may not have enough memory to open the image, or the image may have been corrupted. Restart your computer, and then open the file again. If the red x still appears, you may have to delete the image and then insert it again.

Community Assessment Report Page 58
Local Public Health System Performance Assessment - Report of Results
Lexington Fayette County Health Department
7/20/2011
Table 6: Model standards by perceived LHD contribution and score
Model Standard
LHD
Contribution
Performance
Score
Consider
Questions
for:
1.1 Population-Based Community Health Profile (CHP) 100%
Moderate
(47) Quadrant I
1.2 Access to and Utilization of Current Technology to
Manage, Display, Analyze and Communicate Population
Health Data
100% Moderate
(38) Quadrant I
1.3 Maintenance of Population Health Registries 75%
Significant
(53)
Quadrant
IV
2.1 Identification and Surveillance of Health Threats 100%
Significant
(64) Quadrant II
2.2 Investigation and Response to Public Health Threats
and Emergencies 100% Optimal (81) Quadrant II
2.3 Laboratory Support for Investigation of Health Threats 100% Optimal (84) Quadrant II
3.1 Health Education and Promotion 100%
Moderate
(42) Quadrant I
3.2 Health Communication 100%
Significant
(55) Quadrant I
3.3 Risk Communication 100%
Significant
(60) Quadrant II
4.1 Constituency Development 75%
Significant
(53)
Quadrant
IV
The image cannot be displayed. Your computer may not have enough memory to open the image, or the image may have been corrupted. Restart your computer, and then open the file again. If the red x still appears, you may have to delete the image and then insert it again.

Community Assessment Report Page 59
Local Public Health System Performance Assessment - Report of Results
Lexington Fayette County Health Department
7/20/2011
4.2 Community Partnerships 75%
Moderate
(46)
Quadrant
IV
5.1 Government Presence at the Local Level 100%
Significant
(71) Quadrant II
5.2 Public Health Policy Development 100% Optimal (79) Quadrant II
5.3 Community Health Improvement Process 75%
Significant
(57)
Quadrant
III
5.4 Plan for Public Health Emergencies 100% Optimal (97) Quadrant II
6.1 Review and Evaluate Laws, Regulations, and
Ordinances 100%
Significant
(63) Quadrant II
6.2 Involvement in the Improvement of Laws,
Regulations, and Ordinances 100%
Significant
(58) Quadrant II
6.3 Enforce Laws, Regulations and Ordinances 100%
Significant
(70) Quadrant II
7.1 Identification of Populations with Barriers to Personal
Health Services 50%
Significant
(71)
Quadrant
III
The image cannot be displayed. Your computer may not have enough memory to open the image, or the image may have been corrupted. Restart your computer, and then open the file again. If the red x still appears, you may have to delete the image and then insert it again.
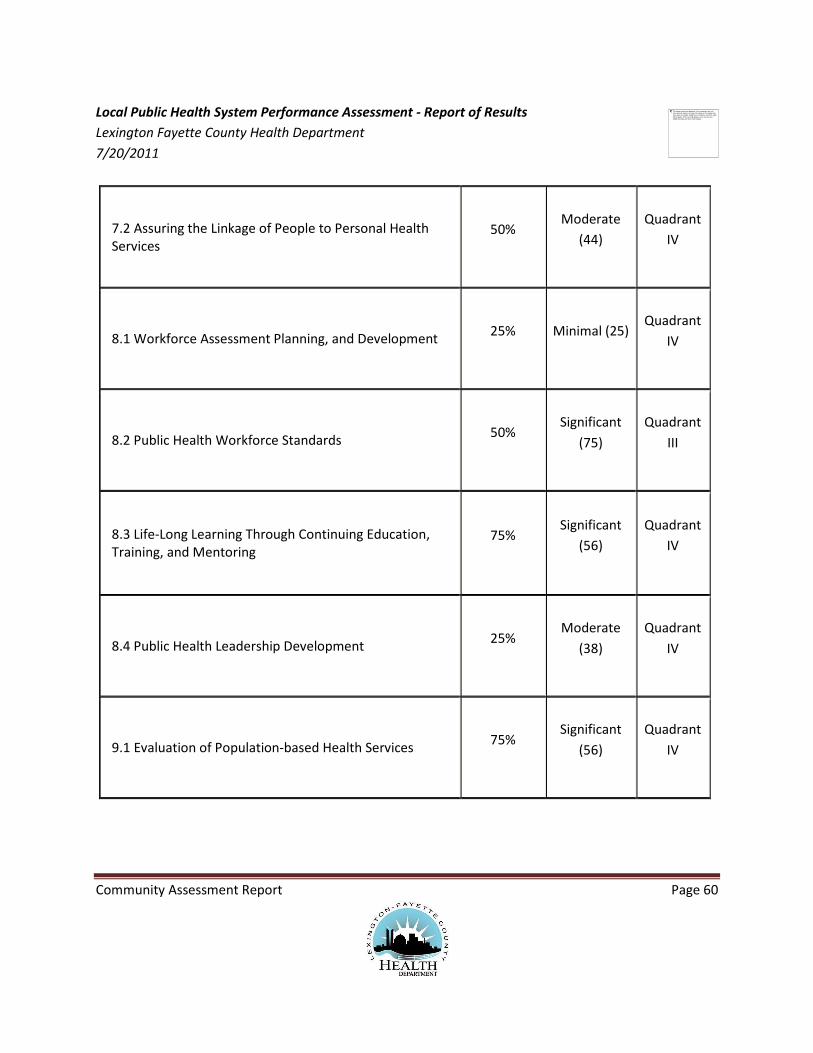
Community Assessment Report Page 60
Local Public Health System Performance Assessment - Report of Results
Lexington Fayette County Health Department
7/20/2011
7.2 Assuring the Linkage of People to Personal Health
Services 50%
Moderate
(44)
Quadrant
IV
8.1 Workforce Assessment Planning, and Development 25% Minimal (25)
Quadrant
IV
8.2 Public Health Workforce Standards 50%
Significant
(75)
Quadrant
III
8.3 Life-Long Learning Through Continuing Education,
Training, and Mentoring 75%
Significant
(56)
Quadrant
IV
8.4 Public Health Leadership Development 25%
Moderate
(38)
Quadrant
IV
9.1 Evaluation of Population-based Health Services 75%
Significant
(56)
Quadrant
IV
The image cannot be displayed. Your computer may not have enough memory to open the image, or the image may have been corrupted. Restart your computer, and then open the file again. If the red x still appears, you may have to delete the image and then insert it again.

Community Assessment Report Page 61
Local Public Health System Performance Assessment - Report of Results
Lexington Fayette County Health Department
7/20/2011
9.2 Evaluation of Personal Health Care Services 50%
Significant
(50)
Quadrant
IV
9.3 Evaluation of the Local Public Health System 100% Minimal (13) Quadrant I
10.1 Fostering Innovation 75%
Moderate
(44)
Quadrant
IV
10.2 Linkage with Institutions of Higher Learning and/or
Research 100%
Significant
(50) Quadrant I
10.3 Capacity to Initiate or Participate in Research 50%
Significant
(56)
Quadrant
IV
The image cannot be displayed. Your computer may not have enough memory to open the image, or the image may have been corrupted. Restart your computer, and then open the file again. If the red x still appears, you may have to delete the image and then insert it again.

Community Assessment Report Page 62
Local Public Health System Performance Assessment - Report of Results
Lexington Fayette County Health Department
7/20/2011
Figure 10: Scatter plot of Essential Service scores and LHD contribution scores
Essential Service data are calculated as a mean of model standard ratings within each Essential Service.
Figure 11: Scatter plot of model standard scores and LHD contribution scores
The image cannot be displayed. Your computer may not have enough memory to open the image, or the image may have been corrupted. Restart your computer, and then open the file again. If the red x still appears, you may have to delete the image and then insert it again.
The image cannot be displayed. Your computer may not have enough memory to open the image, or the image may have been corrupted. Restart your computer, and then open the file again. If the red x still appears, you may have to delete the image and then insert it again.
Community Assessment Report Page 63
Local Public Health System Performance Assessment - Report of Results
Lexington Fayette County Health Department
7/20/2011
The image cannot be displayed. Your computer may not have enough memory to open the image, or the image may have been corrupted. Restart your computer, and then open the file again. If the red x still appears, you may have to delete the image and then insert it again.
The image cannot be displayed. Your computer may not have enough memory to open the image, or the image may have been corrupted. Restart your computer, and then open the file again. If the red x still appears, you may have to delete the image and then insert it again.

Community Assessment Report Page 64
APPENDIX C: Focus Group Questionnaire
Perceptions among community members regarding the most important issues facing their
community
1. What do you think are the 3 most important issues that must be addressed to improve your
community?
2. What actions would you support to improve your community?
3. Lexington Fayette County residents identified the following issues as the top 5 health and social
issues in the Lexington Fayette 2010 Community Needs Assessment survey:
1. Unemployment
2. Drug and Alcohol Abuse
3. Health Care Costs
4. Obesity
5. Safe Neighborhoods.
What steps should our community take to address these five health and social issues?
4. Lexington Fayette County Residents identified the following as the top 5 environmental issues
in the Lexington Fayette 2010 Community Needs Assessment survey:
1. Littering
2. Energy Efficiency
3. Clean Drinking Water
4. Recycling
5. Flood and Drainage Problems
What steps should our community take to address these five environmental issues?
5. What are some positive things about your community?

Community Assessment Report Page 65
APPENDIX D: Focus Group Health Department Services Survey Results
Focus Group Results
Total # of Focus Group Participants for Survey = 64
Percent of Focus Group Participants Familiar with Health Department Programs
Health Dept Service # %
WIC Program 40 62
Dental Clinic 38 59
Diabetes Prevention 27 42
HIV/AIDS 26 41
Public Health Clinic North 25 39
Family Planning 23 36
School Health Program 23 36
STDs 23 36
Breast & Cervical Cancer Screening 22 34
Pregnancy Care Services 22 34
Primary Care Center 20 31
Environmental Health 14 22
Hands Program 14 22
Healthy Living Class 14 22
Public Health Clinic South 14 22
Weight Loss Support Group 14 22
Bluegrass-Aspendale Teen Center 13 20
Nutrition Counseling 13 20
Tobacco Cessation & Prevention 13 20
Adult Day Care Program 10 16
Breastfeeding Information & Help 10 16
Tuberculosis 10 16
Epidemiology & Emergency Health Planning 8 12
Medical Reserve Corps 8 12

Community Assessment Report Page 66
Barriers to Using Health Department Services
Type of Barrier # %
Cost 29 45
Unfamiliar with health department Services 23 36
Transportation 23 36
Location 13 20
Language Barrier 11 17
Longer waiting time to schedule appointment 4 6
Long wait time at clinic 2 3
Office hours for health department 1 1
Other 1 1
Services that Health Department Should Offer
Type of Service # %
Services for uninsured 3 7
Nutrition and Exercise Education 3 5
Better walk-in service and attention 2 3
Health Services for people with health problems 1 1
Denture Clinic 1 1
Outreach in Neighborhoods 1 1
Help for low-income families 1 1
Timely service 1 1
Pediatric dental services 1 1
Help at appointment desk for primary care 1 1
Information in Spanish 1 1
Same day service for sick people 1 1
More payment windows at clinic 1 1
Conversation with youth about drugs 1 1
More assistance for women 1 1
Transportation services to doctor's appointment 1 1
Gainsway area mobile clinic 1 1

Community Assessment Report Page 67
Have you or some you know been involved with the Department for Community Based Services due
to child abuse allegations?
Yes/No # %
No 44 69
Yes 13 20
Did not answer 7 11
If yes, in your opinion was the treatment fair?
Yes/No # %
Yes 5 50
Did not answer 4 40
No 1 10
Is it important to have a health and wellness program offered at work?
Yes/No # %
Yes 59 92
Did not answer 4 6
No 1 2