Embed Size (px)
Citation preview
Community Assessment OverviewEarly ExplorersHead Start & Early Head Start Policy CouncilNovember 2011
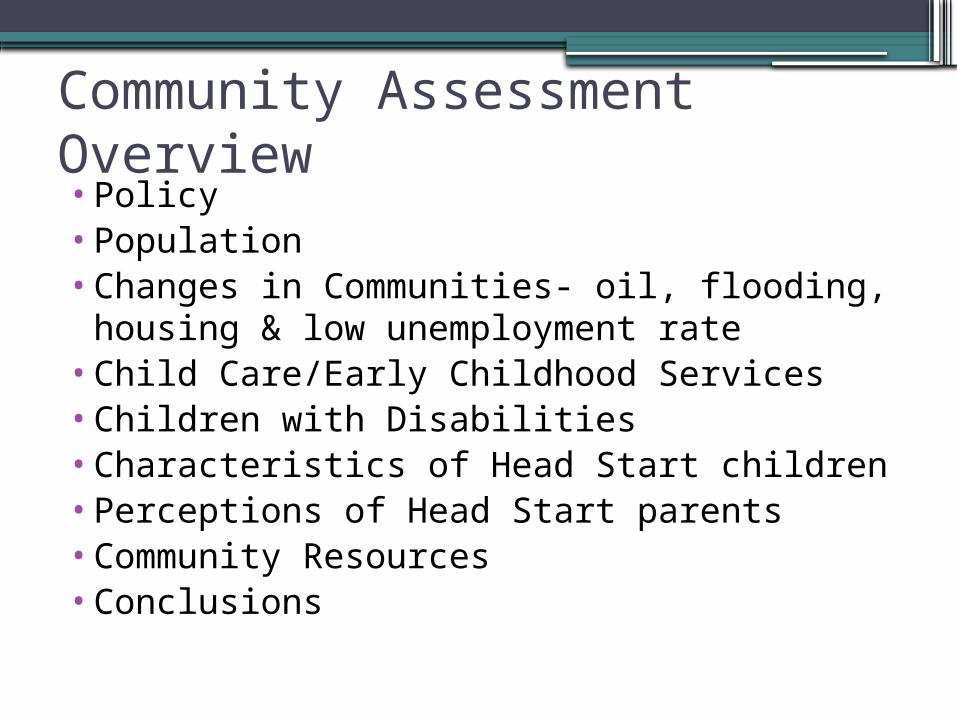
Community Assessment Overview•Policy •Population•Changes in Communities- oil, flooding,
housing & low unemployment rate•Child Care/Early Childhood Services•Children with Disabilities •Characteristics of Head Start children•Perceptions of Head Start parents•Community Resources •Conclusions
Community Assessment Policy
•Policy http://staff.earlyexplorers.org/ckfinder/userfiles/files/252_Community_Assessment.pdf
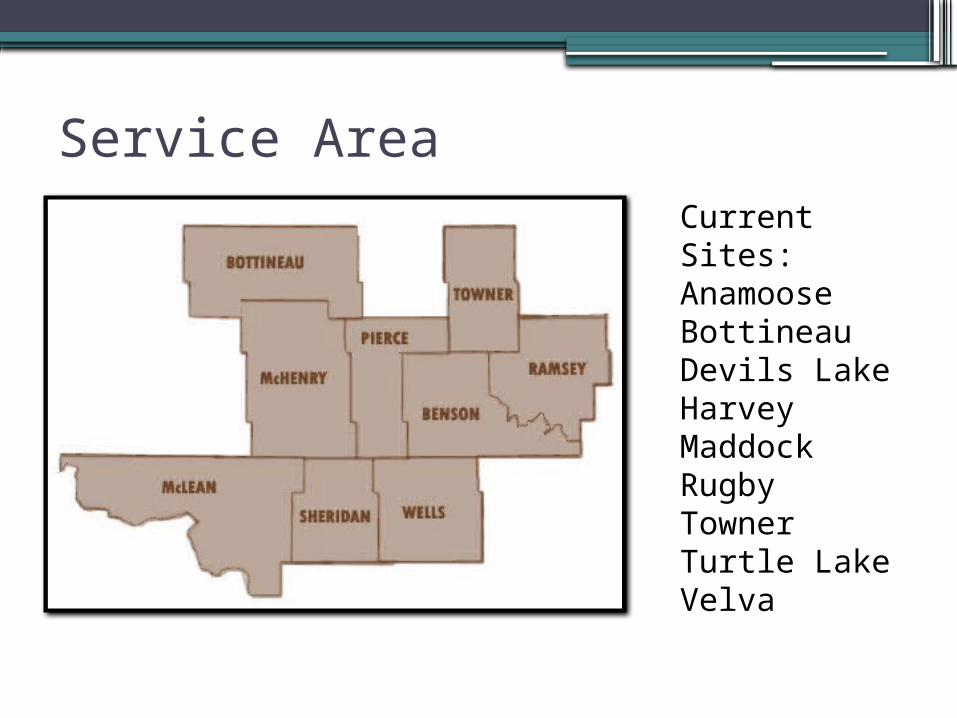
Service Area Current Sites:AnamooseBottineauDevils LakeHarvey MaddockRugbyTownerTurtle LakeVelva
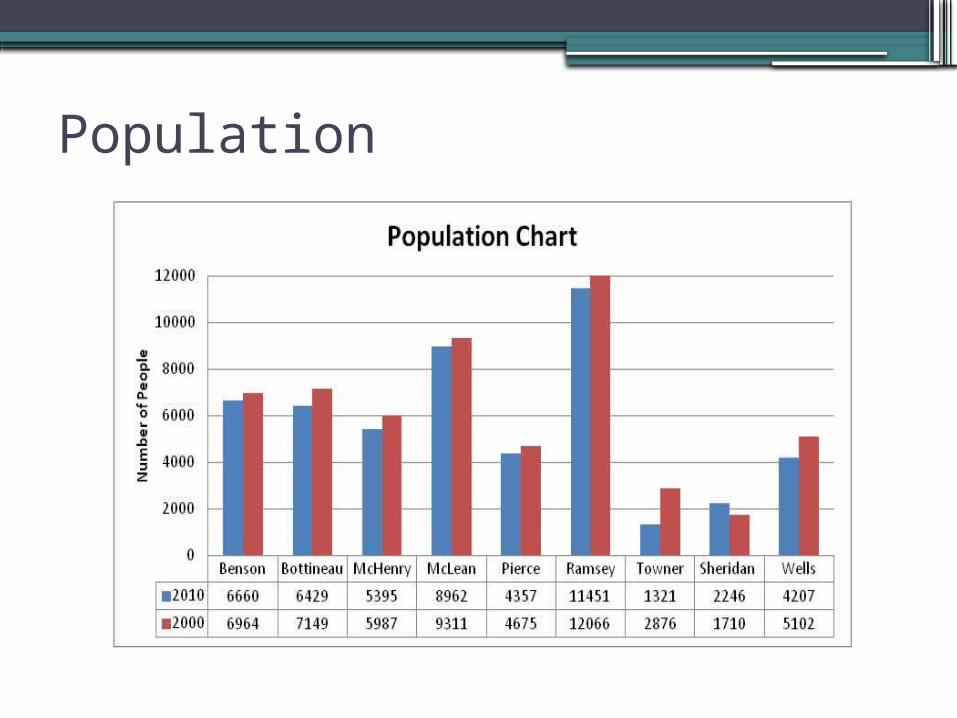
Population
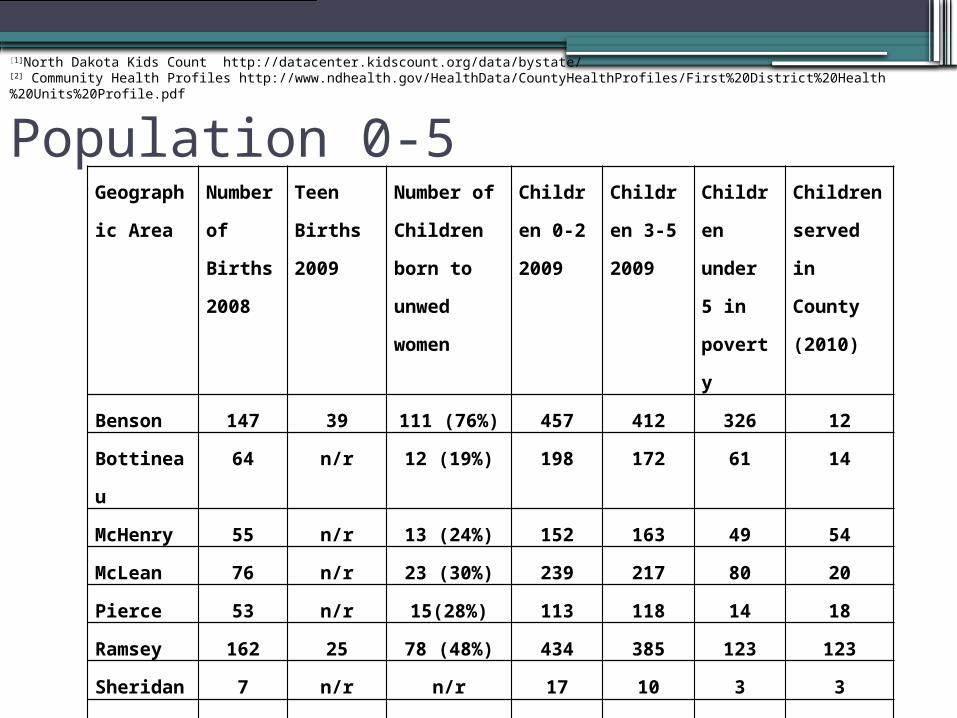
Population 0-5 Geograp
hic Area
Numb
er of
Births
2008
Teen
Births
2009
Number
of
Children
born to
unwed
women
Childre
n 0-2
2009
Childre
n 3-5
2009
Childre
n
under
5 in
povert
y
Children
served
in
County
(2010)
Benson 147 39 111 (76%) 457 412 326 12
Bottinea
u
64 n/r 12 (19%) 198 172 61 14
McHenry 55 n/r 13 (24%) 152 163 49 54
McLean 76 n/r 23 (30%) 239 217 80 20
Pierce 53 n/r 15(28%) 113 118 14 18
Ramsey 162 25 78 (48%) 434 385 123 123
Sheridan 7 n/r n/r 17 10 3 3
Towner 19 n/r 11(58%) 44 37 3 0
Wells 30 6 13 (43%) 107 87 29 38
Total 613 70 276 (36%) 1761 1601 688
[1]North Dakota Kids Count http://datacenter.kidscount.org/data/bystate/[2] Community Health Profiles http://www.ndhealth.gov/HealthData/CountyHealthProfiles/First%20District%20Health%20Units%20Profile.pdf
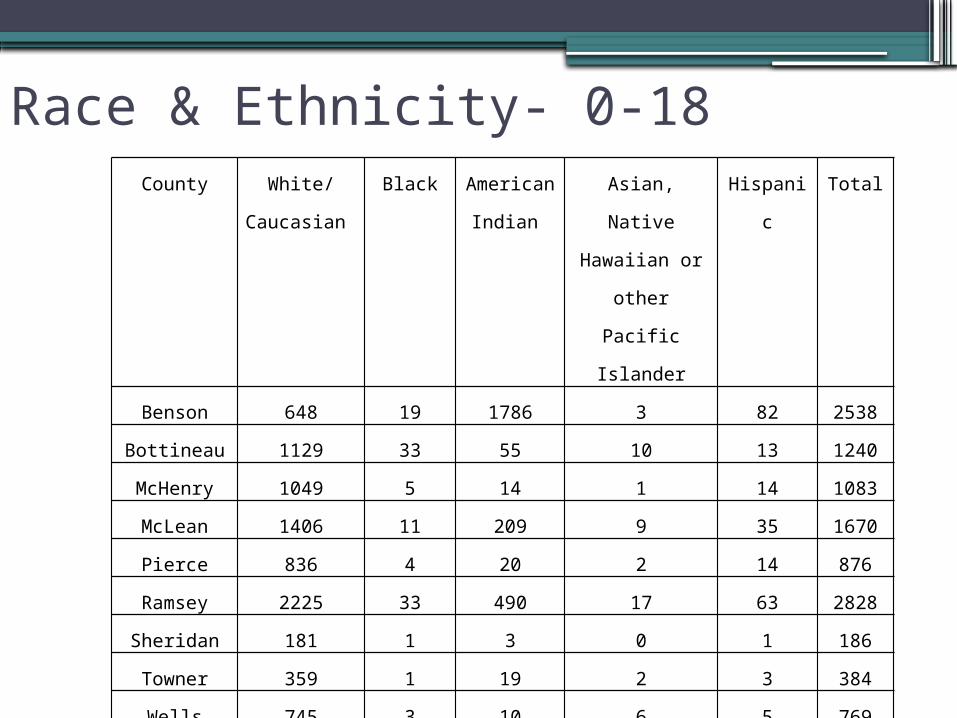
Race & Ethnicity- 0-18 County White/
Caucasian
Black American
Indian
Asian, Native
Hawaiian or
other Pacific
Islander
Hispanic Total
Benson 648 19 1786 3 82 2538
Bottineau 1129 33 55 10 13 1240
McHenry 1049 5 14 1 14 1083
McLean 1406 11 209 9 35 1670
Pierce 836 4 20 2 14 876
Ramsey 2225 33 490 17 63 2828
Sheridan 181 1 3 0 1 186
Towner 359 1 19 2 3 384
Wells 745 3 10 6 5 769
Total 8578 110 2606 50 230 11574
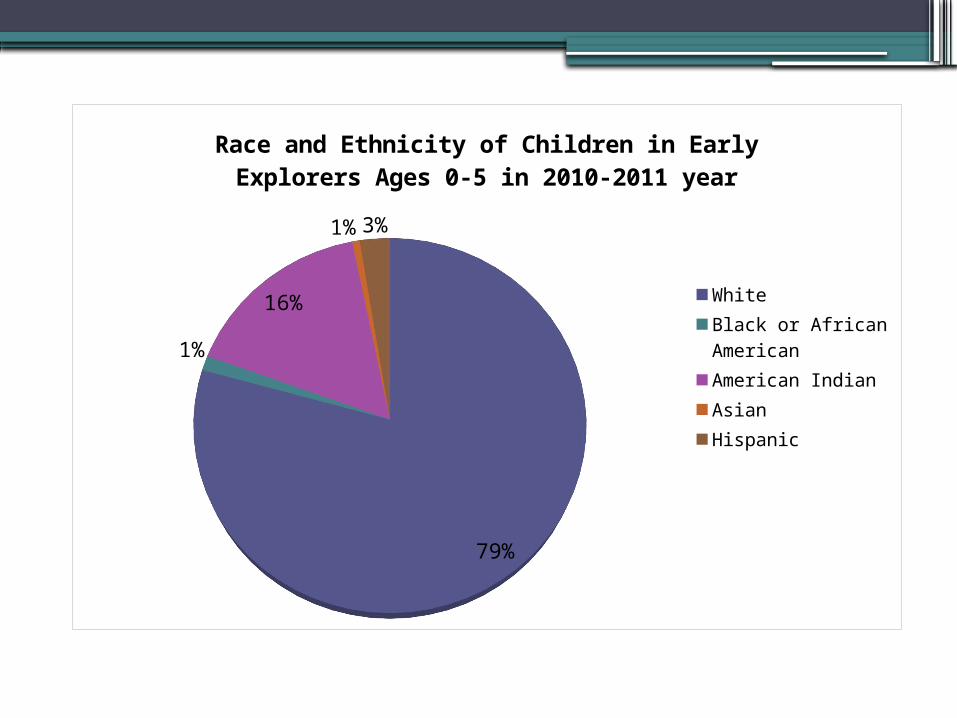
79%
1%
16%
1%3%
Race and Ethnicity of Children in Early Ex-plorers Ages 0-5 in 2010-2011 year
WhiteBlack or African Amer-icanAmerican IndianAsianHispanic
Changes in Communities•Oil Producing Areas•Flooding•Housing•Low Unemployment Rate
▫Commuting ▫No support▫North Dakota does not have the same
services as other states.

Oil Facts -2011Edition of ND Oil & Gas Industry Report• North Dakota is the fourth largest oil producing state in
the US. • Seventeen counties in North Dakota are oil producing. • The state’s average production in 2010 was 309,679
barrels of oil per day, totaling 113,032,814 barrels for the year. This is 33,296,346 barrels greater than the 2009 total.
• In 2010, the average wage in the oil and gas extraction industry was $90,225. That wage is 141.5% above the state average wage of $37,353.
• In 2010, the oil industry paid $85.2 million in royalties and $295 in lease bonuses to trust funds managed by the State Land Department.
• The oil and gas industry employed 12,750 last year, and companies expect that number to keep going up. The industry and the state are updating a study to keep pace with the need for labor, skills and housing as the number of rigs in the state keeps increasing.
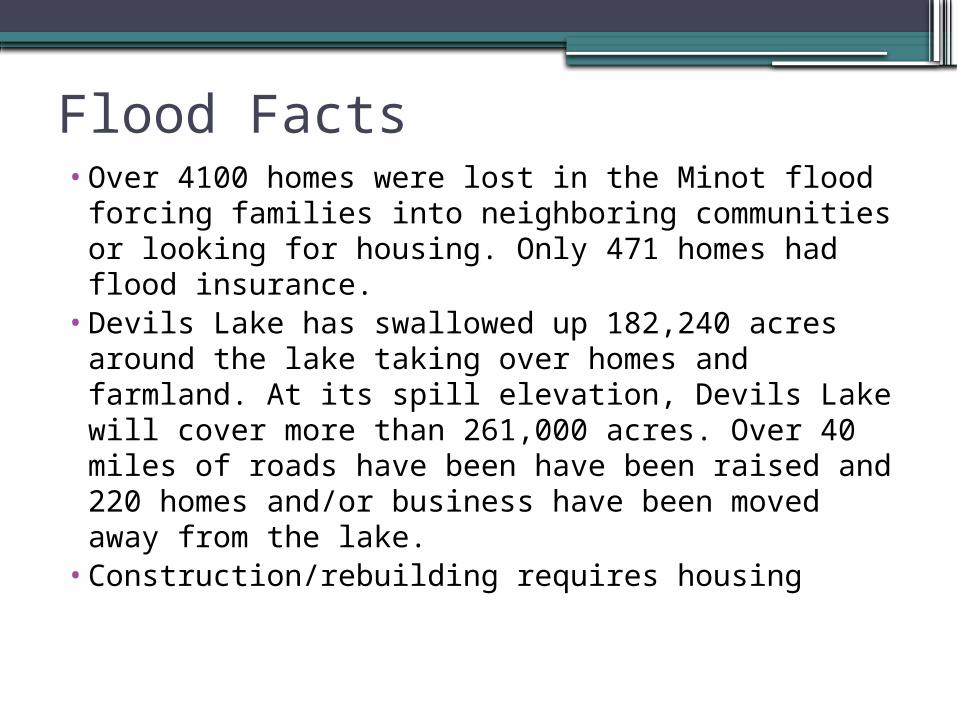
Flood Facts• Over 4100 homes were lost in the Minot flood
forcing families into neighboring communities or looking for housing. Only 471 homes had flood insurance.
• Devils Lake has swallowed up 182,240 acres around the lake taking over homes and farmland. At its spill elevation, Devils Lake will cover more than 261,000 acres. Over 40 miles of roads have been have been raised and 220 homes and/or business have been moved away from the lake.
• Construction/rebuilding requires housing
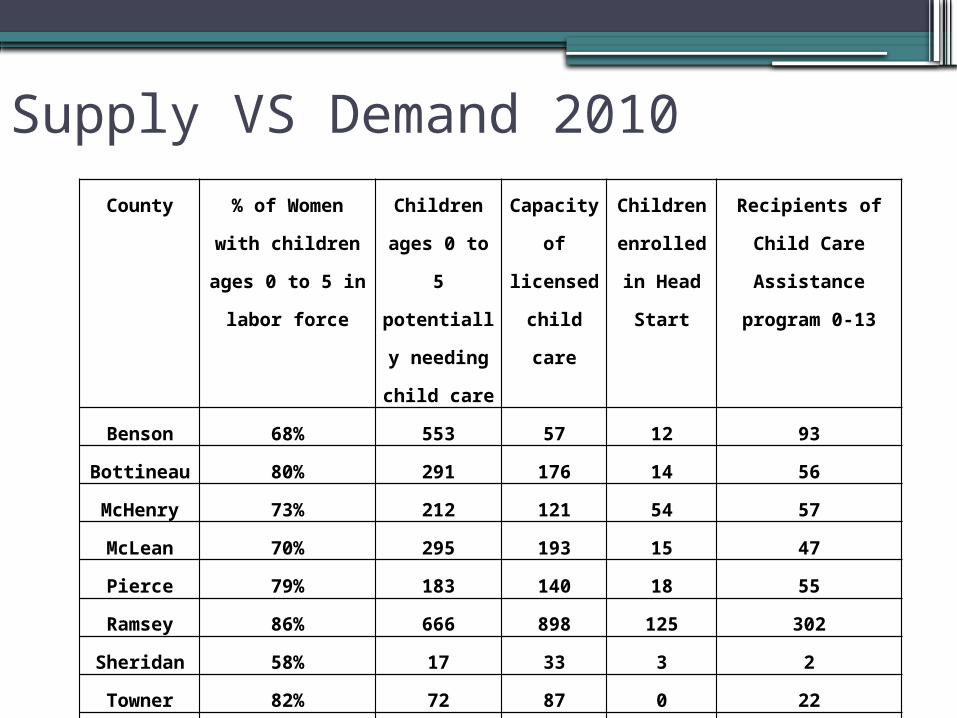
Supply VS Demand 2010County % of Women
with children
ages 0 to 5 in
labor force
Children
ages 0 to
5
potentiall
y needing
child care
Capacit
y of
licensed
child
care
Children
enrolled
in Head
Start
Recipients of
Child Care
Assistance
program 0-13
Benson 68% 553 57 12 93
Bottineau 80% 291 176 14 56
McHenry 73% 212 121 54 57
McLean 70% 295 193 15 47
Pierce 79% 183 140 18 55
Ramsey 86% 666 898 125 302
Sheridan 58% 17 33 3 2
Towner 82% 72 87 0 22
Wells 81% 147 165 41 25
Total 75% 2436 1870 282 659
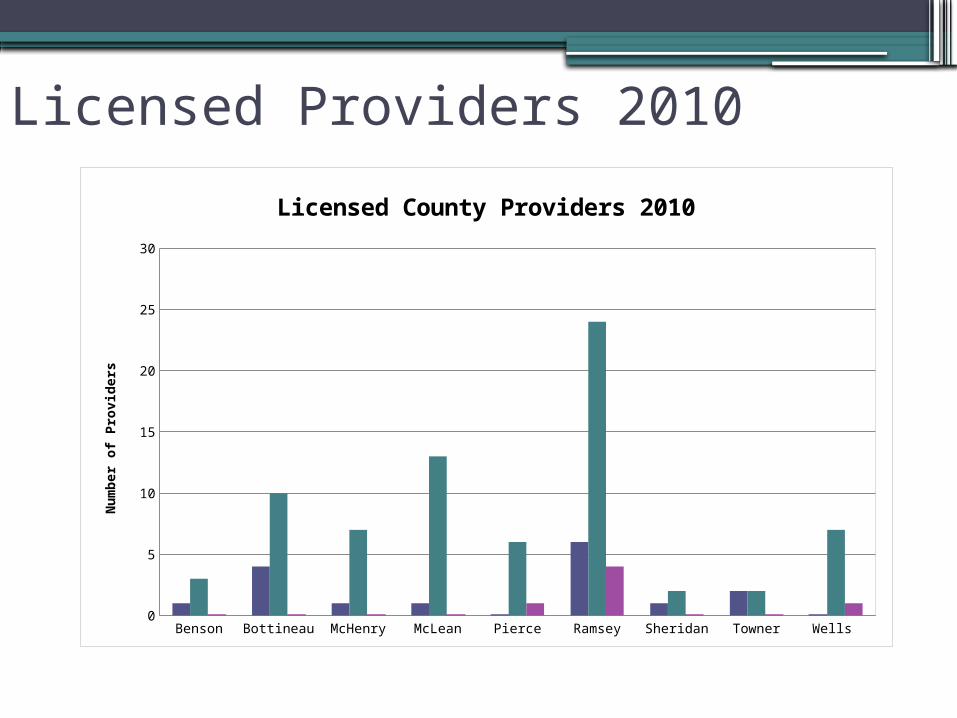
Licensed Providers 2010
Benson Bottineau McHenry McLean Pierce Ramsey Sheridan Towner Wells
Family 1 4 1 1 0 6 1 2 0
Group 3 10 7 13 6 24 2 2 7
Center 0 0 0 0 1 4 0 0 1
2.5
7.5
12.5
17.5
22.5
27.5
Licensed County Providers 2010
Num
ber
of
Pro
vid
ers
Children With Disabilities•Early Head Start works primarily with
two infant development programs•Head Start works with five special
education units•Each unit and school district operates
complete different•Program is required to reserve 10% of
enrollment for children with special needs
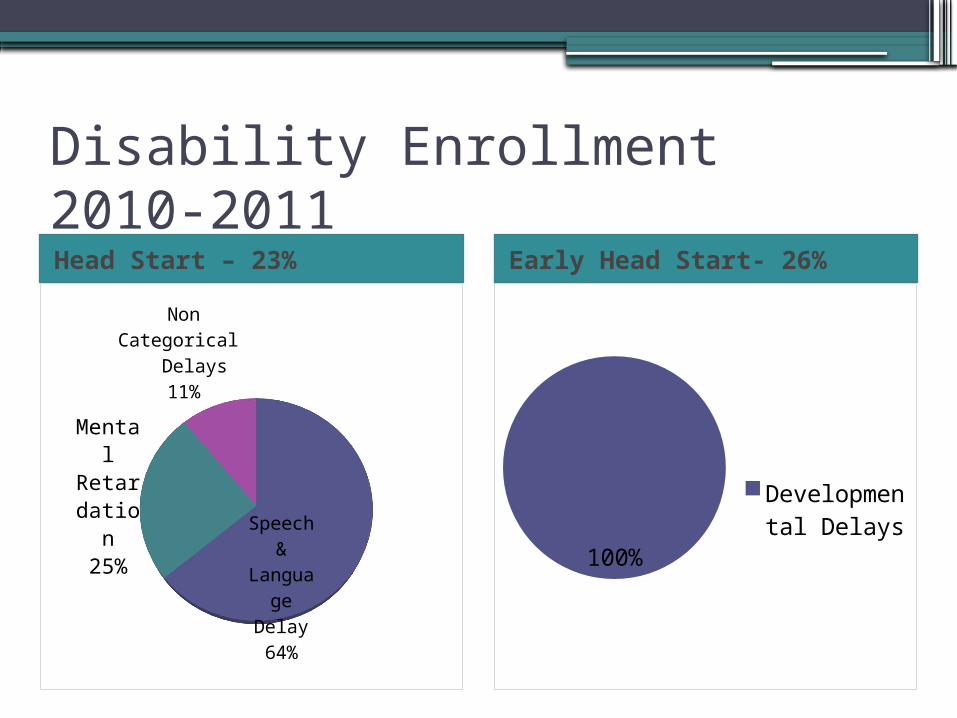
Disability Enrollment 2010-2011Head Start – 23% Early Head Start- 26%
Speech &
Lan-guage Delay64%
Mental Retar-dation25%
Non Categor-ical Delays
11%
100%
Develop-mental De-lays
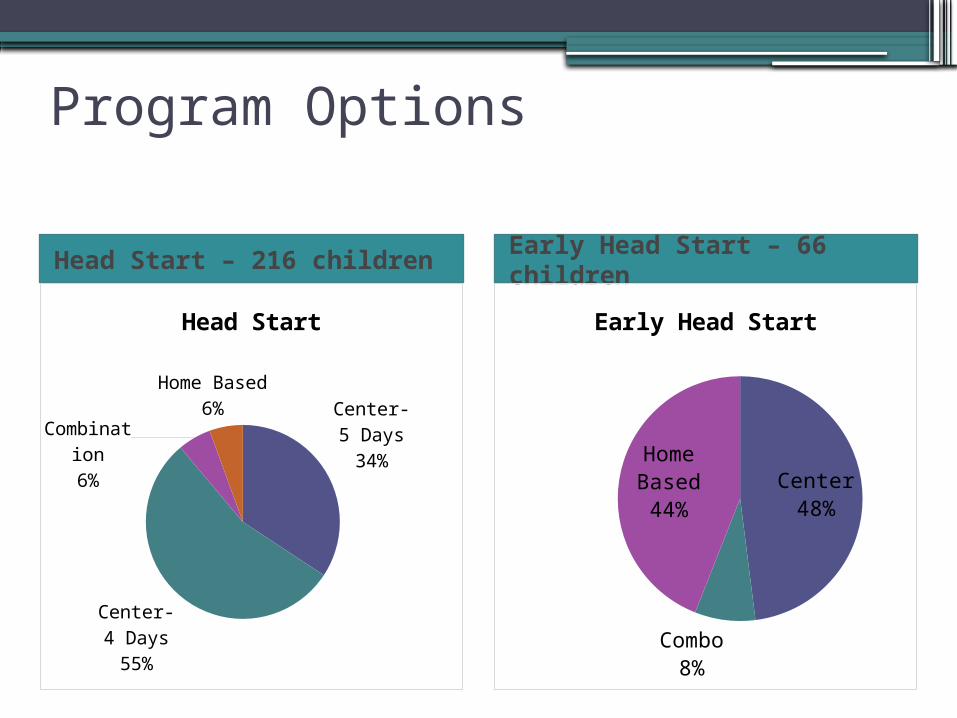
Program Options
Head Start – 216 childrenEarly Head Start – 66 children
Center- 5 Days34%
Center- 4 Days55%
Com-bina-tion6%
Home Based6%
Head Start
Center48%
Combo8%
Home Based44%
Early Head Start
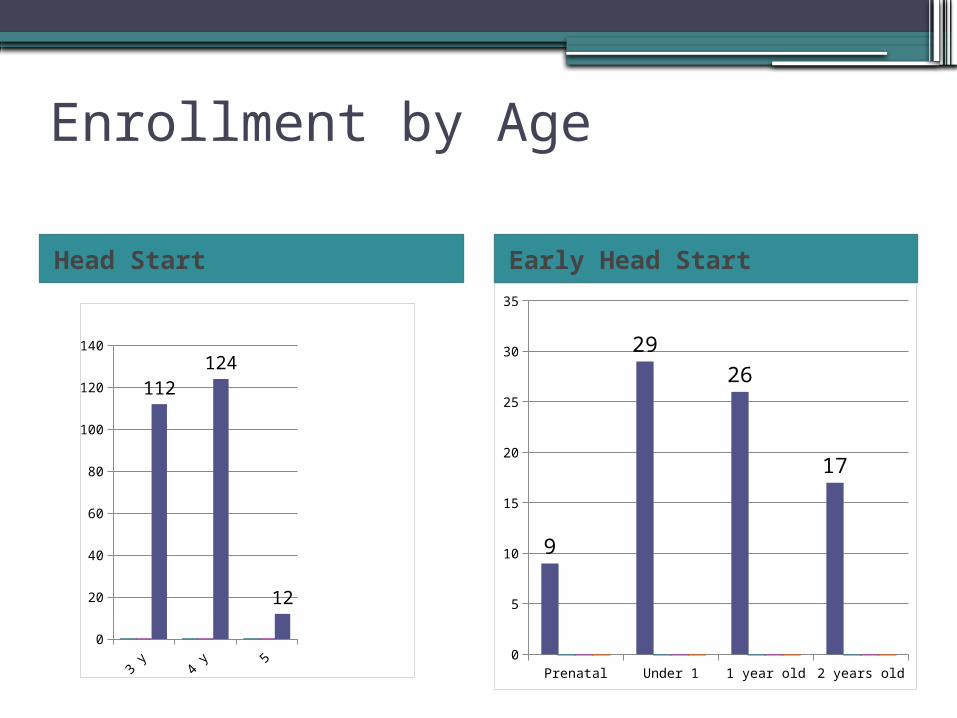
Enrollment by Age
Head Start Early Head Start
Prenatal Under 1 1 year old 2 years old0
5
10
15
20
25
30
35
9
2926
17
3 years old
4 years old
5 + 0
20
40
60
80
100
120
140
112124
12
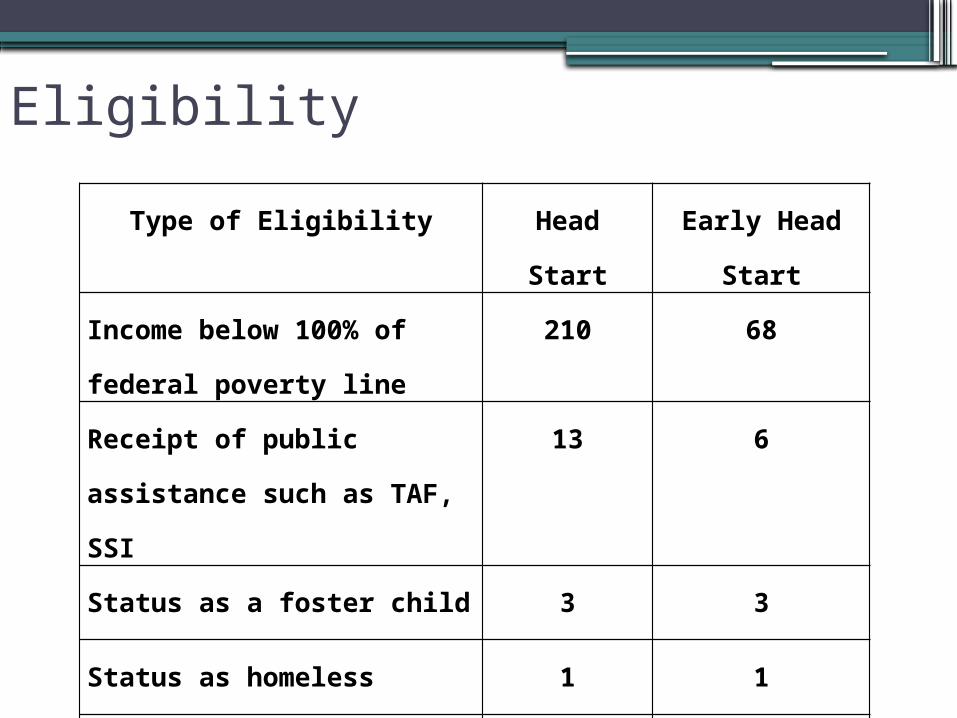
Eligibility
Type of Eligibility Head
Start
Early Head
Start
Income below 100% of
federal poverty line
210 68
Receipt of public
assistance such as TAF,
SSI
13 6
Status as a foster child 3 3
Status as homeless 1 1
Over Income 14 3
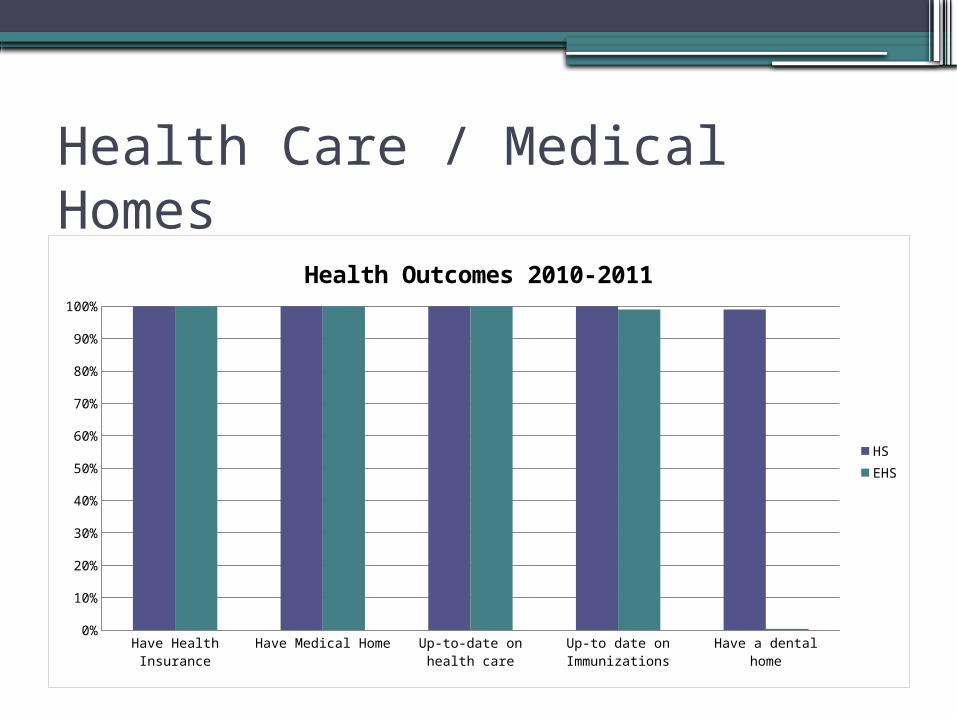
Health Care / Medical Homes
Have
Hea
lth In
sura
nce
Have
Med
ical H
ome
Up-to
-dat
e on
hea
lth car
e
Up-to
dat
e on
Imm
unizat
ions
Have
a de
ntal
hom
e0%
10%
20%
30%
40%
50%
60%
70%
80%
90%
100%
Health Outcomes 2010-2011
HSEHS
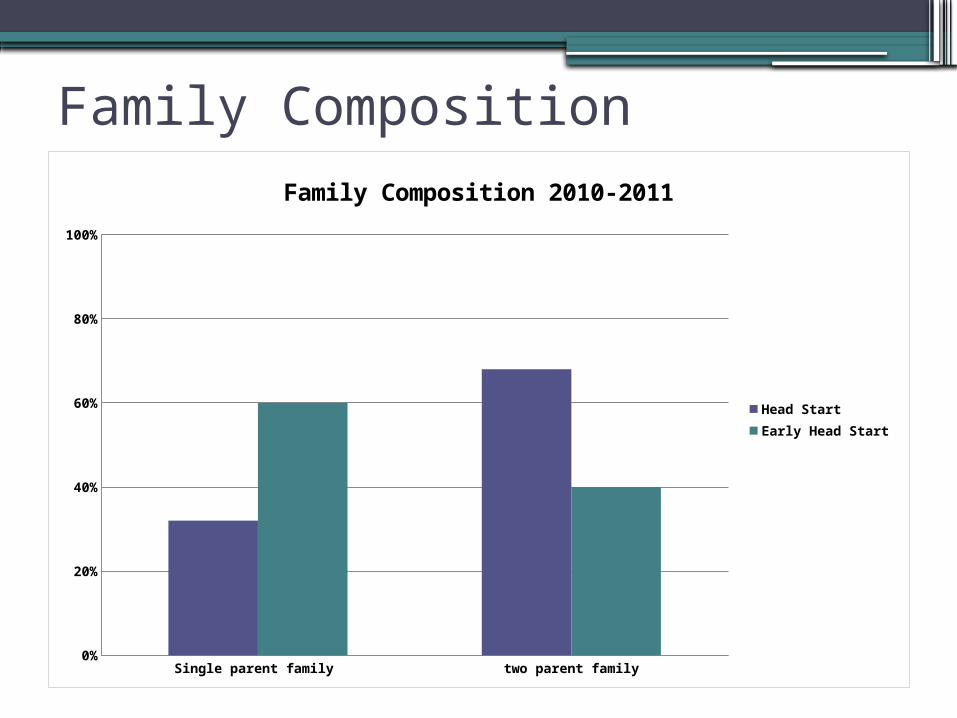
Family Composition
Single parent family two parent family0%
20%
40%
60%
80%
100%
Family Composition 2010-2011
Head StartEarly Head Start
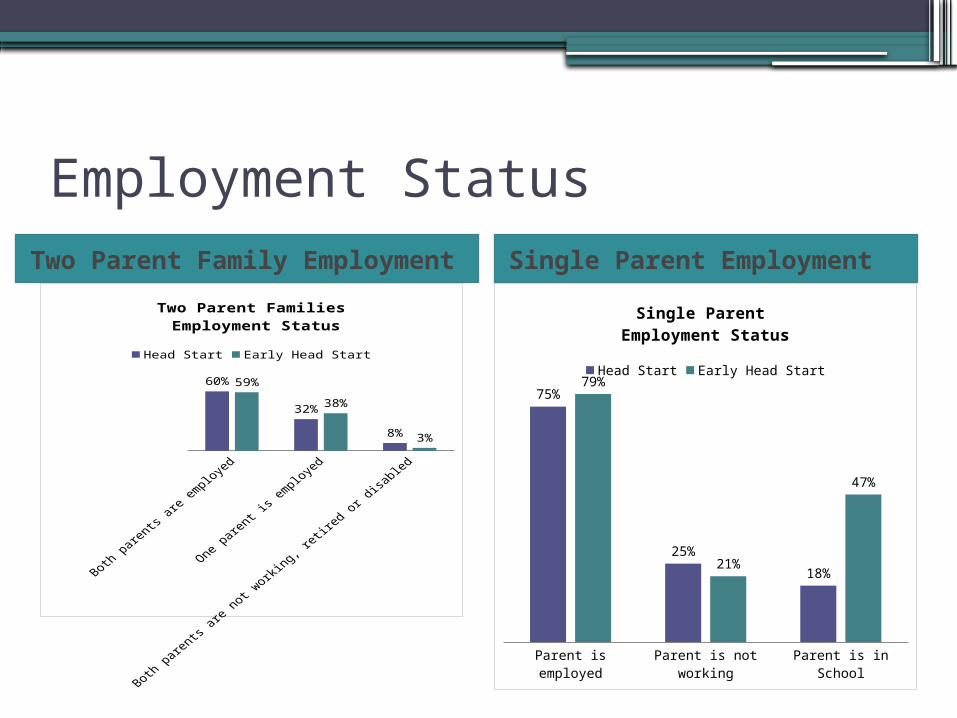
Employment StatusTwo Parent Family Employment
Single Parent Employment
60%
32%
8%
59%
38%
3%
Two Parent Families Employment Status
Head Start Early Head Start
Parent is employedParent is not working Parent is in School
75%
25%
18%
79%
21%
47%
Single Parent Employment Status
Head Start Early Head Start
Community Resources
•Rate of families have insurance
•Reasons physicians will not move to rural areas
•List of Services
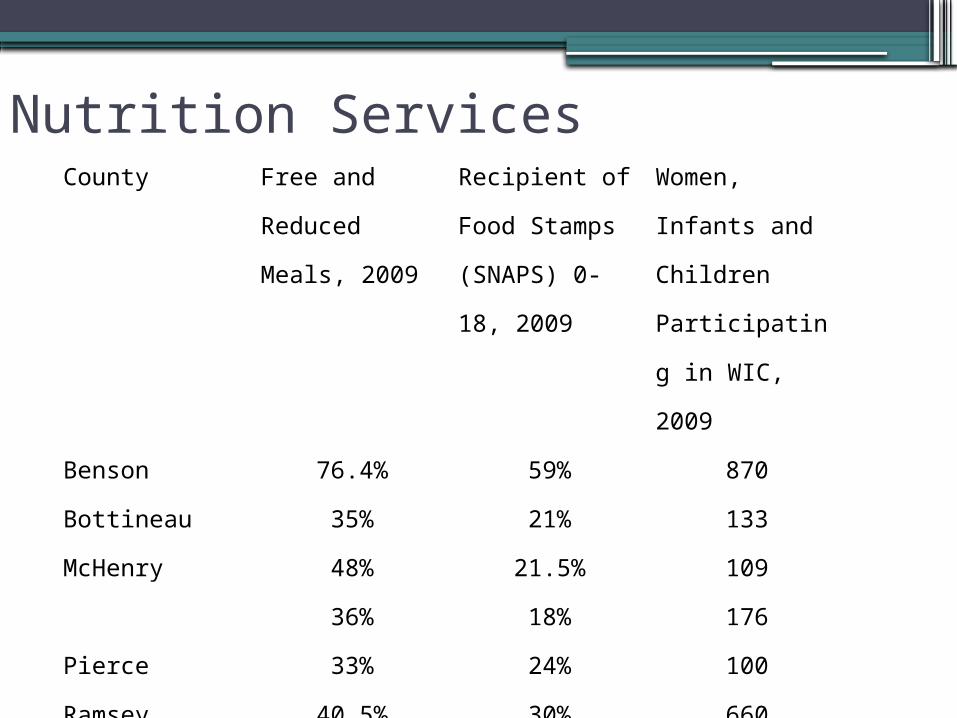
Nutrition ServicesCounty Free and
Reduced
Meals, 2009
Recipient of
Food Stamps
(SNAPS) 0-18,
2009
Women,
Infants and
Children
Participating in
WIC, 2009
Benson 76.4% 59% 870
Bottineau 35% 21% 133
McHenry 48% 21.5% 109
36% 18% 176
Pierce 33% 24% 100
Ramsey 40.5% 30% 660
50% 43% 44
Towner 32% 23% 31
Wells 31% 18% 95
Community Assessment Conclusions1. Early Explorers Head Start is serving the
majority of at risk or income eligible children.
Recommendation – Head Start will continue to focus on recruitment efforts and work with local agencies to identify at risk populations. There are no areas within the service area that have a large number of underserved income eligible children. Any pockets of underserved children may be served through future Pre-Kindergarten Partnerships with school districts.

Community Assessment Conclusions2. Pre-Kindergarten collaborations are
necessary to survive future legislation providing funding for state funded Pre-Kindergarten programs.
Recommendations- The program will continue to work with local school districts in identifying potential partnerships. The program will focus on hiring new employees that meet the Title 1 state teacher licensor requirements.
Community Assessment Conclusions3. Increase collaboration with community
partners.
Recommendations- The program has a number of strong partnerships with community partners. This can be increased to extend parent education opportunities to families not enrolled in the Head Start program and better connect financial resources to serve at risk families.
Community Assessment Conclusions4. Expand Early Head Start Services in
Pierce County.
Recommendation- Infant and toddler childcare are difficult to obtain by low income families. The program will make application when expansion opportunities arise.
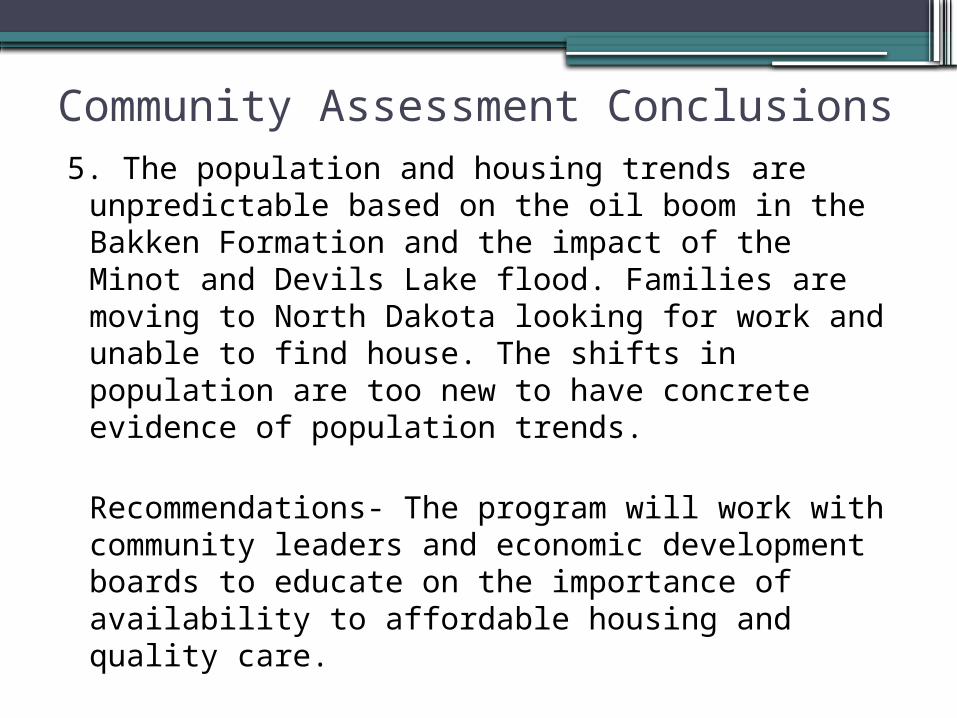
Community Assessment Conclusions5. The population and housing trends are
unpredictable based on the oil boom in the Bakken Formation and the impact of the Minot and Devils Lake flood. Families are moving to North Dakota looking for work and unable to find house. The shifts in population are too new to have concrete evidence of population trends.
Recommendations- The program will work with community leaders and economic development boards to educate on the importance of availability to affordable housing and quality care.
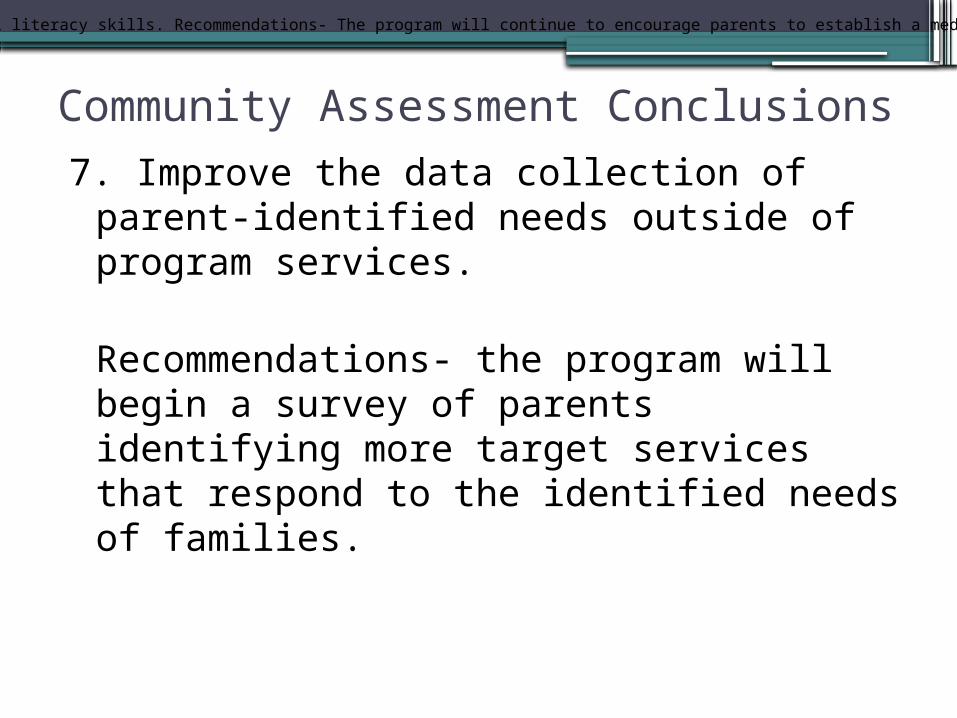
Community Assessment Conclusions7. Improve the data collection of parent-
identified needs outside of program services.
Recommendations- the program will begin a survey of parents identifying more target services that respond to the identified needs of families.
•Based on shortages in the medically underserved areas, the program must focus on the importance of a medical home and increase parents medical literacy skills. Recommendations- The program will continue to encourage parents to establish a medical home and provide information on preventative health measures including physical fitness, childhood obesity, nutrition and mental health.
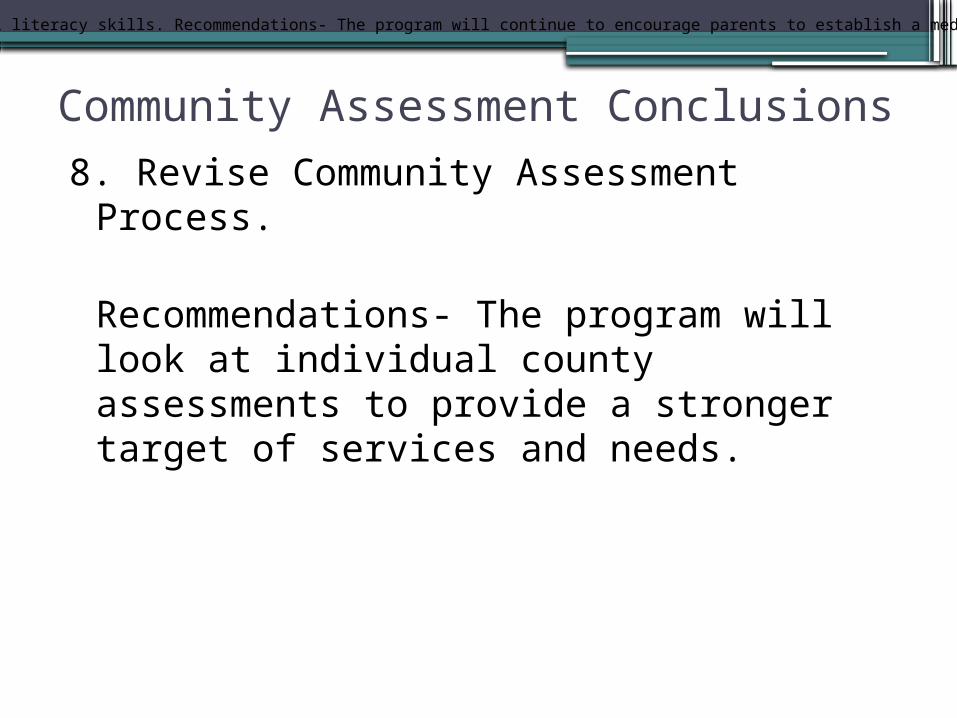
Community Assessment Conclusions8. Revise Community Assessment Process.
Recommendations- The program will look at individual county assessments to provide a stronger target of services and needs.
•Based on shortages in the medically underserved areas, the program must focus on the importance of a medical home and increase parents medical literacy skills. Recommendations- The program will continue to encourage parents to establish a medical home and provide information on preventative health measures including physical fitness, childhood obesity, nutrition and mental health.