Embed Size (px)
Citation preview
Available online at www.sciencedirect.com
Polar Science 4 (2010) 71e80http://ees.elsevier.com/polar/
Communities of algae and cyanobacteria on glaciers inwest Greenland
Jun Uetake a,b,*, Takeshi Naganuma c, Martin Bay Hebsgaard d, Hiroshi Kanda b,Shiro Kohshima e
a Transdisciplinary Research Integration Center, Toranomon, Minato, Tokyo 105-0001, Japanb National Institute of Polar Research, Midori-cho, Tachikawa, Tokyo 190-8518, Japan
c Graduate School of Biosphere Science, Hiroshima University, Kagamiyama, Higashi-hiroshima, Hiroshima 739-8528, Japand Institute of Evolutionary Biology, The University of Edinburgh, Edinburgh EH9 3JT, United Kingdom
e Wildlife Research Center of Kyoto University, Tanaka-Sekidencho, Sakyo, Kyoto 606-8203, Japan
Received 1 April 2009; revised 25 February 2010; accepted 8 March 2010
Available online 24 March 2010
Abstract
Communities of algae and cyanobacteria on two glaciers in west Greenland (the Qaanaaq and Russel glaciers) were analyzedand compared with the aim of explaining why the Qaanaaq Glacier (in northwestern Greenland) has a dark-colored surface insatellite images whereas the Russel Glacier (in western central Greenland) has a light-colored surface. We found that algal andcyanobacterial communities differed between the glaciers and that the amount of biomass was higher on the colder glacier(Qaanaaq Glacier). The community on the Qaanaaq Glacier was composed mainly of green algae, whereas that on the RusselGlacier was dominated by cyanobacteria. Despite the shorter melting period (due to colder air temperature) for the QaanaaqGlacier, the biovolume of algae and cyanobacteria was 2.35 times higher than that on the Russel Glacier at a similar altitude,suggesting greater primary production on the Qaanaaq Glacier. We discuss the possible effects of temperature, nutrient concen-trations, and cryoconite holes (melt-holes in the glacier) on the community structure and productivity of algae and cyanobacteria oneach glacier, and consider the influence of the identified differences in algal and cyanobacterial communities on the amount ofsurface melt.� 2010 Elsevier B.V. and NIPR.
Keywords: Greenland; Glacier; Green algae; Cyanobacteria; Cryoconite
1. Introduction
For many years, researchers believed that glacierswere almost abiotic environments; however, recent
* Corresponding author at: National Institute of Polar Research,
10-3 Midori-cho, Tachikawa, Tokyo 190-8518, Japan. Tel.: þ81 42
512 0768; fax: þ81 42 528 0768.
E-mail address: [email protected] (J. Uetake).
1873-9652/$ - see front matter � 2010 Elsevier B.V. and NIPR.
doi:10.1016/j.polar.2010.03.002
studies have shown that glaciers are biotic environmentsthat contain many psychrophilic organisms such assnow algae (Hoham and Duval, 2001; Kol, 1969),cyanobacteria (Takeuchi, 2001), yeast (Turchetti et al.,2008), bacteria (Segawa et al., 2005), invertebrates(Kohshima, 1984), and metazoans (DeSmet and VanRompu, 1994). It is possible that biological activityon a glacier affects glacier melt, as snow algae, cya-nobacteria, and bacteria are reported to promote the
72 J. Uetake et al. / Polar Science 4 (2010) 71e80
formation and darkening of cryoconiteddark-coloredmaterial on the glacier (Takeuchi et al., 2001a,b, 2005).The activity of these microorganisms on glacierscommonly promotes the formation of cryoconites,which are 0.5e2.0 mm in diameter and contain organicand inorganic particles (Takeuchi et al., 2001b).Cryoconite granules are commonly observed onglaciers throughout the world (Christner et al., 2003;Mueller and Pollard, 2004; Takeuchi et al., 2005;Vincent, 1988). Cryoconite absorbs solar energy dueto its dark color and could act to reduce the albedo ofglaciers (Kohshima et al., 1993; Takeuchi et al., 2001b).Colored snow that results from the growth of snowalgae is also reported to reduce the albedo of the snowsurface (Hoham and Duval, 2001; Thomas and Duval,1995). Therefore, it is possible that biological activityon a glacier might act to accelerate glacial melting byreducing the albedo, thereby contributing to the glacierretreat commonly observed in recent years.
For example, Rignot and Thomas (2002) reported thatice in coastal parts of the Greenland Ice Sheet has becomethinner due to increasing temperature. It is possible thata biological reduction in the albedo process may alsocontribute to this thinning; however, our knowledge ofbiological activity on glaciers in coastal Greenlandremains limited (Gerdel and Drouet, 1960; Kol, 1969).
In the present study, we analyzed communities ofalgae and cyanobacteria on two glaciers in west
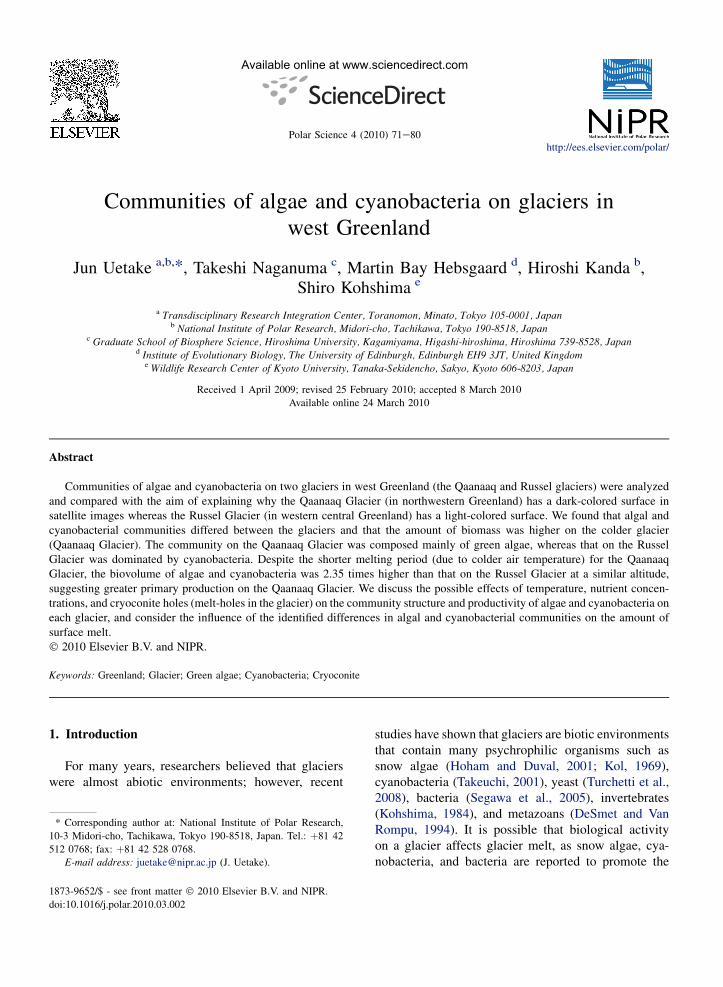
Fig. 1. Locations of the Qaanaaq Glacier (77�290N, 69�140W) a
Greenland. Because the ablation areas of glaciers innorthwest Greenland appear darker than those in otherareas when viewed in satellite images, we comparedthe biological properties of the Qaanaaq Glacier(northwest Greenland) with those of the Russel Glacier(western central Greenland). We found that algal andcyanobacterial communities differed between theglaciers and that the colder glacier (Qaanaaq Glacier)possessed a larger biomass. We then sought to explainthese differences with reference to ecological andenvironmental data. To understand the environmentalconditions that affect microbial activity on the glaciers,we measured and compared the amount of organic andinorganic material on each glacier, chemical ions, andthe sizes of cryoconite holes (CHs, cylindrical melt-holes on the glacier surface). We also discuss theimplications of these differences for surface melt of theglaciers.
2. Materials and methods
2.1. Study area
We conducted field research on the Qaanaaq Glacier(QA) (Fig. 1), an outlet glacier from a small ice cap(Piulip Nuna) in northwestern Greenland (77�290N,69�140W), during 8e15 July 2007, and on the RusselGlacier (RU) (Fig. 1), an outlet glacier from the
nd Russel Glacier (67�090N, 50�010W) in west Greenland.
73J. Uetake et al. / Polar Science 4 (2010) 71e80
western central part of the Greenland Ice Sheet(67�090N, 50�010W), on 24 July 2007. Both glacierswere easily accessed from nearby settlements byvehicle and on foot.
2.2. Sampling
Snow and ice upon the glacier surface were sampledat five sites on Qaanaaq Glacier and three sites onRussel Glacier at altitudinal intervals of w100e200 m(QA1: 276 m (all elevations in the manuscript aregiven in meters above sea level), QA2: 458 m, QA3:678 m, QA4: 783 m, QA5 938 m; RU1: 510 m, RU2:565 m, RU3: 635 m; QA1-3, RU1-3: ablation area;QA4,5: accumulation area) (Figs. 1 and 2). At eachsampling site, five samples were collected fromrandomly selected points. At each sampling point(20� 20 cm), we collected snow and ice from thesurface to the maximum depth of cryoconite holes(4e19 cm at QA, 5e33 cm at RU), and used a steril-ized stainless steel scoop to collect all the cryoconitesat the sampling point (Fig. 2). The samples weremelted in clean plastic bags (Whirl pak: Nasco, FortAtkinson, Wisconsin/USA) and then preserved with3% formaldehyde solution in clean 50 mL
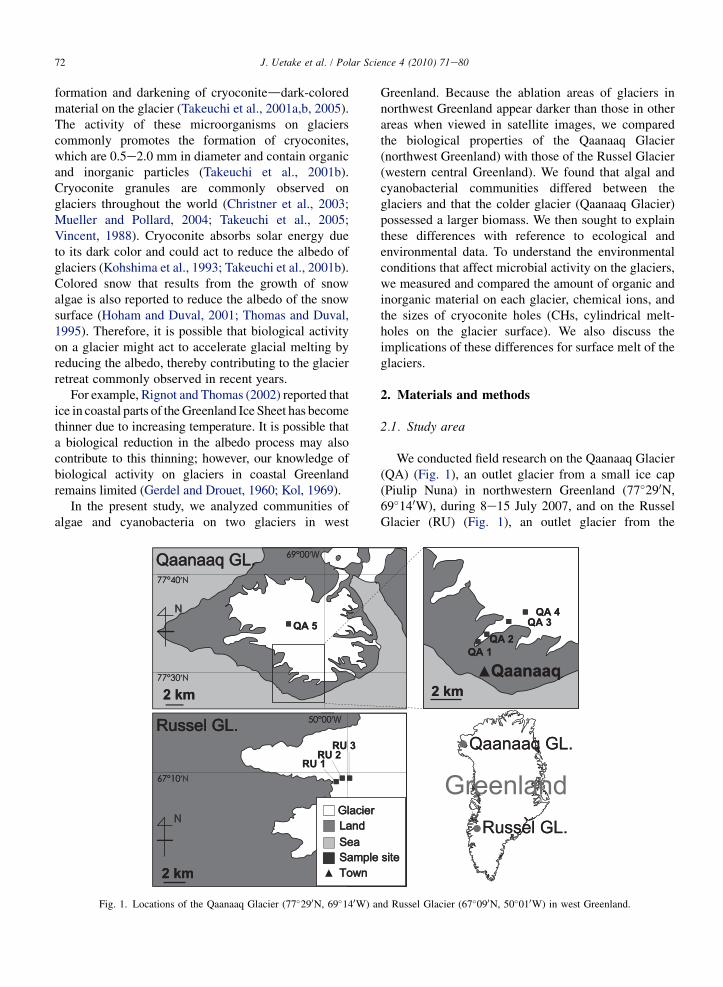
Fig. 2. Photograph of sampling sites: (a) Ablation zone of the Qaanaaq Gla
QA3. (c) Ablation zone of the Russel Glacier at arounfd 600 m a.s.l. (d) S
polyethylene bottles. The samples were shipped to theNational Institute of Polar Research, Japan, at roomtemperature. These formaldehyde-fixed samples wereused for cell biovolume determination. Although thefine structure of the algae may have been lost informalin, the algal cells could still be counted witha microscope. For identification of algal and cyano-bacteria species, other samples were collected from thesame point in centrifuge tubes (Nalgen Nunc,Rochester, NY/USA) and kept cool in an ice coolerduring transportation and in a refrigerator prior toobservation.
2.3. Microscopic observations and estimation ofbiovolume
The biovolume of snow algae and cyanobacteria ateach sampling site was calculated as the total cellvolume per unit area. Cell counts and estimations ofthe cell volume of snow algae were conducted using anoptical microscope (FV1000: Olympus, Tokyo, Japan)following the method proposed by Takeuchi andKohshima (2004). The samples were ultrasonicatedfor 10 min to loosen sedimented particles. We filtered50e1000 mL of sample water through a hydrophilized
cier at around 650 m a.s.l. (b) Surface ice and cryoconite holes at site
urface ice and cryoconite holes at site RU2.
74 J. Uetake et al. / Polar Science 4 (2010) 71e80
PTFE membrane filter with 0.2 mm pore size(Omnipore: Millipore, Billerica, MA/USA) thatbecame transparent with water, and counted thenumber of algae on the filter (1e3 lines on the filter).From the mean results of the cell counts and thefiltered volume of sample water, we obtained the cellconcentration (cells mL�1) in the sample. Mean cellvolume was estimated by measuring the size of 50e100 cells for each species. The total algal biovolumewas estimated by multiplying algal concentrations bythe mean cell volume for each species at each site. Toenable comparisons of biovolume among the sites, thetotal biovolume was calculated as the cell volume persquare meter of glacial surface (mL m�2).
For cell counts and estimations of the cell volumeof cyanobacteria (Oscillatoriaceae), we observed thesamples using a confocal laser microscope (FV1000:Olympus, Tokyo, Japan) equipped with a �10objective lens according to the following method.Excitation light from a 543-nm argon laser passedthrough a 488/543/633 nm dichroic mirror, and 555e625 nm band-pass and 640 nm long-pass filters wereused to take images of chlorophyll autofluorescencefrom cyanobacteria. Cell counts and estimations ofthe cell volume of cyanobacteria were performed byanalyzing these images using imaging software(Metamorph�; Molecular Devices, Downingtown,PA/USA).
2.4. Measurement of ion concentrations
For measurements of chemical ions, we collected fivesamples at each sampling site. The snow and ice of theglacier surface were collected using a sterilized stainlesssteel scoop and kept in clean plastic bags (Whirl pak:Nasco, Fort Atkinson, Wisconsin/USA). These sampleswere kept frozen until just before analysis in thelaboratory. After melting, the samples were filteredthrough a hydrophilic polytetrafluoroethylene (PTFE)membrane filter with 0.2 mm pore size (Omnipore:Millipore, Billerica, MA/USA), and then analyzed byion chromatography (ICS-2000: Dionex, Sunnyvale,CA/USA) at the Nagaoka National College of Tech-nology, Japan. The detection limits (minimal value ofthe standard) of nitrite, nitrate, and phosphate ions werebelow 0.01, 0.05, and 0.01 mg L�1, respectively.
2.5. Estimation of air temperature
Daily mean air temperatures at sites QA3 and RU3(elevations of 678 m and 635 m, respectively) wereestimated from hourly climate data of the National
Climatic Data Center (http://www.ncdc.noaa.gov)recorded at Qaanaaq airport (0 m a.s.l., January 1997to October 2004) and Kangerlussuaq airport (287 ma.s.l., May 1999 to March 2005), assuming a tempera-ture lapse rate of �0.6 �C per 100 m.
2.6. Measurement of CH dimensions
The diameters and depths of 50 randomly selectedCHs were measured with a ruler at each sampling siteand at three additional sites on the Qaanaaq Glacier (atelevations of 258 m, 376 m, and 574 m a.s.l.), and twoadditional sites on the Russel Glacier (540 m and600 m a.s.l.) located between existing sampling sites.
2.7. Statistical analysis
Statistically significant difference between the twoglaciers was determined using a two-sided Student’st-test. Results are expressed as mean � standarddeviation of the mean. Differences with P< 0.05 wereconsidered statistically significant.
3. Results
3.1. Species composition and biovolume
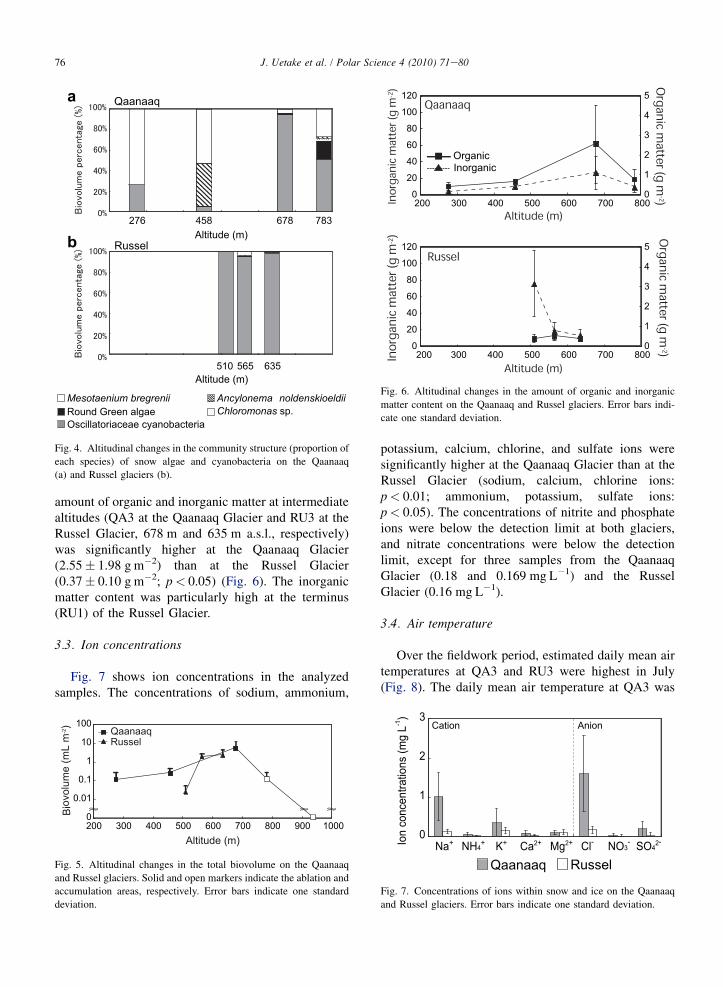
Five green algae species and at least three cyano-bacteria species (Oscillatoriaceae) were observed inthe samples (Fig. 3, Table 1). Green algae weredominant on a per biovolume basis in the QA samples,while cyanobacteria were dominant in the RU samples(Fig. 4). Three green algae (Mesotaenium berggrenii,Ancylonema nordenskioeldii, and Cylindrocystis bre-bissonii) were observed in the ablation areas (QA1e3,RU2e3), although the relative biovolume of eachspecies peaked at different altitudes (Fig. 4). On Qaa-naaq Glacier, M. berggrenii showed the highest relativebiovolume at QA1, while A. nordenskioeldii showedthe highest relative biovolume at QA2. Cyanobacteria(Oscillatoriaceae) were also observed in the ablationareas (QA1e3, RU1e3), showing the highest relativebiovolume at higher elevations in the ablation area(QA3, RU3). Chloromonas sp. and unidentified round-shaped green algal species were observed in theaccumulation area (QA3e4), with their highest relativebiovolumes observed at QA4.
For both glaciers, the algal biovolume (mL m�2)was highest at higher elevations within the ablationarea (QA3, RU3); in the accumulation area of theQaanaaq Glacier, the algal biovolume decreased withincreasing altitude (Fig. 5). Both glaciers showed
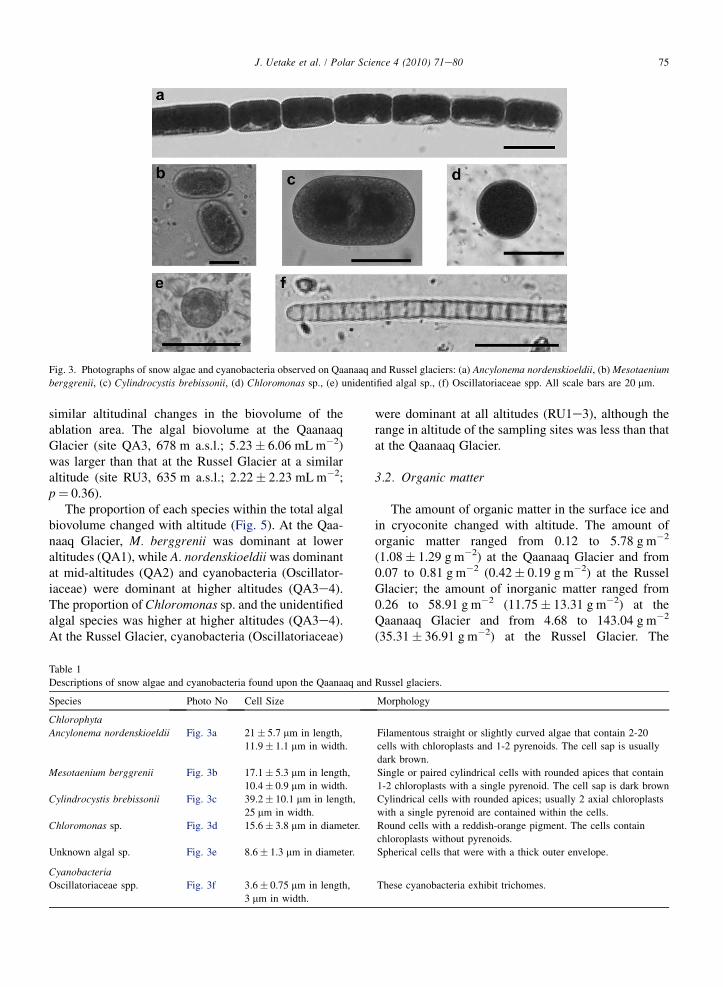
Fig. 3. Photographs of snow algae and cyanobacteria observed on Qaanaaq and Russel glaciers: (a) Ancylonema nordenskioeldii, (b) Mesotaenium
berggrenii, (c) Cylindrocystis brebissonii, (d) Chloromonas sp., (e) unidentified algal sp., (f) Oscillatoriaceae spp. All scale bars are 20 mm.
75J. Uetake et al. / Polar Science 4 (2010) 71e80
similar altitudinal changes in the biovolume of theablation area. The algal biovolume at the QaanaaqGlacier (site QA3, 678 m a.s.l.; 5.23� 6.06 mL m�2)was larger than that at the Russel Glacier at a similaraltitude (site RU3, 635 m a.s.l.; 2.22� 2.23 mL m�2;p¼ 0.36).
The proportion of each species within the total algalbiovolume changed with altitude (Fig. 5). At the Qaa-naaq Glacier, M. berggrenii was dominant at loweraltitudes (QA1), while A. nordenskioeldii was dominantat mid-altitudes (QA2) and cyanobacteria (Oscillator-iaceae) were dominant at higher altitudes (QA3e4).The proportion of Chloromonas sp. and the unidentifiedalgal species was higher at higher altitudes (QA3e4).At the Russel Glacier, cyanobacteria (Oscillatoriaceae)
Table 1
Descriptions of snow algae and cyanobacteria found upon the Qaanaaq and
Species Photo No Cell Size
Chlorophyta
Ancylonema nordenskioeldii Fig. 3a 21� 5.7 mm in length,
11.9� 1.1 mm in width.
Mesotaenium berggrenii Fig. 3b 17.1� 5.3 mm in length,
10.4� 0.9 mm in width.
Cylindrocystis brebissonii Fig. 3c 39.2� 10.1 mm in length,
25 mm in width.
Chloromonas sp. Fig. 3d 15.6� 3.8 mm in diameter.
Unknown algal sp. Fig. 3e 8.6� 1.3 mm in diameter.
CyanobacteriaOscillatoriaceae spp. Fig. 3f 3.6� 0.75 mm in length,
3 mm in width.
were dominant at all altitudes (RU1e3), although therange in altitude of the sampling sites was less than thatat the Qaanaaq Glacier.
3.2. Organic matter
The amount of organic matter in the surface ice andin cryoconite changed with altitude. The amount oforganic matter ranged from 0.12 to 5.78 g m�2
(1.08� 1.29 g m�2) at the Qaanaaq Glacier and from0.07 to 0.81 g m�2 (0.42� 0.19 g m�2) at the RusselGlacier; the amount of inorganic matter ranged from0.26 to 58.91 g m�2 (11.75� 13.31 g m�2) at theQaanaaq Glacier and from 4.68 to 143.04 g m�2
(35.31� 36.91 g m�2) at the Russel Glacier. The
Russel glaciers.
Morphology
Filamentous straight or slightly curved algae that contain 2-20
cells with chloroplasts and 1-2 pyrenoids. The cell sap is usually
dark brown.
Single or paired cylindrical cells with rounded apices that contain
1-2 chloroplasts with a single pyrenoid. The cell sap is dark brown
Cylindrical cells with rounded apices; usually 2 axial chloroplasts
with a single pyrenoid are contained within the cells.
Round cells with a reddish-orange pigment. The cells contain
chloroplasts without pyrenoids.
Spherical cells that were with a thick outer envelope.
These cyanobacteria exhibit trichomes.
276 458 678 783
635565510
Mesotaenium bregrenii Ancylonema noldenskioeldii
Chloromonas sp.Round Green algae Oscillatoriaceae cyanobacteria
Qaanaaq
RusselAltitude (m)
Altitude (m)
a
b
Fig. 4. Altitudinal changes in the community structure (proportion of
each species) of snow algae and cyanobacteria on the Qaanaaq
(a) and Russel glaciers (b).
0
20
40
60
80
100
120
200 300 400 500 600 700 8000
1
2
3
4
5
0
20
40
60
80
100
120
200 300 400 500 600 700 8000
1
2
3
4
5
InorganicOrganic
Fig. 6. Altitudinal changes in the amount of organic and inorganic
matter content on the Qaanaaq and Russel glaciers. Error bars indi-
cate one standard deviation.
76 J. Uetake et al. / Polar Science 4 (2010) 71e80
amount of organic and inorganic matter at intermediatealtitudes (QA3 at the Qaanaaq Glacier and RU3 at theRussel Glacier, 678 m and 635 m a.s.l., respectively)was significantly higher at the Qaanaaq Glacier(2.55� 1.98 g m�2) than at the Russel Glacier(0.37� 0.10 g m�2; p< 0.05) (Fig. 6). The inorganicmatter content was particularly high at the terminus(RU1) of the Russel Glacier.
3.3. Ion concentrations
Fig. 7 shows ion concentrations in the analyzedsamples. The concentrations of sodium, ammonium,
0
0.01
0.1
1
10
100
200 300 400 500 600 700 800 900 1000
QaanaaqRusselm L
m( emulovo iB
2-)
Altitude (m)
Fig. 5. Altitudinal changes in the total biovolume on the Qaanaaq
and Russel glaciers. Solid and open markers indicate the ablation and
accumulation areas, respectively. Error bars indicate one standard
deviation.
potassium, calcium, chlorine, and sulfate ions weresignificantly higher at the Qaanaaq Glacier than at theRussel Glacier (sodium, calcium, chlorine ions:p< 0.01; ammonium, potassium, sulfate ions:p< 0.05). The concentrations of nitrite and phosphateions were below the detection limit at both glaciers,and nitrate concentrations were below the detectionlimit, except for three samples from the QaanaaqGlacier (0.18 and 0.169 mg L�1) and the RusselGlacier (0.16 mg L�1).
3.4. Air temperature
Over the fieldwork period, estimated daily mean airtemperatures at QA3 and RU3 were highest in July(Fig. 8). The daily mean air temperature at QA3 was
0
1
2
3
Na+ NH4+ K+ Ca2+ Mg2+ Cl- NO3
- SO42-
L gm( snoitartnecnoc noI
1-)
Qaanaaq Russel
Cation Anion
Fig. 7. Concentrations of ions within snow and ice on the Qaanaaq
and Russel glaciers. Error bars indicate one standard deviation.
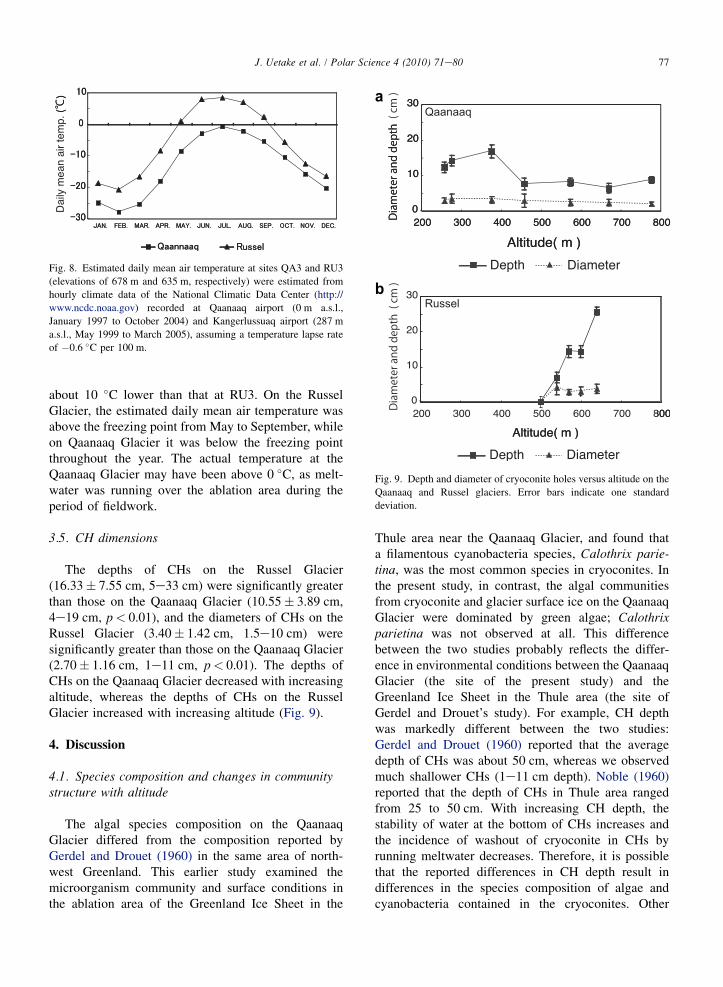
Fig. 8. Estimated daily mean air temperature at sites QA3 and RU3
(elevations of 678 m and 635 m, respectively) were estimated from
hourly climate data of the National Climatic Data Center (http://
www.ncdc.noaa.gov) recorded at Qaanaaq airport (0 m a.s.l.,
January 1997 to October 2004) and Kangerlussuaq airport (287 m
a.s.l., May 1999 to March 2005), assuming a temperature lapse rate
of �0.6 �C per 100 m.
a
b
Fig. 9. Depth and diameter of cryoconite holes versus altitude on the
Qaanaaq and Russel glaciers. Error bars indicate one standard
deviation.
77J. Uetake et al. / Polar Science 4 (2010) 71e80
about 10 �C lower than that at RU3. On the RusselGlacier, the estimated daily mean air temperature wasabove the freezing point from May to September, whileon Qaanaaq Glacier it was below the freezing pointthroughout the year. The actual temperature at theQaanaaq Glacier may have been above 0 �C, as melt-water was running over the ablation area during theperiod of fieldwork.
3.5. CH dimensions
The depths of CHs on the Russel Glacier(16.33� 7.55 cm, 5e33 cm) were significantly greaterthan those on the Qaanaaq Glacier (10.55� 3.89 cm,4e19 cm, p< 0.01), and the diameters of CHs on theRussel Glacier (3.40� 1.42 cm, 1.5e10 cm) weresignificantly greater than those on the Qaanaaq Glacier(2.70� 1.16 cm, 1e11 cm, p< 0.01). The depths ofCHs on the Qaanaaq Glacier decreased with increasingaltitude, whereas the depths of CHs on the RusselGlacier increased with increasing altitude (Fig. 9).
4. Discussion
4.1. Species composition and changes in communitystructure with altitude
The algal species composition on the QaanaaqGlacier differed from the composition reported byGerdel and Drouet (1960) in the same area of north-west Greenland. This earlier study examined themicroorganism community and surface conditions inthe ablation area of the Greenland Ice Sheet in the
Thule area near the Qaanaaq Glacier, and found thata filamentous cyanobacteria species, Calothrix parie-tina, was the most common species in cryoconites. Inthe present study, in contrast, the algal communitiesfrom cryoconite and glacier surface ice on the QaanaaqGlacier were dominated by green algae; Calothrixparietina was not observed at all. This differencebetween the two studies probably reflects the differ-ence in environmental conditions between the QaanaaqGlacier (the site of the present study) and theGreenland Ice Sheet in the Thule area (the site ofGerdel and Drouet’s study). For example, CH depthwas markedly different between the two studies:Gerdel and Drouet (1960) reported that the averagedepth of CHs was about 50 cm, whereas we observedmuch shallower CHs (1e11 cm depth). Noble (1960)reported that the depth of CHs in Thule area rangedfrom 25 to 50 cm. With increasing CH depth, thestability of water at the bottom of CHs increases andthe incidence of washout of cryoconite in CHs byrunning meltwater decreases. Therefore, it is possiblethat the reported differences in CH depth result indifferences in the species composition of algae andcyanobacteria contained in the cryoconites. Other
78 J. Uetake et al. / Polar Science 4 (2010) 71e80
environmental conditions that affect algae growth atthe bottom of CHs (e.g., light intensity and the wave-length of light available for algae) may explain thedifference between the present results and thosereported by Gerdel and Drouet (1960). However, wedid not measure the light environment in the presentstudy, meaning that we cannot assess the influence ofthis factor on species composition.
At the Qaanaaq Glacier, the dominant specieschanged with altitude in a similar way to that reportedfrom glaciers throughout the world. For example,M. berggrenii, which was dominant near the terminusof the Qaanaaq Glacier, is also dominant near theterminus of the Tyndal Glacier, Patagonia (Takeuchiand Kohshima, 2004). A. nordenskioeldii, which wasdominant in the upper ablation area near the snowline on the Qaanaaq Glacier, is also dominant in theupper ablation area on the Gulkana Glacier, Alaska(Takeuchi, 2001). Other studies reported that cyano-bacteria (Oscillatoriaceae) are dominant in the upperpart of the ablation area on a Himalayan glacier(Yoshimura et al., 1997) and an Alaskan glacier(Takeuchi et al., 2001a,b). We found that cyanobac-teria are the dominant species throughout the ablationarea of the Russel Glacier, as also found for a Chineseglacier (Uetake et al., 2006). These results suggestthat different algal species are adapted to differentenvironmental conditions that change with altitudeupon the glacier.
According to Yoshimura et al. (1997), the snowalgae on glaciers can be classified into the followingfour types: snow-environment specialists (observedonly in areas of snow), ice-environment specialists(observed only in areas of bare ice), generalists(observed in both snow and ice areas), and opportunists(observed locally in areas of ice or snow). According tothis scheme, M. berggrenii, A. nordenskioeldii, andcyanobacteria (Oscillatoriaceae) from the QaanaaqGlacier and cyanobacteria (Oscillatoriaceae) from theRussel Glacier are ice-environment specialists. Incontrast, the proportion of Chloromonas sp. and theunidentified round-shaped algal species increased inthat part of the accumulation area (QA4) covered bysnow; therefore, these species could be classified assnow-environment specialists.
It remains unclear why the biomass and communitystructure of algae and cyanobacteria differed betweenthe Qaanaaq and Russel glaciers. Differences in envi-ronmental conditions at the glacier surface (e.g.,temperature, nutrient concentrations, CH depth) mayinfluence the biomass and structure of algal commu-nities in the study area.
4.2. Factors affecting algal biovolume
In the ablation area of both of the studied glaciers,the algal biovolume increased with increasing altitude,reaching a maximum near the snowline, despitea decrease in air temperature with altitude. In theaccumulation area of the Qaanaaq Glacier, algal bio-volume decreased with increasing altitude (Fig. 5). Anincrease in air temperature generally promotes algalproduction on a glacier by increasing the duration ofthe growth period and increasing the supply of melt-water. However, the observed altitudinal change inalgal biovolume cannot be explained by such a rela-tionship between algal production and air temperature.Similar altitudinal changes in algal biovolume havebeen reported from Alaskan Glaciers (Takeuchi, 2001;Takeuchi et al., 2003). In a study of the GulkanaGlacier, Takeuchi (2001) reported that the biovolumewas lowest near the terminus because the amount ofmeltwater that could wash out microorganismsincreased with decreasing altitude. The author alsoreported that biovolume decreased with increasingaltitude in the accumulation area, because meltwateravailability (which is essential for the growth ofmicroorganisms) decreased with increasing altitude. Itis possible that the observed increase in algal andcyanobacterial biovolume with increasing altitude inthe ablation areas of the Qaanaaq and Russel glacierswas caused by the effect of meltwater wash-out.
Despite the occurrence of a shorter growth perioddue to lower air temperature, the algal biovolume washigher on the Qaanaaq Glacier than on the RusselGlacier. Air temperature during summer (JuneeAugust) at QA3, as estimated from meteorologicaldata, was about 9 �C lower than that at RU3 due to the10� difference in latitude. Consequently, microorgan-isms have a much longer annual growth period on theRussel Glacier than on the Qaanaaq Glacier, indicatingthat the difference in biovolume between the twoglaciers is caused by environmental factors other thantemperature.
One such factor that may explain the differencesbetween the two sites is the nutrient condition on theglaciers. Nitrogen and phosphate compounds areimportant for the growth of algae and the formation ofecosystems in CHs (Hodson et al., 2008; Stibal et al.,2006); however, the concentrations of nitrous, nitrate,and phosphate ions in the analyzed samples were verylow or undetectable, indicating extremely oligotrophicconditions at both glaciers. Concentrations of nitrous,nitrate, and phosphate ions in most samples werebelow the detection limit (limits of 0.01, 0.05, and
79J. Uetake et al. / Polar Science 4 (2010) 71e80
0.01 mg L�1, respectively). The concentration of nitrateions in glacier water has been reported to be very low (inthe order of mg L�1; Sawstrom et al., 2002). We wouldonly be able to measure such very low concentrations ofions if the detection limits would be improved. More-over, it has been reported that inorganic matter onglaciers, mainly mineral particles, could be a nutrientsource for microorganisms (Hoham and Duval, 2001).Thus, the fact that inorganic particles occurred in largeramounts on the Qaanaaq Glacier than on the RusselGlacier may indicate that nutrient conditions were morefavorable on the Qaanaaq Glacier.
Another factor that may explain the difference inbiovolume between the two glaciers is the difference indepth of CHs on the glacier surface, which may affectalgal and cyanobacterial production because the lightintensity at the bottom of CHs is expected to decreasewith increasing CH depth. Podgorny and Grenfell (1996)reported that CHs are shallower in the case that largeamounts of dark material are uniformly distributed uponthe glacier surface. Under such conditions, there wouldexist a small difference in melting rate by solar radiationbetween CH bottoms and the glacier surface; conse-quently, CH depth would become shallower and manycryoconites would be distributed not only at the bottomof CHs but also on the glacier surface. Indeed, thissituation was observed on the surface of the QaanaaqGlacier (QA3, QA4). In contrast, cryoconite occurred atthe bottoms of CHs on the Russel Glacier; therefore,light availability differs between the Qaanaaq and Rus-sel glaciers. The difference in CH depth between theglaciers may explain the difference in algal biovolume.
Our results demonstrate that the biovolume andspecies composition of the algal community, as well asthe amount of organic and inorganic matter on theglacier, differed between glaciers with dark- and light-colored surfaces in west Greenland. These findingsraise the possibility that biological activity affects thesurface melting of glaciers in this area, although we haveinsufficient data to identify the causes of these differ-ences. To understand the way in which biologicalprocesses act to reduce the albedo of glaciers in the studyarea, and to predict the response of biological activitiesto environmental change such as global warming, it isnecessary to undertake more studies on the relationshipbetween microbial activity on glaciers and variousenvironmental conditions (e.g., nutrient supply anddepth of cryoconite holes), the physical process bywhich the glacier albedo is reduced, and the relationshipbetween cryoconite hole formation and environmentalconditions such as meteorological conditions and thequality and quantity of dust material on the glacier.
Acknowledgements
This study was supported in part by a Grant-in-Aidfor Scientific Research (No. 18255005) from the JapanSociety for the Promotion of Science. We would like tothank Mr. Satoshi Nakada of the Tokyo Institute ofTechnology for measuring the amount of organicmatter in the analyzed samples.
References
Christner, B.C., Kvitko, B.H., Reeve, J.N., 2003. Molecular identi-
fication of bacteria and eukarya inhabiting an antarctic cryoconite
hole. Extremophiles 7, 177e183.
DeSmet, W.H., Van Rompu, E.A., 1994. Rotifera and tardigrada from
some cryoconite holes on a Spitsbergen (Svalbard) glacier. Belg.
J. Zool. 124 (1), 27e37.
Gerdel, R.W., Drouet, F., 1960. The cryoconite of the Thule Area,
Greenland. Trans. Am. Microsc. Soc. 79, 256e272.
Hodson, A., Anesio, A.M., Tranter, M., Fountain, A., Osborn, M.,
Priscu, J., Laybourn-Parry, J., Sattler, A.B., 2008. Glacial
ecosystems. Ecol. Monogr. 78, 41e67.
Hoham, R.W., Duval, B., 2001. Microbial ecology of snow and
freshwater ice. In: Jones, H.G., Pomeroy, J.W., Walker, D.A.,
Hoham, R.W. (Eds.), Snow Ecology. Cambrige University Press,
Cambridge, pp. 168e228.
Kohshima, S., 1984. A novel cold-tolerant insect found in a Hima-
layan glacier. Nature 310, 225e227.
Kohshima, S., Seko, K., Yoshimura, Y., 1993. Biotic acceleration of
glacier melting in Yala Glacier, Langtangregion, Nepal Hima-
laya. Snow and Glacier Hydrology. Proc. Int. Symp., Kathmandu,
1992, pp. 309e316.
Kol, E., 1969. The red snow of Greenland. II. Acta Bot. Acad. Sci.
Hung 15, 281e289.
Mueller, D.R., Pollard, W.H., 2004. Gradient analysis of
cryoconite ecosystems from two polar glaciers. Polar Biol. 27,
66e74.
Noble, L.H., 1960. Glaciological investigations, Nunatarssuaq Ice
Ramp, Northwestern Greenland. Technical Report 66. U.S. Army
Snow Ice and Permafrost Research Establishment.
Podgorny, I.A., Grenfell, T.C., 1996. Absorption of solar energy in
a cryoconite hole. Geophys. Res. Lett. 23, 2465e2468.
Rignot, E., Thomas, R.H., 2002. Mass balance of polar ice sheets.
Science 297, 1502e1506.
Sawstrom, C., Mumford, P., Marshall, W., Hodson, A., Laybourn-
Parry, J., 2002. The microbial communities and primary
productivity of cryoconite holes in an Arctic glacier (Svalbard 79
N). Polar Biol. 25, 591e596.
Segawa, T., Miyamoto, K., Ushida, K., Agata, K., Okada, N.,
Kohshima, S., 2005. Seasonal change in bacterial flora and
biomass in mountain snow from the Tateyama Mountains, Japan,
analyzed by 16S rRNA gene sequencing and real-time PCR.
Appl. Environ. Microbiol. 71, 123e130.
Stibal, M., Sabacka, M., Kastovska, K., 2006. Microbial communi-
ties on glacier surfaces in Svalbard: Impact of physical and
chemical properties on abundance and structure of cyanobacteria
and algae. Microb. Ecol. 52, 644e654.
Takeuchi, N., 2001. The altitudinal distribution of snow algae on an
Alaskan glacier (Gulkana Glacier in the Alaska Range). Hydr.
Processes 15, 3447e3459.
80 J. Uetake et al. / Polar Science 4 (2010) 71e80
Takeuchi, N., Kohshima, S., 2004. A snow algal community on
Tyndall Glacier in the Southern Patagonia icefield, Chile. Arct.
Antarct. Alp. Res. 36, 92e99.
Takeuchi, N., Kohshima, S., Goto-Azuma, K., Koerner, R.M., 2001a.
Biological characteristics of dark-colored material (cryoconite)
on Canadian Arctic glaciers (Devon and Penny ice caps). Natl.
Inst. Polar Res. Mem. 54 (Spec. Issue), 495e505.
Takeuchi, N., Kohshima, S., Shiraiwa, T., Kubota, K., 2001b. Char-
acteristics of cryoconite (surface dust on glaciers) and surface
albedo of a Patagonian glacier, Tyndall Glacier, Southern Pata-
gonia Icefield. Bull. Glaciol. Res. 18, 65e69.
Takeuchi, N., Kohshima, S., Segawa, T., 2003. Effect of cryoconite
and snow algal communities on surface albedo on maritime
glaciers in south Alaska. Bull. Glaciol. Res. 20, 21e27.
Takeuchi, N., Matsuda, Y., Sakai, A., Fujita, K., 2005. A large
amount of surface dust (cryoconite) on a glacier in the Qilian
Mountains, China. Bull. Glaciol. Res. 22, 1e8.
Thomas, W.H., Duval, B., 1995. Sierra Nevada, California, U.S.A.,
Snow algae: snow albedo changes, algal-bacterial interrelation-
ships, and ultraviolet radiation effects. Arct. Antarct. Alp. Res.
27, 389e399.
Turchetti, B., Buzzini, P., Goretti, M., Branda, E., Diolaiuti, G.,
D’Agata, C., Vaughan-Martini, C.S.A., 2008. Psychrophilic
yeasts in glacial environments of Alpine glaciers. FEMS
Microbiol. Ecol. 63, 73e83.
Uetake, J., Sakai, A., Matsuda, Y., Fujita, K., Narita, H., Matoba, S.,
Duan, K., Nakawo, M., Yao, T., 2006. Preliminary observations
of sub-surface and shallow ice core at July 1st Glacier, China in
2002e2004. Bull. Glaciol. Res. 23, 85e93.
Vincent, W.F., 1988. Microbial Ecosystems in Antarctica. Cambridge
University Press, Cambridge.
Yoshimura, Y., Kohshima, S., Ohtani, S., 1997. A community of snow
algae on a Himalayan glacier: change of algal biomass and com-
munity structure with altitude. Arct. Alp. Res. 29, 126e137.