Embed Size (px)
Citation preview

BAR/CSI 1
Communities At Risk: Frac Sand Mining in the Upper Midwest
A Report by Boston Action Research (a project of Civil Society Institute)
Written by
Emily Chapman Lyle Hopkins Alex Jasset Seth Sheldon Grant Smith
Pam Solo and Grant Smith (Eds.)
(Photo by Ted Auch)
Boston Action Research, a Project of Civil Society Institute 1 Bridge St., Suite 200 Newton, MA 02458 www.civilsocietyinstitute.org

BAR/CSI 2
Acknowledgements
The Project wishes to thank all the local activists whose persistent advocacy is improving the lives of residents in frac sand mining regions of the Upper Midwest and Iowa. We also acknowledge the excellent contributions of Heather White and her staff at Environmental Working Group. EWG’s expertise in online mapping tells a clear picture of what citizens are facing in areas where frac sand operations are prevalent and provides the perfect educational tool for the general public. Last but not least, the research team extends its deepest appreciation to CSI’s Jennifer Filiault for her tireless grassroots organizing efforts and CSI director Pam Solo for her steadfast and insightful leadership on energy issues.

BAR/CSI 3
Table of Contents
Executive Summary .................................................................................................... 5 Section 1. Introduction to Frac Sand Mining ............................................................. 6 Section 2. Description of Frac Sand Operations ......................................................... 7 Section 3. Number and Location of Frac Sand Facilities in Wisconsin and Minnesota .................................................................................................................................... 9 Section 4. Impacts of Frac Sand Operations on Communities ................................. 10 Regulation of Frac Sand Operations ................................................................................................................... 10
General Regulatory Framework ......................................................................................................................... 10 Section 5. Externalities - Human Health and Environmental Costs ......................... 13 Water Impact .............................................................................................................................................................. 14
Water Use in Frac Sand Operations ................................................................................................................. 14 Adverse Impacts to Water Quality ...................................................................................................................... 15
Air Quality Impacts .................................................................................................................................................. 17 Particulate Matter (PM) and Its Health Effects ............................................................................................ 17 Crystalline Silica From Fracking Operations and Its Health Effects .................................................. 18 Carbon Emissions ..................................................................................................................................................... 19
Economic Impacts .................................................................................................................................................... 21 Property Values and Tax Revenues ................................................................................................................... 21 Impacts to Other Businesses and Tourism ...................................................................................................... 24 Impacts to Roads and Infrastructure ................................................................................................................. 25 Mispriced Terms for Towns and Communities .............................................................................................. 26 Variability in Mine Revenues Due to Fluctuating Commodity Costs and Impact on School
Funding ......................................................................................................................................................................... 27 Increased Health Costs and Demands on Local Health Providers ....................................................... 27 Transportation Impacts on the Agricultural Sector from the Fracking Industry ....................... 28
Section 6. Recommendations .................................................................................... 28 Appendix I: Local and State Authority Over Frac Sand Operations ....................... 29 State of Wisconsin .................................................................................................................................................... 29
Local Authority .......................................................................................................................................................... 29 Legislative Threat to Local Control .................................................................................................................. 33 State Authority ............................................................................................................................................................ 35
State of Minnesota .................................................................................................................................................... 37 Local Authority .......................................................................................................................................................... 37 State Authority ............................................................................................................................................................ 39
Appendix II: Local Economic Analyses to Conduct Prior to Frac Sand Operation Approvals .................................................................................................................. 42 Bibliography ............................................................................................................. 43
BAR/CSI 4
Table of Figures Figure 1. Frac Sand Mining Process (WI DNR 2013). ................................................................................... 8 Figure 2. Current and Potential Frac Sand Mining Counties in the United States. ................................ 9 Figure 3. Local, state, and federal authority concerning frac sand mining (Hart, Adams, & Schwartz, 2013). ........................................................................................................................................................ 11 Figure 4. Case study areas showing heavy frac sand mining presence, and (insert) current frac sand counties in the United States. ......................................................................................................... 14 Figure 5. Typical water impacts of frac sand mining. .................................................................................. 17 Figure 6. WI Department of Transportation estimate of yearly volume of frac sand mined. .......... 20 Figure 7. Typical water impacts of frac sand mining. .................................................................................. 20 Figure 8. Expected home value reductions by zone. ..................................................................................... 22 Figure 9. Typical impacts of frac sand mining. .............................................................................................. 23 Figure 10. Typical impacts to road and infrastructure from frac sand mining…………………...26

BAR/CSI 5
Executive Summary The rapid expansion in the United States of oil and shale gas drilling, including hydraulic fracturing (fracking), has a hidden side filled with problems: the mining of the special sand – known as “frac sand,” for short -- that is essential to fracking a drilled well. The specific type of sand in question is now mined most heavily in Wisconsin and Minnesota. However, as the demands of fracking grow it is possible that mining will expand to sand deposits in at least 12 other states: Illinois, Maine, Massachusetts, Michigan, Missouri, New York, North Carolina, South Carolina, Pennsylvania, Tennessee, Vermont and Virginia.
Current and Potential Frac Sand Mining Counties in the United States Key concerns about frac sand mining include the following: · Water issues. Individual mining operations withdraw between 420 thousand and 2 million
gallons per day. The volume of water used is significant, and added chemicals to process the sand compound water related problems with sand mining. Polyacrylamide, a flocculent, that encourages clumping of particles to remove impurities from the sand is used at mining and processing operations. It contains traces of acrylamide and can break down into acrylamide, a neurotoxin and known carcinogen, and can enter groundwater or surface water from wastewater ponds at mining operations or from piles of processed sand ready to be transported. There is also increasing concern with acid mine runoff from operating and reclaimed frac sand mines.
· Air quality issues. Silica dust is of great concern to people living near frac sand
operations. The smallest particles of dust (2.5 microns, a fraction of the width of a human

BAR/CSI 6
hair) cause the greatest damage to the lungs. This is due to the fact that smaller particles can evade the body’s natural defense mechanisms and penetrate deeper into the lungs, and even into the bloodstream. Crystalline silica dust, generally around 4 microns in diameter or less, is also especially harmful. Depending on the amount and duration of exposure, silica dust can cause silicosis of the lungs, a well-known hazard in mining, and at natural gas and oil drill sites due to the use of sand in fracking operations.
· Financial issues. Frac sand mining causes many economic harms, including a potential
loss of nearby real estate values of up to 25 percent; and decreased lifespan for roads and other infrastructure, which carry a substantial replacement cost. Even though Minnesota state law allows counties to levy a 15-cent per ton aggregate extraction tax to help offset the costs of road repair, many counties choose not to. Additionally, the Minnesota Local Research Board found that 22 cents per ton-mile would be a more accurate amount to cover the costs.
Perhaps the best response to the rapid expansion of shale gas extraction is to take a step back and view the entire shale gas fuel cycle more holistically. The questions, if properly posed, can assist us in defining the issues, challenges, and consequences of the shale gas fuel cycle. They will also help answer whether or not the shale gas revolution is of benefit to all of us or just some of us, and determine the long-term viability of the shale-gas economy. In pursuing this exercise, the scope of questions should not remain at some national or geopolitical strategic level. Rather, they should also address the consequences of the shale gas fuel cycle for people at the local level including the consequences for their property, their businesses, their cultural values and way of life, their health, their access to adequate supplies of clean water, the impact on local infrastructure, as well as the sustainability of their community’s economy in the near- and long-term. Of course, such questions should have been posed long ago. Powerful economic forces are churning ahead without pause or consideration of the implications of shale gas extraction for our country and our citizens.
Section 1. Introduction to Frac Sand Mining Oil and natural gas drilling operations, employing the recently honed extraction method of hydraulic fracturing, blanketed the country overnight. With the upsurge in oil and natural gas production came generally false promises of U.S. energy independence, jobs, reduced fuel costs for the American consumer, and a means to shift the negative balance of trade for the United States. These promises are sold as energy independence, however many of the shale deposit leases are owned by foreign companies or foreign companies enter into joint ventures with American companies to provide capital for developing wells.
Quite often, however, the proponents of expanded fossil fuel exploitation focus on the end use or result of the fuel cycle and the benefits of such use—whether it’s burning natural gas in power plants, heating homes, or liquefying natural gas for export. What is often left out in their equation are the health, environmental and economic consequences of the entire lifecycle on communities and
Analysts estimate that fracking companies will require 95 billion pounds of sand this year, an increase of almost 30% from 2013 and 50% above initial forecasts.

BAR/CSI 7
individuals.
As it happens, the natural gas fuel cycle, including horizontal drilling and fracking, is quite expansive. It involves, of course, drilling and fracking. But it also requires intensive inputs of chemical, water and fuel at drilling sites. It requires extensive build-out of pipeline systems and utilizes just about every aspect of our transportation system including road, barge and rail, which requires a large infusion of transportation fuel and results in wear and tear on infrastructure, as well as hardship for other industries that rely on existing transportation infrastructure. Fracking itself produces large volumes of liquid waste that must be disposed of or treated in some way, which requires additional energy and resources.
Beyond these substantial energy and resource demands, shale gas fracking requires enormous volumes of sand.1 Not just any sand, but sand found in certain regions of the country - originally in the high-quality sand areas of Wisconsin, Southeast Minnesota, Northern Illinois, and Northeast Iowa but expanding to lower-quality sand regions of the country such as Texas, Arkansas and South Dakota as demand for frac sand rises. Moreover, companies are now finding that using more sand per well increases shale gas and oil yields. As a result, analysts estimate that fracking companies will require 95 billion pounds of sand this year, an increase of almost 30% from 2013 and 50% above initial forecasts. (Sider, 2014) Frac sand must be uniform in shape and the grains able to withstand enormous pressures at great depth underground to ensure the flow of natural gas from fracked shale formations. The sand holds open the factures created by the water, sand and chemical mixture shot into the earth at high pressure to allow for the extraction of otherwise trapped natural gas.
This report explores the air, water and land impacts of frac sand mining, transportation, and processing and their economic consequences on local communities and their citizens. We review the mechanisms of local and state government as they relate to the frac sand mining boom now occurring in the Upper Midwest and what their response means for communities and the democratic process. It is local communities impacted by frac sand mining who have the most at stake and should be at the center of decision-making about the future of frac sand mining. Any recommendations must include broad representation of those most directly affected.
We offer here a quantitative analysis of the impacts of the frac sand mining infrastructure. How the daily lives of citizens have been impacted by the sudden scale-up of frac sand mining in their communities is essential to reporting on these mining and processing practices. What numbers and data sets mask is the human impact of technology. Through anecdotal reporting, this report suggests critical areas of qualitative analysis that should help determine policy going forward.
Section 2. Description of Frac Sand Operations Frac sand operations consist of preparing the mining site, mining the sand, processing sand, storage and transportation. The final stage for a mine is the reclamation process. 1 According to a 2012 document published by the Minnesota Department of Natural Resources, a single well can require up to 10,000 tons of sand. http://www.co.goodhue.mn.us/countygovernment/committees/MiningCommittee/Studies/SILICA%20SAND%20FACT%20SHEET%203_01_12.pdf

BAR/CSI 8
Figure 1: Frac Sand Mining Process (WI DNR 2013).
During the first stage of the process, removal of “overburden”—essentially the soil, rock, and ecosystem that sits above a sand deposit—alters the naturally occurring patterns of surface water runoff and groundwater recharge. Excavation of the sand is typically done in a surface quarry mine style, which includes blasting to gain access to the sand and crushing to break it up once removal of overburden is complete (Wisconsin Dept of Natural Resources, January 2012).
Blasting varies from site to site given the geological variants but the WI DNR states that a typical blast site “might consist of drilling 40 holes,2 2 to 3 inches in diameter into the formation to be blasted…the holes could be 50 to 150 feet deep and located in a grid 20’x20’ (Wisconsin Dept of Natural Resources, January 2012).”
During processing, the sand is washed, dried, sorted and stored to await transport. During washing, the sand is mixed with water and a polyacrylamide flocculent (a substance that encourages clumping of particles) over a vibrating screen (Wisconsin Dept of Natural Resources, January 2012). This separates the raw sand into various particle size classes and allows undesirable materials to be removed, thereby leaving a clean end product of uniform size—ideal for use in fracking. Another less frequently used method of washing is called an upflow clarifier wherein “the water washes the sand and the overflow water, along with the fines, overflow the tank while the washed sand falls by gravity to the bottom of the tank (Wisconsin Dept of Natural Resources, January 2012).” Once the sand is processed, it is stored in a pile for transport.
Most frac sand mine locations are mined in phases, and thus the reclamation phase is done in phases. Occasionally the process is only in an effort to stabilize the land and minimally revegetate. Of note, while the reclamation process is mandated by state and local regulations,
2 However, according to a local resident, the number of drilling holes may at times exceed 100. (Phone conversation with Ken Schmitt (local farmer) of the Town of Howard, June 3, 2014).
"Many of these industrial sites are located in close proximity to residential
dwellings. …[T]he 100-acre EOG mine… is surrounded by 10 residential homes located within 300 feet of the mine… The EOG processing facility in Chippewa Falls is… closely surrounded by many small businesses and residences." Ronald Koshoshek, Chippewa Falls, WI

BAR/CSI 9
long-term studies have not been completed to determine the viability of the reclaimed land. To this end, a $232,000 study is being initiated with Chippewa County, WI public officials, the University of Wisconsin, River Falls and a few mining companies as participants. Unfortunately, the study is currently at its inception and will not be completed until 2019 while mining continues. (Scanimetrics, 2014).
Section 3. Number and Location of Frac Sand Facilities in Wisconsin and Minnesota Whereas the number of frac sand mining and processing sites proliferated quickly in Wisconsin, Minnesota has not seen nearly the same level of development. Wisconsin was overrun by the industry prior to any understanding of the scale and impacts of the industry. Minnesota has so far been more cautious with respect to industry expansion in the state.
For instance, Climate News reported on the extent and lack of information in Wisconsin: “(The) [n]umber of Wisconsin frac sand facilities increased from 7 in 2010 to 145 today, even though the health implications of the boom aren’t yet fully understood.”3 (emphasis added)
Contrary to Wisconsin, Minnesota, as of May of 2013, was home to approximately 19 active frac sand mines, processing and transportation facilities and 20 proposed facilities. (Bi, 2013)
Figure 2. Current and Potential Frac Sand Mining Counties in the United States.
3 “Frac Sand Mining Boom: Health Hazard Feared, but Lawmakers Aim to Ease Regulation.” Inside Climate News, November 5, 2013. http://insideclimatenews.org/news/20131105/frac-sand-mining-boom-health-hazard-feared-lawmakers-aim-ease-regulation

BAR/CSI 10
Section 4. Impacts of Frac Sand Operations on Communities “Mining is a disruptive process. You are not going to protect the environment and mine it simultaneously. They are mutually exclusive activities” (Steven Wilson, Minnesota Department of Environmental Quality) (Blackman, 2011).
Frac sand mining raises a number of community concerns. In many ways, rural communities are becoming industrialized. Mining, as described above, changes the landscape indefinitely. To many, frac sand mining is the Upper Midwest’s version of mountaintop removal. Eliminating the bluffs facilitates groundwater contamination. Runoff into streams, wetlands, and lakes threatens habitats and fisheries. Mining and processing operations use voluminous amounts of groundwater, which can create competition between uses. Many raise issue with the potential health impacts caused by dust in every stage of frac sand operations. Existing local businesses (including farmers and those dependent on tourism) feel threatened by the arrival of the frac sand industry in their communities.
These concerns are not baseless. Frac sand operations concentrated in southwest Wisconsin and southeast Minnesota are located in what is known as the Driftless Area. It comprises 23,000 square miles and is known for its sandstone bluffs and tourism. It has attracted significant federal and state dollars for the restoration of streams and possesses a large number of unique and threatened species. It contains many protected areas. For many, the frac sand industry represents a threat to the existing economy and quality of life in the region.
Regulation of Frac Sand Operations Officials in both Wisconsin and Minnesota recognize the necessity of properly locating (with respect to zoning) and regulating the environmental and infrastructure impacts (primarily roads) of frac sand facilities. However, currently the system to permit and regulate them is at best a patchwork of various agencies and can differ substantially from state to state and from locality to locality. Moreover, the industry has taken off with little understanding of the public health and local economic consequences.
For a more detailed discussion of local and state authority and recent developments in Wisconsin and Minnesota, see Appendix I.
General Regulatory Framework The goal of analyzing the negative impacts of frac sand operations is to provide local communities, towns, and states a means to better understand the potential cost benefit analysis when making future frac sand mining decisions. Likewise it can help shape the future debate about who regulates the various aspects of frac sand mining.
“The issue of frac sand mining arrived in Sioux Creek early in 2011. I have never before in my tenure with the Plan Commission seen an issue be of such concern to the citizens…”
James Torseth, Chetek, WI
“For the last three years I have been told that DNR will protect our health… As many of us know, this is, at best, an overly optimistic view.”
Ken Schmitt, Colfax WI

BAR/CSI 11
State of Wisconsin As an example of who regulates what when it comes to frac sand operations at the federal, state and local levels, below is a chart showing the permitting authorities and their areas of oversight for the state of Wisconsin:
Figure 3. Local, state, and federal authority concerning frac sand mining (Hart, Adams, & Schwartz, 2013).
The political situation in Wisconsin is very volatile with respect to the frac sand industry and citizen pushback.
The focal point of much of the citizen activism has been at the local level. Among the strategies employed have been the attempts to leverage local authority over frac sand operations, either to restrict or prevent them. Although the power that local government possesses to slow or stop the ever-expanding frac sand mining phenomenon can be quite substantial, the pace of expansion, the political might of the industry, and the initial lack of experience in dealing with large operations all conspired to make it difficult for citizens and concerned local governments to seek ways to protect their health, property, and the region’s unique natural landscape.4
4 As an example, the Center for Land Use Education conducted a study of county comprehensive plans and zoning ordinances in 2012 and found “that counties are not well prepared for the rapid pace and large scale of the recent frac sand mining activity in Wisconsin. (Evaluating Non-‐Metallic Mining: Comprehensive Plans and Zoning Ordinances. Center for Land Use Planning, August 2012. http://wcwrpc.org/Frac_Sand/Planning_and_Regs/CompPlansZoningOrdinancesFracSand4.pdf)

BAR/CSI 12
Similar to other forms of development, frac sand mining has contributed to social conflict. The prospects for economic development, jobs, and profit pit neighbor against neighbor and elected officials against their constituents.
Pushback began to occur and citizens began to influence local decision-making in a number of respects. Some counties began to impose moratoria on further development to study the situation. Other units of local government began to exercise their police powers to impose restrictions on frac sand operations or in attempts to stop expansion altogether.
The industry response has been to file suit, to undermine local jurisdiction through legislative fiat, or to avoid barriers to expansion by shifting local jurisdiction by means of annexation - all of which have implications for local strategies to meet the challenges of frac sand operations.
A serious point of contention in the 2014 legislative session was a bill filed at the behest of the industry to eviscerate local control. Senate Bill 632, which was voted out of committee but eventually died, would have also created regulatory gaps between currently weak state environmental regulations and authority traditionally exercised at the local level. The legislation would have made it, for all practical purposes, impossible for a local unit of government to impose new regulations on existing mines or even to stop their expansion onto contiguous territory, as well as greatly impeded regulation on new mines. Assembly Bill 816 is the companion bill. The previous year, a similar bill, Senate Bill 349, failed to pass.
State of Minnesota The regulatory framework and focus on local activism is similar in Minnesota. However, the government in Minnesota has exhibited much more caution about allowing the frac sand industry to gain a foothold in the state than in Wisconsin. The concern for Minnesota’s natural areas extends from local to state government, to varying degrees.
There also appears to be much more cooperation between state and local government on the issue. The state’s Environmental Quality Board5 recognizes the importance of local planning, zoning, and land use authority as pivotal in protecting the unique Driftless Area in Minnesota, characterized by bluffs (home to much of the frac sand), trout streams, many protected species, and groundwater essential to tourism, economic development in general, and sustaining the quality of the streams. Local government, by and large, shares these concerns with respect to quality of life, aesthetics of the region, the tourism industry, and the existing economy.
5 State statute directs the EQB to: study environmental issues of interdepartmental concern, coordinate programs that are interdepartmental in nature and affect the environment, ensure compliance with state environmental policy, oversee the environmental review program, develop the state water plan and coordinate state water activities, convene environmental congresses, develop energy and environment reports, advise the Governor and the legislature.
“I feel this company (Chippewa Sands) has not demonstrated good intentions… Chippewa Sands resents restrictions on their industry and…. responsibility for the health, safety and welfare of the citizens of the Town of Crooks Valley.”
Victoria Trinko, Chippewa County, WI

BAR/CSI 13
Consequently, the frac sand industry has progressed much more slowly in Minnesota. However, design and enforcement of ordinances vary locally.
In addition, the Minnesota legislature passed legislation that directed the state’s EQB to publish a guidance document for local government of what to regulate and how, from an environmental, water quantity, and public health perspective. The Minnesota Pollution Control Agency is developing air standards for the silica dust threat to local populations.
However, it still remains to be seen how the frac sand issue will ultimately play out in Minnesota. As in Wisconsin, there are constituencies on both sides of the issue and commitment to proper regulation and enforcement may continue to ebb and flow without a solid consensus on how to move forward.
Section 5. Externalities - Human Health and Environmental Costs Externalities are costs imposed on the public by economic activity. In other words, these are costs not included in frac sand operations and thus the ultimate cost of the frac sand commodity. They are externalized to the public.
Here we describe the threats to public health and the environment posed by the frac sand industry in terms of air quality and water quantity and quality. (See Description of Frac Sand Operations for land impacts.) These facilities can be quite close to populated areas, as depicted in Figure 3 below.
Again, the paucity of information in this area reflects the highly speculative nature of this industry. Near-term and long-term negative consequences are ignored for near-term profit in the Upper Midwest sand rush.

BAR/CSI 14
Figure 4. Case study areas showing heavy frac sand mining presence, and (insert) current frac sand
counties in the United States.
Water Impact As with fuel extraction and most electricity generation processes, frac sand mining uses a substantial amount of water. In some cases, fresh surface water is used or impaired, but groundwater is the most common source (Figure 1). Local hydrology should be considered throughout each phase of the frac sand production cycle.
Water Use in Frac Sand Operations For frac sand mine operations, water is typically withdrawn from an on-site well6. The placement of the well at the mine site, along with construction, local geology, and nearby surface waters, all have a distinct impact on the movement and quality of the groundwater. Pumping from any given well may cause a ‘cone of depression’ to form, lowering the groundwater level in that area. If poorly managed it can ultimately cause a reversal on the flow of the groundwater (Parsen, 2012) (Wisconsin Dept of Natural Resources, January 2012).
The total amount of water withdrawn and/or consumed by each operation varies, and much of the variation depends on whether the site employs an open or closed loop process. Most frac sand
6 Currently it is difficult to assess water use at frac sand mines versus their processing facilities. It is unclear if this is due to the processing plants being collocated with the mines, and thus considered a single entity, or if the differentiated data is not widely reported. Since the mine or processing facility will apply for the same high capacity well permit the DNR numbers quoted in this document provide a good proxy until differentiated data is available. However, as an example and according to the Chippewa Falls Department of Public Utilities, the EOG processing facility in Chippewa Falls used approximately 310,000 gallons of water on average per month from January 2012 to June 2012. (This information is in an e-‐mail dated July 2, 2012.)

BAR/CSI 15
mine locations use closed loop systems, in which case nearly 90% of the water withdrawn can be recycled for on-site use. In terms of water volume, site withdrawals can range from 420 thousand gallons per day (292 gpm) to two million gallons per day (1,380 gpm) (Wisconsin Dept of Natural Resources, January 2012).
As a point of reference, municipal wells can extract 100 – 1,500 gpm to provide the needs of a municipality (Parsen, 2012). For most states, this qualifies as a high capacity well and is subject to state regulations for potential impacts where such regulations exist (Wisconsin Dept of Natural Resources, January 2012).
According to the 2013 Wisconsin Water Withdrawal Report, a voluntary survey administered by the state’s Department of Natural Resources, 30 sites in 10 counties reported using more than 1.3 billion (down 144 million from 2012 and up 101 million from 2011) gallons of water for “Industrial sand preparations”, more commonly known as washing frac sand. Of the 30 water withdrawal sites, all water depletion can be attributed to 18 operators. In the ten counties with reported frac sand water operations, industrial sand preparation was the 6th highest user of water with 93% coming primarily from ground water and the rest from the surface. In 2013, 18 operators consumed more water for frac sand preparation than 67 of the 70 “Public/Municipal/Community” water systems for all 10 counties (Wisconsin Department of Natural Resources, 2014).
Water is also used for dust control at mines, sand piles, and transportation hubs.
Adverse Impacts to Water Quality Adverse hydrological impacts may occur at each phase of the frac sand mining process (Figure 1). At some sites dredging occurs and sand is removed below the groundwater table. Dredging is especially harmful from the standpoint of shallow groundwater contamination (Parsen, 2012).
According to the WI DNR, the concentration of the polyacrylamides used in the frac sand washing process is often unknown or may vary substantially. Polyacrylamide levels must be continuously monitored, because although polyacrylamide is itself nontoxic, unpolymerized acrylamide is a known neurotoxin and can occur in low concentrations within sand washing solutions (Daughton, 1988). The Environmental Protection Agency (EPA) has a Maximum Contaminant Level Goal (MCLG) of zero for acrylamide in public drinking water sources. According to the WI DNR, “people who drink water containing high levels of acrylamide over a long period of time could have problems with their nervous system or blood, and may have an increased risk of getting cancer (Wisconsin Dept of Natural Resources, January 2012).” The issue of acrylamides becomes particularly significant when considering wastewater discharge and recharge practices occurring on site. As piles of processed sand dry, acrylamide-laden water can percolate down into the groundwater (Wisconsin Dept of Natural Resources, January 2012) (Parsen, 2012).
Surface and groundwater may also be negatively impacted by land use changes related to increased road networks (Wisconsin Dept of Natural Resources, January 2012) (Parsen, 2012).

BAR/CSI 16
Just as the initial step of overburden recharge affects local hydrological patterns, infilling of completed mine sites, choice of fill, and attention paid to preexisting geological conditions and drainage process dictate the long term level of impact during the reclamation process (Wisconsin Dept of Natural Resources, January 2012).
In addition to complex underground aquifer systems, Wisconsin and Minnesota are home to plentiful streams and lakes. No frac sand mine location is far from such surface water resources. Surface water impacts are most directly felt when sand is removed from the surface water locations themselves. Among the environmentally harmful impacts are siltation, erosion, increased turbidity, and degraded aquatic and riparian habitat. Ongoing mining operations in these areas can adversely impact the chemical makeup of local waterways. Thermal impacts (unnaturally warm or cool waters) have also been noted as a potential concern, but few studies exist to validate the significance of such impacts (Wisconsin Dept of Natural Resources, January 2012).
The primary wastewater streams at frac sand mining operations are wash water generated during processing as well as excess precipitation and/or groundwater removed during pit dewatering. Contamination of natural waterways occurs via seepage or direct discharge to surface waters. The major pollutant of the wastewater discharge that is regulated and/or permitted is the suspended sediment. While suspended sediment is generally non-toxic, it can choke sensitive habitats if exposure is chronic (Wisconsin Dept of Natural Resources, January 2012).
Fishery impacts in Wisconsin and Minnesota are of particular concern to many local citizens as their livelihood and recreational interests are attached to the fishery industry. Long-term fishery impacts are still unknown, due to the exponential expansion of the frac sand mining industry. Citizens have detailed many concerns of detrimental impacts as a result of frac sand mining. The WI DNR details the following as specifically pointing to runoff causing turbidity and affecting trout reproduction, runoff causing sedimentation, thermal increases causing cold-water aquatic life to disappear, decreased stream flow from groundwater withdrawals, entrapment of fish, and realignment of stream channels (Wisconsin Dept of Natural Resources, January 2012).
An emerging and potentially highly damaging water pollution problem is the issue of acid mine runoff that could contaminate groundwater and surface water. Acid mine runoff is normally associated with mineral mining. However, WI DNR data of heavy metal content in sand wash ponds adjacent to mines obtained by Midwest Environmental Advocates demonstrate the same issue arises in frac sand mining.7 The more acidic water allows heavy metals at toxic levels to
7 WI DNR sand wash pond data can be found on the MEA website at: http://midwestadvocates.org/assets/resources/Frac%20Sand%20Mining/2014-‐9-‐12_storm_water_sampling_results_page_1_FINAL.pdf http://midwestadvocates.org/assets/resources/Frac%20Sand%20Mining/2014-‐9-‐12_storm_water_sampling_results_page_2_FINAL.pdf
“In this (Chippewa Sands) permit application (for a frac sand mine), there is no mention of the retention ponds, the amount of water used to fill the ponds, how they will dispose of the chemical-‐laced slurry, what plan of action will be taken in the event of a spill or the level of pollution in these ponds. I feel these ponds are highly toxic due to the signs posted next to the ponds….” Victoria Trinko, Chippewa County, WI

BAR/CSI 17
leach into water supplies, such as arsenic, cadmium, aluminum, lead, manganese, copper. This water contamination problem extends to reclamation processes that use sand from formations located near frac sand formations (the Tunnel City sandstone formation). Moreover, groundwater contamination can occur as a result of farming on such reclaimed land. (Midwest Environmental Advocates, 2014)
Figure 5. Typical water impacts of frac sand mining. (Photos by Ted Auch)
Air Quality Impacts The air impacts associated with frac sand mining are far-reaching and damaging to the environment and to human health. The processes of frac sand mining and transportation contribute to local air pollution as well as to climate change. These problems are not accounted for when calculating the carbon footprint and economic cost of natural gas, but they are very real costs and damages that should be factored into policy choices. Current regulations are weak and often go unenforced, and are therefore minimally effective.
The primary air pollutant of concern for local citizens is silica (frac sand) dust. This is known as particulate matter (PM) and chronic exposure is associated with numerous health problems.
Particulate Matter (PM) and Its Health Effects According to the EPA:
"Particulate matter," also known as particle pollution or PM, is a complex mixture of extremely small particles and liquid droplets. Particle pollution is made up of a number of components, including acids (such as nitrates and sulfates), organic chemicals, metals, and soil or dust particles.
The size of particles is directly linked to their potential for causing health problems. EPA is concerned about particles that are 10 micrometers in diameter or smaller8 because those are the 8 EPA groups particle pollution into two categories: 1) "Inhalable coarse particles," such as those found near roadways and dusty industries, are larger than 2.5 micrometers and smaller than 10 micrometers in diameter: and, 2)"Fine particles," such as those found in smoke and haze, are 2.5 micrometers in diameter and smaller. These particles can be directly emitted from sources such as forest fires, or they can form when gases emitted from power plants, industries and automobiles react in the air (Environmental Protection Agency).
“In October 2012, I was diagnosed with asthma due to my environment…. While on vacation for a month this (2013) summer, my symptoms … disappeared… While driving home… within a mile of the Howard mine, my throat started swelling, and by the time I arrived home, it was sore and my voice horse.” Victoria Trinko, Chippewa County, WI
BAR/CSI 18
particles that generally pass through the throat and nose and enter the lungs. Once inhaled, these particles can affect the heart and lungs and cause serious health problems.
PM2.5 (a very small and very dangerous dust particle) is associated with a wide range of health problems, including asthma, lung disease, cardiovascular issues, respiratory diseases, birth defects and premature death. According to The Journal of the American Medical Association, PM pollution is estimated to cause 22,000-52,000 deaths per year in the U.S. alone. Additionally, the World Health Organization estimates that PM2.5 accounts for 1% of mortality from acute respiratory infections in children under 5 years old, worldwide (Mokdad et al., 2004).
Particles as small as PM2.5 are produced from frac sand mining and processing, transportation vehicles, as well as from construction vehicles related to the mining process. While PM2.5 occurs naturally in small amounts, the rapid growth of the frac sand mining industry is contributing to levels of ambient PM2.5 in the Midwest. Moreover, these silica particles are not weatherworn, and possess sharp, jagged edges that are particularly damaging to the lungs.
Unfortunately, monitoring of this rapidly expanding industry has been outpaced by the rate of development, and there are very few studies that look at the whole picture; however, emerging evidence, such as the research being done by Crispin Pierce and his associates at the University of Wisconsin – Eau Claire has demonstrated that PM2.5 levels near frac sand mines are above the recommended safe level (Prengaman, 2013).
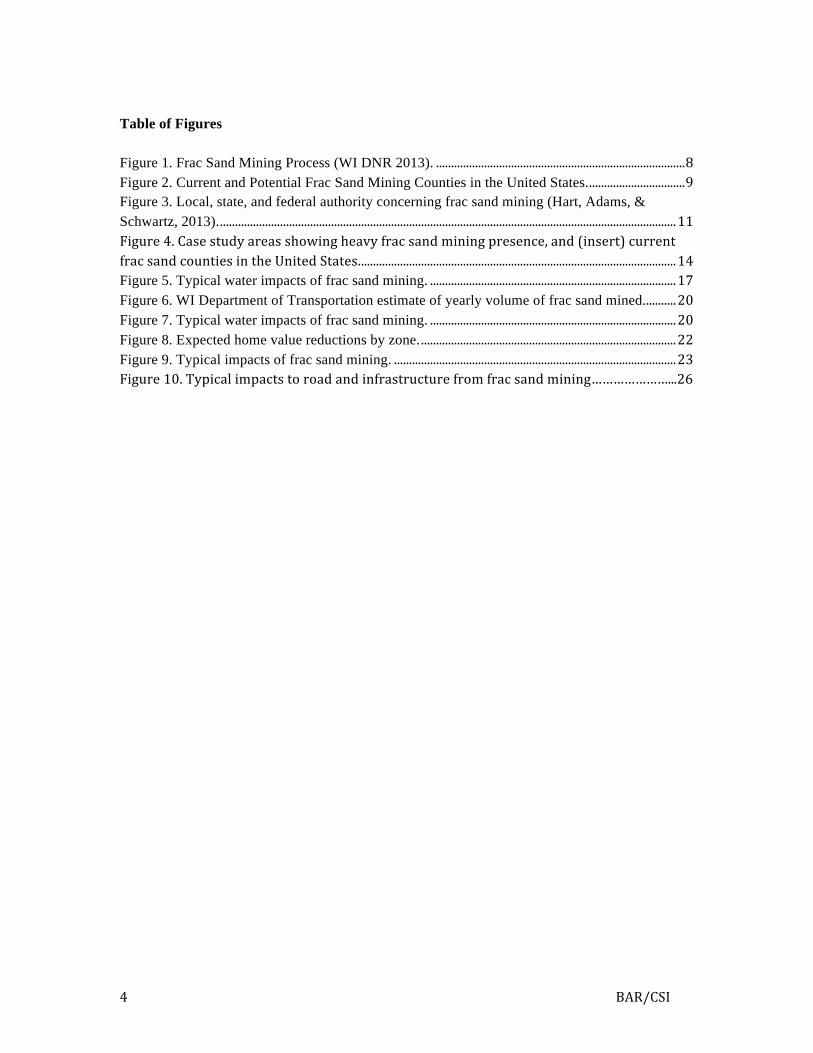
Crystalline Silica From Fracking Operations and Its Health Effects Silica, or silicon dioxide, is a chemical compound that is most commonly found in nature as quartz. Crystalline silica is an ultrafine particle that occurs when silica is crushed, exploded, drilled or chipped, as occurs during silica mining. Crystalline silica can be ingested through breathing, allowing the particles to become lodged in the lungs.
Prolonged exposure can lead to silicosis and is thought to be a lung carcinogen (Korfmacher, Jones, Malone, & Vinci, 2013). The immediate threat comes to the miners who mine and process the sand and then for the well pad workers who come most closely into contact with it (Korfmacher, Jones, Malone, & Vinci, 2013). The National Institute for Occupational Health and Safety collected air samples at 11 different fracking sites in 5 different states. At each of the sites NIOSH found air levels of particle pollution that exceeded occupational health criteria with 31% of the samples exceeding standards by a factor of 10 or more (Korfmacher, Jones, Malone, & Vinci, 2013).
Frac sand also carries a potential risk to residents near mining sites, along transport routes, and for the transport crews who move the cargo. The risk for residents and transporters is currently highly contested by the industry and some government officials, with anecdotal evidence showing health impacts and costs for some residents near frac sand mining operations (Dirr A. , 2013). In 2012 the Concerned Chippewa Citizens measured air quality near Chippewa Falls and found that:
“The air quality monitoring found that when the wind blew in specific directions (toward the monitoring equipment), there was a statistically significant increase in the particulate
“That my children and grandchildren could be subjected to… silica dust from operating mines is intolerable and disconcerting.”
Scott McCurdy, Menomonie, WI

BAR/CSI 19
pollution in the air at the monitoring sites that were more than a mile from the processing facility. On 51 percent of the days that were monitored, the particulate pollution “possibly exceeded the air quality standards” as specified by the Wisconsin Department of Natural Resources. On 37 percent of the days, the monitors showed “possible exceedences of this standard on an average hourly basis.” The monitoring also found silica levels that “exceed various state benchmark levels for silicosis.” This study suggests that health threatening air quality problems can develop at significant distances from the frac-sand processing plants. (Power & Power, 2013)
As mentioned, silicosis9 is among the diseases caused by exposure to frac sand dust. Intense exposure to crystalline silica can cause disease within a year, but it usually takes at least 10-15 years of exposure before symptoms occur. This is particularly troubling for people living in proximity to multiple frac sand mines as well as elderly people or families with young children as these populations may be more susceptible to disease. Additionally, people with silicosis are at high risk for developing tuberculosis.
Crystalline silica exposure has been linked with other lung ailments as well, including emphysema and bronchitis (Park, 2002).
It has also been linked with a variety of autoimmune diseases, such as scleroderma, lupus, rheumatoid arthritis, autoimmune hemolytic anemia, chronic thyroiditis, and hyperthyroidism, among others (Steenland & Goldsmith, 1995) and to kidney-related diseases, such as chronic renal disease, and those with high exposure are more likely to die from renal disease (Goldsmith, Attfield & Mannejte, 2002).
Carbon Emissions In addition to the health impacts of silica exposure, frac sand mining contributes to climate change. Not only does it assist in fossil fuel extraction, but the activities involved in mining, processing, and transporting frac sand are independently carbon intensive. For example, the National Center for Freight & Infrastructure Research & Education estimated that a full build-out scenario of frac sand mining in Chippewa County, Wisconsin would see between five and seven million tons of sand being transported out of the county per year. Chippewa County accounts for about 1/10th of the estimated total output that is projected for Wisconsin (Vart et al., 2013).
Without a doubt, the large number of shipments combined with a low mpg ratio leads to significant carbon pollution, although the exact number is difficult to quantify. Rail transportation is more cost-effective and less polluting, but still contributes to local air pollution and carbon emissions, especially when the sand travels hundreds of miles to reach its final destination. Additionally, diesel locomotives that idle near plants, especially in the winter months, will add to this pollution.
9 According to the U.S. National Library of Medicine, three types of silicosis can occur: 1) Simple chronic silicosis – results from
long-term exposure (more than 20 years) to low amounts of silica dust. The silica dust causes swelling in the lungs and chest lymph nodes. This disease may cause people to have trouble breathing. This is the most common form of silicosis; 2) Accelerated silicosis – occurs after exposure to larger amounts of silica over a shorter period of time (5-15 years). Swelling in the lungs and symptoms occur faster than in simple silicosis; and 3) Acute silicosis – results from short-term exposure to very large amounts of silica. The lungs become very inflamed and can fill with fluid, causing severe shortness of breath and low blood oxygen levels (National Library of Medicine).

BAR/CSI 20
Figure 6. WI Department of Transportation estimate of yearly volume of frac sand mined.
This is only a drop in the bucket considering that there are at least a dozen other counties with active mines, all of which are also shipping frac sand around the country.10 Additionally, there are emissions involved in mining and processing which have yet to be widely studied, but are likely to have a significant cumulative impact on global warming emissions if a full-scale build-out of frac sand mining is achieved.
Figure 7. Typical air impacts of frac sand mining. (Photo Left: from WI DNR11 Photo Right: from NIOSH)
10 It appears that U.S. exports of frac sand will remain limited into the foreseeable future due to domestic demand. According to 2012 data, the U.S. exported 3 million tons of frac sand to Canada, 10% of overall production. (http://www.infomine.com/index/pr/PB327833.PDF) Production for domestic demand is expected to reach 40 to 50 million tons per year. (http://www.academia.edu/3703532/Frac_Sand_Mining_in_Wisconsin_Understanding_Emerging_Conflicts_and_Community_Organizing) 11 Photo was retrieved from “High capacity well and groundwater: frac sand, what you need to know to get your permits.” Presented by Dave Johnson, Groundwater Section of the Bureau of Drinking Water and Groundwater, WI DNR. March 2014 (http://www.axley.com/wp-‐content/uploads/2014/03/FracSandPermits2014.pdf)

BAR/CSI 21
Economic Impacts Local communities and states are faced with the challenge of determining both the potential economic benefits and costs from sand extraction efforts. Unfortunately in many communities the negative risks and consequences have been overlooked, or simply not prioritized against the possible benefits. There are many potential reasons for this.
Examples include the prolonged economic downturn created by the 2008 global finance implosion, which made the potential profits from frac sand mining extremely tempting, given the weak underlying economic environment in the country. Likewise, market psychology may have helped push some communities to overlook the human health and other risks, as no one wants to miss out on a potential economic boom during a lengthy recession. Other communities have accepted the costs and risks seeking to diversify their local business mix and bring in a new revenue and tax stream to otherwise economically homogenous rural areas.
Because there has been little published research on the potential negative economic effects of frac sand mining, those concerned about the impacts are too easily dismissed. The last big round of socio-economic analysis of American mining communities occurred in the 70s and 80s (Deller & Schreiber, 2012). Lacking any conflicting viewpoints, many local communities may have used research that tended to overestimate the positive economic benefits from exploitive technologies (Weinstein & Partridge, 2011).
The following areas detail some of the negative costs associated with frac sand mining and represent a partial listing. They include:
• Substantial declines in property values near mining operations • Associated declines in local tax revenues based on falling property values over time • Negative impacts to local businesses due to mining operations and increased railway or
truck traffic carrying the mined product • Decreased lifespan time for roads and other infrastructure, which carry a substantial
replacement cost • Opportunity costs to local towns and communities that under-profit from local mining
operations • The “flickering” effect as mines temporarily close during periods when mined product
drops below the price needed to profitably mine it • Increased health costs and burdens to local residents as well as increased demands on
local health providers • Demand for track and barge space can lower profitability for other sectors as well • Impacts on school funding
Towns and local communities should exercise precaution when evaluating potential frac sand mining operations in their region. (See Appendix II: Local Economic Analyses to Conduct Prior to Frac Sand Operation Approvals.) The economic benefits for local mines are often oversold and the economic costs are often underestimated, especially early on when the critical legal negotiations are taking place.
Property Values and Tax Revenues One of the problems in assessing positive and negative frac sand mining economic impacts is the lack of economic analysis of mining operations in general in the U.S. and with frac sand in

BAR/CSI 22
particular as a relatively new niche market. Other researchers note that there is a small body of work for peer-reviewed studies on general mining operation impacts on the local community (Deller & Schreiber, 2012).
However there are corollaries in the mining industry from which one can extrapolate for frac sand mining operations and their potential negative impacts. Previous research examined the impacts to local housing values from mining operations in Ohio, Michigan, and rock quarry operations in Canada (C4SE, 2009). Though these other studies are not a one-for-one corollary for frac sand mining they provide a reasonable guide for the rates of property decline and the distances involved for properties near rural mining operations. Many of the negative impacts are the same as for frac sand mining and include heavy truck traffic, changing local topography to remove resources, changes to water drainage patterns due to changes in land slope, etc. (Cantarow, 2012) (Deller & Schreiber, 2012).
Though the potential health impacts are still being debated, home and business owners will make their buying and selling decisions based on the court of public opinion in their local areas, well before the legal and medical issues are resolved. There is already mounting anecdotal evidence that confirms the loss of home and land value for properties near frac sand mining operations (Cantarow, 2012). In some cases homes become practically unsellable, with owners trapped in properties that continue to lose value over time (Cantarow, 2012). A loss in home value is a way to quantify in dollars the deterioration in quality of life, which is a financial burden that is placed on the homeowner by the incoming industry.
Using the results found from the C4SE Rockfort Quarry effort the resulting property value losses via distance from a mining operation are as follows:
Potential Property Value Decrease from Mining Operations
Distance from Mining Project Percentage Decrease
in Property Value Example Reduction in
200k home
Within .5 kilometers (.31 miles) 25% or more 50k loss
1 kilometer away (.62 miles) 15% to 20% 30k to 40k loss
1.5 kilometers away (.93 miles) 15% 30k loss
2 kilometers away (1.24 miles) 10% 20k loss
3 kilometers away (1.86 miles) 10% 20k loss
4 to 5 kilometers away (2.49-3.11 miles) 5% to 7% 10k to 14k loss
Figure 8: Table of potential property value decreases based on proximity to frac sand mining operations (C4SE 2009).
(Note: The example home reductions in the chart above is not in the C4SE report, and is instead added to help highlight what the percentage decreases would mean for a 200k home.)

BAR/CSI 23
Figure 9. Expected home value reductions by zone.
The C4SE study found that the average property value decrease for homes within 2 kilometers (1.24 miles) was 19%, and that the decrease in value is more or less a permanent effect (C4SE, 2009). This represents a huge impact to home owners in the vicinity of local mining operations and also to the local tax base as declined property values lead to a decrease in tax revenues.
Sadly, the potential decrease in property values described in the this section may be too conservative, as frac sand mining creates fine scale dust which migrates from the excavation and transport areas. Thus the radius of property devaluation may be larger than that for the quarry in the initial study. Additionally the increase in truck and railway traffic may be a source for decrease in property values, even more so if windblown frac sand contaminates properties that transport routes pass through. A 2006 study of gravel mines in Michigan concluded that property owners’ willingness to pay to be farther from the haul route increases at about 7.92% per mile, meaning home values are significantly affected not only near mines, but also near haul routes (Erikcek, 2006).
To add to this discussion, Parker and Phanuef at the University of Wisconsin-Madison compiled research to assess the impacts of “traffic congestion, noise, and diminished air quality” from “frac sand operations and transport” activities on property values for the Pepin and Stockholm Districts of Pepin County, WI. This area has many amenities (including a section of the Great River Road along the Mississippi River) that have attracted more residents (in-migration) and tourism. The authors found that such operations have “the potential to significantly impair property values and tourist activity” in the area. They based this conclusion, in part, on research findings that reflect

BAR/CSI 24
similar impacts in many other regions of the country, which has negative economic implications not only for the Pepin and Stockholm Districts but also for communities across western Wisconsin and southeastern Minnesota where frac sand operations are occurring or proposed. (Parker & Phaneuf, 2013)
Likewise there are additional impacts from property devaluation that create a snowball effect in local communities. As an example, realtors in a frac sand mine township are also impacted as property values drop and interest for properties near frac sand mines flat lines. This spreads to the construction sector as new home starts and renovations are similarly impacted in the affected depreciation zone. In the worst-case scenario it could confirm the fears of some frac sand opponents who say that “frac-sand mining will virtually end all residential development in rural townships.” (Cantarow, 2012)
Assessing the likely negative impacts to tax revenues is much harder given the difference in tax rates for areas, how densely populated a region is, what the average home value is, along with a host of other factors. Broadly we can state that declining property values will likely lead to a decrease in tax revenue from properties near frac sand mining over time. For example, in the case of the Rockfort Quarry, C4SE assessed that the local total property tax revenue was $472,000 and would decrease to $382,000 as a result of the mining operations impact on local property owners (C4SE, 2009). This $90,000 loss equates to roughly 19% of the tax revenue and matches the on-average 19% reduction in property values within 5 kilometers (3.11 miles) of a mining operation they assessed for the region (C4SE, 2009).
Impacts to Other Businesses and Tourism Tourism is a very important industry in the Upper Midwest, particularly in Wisconsin, where it sustains approximately one in thirteen jobs and had a $16.8 billion impact on the state’s economy in 2012 (WI Dept. of Tourism, 2013). Additionally, the state receives a generous return on investment in the tourism sector, with every dollar spent on advertising by the state producing a six-dollar return (WI Dept. of Tourism). One assessment looking at conventional fracking (which is significantly less complicated than the majority of unconventional fracking occurring today) in the Marcellus Shale region found that at the local level fracking efforts did not significantly detract from tourism in the area (Rumbach, 2011). However the threat did exist to damage the “brand” and local reputation for a region if pristine areas succumb to industrialized blight (Rumbach, 2011).
The University of Wisconsin study mentioned above underscored, with high confidence, the threats to the existing local economy posed by introduction of frac sand operations. Power and Power’s 2013 report considering the economic costs and benefits of frac sand operations in west central Wisconsin came to similar conclusions. It found that mining counties in the U.S. were typically characterized by poverty, loss of population, and lacked economic diversity. It found, as in other mining counties, that frac sand mining and related operations in Wisconsin - whose economy has moved to professional services and manufacturing “buttressed” by tourism/recreation - could undermine and be a deterrent to the ongoing economic vitality and diversity of the region. It also found that frac sand mining jobs would continue to be a miniscule fraction of all jobs in counties with frac sand resources (Power & Power, 2013), suggesting that, in many cases, the risks far outweigh any benefits from frac sand operations for local economies.
Anecdotal evidence exists that former mine sites cannot be easily reconstituted for agricultural purposes (Cantarow, 2012). This may prove to be problematic for citizens in Wisconsin and Minnesota who expect to be able to repurpose mine sites after they close in the future. Without
“We have had our dream home on the market… with absolutely no bites because of this sand mine going on.”
Jamie Gregor, Tomah, WI

BAR/CSI 25
negotiated legal provisions with affected towns and areas it may prove difficult, if not impossible, to force mining firms to pay for degraded land areas to be brought back to economic usefulness outside of the mining industry, if this level of reclamation is even possible at all.
Impacts to Roads and Infrastructure A common problem for resource exploitation in communities is the accelerated replacement times and associated costs for big-ticket items like local roads. The use of trucks and other big vehicles hauling heavy loads of frac sand lead to much higher road wear than in a purely residential community. As a result, many towns face sticker shock when roads meant to last twenty years instead need replacement at five. To help offset the costs most states/towns establish road upgrade and maintenance agreements (RUMA) with the firms causing road wear and tear (Hart, Adams, & Schwartz, 2013). However, different states use different methods to accomplish the same ends. Ohio relies on a standardized statewide RUMA, Pennsylvania used impact fees where drillers paid 40k to 60k per well, and states like Minnesota consider the use of an aggregate tax where drillers pay a constant rate for each unit of sand moved in the area (Hart, Adams, & Schwartz, 2013). But similar to the complexity involved in permitting anew frac sand mine there is just as much complexity in negotiating a good RUMA or similar mechanism. Thus, there are many opportunities for a town or county to get taken advantage of when assessing road wear repayment mechanisms with savvy firms.12
In the event that local representatives make mistakes in each of the above various clauses, agreements, stipulations, and cost reimbursement agreements it can put local stakeholders on the hook for potential costs.
It is also important to discuss the scale of hauling traffic that accompanies a frac sand mining boom in a state. For example, the Minnesota Department of Transportation (MnDOT) released the numbers it expects statewide in regards to Frac sand mining. It determined the average frac sand mining operation will move from 250 thousand to a million tons of sand per year (MnDOT, 2013). MnDOT assessed that as causing an additional concentrated flow of 70-250 heavy truck trips per day (MnDOT, 2013).
In regards to the ability for current infrastructure to handle the increased wear and tear MnDOT stated: “Normal highway funding available to these governmental units is far from adequate to offset the new and immediate needs for road repair and rebuilds. Serious road degradation may occur in the first 1-3 years, versus a life of the mining operations that is expected to extend for 5-30 years.” (MnDOT, 2013)
12 As an example consider the following elements that need to be analyzed, formulated, negotiated, finalized, enforced, and most importantly, accurately assessed for price:
• Include recitals • Identify terms and conditions • Identify roadway routes to be used • Identify the owner and authorized representatives • Identify the local government and authorized representatives • Contain terms for payments of both roadway improvements and long term roadway maintenance • Indicate cooperation and potential emergency actions • Contain provisions for insurance, remedies, and enforcement • Contain severability clauses • Discuss assignability • Contain processes for modifications and termination
(Hart, Adams, & Schwartz, 2013)

BAR/CSI 26
Minnesota state law allows counties to levy a 15-cent per ton aggregate extraction tax to help offset the costs, but MnDOT assessed this to be drastically under the actual need (MnDOT, 2013). As a result the Minnesota Local Research Board commissioned a study that found that a better road use fee is 22 cents per mile (MnDOT, 2013).
Even this increased fee may not be enough to cover increased road lifecycle replacement costs. Local county public committee meetings debated the issues with local residents pointing out potential errors in the calculations and that if road replacement costs were higher than expected the county may be on the hook for considerable funds (Spring Grove Herald, 2012).
In addition to matters of cost there may be follow-on economic impacts coming from increased costs to first responders such as EMTs, firefighters, and police officers to increased vehicular collisions caused by the increase in volume of local traffic. Likewise, increased traffic flow in winter months may require additional plowing and road salting to accommodate truck traffic operating at off-peak hours while residential traffic patterns tend to wind down.
Likewise many of the jobs associated with frac sand mining may not be placed locally. One of the already observed reactions since the 2008 financial crisis is the willingness and propensity for employees to commute long distances to reach their employment sites. The long distance commuters will likely put further strain on road life as well as on local traffic congestion in the area. (Power & Power, 2013)
Figure 10. Typical impacts to road and infrastructure from frac sand mining (Photos by Ted Auch).
Mispriced Terms for Towns and Communities Local towns and communities also suffer from the potential of undervaluing the amount of revenue they should be receiving from mining firms. This comes as a result of small towns with potentially limited or no experience in dealing with mining lease negotiations being taken advantage of by savvy industry lawyers. Ellen Cantarow provides an example in an article for Salon.com:
“On July 6, 2011, a Unimin representative ran the first public forum about frac-sand mining in the village. Other heavily attended and often heated community meetings followed, but given the cascades of cash, the town board chairman’s failure to take a stand against the mining corporation, and Unimin’s aggressiveness, tiny Tunnel City was a David without a slingshot.
Local citizens did manage to get the corporation to agree to give the town $250,000 for the first two million tons mined annually, $50,000 more than its original offer. In exchange, the township agreed that any ordinance it might pass in the future to restrict mining wouldn’t apply to Unimin. Multiply the two million tons of frac-sand tonnage Unimin expects to mine annually starting in 2013 by the $300 a ton the industry makes and you’ll find that the township only gets .0004% of what the company will gross.” (Cantarow, 2012)

BAR/CSI 27
Since there is little data or research on how pervasive this issue is, it is hard to assess revenue loss across larger geographic areas and states. Likewise some towns may do a better job in negotiations and gain a larger, and fairer share, of the extraction revenues. However, without extensive negotiation experience with extraction firms, it is likely that Tunnel City’s experience will be more the norm rather than the exception. Residents of Buffalo County, Wisconsin already feel they have been taken advantage of, with the citizens of many Minnesota towns also expressing alarm (Chadwick, 2012).
This issue touches again on the higher likely costs to infrastructure discussed in the last section. By miscalculating revenue from mining companies, local townships look to take a double-hit: first, for the “missing” revenue stemming from poorly negotiated revenue agreements, and second, from the higher than expected road and infrastructure costs. The Minnesota DOT itself admits that roads can expect significant wear and tear above normal in the first 3 years of mine operations alone (MnDOT, 2013). Simultaneously the same mining operations can continue for decades, which presents an ongoing, shortened lifecycle replacement timeline on roads that continues to provide potentially higher bills to local towns for the duration of operations (MnDOT, 2013).
Towns counting on the ripple effect of payroll and economic benefits from the mine to make up the shortfall via taxes in the local community may also be disappointed. Since many workers commute from out of the local area, the effects of the mines payroll on local businesses can be substantially watered down (Power & Power, 2013). Likewise, the environmental impacts incur their own costs and the choice to open a mine and the topography changes that accompany it incur an opportunity cost to other local businesses such as farming or tourism (Power & Power, 2013).
Variability in Mine Revenues Due to Fluctuating Commodity Costs and Impact on School Funding To the extent that payroll and ripple effects do contribute to the local economy, it is constrained by the “flicker effect” caused by mine operations halting when commodity prices fall below the profitability line for extraction (Deller & Schreiber, 2012).
Mining companies can attempt to circumvent the flicker effect by extracting as much as possible, as fast as possible while commodity prices are high. However, this leads to a shorter lifespan for mining operations as it speeds up the depletion rate for the mine (Deller & Schreiber, 2012). A mine also does not need to fully deplete to no longer be cost effective as the best grade, and most easily accessible features are extracted first. This leaves areas of lower grade and less profitable sand available later in the lifecycle of the mine. If these areas fall below the profitability line the mine may temporarily shutter and cause the flicker effect until prices rise enough to make it worth mining again.
School funding could be negatively impacted by frac sand mining in Wisconsin, which, according to a recent study released by Trempeleau County, “has largely been left out of the debate.” Mines tend to increase county property valuation overall, even though individual property values may fall near the mines, which results in less state school funding and a higher burden on local taxpayers unless compensated for with higher enrollments that trigger additional state funding. (Miller, et al., 2014)
Increased Health Costs and Demands on Local Health Providers Air quality issues will likely have a direct impact on local asthma rates and will also effect residents who already have pre-existing breathing conditions. This equates to increased health care costs in local communities, who again are likely not receiving enough compensation in mine

BAR/CSI 28
revenues to handle these added costs. Local and state health officials should be monitoring and doing baseline research to document the impact on children and adults living around the most affected areas. In the worst case scenario local residents may develop silicosis or lung cancers from silica dust exposure and will undoubtedly provide a financial hit to local areas for care and treatment, plus the stigma to the area as being unsafe to live in. Since different medical conditions take different amounts of time to develop, it is even more important that local and state officials begin longitudinal studies and keep local residents informed about potential health risks. Unfortunately for residents near frac sand mines they will have to act as the guinea pigs to create the baselines and future case studies for how dangerous incidental frac sand exposure is.
There may be other health costs from the indirect effect of increased mining operations, namely traffic accidents due to higher road congestion and use. These can be more directly tallied in the future by states with frac sand booms by comparing traffic accident health care response costs in a before-and-after model once frac sand traffic picks up in an area.
Transportation Impacts on the Agricultural Sector from the Fracking Industry In addition to the potential direct, negative economic impacts from frac sand operations, the oil boom from the Bakken shale formation in North Dakota has clogged rail lines in the Upper Midwest with oil-bearing tanker cars, undermining the farm economy in the region. Although the unusually cold winter may have played a role in slowing shipments, delays in train car deliveries to grain elevators persist, costing farmers hundreds of millions of dollars. Soybeans, wheat, corn simply cannot be moved from storage. (Plume, 2014)
Although a farm organization notes that Minnesota, North Dakota, South Dakota, and Montana have experienced the worst impacts, (Railpage, 2014) it would stand to reason that Wisconsin is also being impacted. First, frac sand operations have increased transport volume by rail and barge. Moreover, “…between 26 and 44 trains per week transport Bakken oil along an eight-county route that parallels the Mississippi River in western Wisconsin,” which amounts to “3 million gallons of oil every 3.5 hours.” (Associated Press and LaCrosse Tribune, 2014)
Section 6. Recommendations Perhaps the best response to the rapid expansion of shale gas extraction is to take a step back and view the entire shale gas fuel cycle more holistically. The questions, if properly posed, can assist us in defining the issues, challenges, and consequences of the shale gas fuel cycle. They will also help answer whether or not the shale gas revolution is of benefit to all of us or just some of us, and determine the long-term viability of the shale-gas economy. In pursuing this exercise, the scope of questions should not remain at some national or geopolitical strategic level. Rather, they should also address the consequences of the shale gas fuel cycle for people at the local level including the consequences for their property, their businesses, their cultural values and way of life, their health, their access to adequate supplies of clean water, the impact on local infrastructure, as well as the sustainability of their community’s economy in the near- and long-term.
Of course, such questions should have been posed long ago. Powerful economic forces are churning ahead without pause or consideration of the implications of shale gas extraction for our country and our citizens.
Indeed, the report was, in part, written in an attempt to fill the vacuum of government leadership and regulatory authority. While the 2005 Energy Policy Act exempted the shale gas industry from government regulation, slowly but surely communities around the country are finding the need to protect the quality of life, water and public health from this industry.

BAR/CSI 29
The central role of government is to advance and protect the common good through the exercise of its elected authority. Technology and industrial activity can produce jobs and progress and they can produce human suffering and social and economic decline. It is up to governments to not merely monitor, though this is the most basic responsibility of government, but to exercise caution and take preventive action before human and environmental harm are done.
We can begin by posing the following questions:
1. What are the environmental, health, and land use impacts of the shale gas fuel cycle? What do they mean for the nation? For local communities?
2. What is the state of knowledge in each of these categories? Who is doing the research if any? What agencies of local, state and federal government are charged with informing and protecting public health, water resources and land use planning?
3. To what extent are these agencies and the individuals charged with leading them fulfilling their responsibilities?
4. What cost benefit analyses have been done and by whom with respect to each stage of the shale gas drilling cycle?
5. What is the process, if any, for assessing the environmental impact of heavy water use by the different stages of shale gas extraction?
6. What liability and legal framework would be employed in the event of proof of public harm? What corporate structures are being used or potentially being used to shield corporate interests from public accountability or from legal liability from public harm?
7. What type of processes and what kind of analyses and assessments are imposed by local government authorities to ascertain the public health, air, water, land, traffic, infrastructure and economic risks and impacts posed by frac sand mining and processing operations?
Appendix I: Local and State Authority Over Frac Sand Operations
State of Wisconsin
Local Authority The policy debate in Wisconsin over frac sand operations has become a debate over the extent of local control of these operations.
The state legislature has a long history of supporting local control in the state. Local control generally applies primarily to cities, villages, and counties. Towns are unincorporated areas. They are more like townships in other states. However, towns can also gain zoning and other authority through processes stipulated in state statute.13 The basis of local control in Wisconsin statute is the Home Rule Amendment to the state’s constitution (Art. XI § 3(1)) adopted in 1924.
13 A Town can acquire local control in a number of ways. If the county has no zoning, the voters in a town (town electors) can pass a resolution directing the town board to adopt a town zoning ordinance. If there is zoning in a county and the town is not under county zoning, the same procedure takes place, but the town

BAR/CSI 30
Zoning The statutes providing zoning authority to cities and villages are very broad and “liberally construed in favor” (Wis. Stat. § 62.23(7)) of the city or village. Counties also have broad powers, including, such as providing “adequate light and air, including access to sunlight for solar collectors and to wind for wind energy systems” (Wis. Stat. § 50.69(1)).
Zoning has many purposes. Among the general purposes are:
1) “Protection of public health, safety and general welfare; 2) Promotion of desirable development patterns; 3) Separation of incompatible uses of land (e.g. residential vs. industrial); 4) Maintaining community character and aesthetics; 5) Protection of community resources such as farmland, woodlands, groundwater, surface
waters, historic or cultural resources; 6) Protection of public and private investments” (Center for Land Use Planning, 2007).
But local communities must first develop a comprehensive plan to outline how they want development to proceed in their jurisdiction, and zoning ordinances must conform to these plans.
Also, local government is not mandated to have zoning. The exception to this rule is the state’s mandate regarding zoning for shoreland to protect coastal areas.
The principle aim of zoning is to dictate where certain activities (like mining) can take place. There are various designations for land use in zoning. However, they break down into three basic categories. The activity or use can be permitted, conditional or nonconforming use.
Permitted uses confer a right to build homes or operate businesses in compliance with general standards.
Nonconforming uses are applied to buildings or activities that existed prior to adoption of a zoning ordinance. The local government cannot change the existing business/activity but can prohibit expansion or changes that fall outside the zoning districts standards.
Conditional uses come with standards of operation or construction. For instance, local government can place standards on the operation of frac sand operations in terms of hours of operation, location, specific size and depth (to protect groundwater), noise, traffic, road damage, etc.
Legal Constraints to Zoning Although the authority vested to local jurisdictions by the state appears expansive, there are limitations to local authority. Through zoning, local jurisdictions cannot ban mining throughout the entire jurisdiction. They can however prohibit mining in certain zones, as Pepin County did
requires county approval for its local control. If a town is under county zoning, the town must wait until the county redoes its local zoning to opt out and then apply to the county for approval of zoning powers. As of 2011, there were 246 towns out of 1,257 with no town or county zoning (outside of shoreland and mining reclamation ordinances that are mandated by state law but reflect Dept. of Natural Resources regulation) and 242 towns with local control. The rest are under county zoning ordinances.

BAR/CSI 31
along a ten-mile stretch along the Mississippi, the federally recognized and funded Great River Road (County Board of Supervisors, 2013).
Also, developers or landowners can “register” the targeted mining area with local zoning authorities as a “marketable nonmetallic (frac sand, in this instance) mineral deposit.” Local government has 60 days to object but apparently can object only on the basis of the area being off limits to mining in the zoning ordinance or that the material to be mined is unmarketable. Once successfully registered, the land is protected for mining purposes for 10 years, after such time the landowner or developer can extend the registration for another 10 years. During that time, the land cannot be developed in other ways. The registration process is designed to preserve the area registered for mining purposes only.
Another apparent challenge for local governments seeking to reign in frac sand mining operations is the legal concept of the “diminishing asset rule.” The diminishing asset rule has been recognized by the courts in Wisconsin in a number of cases. The Wisconsin Legislative Reference Bureau cites Schroeder v. Dane County Board of Adjustments (Schroeder v Dan County Board of Adjustments, 1999) as an example.
The diminishing asset rule was described in a case cited in the Shroeder decision. The court in that case (Sturgis v Winebago County Board of Adjustments, 1987) stated:
“In a quarrying business the land itself is a mineral or resource. It constitutes a diminishing asset and is consumed in the very process of use. Under such facts the ordinary concept of use, as applied in determining the existence of a nonconforming use, must yield to the realities of the business in question and the nature of its operations. We think that in cases of a diminishing asset the enterprise is "using" all that land which contains the particular asset and which constitutes an integral part of the operation, notwithstanding the fact that a particular portion may not yet be under actual excavation.” (Emphasis added)
However, the 1999 decision appears to have turned on the ambiguous nature of the county’s ordinance. It did not specify which parcels of land (among other things) would need additional “registration” in order to allow the county to prohibit further expansion of the operations, which the court recognized as a means to prohibit unbridled expansion of existing operations with contiguous areas able to be mined. As a result, the contiguous land that remained “unregistered” was able to be developed, as the court ruled that the developer’s intent initially was to mine the land outside of the then existing area of excavation.
Non-Zoning Ordinances (or Licensing or Police Power Ordinances) Additional police powers afford local government another avenue to control, restrict, or prohibit mining operations. These are referred to as non-zoning ordinances. The difference between zoning and non-zoning ordinances is that, although there may be some overlap in terms of performance standards, non-zoning ordinances do not specify where various kinds of development occur. They regulate mines, processing plants, transportation centers no matter where they are in the local government’s jurisdiction. Non-zoning ordinances require a frac sand operation to obtain a license (like a permit) to operate under certain parameters. This is a key aspect of local control, which is now under attack by the industry at Wisconsin’s state legislature.

BAR/CSI 32
The fight over state legislation to substantially curtail local control over frac sand mining began with the Town of Cooks Valley adopting a licensing ordinance to dictate the operations and approval of frac sand mining operations in the town in 2008. A suit was filed claiming that the ordinance was a zoning ordinance, which requires county approval in Wisconsin if a town is located in a county with zoning.
The case made it to the state’s supreme court. In February of 2012, the court held in Zwiefelhofer v Town of Cooks Valley (Zwiefelhold v Town of Cooks Valley, 2012) that the licensing ordinance was not a zoning ordinance because it regulated mines and ancillary operations throughout the town’s jurisdiction. It did not, argued the court, stipulate where such activity can take place (in a particular zone) in the town. Therefore, the court found that the ordinance did not require county approval and is a valid exercise in local control.
The ordinance is important because it not only establishes parameters for the conditions under which mines can operate, it provides the town with the authority to deny a permit if the:
“…development and operation of the proposed nonmetallic mine is not in the best interests of the citizens of the Town, and will not be consistent with the protection of public health, safety and general welfare. (emphasis added) In making its decision, the Town board shall consider the location of the proposed nonmetallic mine, the applicant’s proposed mining and related operations, the expected impacts of the proposed mining and mining operations on Town roads and road safety, the applicant’s experience and track record in operating other nonmetallic mines and related operations, and any other factors relating to the best interest of the citizens of the Town and the protection of public health, safety, and general welfare” (Town of Cooks Valley, 2013).
This was followed by a similar ordinance adopted by the Town of Dover in Buffalo County on February 20, 2014. This ordinance is somewhat more explicit than the Cooks Valley ordinance in that it specifically refers to furthering “the appropriate use and conservation of land and water resources.”
It enumerates the operations it wants to regulate more explicitly. Besides mining activities, these include:
“…[p]rocesses carried out at a nonmetallic mining site that is related to the preparation or processing of the mineral aggregates or nonmetallic minerals obtained from the nonmetallic mining site. These processes include, but are not limited to, stockpiling of materials, blending mineral aggregates or nonmetallic minerals with other mineral aggregates or nonmetallic minerals, blasting, grading, crushing, screening, scalping and dewatering.” (Town of Dover, 2014)

BAR/CSI 33
Legislative Threat to Local Control The adoption of these ordinances precipitated Senate Bill 632 and Assembly Bill 81614 pushed by the frac sand industry. SB 632 passed committee but languished until the end of the session. AB 816 did not move. Attorney Glenn Stoddard, who represented the Town of Cooks Valley in its landmark case, described the companion bills in a letter to the Wisconsin State Senate Committee on Workforce Development, Forestry, Mining, and Revenue and the Wisconsin State Assembly Committee on Jobs, Economy and Mining dated February 27, 2014:
“…[T]hese bills would place significant new limitations on counties and towns that would greatly reduce their ability to regulate existing and future nonmetallic mining and processing operations in order to reasonably protect public health and safety. These bills would unreasonably confer special rights on frac sand…interests…
“…[T]hese bills would ‘grandfather’ existing nonmetallic mining operations, and prohibit counties and towns from imposing any more restrictive regulations on these…operations…
“Enactment of these bills would… arguably violate… the Home Rule Amendment (of the state’s constitution)…” (Stoddard, 2014)
In reviewing the Wisconsin Legislative Reference Bureau’s analysis of the bill (Wisconsin Legislative Reference Bureau, 2014), the industry’s intentions become very clear.
First, the bill would have applied the diminishing asset rule regardless of the wording in local zoning ordinances. In other words, local government would have been able do nothing to stop mining in areas contiguous to existing mining operations. It would have extended the rule to non-zoning ordinances – in other words, to licensing ordinances designed to regulate frac sand operations and the ability of local government to deny frac sand operations on a case-by-case basis.
Secondly, it would have extended registering to non-zoning ordinances. Currently, registering land to be mined in order to prevent other development applies only to zoning ordinances.
What this means is that these bills would have preempted local government from imposing more stringent provisions on frac sand operations beyond current law – and perhaps with no time limit. The bills left zoning authority intact – but for the diminishing asset rule, which severely limits local jurisdiction over existing frac sand operations.
The industry initiative became all the more important due to the gap between local and state jurisdiction over frac sand operations. As Midwest Environmental Advocates point out, even the state (the Department of Natural Resources in particular) understands that “state agencies currently do not have regulatory authority to address a number of the impacts associated with frac sand mining, including: noise, lights, hours of operation, excessive wear to roads…, damage from blasting, aesthetics and land use changes,” (Parra, 2013) which local authorities do have at the
14 A previous industry bill, SB 349, was filed last year. The cities and towns and counties association vehemently opposed it, along with the grassroots. The towns association ultimately opposed SB 632 and AB 816.

BAR/CSI 34
moment.
Moratoria and Industry Response Another means by which local government can slow down frac sand operation development and review the situation is through moratoria. Moratoria, by law, cannot be imposed indefinitely throughout the entire local jurisdiction. The timeframe is usually one year. The rationale is that local government finds it necessary to stop expansion of or prohibit initially frac sand mining and operations to study the impacts on the community and to come up with a regulatory framework.
Apparently, three counties have imposed moratoria in Wisconsin in an effort to study and implement regulations (with varying degrees of success (see below)), including Trempealeau which is home to numerous mines.
However, the statute governing moratoria was amended in 2011 to restrict adoption of moratoria. Contrary to the past, local government must have an expert determine that frac sand operations represent an undue burden on “public facilities.” In addition, an engineer or public health professional has to find that any public health threats posed by such operations are significant enough to warrant a moratorium. The impact of this legislation on moratoria is unclear at the moment. (Apparently the legislation does not apply to counties.) (2011 Wisconsin Act 144)
Annexation as a Means to Sidestep Local Regulation A strategy employed primarily by the industry in Wisconsin is arranging for the annexation of land from a jurisdiction not friendly to frac sand mining to an adjacent jurisdiction that is. Trempealeau County imposed a moratorium to study the impacts of the many frac sand operations in its jurisdiction, which had, temporarily, blocked the development of a proposed 700-acre mining operation. However, Hi-Crush Proppants initiated the annexation process whereby the nearby cities of Independence and Whitehall annexed the property, allowing the mine to go forward (Rupnow, 2013). Also in Trempealeau County, the City of Arcadia annexed land from the Town of Arcadia to smooth the way for a frac sand mine.
The Wisconsin Legislative Council published a document describing the annexation process. (Special Committee Staff Brief, 2004) There are three ways for property to be annexed and it’s usually precipitated by residents or business. The city or village legislative body that will annex the territory must accept it with an annexation ordinance by 2/3 vote. If the property is annexed in a county with a population of 50,000 or more, the petition for annexation must be sent to the State Department of Administration for a public interest review. The local body voting on the annexation ordinance need not adhere to the DOA findings.15
15 The three approaches are: A petition for direct annexation by unanimous approval has all residents (voters and owners of real property) in the targeted territory sign a petition for annexation. The petition is filed with the city or village clerk, and with the town clerk of the territory to be annexed. There is also annexation by ½ approval, with a similar process. However, residents who did not sign can petition for a referendum. A petition for annexation by referendum requires fewer signatures. The process for each is governed by similar timeframes where filings must take place.

BAR/CSI 35
It’s also important to understand that, according to the Wisconsin Municipal Law Blog, towns in Wisconsin are barred from suing against direct unanimous annexations. (Wisconsin Municipal Law Blog, 2013)
Local Recall Process and Industry Response Finally, an option open to local citizens to hold their local officials accountable (other than elections) is to initiate a recall vote. The Glenwood Citizens for Legal and Ethical Representation collected petitions for a recall vote for elected officials, who support a 384-acre sand mine in St. Croix County, because they felt that certain officials acted unethically in promoting the mine. The effort failed (Dirr A. , 2013). However, Assembly Bill 129 passed in 2014 prohibits recall of local officials unless said officials have been charged with a crime or violation of state ethics laws. (Stadelman, 2014) Previously, recalls could have occurred for any reason.
State Authority The Wisconsin Legislative Council lists the state permits required by frac sand mines and operations in its document titled “Regulation of Sand Mining in Wisconsin” published in April of 2013. The issue, of course, is enforcement. The following is a list of state responsibilities as they relate to frac sand operations:
“Navigable waters. If a mining operation will disturb one or more navigable waters, the mine operator may need to obtain a permit under ch. 30, Stats. Wetlands. A sand mining operator who proposes to fill a wetland in Wisconsin must obtain a permit under ch. 281, Stats. If the wetland is a “federal wetland” (i.e., a wetland that is navigable and not isolated), the person must obtain a permit from the U.S. Army Corps of Engineers (ACE), and the DNR must certify that the activity will not violate the state’s water quality standards for wetlands. Water withdrawals. DNR approvals are required under ch. 281, Stats., if a sand mining operator proposes to withdrawal large quantities of surface water or groundwater, for example, for the purpose of dewatering a mining excavation. Solid waste facility. If a proposed sand mining operation includes a facility for processing solid waste, DNR approval may be required for the facility. Solid waste facilities must be located, designed, constructed, operated, monitored, and maintained in compliance with standards set
A final approach, apparently very rare, is where a city or village initiates the annexation process. This decision goes to the courts. This is referred to as annexation by court-ordered referendum. A protest petition may be filed prior to the court hearing on the annexation, which halts the process. If no protest is filed and the court finds the annexation is justified, the court orders a referendum be held in the territory to be annexed.

BAR/CSI 36
forth by the DNR under ch. 289, Stats. Wastewater and stormwater discharge. Under ch. 283, Stats., a Wisconsin Pollution Discharge Elimination System (WPDES) permit is required for any discharges into navigable waters in the state from a discernible, confined and discrete conveyance, and for proposed discharges from a facility or activity that the DNR determines either contributes to a violation of a water quality standard or is a significant contributor of pollutants to the waters of the state. A stormwater permit is also required for construction projects that disturb at least an acre of land. [s. NR 216.42, Wis. Adm. Code.] Air pollution. An air pollution control permit is required under ch. 285, Stats., for the construction and operation of a facility, building, structure, or installation that directly or indirectly emits or may emit air contaminants from a fixed location.
Endangered species. Under ch. 29.604, Stats., a permit is required if a project has the potential to result in injury, damage, death, or removal from the wild of any animals listed on the state endangered and threatened species list. In addition, a permit from or consultation with the U.S. Fish and Wildlife Service may be required under SECTION 7 of the federal Endangered Species Act if the project may have an impact on endangered species.
Mine safety. A sand mine operator may be required to obtain approval of a miner training plan from the federal Mine Safety and Health Administration. [30 C.F.R. s. 46.]
Eagles and migratory birds. If a sand mining operation requires the removal or relocation of eagles or certain migratory birds, or the nests of such birds, the mine operator may need to obtain a permit from the U.S. Fish and Wildlife Service. [50 C.F.R. ss. 21 and 22.]
Hazardous materials. If hazardous waste will be transported as part of a mining operation, an applicant for a mining permit may be required to obtain a hazardous materials registration number from the U.S. Department of Transportation. [49 C.F.R. ss. 107.601-107.620.]” (Information Memorandum, 2013)
Compliance Issues Compliance appears to be a problem at these sites. In 2013, the Wisconsin Center for Investigative Journalism surveyed the industry and tracked its environmental compliance issues regulated by the state’s Department of Natural Resources. (Prengaman, 2013)
The organization found that almost 20% of the 70 active mines in Wisconsin in 2012 had violations. By 2013, the state had over 100 mines. One enforcement official said he sent letter of violations to 80 to 90% of the sites he visited for air violations. There were also two significant instances of leaks from holding ponds into rivers. Most of the public complaints involved silica dust exposure. But only a few serious air quality violations were issued, according to the Center. This may be due to the fact that the state does not require monitoring of the smallest dust particles (2.5 microns) that cause the most harm to human health.
Insufficient Standards, Enforcement, and Funding According to the Wisconsin League of Conservation Voters, there are no water standards “for some of the chemicals used in sand mining.” The League implies that polyacrylamides (flocculants used to remove unwanted minerals from the sand and which can degrade to the neurotoxin and carcinogen acrylamide) are not regulated by the state.

BAR/CSI 37
Although DNR regulates large volumes of water withdrawals, according to the League, it has found at least one company “operating two high-capacity wells without state permits.”
Part of the problem is the quick expansion of the industry over a short period of time, which strained DNR resources. Another could be the influence of the industry as witnessed by its ability to tee up legislation detrimental to local control and/or ignorance by some of the companies.
The League reports that the DNR also rejected a citizen petition16 to regulate small dust particles (crystalline silica or PM4), which are known to cause silicosis among mining-related occupations. The agency cited lack of staff and expense of monitoring as reasons for rejecting the petition. The agency also referred to a lack of an “accepted method to measure offsite exposure.” They rejected data presented by a University of Wisconsin researcher due to the short-term nature of the monitoring.17
The governor did propose funding for additional staff to oversee these operations. But level of enforcement remains the discretion of an administration, no matter who is in power.
State of Minnesota
Local Authority Minnesota lends planning and zoning authority to counties under Chapter 394 and for cities and townships under Chapter 462 of the Minnesota statutes (Rhees, 2013). As such, they have authority to impose restrictions on where mining and processing operations are located, the extent of these operations, and how many are allowed in their jurisdictions.
Bluffland Protection Ordinances Local government got a jump on the frac sand industry far before the emergence of the fracking industry in the mid- to late-2000s. Beginning in the 1990s, the state’s Department of Natural Resources funded the “Bluffland Landscape Coordinator” position in order to assist local governments with drafting Bluffland Protection Ordinances (Minnesota Environmental Quality Board, 2014). The focus of the effort was southeastern Minnesota where the unique topographical features are prominent.
One such example is Wabasha County’s bluffland protection language found in Article 14 of its zoning ordinance. In it the county sets out its reasoning to protect its blufflands, which emphasizes the “historic, environmental and economic values of the bluffs.” It then stipulates that any mining activity within 300 feet of a bluff must have a conditional use permit (Wabasha County). Goodhue County has similar provisions (Goodhue County, 2013).
Local Zoning Ordinances Conditional use permits set standards for the operation of frac sand facilities. Cities, townships, and counties can set the parameters for these operations. They can stipulate hours of operations, size and number of facilities, volume of truck traffic and road maintenance, setbacks from other
16 The citizens demanded that the state: 1) list crystalline silica as a hazardous air pollutant; 2) require monitoring for crystalline silica; 3) establish a standard for crystalline silica of 3 microns per cubic meter. (Phone conversation with Ken Schmitt, June 3, 2014.) 17 It would also appear that legislation passed in 2003 (Act 118) makes it very difficult to list additional hazardous substances under the air toxics rule at NR 445.14(3) and NR 445.13(1).

BAR/CSI 38
property, wells and streams, lighting, air and water monitoring, etc., conforming to any state standards that have been adopted. After gathering information from the developer through a permit approval process, local units of government may approve or deny the permit.
Fillmore County serves as a notable example. The Fillmore County ordinance (Fillmore County, 2012) reflects local government’s concern for its water resources, the aesthetic value of the region, the preservation of other uses (in this case agriculture), and the need to reduce social conflict. The purpose statement reads as follows:
“The purpose of this section on excavation and mining is to (i) protect natural landscapes from excessive excavation and mining activity, (ii) protect water resources, aquifers, streams, and rivers from excessive contamination and appropriation, (iii) minimize soil erosion, (iv) protect agricultural land and farming activity, (v) monitor and control the extraction and mining of industrial minerals and metals, and (vi) minimize land use conflicts” (Section 736.01).
The ordinance then delineates those activities that are prohibited. Among those is flocculent use (normally polyacrylamide, which breaks down into acrylamide, a substance considered to be a neurological toxin and a carcinogen) at mining sites. It also bans processing of frac sand in the county.18
The Fillmore ordinance on mining then limits the size of mines to 50 acres and stipulates that no more than five mines can be operating in the county at any one time, meaning the site of an operating mine must be fully reclaimed before another mine can be opened (Section 736.07).
Furthermore, the ordinance provides for a setback of 1,000 feet from any dwelling (unless otherwise agreed to by an owner) (Section 736.07). It also restricts the depth of mining to be no closer than 10 feet from an existing groundwater aquifer and stipulates that a mine cannot reduce level of surface water within two miles (Section 736.10). Developers must also enter into a road maintenance agreement with the county (Section 736.11).
Moratoria A number of Minnesota counties adopted moratoria on frac sand mines. These included Goodhue, Wabasha, Houston, and Fillmore (Dustman, 2012). Winona County’s moratorium expired in May 2012. Goodhue’s, Fillmore’s, and Wabasha’s expired last year and these counties adopted ordinances. Houston County extended its moratorium, per state statute, into 2015.
The idea of a moratorium on frac sand operations is to allow the county to study the impacts and come up with ordinances to regulate and restrict these operations to certain areas. These were initially allowed by the state for one year, with one extension.
In 2013, the state legislature added to statute that local moratoria could be extended to
18 Section 736.01(4): The washing or application of any chemicals or flocculants to excavated or mined industrial minerals or metals at the mining site is prohibited. Mining operators will be entitled to dry screen and sort industrial minerals or metals at the mining site, but must transport all excavated, mined, and/or screened industrial minerals or metals to sites outside of Fillmore County for further processing or washing.

BAR/CSI 39
December 2015 regardless of how long they had been in place (MN EQB, 2014).
Houston County took advantage of this. The county went so far as to seek guidance from the state Environmental Quality Board as to the legal potential for banning frac sand operations altogether in the county. In the interim, the Houston County Board formed a committee, per the advice of county counsel, to begin the process of ordinance drafting if the state should find that a ban is not a legal option for the county (Bailkowski, 2014). However, the county land-use attorney advised that such a ban would not withstand legal scrutiny and the county recently approved a conditional use permit for a mine. (Moorehead, 2014)
Legal Wrangling In March of 2013, the City of Wabasha imposed two moratoria on frac sand operations. The first prohibits new frac sand operations and the second limits truck traffic on the city’s west side (Commerce & Finance, 2013). In response, the impacted trucking firm, Jim Roemer Transport, LLC, filed suit in federal court claiming that the city is limiting an existing operation, seeking a ruling that the Interstate Commerce Commission Act preempts city action (ABC News, 2013). A letter to the judge sent in January indicates that the parties are attempting to enter into a settlement (Lightfoot, 2014).
In May 2013, a group of citizens filed suit before the Minnesota court of appeals against the Winona County Board’s decision to approve the 20-acre Nisbit frac sand mine that, as of November 2013, was up and running. The citizens contend that the County should have required a full-blown environmental impact statement (EIS) instead of the less-intensive environmental assessment worksheet (EAW), citing inadequacies in the approved EAW by the Minnesota DNR and the recommendations by the Minnesota Department of Health and Pollution Control Agency to mandate an EIS (Rodriquez, 2013).
Local Control and the State Legislature Local control advocates flagged two bills in 2012 that threatened local control – Senate File 270 and House File 389. Critical to local control, the bills would have prohibited adoption of in interim ordinance to regulate a mine once a mining permit had been submitted (Martin, 2012).
The legislative history indicates that HF 389 was the only one of the two to survive during the course of the session and that it failed to pass in April 2012 (Minnesota State Legislature, 2012).
There is no indication of a recent, similar effort by the state legislature to curtail local control.
State Authority
Agencies Involved The three principal agencies involved in the regulation of frac sand mining in Minnesota are: 1) the Environmental Quality Board; 2) the Pollution Control Agency; and, 3) the Department of Natural Resources.
The Environmental Quality Board is the coordinating body for environmental protection and natural resources in the state (see footnote 1). The Pollution Control Agency regulates air and water quality and establishes regulations for noise levels. The Department of Natural Resources administers the state’s wetlands and wildlife action plan, which identifies species of “Greatest Conservation Need” ((MN EQB, 2014) & (Minnesota Environmental Quality

BAR/CSI 40
Board, 2013)).
Water Withdrawal Law The Minnesota DNR also administers the “Water Permit Appropriation Program” that regulates the withdrawals for surface and groundwater. The intent of the statue is to “ensure an adequate supply to meet long-range seasonal requirements for domestic, agricultural, fish and wildlife, recreational, power, navigation, and quality control purposes” (EQB, 2013). Under this program, the state legislature listed users:
“1. Domestic water supply
2. Consumptive use less than 10,000 gallons of water per day
3. Agricultural irrigation and processing
4. Power production
5. Other consumptive uses in excess of 10,000 gallons per day, and
6. Nonessential uses” (EQB, 2014).
As frac sand mines can consume in excess of 4,000 gallons per minute, they would appear primarily under number 5, being of lesser priority than domestic or ag uses of water.
Guidance to Local Government Given the rising concern regarding the impacts of frac sand mining operations, the state legislature enacted what was to become Chapter 116C of the Minnesota statutes in May of 2013 (EQB, 2014). The statute directs the:
1) EQB to draft recommendations for local government, which became the March 2014 document. The EQB makes recommendations for water quality and quantity and air monitoring, road maintenance and traffic volume, setbacks and buffers, and operational suggestions relative to site reclamation, financial assurance for reclamation and other costs, hours of operation, blasting, what information should be requested of developers, etc.;
2) EQB to make determinations with respect to environmental review (when EIS or EAW is required) for frac sand operations;
3) Pollution Control Agency to adopt particulate (dust) standards for frac sand operations; and,
4) DNR to adopt new reclamation regulations (EQB, 2014).
The air and review are still in process. The reclamation standards have been adopted.
Chapter 116C also:
1) Mandates a public meeting of the “Technical Assistance Team” 19 when local government assistance is requested for a specific proposal to site mines or other facilities.
19 The Technical Assistance Team consists of the DNR, PCA, Department of Health, the Board of Water and Soil Resources, and the Department of Transportation.

BAR/CSI 41
2) Prohibits frac sand mines one mile of a designated trout stream20, unless a permit is acquired from DNR (Minnesota Department of Natural Resources, 2014). This is being done to ensure that water tables are not disturbed which recharge trout streams, a key tourist and water quality concern for the state.
3) Establishes a threshold of triggering an EIS from 40 acres to 20 acres for two years to allow for the EQB to update its environmental review standards (Land Stewardship Project, 2013).
20 There are 700 miles of designated trout streams located primarily in the southeastern portion of the state – the Bluffland region.

BAR/CSI 42
Appendix II: Local Economic Analyses to Conduct Prior to Frac Sand Operation Approvals Any town considering a frac sand mining operation should take at least the following minimum steps prior to moving forward with a decision and especially before signing any contract agreements:
• Consider having an independent economic assessment conducted by a neutral party that will evaluate the claims for local profits and costs.
o Preferably have the assessment also look at other already operating mines in the same or adjoining states to look for proven positive/negative economic benefits.
• Assess what the potential topography, water drainage, and other similar physical attribute changes to the land mean for local business, tourism, and property values.
• Spend time assessing the potential drop in property values for residences and businesses near proposed mining sites.
o Equitable home buy out agreements should be built into the city or township contract stipulating that all homes within a certain distance of the mine, processing, and main transport facilities must be given buy-out options by the mining firm.
§ This will help prevent a firm from buying out owners on an individual basis and leaving some owners trapped next to a mining site without ever having being offered a buy-out, since their property is not counted as part of the mine site.
• Assess what the tax revenue implications are for bought-out properties or for falling property values near the mining, processing, and transport sites.
• Assess if local existing businesses will be negatively impacted by road noise, vibration, and congestion from sand transport. Likewise determine if local agriculture, tourism, or senior/child health may be affected by frac sand dust if it migrates further than expected from the mining site.
• Assess the costs for infrastructure replacement, especially for roads, on a highly accelerated schedule with what the worst case costs may be and factor them into contract negotiations.
• Consider hiring an independent legal team that is experienced in negotiating with multi-national firms to advise or conduct any resulting contract negotiations if a town or township moves ahead with a frac sand mine decision.
• Towns should also discuss what the loss of local character means in the event a frac sand mine permanently alters the local topography and environmental condition for the area and its residents.
• Assess how the town will deal with the flickering effect if the mine temporarily shuts down due to commodity price fluctuations. Likewise how will the town accommodate migrating workers for housing, extra policing, etc.
• Does the town or area have adequate health providers in the event asthma or other breathing conditions increase after the mine opens? Do local residents have the funds to pay for increased medical services?
This is just a partial listing but helps provide local decision makers with food for thought for the areas that need to be considered prior to accepting a frac sand mine in their area. Frac sand mining is not as cut and dried as it is typically sold to local towns and there are many ways for a small community to get into trouble unless they are armed with knowledge of the potential negative economic impacts ahead of time.

BAR/CSI 43
Bibliography 2011 Wisconsin Act 144. (n.d.).
ABC News. (2013, July 2). Wabasha frac hauling dispute leads to federal lawsuit. Retrieved from http://www.kaaltv.com/article/stories/s3086176.shtml
Associated Press and LaCrosse Tribune. (2014, July 8). Oil trains moving frequently through Wisconsin. Retrieved July 8, 2014, from Wisconsin State Journal: host.madison.com/news/local/oil-‐trains-‐moving-‐frequently-‐through-‐wisconsin/article_917571aa-‐38e0-‐597e-‐a94c-‐0cbae374f86f.html
Bailkowski, E. (2014, February 11). New attention needed on frac sand ordinance, attorney says. Caledonia Argus .
Bi, F. (2013, May 1). Mapped: more than 20 proposed frac sand facilities. Retrieved March 2014, from Minnesota Public Radio: http://minnesota.publicradio.org/collections/frac_sand/frac_map/
Blackman, F. (2011, April 10). The WMEAC Blog. Retrieved March 2014, from http://thewmeacblog.org/2011/01/04/one-‐of-‐michigans-‐oldest-‐industries-‐sand-‐dune-‐mining/.
C4SE. (2009). The Potential Financial Impacts of the Proposed Rockford Quarry. The Center for Spatial Economics.
Cantarow, E. (2012, May 21). Farmer's Frac Sand Nightmare. Retrieved from Salon: http://www.salon.com/2012/05/21/farmers_sand_frac_nightmare/
Center for Land Use Planning. (2007, January). ftp.gov wisconsin. Retrieved March 2014, from Depatment of Administration: ftp://ftp.wi.gov/DOA/public/comprehensive/ImplementationTookkit/Documents/OverlayZoning.pdf
Chadwick, S. (2012, September 20). The Cost of Fracking and Frac Sand Mining. Retrieved from Environment Minnesota: http://www.environmentminnesota.org/news/mne/cost-‐fracking-‐and-‐frac-‐sand-‐mining
Commerce & Finance. (2013, March 3). Wabasha approves frack sand moratorium. (AP) Retrieved from http://finance-‐commerce.com/2013/03/wabasha-‐approves-‐frac-‐sand-‐moratorium/
County Board of Supervisors. (2013, June 27). Pepin County Code of Ordinances. An Ordiance to Create Chapter 28 -‐ Great River Road Preservation Zoning Code . Pepin County, Wisconsin.
BAR/CSI 44
Daughton, C. G. (1988). QUANTITATION OF ACRYLAMIDE (and Polyacrylamide):Critical review of methods for trace determination/formulation analysis & Future-‐research recommendations. Berkeley, CA: The California Public Health Foundation.
Deller, S. C., & Schreiber, A. (2012). Frac Sand Mining and Community Economic Development. University of Wisconsin-‐Madison; Dept of Agricultural and Applied Economics.
Dirr, A. (2013, November 17). City's frac sand mine battle spurs recalls issues divides small community in northwestern wisconsin. (W. C. Journalism, Producer) Retrieved from Wisconsin Watch: http://wisconsinwatch.org/2013/11/17/citys-‐frac-‐sand-‐mine-‐battle-‐spurs-‐recalls/
Dirr, A. (2013, October 7). Frac-‐sand health fears rise as mining booms in Wisconsin. Retrieved from MinnPost: http://www.minnpost.com/environment/2013/10/frac-‐sand-‐health-‐fears-‐rise-‐mining-‐booms-‐wisconsin
Dustman, J. (2012, October 31). Industrial Silica Sand FAQs. Retrieved 2014 March, from http://www.dnr.state.mn.us/lands_minerals/silicasand/faq.html#3
Fillmore County. (2012, November 27). Fillmore County Zoning Ordinance. Minnesota.
Goodhue County. (2013, December). Article 12 Bluff Land Protection. Goodhue County Zoning Ordinance . Minnesota .
Hart, M. V., Adams, T., & Schwartz, A. (2013). Draft: Transporation Impacts of Frac Sand Mining in the MAFC Region: Chippewa County Case Study. University of Wisconsin-‐madison.
Information Memorandum. (2013). Regulatoin of frac sand mining. Wisconsin Legislative Council.
Jim Roemer Transport, LLC st al v. City of Wabasha, 13-‐CV-‐01706-‐ADM-‐TNL (United States District Court January 15, 2014).
Korfmacher, K. S., Jones, W. A., Malone, S. L., & Vinci, L. F. (2013). Public Health and High Volume Hydraulic Fracking. New Solutions , vol 23, 13-‐31.
Land Stewardship Project. (2013, May 24). Wrap-‐up & action to take on MN state legislation to control corporate frac sand interests. Retrieved from http://landstewardshipproject.org/posts/446
Martin, P. (2012, February 16). Townships updated on frac sand mining. The Cannon Ball Beacon .
Midwest Environmental Advocates. (2014, September). Petition for a Strategic Analysis of Frac Sand Mining . Retrieved September 15, 2014

BAR/CSI 45
Miller, S., Aasen, J., Larson, D., Rhoda, S., Winey, P., Custer, C., et al. (2014, September 8). Final report on the public health impacts of non-‐metallic industrial sand mining in trempelaeau county. Retrieved September 22, 2014, from Trempealeau County: www.tremplocounty.com/landmanagement/nmm/documents/PublicHealthImpactsofNMISMinTrempealeauCounty.pdf
Minnesota Department of Natural Resources. (2014, January 4). Silica sand mining trout stream setback permit: MN statutes, section 103G.217. Retrieved from http://files.dnr.state.mn.us/lands_minerals/silicasand/silicasand_troutstream-‐setback-‐factsheet.pdf
Minnesota Environmental Quality Board. (2013). Report on silica mining: final report. Saint Paul: State of Minnesota.
Minnesota Environmental Quality Board. (2014). Tools to assist local governments in planning for and regulating silica sand projects. Saint Paul: State of Minnesota.
Minnesota State Legislature. (2012, April 3). HF 389 Status in the House for the 87th Legislature. Retrieved March 2014, from https://www.revisor.mn.gov/bills/bill.php?b=House&f=HF0389&ssn=0&y=2011
MnDOT. (2013). Silica (Frac) Sand Mining and Processing: Issues Involved in Transportation . Minnesota Department of Transportation.
Moorehead, C. (2014, July 2). Houston county sand mine to reopen. Retrieved September 23, 2014, from LaCrosse Tribune: lacrossetribune.com/houstonconews/news/local/houston-‐county-‐sand-‐mine-‐to-‐reopen/article_5d34013b/-‐cdc-‐5fd4-‐8615-‐bf4d7754b9d8.html
Parker, D., & Phaneuf, D. (2013, May). The potential impacts of frac sand transport and mining on tourism and property values in lake pepin communities. Retrieved July 1, 2014, from sandpointtimes.com/pdf/Frac-‐Sand-‐Impacts-‐Property-‐Values.pdf
Parra, J. (2013, October 24). MEA Testimony on SB 349. Before the Senate Committee on Workforce Development, Forestry, Mining and Revenue . Wisconsin: Midwest Environmental Advocates.
Parsen, M. (2012). Impacts of frac sand minining...Focus on groundwater. Madison, WI: Wisconsin Geological and Natural History Survey.
Plume, K. (2014, May 14). Trains for grains scarce on the US plains. Retrieved July 8, 2014, from Rueters: reuters.com/article/2014/05/14/us-‐usa-‐farms-‐railroads-‐analysis-‐idUSBREA4D0QE20140514
Power, M., & Power, D. (2013, May 30). The economic benefits of costs of frac-‐sand mining in west central wisconsin: phase one of study -‐ general economic and community overview. Retrieved July 1, 2014, from Institute for Agriculture and Trade Policy: iatp.org/files/2013_05_30/FracSandMining_f.pdf
BAR/CSI 46
Power, T. M., & Power, D. S. (2013). The Economic Benefits and Costs of frac-‐sand mining in west central wisconsin. Power Consulting Inc.
Prengaman, K. (2013, March 3). Frac sand industry faces dnr violations, warnings. (W. C. Journalism, Producer) Retrieved from Wisconsin Watch: http://wisconsinwatch.org/2013/03/03/frac-‐sand-‐dnr-‐violations/
Quorum Call. (2013, November 14). Assembly passes local recall changes. Retrieved March 2014, from Wisconsin Politics: http://quorumcall.wispoitics.com/2013/11/assembly-‐passes-‐local-‐recall-‐changes.html
Railpage. (2014, April 18). Retrieved July 8, 2014, from railpage.com.au/f-‐p1916891.htm
Rhees, S. (2013). Minnesota's planning and zoning enabling laws: analysis and options for reform. American Planning Assoication -‐ Minnesota. Legislative Oversight Committee.
Rodriquez, T. (2013, November 8). Residents file appeal on Nisbit mine ruling. Winona Daily News .
Rumbach, A. (2011). Natural Gas Drilling in the Marcellus Shale: Potential Impacts on the Tourism Economy of the Southern Tier. Cornell University.
Rupnow, C. (2013, June 11). Wisconsin council approves annexations for sand mining plans. Retrieved March 2014, from twincities.com: http://twincities.com/localnews/ci_24465785/wisconsin-‐council-‐approves-‐annexations-‐sand-‐mining-‐plans
Scanimetrics. (2014 йил February). Scanimetrics. Retrieved 2014 йил 18-‐March from http://www.scanimetrics.com/condition-‐monitoring-‐news/14-‐equipment-‐monitoring/82038-‐study-‐examines-‐reclaiming-‐of-‐vacated-‐wisconsin-‐mines
Schroeder v Dan County Board of Adjustments, 228 Wis. 2d 324 (Ct. Apps 1999) (1999).
Sider, A. (2014, August 4). Demand for sand takes off thanks to fracking. Retrieved August 14, 2014, from Wall Street Journal: http://online.wsj.com/articles/demand-‐for-‐sand-‐takes-‐off-‐thanks-‐to-‐fracking-‐14719760
Special Committee Staff Brief. (2004). Municipal Annexation. Wisconsin Legislative Council.
Spring Grove Herald. (2012, May 15). Spring Grove Herald -‐ Letters to the Editor. Retrieved from The Spring Grove Herald: http://www.hometown-‐pages.com/main.asp?SectionID=26&SubSectionID=185&ArticleID=43407
Stadelman, R. J. (2014, May 6). Legislative Update as of May 6, 2014. Retrieved July 11, 2014, from Wisconsin Towns Association: wisctowns.com/uploads/ckfiles/files/Legislative%20Update%20as%20of%20May%206,%202014%20with%20Final%20Act%20numbers(1).pdf

BAR/CSI 47
Stoddard, G. (2014, February 27). Opposition to SB 632 & AB 816. Letter to the Wisconsin State Senate Committee on Workforce Development, Forestry, Mining, and Revenue and the Wisconsin State Assembly Committee on Jobs, Economy and Mining .
Sturgis v Winebago County Board of Adjustments, 141 Wis. 2d 149, 413 N.W. 2d 642 (Ct. App.) (1987).
Town of Cooks Valley. (2013, February 2013). Nonmetallic Mining Ordinance. Chippewa, County, Wisconsin.
Town of Dover. (2014, February 20). Nonmetallic Mining Ordinance. Buffalo County, Wisconsin.
Wabasha County. (n.d.). Article 4 Bluffland Area Protection. Wabasha County Zoning Ordinance . Minnesota.
Weinstein, A. L., & Partridge, M. D. (2011). The Economic Value of Shale Natural Gas in Ohio. Swank Program in Rural-‐Urban Policy Summary and Report.
Wisconsin Department of Natural Resources. (2014, August). 2013 Wisconsin Water Withdrawal Report . Madison, Wisconsin.
Wisconsin Dept of Natural Resources. (January 2012). Silica Sand Mining Wisconsin. Madison, WI.
Wisconsin Legislative Reference Bureau. (2014, Februrary 26). 2013 Senate Bill 632. Analysis by the Wisconsin Legislative Reference Bureau .
Wisconsin Municipal Law Blog. (2013, October 3). Annexation challenge denied for lack of standing. Retrieved March 2014, from http://wisconsinmunicipallaw.com/?=390
Zwiefelhold v Town of Cooks Valley (WI 7 2012).

BAR/CSI 48
Photo Courtesy of Ric Zarwell, Allamakee County (Iowa) Protectors