Embed Size (px)
Citation preview

Designing A Clean EnergyFuture: A Resource ManualDeveloped for the Clean Energy Resource Teams
The Minnesota Project
University of Minnesota’s Regional Sustainable Development Partnerships
Minnesota Department of Commerce
July 2003
CO
MM
UN
ITIE
S A
ND
LO
CA
L E
NE
RG
Y

The manual is available in electronic format on the following web sites:
The Minnesota Project
www.mnproject.org
University of Minnesota’s Regional Sustainable Development Partnerships
www.regionalpartnerships.umn.edu
Minnesota Department of Commerce Energy Information Center
www.commerce.state.mn.us
Additional copies may be ordered from:
Minnesota Department of Commerce Energy Information Center
800-657-3710
651-296-5175
C O V E R P H O T O G R A P H S
(clockwise, from top left)
Dean Schmidt/WesMinRC&D; NationalRenewable EnergyLaboratory; MelissaPawlisch/The MinnesotaProject; Lisa Daniels/Windustry; Digital Stock;Bruce Anderson/RENewNorthfield; MelissaPawlisch/The MinnesotaProject; Amanda Bilek/TheMinnesota Project
Designing A Clean Energy Future: A Resource ManualDeveloped for the Clean Energy Resource Teams
M E L I S S A PAW L I S C H
C A R L N E L S O N
L O L A S C H O E N R I C H
The Minnesota Project
University of Minnesota’s Regional Sustainable Development Partnerships
Minnesota Department of Commerce
July 2003
CO
MM
UN
ITIE
S A
ND
LO
CA
L E
NE
RG
Y

i i Clean Energy Resource Teams Manual
A B O U T T H I S R E P O R T
This report was a collaborative project of The Minnesota Project, the University of Minnesota’s
Regional Sustainable Development Partnerships, and the Minnesota Department of Commerce.
Melissa Pawlisch is a graduate of the Humphrey Institute of Public Affairs of the University of
Minnesota. She worked on the report through a fellowship from the University of Minnesota’s
Regional Sustainable Development Partnerships and the Community Assistantship Project. Carl
Nelson is a Program Manager and Lola Schoenrich is Senior Program Director at the Minnesota
Project.
The Minnesota Project is a nonprofit organization dedicated to sustainable development and
environmental protection in rural Minnesota. Since 1979, The Minnesota Project has worked to
promote healthy rural communities through building broad-based coalitions, facilitating
statewide, regional, and national networks, and connecting communities to resources and policy
forums. Current program areas are renewable energy development, sustainable agriculture, water
protection, and community sustainability.
The University of Minnesota’s Regional Sustainable Development Partnerships bring together
communities and University faculty and students to foster sustainable development in five rural
regions. In collaboration with the University, citizens in these communities work through regional
boards to develop innovative programs and projects that strengthen natural resources, agricul-
ture, and tourism. Local energy and local foods are two areas of focus across regions. The Regional
Partnerships program is a joint effort of University’s Extension Service; the College of Agricultural,
Food and Environmental Sciences; and the College of Natural Resources.
Graphic design was provided by Susan Reed Design. Printed on recycled paper.

Clean Energy Resource Teams Manual i i i
A C K N O W L E D G M E N T S
Many thanks to all of the Regional Advisory Committee Members and Technical Committee
Members for the time and effort they put into guiding the process of assembling this workbook,
providing their insights into the many renewable energy opportunities available in Minnesota,
and reviewing draft after draft of the text.
In addition, a special thank you to all of the case study contacts who shared the stories of their
communities and took special time to review them. These case studies give readers a real sense of
the important work already underway in Minnesota.
Funding was provided by the University of Minnesota’s Regional Sustainable Development
Partnerships, with the assistance of the Community Assistantship Program, Minnesota
Department of Commerce, The Energy Foundation, The Surdna Foundation, The W. Alton Jones
Foundation, and The Unity Avenue Foundation.
Regional Advisory Committee Members
Sigurd Anderson, Experiment in Rural Cooperation(Southeast Regional Sustainable DevelopmentPartnership)
David Benson, South West Regional DevelopmentCommission
Dick Broeker, Experiment in Rural Cooperation(Southeast Regional Sustainable DevelopmentPartnership)
Greg Cuomo, West Central Research and OutreachCenter
Jon Hunter, Hennepin County – Metro CountiesEnergy Task Force
Linda Kingery, Northwest Regional SustainableDevelopment Partnership
Carl Michaud, Hennepin County – Metro CountiesEnergy Task Force
Mary Page, Statewide Coordinating Committee Chair,Regional Sustainable Development Partnerships
Cynthia Pansing, Statewide Coordinator, RegionalSustainable Development Partnerships
Mike Reese, West Central Research and OutreachCenter
Sharon Rezac Andersen, Central Regional SustainableDevelopment Partnership
Dorothy Rosemeier, West Central RegionalSustainable Development Partnership
Monica Siems, Former Statewide Coordinator,Regional Sustainable Development Partnerships
Janet Streff, Minnesota Department of Commerce
Okey Ukaga, Northeast Regional SustainableDevelopment Partnership
Technical Committee Members
Rory Artig, Minnesota Department of Commerce
Jim Boerboom, Minnesota Department of Agriculture
Paul Burns, Minnesota Department of Agriculture
Keith Butcher, Center for Energy and Environment
Bob Cupit, Minnesota Department of Commerce
John Dunlop, American Wind Energy Association
Betsy Engleking, Great River Energy
J. Drake Hamilton, Minnesotans for an Energy-Efficient Economy
Paul Imbertson, University of Minnesota Departmentof Engineering
Matt Schuerger, Independent Consultant
Mike Taylor, Minnesota Department of Commerce
Doug Tiffany, University of Minnesota Department ofApplied Economics
Clean Energy Resource Teams and Contact Information viii
1 I N T R O D U C T I O N 1
What is Community Energy? 1
Why Renewable Energy? 1
Getting Started 3
2 C R E AT I N G A C O M M U N I T Y E N E R G Y V I S I O N 5
Purposes of Community Energy Planning 5
Stakeholders 6
Steps in the Community Energy Planning Process 7
Resources 14
3 I M P R O V I N G E N E R G Y E F F I C I E N C Y 15
The Enormous Potential of Energy Efficiency 15
Implementing Energy Efficiency 16
Barriers to Energy Efficiency 18
Policies and Programs to Encourage Energy Efficiency 18
Resources 20
4 W I N D 21
Wind Basics 21
Farmer owned Wind 22
Assessing Wind Potential 22
Wind Project Costs 27
Other Project Elements 27
Resources 30
5 H Y D R O E L E C T R I C 31
Hydropower Basics 31
Current Technology Status 33
Environmental and Social Concerns 33
Resources 36
6 B I O M A S S 37
Sources of Biomass 37
Converting Biomass to Electricity 38
Environmental Considerations 41
Economic Viability of Biomass 42
Resources 44
7 B I O G A S D I G E S T E R S 45
Anaerobic Digester Basics 45
Environmental Benefits and Concerns 45
Will a Digester Work for My Farm? 47
Other Types of Anaerobic Digesters 49
Resources 52
Contents
P U R P O S E O F T H E
W O R K B O O K
This workbook was
written for use by
the Clean Energy
Resource Teams and
focuses on
opportunities for
communities to
engage in energy
planning regarding
renewable and
community energy
projects. It is our
hope that the
workbook will be
useful to a wide
range of communities
and a broad spectrum
of audiences
including local
government officials,
local utilities,
businesses, farmers,
community leaders,
and individuals.
The focus of the
workbook is to:
• Provide quick
reference material
that details
potential energy
alternatives and
the nuts-and-bolts
of implementation
• Provide detailed
case studies that
illustrate how
similar projects have
previously been
done in Minnesota
• Provide
bibliographical
references for
further resources
and lists of contacts

8 B I O F U E L S 53
Ethanol: A Minnesota Success Story 53
Biodiesel Basics 54
biodiesel and the Environment 56
Biodiesel in Minnesota 58
Resources 60
9 S O L A R E N E R G Y 61
Photovoltaic Power 61
Solar Hot Water Systems 64
Passive Solar Design 64
Resources 66
1 0 C O M B I N E D H E AT A N D P O W E R ( C H P ) / D I S T R I C T E N E R G Y 67
CHP and District Energy Basics 67
How to Determine if a CHP System is Appropriate 69
CHP in the Industrial Sector 69
CHP in the Commercial and Institutional Sectors 70
CHP and District Heating 72
Resources 74
1 1 F U E L C E L L S A N D M I C R O T U R B I N E S 75
Fuel Cells 75
Hydrogen Fuel 77
Microturbines: On Site Generation 78
Resources 80
1 2 D E V E L O P I N G A P R O J E C T 81
Feasibility Study 81
Ownership 83
Environmental Assessment 85
Permitting 85
Connecting to the Grid 86
Financing 87
Resources 90
1 3 T O W N S O F T O M O R R O W – V I S I O N F O R T H E F U T U R E 91
Small Changes Add Up 91
Efficiency for the Future 92
Winds of Tomorrow 93
Hydrogen: The Coming Revolution 93
A P P E N D I X 95
A – Comparison of Costs for Selected Energy Technologies 96
B – Financial Assistance Programs for Renewable Energy Projects 97
The manual is available in
electronic format on the
following web sites:
The Minnesota Project
www.mnproject.org
University of Minnesota’s
Regional Sustainable
Development Partnerships
www.regionalpartnerships.
umn.edu
Minnesota Department of
Commerce Energy
Information Center
www.commerce.state.mn.
us
Additional copies may be
ordered from:
Minnesota Department
of Commerce Energy
Information Center
800-657-3710
651-296-5175
Clean Energy Resource Teams Manual C O N T E N T S v

N O R T H W E S T
Moorhead’s Capture the Wind Success Story 24
N O R T H E A S T
Duluth and the International Council for Local Environmental 10Initiatives: Local Climate Change Targets
Western Lake Superior Sanitary District 51
Voyageurs National Park Biodiesel Program 57
Virginia Department of Public Utilities: 73
Combined Heat and Power at a Local Utility
C E N T R A L
Park Rapids: A Study of Options to Retrofit a Former Structure 34
Haubenschild Farms: Making Electricity on the Farm 46
Perham Community Digester 48
W E S T C E N T R A LWest Central Research and Outreach Center: 11Developing a Renewable Energy Center in Morris
Lac Qui Parle Valley School: Wind and Schools Combine 25
Minnesota Wood Energy Scale-Up Project 39
Willmar Municipal Utilities Combined Heat and Power District 71Heating System
M E T R O
Phillips Community Energy Cooperative 8Consumers Control of Energy Use
Chisago County: A Community Energy Management Plan 12
Crown Hydro: Renewable Energy for Metro Markets 35
Rahr Malting 40
Brooklyn Park 55
Hennepin County Solar Traffic Signal 63
Wild River State Park: Active Solar Thermal Water Heater 65
District Energy St. Paul: 68Combined Heat and Power District Energy Fueled by Biomass
Urban Biomass Plant Preliminary Feasibility Study 82
Metro Counties Energy Task Force 87
S O U T H W E S T
Worthington Public Utilities 23
Pipestone–Jasper School District: Wind Energy and Education 26
Minwind I and II: Innovative Farmer-Owned Wind Projects 28
S O U T H E A S T
Byllesby Dam: Hydroelectric Power Revisited 32
Anaerobic Digestion of Food Waste at AnAerobics/Seneca Foods 48
Rochester Water Reclamation Plant 50
v i C O N T E N T S Clean Energy Resource Teams Manual
I N D E X T O C A S E S T U D I E S
Improves the environment
Works well with agriculture
Helps with reliabilityconcerns
Recycles waste materialsand waste heat
Offers community economic development
Improves energy independence, local control, and energy security
Promotes learning aboutenergy
The following
symbols are used in
this book to help
identify the ways in
which the case
studies illustrated
may be of help to
your community
•2
•3
•1
•4
•5
•6
•7
•8
•9
•10
•11
•12
•13
•14
•15
•16
•17
•18
•19
•20
•21
•22
•23
•24
•25
•26
•27
•28

Clean Energy Resource Teams Manual C O N T E N T S v i i
L O C AT I O N S O F C A S E S T U D I E S
X C E L E N E R G Y S E R V I C E A R E A
Reducing the “Hassle” of Efficiency: The One-Stop Shop Approach 17
Designing Energy Savings 19
O U T S I D E M I N N E S O TA
Iceland: A Demonstration of the Coming Hydrogen Economy 76
Top Deck Holstein Dairy Farm’s Microturbine 78
•1 •2 •3
•4
•5
•6
•7
•8
•9
•10
•11
•12
•26•27
•28
•23•24
•25
•13•14
•15
•16 •17•18
•19
•20•21 •22
Northeast
Northwest
Metro
SoutheastSouthwest
Central
WestCentral

C L E A N E N E R G Y R E S O U R C E T E A M S
H E L P I N G M I N N E S O TA C O M M U N I T I E S D E T E R M I N E T H E I R E N E R G Y F U T U R E
A growing number of Minnesotans envision a future built upon a wide mix of renewable local
energy sources – wind, biomass, solar and even hydrogen. The challenge is to bring technical
resources to communities so that they can help to design this clean energy future. Many
community and industry leaders interested in developing renewable energy alternatives do not
have the technical background to evaluate the feasibility of potential energy projects. Community
energy planning is too often piecemeal, with little linkage of strategic goals to outcomes.
In addition, important stakeholders are often left out of the process.
To address these challenges, several organizations have joined together to launch an exciting and
innovative project. These organizations are the Minnesota Department of Commerce, the
Minnesota Project, the University of Minnesota’s Regional Sustainable Development Partnerships,
the Rural and Metro County Energy Task Forces, and the Resource Conservation and
Development Councils. Named Clean Energy Resource Teams, or CERTS, the project seeks to
engage regions and communities in planning and determining their energy futures. CERTS is
patterned after the notion of regional resource management plans like county water plans.
The success of this project will rest upon the strength of collaboration between regional energy
planning teams and technical resources. The regional teams will be comprised of community,
industry, and government stakeholders. CERTS will match these teams with the technical expertise
needed to accelerate development of renewable energy projects using local resources. The
technical assistance will help the teams identify and prioritize renewable energy opportunities
within their region. In this way, the regional teams will gain the knowledge and technical support
needed to assess cost-effective energy options.
The outcome of the project will be a comprehensive and strategic renewable energy plan and
vision for each region that reflects a mix of energy sources, such as biomass, solar, hydrogen, and
wind. The plan will lay the groundwork for funding and implementing renewable energy projects
that meet regional needs in a systematic and comprehensive way. CERTS is expected to begin in
summer 2003.
P U R P O S E O F T H E W O R K B O O K
This manual presents various energy technology options and discusses how communities have
gone about shaping their energy future. The workbook provides users with quick reference
material that details clean, local energy options as well as nuts-and-bolts for implementing
community energy projects. It includes detailed case studies that describe how these projects
have been implemented in the past and the level of success they have achieved. Lastly, the
workbook provides lists of bibliographical references for those who wish to do more reading and
research and lists of contacts for additional information.
v i i i Clean Energy Resource Teams Manual

C O N TA C T I N F O R M AT I O N F O R C L E A N E N E R G Y R E S O U R C E T E A M S
For information about CERTS statewide coordination and technical resources, please contact:
Lola Schoenrich, Senior Program DirectorMinnesota Project651-645-6159, extension [email protected]
For information about the regional CERTS resource teams and the Regional Sustainable
Development Partnerships, please contact:
Cynthia Pansing, Statewide CoordinatorRegional Sustainable Development Partnerships [email protected]
For more specific information about what you can do within your region, please contact:
C E N T R A L
Sharon Rezac Andersen, Executive DirectorCentral Region Partnership218-894-5192 or [email protected]
N O R T H E A S T
Okey Ukaga, Executive DirectorNortheast Minnesota Sustainable Development Partnership218-879-0850 [email protected]
N O R T H W E S T
Linda Kingery, Executive DirectorNorthwest [email protected]
S O U T H E A S T
Dick Broeker, Executive DirectorExperiment in Rural Cooperation (Southeast Partnership)[email protected]
S O U T H W E S T
Annette Bair, Physical Development DirectorSouthwest Regional Development Commission(507) 836-8547 ext. [email protected]
W E S T C E N T R A L
Dorothy Rosemeier, Executive DirectorWest Central Regional Sustainable Development Partnership320-589-1711 or [email protected]
Clean Energy Resource Teams Manual i X


C H A P T E R 1 Introduction
C O U N T I E S A N D M U N I C I PA L I T I E S have started to take a more active role
in defining their energy future over the past several years. There are many
reasons for this new local interest, but whatever the impetus, the direction is
clear. Communities are looking for more locally controlled energy supplies and
more renewable energy resources and are increasingly interested in moving
away from centralized power stations running on imported fossil and nuclear
fuels. Community energy is not a new phenomenon, and in fact, this trend represents
both a renaissance back to early 20th century traditions and an advancement made
possible by 21st century technologies.
Minnesota is well
aligned to be a leader
in energy systems
that meet community
energy needs, keep
dollars in the local
community, and have
long-term
environmental
benefits.
W H AT W A S C O M M U N I T Y E N E R G Y ?
Before 1900 nearly all power was generated
locally. Small-scale onsite energy generators
provided electricity all across America. Farmers
relied on windmills to pump their water. Mills
depended upon rivers and streams to power
their operations. Onsite generators powered
industries and theaters.
As economies of scale made centralized power
stations cheaper and more efficient, the nation
shifted toward purchasing electricity from
these central suppliers and away from
community energy. Between 1900 and 1930,
the proportion of onsite electricity generation
declined from 60% to 20%1.
W H AT I S C O M M U N I T Y E N E R G Y ?
Community energy today is based on electricity
generation that is located in or near the
building, facility, or community where it is
used. Electricity generated near where it is used
is often called distributed energy. Community
energy could be fueled by renewable resources,
like wind, biomass, hydropower, and solar, or
by fossil fuels, like diesel and natural gas.
Throughout this workbook, community energy
is defined as electricity that is generated from
local, renewable resources and is located
onsite or near the users.
There have been many changes in electricity
generation technology in recent years. Whereas
throughout much of the 1900’s centralized
power stations were by far the most efficient
and cost effective, today distributed generation
is becoming increasingly efficient and cost
effective. Equally important, community
energy can be fueled by a wide variety of
renewable energy sources, providing long-term
environmental benefits.
W H Y R E N E W A B L E E N E R G Y ?
The electric utility industry is the largest single
source of air pollution in the United States
because of coal burning. In Minnesota, 75% of
the state’s electricity is generated from coal and
17% from nuclear. The electric industry
contributes 78% of the sulfur dioxide, 61% of
the nitrogen oxide and more than half the
mercury into Minnesota’s lakes and streams, a
very significant public health and economic
issue. Air pollution from coal-fired power
plants compromises our health, contributing
to respiratory diseases such as asthma and
causes acid rain.
NaturalGas1%
Nuclear17%
Wood1%
Hydro3%
Coal75%
Cogeneration 1%
Fuels used to generate electricity to serve Minnesota
Wind/Solar 1%
RDF 1%
Source: 2001 Energy Planning Report, MN Department of Commerce

2 I N T R O D U C T I O N Clean Energy Resource Teams Manual
Global warming is another, growing problem.
Burning fossil fuels is the main source of the
increasing concentration of carbon dioxide in
the atmosphere, the biggest factor in global
warming. Minnesota scientists predict
devastation of forest ecologies; disruption of
agriculture by drought, flooding, pests, weeds,
and reduced soil moisture; disruption of
hunting and fishing habitat, including likely
reductions in waterfowl and the loss of trout
from Minnesota’s streams.
Evidence is mounting that changes are already
occurring. For instance, a recent study by the
Department of Global Ecology of the Carnegie
Institution of Washington in Stanford,
California documented significant reductions
in corn and soybean yield attributed to
warming temperatures.2 In addition to farming,
forestry, hunting, and fishing, many of
Minnesota’s other industries, such as tourism
and cold-weather performance testing, are
totally dependent on a climate that is clearly
rapidly changing.
Renewable energy from wind, biomass, solar
and other local resources is clean, safe and
abundant in Minnesota. Wind generated
electricity has no emissions. Farm-grown
biomass fuel sequesters carbon in the soil.
Emission-free solar power can be ideal for
remote locations. Anaerobic digestion
generates electricity using manure from farms
or waste from food processing and cleans up
water and odor pollution at the same time.
Many renewable community energy projects
serve a dual purpose, generating electricity and
improving the local environment.
H O W I S T H E E L E C T R I C A L E N E R G Y
S Y S T E M S T R U C T U R E D T O D AY ?
Today our electric system has three components:
generation, transmission and distribution.
Most of the generation occurs at large
centralized power stations. In Minnesota, most
of these centralized power stations rely on coal
and nuclear fuel to make electricity. They burn
fuel to heat water and create steam that turns a
turbine and generates electricity. High-voltage
electricity is transported to local substations by
a complex, and in places aging, electric grid,
Minnesota’s only local
energy resources are
renewables.
Homegrown energy
offers:
• Opportunities for
local economic
development
• Greater community
self-reliance
• Reduced reliance on
volatile-priced
foreign fuels
• A cleaner
environment
Why the Shift Back to Community,Distributed Energy?
T E C H N O L O G Y C H A N G E S A N D
I M P R O V E M E N T S
• Improvements in fuel conversion make smaller generators more efficient.
• Manufactured technologies are cheaper than big power plants.
• The future development of fuel cells and microturbines will make onsite generation reliable and affordable.
• Smaller “combined cycle” and combined heat and power generators are highly efficient.
N E W R E L I A B I L I T Y N E E D S O F T H E
I N F O R M AT I O N E C O N O M Y
• Technology-based businesses cannot afford power outages.
• Computerized industries require greater power quality.
R E L I A B I L I T Y N E E D S O F C O M M U N I T I E S
• Municipal utilities with only one incomingpower line face outages due to weather and equipment failure.
L O C A L E N E R G Y O P P O R T U N I T I E S
• Distributed energy generation fueled by local resources stimulates community economic development.
E N V I R O N M E N TA L A N D H E A LT H
C O N C E R N S
• Renewable community energy improves air and water quality, and helps mitigate global warming.
• Cleaner electricity reduces the negative health impacts of the current system.
The components of the electric grid

Clean Energy Resource Teams Manual I N T R O D U C T I O N 3
also known as the transmission system. At
substations, transformers reduce the electric
voltage for distribution to our homes and
businesses completing the three-tiered chain.
G E T T I N G S TA R T E D
Start with Conservation and Energy
Efficiency The common misconception that
conservation and energy efficiency means
sacrifice, turning down the heat until you’re
cold and turning off all but one light, needs to
be corrected. Turning off lights and keeping
the thermostat at 65° instead of 70° are good
energy saving practices, but reducing use of
electricity is more about using better
technologies than about changing behaviors.
In the 2001 Energy Planning Report 3, the
Minnesota Department of Commerce defines
conservation as “primarily physical
improvements that result in reduced energy
consumption and that can be relied on, once
they are installed, to continue to use less
energy in the future.”
Conservation and
energy efficiency is
the best place to start
when crafting the 21st
century energy future.
Conservation is the
cheapest and often the easiest way to modify
resource usage. Conservation reduces overall
energy consumption, minimizing the potential
for shortages and reducing the negative
environmental impacts of fossil fuel or nuclear
generation. Before looking at new generation
of any kind, individuals, community leaders,
business leaders, and government should
evaluate what steps could be taken to conserve
and improve energy efficiency. This includes
technological changes such as using more
energy efficient light bulbs and appliances,
constructing buildings to take advantage of
natural light and natural heating, or installing
better insulation, all of which save money as
well as energy.
Move Toward Local Renewable Resources and
Community Energy Production Even with
significant conservation and efficiency
improvements, there may still be interest in
and need for new sources of energy for the
community. Since Minnesota’s only local
energy resources are renewables, homegrown
energy offers the potential for local economic
development, greater self-reliance, and less
reliance on foreign and volatile-priced fuels,
and a cleaner environment.
Ethanol is a good example of the multiple
benefits of using homegrown energy. Using
ethanol increases energy security by utilizing a
locally produced fuel that allows cars to burn
“cleaner”. In addition, the Minnesota model of
small, farmer-based cooperatives that produce
ethanol keeps profits in the community.
There are two key components to the
community energy shift in Minnesota. The first
is movement away from large, central station
generating facilities to smaller, more flexible
onsite or community generation. The second is
the use of clean, local, renewable resources to
generate electricity. Resources that make sense
will spawn greater energy independence and
mitigate, rather than exacerbate, environmental
impacts. By moving toward these goals,
Minnesotans are making choices today that
will truly revolutionize our energy system in
the future.

4 I N T R O D U C T I O N Clean Energy Resource Teams Manual
E N D N O T E S1Morris, David, Seeing the Light, Institute for Local SelfReliance, 2001, www.newrules.org
2Lobell and Asner, “Climate and ManagementContributions to Recent Trends in U.S. Agricultural Yield”,Science, 299: 1032, 2003
3Minnesota Department of Commerce, Minnesota EnergyPlanning Report 2001. St. Paul, MN, January 2002,www.commerce.state.mn.us
P H O T O G R A P H S
page 1 – American Wind Energy Assocation; page 2 –Minnesota Energy Planning report, 2001, MN Departmentof Commerce; page 3 – National Renewable EnergyLaboratory (hay bales/bulbs), Eastern Waterfall Guide(waterfall), Lisa Daniels/Windustry (wind turbines)

C H A P T E R 2 Creating a Community Energy Vision
IN THE PAST, UTILITY COMPANIES MADE ALL OF THE DECISIONS about
our energy system. They analyzed projected needs, decided on the best fuel
source and built and owned the power plants and transmission lines. The rest
of us – businesses, government, and residents – just flicked on the switch. The
utility provided the power, and we used as much as we wanted. Today, there is
increasing public interest in our energy system. Businesses and governments
have very specific needs for reliability and quality of power. Many people are calling
for greater reliance on home-grown renewable energy. Farmers and businesses are
interested in developing renewable energy projects using local resources.
The types of energy
used in the 21st
century will be
determined by the
decisions and
investments made in
the next 20 years.
No one person,
business, or group has
the ability to design
and build the system
of the future alone.
P U R P O S E S O F C O M M U N I T Y
E N E R G Y P L A N N I N G
All of the community stakeholders need to be
involved in creating a sustainable energy plan
for the future. Broad involvement allows
communities to establish priorities that will
guide future energy acquisitions and to
evaluate local resources to determine how best
to keep energy dollars at home. In fact,
instituting a community planning process is
the best way to protect the public interest and
ensure that all community stakeholders, rather
than a select few, are deciding the design of the
energy system of the 21st century.
Communities may have many different goals
in energy planning. Local governments may
want to reduce energy costs in public build-
ings. Community members or community
institutions may initiate community energy
planning because of an interest in using or
developing renewable energy. Interest in
energy planning may be sparked because of
local concern about proposed power lines or
new power plants. All of these and more are
valid reasons for convening interested
stakeholders and developing an energy plan.
In the future, a combination of utility
decisions, with community input, and
individual and business decisions will increas-
ingly shape the electric system – decisions
such as how much to conserve and whether or
not to add on-site generation or small renew-
able energy projects. The decisions we make
today are critically important because they will
determine our electricity system for decades to
come. The types of energy used in the 21st
century will be determined by the decisions
and investments made in the next 20 years.1
Everyone has ideas about what our future
electric system should look like, but no one
person, business, or group has the ability to
design and build the system of the future
alone. Even the utilities do not have that
ability, because they cannot build power plants
or transmission lines in the face of organized
community opposition.

6 C R E A T I N G A C O M M U N I T Y E N E R G Y V I S I O N Clean Energy Resource Teams Manual
S TA K E H O L D E R S
There are a variety of groups with interest in
the future of a community’s energy system.
Any one of them could initiate an effort to
examine and make changes in the local energy
system, but the most successful planning
efforts involve all of the community’s
stakeholders. Most projects require broad
involvement and buy-in for implementation.
Involving many players from the beginning
ensures that everyone’s voice is heard, that all
good ideas get on the table, and that questions,
concerns or opposition are understood and
resolved early in the process.
S TA K E H O L D E R R O L E S
Local Residents Citizens often initiate
community energy planning efforts because of
an interest in developing local renewable
energy sources or because of a concern about
power plant or power line siting. Active citizens
can mobilize and organize community support
to initiate community programs and to keep
them growing. Citizens may also get involved
by electing local officials who support
renewable energy development and by
supporting policies that encourage their
development. Citizens can play a role in
purchasing “green electricity” at incrementally
higher prices, showing a commitment to this
type of energy. Lastly, citizens can reduce their
own energy use at home, in schools, churches,
synagogues, and in other community
buildings.
Youth are important stakeholders because we
are designing the energy system today that
they will live with tomorrow. Students, with
their special perspective and skills, can be
involved in many ways. Youth can do research,
help to design projects, voice their opinions,
and be involved in many other ways.
Local Utilities Local utilities must be involved
early in planning any community energy
system. Almost all new sources of generation
will need to plug into the transmission and
distribution system. Utilities can make projects
happen, but they do have a number of
concerns and criteria that must be met.
Utilities have several ways to support projects.
They might actually own and operate a
community’s distributed generation system or
they might simply buy the green power. If the
utility purchases the power, the power
purchase agreement will be a critical element
in making the project economics viable. The
local utility might provide technical help in
meeting their interconnection standards.
Utilities may also fund conservation, renew-
able energy demonstration projects, or even
research. There are many options. Utilities are
required by state law to fund conservation
programs and to bring renewable energy
online. So, while sensitive to electricity pricing,
many utilities may look favorably on projects
that help them fulfill their requirements.
Local Government Local government officials
are key leaders in any renewable energy
project. There are a number of ways local
governments can promote the use of
renewable energy technologies. They can use
renewables to generate electricity for local
government use. Some options include
renewable projects at schools and government
buildings or solar technologies at remote
locations or in city parks. Local governments
can also use combined heat and power
Key stakeholders
include :
• Local Residents –
individuals interested
in renewable energy
and prices of
electricity
• Local Utilities –
investor owned,
cooperative, and
municipal
• Local Government –
county, city, and
township
• Local Business and
Industry –
commercial business
and factories
• Farmers –
owners of windy
land and producers
of bioenergy
• Public and Private
Community
Institutions –
schools, universities,
colleges, experiment
stations, non-profits,
prisons, or others

Clean Energy Resource Teams Manual C R E A T I N G A C O M M U N I T Y E N E R G Y V I S I O N 7
Steps in the
community energy
process include the
following:
1. Agree on common
goals
2. Raise community
awareness
3. Form a steering
committee
4. Gather and examine
information and data
5. Start with efficiency
upgrades and
conservation
6. Develop an action
plan
7. Turn the plan into
action
8. Evaluate and build
on success
systems to generate electricity and capture the
excess heat for use in government buildings or
even in a broader district heating system. In
communities with landfills or sewage
treatment plants, local governments can
collect and burn biogas to generate electricity.
Beyond developing their own resources, local
governments can play a role by purchasing
green electricity. Some options for purchasing
include buying green power for specific
buildings, greening up the entire government
load, perhaps by giving price preferences for
renewable electricity. Lastly, local governments
can use economic development tools to
promote local renewable development,
recognize and promote the use of renewables
by others, and incorporate energy issues in
local planning or in green building design.2
Local Business and Industry Area businesses
and industry play an important role in
sustaining and growing local economies. They
are also significant energy users. These
businesses and industries are important
stakeholders in the community energy
planning process. Businesses can take the lead
in making efficiency upgrades and improve-
ments. Business and industry can also
implement projects that turn a costly facility
waste into an income-generating energy
source. Another option is for a local industry to
be a partner in a combined heat and power
project supplying both electricity and steam
for industrial use or for a district energy
system.
Farmers Farmers can build on-farm
renewable energy projects, installing wind
turbines or anaerobic digesters, reducing their
on-site electricity costs and/or selling power
into the grid for extra income. Farmers can
also lease their land to private wind
developers. Typically, a landowner gets an
annual payment of up to $5000 per turbine if
they are on an annual payment system. Based
on typical turbine spacing and size, harvesting
the wind can increase annual farm income by
$70 per acre. Most of the bioenergy of the
future will be from farm-grown crops, another
way that farmers will be involved in energy
production.
Public and Private Community Institutions
Public and private community institutions like
schools, colleges, universities, experiment
stations, churches, synagogues and many
others are often very interested in reducing
costs through energy conservation. They may
also be interested in developing renewable
energy projects or in buying green power for
their buildings or campuses. Institutions often
serve as demonstration settings, building the
renewable energy project into the curriculum
and providing teaching and community
outreach, making the project additionally
valuable. They can sometimes find grants or
other funding to help offset the up-front
capital costs of projects. They may be a testing
ground for more innovative research and
development projects. These larger organiza-
tions may partner with others in the
community to serve as a hands-on location for
a pilot project that could spawn further
developments down the road.
S T E P S I N T H E C O M M U N I T Y
E N E R G Y P L A N N I N G P R O C E S S
In Minnesota, at least one county has
completed a formal energy plan, and interested
citizens in many other communities have
taken leadership roles to promote
conservation, efficiency, and use of local
renewable resources. Their experiences can be
models for other communities contemplating
energy planning. Several publications are also
available which lay out steps for community
energy planning (see Resources at the end of
this chapter). Communities should design a
planning process that will meet their own
goals, but they need not start from scratch to
create a workable methodology.

T H E G O A L O F T H E
P H I L L I P S C O M M U N I T Y
E N E R G Y C O O P E R AT I V E , led bythe Green Institute, and supported
by Hennepin County and theMinnesota Department of Commerce, is to create an urban energy cooperative that givesenergy consumers greater control over theirenergy usage and to link conservation programswith under-served populations. To achieve theseaims, the Phillips Community EnergyCooperative will deliver energy conservation-related services at the reduced costs that can beachieved by the larger membership base associated with a cooperative.
Phillips Community Energy Cooperative will putinto practice the idea that as more people cometogether, they are better able to influence theirlocal energy system. By setting realistic goalsand providing a mechanism for communitymembers to get involved, the project makes success attainable and enables future growth.Phillips Community Energy Cooperative alsoplans to research the feasibility of a renewablebiomass combined heat and power facility thatwould provide district heating and cooling toPhillips neighborhood businesses and residences.
★
C A S E S T U D Y:
Phillips Community Energy Cooperative:Consumers Control of Energy Use
Raise Community Awareness The next step is
reaching out to identified stakeholders and
others in the community and educating them
about the energy issues and the contemplated
planning process. Education and outreach
efforts vary. It could be as simple as a letter to
the editor in the local paper announcing an
organizing meeting or more involved like a
community meeting or conference on energy
issues. Initial community outreach should be
designed to spark interest in the issue, lay the
groundwork for the planning process, and
identify the people most interested in the
issues and in the planning process.
Agree on Common Goals The organizers of
the community planning effort must begin by
defining their common goals. Is the project
about conservation in public buildings, about
finding the most appropriate renewable energy
demonstration project for the community,
about developing guidelines for assessing new
power plant or power line proposals, or about
something else? Defining the goals will help to
define the universe of interested people in the
community and determine the stakeholders
that must be involved for the project to
succeed.
8 C R E A T I N G A C O M M U N I T Y E N E R G Y V I S I O N Clean Energy Resource Teams Manual
Improves the environment
Works well with agriculture
Helps with reliabilityconcerns
Recycles waste materialsand waste heat
Offers community economic development
Improves energy independence, local control, and energy security
Promotes learning aboutenergy
Phillips Community Energy Cooperative
distributing compact fluorescent light bulbs
This sort of visionary step could be a modelfor urban community redevelopment projectsacross the nation and could serve as an exam-ple to both urban and rural communitieswanting to regain control of their energyfuture.
For more information contact:
Phillips Community Energy Cooperative
Andrew Lambert
Green Institute
612-278-7118

Clean Energy Resource Teams Manual C R E A T I N G A C O M M U N I T Y E N E R G Y V I S I O N 9
Small, successful,
visible steps build a
culture of success.
Ongoing community awareness is critical as
well. Project leaders must make sure that oth-
ers in the community know what is happening
throughout the process. There are many ways
to accomplish this – signs advertising
meetings, regular stories about the planning
effort in the local paper, a regular column or
letters to the editor, meetings on the local
cable access station, and speaking
engagements to local groups and clubs.
Regular community outreach helps to increase
the visibility and interest in your project and
will help secure broad community support for
the final proposals later on.
Form a Steering Committee The most
successful community planning efforts involve
people with a wide range of interests. A wide
range of perspectives is most likely to result in
proposals that meet all community needs.
More diverse groups also hold greater political
and fiscal leverage when it comes to getting
approval for final plans. The more bridges that
can be built, and the more perspectives that
can be brought together, the more likely
communities are to achieve success.
It is a good idea to look for people from within
the stakeholder groups who are interested in
and committed to your goals and who have
respect and influence within their own
organization. You will be counting on the
people around your table to convince others in
the community that all options were
considered and that the final plan is a good
one.
Gather and Examine Information and Data
Every planning process has a fact-finding
element. The project goals will, of course,
dictate the needed information. If conservation
is a goal, information about community and
building energy usage and conservation
potential will be needed. If the goal is develop-
ing renewable energy, a comprehensive
resource assessment will identify the potential
energy resources available and their economic
feasibility. This is the place to involve technical
experts: experts from within the community,
utilities, University experts, state agency
assistance, and consultants.
Start with Efficiency Upgrades and
Conservation Before considering any
alternative energy project, be sure to explore
energy efficiency opportunities within the
community. Although Minnesota has an
excellent track record of conservation
programs, there is still tremendous potential to
reduce electricity use.
Develop an Action Plan Once the information
about technologies and the facts about energy
use and resource options have been analyzed,
it is time to develop an action plan. The action
plan will define the scope of the project. It
should detail what will be done, why, how, and
by whom. The action plan will include specific
goals, objectives, actions, timelines, and
responsibilities. It will identify costs, revenues,
financing and include the business plan for the
project.

1 0 C R E A T I N G A C O M M U N I T Y E N E R G Y V I S I O N Clean Energy Resource Teams Manual
T H E I N T E R N AT I O N A L
C O U N C I L F O R L O C A L
E N V I R O N M E N TA L I N I T I AT I V E S 3
is an international association ofover 564 local governments
working to combat global warming problemsthrough local solutions. Its Cities for ClimateProtection Campaign (CCP) is an internationaleffort to reduce greenhouse gas emissions andimprove community livability by assisting localgovernments with energy management andconservation programs. The program focuses onlocal government involvement because localgovernments influence and sometimes evendirectly control many of the activities that produce greenhouse gas emissions including:land use decisions, energy-efficiency building
codes, waste-reduction, and recy-cling programs.
Duluth, St. Paul, and Minneapolisare all members of the CCPCampaign and have started reducing their greenhouse gas emissions by conserving energy anddeveloping newer, cleaner systems
for heating and electricity. Each of theseMinnesota cities is taking a leadership role ineducating their citizenry and motivating theircommunities to take action. Minneapolis and St.Paul were founding members of CCP in theearly 1990’s, and Duluth joined the Campaign inMay 2001.
In the fall of 2001, Duluth reached its first project milestone, completing a greenhouse gasemissions inventory that allows the City to evaluate the impact of different energy-savingmeasures on emissions. With the inventory completed, the next steps in the CCP process areto identify which energy-saving measures arealready having a positive impact, to formallyadopt a greenhouse gas reduction target, andto develop a Local Action Plan to guide proposed measures for emissions reductions.
Program leaders at the City of Duluth felt it wasimperative to engage a broad range of community members throughout the process. A community steering committee was seated toassist in developing the Local Action Plan and toensure strong communication and organizationthroughout plan development.
The City also secured funding and installed a 2.4kW solar energy system on the Duluth PublicLibrary. The system will be hooked to a monitorin the library that will show the clean energybeing produced and will serve as an energyresource center for the community. The newsolar system was funded in part with a grantfrom the Rebuild Minnesota program, adminis-tered by the Minnesota Department ofCommerce.
Other current projects include an LED traffic signal replacement that conserves 90% of theenergy otherwise used by incandescent trafficlights, as well as a project in cooperation withMinnesota Power that will showcase three alternative energy systems to be installed at theLake Superior Zoo in Duluth.
For more information contact:
Carin Skoog
Cities for Climate Protection-Duluth
218-723-3610
★
C A S E S T U D Y:
Duluth and the International Council for Local Environmental Initiatives:Local Climate Change Targets
Installation of solar
panels atop the
Duluth Public Library

C A S E S T U D Y:
West Central Research and Outreach Center:Developing a Renewable Energy Center in Morris
Clean Energy Resource Teams Manual C R E A T I N G A C O M M U N I T Y E N E R G Y V I S I O N 1 1
T H E W E S T C E N T R A L
R E S E A R C H A N D O U T R E A C H
C E N T E R is leading a communityeffort to make renewable energy a
reality in Morris, Minnesota. TheResearch and Outreach Center has put togethera proposal to develop an integrated, communityscale, research, demonstration and productionRenewable Energy Center in close partnershipwith the University of Minnesota-Morris andother community and renewable energy collaborators. This would be a true community-wide effort involving many different compo-nents from installing renewable energy technologies, to researching technologies forconventional and cellulytic production of biofuels, to tying industry in with a communitydistrict heating system.
Many community institutions are already interested in getting on board. The RenewableEnergy Center hopes to conduct research onbiofuels and install a series of wind towers. TheUniversity of Morris is also interested in becoming a “Green University” by using a biofuel or biomass generator to meet its energyneeds. The local school district is building a newelementary school that could incorporate adistrict heating system tied into the University.
DENCO, a producer/farmer owned corn ethanolplant located in Morris, is also pursuing opportunities to join the mix. They are evaluating the feasibility of installing a thermaloxidizer to reduce the facility’s odors that wouldalso produce a large amount of steam heat thatcould be sold for use in a district heating system.By selling some of the excess steam, they couldrecoup some of the oxidizer installation costswhile contributing to a community-basedrenewable energy system.
The Research and Outreach Center is serving asthe catalyst and facilitator of community effortsto incorporate renewable energy, but area institutions and businesses would own andoperate the systems. A true community programlike this would be a unique demonstration thatcould give people around Minnesota and acrossthe nation a working model of a truly integrated renewable energy program.
To get the program moving, the Research andOutreach Center has hosted two RenewableEnergy Workshops, each attended by over 200people from a variety of backgrounds. A twen-ty-six member Community Steering Committeewas seated after the first conference. The steering committee will provide a citizen’s voicethroughout project development and play a crucial role in ensuring public participation.
While this case study presents a somewhat different model for community-wide planning,it demonstrates another option. Communityenergy planning can follow many models withdifferent community members and organiza-tions playing a leadership role and movingtowns in the “right” direction.
For more information contact:
Greg Cuomo or Mike Reese
West Central Research and Outreach Station
320-589-1711
★
Improves the environment
Works well with agriculture
Helps with reliabilityconcerns
Recycles waste materialsand waste heat
Offers community economic development
Improves energy independence, local control, and energy security
Promotes learning aboutenergy

1 2 C R E A T I N G A C O M M U N I T Y E N E R G Y V I S I O N Clean Energy Resource Teams Manual
I N D E C E M B E R 2 0 0 0 ,
Chisago County released itsChisago County EnergyManagement Plan.4 The plan lays
out a vision for the communityand will guide future energy decisions. It out-lines environmentally smart, sustainable, and economically defensible energy options.Developing the plan also allowed the public tobecome engaged in a broad planning processthat laid the foundation for the comprehensiveenergy management strategy.
To facilitate stakeholder communicationin the process, the county board appointed a citizen-based “Overlay andEssential Services” task force of 18 ommunity members. The task force’s mission was to review existing energy conditions, including local use patternsand energy demand, and to providedetailed recommendations for severalsectors. They set guidelines for every-thing from siting and permitting ofpower lines and generation facilities, tocriteria for scenic resource protection, to
provisions for conservation and alternative energy.
Several Chisago County community membershad already been involved in local energy issuesprior to involvement with the Chisago CountyEnergy Management Plan. In 1996, citizensformed the Concerned River Valley Citizens tochallenge Northern States Power (NSP), nowXcel Energy, regarding its proposed 230 kilovoltpower line that would span the St. Croix Riverfrom Chisago County, Minnesota to Polk County,Wisconsin. NSP sought to construct this new lineacross the wild and scenic St. Croix River tostrengthen the grid interface betweenMinnesota and Wisconsin.
Members of the Concerned River Valley Citizensviewed the siting of a large power line acrossthe St. Croix River as a violation of the Wild andScenic River Act of 1916, which protects thequality of the river and the land around it. Infighting the proposal, they learned all they
could about the energy system, found fundingand brought in expert witness testimony for abattle with NSP. In the process, group memberslearned the ins and outs of the energy businessfrom siting and environmental requirements to technical and engineering issues. They succeeded in forcing a compromise on thepower line, but did not stop there.
Concerned River Valley Citizens saw the need todevelop a mechanism that would give the localgovernments greater control over energy devel-opment in their county forever. They needed acountywide energy plan. The County EnergyManagement Plan project was a community-ledeffort to learn more about energy issues andshape a plan that would ensure a citizen-centered, locally controlled, sustainable energyfuture.
The Overlay and Essential Services task force wasthe primary organizing and leadership group inthe planning process. They worked with allmembers of the community including the general public and local elected officials. Theybrought in assistance from the U.S. Departmentof Energy, engineers, and other communitiesalready doing sustainable community work. Thiscombination of people and broad communityinvolvement helped ensure the success of theproject and created a coalition the communitycould build on in the future.
The county soon had an opportunity to use theplan. Xcel Energy filed a certificate of need withthe Minnesota Public Utilities Commission in2002 to install a different line across the St.Croix, now a lower voltage line with double thetransmission capacity. The coalition builtthrough the initial fight and through develop-ment of the energy plan, is now able to evaluate the proposal against the broadly supported criteria in the county energy plan.
For more information contact:
Bill Neuman
Concerned River Valley Citizens
651-257-6654
★
C A S E S T U D Y:
Chisago County: A Community Energy Management Plan
Improves the environment
Works well with agriculture
Helps with reliabilityconcerns
Recycles waste materialsand waste heat
Offers community economic development
Improves energy independence, local control, and energy security
Promotes learning aboutenergy

E N D N O T E S1World Energy Council and International institute forApplied Systems Analysis, Global Energy Perspectives to2050 and Beyond, London and Austria, 1996.
2Warner, Joshua and Schoenrich, Lola, Plugging Into GreenPower: Local Government Options for Renewable Energy,The Minnesota Project, St. Paul, November 1999.
3For more information regarding the International Councilfor Local Environmental Initiatives, please see the website:http://www.iclei.org/.
4Chisago County Board of Commissioners. December2000. County Energy Management Plan: Chisago County,Minnesota. Chisago County, Minnesota.
P H O T O G R A P H S
page 5 – Melissa Pawlisch/The Minnesota Project (upper),Amanda Bilek/The Minnesota Project (lower); page 6 –Melissa Pawlisch/The Minnesota Project; page 8 – AndrewLambert/The Green Institute; page 9 – Lake Benton ValleyJournal (upper), Lola Schoenrich/The Minnesota Project(lower); page 10 – Steve Forslund/City of Duluth (upper),Carin Skoog/Cities for Climate Protection (lower); page 11 –Teresa Hebert/West Central Research and Outreach Center;page 12 – Chisago County Board of Commissioners; page13 – Lisa Daniels/Windustry
Clean Energy Resource Teams Manual C R E A T I N G A C O M M U N I T Y E N E R G Y V I S I O N 1 3
Turn the Plan into Action This can be one of
the most important steps in the entire process.
If the plan has several components, make sure
that there are visible achievements early on.
Even small, successful, visible steps build a
culture of success. They build momentum,
bring more people into the effort, and
encourage others to support the work. If one of
the first steps is erecting a wind monitoring
station, for example, make sure that the event
is well publicized and well reported. Involve
community volunteers if appropriate and
possible. Making the project happen will
include getting bids for technology, finding
grants, loans or other financing, construction,
interconnection, resolving unexpected
problems, and finally, bringing the project on
line.
Evaluate and Build on Success Be sure to
take time to reflect on what worked well and
what could be improved next time. If there
were problems, identify the barriers and look
for creative ways to overcome them. First look
to people from within the community who can
help to resolve the problems and then look for
outside technical help if it is needed. Learn
from successes and from mistakes and share
both widely within and beyond the
community.
Communities can and do take on and
accomplish what sometimes initially seems
like unachievable goals. Building the 21st
century community energy system takes
vision, commitment, persistence, and strong
leadership. It also requires broad community
involvement and is likely to require some
outside technical expertise. Working together,
people in communities can design and build
the local, renewable energy systems of the
future.
H E L P F U L R E S O U R C E S F O R C O M M U N I T I E S
1 4 C R E A T I N G A C O M M U N I T Y E N E R G Y V I S I O N Clean Energy Resource Teams Manual
BC Energy Aware Committee. From British
Columbia, Canada, the site addresses community
energy planning and the role of local governments
in energy planning. The website includes a “toolkit”
introducing the basic concepts and issues involved
in generating a community energy plan, provides a
number of community planning strategies based
on community size, and offers case studies that
portray pertinent information for a variety of
stakeholders. The toolkit is geared toward local
government officials but could be used by anyone
interested in community energy planning.
(www.energyaware.bc.ca/welcome.htm)
The University of Minnesota’s Regional Sustainable
Development Partnerships. The Regional
Partnerships draw together communities and
University resources to foster innovations in
sustainable development throughout greater
Minnesota. One of the Partnerships’ areas of focus
is locally distributed renewable energy. Partnering
with the Minnesota Project and the Department of
Commerce, the Regional Partnerships help bring
together communities and the resources they need
to determine their energy future. For more
information contact Cynthia Pansing, Statewide
Coordinator, 612-625-8759, [email protected].
(www.regionalpartnerships.umn.edu)
The Minnesota Project. A nonprofit organization
dedicated to sustainable development and
environmental protection in rural Minnesota.
Since 1979, The Minnesota Project has worked to
promote healthy rural communities through
building broad-based coalitions, facilitating
statewide, regional and national networks, and
connecting communities to resources and policy
forums. Current program areas are renewable
energy development, sustainable agriculture, water
protection and community sustainability.
Minnesota Project is coordinating the technical
teams for the Community Energy Resource Teams
Project. Contact: Lola Schoenrich, 651-645-6159 or
(www.mnproject.org)
All web links listed here are available (and updated
if necessary) at www.mnproject.org (click on
“publications”)
Under Construction: Helpful Tools and Techniques
for Local Planning. Minnesota Planning Agency,
September 2002. This report provides information
on local planning and includes several sections on
energy. Additional information is available from
Deborah Pile, Minnesota Planning, 651-297-2375
(www.mnplan.state.mn.us)
Community Energy Workbook: A Guide to Building
a Sustainable Economy. Alice Hubbard and Clay
Fond, Rocky Mountain Institute, 1995. Provides a
systematic approach to community involvement in
building a sustainable energy future. The Rocky
Mountain Institute, 970-927-3851.
(www.rmi.org)
Smart Communities Network: Creating Energy
Smart Communities. A project of the U.S.
Department of Energy. Resources and information
to help communities get started with energy
planning and community-wide energy conserva-
tion. It focuses on managing energy costs with
conservation programs, reducing production of
greenhouse gases, and involving the whole
community in energy management efforts.
Includes success stories of sustainable communi-
ties in renewable energy and efficiency issues.
(www.sustainable.doe.gov/municipal/intro.shtml)
Developing Your Community’s Action Plan. U.S.
Department of Energy, Rebuild America Guide
Series, May 1998. Lays out a planning process to
identify and implement energy conservation in
buildings. 800-DOE-EREC.
(www.eren.doe.gov)
Green House Gas Inventory Report with
Recommendations for the Development of Duluth’s
Local Action Plan. October 2001. This report
outlines both the CCP milestone process and
details how the emission inventory was conducted.
(www.ci.duluth.mn.us/city/information/ccp/GHG
Emissions.pdf)
C H A P T E R 3 Improving Energy Efficiency
BUILDING A BRAND-NEW, SHINY, RENEWABLE ENERGY POWER SOURCE
in your own community has a lot of appeal. Doesn’t everyone want to have the
latest, greatest and cleanest power plant to supply their power and stimulate
the local economy? New renewable energy sources, such as the wind turbines
being erected all over Minnesota, do get a lot of attention. However, there is a
much less glamorous way to “produce” energy that is often cheaper and
smarter than building a new plant. This great, unsung hero is energy efficiency –
consuming less energy by using it more efficiently. Because energy efficiency reduces
energy bills, it’s also dollars smart. Due to energy efficiency technologies adopted
since the shock of the 1973-74 Arab oil embargo, it is estimated that the US saves
$150 to $200 billion annually in energy costs.1
Minnesota could
reduce future energy
consumption
28 percent by
aggressively
implementing
energy efficiency
programs3.
T H E E N O R M O U S P O T E N T I A L O F E N E R G Y E F F I C I E N C Y
The capacity of engineers to think of ways to
do things faster, cheaper and better is
astounding. We are most familiar with this in
terms of computers – it seems that in the time
it takes to get from the factory to our house, a
new computer is obsolete. But while our
society has an obsession with gigahertz, we
pay relatively little attention to kilowatts – the
energy consumed by the products we buy.
And yet just as computers continue to get
faster and faster, so are there improvements in
technologies and processes that can use less
energy to provide the same level of service.
These include compact florescent light bulbs,
super-efficient appliances, variable speed
motors, and ultra-efficient heating and cooling
systems.
A compact florescent light bulb can produce
the same amount of light as a standard
incandescent bulb, but uses a quarter the
power and can last 10 times as long. LED (light
emitting diode) bulbs that are starting to enter
the market are even more efficient and long
lasting.
Simply replacing old light bulbs can result in
significant energy savings. For example, at the
University of Minnesota’s Twin Cities campus,
a light bulb replacement program resulted in
savings of $800,000 per year, which the
University will benefit from for many years to
come2.
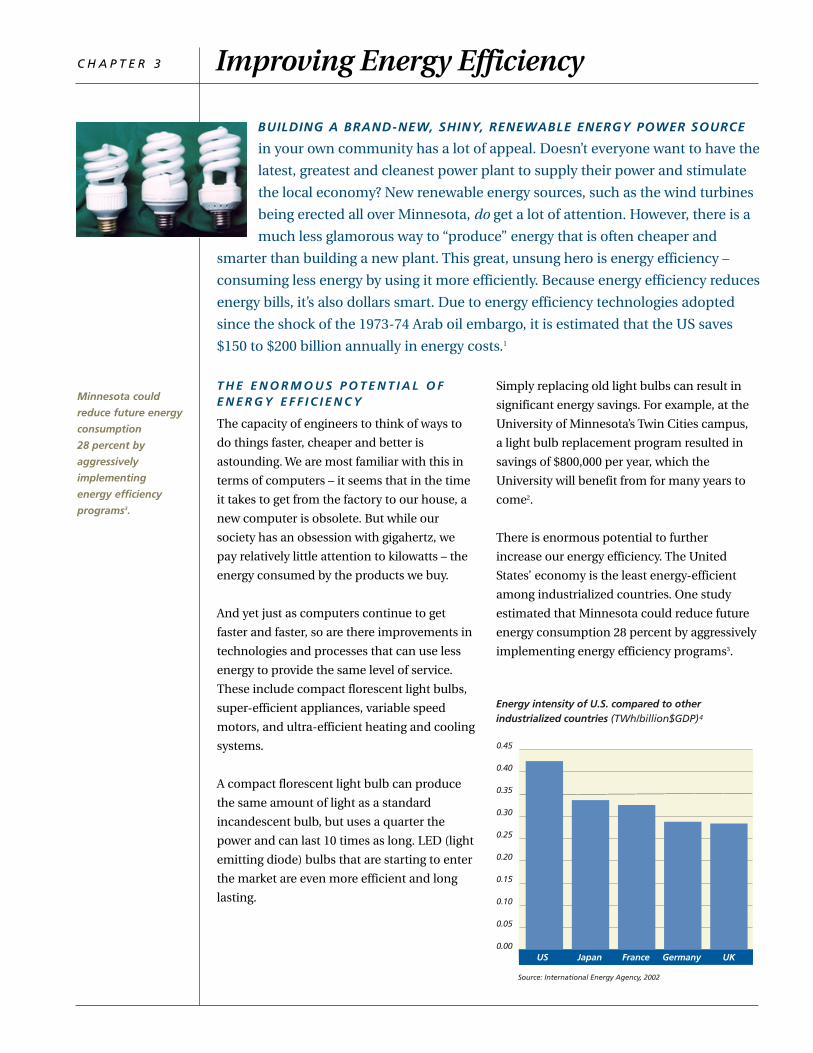
There is enormous potential to further
increase our energy efficiency. The United
States’ economy is the least energy-efficient
among industrialized countries. One study
estimated that Minnesota could reduce future
energy consumption 28 percent by aggressively
implementing energy efficiency programs3.
Source: International Energy Agency, 2002
Energy intensity of U.S. compared to other industrialized countries (TWh/billion$GDP)4
0.00
0.05
0.10
0.15
0.20
0.25
0.30
0.35
0.40
0.45
UKGermanyFranceJapanUS
1 6 I M P R O V I N G E N E R G Y E F F I C I E N C Y Clean Energy Resource Teams Manual
I M P L E M E N T I N G E N E R G YE F F I C I E N C Y
The approach to implementing energy
efficiency will vary slightly depending on
whether it is in the residential, commercial or
industrial sector. Implementing an energy
efficiency project for a homeowner may be as
simple as adding insulation and installing
some efficient light bulbs but may be more
complex if it involves ventilation and other
“house system” elements. For larger projects, a
systematic approach to energy efficiency
involves 5 basic steps:
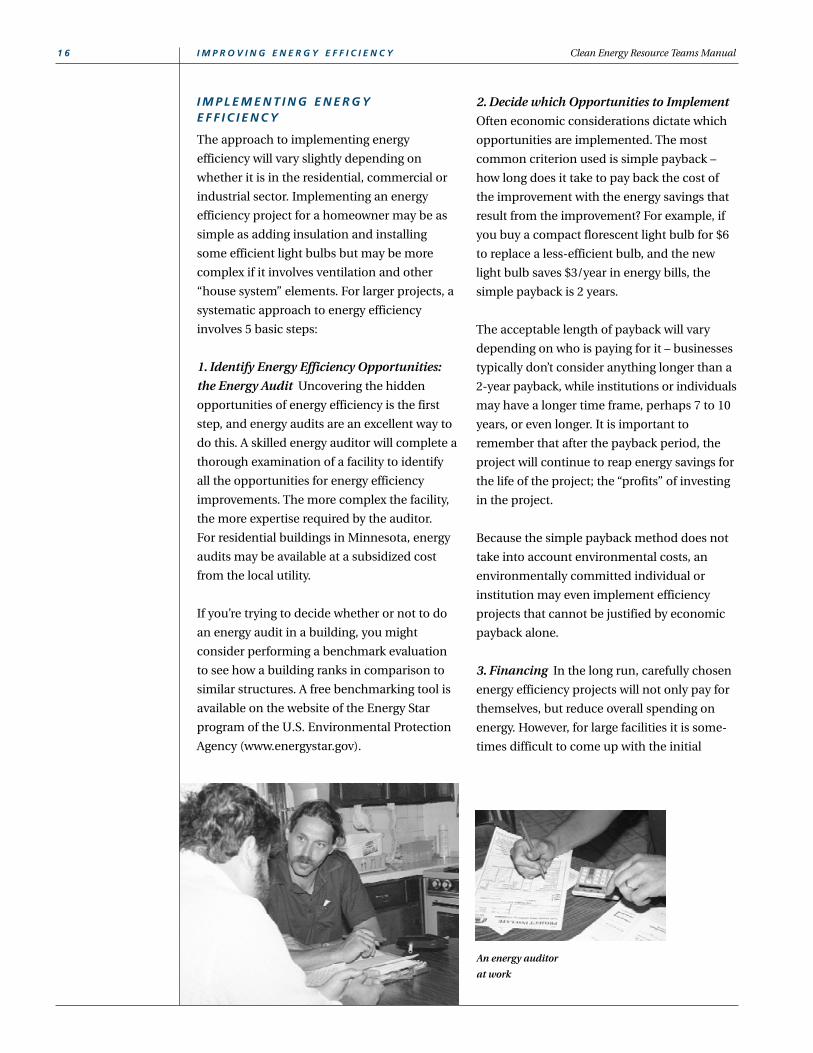
1. Identify Energy Efficiency Opportunities:
the Energy Audit Uncovering the hidden
opportunities of energy efficiency is the first
step, and energy audits are an excellent way to
do this. A skilled energy auditor will complete a
thorough examination of a facility to identify
all the opportunities for energy efficiency
improvements. The more complex the facility,
the more expertise required by the auditor.
For residential buildings in Minnesota, energy
audits may be available at a subsidized cost
from the local utility.
If you’re trying to decide whether or not to do
an energy audit in a building, you might
consider performing a benchmark evaluation
to see how a building ranks in comparison to
similar structures. A free benchmarking tool is
available on the website of the Energy Star
program of the U.S. Environmental Protection
Agency (www.energystar.gov).
2. Decide which Opportunities to Implement
Often economic considerations dictate which
opportunities are implemented. The most
common criterion used is simple payback –
how long does it take to pay back the cost of
the improvement with the energy savings that
result from the improvement? For example, if
you buy a compact florescent light bulb for $6
to replace a less-efficient bulb, and the new
light bulb saves $3/year in energy bills, the
simple payback is 2 years.
The acceptable length of payback will vary
depending on who is paying for it – businesses
typically don’t consider anything longer than a
2-year payback, while institutions or individuals
may have a longer time frame, perhaps 7 to 10
years, or even longer. It is important to
remember that after the payback period, the
project will continue to reap energy savings for
the life of the project; the “profits” of investing
in the project.
Because the simple payback method does not
take into account environmental costs, an
environmentally committed individual or
institution may even implement efficiency
projects that cannot be justified by economic
payback alone.
3. Financing In the long run, carefully chosen
energy efficiency projects will not only pay for
themselves, but reduce overall spending on
energy. However, for large facilities it is some-
times difficult to come up with the initial
An energy auditor
at work

4. Implementing the Energy Efficiency
Projects Once you’ve made a plan for what
projects you want to do, you have to decide if
you want to do them yourself, use staff within
your organization, or contract for services. If
you contract the projects out, choosing a
qualified contractor to install the energy
efficiency projects is key to realizing the energy
savings.
5. Maintenance In some cases, maintenance
of an energy efficiency project will not be an
issue, but in some cases it is worthwhile to
consider how the project will be maintained.
This is especially true
in dealing with
processes and systems.
For example, many
types of energy
efficiency gains in
complex Heating,
Ventilation and Air
Conditioning systems
(HVAC) tend to dimin-
ish over time unless
they are maintained.
capital funds to finance these projects. There
are several ways to overcome this problem:
• Set up a revolving loan fund for energy
efficiency projects. Recognizing that the
projects pay for themselves, the University of
Minnesota Twin Cities campus set up a fund
for energy efficiency projects that is
replenished with the savings from previous
projects.
• Consider having an outside company do the
efficiency project. There are some companies
that will do the assessment, implement and
finance the project, in exchange for a share
of the energy savings, which may make
sense in certain situations.
• Grant and loan programs for energy
efficiency projects. Utilities often offer rebate
programs for high-efficiency products, and
may have other programs – your local utility
should know what programs you qualify for.
Other financing programs exist; for example,
schools have special financing available to
them for energy efficiency projects, and the
Minnesota Housing Finance Agency offers
programs for qualifying homeowners and
multi-family buildings.
S P O N S O R E D B Y X C E L E N E R G Y , and administered by the Center for Energy andEnvironment, the One-Stop Efficiency Shop(One-Stop) is an innovative, full service lightingrebate program for the small businesses sector.Small businesses are difficult to serve with traditional lighting rebate programs due to limitations in financial resources, time, knowledge of lighting products, and access toquality contractors. One-Stop is structuredspecifically to address these needs and concerns.One-Stop offers qualified business owners afree, no obligation audit, lighting rebates, andbelow-market rate financing that is paid on theowner’s utility bill, with loan payments structuredto match the owner’s monthly savings so that
the owner does not experience any increase inmonthly bills. Because One-Stop does not selllighting products, auditors are able to offer customers unbiased recommendations. Yet, dueto the collaboration with local electrical contractors, One-Stop is also able to offer standard program pricing quotes and a pool ofqualified contractors to eliminate the hassle ofcollecting bids. This combination of servicesbrings education, financial resources, and mini-mal time commitment directly to the customer.
Available in Xcel service territory.
For more information about this program, see
www.mncee.org/oses.htm.
C A S E S T U D Y:
Reducing the “Hassle” of Efficiency:the One-Stop Shop Approach
Clean Energy Resource Teams Manual I M P R O V I N G E N E R G Y E F F I C I E N C Y 1 7
Cooling system
inspection
Improves the environment
Works well with agriculture
Helps with reliabilityconcerns
Recycles waste materialsand waste heat
Offers community economic development
Improves energy independence, local control, and energy security
Promotes learning aboutenergy

1 8 I M P R O V I N G E N E R G Y E F F I C I E N C Y Clean Energy Resource Teams Manual
B A R R I E R S T O E N E R G Y
E F F I C I E N C Y
So if energy efficiency is so marvelous and
cost-effective, why aren’t we doing more of it?
Here is a summary of some of the main
reasons.5
Information Gap Consumers and even
contractors often aren’t aware of energy
efficiency options or the economic and
environmental benefits they offer. Consumers
also may not believe the potential saving
estimates claimed by contractors and auditors.
Lack of Investment Dollars Residential,
businesses and government customers may
lack the up-front capital required to make
investments in energy efficiency projects.
High “Transaction Costs” Making an
informed purchase or considering energy
efficiency measures often involves more time,
money and hassle than the consumer is willing
to invest.
Split Incentives If the person who pays the
monthly energy bill is different than the person
who pays for the equipment, there is a split
incentive. This is most evident in landlord/
tenant relationships. The landlord does not
have an incentive to purchase the more
expensive, higher efficient equipment because
the landlord does not reap any of the benefits
of lower operating costs. The tenant is often
unaware of equipment upgrades and does not
actually own the equipment; therefore the
tenant does not invest in more efficient
equipment even though they would capture
significant savings. This same dilemma can
also occur in large institutions where the
person paying the energy bill is different than
the person responsible for capital improve-
ments.
Short Term Costs are Often Emphasized over
Long Term Costs For example, builders try to
keep construction costs as low as possible,
without considering the long-term energy
costs of inefficient construction methods.
O V E R C O M I N G B A R R I E R S :
P O L I C I E S A N D P R O G R A M S
T O E N C O U R A G E
E N E R G Y E F F I C I E N C Y
Recognizing that some policy direction is
necessary to overcome barriers and more fully
capture the potential of energy efficiency,
policymakers have created programs to
stimulate energy efficiency. Below are some of
the programs available in Minnesota.
The largest energy efficiency program in
Minnesota is called the Conservation
Improvement Program (CIP). In Minnesota, all
gas and electric utilities are required to spend a
percentage of their revenues on conservation
efforts.6 These efforts include funding energy
audits, educational efforts, rebates for energy-
efficient appliances and other equipment, and
design assistance to make new buildings more
energy efficient.
The Minnesota Department of Commerce
estimates that because of the CIP program,
every year Minnesota saves the amount of
electricity consumed by 41,000 retail
customers and reduces peak demand by about
128 megawatts. The CIP program is also very
cost-effective: every $1 spent results in about
$3.50 in benefits7. Local utilities can provide
more information on programs that they
provide under CIP.
The Minnesota Department of Commerce runs
the Energy Information Center, which
produces numerous publications for
residential, small business/commercial sites,
and institutional and municipal buildings.
Each section lists publications that provide
practical, easy-to-understand recommenda-
tions for energy saving strategies. The Energy
For every $1 spent on
energy efficiency
programs, about $3.50
in benefits are realized

E N D N O T E S1Interlaboratory Working Group, Scenarios of U.S. CarbonReductions: Potential Impacts of Energy Technologies by2010 and Beyond (5 labs report), (Oak Ridge, TN; OakRidge National Laboratory and Berkeley, CA; LawrenceBerkeley National Laboratory), LBNL-40533 orORNL/CON-444. 1997.(www.ornl.gov/ORNL/Energy_Eff/labweb.htm)
2This savings estimate was made when the lighting retrofitprogram was 70 percent finished, at which time, costs ofthe program totaled $3.1 million. Minnesota BuildingResearch Center, University Energy Efficiency ProgramEvaluation, June 1992.
3Environmental Law and Policy Center, Repowering theMidwest, Chicago, 2001.
4Chart presents electric energy intensity from 2000 data;units (TWh/billion$GDP) are terawatthours per billion 1995 dollars of gross domestic product, adjustedfor purchasing power parity.
5Portions excerpted from Environmental Law and PolicyCenter, Repowering the Midwest, Chicago, 2001; and personal correspondence with Keith Butcher, Center forEnergy and Environment, 3/3/03.
6The law requires all electric utilities to invest 1.5 percentof their state revenues in CIP (except Xcel Energy, whichmust invest 2 percent). Regulated natural gas utilities arerequired to invest 0.5 percent of their state revenues intoconservation programs.
7Minnesota Department of Commerce, Energy Planningand Policy Report 2000, St. Paul, 2001.
8For more information regarding Rebuild Minnesota, see:www.commerce.state.mn.us.
P H O T O G R A P H S
page 15 – National Renewable Energy Laboratory;page 16 – St. Paul Neighborhood Energy Consortium;page 17 – National Renewable Energy Laboratory
F O R 1 0 Y E A R S , X C E L E N E R G Y has offereda program called Energy Design Assistance (formerly Energy Assets) to encourage energyefficiency to be included in the design of largebuildings. Xcel pays for the services of a consulting firm to work with the buildingowner, architect and engineers (the designteam). The program’s goal is to improve theenergy efficiency of new construction projectsby encouraging the design team to implementan integrated package of energy efficientstrategies. Using sophisticated computer model-ing and their knowledge of energy efficiency
practices and technology, the consultants analyze energy impacts and costs associatedwith a range of design options. The programhas addressed almost 200 buildings with a totalof more than 40 million sq. ft., saving well over$15 million per year, and nearly 60 megawattsin electrical peak demand. Savings, compared tocode levels, averages about 30%.
For more information, see www.xcelenergy.com >
business > (enter zip code) Go > Save Energy and
Money > Energy Design Assistance.
C A S E S T U D Y:
Designing Energy Savings
Clean Energy Resource Teams Manual I M P R O V I N G E N E R G Y E F F I C I E N C Y 1 9
Information Center also makes Energy
Specialists available to customers that can
assist with energy conservation questions
(see contact information on page 20).
Another state program is Rebuild Minnesota,8 a
part of the US Department of Energy’s Rebuild
America Program that focuses on creating
partnerships to implement conservation and
energy efficiency projects. Rebuild Minnesota
works with schools, municipalities and low-
income family dwellings to identify solutions
to meet local energy demand and build public
and private partnerships among communities
throughout the state. They provide assistance
drawing community partnerships together and
linking communities with the people and
business that provide energy efficient products,
services, information and strategies.
In addition, The Minnesota Department of
Commerce, University of Minnesota and the
Iron Range Resource and Rehabilitation
Agency are beginning a state level Industries of
the Future (IOF) program to improve energy
efficiency, environmental performance, and
industrial process productivity in two of the
state’s most energy intensive industries, forest
products and mining.
Improves the environment
Works well with agriculture
Helps with reliabilityconcerns
Recycles waste materialsand waste heat
Offers community economic development
Improves energy independence, local control, and energy security
Promotes learning aboutenergy

H E L P F U L R E S O U R C E S F O R C O M M U N I T I E S
2 0 I M P R O V I N G E N E R G Y E F F I C I E N C Y Clean Energy Resource Teams Manual
All web links listed here are available (and updated
if necessary) at www.mnproject.org (click on
“publications”)
Minnesota Department of Commerce. Has
information on the types of conservation programs
available and provides useful publications on their
website related to energy efficiency. In addition,
they host the Energy Information Center, which
has Energy Specialists waiting to answer questions
you may have at the phone number below.
651-296-5175 or 800-657-3710 (toll-free)
(www.commerce.state.mn.us)
Energy Star. A program of the US Environmental
Protection Agency and US Department of Energy.
To use the free benchmarking tool, simply click on
the button that reads “Benchmark your building’s
energy performance”.
(www.energystar.gov)
Utility conservation programs. Many utilities have
websites on their conservation programs, some are
listed below. Contact your local utilities to find out
about their offerings.
• Xcel Energy
(www.xcelenergy.com)
• CenterPoint Energy Minnegasco
(www.minnegasco.centerpointenergy.com)
• Minnesota Power
(www.minnesotapower.com/energy_tips)
• Ottertail Power Company
(www.otpco.com/asp/energywizard.asp)
• Alliant Energy
(www.alliantenergy.com)
Center for Energy and Environment (CEE). CEE is a
nonprofit Minneapolis-based organization with a
broad expertise in energy efficiency. CEE has
provided energy, environmental and housing
rehabilitation services to utilities, private
corporations, neighborhood organizations,
municipalities and public agencies for over 18
years. These services include financing, building
audits, technical research, program design and
delivery and evaluations.
Contact: Keith Butcher, Engineer, 612-335-5890,
(www.mncee.org)
St. Paul Neighborhood Energy Consortium (NEC).
The Neighborhood Energy Consortium is a non-
profit organization involved with many aspects of
energy efficiency. It offers an energy audit program,
an insulation program, custom home energy
analyses, and community education. They also run
an innovative car-share program.
Contact: Jimmie Sparks, Energy Program Manager,
612-221-4462 ext. 123, [email protected]
(www.spnec.org)

W I N D B A S I C S
Many people still think of wind power as the
old farm windmills or the small wind spinners
that help to power cabins or farm sites. Wind
technology has made great strides in the past
20 years, however, and today wind is the fastest
growing source of electricity in the world. The
technology has developed to the point that
wind is cost-competitive with other generation
sources. The fuel is free, and environmental
impacts are minimal. In the spring of 2003,
Minnesota had an installed capacity of about
335 megawatts (MW), enough to power about
110,000 homes, or 1% of the total electricity
used in the state.2
Utility-scale wind in Minnesota has been
developed in response to state public policy.
The first utility-scale wind projects on the
Buffalo Ridge were developed in 1995 to fulfill
a legislative requirement that Xcel Energy
develop 425 megawatts of wind energy in
exchange for additional nuclear waste storage
at their Prairie Island nuclear plant. The
Minnesota Public Utilities Commission has
since added an additional wind requirement,
for a total of 825 MW. In 2001, the Minnesota
legislature required all utilities to make a “good
faith effort” to supply 10% of their electricity
from renewable sources by 2015 and required
all utilities to offer customers a choice of green
power3. Most of the green electricity programs
use 100% wind power that can be bought in
100 kWh increments for between 2-3 cents
more per kWh.
C H A P T E R 4 Wind
MINNESOTA IS ONE OF THE WINDIEST STATES in the nation, according to
the Department of Energy. Wind power could theoretically generate many
times more electricity than currently used in the state1. In 2003, Minnesota
was fourth in the nation in wind power development, with only California,
Texas and Iowa having built more wind turbines. Most of the wind
development to date is on the very windy Buffalo Ridge in Southwestern
Minnesota. There are many other promising wind sites in the state, with high
elevations and minimal obstructions, many across all of southern Minnesota.
Wind turbines installed in Minnesota in 2002
were as large as 1.5 MW each with capacity
factors of up to 40 percent. To put these
turbines in perspective, each of the three
blades weighs in excess of 12 tons and rotates
at 20 revolutions-per-minute (compared to
1,000 rpms for a small, home-sized wind tur-
bine and 4,000 rpms for a typical car engine at
cruising speed). The towers are 200 feet tall or
taller and can power over 650 average
Minnesota homes each year.
W I N D D E V E L O P M E N T
Wind developers, building large projects of
tens or even hundreds of wind turbines, are
developing most of the state’s wind projects.
They are selling the electricity to Xcel Energy,
Great River Energy and other utilities. Wind
developers usually lease land from
landowners, paying as much as $5,000 per
turbine per year. Based on typical turbine
spacing and size, harvesting the wind can
increase annual farm income by $70 per acre.
Municipal and cooperative utilities have built
smaller projects of two or three turbines each.
In addition, several schools have built wind
turbines, which offset some of the building’s
electricity use and educate students and the
community at large.
Wind turbines convert
the kinetic energy in
wind to mechanical
power that runs a
generator to produce
electricity. Wind turns
the blades, which spins
a shaft connected to a
generator that makes
electricity. Major
components include
the rotor, nacelle,
tower, and foundation.
The rotor is at the
center of the spinning
part of the turbine
and turns the electric
generator in the
nacelle. Large turbines
are roughly 230 feet
tall, where the winds
are stronger and less
turbulent.

F A R M E R O W N E D W I N D
In Denmark, much of the wind development is
owned by farmer-owned cooperatives. This is
an intriguing idea in Minnesota as well, and
many are interested in the idea that farmers
can develop and own wind projects, “harvesting
the wind” on their own land. Locally-owned
wind projects are appealing because they keep
more of the revenue from the projects in the
community. There are now several groups of
farmers with small projects and a couple of
models for farmer-owned wind.
Farmer-owned wind projects have all of the
same elements of any other wind project, and
so must consider a number of different factors.
One of the most important is the wind
potential at the site. Second, the power
purchase agreement defines the price and
terms from the utility purchasing the electricity.
The design of the project includes the type of
turbine, tower and installation. Inter-
connection and transmission access are
another set of prime considerations. Most
wind projects require some level of permitting.
2 2 W I N D Clean Energy Resource Teams Manual
Wind is cost-
competitive with
other generation
sources. The fuel is
free, and
environmental
impacts are
minimal.
Legal structure, ownership, and financing are
final considerations. Farmers developing wind
work with lawyers, accountants, wind turbine
manufacturers and other experts to put all of
the elements of a project in place.
The farmer-owned wind projects in Minnesota
are relatively new and much of the information
about legal and ownership structures is
proprietary. However, there are some resources
available for farmers interested in developing
projects and many consultants ready to help.
Specific resource information is detailed at the
end of the chapter.
A S S E S S I N G W I N D P O T E N T I A L
There are a few basic things to think about
when considering whether a community wind
project is viable.
1. How strong are the winds in the area? To
begin, generally assess the wind speed of the
area by looking at the Minnesota Department
of Commerce wind maps of Minnesota. The
Wind Resource Assessment Program has
gathered wind speed and direction data
collected over more than 10 years of monitoring
from a wide network of data points.4
Wind speed meters/second
Source: Minnesota Department of Commerce
Minnesota’s wind resource bywind speed at 70 meters5
0 – 4.80
4.80 – 5.60
5.60 – 5.87
5.87 – 6.13
6.13 – 6.41
6.41 – 6.61
6.61 – 6.81
6.81 - 7.01
7.01 – 7.17
7.17 – 7.33
7.33 – 7.51
7.51 – 7.66
7.66 – 8.01
8.01 – 8.25
8.25 – 8.41

3. Is your site higher than its surroundings
(for 1 to 2 miles) or are you located in a
valley?
• If you are located in a valley, wind is not a
good option.
• If you are located on a prominent point or
ridge, wind may be an option.
4.Will you be able to install a wind tower
a minimum of 500 feet from any road or
structure? There is a required 500-foot
setback distance for facilities with 5 MW or
greater capacity. Always check local zoning
ordinances for siting specifications.
5. Are tall towers allowed in your
neighborhood or rural area?
Ideal wind sites are characterized by Class 4 or
5 winds or better, but wind projects can still be
viable on Class 3 wind sites. If the site is
characterized by Class 2 winds or below, wind
is probably not a good option.
2. Do trees or buildings surround the site? If
obstacles such as trees and buildings surround
your proposed site, wind may not be your best
option, but consider:
• If the wind blows primarily from the north
and you have buildings to the south, it may
not be as much of a problem.
• If the wind blows from the north and you
have forest to your north, then wind may not
hold much electrical generating promise.
Clean Energy Resource Teams Manual W I N D 2 3
Improves the environment
Works well with agriculture
Helps with reliabilityconcerns
Recycles waste materialsand waste heat
Offers community economic development
Improves energy independence, local control, and energy security
Promotes learning aboutenergy
I N S E P T E M B E R 2 0 0 0 , T H E
W O R T H I N G T O N P U B L I C
U T I L I T I E S assembled a task forceof citizens to investigate the merit
of wind power in Worthington.Windustry, a project affiliated with the non-profit Institute for Agriculture and Trade Policy,funded the effort through a grant from theMinnesota Department of Commerce.Investigation results were very positive, soWorthington Public Utilities joined with theirpublic power agency, Missouri River EnergyServices, and Wisconsin Public Power Inc., another power agency, to install four new 900kW wind turbines. Worthington Public Utilities’two partners each own two of the turbines,allowing both to qualify for the MinnesotaRenewable Energy Production Incentive for projects under 2 MW.
Energy generated by the wind turbines is fedinto the power grid for the local communityand the member cities of Missouri River EnergyServices and Wisconsin Public Power, Inc.Worthington’s electric customers can purchasethis renewable energy in 100 kWh blocks for anextra $2.00/month (or 2 cents/kWh).
Worthington has found strong community support, strong government staff support, andbroad community interest in theproject. Worthington Public Utilitieshopes to further encourage thisinterest by engaging the surrounding community throughopen houses that will educate citizens about how wind powerworks, and encourage them to stayinterested in and involved withwind turbine development.Worthington Public Utilities hasalready set aside land for two additional wind turbines and plansto install them within the next fewyears.
For more information contact:
Don Habicht
Worthington Public Utilities
507-372-8680
★
C A S E S T U D Y:
Worthington Public Utilities
Construction of
Worthington wind
turbine
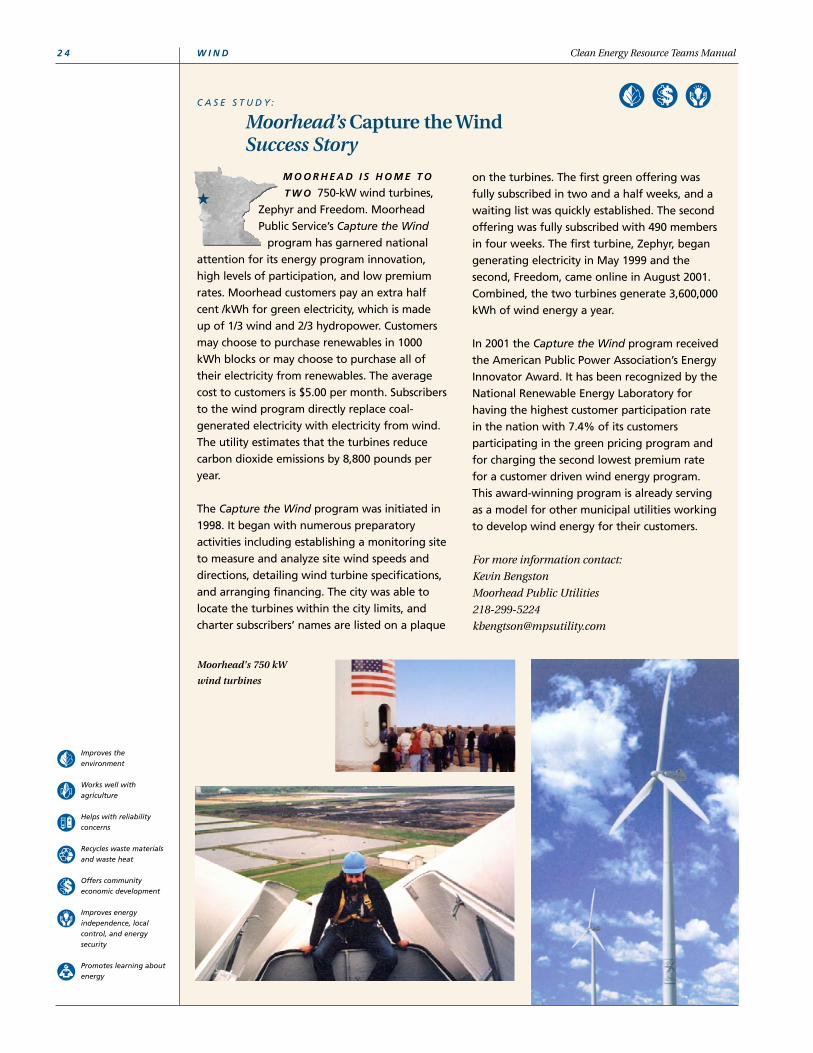
2 4 W I N D Clean Energy Resource Teams Manual
Improves the environment
Works well with agriculture
Helps with reliabilityconcerns
Recycles waste materialsand waste heat
Offers community economic development
Improves energy independence, local control, and energy security
Promotes learning aboutenergy
M O O R H E A D I S H O M E T O
T W O 750-kW wind turbines,Zephyr and Freedom. MoorheadPublic Service’s Capture the Wind
program has garnered nationalattention for its energy program innovation,high levels of participation, and low premiumrates. Moorhead customers pay an extra halfcent /kWh for green electricity, which is madeup of 1/3 wind and 2/3 hydropower. Customersmay choose to purchase renewables in 1000kWh blocks or may choose to purchase all oftheir electricity from renewables. The averagecost to customers is $5.00 per month. Subscribersto the wind program directly replace coal-generated electricity with electricity from wind.The utility estimates that the turbines reducecarbon dioxide emissions by 8,800 pounds peryear.
The Capture the Wind program was initiated in1998. It began with numerous preparatory activities including establishing a monitoring siteto measure and analyze site wind speeds anddirections, detailing wind turbine specifications,and arranging financing. The city was able tolocate the turbines within the city limits, andcharter subscribers’ names are listed on a plaque
on the turbines. The first green offering wasfully subscribed in two and a half weeks, and awaiting list was quickly established. The secondoffering was fully subscribed with 490 membersin four weeks. The first turbine, Zephyr, begangenerating electricity in May 1999 and the second, Freedom, came online in August 2001.Combined, the two turbines generate 3,600,000kWh of wind energy a year.
In 2001 the Capture the Wind program receivedthe American Public Power Association’s EnergyInnovator Award. It has been recognized by theNational Renewable Energy Laboratory for having the highest customer participation ratein the nation with 7.4% of its customers participating in the green pricing program andfor charging the second lowest premium ratefor a customer driven wind energy program.This award-winning program is already servingas a model for other municipal utilities workingto develop wind energy for their customers.
For more information contact:
Kevin Bengston
Moorhead Public Utilities
218-299-5224
★
C A S E S T U D Y:
Moorhead’s Capture the WindSuccess Story
Moorhead's 750 kW
wind turbines

• Monthly average wind speed (to determine
the amount of likely power generation)
• Wind Rose data (wind speed and direction
frequency data help evaluate the site and
where best to put the turbine)
• Site exposure information
• Height above ground (at what height the
measurements were taken)
• Data recovery (number of hours of valid data
vs. total possible hours – ideally 90% of total)
• Data record (year and months with
measurements)
• Site location with respect to your property
(wind speeds generally increase to the north
and west)
Clean Energy Resource Teams Manual W I N D 2 5
L A C Q U I PA R L E VA L L E Y
H I G H S C H O O L erected a 225kW wind turbine in 1997. MinnesotaDepartment of Commerce sponsored
the turbine installation followinga rigorous selection process in which Lac QuiParle Valley High School was selected as an optimal location based on wind velocity andconsistency and its rural location. The system wasdesigned to start generating electricity whenwind speeds hit 6 mph and to produce at fullcapacity at 25 mph. Since installation, the tur-bine has generated an average of 36,000 kWper month, approximately 25-30% of theamount of electricity used by the school. Thisproject has come to serve as a model for windpower generation at local schools.
Of course, beyond the benefits of green power,the project had to be financially viable.Installation of the turbine cost $248,907, andthe school received funding via a $60,000 grantand a 10-year, $188,907, interest free loan fromthe Department of Commerce. Lac Qui ParleValley School expects to have a 10-year pay backbased on electricity cost savings, sales of excesselectricity, and government production payments.Since the turbine provides roughly one-third of
the schools electricity needs, it has substantiallyreduced the annual electric bill (down from$80,000 to $60,000). In addition, electricity produced during non-peak schoolhours, such as nights and weekends,is sold to Ottertail Power Companyat a rate of approximately 1.5 centsper kilowatt. This too has generatedextra funds for the school. Lastly,the school receives payments fromthe state for each kilowatt sold (1.5cents) and payment from the federal government for each kilowatt generated (approximately1.5 cents).
Besides supplementing the school’senergy needs, the wind turbine isused as an education and researchtool. Students at Lac Qui ParleValley High School have gathered informationfrom the turbine for use in their economics,physics, and environmental class discussions.
For more information contact:
Robert Munsterman
Superintendent of Schools
320-752-4200
★
C A S E S T U D Y:
Lac Qui Parle Valley School:Wind and Schools Combine
6. Are you located near an airport? FAA regu-
lations stipulate minimum distances from
airport runways for structures of various
heights that apply to wind towers, especially
those over 200 feet tall.
7. Data from Wind Monitoring 6 It is usually
prudent to monitor actual wind speeds for six
months to a year using an anemometer before
investing in a wind project. Anemometers are
sometimes mounted on existing towers or on a
newly erected tower. The following data is
needed to fully evaluate the feasibility and
costs of a wind project.
• Site elevation (higher is better)
Wind turbine at Lac
Qui Parle Valley school

2 6 W I N D Clean Energy Resource Teams Manual
Improves the environment
Works well with agriculture
Helps with reliabilityconcerns
Recycles waste materialsand waste heat
Offers community economic development
Improves energy independence, local control, and energy security
Promotes learning aboutenergy
I N F A L L 2 0 0 1 , T H E
P I P E S T O N E - J A S P E R
S C H O O L D I S T R I C T was awardedone of Xcel Energy’s Renewable
Development Fund grants to construct a wind turbine. Jack Keers, a PipestoneCounty Commissioner, and Dan Juhl, a localwind developer, had urged the Pipestone-JasperSchool District to apply for a grant to install awind turbine at the new school to supply partof the school’s electricity needs. The District wasideally located and seemed like a perfect fit fora school wind turbine project. The school wouldbe built on a very windy Buffalo Ridge location,funding for the new school was secure, and construction was significantly under budget.With the Renewable Development Fund grantin place, the District must contribute $150,000toward the turbine construction and XcelEnergy contributes the remaining $850,000.
The new school property is a 55-acre piece ofland on the edge of town, and the wind turbinewill be located on the northwest portion of theproperty to take advantage of the prevailingwinds. The school will install a 900 kW wind turbine that is expected to power all of theschools basic needs and then some. The Districtanticipates selling the excess energy back toSioux Valley Southwestern Electric, which shouldallow them to payback their initial investmentwithin 6 years and will also allow the school toraise a bit of money after the payback period.
In addition to the economic incentives, JerryHorgen, Superintendent of Pipestone-JasperSchool District, also sees “great benefit in having the school set an example for the community by using renewable energy”. As aneducational institution, the District has a majorrole in educating and bringing the communitytogether. The wind turbine project provides anideal educational project for students of allages, and will be incorporated into learningactivities within the science department. Dr.Horgen says that the wind turbines offer a greatopportunity for “furthering environmentalawareness in our kids.” As of summer 2002, theproject is moving along right on target. Thenew building is expected to open by January2003 and wind tower construction is anticipatedto begin in April 2003 and should be completedby July or August 2003.
For more information contact:
Jerry Horgen
Superintendent of Schools
507-825-5861 or
Dan Juhl
DanMar and Associates
507-562-1280
★
C A S E S T U D Y:
Pipestone-Jasper School District:Wind Energy and Education

W I N D P R O J E C T C O S T S
The amount of energy in the wind is a function
of wind speed. The energy in wind increases
with the cube of wind speed. This means that if
you double the wind speed, the energy
production increases eight times. In addition,
wind speed varies with height above the
ground, and generally speaking increases with
height. How the wind speed varies with height
depends on the terrain, season, time of day,
and other meteorological factors.
The cost of wind energy relates directly to the
average wind speed at the site and the size of
the wind farm. For example, the turbine in
Moorhead produces just under 1.5 million
kWh/yr with a 14 mph wind, while the same
turbine in southwestern Minnesota produces
2.1 million kWh/yr with a 16 mph wind – more
than 50% more. Construction of commercial
scale wind energy plants currently costs about
$800 to $1,000 per kilowatt of nameplate
capacity. From a production standpoint, large-
scale wind is now cost-competitive with
conventional electric generation and costs are
projected to decline further by 2006. Xcel
Energy wind contracts have achieved levels of
3 to 4 cents/kWh.
A power purchase agreement with a utility is
necessary in almost every case. Even projects
built to supply electricity to one building or a
campus facility are usually interconnected to
the utility grid. Because of this, the utility
should be contacted very early in the project
planning process. Utilities are becoming more
interested in purchasing wind energy because
of the state requirements for green electricity.
Xcel Energy has set a standard small wind
tariff, which includes a standard contract and
interconnection agreement and a price of
$0.033/kWh for wind projects under 2 MW. The
Minnesota Public Utilities Commission is in
the process of examining tariffs for distributed
generation for other utilities, which might
include small wind projects.
Clean Energy Resource Teams Manual W I N D 2 7
O T H E R P R O J E C T E L E M E N T S
Other project elements include electric
interconnection and transmission, project
design, permitting, ownership, financing, and
operations and maintenance. All of these will
require technical expertise. Depending on the
size and complexity of the project, one or more
consultants will likely be needed. Each and
every one of these areas is critical to project
success. These elements are discussed in more
depth in Chapter 12.
Interconnection and Transmission Projects
will be connected to the electric grid and
utilities understandably have requirements
related to standardization and safety.
Transmission will be necessary if the project is
designed to deliver power to a distant user. The
state’s transmission system has not been
upgraded in recent years and is constrained in
many parts of the state. Even small projects
may need to go through a review of transmis-
sion availability.
Project Design and Permitting Project design
includes consideration of which size and type
of turbine is best suited to the proposed site.
The turbines from different manufacturers
each have slightly different designs and
features. There are different types and sizes of
towers and different types of foundations.
Road access to the turbine for operation and
maintenance is another consideration.
Project elements
include electric
interconnection and
transmission, project
design, permitting,
ownership, financing,
and operations and
maintenance.

2 8 W I N D Clean Energy Resource Teams Manual
Improves the environment
Works well with agriculture
Helps with reliabilityconcerns
Recycles waste materialsand waste heat
Offers community economic development
Improves energy independence, local control, and energy security
Promotes learning aboutenergy
I T T O O K A L M O S T T W O
Y E A R S , but in the fall of 2002one of the first farmer-owned windprojects in Minnesota went on line
in Rock County. “We wanted afarmer-owned project that would bring economic development, get farmers a return ontheir investment, and use local businesses andcontractors to do the work,” said Mark Willers,a project leader and farmer from Beaver Creek,Minnesota.
After extensive research, the groupformed two limited liability companies, Minwind I andMinwind II. This maximized theirability to use tax credits and otherincentives while maintaining thecooperative principles of voluntaryand open membership, democraticmember control, and concern forthe greater community.
Sixty-six investors from the regionsnapped up all the available sharesin both companies in just 12 days.Eighty-five percent of the sharesmust be owned by farmers, leaving
the rest available for local townspeople andnon-farmers who could someday inherit shares.Each share gives the owner one vote in the company and no single person can own morethan 15 percent of the shares.
Although they coordinate closely, the two companies are governed by separate boards ofdirectors, have different groups of investors andmaintain separate financial books. Both groupsrelied heavily on expertise from consultants todevelop the actual wind projects, negotiate thepower purchase agreements, and determine thebusiness structure.
With the shares sold, the companies begandevelopment of the two 1.9 MW wind projects.Each project consists of two Micon 950 kW turbines, and all four turbines are located onthe same farm seven miles southwest ofLuverne. The group wanted to use land owned
by one of the project’s investors, and the farmchosen had the best combination of windresource and access to transmission lines.
According to Willers, the most difficult step inthe projects was negotiating a power purchaseagreement. Discussions with their rural electriccooperative proved fruitless. There were just toomany issues including interconnection requirements, cost, and the cooperative’s long-term exclusive agreement with another powersupplier. Eventually, after months of negotiation,Minwind I and II entered into a 15-year contractwith Alliant Energy, which will use the power tohelp satisfy renewable energy standards in Iowaor Wisconsin.
Finding capital for the hardware, consultantsand legal fees was easy, because farmers wereenthusiastic about investing from the verybeginning. Willers believes that it is a myth thatfarmers do not have the money to finance projects on this scale (Minwind I and II will costabout $1.6 million dollars each and will be paidoff in ten years).
Now that the current two 1.9 MW projects areoperational, Willers says that there is so muchinterest from area farmers and other potentialinvestors that they have already begun research-ing other potential sites and the possibility ofdoing much larger projects. Willers hopesexpansion will allow many more farmers to participate in this innovative model for winddevelopment. “This model is a way for farmersto take advantage of economies of scale indeveloping wind, just like the big companiesdo,” said Willers. It’s a model that can be usedall over Minnesota.
For more information contact:
Mark Willers
507-962-3360
*Condensed from:Minwind I & II: Innovative farmer-owned wind projects,Windustry Newsletter, Fall 2002.www.windustry.org/newsletter/2002FallNews.htm
★
C A S E S T U D Y:
Minwind I & II: Innovative Farmer-Owned Wind Projects*
Mark Willers [left] and
Tom Arends [right]

Clean Energy Resource Teams Manual W I N D 2 9
Almost every project will require some level of
permitting. Larger projects are permitted by
the state Environmental Project Board. Smaller
projects will have to meet local siting
requirements.
Ownership and Financing Financing is a
critical element of any wind project since the
bulk of the costs are up-front capital costs. The
ownership structure and financing costs can
be interrelated issues since the ownership may
impact the financing available. Municipal, tax-
free financing will be lower cost, for instance,
than a bank loan available to a private owner.
The federal Renewable Energy Production
Incentive tax credit is a critical element of
financing all wind projects.
Operations and Maintenance Someone will
need to operate and maintain the wind project
over time. Even though modern wind turbines
are largely trouble free, arrangements for the
occasional repairs and regular required
maintenance would impact project costs.
S M A L L - S C A L E W I N D P R O J E C T S
There are economies of scale in wind develop-
ment, and in general, as might be expected,
smaller wind projects have higher costs. There
are, however, numerous programs to help
improve the economics of small projects.
Small-scale wind incentives for installations of
2 MW or less and programs offering special
financial assistance for these small-scale wind
installations are summarized on the tables
provided in Appendix B. The Minnesota
Renewable Energy Production Incentive is key
to the financial viability of these projects, along
with both property and sales tax exemptions.
Wind installations of 40 kW or less, home or
farm systems, qualify for net metering. Net
metering allows owners of these very small
wind machines to consume electricity from the
grid when they are not producing power, and
sell electricity back to the grid at retail price
when they are producing power.
E N D N O T E S1An Assessment of the Available Windy Land Area andWind Energy Potential in the Contiguous United States,Pacific Northwest Laboratory, 1991.
2Minnesota Department of Commerce, Minnesota EnergyPlanning Report 2001, St. Paul, Minnesota: MN DOC,January 2002.
3Renewable and High-Efficiency Energy Rate Options,Minnesota Statutes 2002, Section 216B.169 (2002).
4Minnesota Department of Commerce, Wind ResourceAnalysis Program 2002, October 2002.www.commerce.state.mn.us.
5The Department of Commerce prepared this map usingthe WindMap program, which takes into account winddata, topography, and land use characteristics. Data isaveraged over a cell area 750 meters square, and withinany one cell there could easily be features that couldincrease or decrease the results shown on the map.Regions with the greatest concentrations of monitoringsites show the most accurate results. This map shows thegeneral variation of Minnesota's wind resources andshould not be used to determine the performance of specific projects.
6Daniels, Lisa, Harvest the Wind, Sustainable ResourcesCenter, Minneapolis, MN, 1996.
P H O T O G R A P H S
page 21 – National Renewable Energy Laboratory (lower);page 22 – Minnesota Department of Commerce; page 23 –Don Habicht/Worthington Public Utilities; page 24 –Moorhead Public Service, National Renewable EnergyLaboratory; page 25 – Lac Qui Parle Valley High School;page 27 – Bruce Anderson/RENew Northfield; page 28 –Lisa Daniels/Windustry; page 29 – U.S. Department ofEnergy

3 0 W I N D Clean Energy Resource Teams Manual
H E L P F U L R E S O U R C E S F O R C O M M U N I T I E S
All web links listed here are available (and updated
if necessary) at www.mnproject.org (click on
“publications”)
Minnesota Wind Resource Analysis Program Report
– October 2002. Minnesota Department of
Commerce presents data collected from 1995
through 2001. The Minnesota Wind Resource
Assessment Program (MNWRAP) is an ongoing
project sponsored by the Minnesota State Energy
Office within the Department of Commerce.
(www.commerce.state.mn.us)
Energy: Modern Technology – Wind. Minnesota
Department of Commerce website including
several wind maps that highlight wind potential
around the state.
(www.commerce.state.mn.us)
Energy Information Center, Minnesota Department
of Commerce, Energy Division. Additional informa-
tion on wind, conservation and other renewables.
email: [email protected], 651-296-5175 or
toll free at 800-657-3710.
(www.commerce.state.mn.us)
American Wind Energy Association. Web page with
fact sheets and information about wind energy.
(www.awea.org)
Also available on this site are a list of small turbine
manufacturers
(www.awea.org/faq/smsyslst.html).
A summary of programs, incentives and resources
available regarding small-wind project
development in Minnesota is available at:
(www.awea.org/smallwind/minnesota_sw.html)
Great Plains contact: John Dunlop,
10 Steps in Building a Wind Farm. American Wind
Energy Association. Outlines the items one should
consider before moving forward with a wind
project. This document also references other
websites that list wind developers as well as wind
consultants.
(www.awea.org/pubs/factsheets/10stwf_fs.PDF)
Windustry. A program providing information and
education about small-scale and farmer-owned
wind development. Web page includes information
on financing and other aspects of farmer-owned
projects, including a spreadsheet for assessing
costs, production, and incentive numbers.
(www.windustry.org/calculator/default.htm)
Windustry contact: Sarah Johnson 800-946-3640 or
612-870-3461, [email protected]
(www.windustry.org)
Do It Yourself Small Wind Project Manual. enXco
Midwest Office, 2003. A manual detailing the steps
for developing a small wind project, including lists
of consultants and suppliers. Call or write to
request a free copy of the manual. enXco, 625 8th
Avenue SE, Minneapolis, MN, 55414, 612-331-1486,
866-321-WIND
(www.enxco.com)
Farmers Guide to Farming Wind Energy as a Cash
Crop. Dan Juhl and Harvey Washerman, 2002. A
comprehensive guide for farmers interested in
installing their own wind turbines. Includes all of
the necessary documents and pro-formas for
installing a system. Dan Juhl, [email protected],
507-562-1280; fax: 507-562-1279
Landowner’s Guide to Wind Energy In the Upper
Midwest. Nancy Lange and William Grant, Isaac
Walton League of America, 1995. Midwest Office
651-649-1446.
Assessing Wind Resources: a Guide for Landowners,
Project Developers and Power Suppliers. Michael
Tennis, Steven Clemmer, and Jonathan Howland,
Union of Concerned Scientists. An easy to
understand and use summary of how to assess the
wind potential.
(www.ucsusa.org/index.html).
Apples and Oranges. Mick Sagrillo, HomePower
Magazine, detailed comparisons of various small
wind turbines (from 50 watts to 20 kW).
(www.homepower.com/files/apples.pdf)
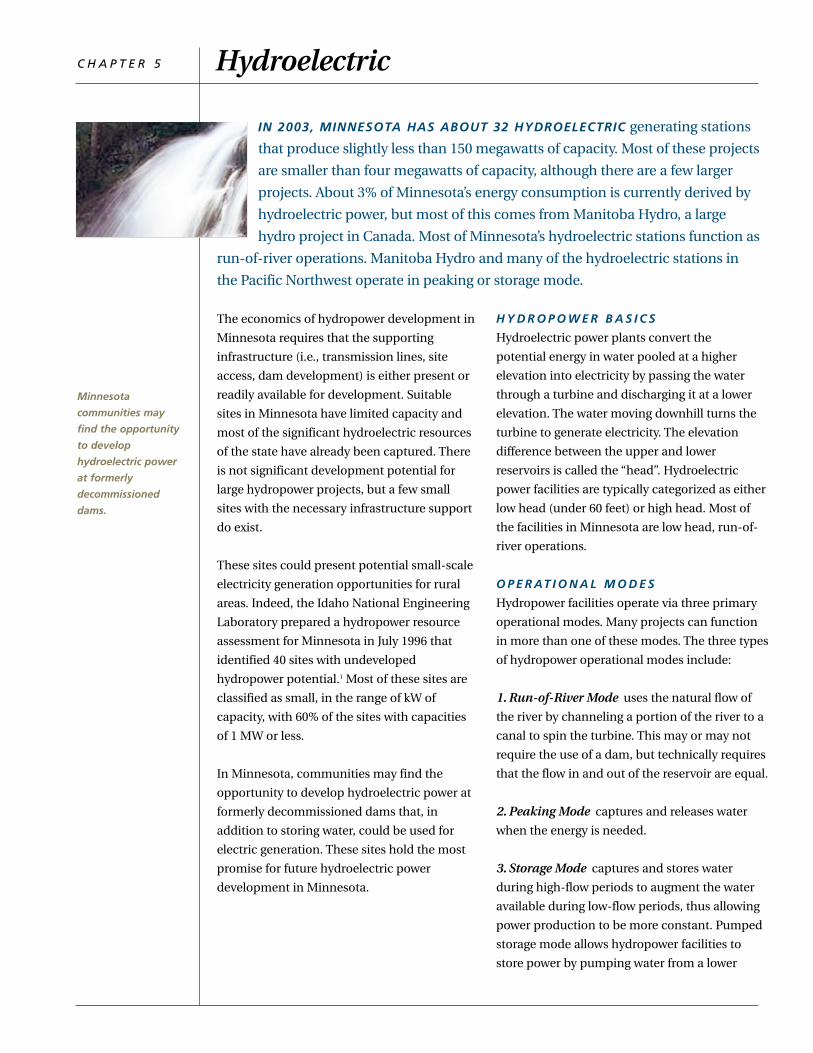
C H A P T E R 5 Hydroelectric
IN 2003, MINNESOTA HAS ABOUT 32 HYDROELECTRIC generating stations
that produce slightly less than 150 megawatts of capacity. Most of these projects
are smaller than four megawatts of capacity, although there are a few larger
projects. About 3% of Minnesota’s energy consumption is currently derived by
hydroelectric power, but most of this comes from Manitoba Hydro, a large
hydro project in Canada. Most of Minnesota’s hydroelectric stations function as
run-of-river operations. Manitoba Hydro and many of the hydroelectric stations in
the Pacific Northwest operate in peaking or storage mode.
Minnesota
communities may
find the opportunity
to develop
hydroelectric power
at formerly
decommissioned
dams.
The economics of hydropower development in
Minnesota requires that the supporting
infrastructure (i.e., transmission lines, site
access, dam development) is either present or
readily available for development. Suitable
sites in Minnesota have limited capacity and
most of the significant hydroelectric resources
of the state have already been captured. There
is not significant development potential for
large hydropower projects, but a few small
sites with the necessary infrastructure support
do exist.
These sites could present potential small-scale
electricity generation opportunities for rural
areas. Indeed, the Idaho National Engineering
Laboratory prepared a hydropower resource
assessment for Minnesota in July 1996 that
identified 40 sites with undeveloped
hydropower potential.1 Most of these sites are
classified as small, in the range of kW of
capacity, with 60% of the sites with capacities
of 1 MW or less.
In Minnesota, communities may find the
opportunity to develop hydroelectric power at
formerly decommissioned dams that, in
addition to storing water, could be used for
electric generation. These sites hold the most
promise for future hydroelectric power
development in Minnesota.
H Y D R O P O W E R B A S I C S
Hydroelectric power plants convert the
potential energy in water pooled at a higher
elevation into electricity by passing the water
through a turbine and discharging it at a lower
elevation. The water moving downhill turns the
turbine to generate electricity. The elevation
difference between the upper and lower
reservoirs is called the “head”. Hydroelectric
power facilities are typically categorized as either
low head (under 60 feet) or high head. Most of
the facilities in Minnesota are low head, run-of-
river operations.
O P E R AT I O N A L M O D E S
Hydropower facilities operate via three primary
operational modes. Many projects can function
in more than one of these modes. The three types
of hydropower operational modes include:
1. Run-of-River Mode uses the natural flow of
the river by channeling a portion of the river to a
canal to spin the turbine. This may or may not
require the use of a dam, but technically requires
that the flow in and out of the reservoir are equal.
2. Peaking Mode captures and releases water
when the energy is needed.
3. Storage Mode captures and stores water
during high-flow periods to augment the water
available during low-flow periods, thus allowing
power production to be more constant. Pumped
storage mode allows hydropower facilities to
store power by pumping water from a lower

3 2 H Y D R O E L E C T R I C Clean Energy Resource Teams Manual
Improves the environment
Works well with agriculture
Helps with reliabilityconcerns
Recycles waste materialsand waste heat
Offers community economic development
Improves energy independence, local control, and energy security
Promotes learning aboutenergy
T H I S C A S E S T U D Y I S A
G R E AT E X A M P L E of puttinga decommissioned resource back touse. Construction of the Byllesby
Dam was completed in 1911, andit generated electricity for Northern StatesPower Company (now Xcel Energy) until 1966.In 1968, the power company transferred ownership of the dam to Goodhue and DakotaCounties. The dam remained decommissioneduntil the mid-1980’s when the two countiesjointly decided to put it back into operation. In1987, North American Hydro, a private firm,began to refit the dam for hydro production.The Byllesby Dam now provides 2.6 MW ofrenewable energy via three generators and a56-foot head.
Dakota County manages the dam, but the generation itself, along with the paperwork andoperation and maintenance details, are contracted out to North American Hydro. NorthAmerican Hydro also provided the upfront capital to restart the project. The two counties
and North American Hydro share the revenuesfrom the electricity generation, which are generally put back toward dam maintenancecosts. Although it does not generate a profit forthe counties, it does help them cover their costs,while putting local, renewable energy back intothe grid.
For more information contact:
Bruce Blair
Dakota County Park Service
651-438-4960
★
C A S E S T U D Y:
Byllesby Dam: Hydroelectric Power Revisited
Byllesby Dam on the
Cannon River

Clean Energy Resource Teams Manual H Y D R O E L E C T R I C 3 3
reservoir to an upper reservoir during periods
of low-energy demand. During periods of high-
energy demand the water can be re-released to
the lower reservoir to spin the turbines and
create electricity.
C U R R E N T T E C H N O L O G Y S TAT U S
Hydroelectric power generation is a well-
developed technology and therefore is generally
very reliable except during periods of sustained
drought or in the presence of ice. Both limit
the availability of water to turn the turbines.
Hydroelectric plants boast an overall efficiency
of about 80 percent, significantly higher than
that of either coal or natural gas. The capital
costs for constructing a hydropower facility are
estimated to be in the range of $1,700 to
$2,300 per kilowatt (1996 dollars). Operating
costs of hydroelectric plants are often low in
comparison to those of fossil fuel plants
because the flowing river water generally has
no direct cost associated with its use.
E N V I R O N M E N TA L A N D
S O C I A L C O N C E R N S
Large hydroelectric projects can have severe
impacts on surrounding communities and on
ecosystems. Some of the impacts can include
complete dislocation of communities and
flooding of surrounding villages or restriction
of fish movement and local extinctions.
Smaller scale projects, like those possible
within Minnesota, tend to have fewer impacts.
To address the potential environmental and
social concerns, it is imperative that project
developers do an environmental analysis on
their site that includes an analysis of the
potential impact to flora and fauna. For
projects of less than 5 MW, a formal
environmental assessment is not required, but
the developer should address potential
environmental issues to ensure community
buy-in.
E N D N O T E S1Francfort, James. U.S. Hydropower Resource Assessmentfor Minnesota. Idaho National Engineering Laboratory,Boise, Idaho, July 1996. This report can be accessed from:http://hydropower.inel.gov/state/mn/mn.pdf.
P H O T O G R A P H S
page 31 – Eastern Waterfall Guide; page 32 – Bruce Blair/Dakota County Park Service; page 33 – JustEnergy; page 34– Park Rapids Enterprise Newspaper (left), LuAnn Hurd-Lof/Park Rapids Enterprise Newspaper (right); page 35 –Minnesota Historical Society
As a result of trying to
control water levels in
Manitoba for maximum
power generation,
flooding occurs causing
debris to line the shore
and large amounts of
sediment to be deposited
in once clear waters.

Improves the environment
Works well with agriculture
Helps with reliabilityconcerns
Recycles waste materialsand waste heat
Offers community economic development
Improves energy independence, local control, and energy security
Promotes learning aboutenergy
3 4 H Y D R O E L E C T R I C Clean Energy Resource Teams Manual
A S T U D Y O F U S I N G T H E
F I S H H O O K R I V E R D A M inPark Rapids to again generate electricity began in 2000 as part of a
University of Minnesota CentralRegional Sustainable Development Partnershipenergy project on alternative community energy generation possibilities. The study looked atlocal renewable energy generation at five community sites, including the Fish Hook Riverdam. The dam was originally built with ahydropower facility in 1909 but was
decommissioned in 1943, and has sat unusedever since.
Park Rapids saw a great opportunityat their underutilized dam. After all,
they had both the dam and the plantalready there. While the upfront capital
costs would be high to install the new turbinesthat would be needed, the project would generate renewable energy for the communityand would reduce the amount of coal neededto generate electricity in Park Rapids.Additionally, the project could draw upon a1982 feasibility study that had evaluated thepotential of reactivating the site but never came to fruition.
In nearly every sense, the project seemed wellaligned. If successful, the project could serve asan example to other communities around thestate with inactive power facilities at existingdams. Unfortunately, plans to reactivate thepower facility on Fish Hook River were droppedin April 2002. The Park Rapids City Councildecided that the expected generation of only100 kWh/hour meant that the project was noteconomically feasible. They believed that atleast 200 kWh/hour would have been necessaryfor the project to move forward.
In the end, it appears that delayed researchfindings may have stalled the project too longand swayed council members to pass up anopportunity without ever getting the full story.Project supporters are now considering applyingfor an Xcel Energy Renewable DevelopmentFund grant that could provide partial fundingand help make the project a reality.
For more information contact:
Paul Imbertson
University of Minnesota
612-625-6529
C A S E S T U D Y:
Park Rapids: A Study of Options to Retrofit a Former Structure
★

Clean Energy Resource Teams Manual H Y D R O E L E C T R I C 3 5
C R O W N H Y D R O received$5.1 million through Xcel's
Renewable Development Fund in2002 to renovate for hydropower
production a section of theMinneapolis Mill Ruins located at the west endof St. Anthony Falls. The project will be a run ofthe river plant, consisting of a reconstructedupper canal and intake tunnel, a powerhouseroom containing two Kaplan turbines with atotal generating capacity of 3400 kW, an existing tailrace tunnel as well as a reconstructedtailrace tunnel, and an underground transmis-sion line. The project will also improve a sectionof Minneapolis Park Board land with a newbridge, a boardwalk, landscaping, and publicinformation structures featuring the hydro plantand history of the area.
As of January 2003 Crown achieved three majormilestones: a completed 20 year power purchaseagreement with Xcel, which awaits expectedPUC approval this March; a settlement agreement with the Minnesota Department ofNatural Resources for a fish restitution plan; andan agreement with the Federal EnergyRegulatory Commission (FERC) for a culturalresources management plan affecting the historical site. A lease agreement withMinneapolis Park Board is under active negotiation. FERC intends to issue an order forconstruction in April, 2003, and Crown nowexpects to begin construction in June with start up projected for April, 2004.
Crown will take advantage of an existinguntapped resource to provide additional capacity to the surrounding metro-area and provide clean, renewable energy to a highlypopulated, energy demanding community.
For more information contact:
Tom Griffin
Crown Hydro
612-825-1043
C A S E S T U D Y:
Crown Hydro: Renewable Energy for Metro Markets
Crown Hydro facility will
be located on the east end
of St. Anthony Falls
Pillsbury Mill and St.
Anthony Falls, circa 1897
★

3 6 H Y D R O E L E C T R I C Clean Energy Resource Teams Manual
H E L P F U L R E S O U R C E S F O R C O M M U N I T I E S
All web links listed here are available (and updated
if necessary) at www.mnproject.org (click on
“publications”)
Office of Energy Efficiency and Renewable Energy:
Hydropower Topics and Hydropower Basics. Sites
include basic hydropower information and
descriptions of types of turbines.
(www.eren.doe.gov/RE/hydropower) and
(www.eren.doe.gov/RE/hydro_basics.html)
U.S. Hydropower Resource Assessment for
Minnesota, James E. Francfort, Idaho National
Engineering Laboratory for the US DOE, July 1996.
Outlines sites available in Minnesota with
undeveloped hydroelectric potential by dam status
group and by river basin.
(http://hydropower.inel.gov/state/mn/mn.pdf)
Minnesota Department of Commerce 2001 Energy
Planning Report. Includes basic information
regarding hydropower projects in Minnesota and
the potential associated environmental and social
costs.
(www.commerce.state.mn.us)
St. Anthony Falls Laboratory. Provides information,
research and publications available from this
University of Minnesota research laboratory. John
Thene, Associate Director, Contract Research and
Engineering, 612-627-4609, email
(www1.umn.edu/safl/index.html)
Minnesota Department of Natural Resources
Hydropower webpage. Provides links to pertinent
licensing organizations, information about
potential environmental impacts, and listings of
Minnesota’s hydropower facilities.
(www.dnr.state.mn.us/waters/surfacewater_section/
stream_hydro/hydropower.html)
Federal Energy Regulatory Commission:
Hydropower. Outlines the preliminary and final
permitting requirements as well as permit
conditions reviewed (including environmental and
safety issues) and parties that must be involved in
any permitting process for a hydroelectric facility.
(www.ferc.gov/hydro/docs/waterpwr.htm)
University of Minnesota, Department of Civil
Engineering. John S. Gulliver, author of Hydropower
Engineering Handbook, has worked on the
feasibility of small hydropower, on hydraulic
design, hydrologic studies, and water quality
impacts of hydropower. 612-625-4080, email:

C H A P T E R 6 Biomass
BIOMASS IS ANY ORGANIC MATERIAL not derived from fossil fuels that can
be converted to a fuel useful for generating electricity. Biomass can be waste
products, as described in the Rahr Malting Case Study below, or crops planted
expressly to produce energy (“dedicated crops”), like the poplar trees described
in the case study below. Minnesota currently has 343 MW of biomass electric
generation capacity.1 The Union of Concerned Scientists estimates that with
existing technology, biomass could provide 6,690 MW of capacity to Minnesota,2 or
well over half the state’s current needs.
Biomass could provide
6,690 MW of capacity
to Minnesota, or well
over half the state’s
current needs.
Biomass generates electricity by combustion,
which releases the stored solar energy
contained in the plant matter.3 Unlike wind or
solar, a benefit of biomass is that it is
“dispatchable” – that is, it can be turned on
and off on demand. Utilities in particular like
this feature, because it ensures that the power
is available when they need it the most.
S O U R C E S O F B I O M A S S
Also referred to as “feedstocks”, biomass for a
power plant can come from a wide variety of
sources, including the following:4
Wood Residues This refers to leftover wood
from other uses, and not wood harvested
expressly for biomass. The lumber, pulp, and
wood milling industries already extensively use
wood waste to produce power. Wood residues
can also come from forest thinnings, urban
tree trimmings, residual construction material,
demolition material, wood pallets, and other
waste.
Agricultural Residues This includes primarily
mill residues (waste from a processing plant,
like nut hulls and oat hulls) and field residues
(left in field after harvest, like corn stover and
wheat straw). The removal of field residues for
energy must be balanced with the benefit to
soil quality that residues provide.
Energy Crops These are crops that are
“dedicated” for energy production. The most
promising include woody crops like willows,
hybrid poplars, maple, and sycamore; and
herbaceous crops like switchgrass and other
prairie grasses. Often these types of energy
crops offer environmental benefits over
conventional crops, like less need for crop
inputs, habitat for wildlife and reduced erosion
and run-off.
Animal Waste Dry animal waste, primarily
from poultry, can be burned directly for heat
and power. Wet manure can be digested to
produce biogas – see more in chapter 7.
Sewage Sludge Although the solids can be
burned, a more common option for producing
energy at a sewage treatment plant is
anaerobic digestion, which produces energy
while treating the waste (see chapter 7).
Biofuels Liquid fuels like ethanol and biodiesel
are primarily used in transportation
applications, but could also be burned to
produce electricity. See more in the chapter 8.
Approximate Costs of Various Biomass Feedstocks5
Feedstock Delivered cost ($/dry ton)
Urban wood wastes <$25-$35
Wood mill residues <$25-$55
Agricultural residues <$35-$55
Hybrid poplars <$55-$70
Willows <$35-$75
Switchgrass <$35-$55
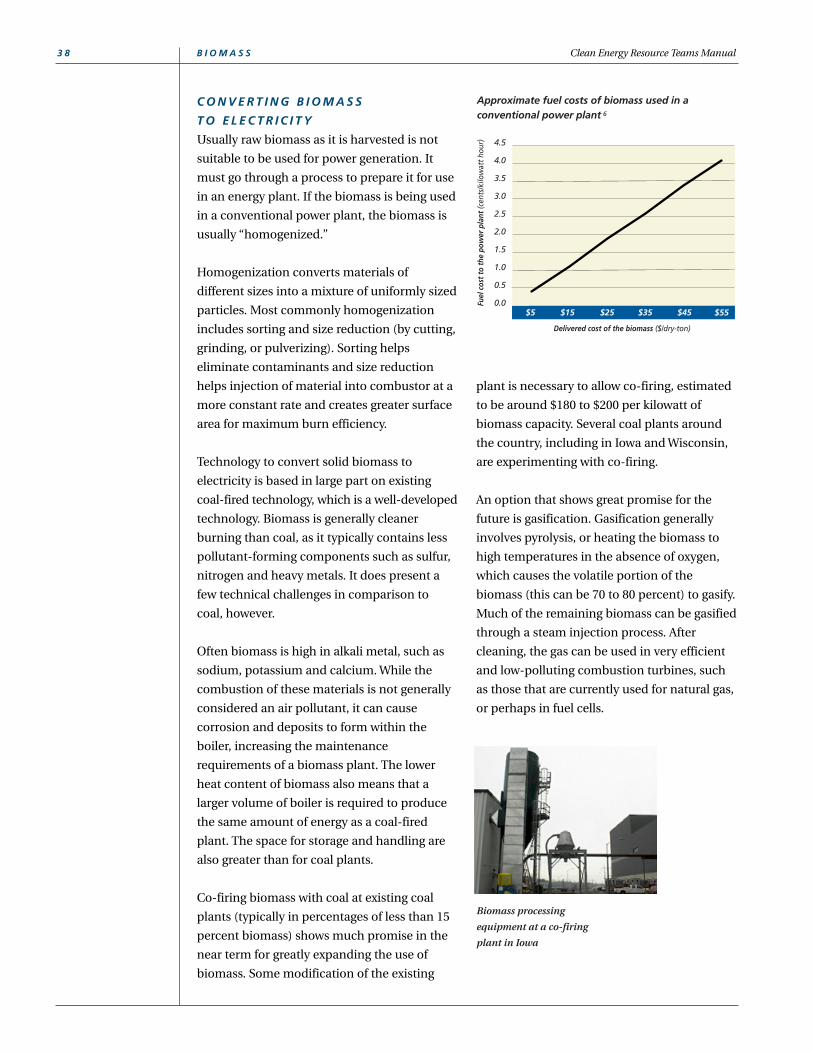
Biomass processing
equipment at a co-firing
plant in Iowa
3 8 B I O M A S S Clean Energy Resource Teams Manual
C O N V E R T I N G B I O M A S S
T O E L E C T R I C I T Y
Usually raw biomass as it is harvested is not
suitable to be used for power generation. It
must go through a process to prepare it for use
in an energy plant. If the biomass is being used
in a conventional power plant, the biomass is
usually “homogenized.”
Homogenization converts materials of
different sizes into a mixture of uniformly sized
particles. Most commonly homogenization
includes sorting and size reduction (by cutting,
grinding, or pulverizing). Sorting helps
eliminate contaminants and size reduction
helps injection of material into combustor at a
more constant rate and creates greater surface
area for maximum burn efficiency.
Technology to convert solid biomass to
electricity is based in large part on existing
coal-fired technology, which is a well-developed
technology. Biomass is generally cleaner
burning than coal, as it typically contains less
pollutant-forming components such as sulfur,
nitrogen and heavy metals. It does present a
few technical challenges in comparison to
coal, however.
Often biomass is high in alkali metal, such as
sodium, potassium and calcium. While the
combustion of these materials is not generally
considered an air pollutant, it can cause
corrosion and deposits to form within the
boiler, increasing the maintenance
requirements of a biomass plant. The lower
heat content of biomass also means that a
larger volume of boiler is required to produce
the same amount of energy as a coal-fired
plant. The space for storage and handling are
also greater than for coal plants.
Co-firing biomass with coal at existing coal
plants (typically in percentages of less than 15
percent biomass) shows much promise in the
near term for greatly expanding the use of
biomass. Some modification of the existing
plant is necessary to allow co-firing, estimated
to be around $180 to $200 per kilowatt of
biomass capacity. Several coal plants around
the country, including in Iowa and Wisconsin,
are experimenting with co-firing.
An option that shows great promise for the
future is gasification. Gasification generally
involves pyrolysis, or heating the biomass to
high temperatures in the absence of oxygen,
which causes the volatile portion of the
biomass (this can be 70 to 80 percent) to gasify.
Much of the remaining biomass can be gasified
through a steam injection process. After
cleaning, the gas can be used in very efficient
and low-polluting combustion turbines, such
as those that are currently used for natural gas,
or perhaps in fuel cells.
Approximate fuel costs of biomass used in a conventional power plant 6
Delivered cost of the biomass ($/dry-ton)
0.0
0.5
1.0
1.5
2.0
2.5
3.0
3.5
4.0
4.5
$45$35$25$15$5 $55
Fuel
cos
t to
the
pow
er p
lant
(cen
ts/k
ilow
att
hour
)

Clean Energy Resource Teams Manual B I O M A S S 3 9
Improves the environment
Works well with agriculture
Helps with reliabilityconcerns
Recycles waste materialsand waste heat
Offers community economic development
Improves energy independence, local control, and energy security
Promotes learning aboutenergy
B E G U N I N 1 9 9 4 , T H E
M I N N E S O TA W O O D
E N E R G Y S C A L E - U P P R O J E C T ,based in Alexandria, Minnesota, was
the first biomass to electrical energy research project involving hybrid poplars.The project is a partnership between theWestern Minnesota Resource, Conservation andDevelopment Council (WesMin RC&D), the OakRidge National Laboratories Biofuels FeedstockDevelopment Program, and local landowners.The project focuses on developing a biomassfeedstock. Although there are no contracts currently established to use the biomass in anenergy plant, several options are under consideration. Currently, the project consists of1,800 acres of privately owned cropland, alllocated within 50 miles of Alexandria.Landowners are supported in their efforts bycost-share agreements for maintenance and pestcontrol while the WesMin RC&D and theMinnesota Department of Natural Resourceswork with landowners to plant and maintainthe poplars as well as measure and collect treegrowth data. The Biofuels FeedstockDevelopment Program calculates the hybridpoplars annual yield. All of this data is thencombined with economic data to assess on-going feasibility of hybrid poplar projects.The Minnesota Wood Energy Scale-Up Projecthas brought together numerous stakeholders allworking to take charge of their energy futureby capitalizing on a locally grown, perennial,renewable energy resource.
For more information contact:
Dean Schmidt
320-763-3191 x 5
C A S E S T U D Y:
Minnesota Wood Energy Scale-Up Project
A tour group wanders
among tress enrolled in
the Minnesota Wood
Energy Scale Up Project.

4 0 B I O M A S S Clean Energy Resource Teams Manual
Improves the environment
Works well with agriculture
Helps with reliabilityconcerns
Recycles waste materialsand waste heat
Offers community economic development
Improves energy independence, local control, and energy security
Promotes learning aboutenergy
R A H R M A LT I N G I S A
F A M I LY- O W N E D M A LT I N G
B U S I N E S S located in Shakopee,Minnesota. As a malting facility, the
plant must have a reliable energysupply to operate its plant -- its two biggest processing costs are electricity and natural gas.Rahr Malting produces 50,000 tons of biomassannually, a low value by-product of the maltingprocess. Within 50 miles are numerous facilitiesthat could provide additional biomass by-products, as well as farms that could grow energy crops to supplement Rahr’s biomass supply. Rahr is considering building a 20megawatt combined heat and power facilitythat at full capacity would be able to providefor all of its electrical needs, generate an additional 12 megawatts for the surroundingcommunity, and supply a minimum of 20 to 30percent of its process heating needs.
According to Rahr, the project will have extensive direct and indirect effects on the localeconomy from jobs created at the plant, theconstruction of the project, increased
agricultural demand, and the generation ofelectricity.7 However, as of spring 2003, the project is still on hold. Rahr is currently awaitingthe outcome of proposed federal legislationcontaining incentives for biomass energy generation. In addition, the company continuesto seek a partner to buy the 12 MW of excessenergy that will be produced. This power purchase agreement is a crucial component tothe project, and will be key to establishing theproject’s economic viability. The avoided energycosts and reduced operating costs for wastematerial transportation and disposal cannotalone ensure the viability of the project.
For more information, see the report referenced at
the end of this section, or contact:
Paul Kramer
Vice President, Rahr Malting
952-496-7002
★
C A S E S T U D Y:
Rahr Malting
Rahr Malting
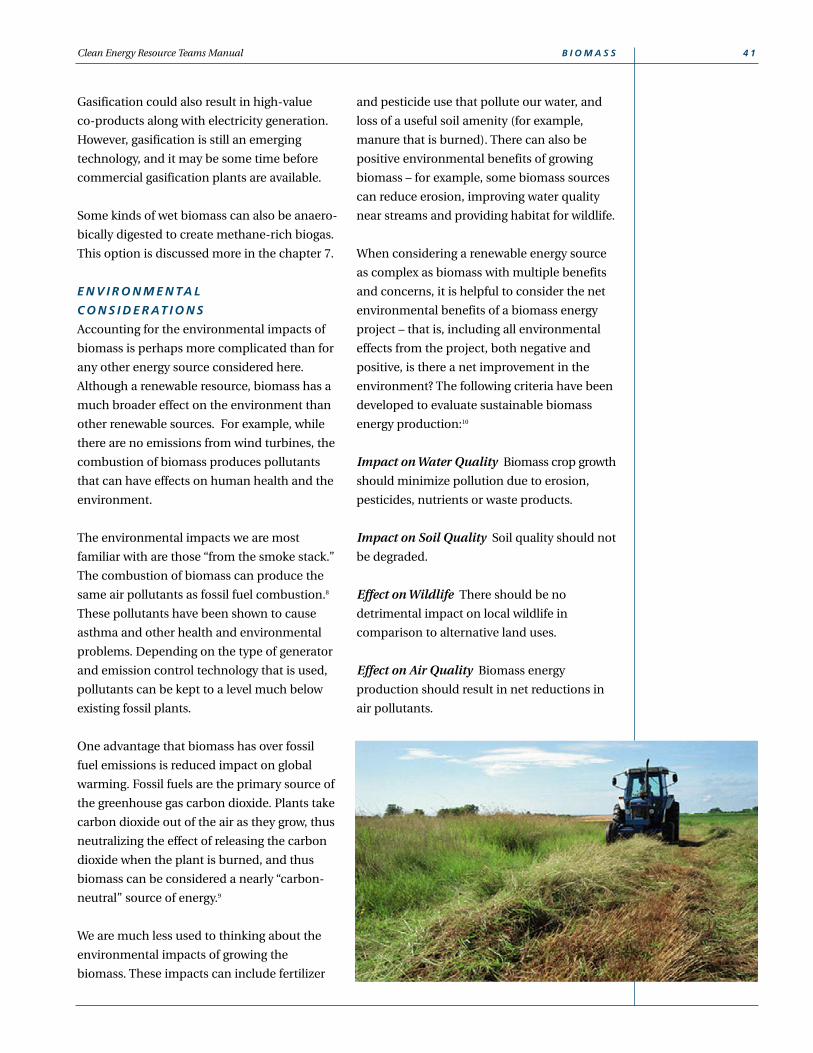
and pesticide use that pollute our water, and
loss of a useful soil amenity (for example,
manure that is burned). There can also be
positive environmental benefits of growing
biomass – for example, some biomass sources
can reduce erosion, improving water quality
near streams and providing habitat for wildlife.
When considering a renewable energy source
as complex as biomass with multiple benefits
and concerns, it is helpful to consider the net
environmental benefits of a biomass energy
project – that is, including all environmental
effects from the project, both negative and
positive, is there a net improvement in the
environment? The following criteria have been
developed to evaluate sustainable biomass
energy production:10
Impact on Water Quality Biomass crop growth
should minimize pollution due to erosion,
pesticides, nutrients or waste products.
Impact on Soil Quality Soil quality should not
be degraded.
Effect on Wildlife There should be no
detrimental impact on local wildlife in
comparison to alternative land uses.
Effect on Air Quality Biomass energy
production should result in net reductions in
air pollutants.
Clean Energy Resource Teams Manual B I O M A S S 4 1
Gasification could also result in high-value
co-products along with electricity generation.
However, gasification is still an emerging
technology, and it may be some time before
commercial gasification plants are available.
Some kinds of wet biomass can also be anaero-
bically digested to create methane-rich biogas.
This option is discussed more in the chapter 7.
E N V I R O N M E N TA L
C O N S I D E R AT I O N S
Accounting for the environmental impacts of
biomass is perhaps more complicated than for
any other energy source considered here.
Although a renewable resource, biomass has a
much broader effect on the environment than
other renewable sources. For example, while
there are no emissions from wind turbines, the
combustion of biomass produces pollutants
that can have effects on human health and the
environment.
The environmental impacts we are most
familiar with are those “from the smoke stack.”
The combustion of biomass can produce the
same air pollutants as fossil fuel combustion.8
These pollutants have been shown to cause
asthma and other health and environmental
problems. Depending on the type of generator
and emission control technology that is used,
pollutants can be kept to a level much below
existing fossil plants.
One advantage that biomass has over fossil
fuel emissions is reduced impact on global
warming. Fossil fuels are the primary source of
the greenhouse gas carbon dioxide. Plants take
carbon dioxide out of the air as they grow, thus
neutralizing the effect of releasing the carbon
dioxide when the plant is burned, and thus
biomass can be considered a nearly “carbon-
neutral” source of energy.9
We are much less used to thinking about the
environmental impacts of growing the
biomass. These impacts can include fertilizer

4 2 B I O M A S S Clean Energy Resource Teams Manual
Net Energy Balance Does it provide more
energy than is consumed in making the energy
(such as the energy used to produce fertilizer,
drive tractors, dry the crop, etc.)?
Biodiversity Does the biomass increase the
diversity of our nation’s genetic crop base?
E C O N O M I C V I A B I L I T Y
O F B I O M A S S
The economic viability of biomass continues
to increase. However, biomass facilities using
dedicated energy crops currently cost more
than traditional fossil fuel plants. Perhaps if
the full environmental impacts of these fossil
plants were included, the balance would
change. In any case, just as for wind, the
economics will improve over time as more
plants are built.
There are many situations when biomass is
economically viable on its own right. When low
value sources of biomass are available as a
byproduct of another process, or that have no
other useful purpose, fuel costs can be
dramatically reduced. This is why there are so
many biomass plants at paper mills, where
there is a lot of wood waste. Many studies also
suggest that the most economic use of biomass
is in co-firing at existing coal plants.
The economics also improve when waste heat
from electric generation is used for other
purposes (see chapter 11 on Combined Heat
and Power). As was mentioned earlier, biomass
has the advantage of being able to produce
electricity on demand, which also adds value.
With the proper nurturing, biomass can
become an important part of our energy mix.
Biomass plants in Minnesota
Facilities in Minnesota currently utilizing“bioenergy” fuel sources often use millingand logging residues. Some examplesinclude:
• Blandin Paper – Grand Rapids
• Boise Cascade – International Falls
• Champion Paper - Sartell
• Potlatch Corporation – Cloquet
• Minnesota Power – Duluth
In 1994, Xcel Energy (then NSP) wasrequired to develop 425 MW of windpower and 125 MW of biomass projects, in exchange for continued operation of itsPrairie Island nuclear plant. Projects thatare being developed to fulfill this requirement include:
• St. Paul District Energy – uses urban wood waste to produce electricity and heat (see case study in chapter 12)
• EPS/Beck Power – proposed to be built near St. Peter, using hybrid poplar trees
• FibroMinn – plant near Benson utilizing turkey litter
Hybrid poplar wood chips
being unloaded in
Crookston, Minnesota

E N D N O T E S12000 data from the Renewable Electric Plant InformationSystem (REPIS, version 6.0), U.S. Dept. of Energy, Office ofEnergy Efficiency and Renewable Energy;www.eren.doe.gov/repis. Note that of the total biomasscapacity, 151 MW is municipal solid waste, a fuel sourcethat many do not consider renewable.
2Data provided by Steve Clemmer, UCS. Biomass potentialis calculated based on data from Walsh, M.E, et. al.Biomass Feedstock Availability in the United States: 1999State Level Analysis, Oak Ridge National Laboratory,January, 2000. Available online at:http://bioenergy.ornl.gov/pubs/econ_assess.html. Includes urban wood residues, mill residues, forest residues, agricultural residues, and energy crops(e.g., switchgrass) that can be produced for $50 per ton orless.
3Combustion of biomass is the only commercially viableoption for generating electricity at present – however,researchers are working on ways to directly convert bio-mass to hydrogen fuel, where it can be used in a fuel cellwithout combustion. See chapter 10.
4Renewable Energy Policy Project, “BioEnergy: BiomassFAQs”. Retrieved on October 21, 2002 fromhttp://www.crest.org/articles/static/1/1004994679_6.html#bioc.
5Costs of feedstocks can vary widely depending on local conditions. From Bain, Richard, Biopower TechnicalAssessment: State of the Industry and Technology, Golden,CO: National Renewable Energy Laboratory, March, 2003;and Walsh, M.E, et. al. Biomass Feedstock Availability inthe United States: 1999 State Level Analysis, Oak RidgeNational Laboratory, January, 2000.
6Note this is fuel costs only and does not include capitalcosts or operations and maintenance costs of the plant.This chart assumes a biomass heat content of 8000Btu/dry lb (actual heat content varies by feedstock, fromabout 6500 to 8500), and a conversion rate (heat rate) of12,000 Btu/kWh, approximately the average for existingcoal plants.
7Rahr Malting, Rahr Malting 20 Megawatt Biomass toEnergy Project, Shakopee, Minnesota, October 2001.
8These emissions can include nitrogen oxides (NOx), lowlevels of sulfur dioxide (SO2), particulate matter or “soot”(PM), carbon dioxide (CO2), Volatile Organic Compounds(VOCs), and other pollutants. Emissions vary widelydepending on the type of generator and emission controlsused.
9Note that biomass may cause some carbon dioxide emissions through the production and transportation ofthe biomass (e.g., the trucks that deliver biomass to theplant consume fossil fuel), so may not be completely “carbon-neutral”.
10Nelson, Carl, Renewable Energy from Farms: Building on the principles of sustainable agriculture to achieve sustainable energy, Minnesota: Midwest SustainableAgriculture Working Group, June 2002. Available atwww.mnproject.org
11From the U.S. Dept. of Energy – see reference 1.
Clean Energy Resource Teams Manual B I O M A S S 4 3
P H O T O G R A P H S
page 37 – National Renewable Energy Laboratory; page 38– Chariton Valley RC&D; page 39 – Dean Schmidt/WesMinRC&D (upper), National Renewable Energy Laboratory(lower); page 40 – Paul Kramer/Rahr Malting; page 41 –National Renewable Energy Laboratory; page 42 – NationalRenewable Energy Laboratory; page 43 – DeanSchmidt/WesMin RC&D
Hybrid poplars near
Alexandria

4 4 B I O M A S S Clean Energy Resource Teams Manual
H E L P F U L R E S O U R C E S F O R C O M M U N I T I E S
All web links listed here are available (and updated
if necessary) at www.mnproject.org (click on
“publications”)
Biomass Energy Resources and Information from
Minnesotans for an Energy-Efficient Economy.
Information on biomass projects in Minnesota,
including the Rahr Malting and hybrid poplar
projects discussed in this chapter. Also a good
source of general information on biomass.
(www.me3.org/issues/biomass)
Energy from Biomass, Loni Kemp, The Minnesota
Project. This article details the three crops
Minnesota farmers have the most experience with
(corn, alfalfa, and hybrid poplar) that could be
used as biomass fuels.
(www.mda.state.mn.us/crp/biomass.htm)
Biomass for Electricity Generation, written by Zia
Hag, U.S. Department of Energy, Energy
Information Agency. This article details biomass
feedstock supply curves – how much the various
feedstocks cost, the likely supply quantity, and how
much it would cost to transport them – also
provides predictions regarding energy generation
potential.
(www.eia.doe.gov/oiaf/analysispaper/biomass/
index.html)
Bioenergy: Biomass FAQs. Included on the
Renewable Energy Policy Project website that
covers a broad range of biomass information from
feedstock descriptions to prices to associated
environmental impacts.
(www.crest.org/articles/static/1/1004994679_6.
html#biof)
Biopower Technical Assessment: State of the
Industry and Technology. This recent (March 2003)
and detailed (277 pages) study of biomass power
by the National Renewable Energy Laboratory
assesses barriers, feedstock supplies, environmental
performance and lessons learned from existing
biomass plants as well as an economic analysis of
costs for biomass plants.
(www.eere.energy.gov/biopower/bplib/library)
U.S. Department of Energy. Primary biomass
energy page at the Department of Energy.
(www.eren.doe.gov/RE/bioenergy.html)
U.S. Department of Energy, Office of Energy
Efficiency and Renewable Energy. Contains detailed
information regarding the various biomass
resources.
(www.eren.doe.gov/RE/bio_resources.html)
Short Rotation Woody Crops: A role for the state of
Minnesota. Center for Rural Policy and
Development at Minnesota State University,
Mankato has published its policy paper on
producing short rotation woody crops; discusses
economic and environmental benefits and barriers
associated with growing woody crops on
agricultural lands.
(www.mnsu.edu/dept/ruralmn/pages/Publications/
publications.html)
Renewable Energy from Farms: Building on the
Principles of Sustainable Agriculture to Achieve
Sustainable Energy. Midwest Sustainable
Agriculture Working Group Position Paper
authored by Carl Nelson of The Minnesota Project
and published in June 2002.
(www.mnproject.org)
From Plants to Power Plants: Cataloging the
Environmental Impacts to Biopower. This report
from the Natural Resources Defense Council
(NRDC), still in draft form, has a goldmine of both
technical and environmental information of
biomass. Contact Nathaniel Greene, NRDC,
212-727-4482, [email protected]

C H A P T E R 7 Biogas Digesters
BIOGAS DIGESTERS HAVE CAPTURED MANY IMAGINATIONS because they
can turn organic wastes from our farms, factories and cities into a valuable
source of renewable energy. In addition, the potential of this technology to
reduce odors and other environmental concerns of animal feedlots has resulted
in much recent interest from farmers. On-farm uses are not, however, the only
digester options. Indeed, other industries have been reaping the benefits of
digestion for years, particularly for wastewater treatment. While digesters can be a
useful source of energy, they probably will never supply a significant portion of our
state’s energy needs – it’s estimated that farm digesters could at most provide about
one and a half percent of Minnesota’s energy needs.1 This chapter will discuss both
on-farm and non-farm applications.
Anaerobic digestion
is a natural process
similar to composting
that breaks down
organic wastes to
produce biogas.
A N A E R O B I C D I G E S T E R B A S I C S
Biogas digesters work on the principal of
anaerobic digestion – a natural, biological
process similar to composting that breaks
down liquid manure, sewage, or other organic
wastes. In the process, biogas is produced.
This biogas is about 55-70 percent methane
(the primary component of natural gas) and
therefore can make an excellent energy source.
Anaerobic means “without oxygen,” and the
bacteria that produce the biogas can only
survive if they are not exposed to oxygen in the
air. These bacteria generally thrive at two
temperature “zones” from 95-105o F, and from
125 to 135o F. Although anaerobic digestion
occurs at lower temperatures, it is not as
efficient at producing biogas.
E N V I R O N M E N TA L B E N E F I T S
A N D C O N C E R N S 2
Anaerobic digestion offers several environ-
mental benefits:
Odor Reduction Odors are significantly
reduced in an anaerobic digestion system.
Green Energy Production Biogas is a
renewable resource, and when it is converted
to electricity it is replacing power than would
otherwise be produced from fossil fuel sources.
Pathogen Reduction Harmful pathogens are
also reduced – although not eliminated –
through digestion.
Greenhouse Gas Reduction Methane
produced naturally from animal manure
storage is a contributor to global warming –
methane is a powerful greenhouse gas 23 times
more potent than carbon dioxide, the most
common greenhouse gas. Capturing and
burning this methane with an anaerobic
digestion system reduces this agricultural
source of greenhouse gases.
Reduction in Total Oxygen Demand of the
Treated Waste Total oxygen demand (TOD) is
a measure of potential impact on aquatic
systems. In the case of a manure spill into a
water body, manure with a high TOD will suck
more oxygen from the water and thus kill more
fish.
Especially for on-farm digesters, there are also
several potential environmental concerns of
digesters:
Nitrogen and Ammonia Emissions Although
digestion does not remove nutrients from the
manure, is does convert organic nitrogen in
manure to an ammonia form. This can be both
a benefit – it is more easily available as a
nutrient to plants – and a potential concern, as

4 6 B I O G A S D I G E S T E R S Clean Energy Resource Teams Manual
Improves the environment
Works well with agriculture
Helps with reliabilityconcerns
Recycles waste materialsand waste heat
Offers community economic development
Improves energy independence, local control, and energy security
Promotes learning aboutenergy
H A U B E N S C H I L D D A I R Y
F A R M is a 1000-acre, familyowned and operated dairy farmlocated near Princeton, Minnesota.
In 1999 the farm installed a biogasdigester at a total cost of $355,000, includingthe engine and generator. It is a great exampleof a local waste to energy project, althoughowner Dennis Haubenschild would dispute thefact that manure from his dairy cows is a waste.“Manure is a valuable resource that we need touse to its fullest extent,” says Dennis.
The Haubenschild Dairy Farm collects manurefrom its approximately 750 cows. Over a periodof about 15 days, the manure passes through acovered 350,000-gallon, in-ground concrete tank– the biogas digester. Suspended heating pipesheat the manure inside the digester to createthe optimal conditions for creating biogas. A135-kilowatt engine-generator set is then fueledwith the biogas captured from the digester andused to generate electricity. The hot water usedto heat the digester is recovered from theengine-generator’s cooling jacket and reused toheat the barn floor space. The digested manureis stored in a lined storage lagoon until it can bespread on the fields for fertilizer.
The farm produces enough electricity to meetall on-farm electric needs plus enough excesselectricity to power about 75 homes. The excesselectricity is sold to East Central Energy, theHaubenshild’s local electric cooperative, whichmarkets the “cow power” as green electricity toits customers for a slight mark-up to cover itsincreased distribution expenses. HaubenschildFarms expect the value of the energy from thedigester will pay back total project costs inabout 5 years.
For more information, a full report on the
Haubenschild digester is available at
www.mnproject.org
or contact:
Henry Fischer
East Central Energy
763-689-8055
★
C A S E S T U D Y:
Haubenschild Farms:Making Electricity on the Farm3
Digester engine with heat
recovery system
The Haubenschilds: Dennis, Bryan,
Marsha and Tom (left to right)

ammonia nitrogen can be more easily lost to
the air, where it is a pollutant. Nitrogen loss
can be minimized by using proper manage-
ment practices such as: injecting the digested
manure into the soil instead of spreading it;
maintaining a crust on the storage pond; and
reducing the surface area of the storage pond.
Digested Manure Storage Concerns Water
pollution from potential surface water run-off
or groundwater contamination from liner
leakage. This is not a concern that is particular
to digesters, however, but exists for all confined
animal agriculture operations.
Clean Energy Resource Teams Manual B I O G A S D I G E S T E R S 4 7
Three Primary Types of Digestersfor On-Farm Use 4
While engineers have developed manydigester designs for use in treating sewageand industrial waste streams – some ofthem quite complex – there are three basicdesigns in commercial use on farms.
C O V E R E D L A G O O N
• Least expensive• Large lagoon covered with impermeable
cover• Best for liquid manure• Does not work well for energy
production in Minnesota because it is not heated, but does help curb odors
C O M P L E T E M I X D I G E S T E R
• Works for manure with 3 to 10 percent solids (swine or dairy)
• Manure processed in heated tank (above or below ground) and solids kept in suspension by mixer
• More expensive than plug-flow
P L U G - F L O W D I G E S T E R
• Works well for manure with solids concentration of 11 to 14 percent, such ascow manure
• Mixes manure then moves it through the digester in a “plug” (gummy clump of manure). Anaerobic digestion creates biogas that moves through digester; the digester is heated by suspended hot water pipes, and the gas is stored under an impermeable cover
Air Emissions from Combusting Biogas The
burning of biogas does produce emissions;
however, these emissions are significantly
cleaner than existing coal-fired power plants.
W I L L A D I G E S T E R W O R K
F O R M Y F A R M ?
The AgSTAR Handbook includes 5 criteria for
preliminary screening of potential anaerobic
digester projects at dairy or swine feedlots. For
complete information on conducting a
pre-feasibility assessment, farmers should see
the Ag STAR Handbook.5
1. Do you have a “large” confined livestock
facility? Ag STAR defines large as at least 300
head of dairy cows/steers or 2000 swine,
although digesters have been successful at
smaller farms.
2. Can you ensure year-round, stable manure
production and collection? A digester needs
to be constantly and regularly “fed” manure to
maintain methane-producing bacteria.
3. Do you have a manure management
strategy that is compatible with digester
technology? Digester technology requires the
manure to be: managed as a liquid, slurry or
semi-solid; collected at one point; collected
regularly; and free of large quantities of
bedding and other materials (i.e., rocks, sand,
straw).
4. Do you have a use for the energy recovered?
Can a generator be installed to produce energy
and will a local utility purchase it? Are your
on-farm electricity costs high? Is there another
use for the energy on-farm?
5. Do you have someone to efficiently manage
the system? Successful digester operation
requires an interested operator who will pay
attention to performing the daily routines of
digester maintenance and possesses basic
“screwdriver friendliness.”
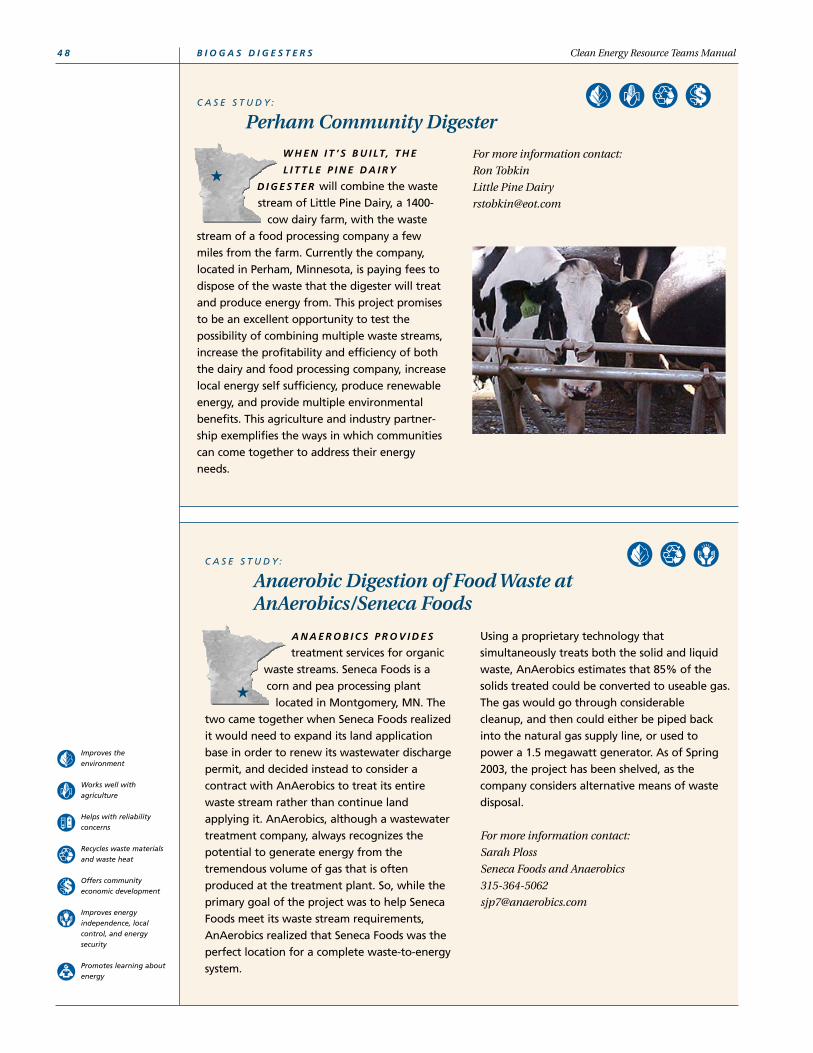
A N A E R O B I C S P R O V I D E S
treatment services for organicwaste streams. Seneca Foods is acorn and pea processing plant
located in Montgomery, MN. Thetwo came together when Seneca Foods realizedit would need to expand its land applicationbase in order to renew its wastewater dischargepermit, and decided instead to consider a contract with AnAerobics to treat its entirewaste stream rather than continue land applying it. AnAerobics, although a wastewatertreatment company, always recognizes thepotential to generate energy from the tremendous volume of gas that is often produced at the treatment plant. So, while theprimary goal of the project was to help SenecaFoods meet its waste stream requirements,AnAerobics realized that Seneca Foods was theperfect location for a complete waste-to-energysystem.
Using a proprietary technology that simultaneously treats both the solid and liquidwaste, AnAerobics estimates that 85% of thesolids treated could be converted to useable gas.The gas would go through considerablecleanup, and then could either be piped backinto the natural gas supply line, or used topower a 1.5 megawatt generator. As of Spring2003, the project has been shelved, as the company considers alternative means of wastedisposal.
For more information contact:
Sarah Ploss
Seneca Foods and Anaerobics
315-364-5062
★
C A S E S T U D Y:
Anaerobic Digestion of Food Waste at AnAerobics/Seneca Foods
4 8 B I O G A S D I G E S T E R S Clean Energy Resource Teams Manual
Improves the environment
Works well with agriculture
Helps with reliabilityconcerns
Recycles waste materialsand waste heat
Offers community economic development
Improves energy independence, local control, and energy security
Promotes learning aboutenergy
W H E N I T ’ S B U I LT, T H E
L I T T L E P I N E D A I R Y
D I G E S T E R will combine the wastestream of Little Pine Dairy, a 1400-
cow dairy farm, with the wastestream of a food processing company a fewmiles from the farm. Currently the company,located in Perham, Minnesota, is paying fees todispose of the waste that the digester will treatand produce energy from. This project promisesto be an excellent opportunity to test the possibility of combining multiple waste streams,increase the profitability and efficiency of boththe dairy and food processing company, increaselocal energy self sufficiency, produce renewableenergy, and provide multiple environmentalbenefits. This agriculture and industry partner-ship exemplifies the ways in which communitiescan come together to address their energyneeds.
For more information contact:
Ron Tobkin
Little Pine Dairy
★
C A S E S T U D Y:
Perham Community Digester

Clean Energy Resource Teams Manual B I O G A S D I G E S T E R S 4 9
O T H E R T Y P E S O F
A N A E R O B I C D I G E S T E R S
Food Waste Wherever a large amount of food
waste is generated there is potential for
anaerobic digestion. In fact, many food
processing industries are required to treat their
waste streams, and digestion offers one way to
accomplish this.
Often the energy potential of digestion can
complement the need to treat organic wastes
at a food processing plant. For example, the
waste from rendering plants is high in organic
wastes that could be treated through digestion.
Landfill Gas Significant quantities of biogas
are emitted from municipal solid waste
landfills. Landfill biogas has a methane content
of approximately 40-55%, with the remaining
gas made up of primarily carbon dioxide
(CO2), as well as some nitrogen (N2) and
hydrogen sulfide (H2S).6 The gas can be used to
generate electricity at the landfill site by
collecting the gas and burning it to power a gas
turbine and produce electricity.
A large portion of the potential for landfill gas
electric generation in Minnesota has already
been realized with existing projects, but a
study conducted in association with the
Lakefield Junction natural gas plant suggested
that some landfill gas-based generation
potential still exists in Minnesota.
The study suggests that additional landfill gas
projects could add roughly two additional
megawatts in generating capacity. Existing
municipalities and landfill facilities not yet
incorporating such a process should explore
the option to help lower their electric bills and
to reduce the amount of methane they release.
Landfill gas systems are reliable and are
expected to be available for combustion over
90 percent of the time. Capital costs for
constructing a landfill gas facility are slightly
less than $1,000 per kilowatt and annual
operating costs are likely less than for a
traditional power plant because the landfill
would not have to purchase its own gas.
Wastewater Treatment Much like landfill gas,
utilizing biogas generated from wastewater
treatment can serve to improve the economics
of wastewater treatment by producing onsite
heat and electricity. Anaerobic digestion is
often part of the treatment process at a waste-
water treatment plant. These digesters produce
biogas with methane contents ranging from
60-70%.7 Because the treatment process is very
energy intensive, most or all of the biogas
energy may be used on-site. Often, the biogas
is used for process heat or to directly power
equipment at the plant, rather than in a
generator.
E N D N O T E S1Assuming all manure in Minnesota was digested. See:Hinds, Paul, DRAFT: Minnesota’s Potential for ElectricityProduction Using Biogas Resources: Summary Report,Minnesota Department of Commerce, January 2002.Digestion of additional wastes from food processing facilities, wastewater treatment plants and other sourceswould increase this amount.
2Nelson, Carl, Final Report: Haubenschild Farms AnaerobicDigester Updated!, St. Paul, Minnesota: The MinnesotaProject, August 2002. Available at www.mnproject.org.
3ibid.
4ibid.
5Roos, K.F. and M.A. Moser, eds., AgStar Handook, 1stEdition, Washington D.C.:U.S. Environmental ProtectionAgency, 1997.
6Ross, Charles C., Thomas J. Drake, James L. Walsh,Handbook of Biogas Utilization, Second Edition, Atlanta:U.S. Department of Energy, July 1996.
7ibid.
8Soderberg, Kurt. “WLSSD Announces a New “Beacon” onthe Harbor,” Press Release, 23 July 2001. Retrieved June 18,2002 from: http://www.wlssd.duluth.mn.us/PR72301.htm.
P H O T O G R A P H S
page 45 – Natural Resources Conservation Service;page 46 – Carl Nelson/The Minnesota Project; page 48 –Melissa Pawlish/The Minnesota Project; page 50 – ChetWelle/City of Rochester; page 51 – Karen Anderson/WesternLakes community relation’s director (upper), DougFairchild/Western Lakes Environmental ProgramCoordinator (lower)
Some examples of
existing landfill gas
projects in Minnesota
include:
• Browning Ferris
Industries in Inver
Grove Heights –
Pine Bend Landfill
• Neo Corp in Eden
Prairie –
Flying Cloud
(Wood Lake
Sanitary Services)
• Neo Corp in
Burnsville –
Burnsville Sanitary
Services
• Power Recyclers Inc.
in Anoka –
Anoka Landfill

5 0 B I O G A S D I G E S T E R S Clean Energy Resource Teams Manual
Improves the environment
Works well with agriculture
Helps with reliabilityconcerns
Recycles waste materialsand waste heat
Offers community economic development
Improves energy independence, local control, and energy security
Promotes learning aboutenergy
T H E R O C H E S T E R W AT E R
Reclamation Plant has realizedthe value of making use of its existing resources. The Rochester
Water Reclamation Plant generates biogas as a major byproduct of itswastewater treatment process, which includesanaerobic digesters. This biogas has the potential to provide the plant with a renewablesource of fuel that saves money on energy costs.During the major plant expansion of 1980, two400 kW generators were installed which usedthe biogas gas to produce electricity. In 2000,due to concerns of local energy shortages, plantstaff got the Rochester Water Reclamation Plantprepared. Partnering with the local RochesterPublic Utility, and utilizing the technical knowledge of its staff, plant managementdecided to look for ways to use the facility’s gasmore efficiently.
In its current configuration, the Rochester WaterReclamation Plant produces enough biogas toreduce its power purchasing needs by 25% during summer months, but it plans to increasethis percentage with a number of upgrades. Thetwo existing 400 kW generators are currentlybeing upgraded to 1000 kW generators, bothwith turbocharged engines that will increasegenerator efficiency by 20%. The plan is toreroute the excess heat given off by the generators back to the anaerobic digesters. Thisadded heat should increase biogas gas availablefor use in the engine generators by another25%. Overall, the upgrades should allow thefacility to supply 100% of its short-term powerneeds, and supply 50% of its on-going energyneeds – making a significant dent in its fossilfuel energy consumption and making significantly better use of its on-site resources.
For more information contact:
Chet Welle
Rochester Water Reclamation Project
507.281.6190 x 3003
★
C A S E S T U D Y:
Rochester Water Reclamation Plant

Clean Energy Resource Teams Manual B I O G A S D I G E S T E R S 5 1
A N O T H E R F A C I L I T Y that hasput its waste to work is the
Western Lake Superior SanitaryDistrict wastewater treatment plant
in Duluth. In 1999, the WesternLake Superior Sanitary District began a majorrenovation to install a $32.6 million biosolidsanaerobic digestion facility. In July 2001,Western Lake Superior Sanitary District permanently shut down its incinerator and started treating waste in four digesters, eachwith a million-gallon capacity. The new digestersuse a high temperature process (120 to 140° F)to reduce the organic portion of the wastewaterto a biosolids product rich in organic matter andnutrients. This biosolids product is used in
agricultural and mine land applications. Theplant uses a special biogas boiler to provide theheat needed for the digestion process as well asheating for the Biosolids Processing Facility. Byusing the waste gas without compression ortreatment in a dedicated boiler, the District hasreduced its costs. Ultimately, the biogas may alsoprovide heat to additional buildings within thetreatment plant and power a combustionengine that will generate a portion of electricityused by the Sanitary District.
For more information contact:
Kurt Soderberg, Executive Director
Western Lake Superior Sanitary District
218-722-3336 x. 213
★
C A S E S T U D Y:
Western Lake Superior Sanitary District 8
Western Lake Superior
Sanitary District
wastewater treatment
plant in Duluth, MN
Digester controls at a
wastewater treatment
plant

5 2 B I O G A S D I G E S T E R S Clean Energy Resource Teams Manual
H E L P F U L R E S O U R C E S F O R C O M M U N I T I E S
All web links listed here are available (and updated
if necessary) at www.mnproject.org (click on
“publications”)
Final Report, Updated: Haubenschild Farms
Anaerobic Digester. The report, written by Carl
Nelson and John Lamb of The Minnesota Project
was updated in August 2002 and provides detailed
information about the Haubenschild digester
project. Contact: Carl Nelson, The Minnesota
Project, 651-645-6159 x 5, [email protected].
Along with the report, The Minnesota Project
website has a wealth of information on digesters.
(www.mnproject.org)
University of Minnesota, Department of Biosystems
and Agricultural Engineering have done a lot of
work on odor control, as well as having expertise in
anaerobic digesters. Contacts: David Schmidt,
612-625-4262, [email protected] or Phil
Goodrich, 612-625-4215, [email protected].
(www.bae.umn.edu)
Handbook of Biogas Utilization, 2nd Edition.
Published in July 1996 for the US DOE,
Southeastern Regional biomass Energy Program,
Tennessee Valley Authority, Muscle Shoals,
Alabama.
On-Farm Biogas Production. Written by Robert A.
Parsons and published by Northeast Regional
Agriculture Engineering Service. Ithaca, New York:
1984.
AgSTAR Handbook. This publication covers
several chapters and appendices with pertinent
information about how to go about designing and
implementing an anaerobic digestion system.
(www.epa.gov/agstar/library/handbook.htm)
Industry Directory for On-farm Biogas Recovery
Systems. For farmers looking for companies that
can build digesters.
(www.epa.gov/agstar/library/ind2.pdf)
Agriculture Utilization and Research Institute
(AURI) digester website. Contains an analysis of the
benefits of using an on-farm digester to treat
manure as well as a checklist for farmers to use to
decide if it is a viable option.
(www.auri.org/research/digester/diglead.htm)

Because of policies enacted by the state
legislature, the majority of Minnesota’s 14
ethanol-processing facilities are actually
owned by farmer cooperatives, which means
that the farmer-owners benefit from the
economic value added, rather than losing it to
a large company that may not even be located
in the state. This provides a mechanism to
strengthen Minnesota’s rural communities by
keeping dollars spent on ethanol in the state.
Minnesota’s ethanol model could also be
copied for other renewable energy resources.
E T H A N O L’ S F U T U R E
Because of its high starch content, corn is a
good candidate for the current fermentation
methods used to create ethanol. However, corn
is a fairly input-intensive crop (in terms of
energy, fertilizer and chemicals) and the corn
kernel is only a small percentage of the whole
plant. In the long-term, other crops may be
used to produce ethanol more efficiently and
with less impact to the environment.
Methods to convert cellulose (the fibrous
material in plants) into ethanol show the most
promise for the future.
Then perennial crops
like switchgrass that
don’t need to be re-
planted every year
and have less input
requirements could be
used for ethanol.
C H A P T E R 8 Biofuels
THE LAST DECADE HAS SEEN A TREMENDOUS GROWTH in the use of
biofuels to replace petroleum-based transportation fuels. Ethanol production
has grown from 0.2 billion gallons in 1980 to over 2.1 billion gallons in 2002.
Rural economies not only benefit from growing the raw material for biofuels,
but can also benefit by being involved in the production of biofuels. Minnesota
ethanol plants, many owned by farmers, produce over 400 million gallons of
ethanol a year, nearly 20 percent of current U.S. production. Despite recent setbacks
for the state payments Minnesota ethanol plants receive, state policy supporting
ethanol and biodiesel has been a model for the nation.
Minnesota ethanol
plants, many owned
by farmers, produce
nearly 20% of current
U.S. ethanol
production.
E T H A N O L : A M I N N E S O TA
S U C C E S S S T O R Y
Minnesotans began using ethanol as a
standard blend in their gasoline in 1996. At
first it was just used during the winter and
Minnesotans actually had to import their
ethanol. Now however, even with Minnesota
auto fuel comprised of 10% ethanol year
round, Minnesota is producing 40-50% more
ethanol than it needs, and exporting the rest.
Besides the fact that it’s a renewable source of
fuel, ethanol is an environmentally benign fuel
additive that can substitute for MTBE. MTBE
is a fuel oxygenate that was found to pose a
significant environmental threat to ground and
surface water, enhanced by its ability to rapidly
penetrate the ground.
Corn is currently the primary feedstock for
ethanol, although Minnesota also uses whey,
and other states have incorporated other
feedstocks. Corn-based ethanol can be
produced by either the wet milling or the dry
milling method. Dry milling is the most
common process used in Minnesota, and
consists of grinding up the corn and adding
water to make mash. The mash is then cooked
to kill off the bacteria and expose the starches.
Enzymes are added to convert the starch to
sugar, which is then converted to ethanol by
yeasts. The ethanol is then purified for use as a
fuel.
Green switchgrass

5 4 B I O F U E L S Clean Energy Resource Teams Manual
The U.S. Department of Energy (DOE)
estimates that with steady improvements over
the next decade in cellulosic conversion tech-
nology, the cost of producing ethanol – now
about 90 cents/gallon – could be as low as 60
cents/gallon. In contrast, the DOE concludes
there is not much room for further cost
reductions in corn/starch ethanol production.1
Cellulosic ethanol would also reduce green-
house gases, because less fossil fuel is needed
to produce it. Argonne National Laboratory
estimates that using a 10% blend of cellulosic
ethanol results in the reduction of 4 to 5 times
more greenhouse gases than using a 10% blend
of corn ethanol.2 The first cellulosic ethanol
plants might be paired with current corn-
ethanol plants, utilizing the cellulose-rich
byproducts of the corn/starch ethanol process.
B I O D I E S E L B A S I C S
Biodiesel is a fuel commonly made from a
chemical reaction between soybean oil,
methanol, and lye. Although soybean oil is the
most common feedstock, other non-petroleum
oils and greases (such as waste grease from
cooking food) can be used. Biodiesel can be
used in its pure form or can be blended with
petroleum diesel. Any percentage of biodiesel
★ Little Falls
★ Melrose★ Morris
★ Benson
★ Buffalo Lake ★ St. Paul
★ Marshall ★ Winthrop
★ Bingham Lake★ Claremont
★ Luverne ★ Winnebago ★ Preston★ Albert Lea
can be used, but 2 percent (B2) and 20 percent
(B20) are the most common. Biodiesel’s use as
a transportation fuel in diesel engines is
becoming more wide spread, but it can also be
readily used in standby, emergency and remote
diesel electric generators.
Using a biodiesel mixture rather than pure
petroleum diesel to fuel emergency generators
could help reduce many air emissions that
result with use of diesel electric generators.
However, as diesel generators are one of the
most polluting sources of electricity there is,
biodiesel electric generation is still a very dirty
source of electricity, even compared to other
fossil fuel sources. Therefore, traditional diesel
generators using biodiesel fuel is a source
suitable for backup power or other special
situations, but is not suitable for generating a
significant amount of our electricity needs.
Since 2000, the cost of biodiesel has dropped
significantly due to a federal program to
encourage biodiesel production. In 1998 the
US Department of Energy modified the Energy
Policy Act (EPAct) to allow the use of B20 to
help facilities meet their alternative fuel
vehicle mandate. Unfortunately though, cost is
still one of the primary barriers to widespread
adoption of biodiesel.
Ethanol Plants in Minnesota
Source: Minnesota Department of Agriculture, February 2002
Soybeans can be
converted to biodiesel

Clean Energy Resource Teams Manual B I O F U E L S 5 5
Improves the environment
Works well with agriculture
Helps with reliabilityconcerns
Recycles waste materialsand waste heat
Offers community economic development
Improves energy independence, local control, and energy security
Promotes learning aboutenergy
T H E C I T Y O F B R O O K LY N
PA R K was not willing to waitaround for a biodiesel mandate.When members of the National
Association of Fleet Administratorsstarted talking about alternative fuels and alternative fuel vehicles, Steve Lawrence knew itwas time to act. Jon Thiel, his director, agreed.They wanted to be proactive and felt that byacting now they could save a lot of money anda lot of headaches in the long run. So, in Fall2001 the City of Brooklyn Park initiated theirbiodiesel program.
After one winter of operation with absolutelyno complications, they have expanded their program and as of August 2002, now have 88vehicle units running on B20 – one of the largestsuch projects currently underway in Minnesota.
City administrators thought that this effortwould show the community that it was spendingmoney wisely and planning ahead while makingtheir operations more environmentally friendly.While the fuel is a bit more expensive than standard diesel right now (about 4 cents higher),city staff feels it will reap the benefits of itsforethought in the years to come. Brooklyn Park is now working with the University ofMinnesota and Hennepin County to be "agentsof change" in Minnesota and to furtherbiodiesel development around the state. Theyhave agreed to work with the University’sCenter for Diesel Research on testing fuel additives that should both reduce biodieselemissions and enhance biodiesel's performance,making biodiesel an even better option in yearsto come.
For more information contact:
Steven Lawrence
763-493-8028
★
C A S E S T U D Y:
Brooklyn Park
Currently most
suppliers and
providers charge an
additional $0.01 per
percentage point of
added biodiesel per
gallon, but this
number varies. This
cost increase can add
up quickly for high biodiesel blends if you
utilize a lot of fuel. The Cannon Valley
Cooperative, located in Cannon Valley,
Minnesota, is a rare example of a facility that
actually offers solely biodiesel and does not
charge any extra for its purchase.
Cannon Valley
Cooperative

5 6 B I O F U E L S Clean Energy Resource Teams Manual
Fossil Energy Balance of Biofuels 3
F O S S I L E N E R G Y
F U E L B A L A N C E
Ethanol 1.34
Biodiesel 3.2
Petroleum diesel 0.83
For every unit of useful fuel that is produced by biofuels, a certain amount ofenergy is required to produce the fuels. Forexample, biodiesel produces the usefulenergy that drives truck engines, but energyis expended in planting, fertilizing, harvesting, transporting and processing thesoybeans used to make the biodiesel. Thisenergy is typically produced from fossil fuelsources. The fossil energy balance is theratio of useful energy gained per unit offossil energy consumed during the life cycleof the fuel (including the fuel itself, if it isfossil).
Biodiesel’s fossil energy balance of 3.2 means that for every unit of energy used producing biodiesel, over 3 units are available to do useful work. In contrast, theconsumption of one unit of fossil fuel energy produces just 0.83 units of usefulenergy from petroleum diesel.4 Earlier studies reported that it took more energy toproduce ethanol than it created (a fossilenergy balance of less than 1), but recentstudies such as the one cited above suggesta positive energy balance.5
B I O D I E S E L A N D
T H E E N V I R O N M E N T
Although diesel – even biodiesel blends – is a
very polluting fuel, biodiesel is less polluting
than standard diesel. As the percentage of
biodiesel goes up, there are reductions in many
air emissions (including sulfur dioxide, carbon
monoxide, volatile organic compounds and
particulates).
The addition of biofuels to diesel and gasoline
allows for more complete combustion, which
therefore reduces the amount of carbon
monoxide emissions and unburned hydro-
carbon emissions, causing a reduction in some
ground-level ozone causing pollutants.
However, the addition of oxygenated fuels
causes combustion temperatures to rise, which
results in increased formation of nitrogen
oxides. Biodiesel blends of 100% or 20% also
reduce visible smoke and odors. See table
below for estimated amounts of air emission
reduction.
The U.S. Environmental Protection Agency has
been considering rules to drastically reduce
emissions (especially fine particulates) from
diesel. It’s unclear what role biodiesel would
play to help or hinder meeting any future
diesel emissions rules. Like ethanol, biodiesel
also results in a net reduction in greenhouse
gases.
Emission Reductions from Replacing Diesel with
Biodiesel (20% and 100% blends)6
Emission B-20 B-100
Carbon Monoxide -13% -43%
Hydrocarbons -11% -56%
Particulates -18% -55%
Nitrogen oxides 1% 6%
Air Toxics -0.3% -1.5%

Clean Energy Resource Teams Manual B I O F U E L S 5 7
Improves the environment
Works well with agriculture
Helps with reliabilityconcerns
Recycles waste materialsand waste heat
Offers community economic development
Improves energy independence, local control, and energy security
Promotes learning aboutenergy
V O YA G E U R S N AT I O N A L
PA R K began its biodiesel program in September 2000 as partof a Department of Energy pilot
program. Park maintenance officials were so pleased with how well theblend of 20% biodiesel (B20) worked in theirpickups during the first winter that theyexpanded their biodiesel program the followingyear to include all of their diesel equipment,including a barge. Initially park staff were concerned about using biodiesel in the bargesince it sits unused from October to June, butthey have had no trouble restarting it, and thebiodiesel has significantly reduced its smokeoutput and diesel odors. In fact, ParkMaintenance Supervisor Bill Carlson says theywould use a higher biodiesel blend if it weren’tso expensive to get it and transport it to thepark. Voyageurs feels it is setting a good example for environmental stewardship, especially on water ways, by incorporatingbiodiesel into its fuel mix.
For more information contact:
Bill Carlson
Rainy District Maintenance Supervision
218-283-9821
★
C A S E S T U D Y:
Voyageurs National Park Biodiesel Program

5 8 B I O F U E L S Clean Energy Resource Teams Manual
B I O D I E S E L I N M I N N E S O TA
Minnesota has been home to several
demonstration projects that have put biodiesel
to work in real applications. Some of these
examples include:
• Voyageurs National Park has operated all of
its diesel-equipped trucks on 20% biodiesel
for two years as part of an experimental DOE
program that was hoping to test the use of
biodiesel in a “worst case” scenario for cold
temperatures (see case study)
• Eureka Recycling (formerly a part of the St.
Paul Neighborhood Energy Consortium) is
running its fleet of recycling trucks on B20
• Brooklyn Park
now operates its
entire city fleet of
diesel vehicles on
B20 (see case
study)
• Hennepin County
operates 4 heavy-
duty maintenance
trucks on B20
• University of Minnesota operates two
vehicles on biodiesel, one on B100 and the
other on B20
• Dakota Electric purchased 1000 gallons of
biodiesel to blend in with its petrodiesel and
has thereby qualified for 2 EPAct credits
• Department of Commerce received federal
funding to perform a demonstration project
using B20 in school buses for the winter
driving season in 2001 and 2002
• The State Energy Office in the Department
of Commerce funded a successful
demonstration project using biodiesel in
over 15 diesel generators during the Taste of
Minnesota in St. Paul in 2000.
In 2002, the state legislature took another step
forward in biodiesel policy. Starting in June
2005, all diesel fuel sold in the state for use in
internal combustion engines must contain at
least 2 percent biodiesel, with a few
exceptions.7 The law also stipulates that
Minnesota must have a minimum of 8 million
gallons of in-state production.8
Incorporating biodiesel into our fuel mix
would not only support the use of renewable
energy resources and improve air quality, but it
would also help provide additional income to
farmers producing soybeans. Currently over
27 Minnesota facilities, focused on the
transportation sector, sell biodiesel as a 2%
biodiesel, 98% petrodiesel blend. Some of
these facilities, located throughout Minnesota,
will sell and deliver 100% biodiesel in bulk.
Minnesota is fortunate to have the Center for
Diesel Research at the University of Minnesota
that has been doing innovative research to test
the potential for biodiesel in peaking and
emergency generators. They have initiated a
pilot project to measure the air emissions
resulting from various blends of biodiesel,
from 10% to 100%, and with use in various
engines. This research will contribute
significant data that should help optimize
future generator designs and fuel blends such
that our diesel generators, if they absolutely
must be put to work, will do so using at least
partially renewable, cleaner burning fuels.
The Center for Diesel Research is also involved
in researching the use of raw soybean oil in gas
turbines. This use would allow both reduced
fuel processing and allow the use of biodiesel
in larger power-production operations.

Clean Energy Resource Teams Manual B I O F U E L S 5 9
E N D N O T E S1DiPardo, Joseph, Outlook for Biomass Production andDemand, U.S. Department of Energy, Energy InformationAgency, 2000.
2Wang, M., et. al., Effects of Fuel Ethanol Use of Fuel-CycleEnergy and Greenhouse Gas Emissions, Argonne NationalLaboratory, Center for Transportation Studies, Argonne, IL,1999.
3Source for biodiesel and petroleum diesel: Sheehan et. al.,“Life Cycle Inventory of Biodiesel and Petroleum Diesel forUse in an Urban Bus,” sponsored by U.S. Dept. ofAgriculture and U.S. Dept. of Energy, NREL/SR-580-24089,1998. Source for ethanol: Shapouri, et. al, “The EnergyBalance of Corn Ethanol: An Update,” U.S. Dept. ofAgriculture, 2001.
4Alternatively put, for every gallon of petroleum diesel, the equivalent of about 1⁄4 gallon of diesel is needed to produce, transport and refine it.
5Some of the strongest criticism over the net energy balance of ethanol comes from Cornel University’s DavidPimentel, who recently reported a study showing a negative net energy balance of corn ethanol (2001). Criticsfeel the study fails to make a convincing argument aboutthe current state of the industry, however, citing Pimentel’suse of older data that doesn’t account for advancements inthe productivity of corn and ethanol production.
6US Department of Energy, Office of Transportation.Biofuels and the Environment: Air Pollution. Results in thistable were rounded to the nearest percent (1/10th percentfor air toxics). Retrieved from:http://www.ott.doe.gov/biofuels/environment.html#table.
7Exceptions to the mandate include railroad locomotivesand off-road taconite and copper mining equipment andmachinery; a temporary exception was also included formotors at electric generating plants governed by thenuclear regulatory commission.
8For more information see The Minnesota Session Lawswebpage at:http://www.revisor.leg.state.mn.us/slaws/2002/c244.html.
P H O T O G R A P H S
page 53 – Natural Resources Conservation Service (upper),Chariton Valley RC&D (lower); page 54 – Core 4Conservation; page 55 – Nathan Jensen/Cannon ValleyCoop; page 57 – National Park Service; page 58 – NationalRenewable Energy Laboratory (upper), Eureka Recycling(lower)

6 0 B I O F U E L S Clean Energy Resource Teams Manual
H E L P F U L R E S O U R C E S F O R C O M M U N I T I E S
All web links listed here are available (and updated
if necessary) at www.mnproject.org (click on
“publications”)
Clean Fuels: Developing Fuels to Benefit Minnesota’s
Environment and Economy. A brochure written by
the Minnesota Department of Commerce includes
descriptions of biodiesel as well as several other
clean fuels, including ethanol and hydrogen.
(www.commerce.state.mn.us)
Outlook for Biomass Production and Demand.
This report from the U.S. Department of Energy
analyzes the future of ethanol production and
concludes that there is not much opportunity for
reducing corn ethanol’s production costs, but
cellulosic ethanol production shows great promise
in the future for reducing production costs. An
overview cellulosic conversion technology and
various feedstock options and a brief history of
ethanol is also presented.
(www.eia.doe.gov/oiaf/analysispaper/pdf/biomass.
pdf)
The Biodiesel Plant Development Handbook. A
59-page overview of the steps involved in building
a biodiesel plant. Prepared for the Agricultural
Utilization and Research Institute (AURI) and the
Minnesota Soybean Research and Promotion
Council, and available from AURI by calling
320-589-7280.
Agricultural Utilization and Research Institute
(AURI). AURI provides technical assistance to
Minnesota businesses or cooperatives with
projects that have the potential to create new uses
or new markets for Minnesota agricultural
commodities. AURI has been involved with many
renewable energy projects, including a meat
rendering plant that is working to produce
biodiesel. Contact: Michael Sparby, Morris office,
320-582-7280, [email protected]
National Biodiesel Board. Biodiesel basics, updates
on current legislation and projects.
(www.biodiesel.org)
The National Corn Growers Association has
information on Ethanol and the Farm Bill.
(www.ncga.com)
Carbohydrate Economy. Website is a clearing house
of resources on ethanol and other carbohydrate-
based fuels.
(www.carbohydrateeconomy.org)
Center for Diesel Research. Located at the
University of Minnesota, the Center conducts
research on the potential of biodiesel to generate
electricity. They also staff a biodiesel helpline:
1-800-929-3437 or 651-330-0450. Contact: Kelly
Strebig, 651-457-1404, [email protected]
Minnesota Department of Agriculture. The
Department of Agriculture has been instrumental
in supporting the ethanol industry in the state, and
its staff are a wealth of information on ethanol.
Contact: Ralph Groschen, Agriculture Marketing
Specialist, 651-297-2223, Ralph.Grolschen@
state.mn.us

C H A P T E R 9 Solar Energy
ALTHOUGH WE MAY FEEL IN THE DEAD OF JANUARY that the sun is
scorning us, there are still plenty of opportunities for solar in Minnesota.
Minnesota has more annual solar energy potential than Houston, Texas and
nearly as much as Miami, Florida.1 Although the cost of generating solar
electricity is currently expensive relative to traditional sources, solar energy can
be economic in many situations, such as for heating hot water and when it is
impractical to connect to the electric grid. When buildings are designed to maximize
the light and heating potential from the sun, significant “passive solar” energy savings
can be realized.
Minnesota has more
annual solar energy
potential than
Houston, Texas and
nearly as much as
Miami, Florida.
A study completed in 1992 2 identified several
types of applications that would be most cost-
effective for solar electric systems. These
included:
Government
• Lighting, for public lake access, trails, and
rest rooms
• Communications, such as emergency call
boxes
• Vehicle battery charging for snow removal
equipment, earth moving equipment, and
emergency vehicles
• Monitoring, such as remote weather stations
• Warning signals
• Off-grid facilities such as state park
residences, remote equipment storage
buildings, and fire towers
Travel and Tourism
• Residences, such as remote cabins and
hunting facilities
• Battery chargers for recreational vehicles,
trolling motors, and sailing vessels
• Lighting for boat launches/docks and
parking areas
• Water pumping for pond aeration and
potable water
Agriculture
• Fence chargers
• Stock tank aerators
• Water pumps
Several case studies highlighted by the Center
for Energy and Environment’s study Using
Renewable Energy in Minnesota Parks 3
emphasize similar applications integrating
both solar electric opportunities as well as
passive and active solar thermal water heating
systems. An initial analysis by the Department
of Commerce indicates that there is a roughly
15% difference between the lowest and highest
solar resources across the state of Minnesota.4
Regions of southwest Minnesota receive the
most sunlight and northern Minnesota
receives the least.
P H O T O V O LTA I C P O W E R
Photovoltaic systems, or PV, produce electric
DC power from sunlight because of the
photovoltaic effect (a semiconductive process
that generates electricity without moving parts
or emissions). Inverters can be added to
convert the DC power to grid-compatible AC
power.
PV panels (a combination of many cells)
produce the most electricity under periods of
high solar output, or insolation,5 during sunny
summer days. They are generally mounted on
un-shaded south-facing exposures and have
optimum energy production when the sun’s
rays are perpendicular to the panel.

6 2 S O L A R E N E R G Y Clean Energy Resource Teams Manual
The most common type of photovoltaic cell is
constructed of semiconductor-grade
crystalline silicon wafers that have grid contact
structures on the front and back to create an
electric circuit. Photovoltaic cells can be linked
together to form panels or arrays.
Electricity is generated when light photons
excite the bottom wafer to donate an electron
to the upper wafer, resulting in the flow of
electricity when attached to an electric circuit.
PV systems do not create noise, air or water
emissions, or have any moving parts and the
panels themselves are generally designed to
last for 20 years.
One of the key benefits of incorporating PV
systems into our electricity generating system
has to do with timing. The amount of energy
that solar electric systems generate directly
correlates with the sunlight intensity and
length. This peak condition occurs most often
during hot, sunny, summer days, when
electricity demand is also at its peak. This peak
demand is when electricity is most expensive
to generate and most valuable to the utility.
Thus, although solar power is an intermittent
power source, it provides power when it is
most needed.
The cost of PV (15 cents/kWh or more) is not
yet competitive with other sources of electric
generation and the payback of a grid-intercon-
nected system may take 30 years or more. PV
can be cost-effective for off-grid applications,
however.
P H O T O V O LTA I C S Y S T E M F A C T S 8
• Installation costs are about $7,000-9,000/kW
• A typical solar installation in Minnesota can
be expected to generate about 1,000 to 1,100
kilowatt hours per kW of installed capacity
per year. For example, a 500 watt (.5 kW) PV
system can be expected to produce
approximately 500 to 550 kilowatt hours of
electricity in one year. Solar generation will
be greater in the summer than in the winter.
• Factors such as inverter and wiring
efficiency, the orientation and tilt of the
panels, and shading can increase or decrease
this amount.
Minnesota’s solar resources 7
County boundaries
High: 165
Low: 140
Value
Source: Minnesota Department of Commerce
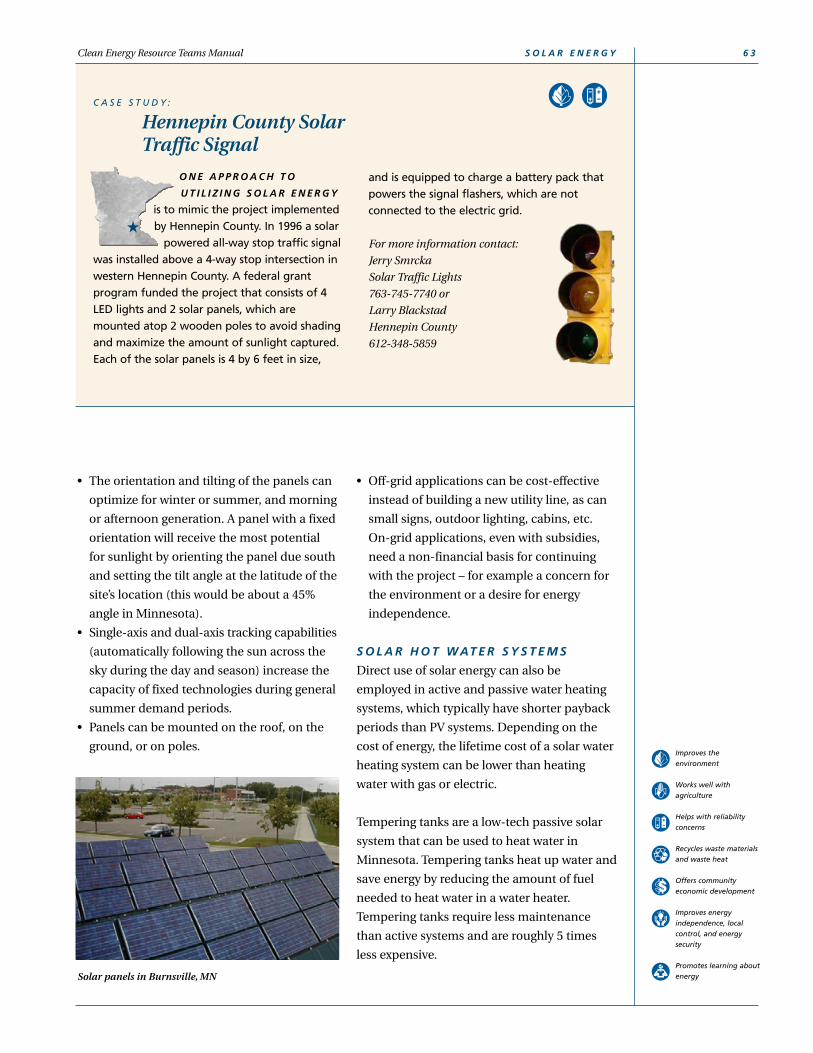
• The orientation and tilting of the panels can
optimize for winter or summer, and morning
or afternoon generation. A panel with a fixed
orientation will receive the most potential
for sunlight by orienting the panel due south
and setting the tilt angle at the latitude of the
site’s location (this would be about a 45%
angle in Minnesota).
• Single-axis and dual-axis tracking capabilities
(automatically following the sun across the
sky during the day and season) increase the
capacity of fixed technologies during general
summer demand periods.
• Panels can be mounted on the roof, on the
ground, or on poles.
Clean Energy Resource Teams Manual S O L A R E N E R G Y 6 3
Improves the environment
Works well with agriculture
Helps with reliabilityconcerns
Recycles waste materialsand waste heat
Offers community economic development
Improves energy independence, local control, and energy security
Promotes learning aboutenergy
O N E A P P R O A C H T O
U T I L I Z I N G S O L A R E N E R G Y
is to mimic the project implementedby Hennepin County. In 1996 a solar
powered all-way stop traffic signalwas installed above a 4-way stop intersection inwestern Hennepin County. A federal grant program funded the project that consists of 4LED lights and 2 solar panels, which are mounted atop 2 wooden poles to avoid shadingand maximize the amount of sunlight captured.Each of the solar panels is 4 by 6 feet in size,
and is equipped to charge a battery pack thatpowers the signal flashers, which are not connected to the electric grid.
For more information contact:
Jerry Smrcka
Solar Traffic Lights
763-745-7740 or
Larry Blackstad
Hennepin County
612-348-5859
★
C A S E S T U D Y:
Hennepin County Solar Traffic Signal
Solar panels in Burnsville, MN
• Off-grid applications can be cost-effective
instead of building a new utility line, as can
small signs, outdoor lighting, cabins, etc.
On-grid applications, even with subsidies,
need a non-financial basis for continuing
with the project – for example a concern for
the environment or a desire for energy
independence.
S O L A R H O T W AT E R S Y S T E M S
Direct use of solar energy can also be
employed in active and passive water heating
systems, which typically have shorter payback
periods than PV systems. Depending on the
cost of energy, the lifetime cost of a solar water
heating system can be lower than heating
water with gas or electric.
Tempering tanks are a low-tech passive solar
system that can be used to heat water in
Minnesota. Tempering tanks heat up water and
save energy by reducing the amount of fuel
needed to heat water in a water heater.
Tempering tanks require less maintenance
than active systems and are roughly 5 times
less expensive.

Active solar thermal applications use collectors
and mechanical pumps to make the most of
the sun’s natural ability to heat water. Water is
pumped into solar collectors stationed on
south facing roofs, allowed to warm, and then
stored in a pre-heat storage tank. This system
requires a conventional water heater backup to
ensure hot water on demand and during
winter months.
Active solar thermal can save up to 50% of
summer water heating needs. A large system
serving a campground shower facility costs
approximately $10,000, while residential
systems can cost several thousand dollars
installed.
Research is being conducted on solar thermal
systems that generate electricity, and a few test
plants exist, but unlike solar water heating and
PV, solar thermal electricity generation is still a
long way from being a commercial technology.
PA S S I V E S O L A R D E S I G N
Good building design with the sun in mind can
save energy. Passive solar design integrates a
combination of building features to reduce the
need for heating, cooling and daytime lighting.
The design often does not have to be complex,
but does involve knowledge of solar geometry,
window technology and local climate.
6 4 S O L A R E N E R G Y Clean Energy Resource Teams Manual
Typical passive solar features include careful
orientation of the building, careful positioning
and selection of windows including additional
window glazing, added thermal mass for heat
storage, use of natural ventilation and larger
roof overhangs.
Choosing an architect
and builder
knowledgeable of
passive solar
techniques is key to
realizing savings from
passive solar design. Although a passive solar
design may initially cost more, savings are
born out over the lifetime of the building, and
the increased cost can often be paid back in
several years through energy savings.
Solar panels at the
Haubenschild dairy farm
B R I G H T F I E L D S :
R E D E V E L O P I N G
B R O W N F I E L D S W I T H
S O L A R E N E R G Y
A brightfield is an
abandoned or
contaminated property
(brownfield) that
incorporates solar
energy when it is
redeveloped. The idea,
with backing from the
U.S. Department of
Energy, is designed to
address economic
development,
environmental
cleanup, and ongoing
air quality concerns
by combining
emission-free solar
energy with high-tech
solar manufacturing
jobs at formerly
abandoned sites.
See www.eren.doe.gov/
brightfields.
Solar Electric Rebate Program
P O W E R F R O M T H E S U N ,
R E B AT E F R O M T H E S TAT E !
The State Energy Office is administering aSolar Electric Rebate Program for grid-connected solar electric energy installationsthat will rebate between $2,000 and $8,000 per participant at a rate of $2,000per kWh.
Eligible participants currently include Xcel Energy customers. If money is still available in 2004, the program will beexpanded to all of Minnesota. A short application form and site pictures must beapproved before installation begins.
For eligibility requirements, detailed program information, and an application,check the Minnesota Department. ofCommerce website or call the EnergyInformation Center at 651-296-5175 or 800- 657-3710. (www.commerce.state.mn.us)

For more information contact:
Shawn Donais
651-583-2125
Clean Energy Resource Teams Manual S O L A R E N E R G Y 6 5
Improves the environment
Works well with agriculture
Helps with reliabilityconcerns
Recycles waste materialsand waste heat
Offers community economic development
Improves energy independence, local control, and energy security
Promotes learning aboutenergy
W I L D R I V E R S TAT E PA R K
converted the fuel oil-firedwater heater at one of its campground shower facilities to a
liquid propane and solar thermalwater pre-heating system in May 1998. The system works by pumping water from the wellto the solar storage tank and from there cyclingit through the solar collector system which iscomprised of 4 flat plate solar collectors. Thewater pump for the collector is powered by a10-watt 12-volt PV panel. It operates from Aprilto October, and requires virtually no maintenance; it even drains itself in the winter.During the week, the solar heating system canheat the water to 190° F, which eliminates theneed to use the LP fuel. On the weekend, whenthe system is used more heavily, the system preheats the water to between 70° F and 80° F,minimizing the amount of additional heatingrequired.
★
C A S E S T U D Y:
Wild River State Park:Active Solar Thermal Water Heater
Solar panels collecting energy
in Wild River State Park
E N D N O T E S1This is based on a comparison with Minneapolis using asolar energy calculator developed by the NationalRenewable Energy Laboratory. See: http://rredc.nrel.gov/solar/codes_algs/PVWATTS/version1.
2Minnesota Department of Public Service, A Cost EffectiveMarket for Photovoltaics in Minnesota, St. Paul, MN, 1992.
3Center for Energy and Environment, Using RenewableEnergy in Minnesota State Parks: A Guidebook for ParkManagers, Minneapolis, MN, October 1999.
4Minnesota Department of Commerce, Minnesota EnergyPlanning Report 2001, St. Paul, MN, January 2002.
5Insolation is a measure of the strength of a solar resource– the rate of delivery of direct solar radiation per unit ofhorizontal surface.
6Resource potential for flat plate collectors.
7NASA satellite based solar radiation data. Annual averagesolar insulation 1998-2000.
8Taylor, Michael Paul, “A Performance, Cost-Benefit, andPolicy Analysis of Photovoltaic Technologies inMinnesota,” Masters Thesis, University of Minnesota, May2002.
P H O T O G R A P H S
page 61 – Carl Nelson/The Minnesota Project; page 62–National Renewable Energy Laboratory (upper), RoryArtig/Minnesota Department of Commerce (lower);page 63 – Advanced Systems from Klinge Cooperation andAssociates (upper), National Renewable Energy Laboratory(lower); page 64 – Carl Nelson/The Minnesota Project (left),National Renewable Energy Laboratory (right); page 65 –Shawn Donais/Minnesota DNR (two upper), NationalRenewable Energy Laboratory (lower)
These PV shingles offer a low-profile way to
add solar to a residential home

6 6 S O L A R E N E R G Y Clean Energy Resource Teams Manual
H E L P F U L R E S O U R C E S F O R C O M M U N I T I E S
All web links listed here are available (and updated
if necessary) at www.mnproject.org (click on
“publications”)
A Consumer’s Guide to Buying a Solar Electric
System. Published by the National Renewable
Energy Laboratory. This document covers pros and
cons of investing in a PV system, how to pick an
installer, and how to fulfill permit requirements,
how to get a net metering agreement and other
topics.
(www.nrel.gov/ncpv/pdfs/26591.pdf)
Minnesota Department of Commerce. Great source
of general solar information as well as links to the
rebates and incentives site. Contains a consumer’s
guide to solar energy systems, an article on hiring a
renewable energy dealer and other valuable
information to those considering a system. Phone:
800-657-3710 or 651-296-5175.
(www.commerce.state.mn.us – click on “consumer
info,” then “energy info,” then “solar.”)
Chicago Solar Partnership. Teaching tools for
parties interested in either viewing primers or
sharing information about solar power with others.
(www.chicagosolarpartnership.com/teaching_tools
/index.htm)
Using Renewable Energy In Minnesota Parks: A
Guidebook for Park Managers. A guide for
renewable energy projects, including solar projects
that have been and could be implemented at
Minnesota State Parks.
(www.mncee.org/ceedocs/parkguide.pdf)

Minnesota currently has the potential to
generate 1,600 to 2,100 MW through CHP at
existing facilities.1 CHP can reduce air
emissions from combustion since less fuel is
burned when electricity and thermal energy
are generated together. CHP also reduces the
discharge of hot waters from cooling towers
into community lakes and rivers because the
water is reused. CHP and district energy are an
opportunity for communities and local
businesses to expand production of local
energy and most efficiently use renewable or
fossil fuel resources.
C H P A N D D I S T R I C T E N E R G Y
B A S I C S
CHP is actually a range of technologies that
simultaneously produce electricity and useful
thermal or mechanical energy from a single
energy source. Typically, a CHP system first
uses a gas turbine or reciprocating engine
generator set to generate electricity. The
thermal energy generated by the turbine or
engine is recovered and recycled as usable
steam or hot water. Since CHP systems are
based on capturing and recycling this other-
wise wasted thermal energy, a CHP system
must be located at or near the facility or
buildings that will be utilizing both the
electricity and heat generated by the CHP
system.
C H A P T E R 1 0 Combined Heat & Power/District Energy
COMBINED HEAT AND POWER (CHP), also known as cogeneration, is based
on the simple idea of recovering and utilizing the waste heat created from the
generation of electricity. Typically 60 percent or more of the energy used to
produce electricity in central-station power plants is wasted. CHP is utilized by
industries or institutions that have a use for the waste heat produced from
electrical generation, such as for industrial processes or space heating. District
energy systems also achieve efficiencies by centrally producing the heat and/or
cooling for multiple customers in a concentrated area, like a city center. When district
energy systems include CHP, they can achieve the highest efficiencies. While CHP and
district energy systems can utilize renewable energy fuels, they often use fossil fuels.
Due to the increased fuel efficiency, even use of standard fossil fuels can have
environmental benefits.
By using waste heat,
CHP can realize system
efficiencies as high as
80%, nearly three
times the efficiency of
a typical coal power
plant.
A district energy system traditionally refers to
centrally producing heat and/or cooling for
multiple customers in a concentrated area,
such as a city center, a university campus, or a
hospital complex. Normally, a district energy
system is a prime candidate for adding CHP.
When CHP is incorporated into an industrial,
commercial, institutional, or district energy
application, system efficiencies as high as 80%
can be realized, compared to typical coal
power-plant efficiencies of about 30%. These
increased efficiencies can provide energy cost
savings and lower emissions, while providing
higher reliability of electric service.
The advantage of efficiency in a CHP system
Source: U.S. Department of Energy
100% Fuel Input
40%Useful energy produced for electricity
60%"Waste" heat rejected to environment
Standard Power Plant
100% Fuel Input
40%Useful energy produced for electricity
20%"Waste" heat rejected to environment
District Energy/Combined Heat and Power Plant
40%Useful energy produced for heating and/or cooling via district energy system

6 8 C H P A N D D I S T R I C T E N E R G Y Clean Energy Resource Teams Manual
Improves the environment
Works well with agriculture
Helps with reliabilityconcerns
Recycles waste materialsand waste heat
Offers community economic development
Improves energy independence, local control, and energy security
Promotes learning aboutenergy
D I S T R I C T E N E R G Y S T.
PA U L , I N C . , is a private, non-profit, community-based corporationlocated in downtown St. Paul.
District Energy owns the largesthot water district heating system in NorthAmerica in addition to a rapidly expanding district cooling system.
Since 1999, Market Street Energy Company (aDistrict Energy affiliate) and Trigen-CinergySolutions have been working to build a CHP system that will burn urban wood waste to produce electricity while simultaneously generating energy for St. Paul’s district heatingand cooling needs. The new CHP plant, whichwill be operational in 2003, is a 25 MW wood-waste fired facility that will supply over 75% ofthe thermal energy required by district heatingand cooling customers in downtown St. Paul.The 25 MW of electricity will be supplied to thelocal grid under a 20-year contract with XcelEnergy, and helps Xcel meet a mandate to produce 125 MW of biomass power.
A substantial portion of the wood waste usedfor CHP will come from downed trees, tree trimmings and branches from around the TwinCities area. Using this material has several benefits. First, by turning regional wood wasteinto a useful product, the system will help keepenergy dollars in the local economy, instead ofimporting fossil fuels. Second, using wood wastewill help solve the ongoing environmentalchallenge of wood waste disposal, using
approximately half of the 600,000 metric tons ofwood waste generated in the metro area annually. Lastly, the project will significantlyreduce air pollution by displacing 80% of thecoal and oil District Energy currently burns everyyear, thereby reducing sulfur dioxide emissionsby roughly 600 tons per year and reducing carbon dioxide emissions by roughly 280,000tons per year. This efficient use of a renewableenergy resource should serve as a model forcommunities looking to take similar steps.
For more information contact:
Trudy Sherwood
★
C A S E S T U D Y:
District Energy St. Paul:CHP District Energy Fueled by Biomass
In January 2003, construction is almost completed at
the new combined heat and power plant in Saint Paul
District Energy Tour Participants from left to right:
Anders Rydaker, District Energy; Secretary of Energy
Spencer Abraham; President George Bush; Jim Rogers,
Cinergy; EPA Administrator Christine Todd Whitman;
Mayor (now U.S. Senator) Norm Coleman; and
Michael Burns, District Energy

Clean Energy Resource Teams Manual C H P A N D D I S T R I C T E N E R G Y 6 9
C H P T E C H N O L O G Y O P T I O N S
Combustion turbines (simple cycle and
combined cycle), reciprocating engines, and
steam turbines are the primary technologies
used to generate electricity for CHP systems.
Fuel cells and microturbines are also suited for
CHP, but can be expensive options.
If a facility is already producing steam from a
boiler, it may be a candidate for a type of
steam turbine called a back pressure turbine.
Many industrial facilities generate steam at
high pressures and during the industrial
process will drop the pressure through
pressure reducing valves. In these applications,
a back pressure steam turbine is a relatively
inexpensive way of utilizing the pressure drop
to generate electricity onsite. Installed costs
can be as low as $600 per kilowatt of capacity
for the addition of a turbine to an existing
boiler system.
Heat-recovery systems are also essential
components of CHP systems, so that the waste
heat can be recycled for use in industrial
processes or in space conditioning the
facilities. Absorption chillers can convert hot
water or steam into chilled water for air
conditioning. A desiccant dehumidifier can be
utilized to remove moisture from the air which
in turn can reduce air conditioning loads and
provide better indoor air quality. In a CHP
system, the recovered heat can be utilized to
regenerate the desiccant material in the
dehumidifier.
H O W D O Y O U D E T E R M I N E
I F A C H P S Y S T E M M I G H T B E
A P P R O P R I AT E ?
The Minnesota Planning report 2 lists several
factors to consider:
Consistency and Size of Thermal and Electric
Loads Constant, level loads are best for a CHP
system, since the CHP system can run as close
to continuously as possible, increasing the
economic payback. If the facility is closed for a
portion of the year, or has widely varying
thermal or electric loads, a CHP system is less
likely to make economic sense. It is usually
most cost effective to size a CHP system at less
than peak demand so that the system is able to
operate as much as possible at full capacity.
Planned New Construction or Upgrades It is
best to plan CHP projects for new construction
sites or sites in need of upgrades. These
technologies are easier to incorporate with
newer facilities that are likely to be more
reliable and require less maintenance. If the
avoided costs for upgrades or replacements
can be put back into the CHP project, the
project becomes more cost effective.
Cost of Purchased Power If the cost of power
is high, it will make on-site generation more
cost competitive.
Value of Sold Electricity If excess power can
be sold at a sufficient price, it becomes more
economical. Incentives can also help – the
federal Investment Tax Credit (ITC) provides a
10% ITC for qualifying facilities; Production
Tax Credits (PTC) are also under consideration
by Congress.
Available and Affordable Fuel Supply If there
is an opportunity to use lower-cost, easily
accessible fuels with CHP as compared to
current fuels used for thermal production,
CHP presents an option to avoid higher costs.
C H P I N T H E I N D U S T R I A L S E C T O R
There are several industrial facilities in
Minnesota that have already incorporated CHP
systems into their onsite operations. The paper
industry in particular has significant
experience operating CHP facilities and
utilizing their biomass residuals (waste wood)
to power their operations.
Companies with CHP systems include Blandin
Paper (Grand Rapids), Boise Cascade
(International Falls), and Champion

International (Sartell). The paper industry is
not alone in its smart business use of CHP;
several other industries including mining and
agri-processing industries also reuse their
waste heat to achieve more efficient energy
use.
C H P I N T H E C O M M E R C I A L A N D
I N S T I T U T I O N A L S E C T O R S
Many people are not aware of the huge
potential for increasing Minnesota’s use of
CHP in commercial and institutional buildings
– altogether, there is the potential to generate
over 1,100 megawatts of electricity (about
1/10th of Minnesota’s current generating
capacity) as well as serve heating and cooling
loads.
Institutional buildings are a large source of this
potential. Schools and colleges have large
heating loads that can be served by CHP
systems. CHP paybacks tend to be in the 4 to 7
year range, which is more acceptable to the
long term planning horizon of an institutional
owner than a private for-profit company.
Buildings that need highly reliable or back-up
power, such as hospitals, computer data
centers and telephone switching centers, are
an especially attractive possibility. A CHP
system can serve as a backup power system
that will pay for itself, rather than simply be an
expense.
7 0 C H P A N D D I S T R I C T E N E R G Y Clean Energy Resource Teams Manual
Sites Identified by MN PlanningStudy with CHP Potential 3
G O O D P R O S P E C T S W I T H G O O D D ATA :
• Rahr Malting Company (see case study onpage 40)
• Chippewa Valley Ethanol Company (Benson)
• St. Mary’s Duluth Clinic• Duluth Steam Cooperative
P O T E N T I A L P R O S P E C T S , B U T D ATA
I N A D E Q U AT E F O R A S S E S S M E N T:
• Seneca Foods Corp. (Rochester)• Hormel Foods Corp. (Austin)• St. Olaf College (Northfield)• Crown Cork and Seal (Faribault)• Froedtert Malt (Winona)• Dairy Farmers of America (Zumbrota)• Heartland Corn Products (Winthrop)• US Steel – Minnesota Ore Operations
(Mountain Iron)• Boise Cascade (International Falls),
potential for additional capacity
Existing CHP/District HeatingPlants in Minnesota
P U B L I C U T I L I T I E S :
• Willmar (see case study on page 68)• Hibbing• Virginia (see case study on page 68)• New Ulm
O T H E R S :
• District Energy St. Paul Inc. (see case studyon page 68)
• University of Minnesota (Twin Cities)• Franklin Heating Station (Rochester)• St. John’s University (Collegeville)
Education34%
Health Care17%
Lodging4% Food
Sales/Service4%
Office Buildings32%
Other 9%
Minnesota's potential to generate power in the commercial/institutional sector (1165 MW total)4

Clean Energy Resource Teams Manual C H P A N D D I S T R I C T E N E R G Y 7 1
Improves the environment
Works well with agriculture
Helps with reliabilityconcerns
Recycles waste materialsand waste heat
Offers community economic development
Improves energy independence, local control, and energy security
Promotes learning aboutenergy
W I L L M A R M U N I C I PA L
U T I L I T I E S , established in1891, currently provides districtheating to 325 local customers. Its
district heating system was built in1913, and in 1982 the system was modernizedto utilize hot water, rather than steam, to provide heating. Willmar’s transition to hotwater was based on Northern European technology and designed by engineers fromSweden. In making the upgrade to hot water,Willmar Municipal Utilities achieved higher efficiencies.
As part of the 1982 renovation, WillmarMunicipal Utilities rebuilt the entire districtheating distribution system. The district heatingprogram started out serving only the commercial, institutional, and industrial buildings in the core business district, but beganexpanding in 1983 and continued expandinguntil 1990 to include its current customer base – 108 commercial, institutional and industrial facilities and 199 single family homes.When natural gas prices fell in the late 1980’s,interest in district heating fell off, and therehave been few expansions since.
Bart Murphy of Willmar Municipal Utilities saidthat for Willmar, “all the pieces just cametogether to make the expansion work.”Although the upgrade was very capital intensive, they already had a heat source inplace, and local citizensalready had a goodunderstanding of district energy. Existing customers liked the concept, so they didn’tmind making a minorinvestment for theupgrades. In 1981,when they were planning to expand, the pricing was right fordistrict heating because it would have cost significantly more to remove the whole systemand connect every building to its own naturalgas heating system.
While Willmar still uses coal in its system, thereare other systems experimenting with other fuelsources, including various biomass materials.
For more information contact:
Bart Murphy
Willmar Public Utilities
320-235-4422
★
C A S E S T U D Y:
Willmar Municipal Utilities CHP District Heating System

7 2 C H P A N D D I S T R I C T E N E R G Y Clean Energy Resource Teams Manual
C H P A N D D I S T R I C T H E AT I N G
District heating does not necessarily have to
produce both heat and power, but often this is
the case. It is also not limited to just down-
towns, but can also include “campus heating”
of educational and other multiple-building
facilities. St. Johns University near St. Cloud
has a CHP campus heating system that uses a
coal and waste wood fired steam unit. The
Mayo Clinic in Rochester is also supplied by a
CHP system.
Waste heat from local processing facilities also
presents and opportunity for community-wide
heating and cooling systems. This would both
promote private-public cooperation and
decrease the energy usage of the entire
community.
The West Central Research and Outreach
Center (see page 11 in chapter. 2) and the
University of Minnesota Morris are working
with DENCO, a farmer-owned ethanol plant, to
utilize the waste steam heat that DENCO
would generate. The University of Minnesota-
Morris would use this waste steam in a district
energy system that would serve its needs and
those of a new elementary school while
allowing DENCO to recover some of its costs.
Installing district energy systems is not without
obstacles. These systems require significant
capital investment to create the necessary
infrastructure support. This means that district
energy systems need community support, but
district energy presents a real solution for
improved energy efficiency and presents a
tangible way for communities to reduce their
fuel consumption.
E N D N O T E S1Minnesota Planning, Inventory of Cogeneration Potentialin Minnesota, St. Paul, MN, August 2001. Generallyincludes facilities with larger than 1MW generating potential. Another study referenced in the above reportconcludes that the potential of small CHP systems (under1MW) in MN is 842MW.
2ibid.
3ibid.
4The Market and Technical Potential for Combined Heatand Power in the Commercial/Institutional Sector, OnsiteSycom Energy Corporation, for the US Department ofEnergy’s Energy Information Agency, Washington D.C.,Jan. 2000.
P H O T O G R A P H S
page 67 – Virginia Public Utilities (upper), U.S.Department of Energy (lower); page 68– Nancy Toohey/District Energy St. Paul; page 71 – Willmar Area Visitorsand Convention Bureau; page 73 – Virginia Public Utilities
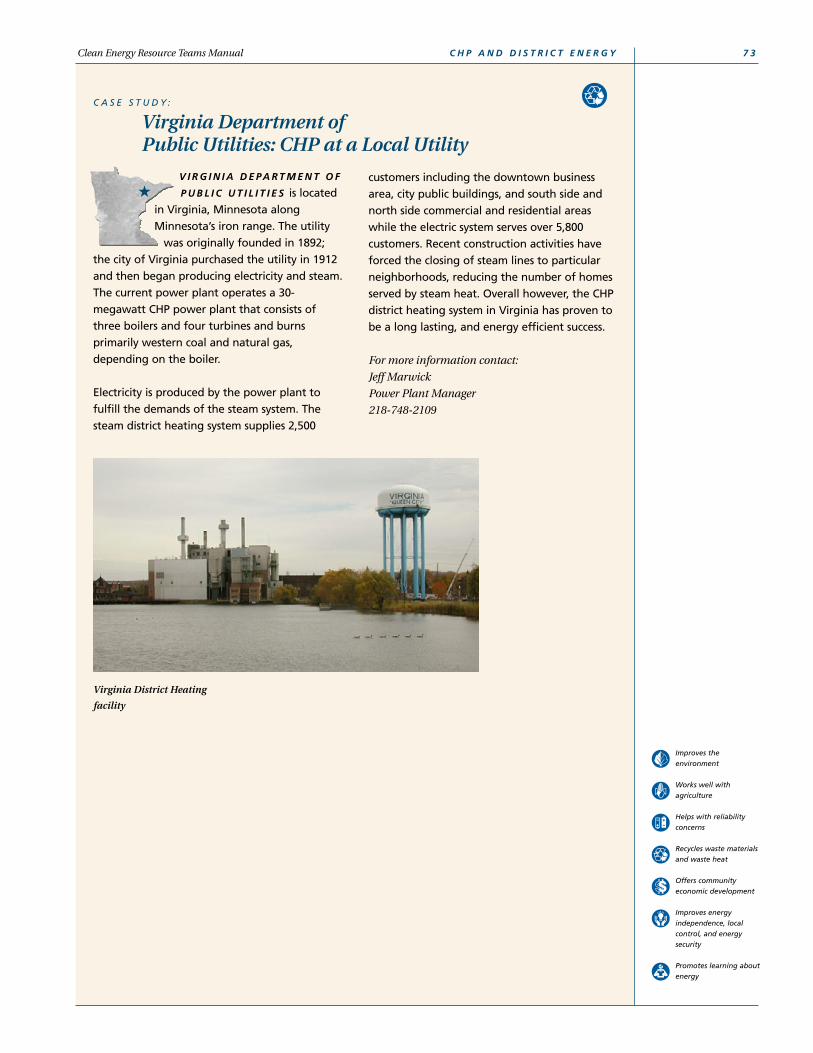
V I R G I N I A D E PA R T M E N T O F
P U B L I C U T I L I T I E S is locatedin Virginia, Minnesota alongMinnesota’s iron range. The utility
was originally founded in 1892;the city of Virginia purchased the utility in 1912and then began producing electricity and steam.The current power plant operates a 30-megawatt CHP power plant that consists ofthree boilers and four turbines and burns primarily western coal and natural gas, depending on the boiler.
Electricity is produced by the power plant to fulfill the demands of the steam system. Thesteam district heating system supplies 2,500
customers including the downtown businessarea, city public buildings, and south side andnorth side commercial and residential areaswhile the electric system serves over 5,800 customers. Recent construction activities haveforced the closing of steam lines to particularneighborhoods, reducing the number of homesserved by steam heat. Overall however, the CHPdistrict heating system in Virginia has proven tobe a long lasting, and energy efficient success.
For more information contact:
Jeff Marwick
Power Plant Manager
218-748-2109
★
C A S E S T U D Y:
Virginia Department of Public Utilities: CHP at a Local Utility
Clean Energy Resource Teams Manual C H P A N D D I S T R I C T E N E R G Y 7 3
Improves the environment
Works well with agriculture
Helps with reliabilityconcerns
Recycles waste materialsand waste heat
Offers community economic development
Improves energy independence, local control, and energy security
Promotes learning aboutenergy
Virginia District Heating
facility

7 4 C H P A N D D I S T R I C T E N E R G Y Clean Energy Resource Teams Manual
H E L P F U L R E S O U R C E S F O R C O M M U N I T I E S
All web links listed here are available (and updated
if necessary) at www.mnproject.org (click on
“publications”)
Inventory of Cogeneration Potential in Minnesota.
Published by Minnesota Planning in August 2001.
(www.mnplan.state.mn.us./eqb/pdf/2001/CogenIn
ventory.pdf)
Opportunities to Expand Cogeneration in
Minnesota. Written by Center for Energy and
Environment and released in August 1996.
(www.mncee.org/ceedocs/mmua_guide.pdf)
Midwest CHP Application Center. Located in
Chicago and partially funded by the US
Department of Energy, this is a premier center for
technical assistance on CHP, such as determining
the feasibility of CHP at a particular site. Contact:
John Cuttica, 312-996-4382. Check their website for
CHP evaluation tools.
(www.CHPCenterMW.org)
Deployment of Distributed Energy Resources:
Sources of Financial Assistance and Information.
Published by the Federal Energy Management
Program in January 2002.
(www.eren.nrel.gov/femp/techassist/pdf/der_$avai
lable_1_24_02.pdf)
Consumer Energy Information: EREC Reference
Briefs: Cogeneration or Combined Heat and Power.
U.S. Department of Energy, Energy Efficiency and
Renewable Energy Network.
(www.eren.nrel.gov/consumerinfo/refbriefs/ea6.ht
ml)
Combined Heat and Power: Capturing Wasted
Energy. A primer on combined heat and power
technologies. R. Neal Elliott and Mark Spurr, 1999.
Summary available at:
(www.aceee.org/pubs/ie983.htm)
District Heating Planning in Minnesota: A
Community Guidebook. Minnesota Department of
Energy, Planning and Development, 1981.
(www.hud.gov/offices/cpd/energyenviron/energy/
library/ces/policyanalysis/c7.pdf)
Environmental Protection Agency: Combined Heat
and Power. Provides general technology
information as well as success stories from around
the country.
(www.epa.gov/CHP/index.htm)
District Energy Library. Website operated by the
University of Rochester, providing a wide range of
information on district energy and CHP including
numerous links and publications.
(www.energy.rochester.edu)
Minnesotan’s for an Energy-Efficient Economy:
Cogeneration. This website provides numerous
links to pertinent information.
(www.me3.org/issues/cogen/)
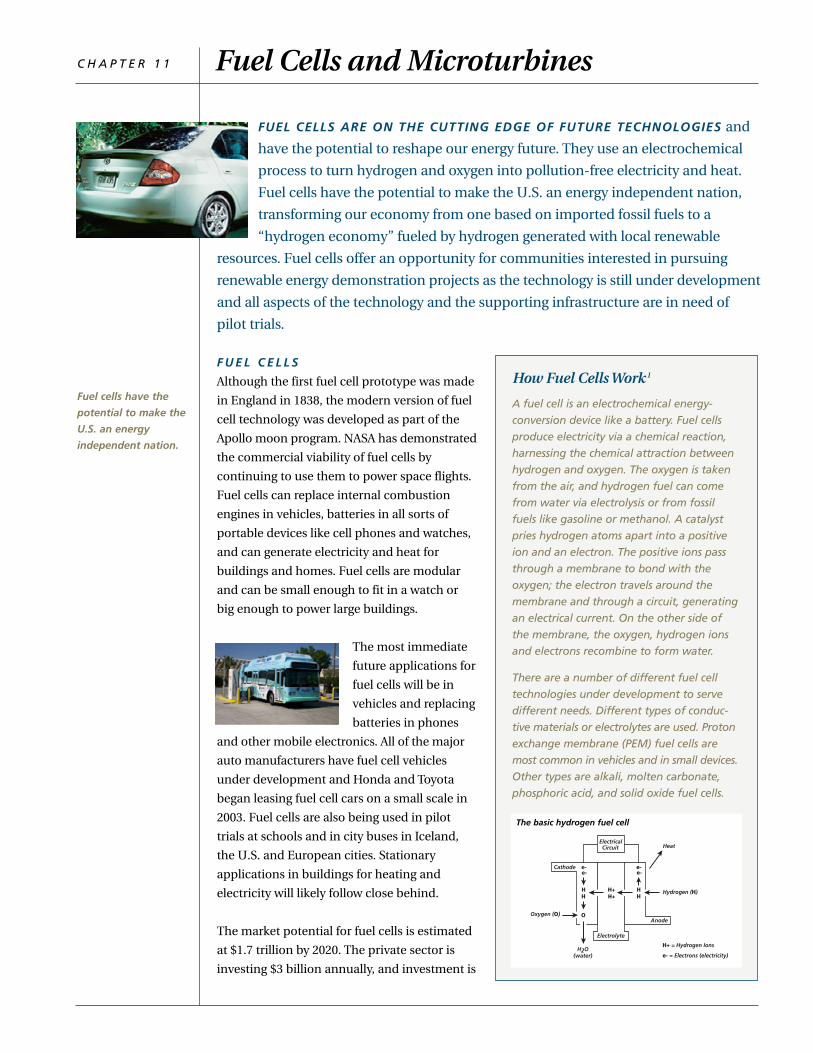
C H A P T E R 1 1 Fuel Cells and Microturbines
FUEL CELLS ARE ON THE CUTTING EDGE OF FUTURE TECHNOLOGIES and
have the potential to reshape our energy future. They use an electrochemical
process to turn hydrogen and oxygen into pollution-free electricity and heat.
Fuel cells have the potential to make the U.S. an energy independent nation,
transforming our economy from one based on imported fossil fuels to a
“hydrogen economy” fueled by hydrogen generated with local renewable
resources. Fuel cells offer an opportunity for communities interested in pursuing
renewable energy demonstration projects as the technology is still under development
and all aspects of the technology and the supporting infrastructure are in need of
pilot trials.
Fuel cells have the
potential to make the
U.S. an energy
independent nation.
F U E L C E L L S
Although the first fuel cell prototype was made
in England in 1838, the modern version of fuel
cell technology was developed as part of the
Apollo moon program. NASA has demonstrated
the commercial viability of fuel cells by
continuing to use them to power space flights.
Fuel cells can replace internal combustion
engines in vehicles, batteries in all sorts of
portable devices like cell phones and watches,
and can generate electricity and heat for
buildings and homes. Fuel cells are modular
and can be small enough to fit in a watch or
big enough to power large buildings.
The most immediate
future applications for
fuel cells will be in
vehicles and replacing
batteries in phones
and other mobile electronics. All of the major
auto manufacturers have fuel cell vehicles
under development and Honda and Toyota
began leasing fuel cell cars on a small scale in
2003. Fuel cells are also being used in pilot
trials at schools and in city buses in Iceland,
the U.S. and European cities. Stationary
applications in buildings for heating and
electricity will likely follow close behind.
The market potential for fuel cells is estimated
at $1.7 trillion by 2020. The private sector is
investing $3 billion annually, and investment is
How Fuel Cells Work 1
A fuel cell is an electrochemical energy-
conversion device like a battery. Fuel cells
produce electricity via a chemical reaction,
harnessing the chemical attraction between
hydrogen and oxygen. The oxygen is taken
from the air, and hydrogen fuel can come
from water via electrolysis or from fossil
fuels like gasoline or methanol. A catalyst
pries hydrogen atoms apart into a positive
ion and an electron. The positive ions pass
through a membrane to bond with the
oxygen; the electron travels around the
membrane and through a circuit, generating
an electrical current. On the other side of
the membrane, the oxygen, hydrogen ions
and electrons recombine to form water.
There are a number of different fuel cell
technologies under development to serve
different needs. Different types of conduc-
tive materials or electrolytes are used. Proton
exchange membrane (PEM) fuel cells are
most common in vehicles and in small devices.
Other types are alkali, molten carbonate,
phosphoric acid, and solid oxide fuel cells.
Hydrogen (H)
Heat
Cathode
Anode
Electrolyte
H2O(water)
Oxygen (O)
Electrical
e-e-
HH
O
e-e-
HH
H+H+
H+ = Hydrogen Ions
e- = Electrons (electricity)
Circuit
The basic hydrogen fuel cell

7 6 F U E L C E L L S A N D M I C R O T U R B I N E S Clean Energy Resource Teams Manual
Improves the environment
Works well with agriculture
Helps with reliabilityconcerns
Recycles waste materialsand waste heat
Offers community economic development
Improves energy independence, local control, and energy security
Promotes learning aboutenergy
I C E L A N D I C N E W E N E R G Y, LT D . is a groupmade up of government, business, and academic institutions facilitating Iceland’s transition from a fossil fuel based economy to ahydrogen economy. Chemistry professor BragiArnason originally proposed the idea of transforming Iceland into the world’s firsthydrogen economy. His idea, with the backingof Vistorka, an Iceland consortium, and threemultinationals, Shell Hydrogen, Daimler-Chrysler,and Norsk Hydro (all part of Icelandic NewEnergy, Ltd.) is now becoming a reality.
Iceland will be the launching ground for testinghydrogen-powered vehicles and building ahydrogen-fueling infrastructure. All of thehydrogen will be produced using electricity fromlocal renewable energy resources.
The world’s first public access, hydrogen fuel station opened in April of 2003. The fueling station is the first of its kind to allow publicaccess, and this demonstration is expected toyield critical information necessary towardestablishing a hydrogen delivery infrastructure.Three hydrogen-fuel city buses, provided byDaimler-Chrysler, will be put in use in Summer2003 and begin a two year pilot program.
For more information contact:
World Business Council for Sustainable
Development
“DaimlerChrysler, Shell, and Norsk Hydro: The
Iceland Experiment”, a case study of Iceland and
the Hydrogen Economy
www.wbcsd.ch
C A S E S T U D Y:
Iceland: A Demonstration of the Coming Hydrogen Economy
Completed hydrogen
fueling station in Iceland

growing each year. The high cost of fuel cells,
however, still remains a barrier for widespread
commercial use, but expectations are that
they will be cost competitive with other
technologies by the end of this decade.
Fuel cells can operate at conversion efficiencies
as high as 80% for fuel cells running on
hydrogen. Fuel cells running on methanol or
gasoline are only 40% efficient, but all fuel cells
have the added advantage of producing
thermal hot water that can be integrated into a
combined heat and power system. This makes
them an efficient energy source that can evolve
to serve multiple needs.
Fuel cells also provide the added benefit of
providing a “clean” source of energy. Because
the energy is generated by a chemical reaction,
the electron stream generated from fuel cells is
cleaner than that normally generated using
conventional power plants. For many industries
the quality of their power is not of extreme
importance, but for some niche applications,
such as computer chips, power quality is
crucial.
H Y D R O G E N F U E L
Fuel cells have the potential to be
pollution-free and to make the U.S. energy
independent. Whether or not they live up to
that promise depends on how the hydrogen
fuel is generated. Hydrogen is all around us.
Water is made of hydrogen and oxygen and
hydrogen is in all living things, but it is rarely
in the elemental form needed for fuel. It takes
energy of some kind to generate pure
hydrogen. Hydrogen can be produced via three
primary mechanisms.
Clean Energy Resource Teams Manual F U E L C E L L S A N D M I C R O T U R B I N E S 7 7
Electrolysis generates hydrogen by splitting
the water molecule into its two components,
hydrogen and oxygen, by passing an electrical
current through the water and then capturing
the hydrogen. The question is how to generate
the electricity to do it. Will it be coal, nuclear
power, or electricity from renewables?
The cleanest and most environmentally
friendly way of generating hydrogen is to use
renewable energy resources, like wind,
biomass, or solar, to generate the electricity to
perform the electrolysis. This choice has the
additional benefit of bringing economic
development opportunities to Minnesota.
Using wind and solar power to generate
hydrogen makes these intermittent resources
more valuable. They can be used when available
to produce hydrogen, solving the dilemma of
their intermittent nature.
Bio-chemical Conversion of Biomass The
plant material all around us contains hydro-
gen. Demonstration projects are showing that
hydrogen fuels can be made from plant waste
materials using enzymes, fermentation,
catalysts, and algae. Many communities have
wastes from sugar beet plants, food processing
plants, ethanol and biodiesel facilities, and
even sewage treatment plants that may in the
future be used to generate hydrogen fuels.
Reforming of Fossil and Bio Fuels requires
pre-treatment of the fuel, which could be crude
oil, methanol, ethanol, natural gas, or even
gasoline or diesel fuel, in a “fuel reformer” that
extracts the hydrogen for use in a fuel cell. The
drawback to this method is that except for
ethanol and methanol, it still requires the use
of imported fossil fuels and still produces air
pollution and greenhouse gases. On the other
hand, reforming fossil fuels is a more efficient
mechanism of using these fuels because it
involves a chemical reaction rather than
thermal production and results in more miles
per gallon.
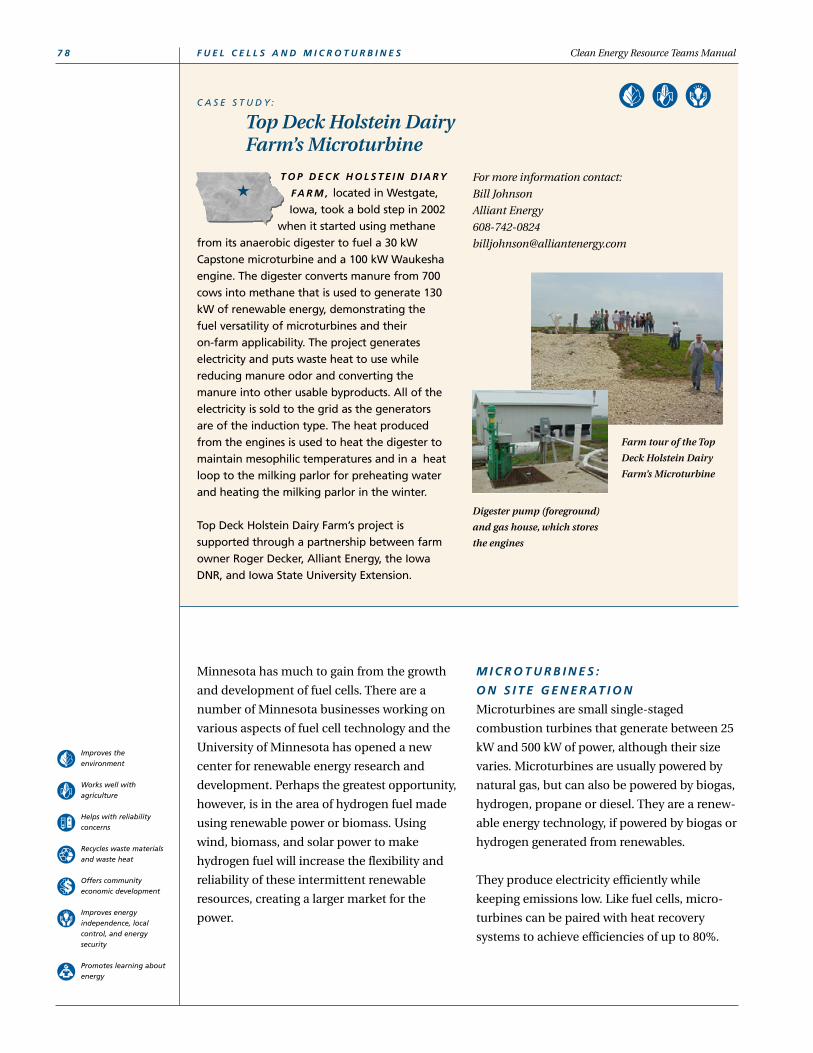
7 8 F U E L C E L L S A N D M I C R O T U R B I N E S Clean Energy Resource Teams Manual
Improves the environment
Works well with agriculture
Helps with reliabilityconcerns
Recycles waste materialsand waste heat
Offers community economic development
Improves energy independence, local control, and energy security
Promotes learning aboutenergy
T O P D E C K H O L S T E I N D I A R Y
F A R M , located in Westgate,Iowa, took a bold step in 2002
when it started using methanefrom its anaerobic digester to fuel a 30 kWCapstone microturbine and a 100 kW Waukeshaengine. The digester converts manure from 700cows into methane that is used to generate 130kW of renewable energy, demonstrating thefuel versatility of microturbines and their on-farm applicability. The project generateselectricity and puts waste heat to use whilereducing manure odor and converting themanure into other usable byproducts. All of theelectricity is sold to the grid as the generatorsare of the induction type. The heat producedfrom the engines is used to heat the digester tomaintain mesophilic temperatures and in a heatloop to the milking parlor for preheating waterand heating the milking parlor in the winter.
Top Deck Holstein Dairy Farm’s project is supported through a partnership between farmowner Roger Decker, Alliant Energy, the IowaDNR, and Iowa State University Extension.
For more information contact:
Bill Johnson
Alliant Energy
608-742-0824
★
C A S E S T U D Y:
Top Deck Holstein Dairy Farm’s Microturbine
Digester pump (foreground)
and gas house, which stores
the engines
Farm tour of the Top
Deck Holstein Dairy
Farm’s Microturbine
Minnesota has much to gain from the growth
and development of fuel cells. There are a
number of Minnesota businesses working on
various aspects of fuel cell technology and the
University of Minnesota has opened a new
center for renewable energy research and
development. Perhaps the greatest opportunity,
however, is in the area of hydrogen fuel made
using renewable power or biomass. Using
wind, biomass, and solar power to make
hydrogen fuel will increase the flexibility and
reliability of these intermittent renewable
resources, creating a larger market for the
power.
M I C R O T U R B I N E S :
O N S I T E G E N E R AT I O N
Microturbines are small single-staged
combustion turbines that generate between 25
kW and 500 kW of power, although their size
varies. Microturbines are usually powered by
natural gas, but can also be powered by biogas,
hydrogen, propane or diesel. They are a renew-
able energy technology, if powered by biogas or
hydrogen generated from renewables.
They produce electricity efficiently while
keeping emissions low. Like fuel cells, micro-
turbines can be paired with heat recovery
systems to achieve efficiencies of up to 80%.
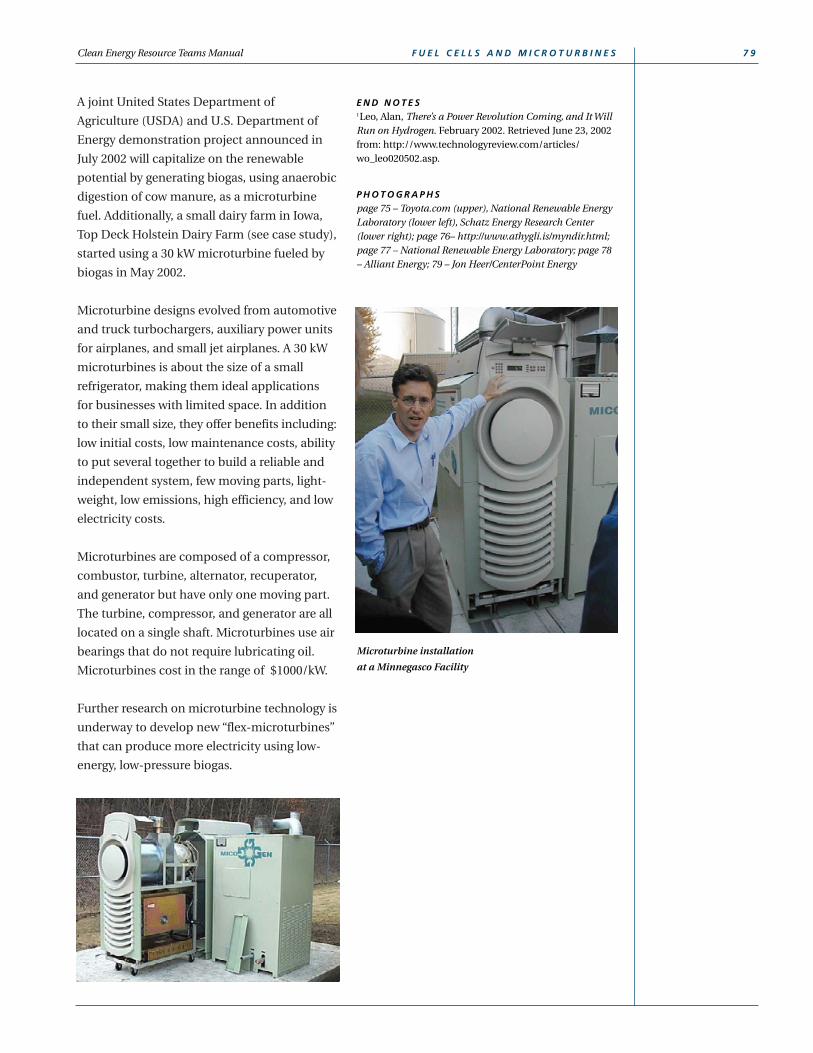
A joint United States Department of
Agriculture (USDA) and U.S. Department of
Energy demonstration project announced in
July 2002 will capitalize on the renewable
potential by generating biogas, using anaerobic
digestion of cow manure, as a microturbine
fuel. Additionally, a small dairy farm in Iowa,
Top Deck Holstein Dairy Farm (see case study),
started using a 30 kW microturbine fueled by
biogas in May 2002.
Microturbine designs evolved from automotive
and truck turbochargers, auxiliary power units
for airplanes, and small jet airplanes. A 30 kW
microturbines is about the size of a small
refrigerator, making them ideal applications
for businesses with limited space. In addition
to their small size, they offer benefits including:
low initial costs, low maintenance costs, ability
to put several together to build a reliable and
independent system, few moving parts, light-
weight, low emissions, high efficiency, and low
electricity costs.
Microturbines are composed of a compressor,
combustor, turbine, alternator, recuperator,
and generator but have only one moving part.
The turbine, compressor, and generator are all
located on a single shaft. Microturbines use air
bearings that do not require lubricating oil.
Microturbines cost in the range of $1000/kW.
Further research on microturbine technology is
underway to develop new “flex-microturbines”
that can produce more electricity using low-
energy, low-pressure biogas.
E N D N O T E S1Leo, Alan, There’s a Power Revolution Coming, and It WillRun on Hydrogen. February 2002. Retrieved June 23, 2002from: http://www.technologyreview.com/articles/wo_leo020502.asp.
P H O T O G R A P H S
page 75 – Toyota.com (upper), National Renewable EnergyLaboratory (lower left), Schatz Energy Research Center(lower right); page 76– http://www.athygli.is/myndir.html;page 77 – National Renewable Energy Laboratory; page 78– Alliant Energy; 79 – Jon Heer/CenterPoint Energy
Clean Energy Resource Teams Manual F U E L C E L L S A N D M I C R O T U R B I N E S 7 9
Microturbine installation
at a Minnegasco Facility

8 0 F U E L C E L L S A N D M I C R O T U R B I N E S Clean Energy Resource Teams Manual
H E L P F U L R E S O U R C E S F O R C O M M U N I T I E S
All web links listed here are available (and updated
if necessary) at www.mnproject.org (click on
“publications”)
Fuel Cells 2000: the Online Fuel Cell Information
Center Website. A nonprofit organization providing
extensive information on fuel cell technologies,
including a listing of fuel cell vendors.
(www.fuelcells.org)
How Stuff Works Website. Has general information
about hydrogen and fuel cells.
(www.howstuffworks.com/fuel-cell.htm)
(www.howstuffworks.com/hydrogen-
economy.htm.)
Minnesota Office of Environmental Assistance.
Website has several fact sheets including, “Fuel
Cells – Power Where It’s Needed” and “Hydrogen –
The New Fuel of Choice.”
(www.moea.state.mn.us)
National Fuel Cell Research Center. Information on
how fuel cells work, lists manufacturers and
researches, and provides detailed information on
research projects.
(www.nfcrc.uci.edu)
MIT Enterprise Technology Review. Technical
descriptions about how fuel cells work.
(http://www.technologyreview.com/articles/wo_le
o020502.asp)
World Business Council for Sustainable
Development. “DaimlerChrysler, Shell, and Norsk
Hydro: The Iceland Experiment” a case study of
Iceland and the Hydrogen Economy.
(www.wbcsd.ch)
U.S. Department of Energy Hydrogen Information
Network.
(www.eren.doe.gov/hydrogen/features.html)
Distributed Energy Resources. Information on the
DOE microturbine program can be found at:
(www.eren.doe.gov/der/microturbines/microtur-
bines.html)

it would also outline other options that could
be used instead.
Financial Analysis This analysis will evaluate
how much the system would cost and how the
owner would pay for it. Different entities, like
state government and industry, may have
different approaches and include different
components when completing a financial
analysis and therefore financial analyses must
be tailored to the specific project. For instance,
this section could also include a cost-
effectiveness evaluation that would detail
social, environmental, and avoided cost
benefits in addition to the simple payback
period. Usually included is a “pro-forma”, or
detailed year-by-year accounting of income
and expenses for the life of the project.
Shortcomings This section should address the
significant issues and potential pitfalls
associated with the project and feasibility
study analysis and propose solutions and
recommendations to address these issues.
Conclusion Final opinion regarding whether
or not the project should move forward
(should not be overly positive if the data does
not support it.)
Ideally, the lending organization will be able to
read through the feasibility study, clearly follow
the points and arguments, and arrive at the
same final conclusion.
F E A S I B I L I T Y S T U D Y
The first step in developing a project is to make
sure it can be done with the technological,
financial, managerial and other resources that
are available. Although a feasibility study can
be as simple as calculating the estimated cash
flow of a project, it is often a more formal
document. Lenders will typically require a
formal feasibility study.
Feasibility studies consider a proposed project
at a specific site. Both technical and financial
feasibility are considered, as well as potential
obstacles. Overall, the study should indicate
whether or not the project should move
forward, as well as providing the data and
assumptions that led to that conclusion.
Many feasibility studies contain the following
primary sections, although reports can vary as
to their order and contents 1:
Background This section will outline the
motivation for conducting the project (the
problem), the potential impacts/benefits of
implementing the project, and a description of
the facility, its components, and a site map;
this section should also foreshadow how the
option will be evaluated.
Technology Choice This section will outline
the proposed system, how it would fit in with
the existing facility, what gains the system
would provide, and how these would be used;
C H A P T E R 1 2 Developing a Project
CHAPTER TWO COVERED THE BASIC STEPS of community energy planning.
Once renewable energy potential has been assessed, and a decision made to
move forward with a project, it’s time to develop the project. This can be a very
complicated and time-consuming process, and may take a year or more to
complete. This section outlines some of the basic steps in developing a project,
including conducting a feasibility study, ownership, environmental assessment,
permitting, connecting to the grid, and financing. In many cases it will make sense to
hire an experienced project developer who is familiar with the technical, legal and
regulatory issues to guide you through the process.
In many cases it will
make sense to hire an
experienced project
developer who is
familiar with the
technical, legal and
regulatory issues to
guide you through the
process of developing
a project.

8 2 D E V E L O P I N G A P R O J E C T Clean Energy Resource Teams Manual
Improves the environment
Works well with agriculture
Helps with reliabilityconcerns
Recycles waste materialsand waste heat
Offers community economic development
Improves energy independence, local control, and energy security
Promotes learning aboutenergy
T H E P H I L L I P S
N E I G H B O R H O O D O F
M I N N E A P O L I S and The GreenInstitute are exploring a local
renewable energy plant thatwould provide space heating to neighborhoodbuildings and homes and electric power to thegrid. The Phillips Community EnergyCooperative (PCEC) is taking a closer look at thispossibility. They commissioned a preliminary feasibility study to examine the opportunitiesand challenges associated with the developmentof a biomass combined heat and power plant inthe neighborhood.
The purpose of a preliminary feasibility study isto summarize all aspects of the project to determine whether a full feasibility analysis iswarranted. A Minneapolis consulting firm,Trillum Planning and Development, conductedthe analysis.
The main topic of the 40-page study is the possible conversion of a former municipal wasteincinerator, located in the Phillips neighbor-hood, to a biomass combined heat and powerfacility. The study is quite comprehensive. Itexamines such topics as fuel availability, cogeneration potential, facility adaptation,equipment choices, environmental considera-tions, production costs, regulatory framework,business models and financing. Each topic isdescribed in the context of the project withchallenges and opportunities being detailed foreach category.
The conclusion of this analysis includes nextsteps and recommendations. The report recommendations that emerged include: conducting a comprehensive feasibility study,securing development rights and beginningnegotiations for acquisition of land andimprovements, securing funds for environmentalinvestigation of site and facility, drafting anEnvironmental Assessment Worksheet, andbeginning the MPCA Air Emission Permitprocess.
For more information contact:
Andrew Lambert
The Green Institute
612-278-7118
www.greeninstitute.org
★
C A S E S T U D Y:
Urban Biomass Plant Preliminary Feasibility Study

O W N E R S H I P
Ownership generally falls into two basic
categories: public or private. As communities
begin to select energy alternatives, they will
also need to consider which ownership option
will be most effective in accomplishing their
goals. For some projects the choice is obvious,
but for others, deciding who will own a project
will be slightly more complex. For instance,
when a particular entity within the community,
either a private organization or a public
institution, decides to move forward, they may
automatically decide to own the project. Many
of the school wind turbine projects are, for
example, logically owned by the school district.
However, when a community sits down to
establish a set of objectives for incorporating
renewable energy into its energy future, its
ownership options may be less clear.
Communities must decide whether or not they
want to own the generation, or partner with
the local utility and share ownership, or simply
buy renewable energy from the local utility.
Often a local government’s role will simply be
to encourage and provide opportunities for
renewable energy project development, rather
than to develop projects themselves.
When an individual
farmer or an
individual business is
evaluating ownership
possibilities, the issue
can become even
more complicated.
Often, renewable
energy operating
equipment can have
expensive upfront
capital costs. This can make projects
prohibitively expensive to do alone. Sometimes
farmers will just lease their land to developers,
rather than reaping the energy benefits for
themselves. Cooperatives might in some cases
present a collective option. The following
sections consider some of these options.
Clean Energy Resource Teams Manual D E V E L O P I N G A P R O J E C T 8 3
P U B L I C O W N E R S H I P
School Districts benefit from some funding
options not available to private sector entities.
First, the school districts are eligible for grants
and funding opportunities, and even bonding
opportunities that they would not qualify for
as a private entity.
Also, school district budgets are able to benefit
from the reduced electricity costs, the electricity
sold back to the utility, as well as the federal
and state production incentives. These
financial mechanisms are discussed further in
the financing section below.
Beyond financing, schools also have a unique
opportunity to educate the surrounding
community with the installation of a renewable
energy system. By attaching a system to the
school, the school suddenly takes on a leader-
ship role in educating the community not only
about the science and operating mechanisms
behind renewable energy, but also about the
environmental and potential economic
benefits associated with such a system.
If schools can begin educating the younger
generation of Minnesotans about renewable
energy now, when these children become our
future leaders they can make more informed
decisions about renewable energy. On-site
energy facilities can also serve as important
learning tools for science and economics
classes and can serve as a hands-on resource
to students and the surrounding community.
School districts may
be a good ownership
option for a wind
project, because they
are often able to take
advantage of funding
opportunities not
available to other
entities.
Spirit Lake, Iowa
Mike Demchik, Central
Lakes Agriculture Center,
Staples, MN

Counties and Municipalities Local govern-
ments have the potential to draw on a larger
base of funding than individuals. They also
have the benefit of being able to merge several
smaller projects from many different buildings
around their community into one larger
project to secure a better overall bulk-quantity
based price. See case study on page 87.
Counties and municipalities also have the
benefit of having control over local land use
and planning not specifically preempted by
state or federal government. This allows these
entities to exert some control over local energy
planning matters and also engage the
community around them in planning efforts.
Aspects of this leadership role were
emphasized in the Chisago County case study
in Chapter Two.
P R I VAT E O W N E R S H I P
Individuals, Farmers and Businesses Private
parties have the benefit of choosing their own
motivation for the project and determining
which conditions are most important to
measuring the project’s success. If the goal of
the project is to be more environmentally
conscious, then the metrics will be different
than if the goal is to increase farming
profits.
Financially, one of the benefits of private
ownership is the eligibility for production tax
credits for wind projects. These credits can
make or break the financial feasibility of
project and are therefore an important
element to consider. Of course, the economic
drawback of private ownership is that you and
your business alone incur all of the upfront
costs, but again, it depends upon your personal
motivation.
In some scenarios, it may be possible to
actually partner with a larger firm or simply
contract out one’s
land. In any case, it
will be important that
individuals pursuing
renewable energy
projects seek the
advice of experts, like
project developers,
engineers, and
attorneys, to ensure
that the process goes
smoothly and that all
necessary require-
ments are met.
Cooperative Ownership The Minnesota Wood
Energy Scale-Up Project (see page 39) and
Minnesota’s ethanol cooperatives are two
examples of farmer-owned renewable energy
cooperatives. The USDA provides information
about how agricultural cooperatives work and
how to form your own.2
Because cooperatives cannot take advantage of
the federal production tax credit for wind,
some farmers have set up Limited Liability
Corporations (LLCs) to function very much like
a cooperatives. MinWin1 and MinWin2, LLCs
in Pipestone county, each have about 60
farmer/shareholders for each of their 2 MW
wind projects (see page 28).
Businesses, farmers and individuals also have
the ability to work more as a loosely knit
agreement between like-minded parties rather
than as a formal business entity. A group of
farmers in Wisconsin has recently discussed
8 4 D E V E L O P I N G A P R O J E C T Clean Energy Resource Teams Manual
Paynesville Public School,
Paynesville, MN
Richard and Roger Kas
built a wind turbine on
their farm in Woodstock,
MN

jointly hiring an engineer to develop plans for
an anaerobic digester. In this scenario, they
will each install their own digester, but they
will have shared the cost of developing an
engineering design. This sort of approach has
great potential to help individuals cut costs by
sharing the financial burden.
E N V I R O N M E N TA L A S S E S S M E N T
Before proceeding with any project, it would
be prudent to evaluate the potential environ-
mental impact a project may have on local site
conditions. For some projects this may not
present a huge obstacle. After all, few wind
projects or solar installations will have
significant detrimental environmental impacts
on their surroundings as long as they are sited
appropriately.
However, biomass and other types of energy
discussed here do have environmental impacts
– some of which may be positive, and some
negative. By evaluating the potential environ-
mental concerns in advance, communities
and property owners can avoid unexpected
mishaps in the future.
For most small generation projects, a formal
environmental assessment or environmental
impact statement is not required. Minnesota
Planning’s Guide to Minnesota Environmental
Review Rules 3 includes an exemption category
for construction of an electric generation plant
less than five megawatts. The report also out-
lines the difference between an Environmental
Assessment Worksheet and an Environmental
Impact Statement and when the two are
required.
Anyone considering a new project should
review these requirements and possibly talk
with a representative of the Minnesota
Environmental Quality Board to clarify what
permitting and environmental review
documentation may be required.
Clean Energy Resource Teams Manual D E V E L O P I N G A P R O J E C T 8 5
P E R M I T T I N G
In Minnesota, there are several governmental
authorities that may require you to submit a
permit. Permitting may be at the local, state,
and/or federal level; be sure to check with all.
One of the first permits that should be consid-
ered is the environmental rule outlined above.
In addition, for wind projects over 5 MW, the
Environmental Quality Board has specific
requirements for obtaining a wind-siting
permit; for less than 5 MW it’s a local issue.4
The Federal Aviation Administration (FAA) also
requires that wind projects complete a
permitting process. For anaerobic digesters,
operators will also need to contact the
Minnesota Pollution Control Agency to
complete their environmental review.
Other agencies that may need to be involved
include the Department of Natural Resources,
the Midwest branch of the US Fish and Wildlife
Service, and the Minnesota Historic
Preservation Office.
All projects will probably need to obtain
building and electrical permits from either the
city or county building department. In many
cases the contractor installing the equipment
can take care of these permits, but this should
be negotiated in advance. Power developers
will also need to address any necessary Federal
Energy Regulatory Commission (FERC)
permits.
Pope County Courthouse,
Glenwood, MN

the Minnesota Public Utilities Commission to
develop generic interconnection standards and
rates that will “promote the use of distributed
resources… [and] provide for the low-cost,
safe, and standardized interconnection of
facilities.”5 This process is expected to be
concluded in 2003 or 2004.6
In other states that have adopted standardized
interconnection agreements, including Texas
and California, the standards have been
successful in encouraging distributed
generation. California, for example, has a
“pre-certification” process for manufacturers
of distributed generating equipment. Once a
system is pre-certified, the utility cannot
require an individual customer to pay for
additional studies that have already been
covered in the pre-
certification process.
California also has an
exemption from
standby fees for small
generators.
N E T M E T E R I N G
Net metering allows qualifying facilities to
consume electricity from the grid when they
are not producing power, and sell electricity
back to the grid when they are. This flow can
typically be measured using your standard
utility meter that spins forward when the
utility is supplying energy and spins backward
when the utility is taking energy.
Minnesota's net metering laws were
established in 1983 and apply to all of the
state's investor-owned utilities, municipalities
and rural electric cooperatives. Renewable
energy generators of 40 kW or less are eligible
for the program, and there is no limit to total
state-wide capacity allowed. Utilities are
required to purchase net excess generation at
the average retail rate, which can be twice as
much, or more, than the standard utility buy-
back rate.
8 6 D E V E L O P I N G A P R O J E C T Clean Energy Resource Teams Manual
Often it will be easiest to seek assistance from
an experienced developer to help maneuver
through the complicated array of permits, but
it will always be prudent for any project to
involve these agencies, or any other potential
permitting agencies, prior to starting a project
to ensure that it will not be halted somewhere
further down the road.
C O N N E C T I N G T O T H E G R I D
It is very important to involve the local utility
from the very beginning of any project that will
tie into the electric grid. Each utility has
requirements for interconnection in order to
protect the safety of their line workers and
maintain the integrity of the power system.
These requirements may vary with the size and
type of generator. The utility may require the
customer to pay for special engineering studies
to determine the impact of adding additional
generation to the grid, which can be expensive.
Usually extensive studies are unnecessary for
small projects (less than 1 MW or so).
The utility may also
charge fees for servic-
es necessary for the
generator to operate,
such as upgrades to
utility lines. Another
charge that may apply
for generators that
serve a large load,
such as a Combined Heat and Power facility, is
a “standby fee”, or a charge for the utility to
back up the load that the generator serves in
case the generator goes down. Standby fees
apply even if the facility does not actually use
energy from the utility.
Many utility-required standards and studies
are appropriate for larger generators, but may
be unnecessary and burdensome for smaller
generators. As well, requirements may vary
considerably from utility to utility. Because of
this, in 2001 the Minnesota legislature required
It is important to the
success of a project to
begin discussions with
the electric utility
early in the process.

The purchase of net excess generation at retail
rates distinguishes Minnesota's net metering
legislation from programs in most other states.
Only Wisconsin also provides for the purchase
of net excess generation at retail rates. It is also
worth noting that Minnesota, Maryland,
Nevada, New York, and California are the only
states where net metering is mandated in
statute by the state legislature. As of 2000, the
Minnesota Department
of Commerce reported
that there were 110
facilities with net
billing arrangements.
Of these facilities, 23
were photovoltaic and
87 were wind facilities.7
F I N A N C I N G
Financing for renewable energy projects can
come from multiple sources, including
up-front equity, private lending sources,
incentives payments and low-interest loans.
The following gives a brief overview of some of
the types of funding available.
State and Federal Incentive Payments Both
federal and state production incentives exist
for renewable energy. These may exist as a tax
incentive, or a production payment. Eligibility
and availability of funds is notoriously subject
to change, so any project that relies on
incentive payments will need to be sure that
incentives will still be available when the
project goes on-line.
Improves the environment
Works well with agriculture
Helps with reliabilityconcerns
Recycles waste materialsand waste heat
Offers community economic development
Improves energy independence, local control, and energy security
Promotes learning aboutenergy
T H E M E T R O C O U N T I E S
E N E R G Y TA S K F O R C E is agreat example of local governmentscoming together to work on energy
issues and joint projects that aregreater than the sum of what they could doindividually. In response to the ongoing changesin the electric utility industry and other energymarkets, Hennepin County initiated aMetropolitan Counties Energy Task Force in late1999. The Task Force consists of one county commissioner from each of the seven metrocounties.
The Task Force meets monthly to focus on energy issues relating to the Twin Cities area.The meetings serve to educate commissionerson topics such as wind energy, potential energyprojects, and legislative issues relating to energyand conservation. The Task Force sponsors anenergy workshop every summer.
The Task Force recently initiated a model energyconservation building in each county. The energyconservation program consists of each countyselecting a building to which they would make
energy conservation improvements as a demonstration for the public. In addition, theyare developing models for energy efficiency procedures and financing that may be appliedto a range of buildings throughout the region.
The Task Force is exploring others ways that itcan become more active in guiding policy andinitiating metro-wide programming relating toconservation and energy.
The meetings are attended not only by TaskForce members but also by representatives fromthe Public Utilities Commission, the stateDepartment of Commerce, local utilities andengineering firms. The meetings serve to breakdown barriers between the counties and otheractors in energy policy and educate the attendees on all aspects of the issue. Workingtogether, the Task Force hopes to effect positiveenergy policy for the metro area.
For more information contact:
Melissa Rolling
O’Neill, Grills, & O’Neill, L.L.P.
651-298-8300
★
C A S E S T U D Y:
Metro Counties Energy Task Force
Clean Energy Resource Teams Manual D E V E L O P I N G A P R O J E C T 8 7

8 8 D E V E L O P I N G A P R O J E C T Clean Energy Resource Teams Manual
The end of this chapter contains links to
websites with updated information on federal
and state renewable energy production
incentives and other programs.
State and Federal Loans and Grants Beyond
production incentives, there are also numerous
loan programs available to help finance
renewable energy projects. The Minnesota
Department of Agriculture has summarized
many of these programs (see Appendix B), and
see the end of this chapter as well.
Schools, municipalities, counties and other
government units are eligible for State Loan
Money through the Department of Commerce.
These loans present borrowers with lower
interest rates because the state has enough
buying power to garner lower borrowing rates.
Schools are also eligible for “lease-purchase
agreements”, which are favorable interest rate
loans available to schools because they are
non-taxable, or can issue capital notes, which
are like bonds but do not require election
approval. Of course, schools can also open a
renewable energy project to a general bonding
referendum, which could then either be voted
up or down by the community.
Grants are also likely available to schools
through the U.S. Department of Education,
U.S. Department of Energy, and through
environmental education entities.
Farmers and rural small businesses are eligible
to receive funding from the Renewable Energy
Systems and Energy Efficiency Improvements
Grant Program, administered by the U.S.
Department of Agriculture. This grant can fund
up to 25% of total project costs. See the end of
this chapter for sources of more detailed
information about each of these programs.
Private Lending Even if a project receives
state or federal funding, some of the funds will
probably need to come from private lenders,
including banks and agricultural lenders like
AgStar Financial Services. Before heading to
the bank, project developers will need to have
their project proposal materials, feasibility
study, and site data ready.
In instances where part of the project objective
includes selling power to the local utility, it
will be important to have a power purchase
agreement from the local utility. The purchase
agreement will help the bank gauge the
financial viability of the project and evaluate
the potential payback period.
Local banks in Minnesota are becoming
increasingly comfortable with funding
renewable energy projects, especially in the
southwest corner of the state, where local
banks have funded many wind projects.
Renewable Development Fund Xcel Energy
created the Renewable Development Fund as
part of a legislative deal in 1994 allowing the
company to store it’s nuclear waste above-
ground at the Prairie Island nuclear power
plant near Red Wing. The fund currently
provides about $8.5 million per year in grants
for renewable energy projects.
Xcel Energy completed its first round of
funding under this program in 2001. Grant
applications can be submitted for wind,
biomass, solar and hydro projects, but the fund
currently gives special preference to biomass.
Glenwood State Bank,
Glenwood, MN

Clean Energy Resource Teams Manual D E V E L O P I N G A P R O J E C T 8 9
Funding is split between in-the-ground renew-
able energy projects and research and develop-
ment projects that would lead these technolo-
gies toward full commercialization. For more
information see www.xcelenergy.com.
M A K I N G I T H A P P E N
This chapter has covered some of the basic
steps involved in getting a project off the
ground, and some of the choices facing project
developers. As you can see from reading this
chapter, it can be a complicated process to see
a project from start to finish, and many people
choose to work with an experienced project
developer who can guide them through the
process. Although it comes at a price, this can
reduce project risk. However the project moves
forward, it is important to consider all the
aspects of developing a project discussed here
before beginning the project in order to avoid
potential pitfalls.
E N D N O T E S1McMurrey, David, Online Technical Writing:Recommendation and Feasibility Reports,http://www.io.com/~hcexres/tcm1603/acchtml/feas.html.
2For more information see their online documents:http://www.rurdev.usda.gov/rbs/pub/cir55/c55text.pdfand http://www.rurdev.usda.gov/rbs/pub/cir7/cir7.pdf..
3Minnesota Environmental Quality Board (division ofMinnesota Planning), Guide to Minnesota EnvironmentalRules, St. Paul, MN, April 1998(www.mnplan.state.mn.us/pdf/rulguid3.pdf).
4These rules can be found at:www.mnplan.state.mn.us/eqb/wind/index.html.
5Minnesota Statutes, Section 216B.1611 (2002).
6A comprehensive website on the status of the distributedgeneration rules in MN has been compiled by John Baileyat the Institute for Local Self Reliance:www.newrules.org/dgtariff/index.html.
5Database of State Incentives for Renewable Energy,Minnesota Incentives for Renewable Energy,www.dsireusa.org/.
P H O T O G R A P H S
page 81 – Spirit Lake Community School District; page 82–Trillium Planning and Development, Inc.; page 83 –Dwight Tober/NRCS Plant material center (left), Spirit LakeCommunity School District (right); page 84 – Carl Nelson/The Minnesota Project (left), Lisa Daniels/Windustry(right); page 85 – Carl Nelson/The Minnesota Project; page86 – National Renewable Energy Laboratory; page 87 – Lola Schoenrich/The Minnesota Project; page 88 – CarlNelson/The Minnesota Project; page 89 – Carl Nelson/TheMinnesota Project
Glenwood, MN

9 0 D E V E L O P I N G A P R O J E C T Clean Energy Resource Teams Manual
H E L P F U L R E S O U R C E S F O R C O M M U N I T I E S
All web links listed here are available (and updated
if necessary) at www.mnproject.org (click on
“publications”)
Database of State Incentives for Renewable Energy.
This website contains comprehensive information
on state and federal grants, loans, tax credits and
other incentives for renewable energy.
(www.dsireusa.org)
Minnesota Department of Commerce Energy
Information Center. Commerce’s website has a list
of incentives available for state renewable energy
projects. Energy specialists are also available by
phone: 651-296-5175 or 800-657-3710 (toll-free);
email: [email protected]
(www.commerce.state.mn.us)
U.S. Department of Agriculture, Renewable Energy
Systems and Energy Efficiency Improvements Grant
Program. This program was initiated under the
Energy Title of the 2002 Farm Bill. In 2003, this
program provided $23 million in grants for farmers
and rural small businesses.
(www.rurdev.usda.gov/rd/farmbill/9006resources.html)
Environmental Review. Information from
Minnesota Planning about environmental review
process, documents, and how the Environmental
Quality Board works for development and approval
of new projects.
(www.mnplan.state.mn.us/eqb/review.html#How
%20it%20works)
Wind Turbine Siting. Information from Minnesota
Planning regarding wind project permitting and
siting for wind projects over 5 MW.
(www.eqb.state.mn.us/EnergyFacilities/wind.html)
Online Technical Writing: Recommendation and
Feasibility Reports. Used as an online manual for
technical writing courses around the world.
(www.io.com/~hcexres/tcm1603/acchtml/feas.html)
Xcel Energy: Interconnection Guidelines For Parallel
Operation of Distribution Connected Customer-
Owned Generation. This document applies to Xcel
Energy territories in Michigan, Minnesota, North
Dakota, South Dakota and Wisconsin.
(www4.xcelenergy.com/EnergyMarkets/CustInterc
onnectGuide/TOC.asp)

C H A P T E R 1 3 Towns of Tomorrow – Vision for the Future
MINNESOTA IS RICH IN THE RENEWABLE ENERGY RESOURCES especially
wind and biomass that will allow us to build a sustainable energy future. Using
local, renewable energy will bring cleaner air and water, local economic
development opportunities, and will help revitalize our rural and urban
communities. This workbook has explored many of the energy technologies
available to communities interested in diversifying their energy supply to
include locally generated, clean, renewable energy. With wind, biomass, solar energy,
and increased efficiency through conservation and cogeneration, the community
energy system of tomorrow could be very different from the one we have today.
Using local, renewable
energy will bring
cleaner air and water,
local economic
development
opportunities, and
will help revitalize our
rural and urban
communities.
But could it really? After all, each community is
part of a larger system. Our electric system is
owned by multi-state, investor-owned utilities
and large cooperatives. It is shaped and
regulated by state policy. Our state system is
interconnected with the regional electricity
system and with the national system. National
policy and regulation affect what happens in
each city here. The way that we produce and
use energy in the United States affects people
and the environment all over the planet.
Sure, good ideas implemented on a local level
make one community a better place to live and
work. But does it really make a difference in
the bigger picture?
S M A L L C H A N G E S A D D U P
In fact it does. Creative vision for real change
often comes from people at the local level.
Think about the change in the national under-
standing of smoking, of campaigns against
drunk driving, of recycling. Recycling programs
started with a few scout troops collecting
aluminum cans and newspapers. Today, every-
one has a recycling bin out back. Successful
vision and change at the local level inspires
and drives changes at the state level. Success at
the state level can drive national policy.
Vision from community energy projects is
already impacting thinking within Minnesota
state government. State legislators have gotten
interested in a number of energy ideas
pioneered at the local level including on-farm
anaerobic digesters and farmer-owned wind
developments. Legislators got interested in the
idea of moving toward a hydrogen-based
economy in Minnesota, in part, because of the
vision and initiative of a citizen leader in Lake
City.
Citizens in Lake City are looking at the
feasibility of adding wind energy to the local
municipal electric system. One of them came
across information about the hydrogen fuel
cell initiative in Iceland, and began a
correspondence with officials there. Through
this relationship, an Icelandic delegation visited
Minnesota in the spring of 2002 to talk about
their hydrogen initiative.
State officials, business leaders, and University
researchers were inspired and have convened a
working group to
examine the potential
role of hydrogen in
Minnesota’s future.
State legislators are
interested in
positioning the state
for the future and a
number of hydrogen
initiatives were
passed during the 2003
legislative session.

9 2 T O W N S O F T O M M O R R O W – A V I S I O N F O R T H E F U T U R E Clean Energy Resource Teams Manual
I T S TA R T S W I T H V I S I O N
Minnesota is well positioned to lead the nation
in supplying our industries, farms, homes and
government with renewable energy that
protects the environment for future generations
while creating economic opportunity today.
Minnesota has the renewable resources to take
the next bold step. It begins with a vision of
what might be possible for our state and for
our communities.
Consider the following real examples illustrating
bold visions of dramatically different energy
futures that led to a cleaner environment and
cutting edge business development. The first
describes energy efficiency in Sweden, the
second wind development in Denmark and the
third the Icelandic hydrogen initiative. All are
countries very like Minnesota in size,
population, and heritage. Imagine what could
happen if Minnesota did the same.
E F F I C I E N C Y F O R T H E F U T U R E
Imagine a country where the government,
businesses, and citizens all agreed that creating
energy efficiency in all sectors, from residential,
to commercial, to industrial, would be their
primary energy focus. Efficiency would guide
all their future energy planning. This country,
not unlike Minnesota today, had a growing
population and was faced with projected
energy shortfalls within the decade. To make
matters worse, it was almost completely
dependent upon imported fossil fuels.
With government taking the lead, partnering
with utilities and businesses, policies were
enacted that transformed engineering and
manufacturing practices. They built more
efficient homes and buildings and produced
goods more efficiently. Citizens supported
these efforts by buying more efficient homes
and autos, and by supporting legislation that
encouraged continued efficiency
improvements.
The place is Sweden, where energy efficiency
has become the norm. Swedes, from
government officials, to manufacturing
leaders, to average citizens, decided that they
would have the most efficient housing in the
world. They made energy efficiency a priority.
In roughly twenty years, they have been able to
make housing manufacturing one of their
most innovative and modern industries, and
have become a model for the rest of the world.1
Minnesota too could make huge strides just
by implementing greater efficiency improve-
ments. If all state, county and municipal
buildings were retrofitted with strict
requirements for energy conservation;
Minnesota would make good progress in
reducing energy demand. If every person in
the state bought only the most efficient Energy
Star appliances, the state could make more
progress in reducing consumption. If commu-
nities all around the state partnered with local
utilities to improve the efficiency of homes and
businesses, the state could make huge strides
in reducing the amount of coal it burned.
There are so many options. Minnesota just
needs to lay out the vision and work to make it
a reality.
Stockholm, Sweden
Change begins with
a vision of what
might be possible for
our state and for our
communities.
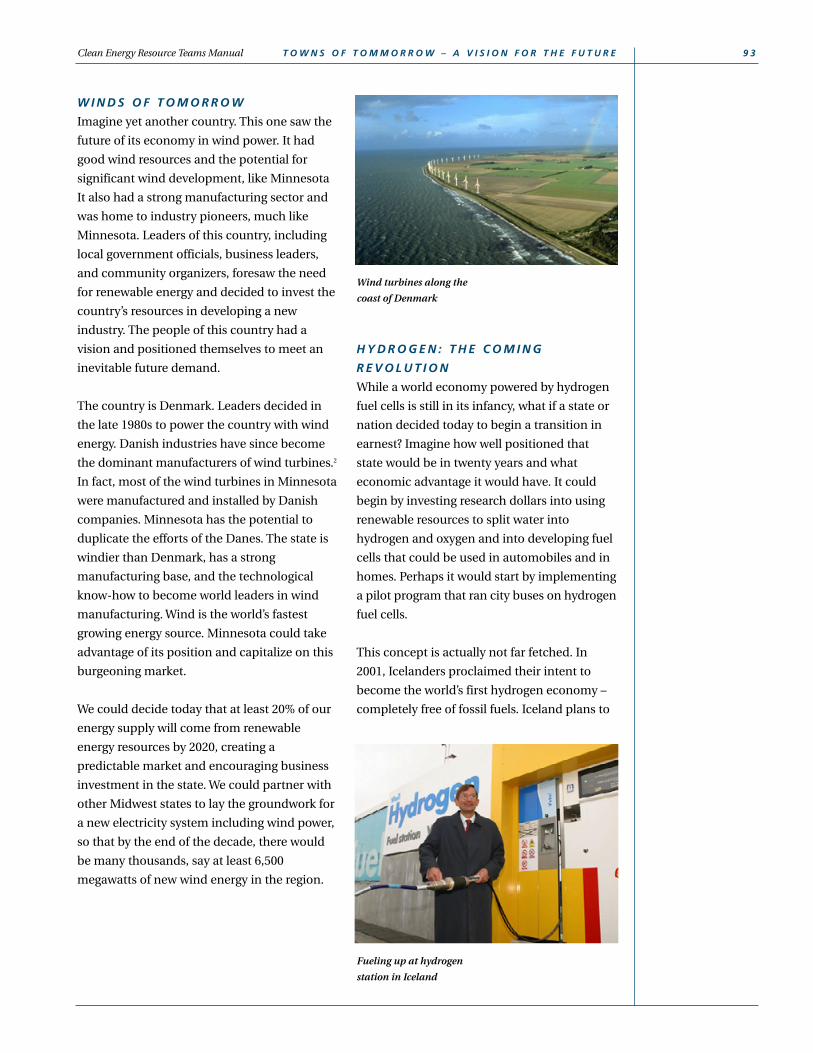
Clean Energy Resource Teams Manual T O W N S O F T O M M O R R O W – A V I S I O N F O R T H E F U T U R E 9 3
Wind turbines along the
coast of Denmark
Fueling up at hydrogen
station in Iceland
W I N D S O F T O M O R R O W
Imagine yet another country. This one saw the
future of its economy in wind power. It had
good wind resources and the potential for
significant wind development, like Minnesota
It also had a strong manufacturing sector and
was home to industry pioneers, much like
Minnesota. Leaders of this country, including
local government officials, business leaders,
and community organizers, foresaw the need
for renewable energy and decided to invest the
country’s resources in developing a new
industry. The people of this country had a
vision and positioned themselves to meet an
inevitable future demand.
The country is Denmark. Leaders decided in
the late 1980s to power the country with wind
energy. Danish industries have since become
the dominant manufacturers of wind turbines.2
In fact, most of the wind turbines in Minnesota
were manufactured and installed by Danish
companies. Minnesota has the potential to
duplicate the efforts of the Danes. The state is
windier than Denmark, has a strong
manufacturing base, and the technological
know-how to become world leaders in wind
manufacturing. Wind is the world’s fastest
growing energy source. Minnesota could take
advantage of its position and capitalize on this
burgeoning market.
We could decide today that at least 20% of our
energy supply will come from renewable
energy resources by 2020, creating a
predictable market and encouraging business
investment in the state. We could partner with
other Midwest states to lay the groundwork for
a new electricity system including wind power,
so that by the end of the decade, there would
be many thousands, say at least 6,500
megawatts of new wind energy in the region.
H Y D R O G E N : T H E C O M I N G
R E V O L U T I O N
While a world economy powered by hydrogen
fuel cells is still in its infancy, what if a state or
nation decided today to begin a transition in
earnest? Imagine how well positioned that
state would be in twenty years and what
economic advantage it would have. It could
begin by investing research dollars into using
renewable resources to split water into
hydrogen and oxygen and into developing fuel
cells that could be used in automobiles and in
homes. Perhaps it would start by implementing
a pilot program that ran city buses on hydrogen
fuel cells.
This concept is actually not far fetched. In
2001, Icelanders proclaimed their intent to
become the world’s first hydrogen economy –
completely free of fossil fuels. Iceland plans to

9 4 T O W N S O F T O M M O R R O W – A V I S I O N F O R T H E F U T U R E Clean Energy Resource Teams Manual
derive all its hydrogen via electrolysis powered
by renewably generated electricity, rather than
from fossil fuels. Rather than waiting for
someone else to take the first step, Iceland
stepped into the forefront, and became the
world’s leader in creating a vision for a fossil
fuel-free energy future.
In fact, the plan is to begin this transition by
using fuel cells on city buses and expanding
from there. The first public hydrogen fueling
station opened in Iceland in April 2003. By
taking such a step, Icelandic developers will be
able to begin building a nation-wide hydrogen
infrastructure system – positioning themselves
well ahead of the rest of the world and primed
to market their knowledge as everyone else
plays catch-up.
A V I S I O N F O R M I N N E S O TA
Minnesota leaders, too, could articulate and
embrace a vision of a very different energy
future, including greatly increased
conservation, electricity generated from
renewable resources like wind, biomass, and
solar, and eventually, an economy running
entirely on hydrogen generated using
renewable power. We could, as a state, as
communities, as leaders, set these goals, plot a
course, enact policies, and create incentives to
achieve it. Community level initiatives could
compel that vision. What are we waiting for?
Community level
initiatives could
compel a new energy
vision for Minnesota.
What are we waiting
for?
E N D N O T E S1Noble, Michael. Our Electricity System: Crisis of Vision,Minnesota Journal Volume 19, Number 7 (2002): 1-2.
2ibid
P H O T O G R A P H S
page 91 – Chuck Roberts/Fokti.com (upper), NationalRenewable Energy Laboratory (lower); page 92– YahooGreetings; page 93 – Danish Wind Energy Information(upper), http://www.athygli.is/myndir.html (lower);

Appendix
A P P E N D I X A
Comparison of Costs for Selected Energy Technologies
A P P E N D I X B
Financial Assistance Programs for Renewable Energy Projects
The table presented in Appendix B was prepared in 2002 by the Minnesota Department of Agriculture. The first two pages list loan programs, and the nexttwo pages list incentive payments, tax credits, and grants for renewable energysystems. In addition to the programs listed here, since this fact sheet was published, the following grant program was established:
USDA Renewable Energy Systems and Energy Efficiency Improvement Grant andLoan Program. This provides up to $23 million nationally for renewable energyprojects and energy efficiency projects for farmers and rural small businesses.(www.rurdev.usda.gov/rd/farmbill/9006resources.html)
In addition, a federal tax credit is being considered in Congress that would provide a tax credit for each kWh generated from farm biogas systems.
A good source of up-to date information on both federal and state incentives isthe Database of State Incentives for Renewable Energy (DSIRE)(www.dsireusa.org)
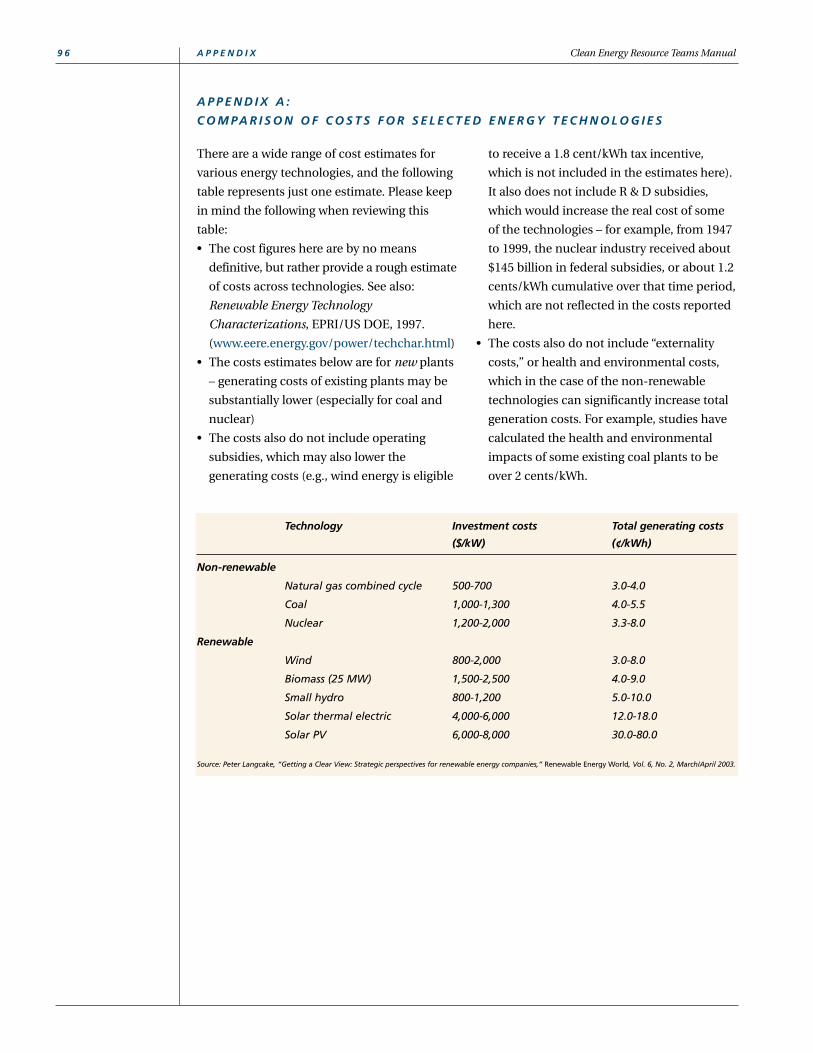
9 6 A P P E N D I X Clean Energy Resource Teams Manual
There are a wide range of cost estimates for
various energy technologies, and the following
table represents just one estimate. Please keep
in mind the following when reviewing this
table:
• The cost figures here are by no means
definitive, but rather provide a rough estimate
of costs across technologies. See also:
Renewable Energy Technology
Characterizations, EPRI/US DOE, 1997.
(www.eere.energy.gov/power/techchar.html)
• The costs estimates below are for new plants
– generating costs of existing plants may be
substantially lower (especially for coal and
nuclear)
• The costs also do not include operating
subsidies, which may also lower the
generating costs (e.g., wind energy is eligible
to receive a 1.8 cent/kWh tax incentive,
which is not included in the estimates here).
It also does not include R & D subsidies,
which would increase the real cost of some
of the technologies – for example, from 1947
to 1999, the nuclear industry received about
$145 billion in federal subsidies, or about 1.2
cents/kWh cumulative over that time period,
which are not reflected in the costs reported
here.
• The costs also do not include “externality
costs,” or health and environmental costs,
which in the case of the non-renewable
technologies can significantly increase total
generation costs. For example, studies have
calculated the health and environmental
impacts of some existing coal plants to be
over 2 cents/kWh.
Technology Investment costs Total generating costs
($/kW) (¢/kWh)
Non-renewable
Natural gas combined cycle 500-700 3.0-4.0
Coal 1,000-1,300 4.0-5.5
Nuclear 1,200-2,000 3.3-8.0
Renewable
Wind 800-2,000 3.0-8.0
Biomass (25 MW) 1,500-2,500 4.0-9.0
Small hydro 800-1,200 5.0-10.0
Solar thermal electric 4,000-6,000 12.0-18.0
Solar PV 6,000-8,000 30.0-80.0
Source: Peter Langcake, “Getting a Clear View: Strategic perspectives for renewable energy companies,” Renewable Energy World, Vol. 6, No. 2, March/April 2003.
A P P E N D I X A :
C O M PA R I S O N O F C O S T S F O R S E L E C T E D E N E R G Y T E C H N O L O G I E S

Wind Energy Value Added Agricultural Improvement Manure Digester Sustainable Ag
Pilot Loan Program Stock Loan Participation Loan Loan Program Loan Program
Residence: Minnesota only Minnesota only Minnesota only Minnesota only Minnesota only
Individual Individual Individual Individual Individual
Any Improvement to Alternative Energy
Real Estate Utilization
Loan Amount: (RFA – 45%) $500,000 45% Participation 45% Participation $250,000 $25,000 - 7 yr.
up to $24,000 up to $125,000Local Lenders Local Lenders Local Lenders
(RFA Participation) (RFA Participation) (RFA Participation)
Stock Purchased
Security Agreement
1st $125,000 @ 6% 4% 0% throught 6/30/03 6%Balance - @ 7%
10 yr. on RFA 8 yr. on RFA 10 yr. on RFA 10 yr. 7 yr.
Participation Participation Participation
Fees: $50. Application $50. Application $50. Application No Fees No Fees
(Non Refundable) (Non Refundable) (Non Refundable)Farm Full Time? Yes Yes Yes Yes Yes
Equity Required: Negotiable Negotiable Negotiable Negotiable Negotiable
Web Site: www.mda.mn.us/agfinance www.mda.mn.us/agfinance www.mda.mn.us/agfinance www.mda.mn.us/agfinance www.mda.mn.us/agfinance
Prepared by: Minnesota Department of Agriculture
90 W. Plato Blvd.
St. Paul, MN 55107
Date: August 9, 2002
STATE FINANCING PROGRAMS
RURAL FINANCE AUTHORITY (RFA) AND MN DEPARTMENT OF AGRICULTURE
Financial Assistance for Renewable Energy Projects
Requirements
Borrowing Entity:
Loan Purpose: Wind Turbine Wind Generation Facilities Wind Turbine
Lending Entity: MN Dept. of Agriculture MN Dept. of Agriculture
Negotiable
6%
Amortization:
Interest rate:
Security: Real Estate Real Estate Negotiable

Agency:Farm Service Agency (FSA)
Small Business Administration (SBA)
Farm Ownership Guaranteed 504 Certified Intermediary Re-lending B and I GuaranteedGuaranteed Loan Development Co. Program Loans
Residency: Minnesota only Minnesota only Minnesota only Minnesota onlyIndividual, LLC or LLP Community based certified
development companyNon-profits or local government
Real estate, machinery and equipment, buildings
Real Estate Create and maintain employment and improve economic climate.
Dollar Parameter: $731,000 OL & FO $1,300,000 $2 million maximum/intermediary $750,000 initially. Recipient - $250,000.
Maximum $25,000,000
Local lender Local lender - 50%. CDC - (jr. lien) - 40%. Borrower - 10%.
USDA to intermediary. Intermediary to recipient.
Banks, credit unions, insurance companies, Farm Credit Services, savings and loan associations.
Real estate Real or personal property of intermediary or recipient.
Set by lender Based on 5 and 10 year 1% to intermediarytreasury issues Negotiable to recipient
Up to 40 years 10 to 20 years 30 year maximum Lender negotiatedFees: Yes 3% of the SBA debenture 2% of guarantee
(Non Refundable)Equity Required: Negotiable 10% Negotiable Negotiated by lender
Other Criteria: Job creation Areas of under 25,000 people. Unable to obtain credit elsewhere.
Rural area. Population under 50,000.
Web Site: www.fsa.gov/pas/default.asp www.sba.gov www.usda.gov www.usda.gov
Prepared by: Minnesota Department of Agriculture90 W. Plato Blvd.St. Paul, MN 55107
www.usda.gov
FEDERAL FINANCING PROGRAMS
Eligible Entity:
Loan Purpose: Community economic development; i.e.: wind turbine. Fixed assets.
Community development. Innovative projects, land, buildings.
Lending Entity:
Negotiated by lender
Lender decisionAssets being financed. Personal guarantees.
Financial Assistance for Renewable Energy Projects
Program Requirements
USDA RURAL DEVELOPMENT
Other Financing ConsiderationsUSDA Rural Development has several other financing programs targeted at rural areas that may offer some opportunity under special circumstances. Most of these financial assistance programs involve a community based non-profit organization or a governmental agency as the coordinating lender. These programs are Rural Economic Development Loan and Grant, Rural Business Grant and B and I Direct Loan Programs.
For further information on these programs, you can contact the web site listed below, or telephone: 651-602-7799.
Commercial lenders are studying and researching their role in financing renewable energy projects, especially wind turbine installation, as a means of enhancing and promoting rural development. Long term production contracts that provide an excellent income stream are an important part of the criteria for their financial participation.
Date: August 9, 2002
Amortization:
Interest Rate:
Security:

Selected Government Incentives for Renewable Energy in Minnesota – August 12, 2002
Applicable Technology Type of Incentive
Incentive Provider
Description
Biomass Wind Solar
Eligible Recipients Effective Dates Authority
Federal Renewable Energy Production Incentive Annual incentive payment of 1.74¢ per kilowatt-hour (in 2002 dollars; payment is adjusted annually for inflation) for the first 10 years of operation, as annual appropriations permit. Solar, wind, closed-loop biomass, or geothermal facilities receive priority; any remaining funds may be used for payments to open-loop biomass facilities, including anaerobic digesters.
US Department of Energy www.eren.doe.gov/power/repi.html
x x x Facilities owned by non-taxable entities such as state and local governments (e.g., municipal utilities) and non-profit electric cooperatives
For production started between Oct 1, 1993 & Sept 30, 2003
Code of Federal Regulations Citation:
10 CFR 451
Incentive Payments
State Minnesota Renewable Energy Production Incentive A 1.5¢ per kilowatt-hour payment quarterly for up to the first 10 years of electricity generation from new on-farm anaerobic digesters and small-scale wind energy projects (2 MW or less, or 7 MW or less if owned by a cooperative with at least 51% local membership). The wind incentive is first-come first-served until a 100-MW statewide cap is reached. The payment rate is fixed.
Minnesota Department of Commerce: Jeremy DeFiebre, 651-297-1221, [email protected]
x x Small-scale producers in the commercial, industrial, residential, non-profit, utility, and tribal council sectors, regardless of tax liability
Digesters— Jul 1, 2001 through Dec 31, 2015. Wind—for production started before Jan 1, 2005, until program is fully subscribed
Mn Statutes 2001:
216C.41
Renewable Electricity Production Tax Credit A tax credit of 1.5¢ per kilowatt-hour for the first 10 years of operation for electricity generated by wind, closed-loop biomass and poultry waste.
Database of Incentives for Renewable Energy www.dsireusa.org IRS Form 8835 www.irs.gov/pub/irs-pdf/f8835.pdf
x x Taxable corporate entities in the commercial and industrial sectors
Expires Dec 31, 2003
US Code Citation:
26 USC 45 (1994)
Income Tax Credits
Federal
Solar & Geothermal Business Energy Tax Credit Tax credit equal to 10% of the purchase and installation cost of solar heating, solar electricity, or active geothermal energy equipment.
Database of Incentives for Renewable Energy www.dsireusa.org IRS Form 3468 www.irs.gov/pub/irs-pdf/f3468.pdf
x Same as above Ongoing, no expiration date
US Code Citation:
26 USC 48 (1994)
Federal Accelerated Cost Recovery System Allows qualifying renewable energy systems to be depreciated using a double-declining balance, five-year depreciation schedule. Businesses should consult their tax attorneys for details.
x x x Taxable corporate entities in the commercial and industrial sectors
Expires Dec 2005 or as funds allow
US Code Citation:
26 USC 168 (1994)
Accelerated Depreciation
State Renewable Energy Equipment Accelerated Depreciation Same depreciation schedule as federal.
x x x Same as above Ongoing Mn Statutes 2001:
500.30 (5)
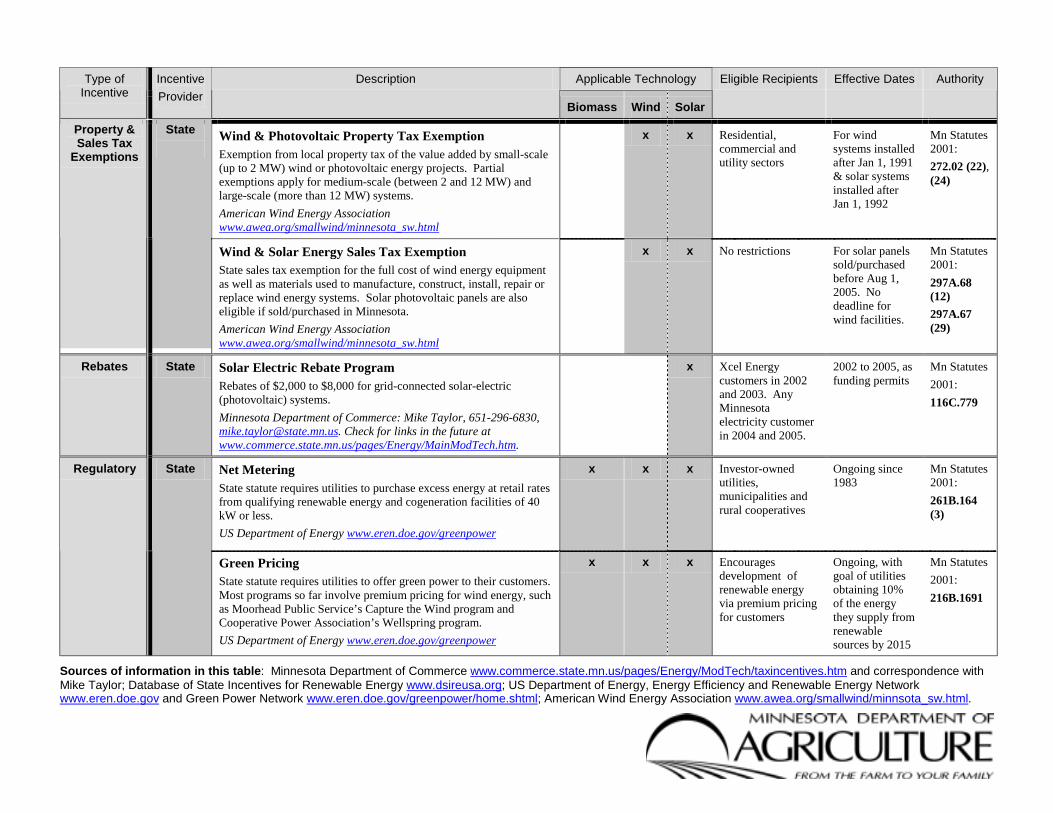
Applicable Technology Type of Incentive
Incentive Provider
Description
Biomass Wind Solar
Eligible Recipients Effective Dates Authority
Wind & Photovoltaic Property Tax Exemption Exemption from local property tax of the value added by small-scale (up to 2 MW) wind or photovoltaic energy projects. Partial exemptions apply for medium-scale (between 2 and 12 MW) and large-scale (more than 12 MW) systems.
American Wind Energy Association www.awea.org/smallwind/minnesota_sw.html
x x Residential, commercial and utility sectors
For wind systems installed after Jan 1, 1991 & solar systems installed after Jan 1, 1992
Mn Statutes 2001:
272.02 (22), (24)
Property & Sales Tax
Exemptions
State
Wind & Solar Energy Sales Tax Exemption State sales tax exemption for the full cost of wind energy equipment as well as materials used to manufacture, construct, install, repair or replace wind energy systems. Solar photovoltaic panels are also eligible if sold/purchased in Minnesota.
American Wind Energy Association www.awea.org/smallwind/minnesota_sw.html
x x No restrictions For solar panels sold/purchased before Aug 1, 2005. No deadline for wind facilities.
Mn Statutes 2001:
297A.68 (12)
297A.67 (29)
Rebates State Solar Electric Rebate Program Rebates of $2,000 to $8,000 for grid-connected solar-electric (photovoltaic) systems.
Minnesota Department of Commerce: Mike Taylor, 651-296-6830, [email protected]. Check for links in the future at www.commerce.state.mn.us/pages/Energy/MainModTech.htm.
x Xcel Energy customers in 2002 and 2003. Any Minnesota electricity customer in 2004 and 2005.
2002 to 2005, as funding permits
Mn Statutes
2001:
116C.779
Net Metering State statute requires utilities to purchase excess energy at retail rates from qualifying renewable energy and cogeneration facilities of 40 kW or less.
US Department of Energy www.eren.doe.gov/greenpower
x x x Investor-owned utilities, municipalities and rural cooperatives
Ongoing since 1983
Mn Statutes 2001:
261B.164 (3)
Regulatory State
Green Pricing State statute requires utilities to offer green power to their customers. Most programs so far involve premium pricing for wind energy, such as Moorhead Public Service’s Capture the Wind program and Cooperative Power Association’s Wellspring program.
US Department of Energy www.eren.doe.gov/greenpower
x x x Encourages development of renewable energy via premium pricing for customers
Ongoing, with goal of utilities obtaining 10% of the energy they supply from renewable sources by 2015
Mn Statutes
2001:
216B.1691
Sources of information in this table: Minnesota Department of Commerce www.commerce.state.mn.us/pages/Energy/ModTech/taxincentives.htm and correspondence with Mike Taylor; Database of State Incentives for Renewable Energy www.dsireusa.org; US Department of Energy, Energy Efficiency and Renewable Energy Network www.eren.doe.gov and Green Power Network www.eren.doe.gov/greenpower/home.shtml; American Wind Energy Association www.awea.org/smallwind/minnsota_sw.html.