Embed Size (px)
Citation preview

AD-A233 467
Technical Document 2033February 1991
Evaporation DuctCommunication:Test Plan
K. D. Anderson
DTICftIELECTE
APR03 M11fl
Approved for publo rlease; dlstrutlon Is MANited.
91 4 01 109

NAVAL OCEAN SYSTEMS CENTERSan Diego, California 92152-5000
J. D. FONTANA, CAPT. USN H. R. TALKINGTON, ActingCommander Technical Director
ADMINISTRATIVE INFORMATION
This report was prepared under project RC32CIl of the Command Systems BlockProgram. This block is managed by Naval Ocean Systems Center under the guidance anddirection of the Office of Naval Technology. The work was funded under program element0602232N and was performed by members of Code 543, Naval Ocean Systems Center, San Diego,CA 92152-5000.
Released by Under authority ofH. V. Hitney, Head J. H. Richter, HeadTropospheric Branch Ocean and Atmospheric
Sciences Division
MA

SUMMARY
The evaporation duct communication (EDCOM) project is an effort to provide an alternativeship-to-ship communications channel by properly exploiting the natural environment. It is a uniqueproject in that a microwave communications circuit (similar to the commercial line-of-sight (LOS)microwave links that carry voice and data across the country) will be used on an over-water,over-the-horizon (OTH) path where successful communication is critically dependent on the evaporationduct. A one-way, 83-km transmission path will be instrumented to simultaneously measure surfacemeteorological conditions and radio frequency (RF) characteristics of the communication channel.Measurements of bit-error rate (BER), made at DS-1 transmission rates of 1.544 megabits per second,will be compared to propagation models that predict BER from knowledge of the surface meteorology.These comparisons will be used to validate or improve the propagation models so that the performance ofsimilar communication circuits can be predicted from knowledge of the environmental conditions.
The EDCOM project has two objectives. First, EDCOM will demonstrate the feasibility of an OTHcommunications link that depends on the evaporation duct for successful link operation. Second,EDCOM will validate a propagation model that can be confidently used to guide the development anddesign of an alternative communications link for U.S. Navy ship-to-ship communications.
A0o.ssj0n For'
NTIS QRAIDTIC TABUnannounced
Justifioation
Distribution/-A va/llabliltyeadCode
lost JSpecia.l
CONTENTS
INTRODUCTION ............................................................... 1
M O D ELS ...................................................................... 2
Evaporation Duct ............................................................ 2RF Propagation .............................................................. 2
EXPERIMENT DESCRIPTION .................................................... 6
O verview ................................................................... 6Propagation Path ............................................................. 6Path Loss Distribution ......................................................... 6Digital Radio Equipment ....................................................... 8Transmitter/Receiver System ................................................... 11BER M easurem ents .......................................................... 12Meteorological Measurements ................................................. 14
EDCOM TEST MEASUREMENT DESCRIPTION ................................... 14
Transm itter Site ............................................................. 14
Receiver Site ............................................................... 15Expected Measurement Results ................................................ 16
TIM E SCHEDULE ............................................................. 16
CONCLUSION AND RECOMMENDATION ........................................ 17
GLO SSA RY ................................................................... 17
REFERENCES ................................................................. 18
FIGURES
1. Distribution of evaporation duct heights for the San Diego offshore area(Marsden Square 120). Combined day and night averages for all months ofthe year .................................................................... 3
2. Range dependency of path loss (coherent) for standard atmosphericconditions (labeled as 0 on the plot) and for evaporation duct heightsfrom 2 through 24 m. Frequency is 4.7 GHz. Transmitter and receiverantennas are 25 m above msl ................................................... 4
3. Range dependency of path loss (coherent) for standard atmosphericconditions (labeled as 0 on the plot) and for evaporation duct heightsfrom 2 through 24 m. Frequency is 7.5 GHz. Transmitter and receiverantenna are 25 m above msl .................................................... 5
iii
CONTENTS (continued)
FIGURES (continued)
4. Range dependency of path loss (coherent) for standard atmosphericconditions (labeled as 0 on the plot) and for evaporation duct heightsfrom 2 through 24 m. Frequency is 14.5 GHz. Transmitter andreceiver antennas are 25 m above msl ............................................ 5
5. Transmission path from San Mateo Point to NOSC. Path lengthis 83.1 km. Transmitter and receiver radio horizon shown by dashed arcs .............. 7
6. Transmission path profile from San Mateo Point to NOSC. Theobstruction is the ocean's surface ................................................ 7
7. Cumulative frequency distribution of path loss for a transmissionfrequency of 4.7 GHz. Path is San Mateo Point to NOSC. Free spaceand diffraction field references are indicated . ..................................... 8
8. Cumulative frequency distribution of path loss for a transmissionfrequency of 7.5 GHz. Path is San Mateo Point to NOSC. Free spaceand diffraction field references are indicated . ..................................... 9
9. Cumulative frequency distribution of path loss for a transmission frequencyof 14.5 GHz. Path is San Mateo Point to NOSC. Free space and diffractionfield references are indicated . .................................................. 9
10. Conceptual diagram of the EDCOM hardware. Transmitter is locatedat San Mateo Point, CA. Receiver is located at NOSC, Point Loma .................. 13
11. Expected results from the EDCOM measurement program. The probabilitycurves plotted are strictly estimates. The cross at 10-6 BER is derived fromtable 3, 10-dB margin data .................................................... 16
TABLES
1. Applicable government frequencies for fixed-site transmission ........................ 10
2. Loral TerraCom transmitter/receiver specifications and power budgetestim ates .................................................................. 11
3. Expected availability of the EDCOM links ........................................ 12
4. Measurement capabilities of the Tau-Tron Model 5108 DS-1 test set(partial list.) ................................................................ 13
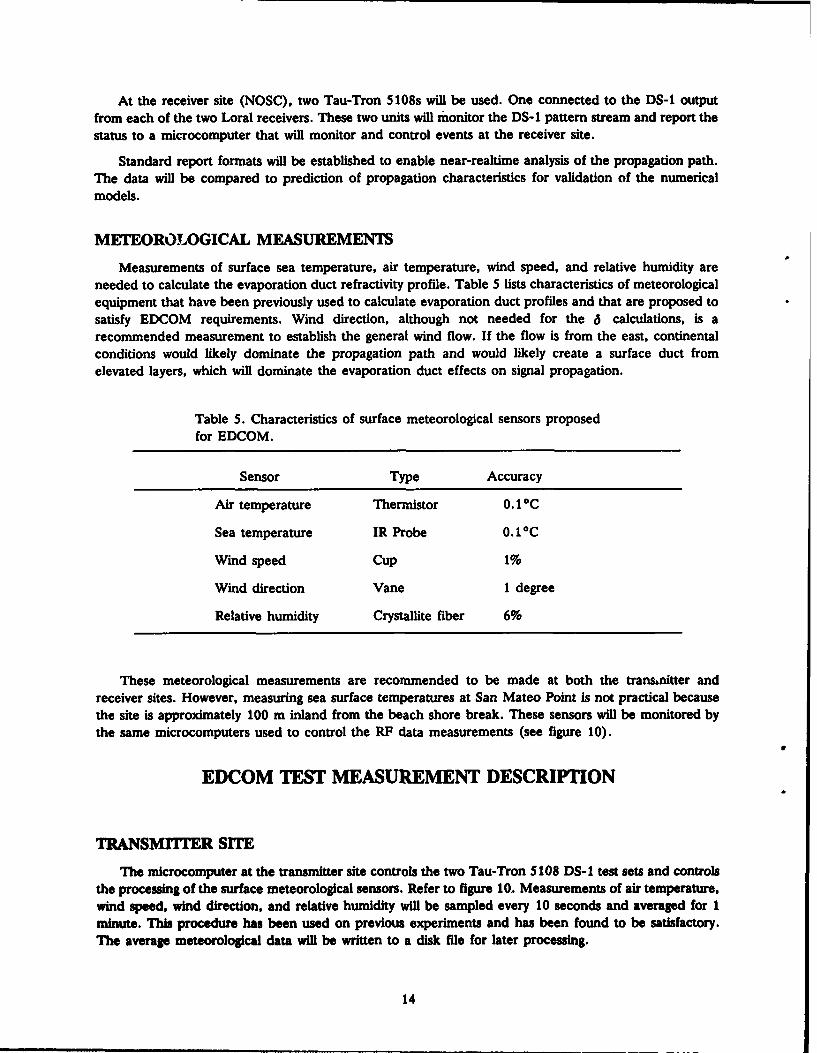
5. Characteristics of surface meteorological sensors proposed for EDCOM ............... 14
6. Schedule of EDCOM important events . ......................................... 17
iv
INTRODUCTION
"The most often expressed communications problem in Navy Battle Group (NBG) communications isthe lack of channels or bandwidth" (Rockway and James, in press). One technique to reduce the NBGcommunication problem is to establish a network of links and nodes tying the NBG elements together. Ifthere are multiple links to a node, then the bandwidth increases and, particularly in a stressed situation,there is a greater probability of at least one operational link. Essentially, the more alternative communica-tion channels there are between nodes, the higher the probability of successful communication.
A recent study by Rockway and James (in press) of alternative NBG communication channelsindicates that the oceanic evaporation duct could be used to support line of sight (LOS) as well asover-the-horizon (OTH) ship-to-ship communications. The authors examined three frequencies (4.5, 9.0,and 18.0 GHz) and concluded that 9.0 GHz is the optimum choice for typical ship-to-ship communica-tions at ranges between 50 and 100 km. Their link budgets indicate that data rates of tens to hundreds ofmegabits per second (Mb/s) are possible even at these OTH ranges. This potential link performance maybe of great value to NBG communications.
Rockway and James recommend starting a program to evaluate the performance of a microwavecommunications link that could be designed to use the evaporation duct as a communications channel.They propose four tasks: (1) system engineering, (2) network engineering, (3) radio frequency (RF)engineering, and (4) experimental evaluation of the concept. System engineering determines therequirements and evaluates the costs. Network engineering determines the link and node topology andprotocols. RF engineering implements the radio links to meet system and network requirements. Theexperimental evaluation provides measurements of the communication channel that can be used asguidelines in the system, network, and RF engineering tasks. This paper addresses the experimentalevaluation task known as the Evaporation Duct Communications (EDCOM) effort.
An evaporation duct can support RF propagation to ranges well beyond the normal radio horizon.Numerous investigators have examined the phenomenon of evaporation ducting and its effects onpropagation at frequencies from 600 MHz to 94 GHz (Jeske, 1965; Katzin, Bauchman, and Binnian,1947; Richter and Hitney, 1988; Anderson, 1982; Anderson, 1990; and Hitney and Veith, 1990). Theresults of these efforts, primarily one-way continuous wave (cw) and radar measurements, have been usedto develop and refine numerical propagation models (Baumgartner, 1983; Dockery and Thews, 1989; andRyan, 1989) and to spur the creation of a global evaporation duct climatology (Patterson, 1982).
Current state-of-the-art propagation models reliably predict the average received signal level (ARSL),where the average is computed over observation periods on the order of hours or days. Instantaneousreceived signal level (IRSL) contains signal fluctuations on the order of seconds or minutes and is notadequately modeled. Modeling accuracy is not limited by the physics of the models but rather by theaccuracy in physical measurements of the environmental conditions along the path.
In practice, surface meteorology is measured at one or both terminal sites, and these measurementsare used to represent the entire propagation path. Therefore, ARSL time scales are commensurate withmesoscale meteorology; usually on the order of hours. Strongly affected by spatial and temporal variationsof the meteorological conditions along the path, IRSL affects the bit-error rate (BER) and the overallreliability of the communications circuit. IRSL is associated with microscale meteorological effects that areextremely difficult to measure on a moderate length path.
Current propagation modeling results clearly indicate that the ARSL is sufficient to obtain 50- to 90-percent reliability with a communication link. The major question that EDCOM must answer is whether ornot the IRSL is sufficient for reliable communications.
1

The remainder of the report will examine the evaporation duct and the RF propagation models as wellas propose hardware to instrument a test link. The intent is to provide an overview; details of theevaporation duct and propagation models are available elsewhere in the literature. The experimental setupis reviewed based on conversations with equipment manufacturers as to what equipment is available as wellas results from the ducting and propagation models.
MODELS
EVAPORATION DUCT
The evaporation duct is a nearly permanent propagation mechanism created by a rapid decrease ofmoisture immediately above the ocean surface. Air adjacent to the surface is saturated with water vaporand rapidly dries out with increasing height until an ambient value of water vapor content is reached,which is dependent on general meteorological conditions. The negative water vapor pressure gradient justabove the surface causes a negative modified refractivity gradient, which creates a surface duct. Theheight where the modified refractivity reaches a minimum is defined as the evaporation duct height and isa measure of the strength of the duct. Typical duct heights range from a few meters to approximately 20m; the average evaporation duct height is 13.6 m (Patterson, 1982). Strong trapping is rarely observed forfrequencies below 2 GHz because these ducts are vertically thin.
In practice, boundary-layer theory relates bulk surface meteorological measurements of air tempera-ture, sea temperature, wind speed, and humidity to the evaporation duct height. In this analysis,evaporation duct height is computed using the Jeske model (1965, 1971) as implemented by Hitney(1975) with thermal stability modifications suggested by Paulus (1985). In a thermally neutral atmos-phere, where the air-sea temperature difference is 0, the modified refractivity profile is given by
M(z) = M(0) + 0.125 (z- (6 + zo) In [(z+ zo)/zo]} (1)
where z is height above the ocean, 6 is evaporation duct height, and zo is a length characterizingboundary roughness (Paulus, 1985).
Figure 1 shows the distribution of evaporation duct heights for the San Diego offshore area. Thedistribution is based on 15 years of surface meteorological measurements made by ships operating in thearea (Patterson, 1982). Evaporation duct heights of 6 to 12 m are observed approximately half the time;the average duct height is 9 m. Thick ducts, in excess of 24 m, are expected less than 1 percent of thetime.
RIF PROPAGATION
Numerical propagation modeling techniques agree with RF measurement results when single-stationsurface meteorological observations are available to determine the refractivity-versus-altitude profile of theevaporation duct (Jeske, 1965; Katzin, Bauchman, and Binnian, 1947; Richter and Hitney, 1988;Anderson, 1982; Anderson, 1990; and Hitney and Veith, 1990). In this study, the evaporation duct isassumed to be (1) range independent and (2) the dominant propagation phenomenon. The effects due tothe presence of surface-based and elevated ducts created by advection or subsidence of an air mass areneglected because these ducts are infrequent, occurring only about 10 percent of the time (Patterson,1982).
2

5 25 ANNUAL SURFACEEDff()% OCCUR _ DUCT SUMMARY
0102 3.921D4 6.9 K SURFACE OBS* MS 1204106 12.1 L Latitude: 30to40 N6108 17.4 Longde: 110to 120W
Av h 9.5 rmem8 ID 10 182 . Avg wind speed: 10.5 knots
10 t 12 14.9 0 Sanple size: 59,344 observators12 to 14 10.6 314 to 16 6.8 A16 t 18 4.2 T18 t 20 2.3 1201o22 1.3 022to 24 0.6 N241o26 0.426 t 28 0.2 328to 30 0.1 U301o32 0.1 C32t 34 0.0 T341o36 0.0361o38 0.0 H38t b40 0.0 T
> 40 0.0
Figure 1. Distribution of evaporation duct heights for the San Diego offshore area(Marsden Square 120). Combined day and night averages for all months of the year.
Numerical results are derived using a waveguide formalism (Booker and Walkinshaw, 1946; Budden,1961; Brekhovskikh, 1970) approach to the analysis of propagation through the troposphere. Thecomputer program used is known as "MLAYER," an enhanced version of the "XWVG" program(Baumgartner, 1983). The program assumes that the vertical profile of refractivity over the sea can beapproximated by an arbitrary number of linear segments, and it uses an ingenious technique by Morfittand Shellman (1976) to find all complex modes that propagate with attenuation rates below a specifiedvalue. Surface roughness is developed from Kirchhoff-Huygens theory in terms of rms bump height,which is related to wind speed by the relation o = 0.0051 u2, where u is wind speed (m/s) (Ament,1953).
Measurements of the bulk parameters of air temperature, sea temperature, wind speed, and relativehumidity are used to calculate the evaporation duct height 6. Equation (1) is used to calculate the verticalrefractivity profile needed by the MLAYER program. Measured wind speed is used to calculate thesurface roughness parameter, a, also used by MLAYER.
The results of propagation modeling by MLAYER are expressed in terms of path loss, L, defined asthe ratio of power transmitted to power received, assuming loss-free isotropic antennas. Propagation loss(which includes antenna pattern shaping) and path loss are equivalent terms in this analysis because theantenna radiation patterns are known and accounted for in the development. For a one-way transmissionsystem, signal power at the receiver, Pr, is
Pr = Pt + Gt - L + Gr (2)
where Pt is power transmitted; Gt and Gr are transmitter and receiver antenna gains.
Range dependency of path loss at a frequency of 4.70 GHz is shown in figure 2 for a standardatmosphere (denoted by 0 duct height) and for evaporation duct profiles (neutral stability) correspondingto duct heights of 2 to 24 m. The transmitter and receiver are 25 m above a moderately rough sea surface
3

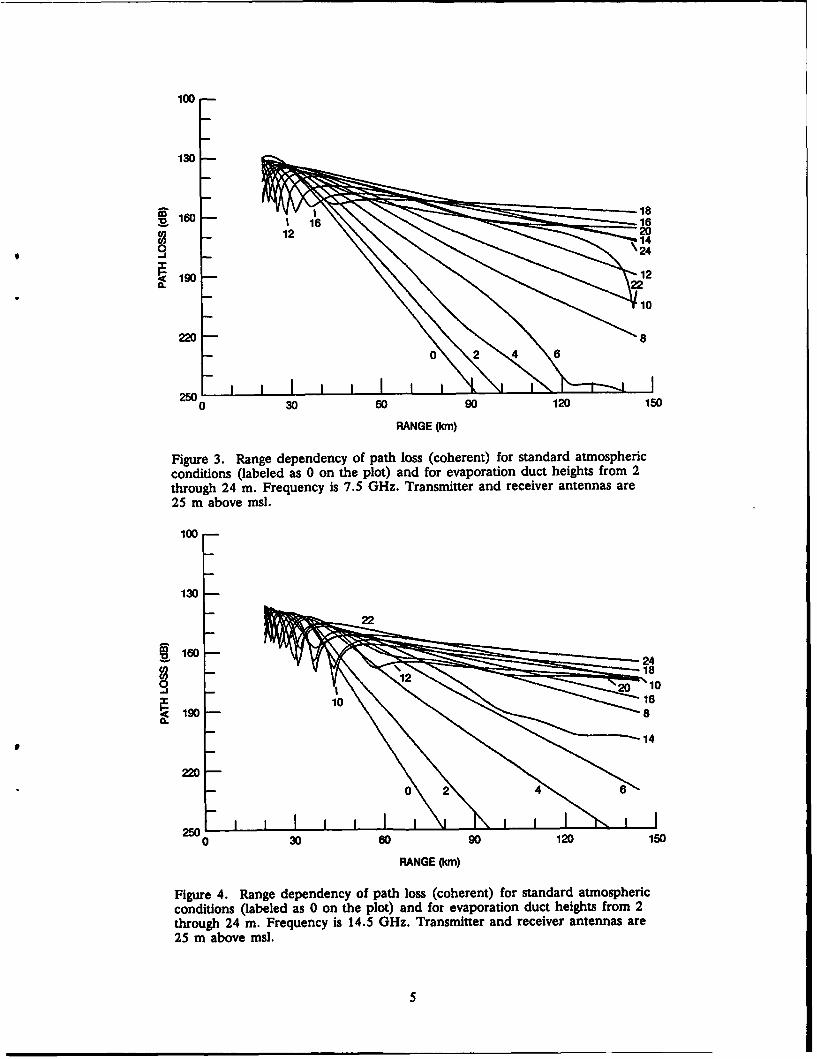
(wind speed is 7 m/s), and coherent signal propagation is assumed. At a range separation of 80 kin, thepath loss (L) for transmission through a standard atmosphere is about 215 dB. For propagation in anatmosphere represented by a refractivity profile corresponding to an evaporation duct height of 2 m (arelatively shallow duct), the path loss is approximately 207 dB, a "gain" of 8 dB compared to thediffraction reference. With a 12-m evaporation duct, path loss decreases to approximately 160 dB, a gainof 55 dB. As the duct height increases to 24 m, path loss decreases to 143 dB. If a 24-m evaporation ductexists, received signals are predicted to be 72 dB higher than the level expected under standardatmospheric conditions. Figures 3 and 4, for the same geometry and conditions, show the rangedependency of path loss at frequencies of 7.5 and 14.5 GHz.
100
130 _
-- 24
160 18
0
~16
190 14
220 10
250 j0 30 60 90 120 150
RANGE (km)
Figure 2. Range dependency of path loss (coherent) for standard atmosphericconditions (labeled as 0 on the plot) and for evaporation duct heights from 2through 24 m. Frequency is 4.7 GHz. Transmitter and receiver antennas are25 m above msl.
The plots in figures 2, 3, and 4 illustrate the complicated range dependency of path loss in terms ofthe evaporation duct and frequency. For 4.7 GHz, at ranges in excess of 70 km, path loss decreases forincreasing duct height. For 7.5 GHz, at the same ranges, path loss is a minimum for a duct height of about18 m; as the duct height increases to 24 m, path loss increases and then decreases with increasing ductheight. For 14.5 GHz, path loss decreases with increasing duct height up to about 10 m; as the duct heightincreases, path loss oscillates between increasing and decreasing. In general, for ranges beyond thehorizon (about 40 kin), the evaporation duct provides a gain in received signal as compared to thediffraction field reference.
At ranges less than the horizon range, the presence of an evaporation duct may decrease the signalstrength as compared to the signal strength expected in a normal atmosphere. In a ray-trace analysis, thiseffect is due to the increased downward bending of the rays as the duct height increases, which moves thelocation of the last interference null outward in range.
4
100
130
"160 18
S190- 112.2
10
2202
2500 30 60 90 120 150
RANGE (km)
Figure 3. Range dependency of path loss (coherent) for standard atmosphericconditions (labeled as 0 on the plot) and for evaporation duct heights from 2through 24 m. Frequency is 7.5 GHz. Transmitter and receiver antennas are25 m above msl.
100
130
190 8
220(2504
0 30 60 90 120 150
RANGE (k(m)
Figure 4. Range dependency of path loss (coherent) for standard atmosphericconditions (labeled as 0 on the plot) and for evaporation duct heights from 2throughx 24 mn. Frequency is 14.5 0Hz. Transmitter and receiver antennas are25 m above msl.
50 1
A systems design for an alternative communication circuit that uses the evaporation duct to achieveOTH communication ranges must consider the effects at all ranges. A complete systems design, asrecommended by Rockway and James (in press), should be addressed once the propagation models arevalidated.
The next section discusses an outline of the proposed experiment, the hardware necessary toimplement the measurements, and the expectations of the experimental measurements.
EXPERIMENT DESCRIPTION
OVERVIEW
To provide useful information, the experimental setup will simulate a ship-to-ship communicationscircuit that might be built. Typical shipboard antenna heights are 25 to 35 m above the ocean surface,which gives radio horizon ranges of 40 to 50 km. Therefore, the path length will be on the order of 50km. It makes sense to use concepts and equipment that are already being used in the operation ofterrestrial LOS microwave links. EDCOM will use commercial digital radio equipment and will validate thepropagation models without trying to simulate a complete NBG communications system. Custom RFequipment, necessary to meet NBG systems engineering requirements, is not needed.
A simplex system for one-way data transmission will be established using off-the-shelf equipment.Terrestrial LOS microwave link test equipment has been developed to evaluate channel capacity andreliability. Digital pattern generators and checkers are routinely used to monitor the performance ofterrestrial links. This equipment will be used by EDCOM to provide a measure of the link reliability. Fromthe top level, EDCOM will implement a commercial LOS microwave link. The major difference is thepath length; EDCOM will use an OTH, over-water path.
PROPAGATION PATH
Placing one terminal at NOSC greatly reduces the costs of monitoring and maintaining the equipment.From NOSC, the practical over-water paths are in the NNW direction, essentially from Oceansidenorthward. The northern terminal is desirable to be on government property on, or near, the beach andwith a clear view to NOSC. Camp Pendleton property extends north from Oceanside to San Clemente. AtSan Mateo Point, adjacent to the city of San Clemente, the elevation is about 25 m above msl and theview is unobstructed southward to NOSC. Figure 5 shows the proposed propagation path, an 83.1-kmover-water path. With the transmitter located 25 m above msl, the radio horizon is 20.6 km and is shownin figure 5 as a dashed arc. The receiver site at NOSC is also at 25 m above msl and has the same radiohorizon. Approximately half of the path is blocked by the surface. Figure 6 shows the path profile fromSan Mateo Point to NOSC; the obstruction is the ocean's surface. Both antennas would have to besituated at a height of 102 m above msl to have an LOS path.
PATH LOSS DISTRIBUTION
Figure 1 shows the distribution of evaporation duct heights as a function of time. For example, ductheights in the interval from 0 to 2 m are expected to occur 4 percent of the time in the San Diego offshorearea. The range dependency of path loss at 4.7 GHz in relation to duct height is shown in figure 2.Therefore, for a specified range, one can easily calculate the distribution of path loss as a function of time.From figure 2, the path loss at 4.7 GHz for a 0-m duct height at a range of 83 km is 221 dB; for a 2-mduct height, the path loss is 213 dB at the same range. Therefore, at a range of 83 km, it is expected thatpath loss in the interval from 213 to 221 dB occurs 4 percent of the time.
6

TRANSMITTERSAN MATEO 33°23'21"N 117035'39"E
POINT ", 25m ABOVE MEAN SEA LEVEL
TRANSMITTER- -.. ,
HORIZON20.6 km
83.1 km PATH
RECEIVERHORIZON20.6 km
POINT LOMARECEIVER
32041'47"N 117015'14"E25 m ABOVE MEAN SEA LEVEL
Figure 5. Transmission path from SanMateo Point to NOSC. Path length is83.1 km. Transmitter and receiver radiohorizon shown by dashed arcs.
25 m - - --- - - - - - - - - - - - - - - - 25 m
0 21 42 62 83
STANDARD ATMOSPHERE (4/3 EARTH RADIUS)
Figure 6. Transmission path profile from San Mateo Point toNOSC. The obstruction is the ocean's surface.
7

Figure 7 shows the distribution of path loss as a cumulative frequency diagram, where the ordinateindicates the percent of time that values on the abscissa are exceeded. This figure is for the case of afrequency of 4.7 GHz, transmitter and receiver heighLs at 25 m, and a range separation of 83 km. Thediffraction (0-m duct height) and free space (spherical spreading) path loss are indicated by verticaldashed lines. From this figure, path loss is less than 175.5 dB half of the time; 10 percent of the time,path loss exceeds 200 dB (path loss is less than 200 dB 90 percent of the time). Path loss values less thanfree space are expected a small percentage of the time.
100
mZ
8 -
WC
cc
r3 0 iaIo ~
0 -c -I
!j 4 uI I
125 163 200 238 275
PATH LOSS (dB)
FREQUENCY 4700 MHz TRANSMITTER 25 mMARSDEN SQUARE 120 RECEIVER 25 mRANGE 83 km
Figure 7. Cumulative frequency distribution of path loss for a transmissionfrequency of 4.7 GHz. Path is San Mateo Point to NOSC. Free space anddiffraction field references are indicated.
The expected distribution of path loss for frequencies of 7.5 and 14.5 GHz are shown in figures 8-9.At 7.5 GHz, the average path loss is 63 dB above the diffraction reference; at 14.5 GHz, the average pathloss is 90 dB above diffraction and within 15 dB of free space. As the frequency of transmission increases,so does the system gain provided by the evaporation duct.
DIGITAL RADIO EQUIPMENT
Discussions among the NOSC Frequency Coordinator, the Western Region Frequency Coordinator,and the Navy Frequency Allocation and Assignment Coordinators clearly indicate that the frequencyallocation and assignment request should be in the Government frequency bands. Commercial equipmentoperating in the commercial bands is readily available but there may be frequency conflict withcommercial companies. For example, Southern California Edison (SCE) operates a 6-GHz microwavelink from the San Onofre power facility to the Encina facility. SCE also operates a 10-GHz link from SanOnofre northward. Even though the link from San Mateo Point to NOSC is unlikely to interfere with anyother microwave link, there is a possibility of conflict. The discussions with the frequency coordinatorsindicate that any possibility of interference is grounds for rejection of the frequency allocation andassignment reqaests. Therefore, it is best to keep the frequencies within the Government bands, which arelisted in table 1. The designator "fixed" means these frequencies are applicable for fixed-site transmission.
8

10o
iZso 080--z
C9Z Iz 60
Uj0 ---- I- ------- ------ -
I I
40 Iun-
0l.
20 c
ot0 ! I I I I- I I I I I!I II I _
125 163 200 238 275PATH LOSS (dB)
FREQUENCY 7500 MHz TRANSMITTER 25 mMARSDEN SQUARE 120 RECEIVER 25 m
RANGE 83km
Figure 8. Cumulative frequency distribution of path loss for a transmissionfrequency of 7.5 GHz. Path is San Mateo Point to NOSC. Free space anddiffraction field references are indicated.
1w
WZI I
o , , , I ,I !
800
a 60LUILuI
0 -I--- --- - - -- -- -- -- -- -- -- -- ----
12 16 10 3 7
1;40 wi
20 cc 1
OL I I h I IIIIh L125 163 200 238 275
PATH LOSS (dB)
FREQUENCY 14500 MHz TRANSMITTER 25 mMARSDEN SQUARE 120 RECEIVER 25 m
RANGE 83km
Figure 9. Cumulative frequency distribution of path loss for a transmissionfrequency of 14.5 0Hz. Path is San Mateo Point to NOSC. Free space anddiffraction field references are indicated.
9
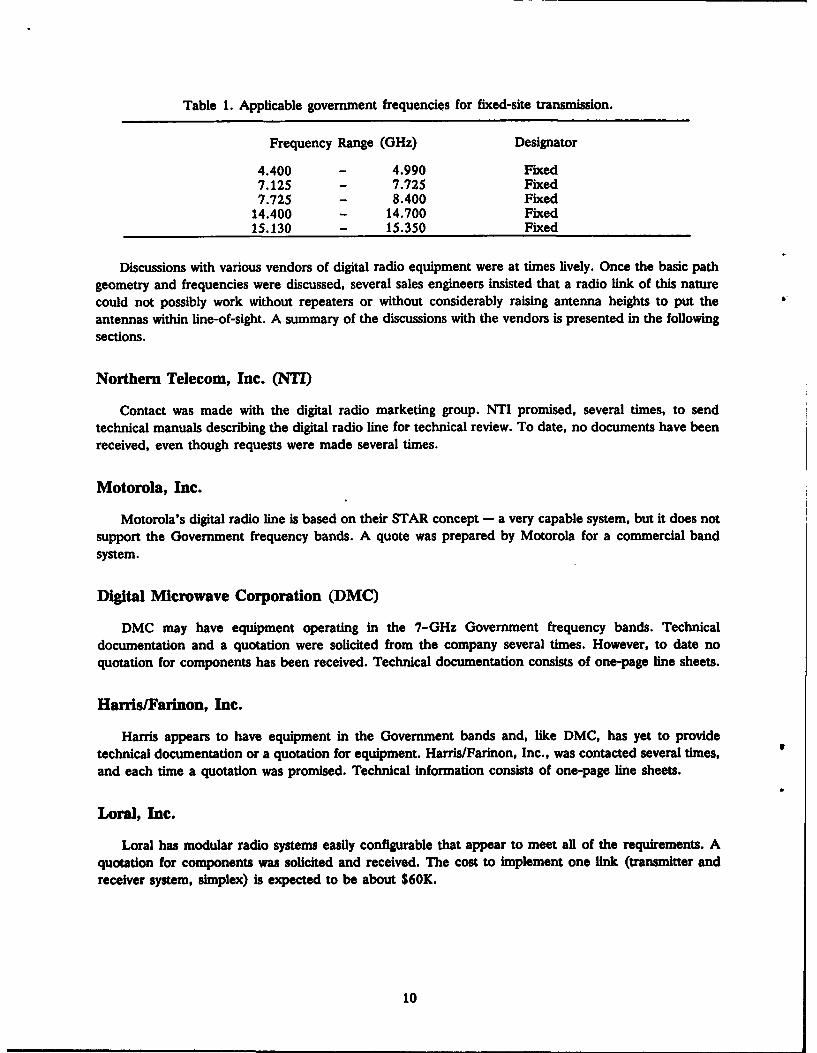
Table I. Applicable government frequencies for fixed-site transmission.
Frequency Range (GHz) Designator
4.400 - 4.990 Fixed7.125 - 7.725 Fixed7.725 - 8.400 Fixed
14.400 - 14.700 Fixed15.130 - 15.350 Fixed
Discussions with various vendors of digital radio equipment were at times lively. Once the basic pathgeometry and frequencies were discussed, several sales engineers insisted that a radio link of this naturecould not possibly work without repeaters or without considerably raising antenna heights to put theantennas within line-of-sight. A summary of the discussions with the vendors is presented in the followingsections.
Northern Telecom, Inc. (NT)
Contact was made with the digital radio marketing group. NTI promised, several times, to sendtechnical manuals describing the digital radio line for technical review. To date, no documents have beenreceived, even though requests were made several times.
Motorola, Inc.
Motorola's digital radio line is based on their STAR concept - a very capable system, but it does notsupport the Government frequency bands. A quote was prepared by Motorola for a commercial bandsystem.
Digital Microwave Corporation (DMC)
DMC may have equipment operating in the 7-GHz Government frequency bands. Technicaldocumentation and a quotation were solicited from the company several times. However, to date noquotation for components has been received. Technical documentation consists of one-page line sheets.
Harris/Farinon, Inc.
Harris appears to have equipment in the Government bands and, like DMC, has yet to providetechnical documentation or a quotation for equipment. Harris/Farinon, Inc., was contacted several times,and each time a quotation was promised. Technical information consists of one-page line sheets.
Loral, Inc.
Loral has modular radio systems easily configurable that appear to meet all of the requirements. Aquotation for components was solicited and received. The cost to implement one link (transmitter andreceiver system, simplex) is expected to be about $60K.
10
TRANSMITER/RECEIVER SYSTEM
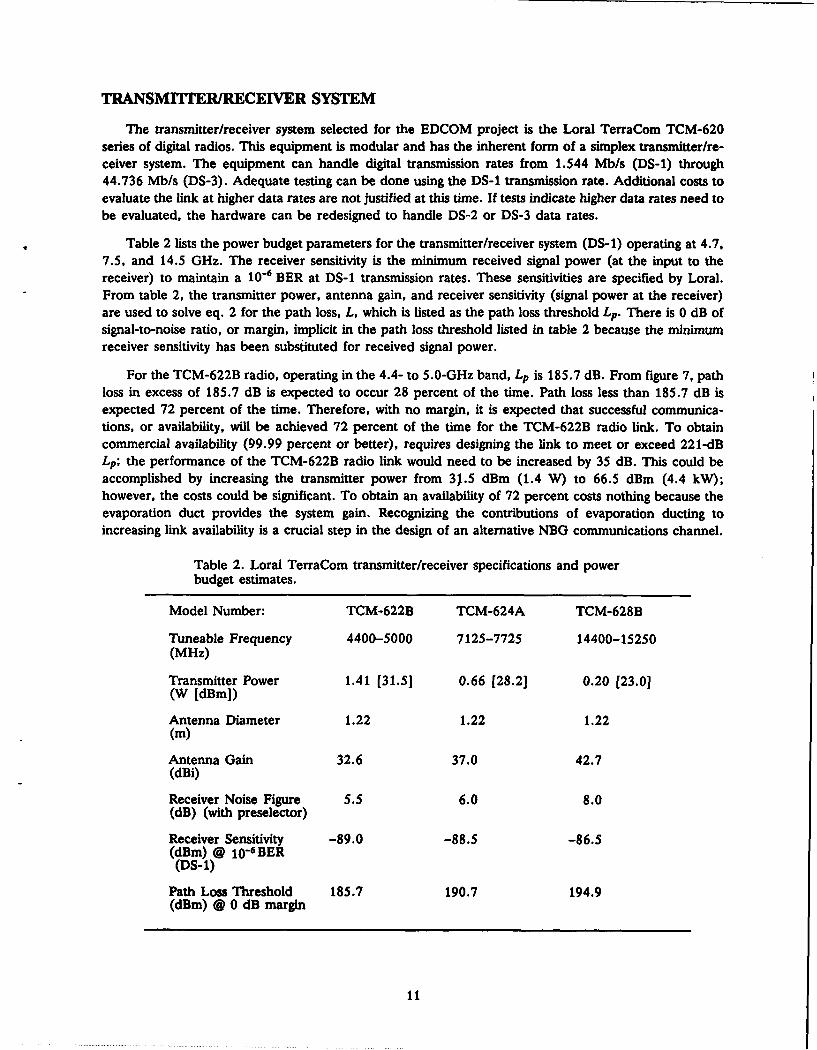
The transmitter/receiver system selected for the EDCOM project is the Loral TerraCom TCM-620series of digital radios. This equipment is modular and has the inherent form of a simplex transmitter/re-ceiver system. The equipment can handle digital transmission rates from 1.544 Mb/s (DS-1) through44.736 Mb/s (DS-3). Adequate testing can be done using the DS-1 transmission rate. Additional costs toevaluate the link at higher data rates are not justified at this time. If tests indicate higher data rates need tobe evaluated, the hardware can be redesigned to handle DS-2 or DS-3 data rates.
Table 2 lists the power budget parameters for the transmitter/receiver system (DS-1) operating at 4.7,7.5, and 14.5 GHz. The receiver sensitivity is the minimum received signal power (at the input to thereceiver) to maintain a 10- 6 BER at DS-1 transmission rates. These sensitivities are specified by Loral.From table 2, the transmitter power, antenna gain, and receiver sensitivity (signal power at the receiver)are used to solve eq. 2 for the path loss, L, which is listed as the path loss threshold Lp. There is 0 dB ofsignal-to-noise ratio, or margin, implicit in the path loss threshold listed in table 2 because the minimumreceiver sensitivity has been substituted for received signal power.
For the TCM-622B radio, operating in the 4.4- to 5.0-GHz band, Lp is 185.7 dB. From figure 7, pathloss in excess of 185.7 dB is expected to occur 28 percent of the time. Path loss less than 185.7 dB isexpected 72 percent of the time. Therefore, with no margin, it is expected that successful communica-tions, or availability, will be achieved 72 percent of the time for the TCM-622B radio link. To obtaincommercial availability (99.99 percent or better), requires designing the link to meet or exceed 221-dBLp; the performance of the TCM-622B radio link would need to be increased by 35 dB. This could beaccomplished by increasing the transmitter power from 31.5 dBm (1.4 W) to 66.5 dBm (4.4 kW);however, the costs could be significant. To obtain an availability of 72 percent costs nothing because theevaporation duct provides the system gain. Recognizing the contributions of evaporation ducting toincreasing link availability is a crucial step in the design of an alternative NBG communications channel.
Table 2. Loral TerraCom transmitter/receiver specifications and power
budget estimates.
Model Number: TCM-6228 TCM-624A TCM-628B
Tuneable Frequency 4400-5000 7125-7725 14400-15250(MHz)
Transmitter Power 1.41 [31.5] 0.66 [28.2] 0.20 [23.0](W [dBm])
Antenna Diameter 1.22 1.22 1.22(i)
Antenna Gain 32.6 37.0 42.7(dBi)
Receiver Noise Figure 5.5 6.0 8.0(dB) (with preselector)
Receiver Sensitivity -89.0 -88.5 -86.5(dBm) @ 10-GBER(DS-1)
Path Loss Threshold 185.7 190.7 194.9(dBm) @ 0 dB margin
11
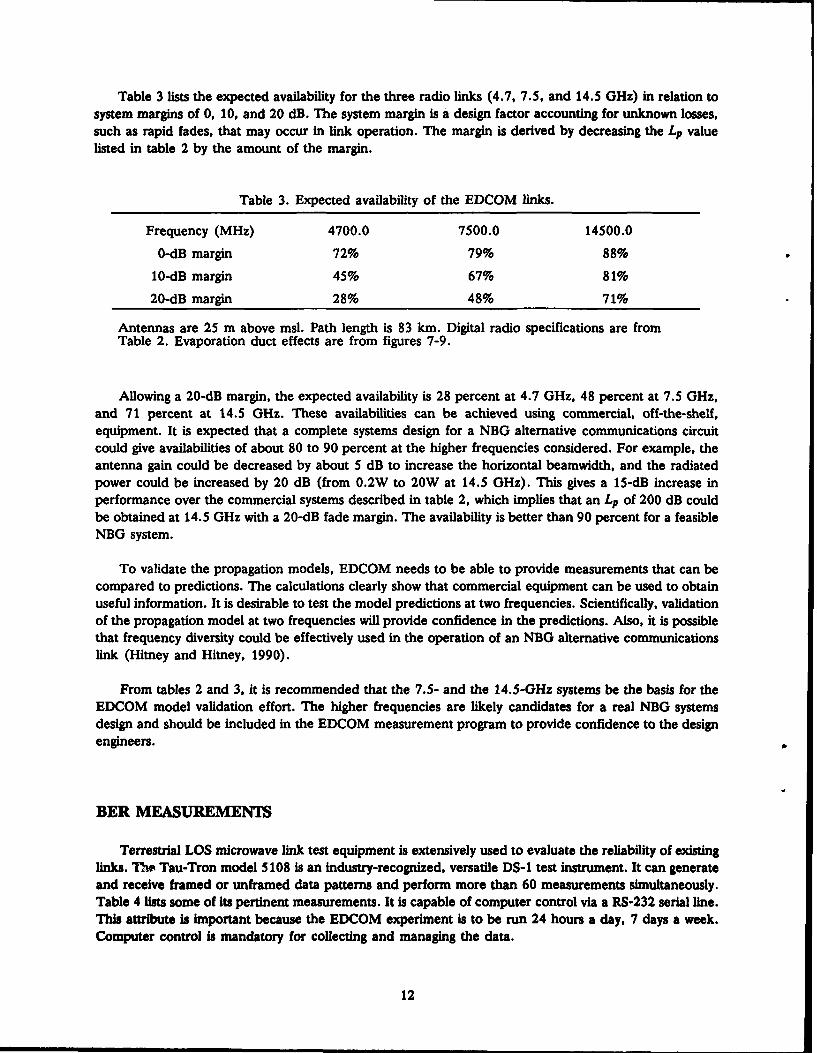
Table 3 lists the expected availability for the three radio links (4.7, 7.5, and 14.5 GHz) in relation tosystem margins of 0, 10, and 20 dB. The system margin is a design factor accounting for unknown losses,such as rapid fades, that may occur in link operation. The margin is derived by decreasing the Lp valuelisted in table 2 by the amount of the margin.
Table 3. Expected availability of the EDCOM links.
Frequency (MHz) 4700.0 7500.0 14500.0
0-dB margin 72% 79% 88%
10-dB margin 45% 67% 81%
20-dB margin 28% 48% 71%
Antennas are 25 m above msl. Path length is 83 km. Digital radio specifications are fromTable 2. Evaporation duct effects are from figures 7-9.
Allowing a 20-dB margin, the expected availability is 28 percent at 4.7 GHz, 48 percent at 7.5 GHz,and 71 percent at 14.5 GHz. These availabilities can be achieved using commercial, off-the-shelf,equipment. It is expected that a complete systems design for a NBG alternative communications circuitcould give availabilities of about 80 to 90 percent at the higher frequencies considered. For example, theantenna gain could be decreased by about 5 dB to increase the horizontal beamwidth, and the radiatedpower could be increased by 20 dB (from 0.2W to 20W at 14.5 GHz). This gives a 15-dB increase inperformance over the commercial systems described in table 2, which implies that an Lp of 200 dB couldbe obtained at 14.5 GHz with a 20-dB fade margin. The availability is better than 90 percent for a feasibleNBG system.
To validate the propagation models, EDCOM needs to be able to provide measurements that can becompared to predictions. The calculations clearly show that commercial equipment can be used to obtainuseful information. It is desirable to test the model predictions at two frequencies. Scientifically, validationof the propagation model at two frequencies will provide confidence in the predictions. Also, it is possiblethat frequency diversity could be effectively used in the operation of an NBG alternative communicationslink (Hitney and Hitney, 1990).
From tables 2 and 3, it is recommended that the 7.5- and the 14.5-GHz systems be the basis for theEDCOM model validation effort. The higher frequencies are likely candidates for a real NBG systemsdesign and should be included in the EDCOM measurement program to provide confidence to the designengineers.
BER MEASUREMENTS
Terrestrial LOS microwave link test equipment is extensively used to evaluate the reliability of existinglinks. T*h Tau-Tron model 5108 is an industry-recognized, versatile DS-1 test instrument. It can generateand receive framed or unframed data patterns and perform more than 60 measurements simultaneously.Table 4 lists some of its pertinent measurements. It is capable of computer control via a RS-232 serial line.This attribute is important because the EDCOM experiment is to be run 24 hours a day, 7 days a week.Computer control is mandatory for collecting and managing the data.
12

Table 4. Measurement capabilities of the Tau-Tron Model 5108 DS-1
test set (partial list).
Frame Errors and Alarms £fPatr .rrors
Total TotalAverage Bit-Error Ratio Average and Current BER
Out of frame seconds Errored secondsLoss of frame events Severely errored secondsLoss of frame seconds Pattern loss seconds
CRC. 6 ErrIo G.821 Calculations
Errored seconds Unavailable seconds
Severely errored seconds Errored seconds% Error-free seconds Severely errored secondsSynchronous errored seconds Degraded minutes
Figure 10 illustrates the EDCOM experiment hardware configuration. Two Tau-Tron 5108 units willbe used as DS-1 data pattern generators. The output of each Tau-Tron generator, alternate markinversion (AMI) line code at 1.544 Mb/s (Ti), will feed the input of the Loral digital transmitters. Amicrocomputer will monitor the operation of the transmitter site to control events and report unusual
conditions.
LORAL 6288 LORAL 6288AIR TEMPERATURE TRANSMITTER RECEIVER AIR TEMPERATURE
WIND SPEED 14.5 GHz 14.5 GHz SEA TEMPERATUREWIND DIRECTION WIND SPEED
RELATIVE HUMIDITY A TI WIND DIRECTIONTAU-TRON 5108 A, Mb/s TAU-TRON 5108 RELATIVE HUMIDITY
DS-1 TEST DS-1 TESTSET SET
MICRO LORAL 6248 LORAL. 6248 MCCOMUTE TRANSMITTER RECEIVER cMUECOMPUTER 7GHZ 7GHz
TAU-TRON 5106 . Ti TAU-TRON 5108DS-1 TEST DS-1 TEST
SET SET
TRANSMITTER SYSTEM RECEIVER SYSTEM
Figure 10. Conceptual diagram of the EDCOM hardware. Transmitter is locatedat San Mateo Point, CA. Receiver is located at NOSC, Point Loma.
13
At the receiver site (NOSC), two Tau-Tron 5108s will be used. One connected to the DS-1 outputfrom each of the two Loral receivers. These two units will monitor the DS-I pattern stream and report the
status to a microcomputer that will monitor and control events at the receiver site.
Standard report formats will be established to enable near-realtime analysis of the propagation path.The data will be compared to prediction of propagation characteristics for validation of the numericalmodels.
METEOROLOGICAL MEASUREMENTS
Measurements of surface sea temperature, air temperature, wind speed, and relative humidity areneeded to calculate the evaporation duct refractivity profile. Table 5 lists characteristics of meteorologicalequipment that have been previously used to calculate evaporation duct profiles and that are proposed tosatisfy EDCOM requirements. Wind direction, although not needed for the 6 calculations, is arecommended measurement to establish the general wind flow. If the flow is from the east, continentalconditions would likely dominate the propagation path and would likely create a surface duct fromelevated layers, which will dominate the evaporation duct effects on signal propagation.
Table 5. Characteristics of surface meteorological sensors proposedfor EDCOM.
Sensor Type Accuracy
Air temperature Thermistor 0.1 0 C
Sea temperature IR Probe 0.1 0C
Wind speed Cup 1%
Wind direction Vane 1 degree
Relative humidity Crystallite fiber 6%
These meteorological measurements are recommended to be made at both the transnitter andreceiver sites. However, measuring sea surface temperatures at San Mateo Point is not practical becausethe site is approximately 100 m inland from the beach shore break. These sensors will be monitored bythe same microcomputers used to control the RF data measurements (see figure 10).
EDCOM TEST MEASUREMENT DESCRIPTION
TRANSM'TER SITE
The microcomputer at the transmitter site controls the two Tau-Tron 5108 DS-1 test sets and controlsthe processing of the surface meteorological sensors. Refer to figure 10.. Measurements of air temperature,wind speed, wind direction, and relative humidity will be sampled every 10 seconds and averaged for 1minute. This procedure has been used on previous experiments and has been found to be satisfactory.The average meteorological data will be written to a disk file for later processing.
14

At the beginning of a measurement period, the computer will command each DS-1 test set to generatea specific DS-1 framing format and test pattern. The framing format will be DS-1 SuperFrame ("D4"format) shown on the Tau-Tron as a "DS-1 SF" format. The test pattern will be an industry-standardquasi-random word, a 220 - 1 pseudorandom binary sequence (PRBS) with a 14-zero constraint. The linecode shall be AMI, and the data rate shall be 1.544 Mb/s, which yields a standard T1 transmissionformat. The Loral transmitters will be interfaced to the Tau-Trons and shall radiate at 7.7 and 14.5 GHz.The signals radiated are independent of each other.
The microcomputer will periodically interrogate each Tau-Tron unit to verify proper operation.Errors will be recorded onto a disk file for later use.
RECEIVER SITE
The receiver microcomputer (see figure 10) controls the recording of the surface meteorologicalsensors as well as the DS-1 test sets. Air temperature, sea temperature, wind speed, wind direction, andrelative humidity will be sampled once every 10 seconds and averaged for a 1-minute interval. Theaverage meteorological data will be written to a disk file for later processing. Evaporation duct height,dependent upon air-sea temperature difference, wind speed, and relative humidity, will also be calculatedfor 1-minute intervals.
At the beginning of a measurement period, the computer will command each DS- 1 test set to generatea DS-1 framing format and test pattern matching the transmitter pattern generators. The framing formatwill be DS-1 Super Frame ("D4" format) shown on the Tau-Tron as a "DS-1 SF" format. The testpattern will be an industry standard 2 20- 1 PRBS with a 14-zero constraint. In addition, each Tau-Tronunit will be commanded to generate a status report once every hour. This report, which can be processedby the microcomputer, consists of the following information:
* Tide, date, and time
* Period start and length
* Unit setup summary
* Total error count, error seconds, severely errored seconds (SES), consecutive SES
• Average BER
• Percentage of error-free seconds
This data will be displayed in realtime and recorded to a disk file for later processing.
The line code shall be AMI, and the data rate shall be 1.544 Mb/s (TI transmission). The Loralreceivers will be interfaced to the Tau-Trons and shall receive the transmitted signals radiated at 7.7 and14.5 GHz. The TI data streams are independent of each other.
The microcomputer will periodically interrogate each Tau-Tron unit to verify proper operation.Errors will be recorded onto a disk file for later use.
15

EXPECTED MEASUREMENT RESULTS
Figure 11 illustrates the expected results from the EDCOM measurement program. The ordinate is thepercent of time that abscissa values are exceeded. For example, a BER of 10-6 or less is expected 67percent of the time for the 7-GHz system (see table 3). At 14 GHz, a BER of 10-6 or less is expected 81percent of the time. The exact shape of the probability curves are estimated. An extensive analysis isneeded to adequately model the form of the curves.
100\ ,
\ ,
75\ +\ ,S
", 14GHz
X % "S
,,, 7 GHz "o I I4I I25S
10-7 10-45 10-5 10-.4 10-3
BIT-ERROR RATE
Figure 11. Expected results from the EDCOM measure-ment program. The probability curves plotted are strictlyestimates. The cross at 10-4 BER is derived from table 3,10-dB margin data.
TIME SCHEDULE
All site preparations are expected to be completed by early summer 1991 (July 1991 timeframe).Testing of RF equipment and computer control programs are anticipated to commence upon completionof site preparation and last for several months. It is highly desired to have all testing completed and thelink in full operation by September - October 1991.
The following time schedule fists important events that will be met by the EDCOM project.
16

Table 6. Schedule of EDCOM important events.
1990 1991.
Event Oct Nov Dec Jan Feb Mar Apr May Jun Jul Aug Sep Oct
Field survey site (NOSC) > .... X
Develop plans for site > ........... x
Concrete Slab > ........... x
Electric Power > ................ x
Telephone > .............. x
Field Hut Installation >...X
Security Lighting > ........ x
Security Fencing > ....... x
Test and Integration > ............ x
Full Operations > ............... >
CONCLUSION AND RECOMMENDATION
Results of propagation modeling show that a microwave communication link, operating at a rangeseparation of more than twice the maximum LOS range, could be constructed to achieve an availability ofabout 80 percent at a transmission frequency of 14.5 GHz. This link would use commercially available RFequipment and represents a unique use of the environment to enhance communications capabilities.Further, operation of this link will provide the first set of measurements of channel capacity where thechannel is critically dependent on the existence of an oceanic evaporation duct.
The measurement program discussed in this paper is strongly recommended to be carried out.Measurements of evaporation ducting channel characteristics represent a unique opportunity to study andevaluate an alternative communications channel that can possibly be used to alleviate NBG communica-tions problems.
GLOSSARY
AMI alternate mark inversion LOS line of sight
ARSL average received signal level m meter
BER bit-error rate Mb/s megabits per second
cw continuous wave MHz megahertz
dB decibels m/s meters per second
17
dBi decibel over isotropic msl mean sea level
dBm decibel referred to 1 milliwatt NBG Naval battle group
EVD evaporation duct NOSC Naval Ocean Systems Center
EDCOM evaporation duct communication OTH over the horizon
GHz gigahertz PRBS pseudorandom binary sequence
ht height RF radio frequency
IRSL instantaneous received signal level SCE Southern California Edison
km kilometer W watt
kw kilowatt SES severely errored seconds
REFERENCES
Ament, W. D. 1953. "Toward a Theory of Reflection by a Rough Surface," Proc. IRE, vol. 41, pp.142-146.
Anderson, K. D. 1982. "Evaporation Duct Effects on Moderate Range Propagation Over the Sea at 10and 1.7 cm Wavelengths," NOSC TR 858 (Nov). Naval Ocean System Center, San Diego, CA.
Anderson, K. D. May 1990. "94-GHz Propagation in the Evaporation Duct," IEEE Ant. and Prop., vol.38, no. 5.
Baumgartner, Jr., G. B. 1983. "XWVG: A Waveguide Program for Trilinear Tropospheric Ducts," NOSCTD 1610 (Jun) Naval Ocean Systems Center, San Diego, CA.
Booker H. G. and W. Walkinshaw, 1946. "The Mode Theory of Tropospheric Refraction and its Relationto Waveguides and Diffraction," in Meteorological Factors in Radio Wave Propagation. The PhysicalSociety, pp 80-127. London, England.
Brekhovskikh, L. M. 1970. Waves in Layered Media, 2nd ed. Pergamon Press. New York.
Budden, K. G. 1961. The Waveguide Mode Theory of Wave Propagation. Logos, London, England.
Dockery G. D. and E. R. Thews. 1989. "The Parabolic Equation Approach to Predicting TroposphericPropagation Effects in Operational Environments," in NATO-AGARD Conf. Proc. CP-453, (May15-19, 1989), pp. 18-1, 18-9.
Hitney, H. V. 1975. "Propagation Modeling in the Evaporation Duct," NELC TR 1947 (Apr). 33 pp.,Naval Electronics Laboratory Center, San Diego, CA.
Hitney, H. V. and L. R. Hitney, "Frequency Diversity Effects of Evaporation Duct Propagation," IEEEAnt. and Prop., In press, Oct. 1990.
Hitney, H. V. and R. Veith. Jun 1990. "Statistical Assessment of Evaporation Duct propagation," IEEEAnt. and Prop., vol. 38, no. 6.
Jeske, H. 1965. "Die Ausbreitung Elektromagnetischer Wellen im cm-bis M-Band Uber Dem Meer unterbesonderer Berucksichtigung der Meteorologlschen Bedingungen in der Maritimen Grenzschicht,"Hamburger Geophys. Einzelschrlften, Hamburg, DeGruyter and Co.
Jeske, H. 1971. "The State of Radar-Range Prediction Over Sea," Tropospheric Radio Wave PropagationPart II, AGARD, pp 50-1, 50-6.
Katzin, M., R. W. Bauchman, and W. Binnian. Sep 1947. "3- and 9-Centimeter Propagation in LowOcean Ducts," Proc. IRE, vol. 35, no. 9, pp. 891-905.
18

Morfitt, D. G. and C. H. Shellman. 1976. " 'MODESi.CH', An Improved Computer Program for Obtain-ing ELF/VLF/LF Mode Constants in an Earth Atmosphere Waveguide," Interim Rep. 77T, (Oct)prepared for the Defense Nuclear Agency by the Naval Electronics Laboratory Center (Now NavalOcean Systems Center), San Diego, CA.
Patterson, W.L. 1982. "Climatology of Marine Atmospheric Refractive Effects," NOSC TD 573. NavalOcean Systems Center, San Diego, CA.
Paulus, R. A. 1985. "Practical Application of an Evaporation Duct Model," Radio Sci., vol. 20, pp.887-896.
Richter, J. H. and H. V. Hitney. 1988. "Antenna Heights for the Optimum Utilization of the OceanicEvaporation Duct," NOSC TD 1209. Naval Ocean Systems Center, San Diego, CA.
Rockway, J. W. and R. R. James. "Battle Group Alternative Communications: A Study of the SHFNon-Satellite Communications Channel," NOSC TR (in press) Naval Ocean Systems Center, SanDiego, CA.
Ryan, F. J. 1989. "RPE: A Parabolic Equation Radio Assessment Model," in NATO-AGARD Conf. Proc.CP-453, (May 15-19, 1989), pp. 19-1, 19-10.
19

Public reporing burden for oti collection of Ink~mastion is esimrated to average I hour per response. Including the timne for revlewtg Inhtructions. searching existng dt sources. gathering andmawflalrrngthe dgsn-eded, and completing and niviowtngthe colection ofIn~onnallon. Send comnts regarding tis burden estina orany ctheraspect of thes collection di Inlformatlon, Includingsuggestlonsfor reducing this buden. to Wmllhgton Headquarters Servioe Olrectoraletor IlmAtlon Opert"n and Reports l21JE~eson Davis Highway, Sukte 1204. Arlington, VA Z2=24=02and tot eW~cecf aaaend Bde, * wr ReductiWn 704,0188). Washlnn .D 20503.
1. AGENCY USE ONLY ILav bler 2. REPOR T DATE 3. REPORT YPE AND D3ATES COVERED
IFebruary 1991 Final: October 1989 - 19904. TITLE AND SUBTITLE 5. FUNDING NUMBERS
EVAPORATION DUCT COMMUNICATION: TEST PLAN PE: 0602232NPROJ: RC 32C1l
8. AUTHOR(S) SUBPROJ: 84-CHB5-06
K. D. AndersonAC:D 30 7
7. PERFORMING ORGANIZATIONS NAME(S) AND ADDRESS(ES) 8. PERFORMING ORGANIZATIONREPORT NUMBER
Naval Ocean Systems Center NOSC TD 2033San Diego, CA 92152-5000
g. SPONSORWGJMON.TORING AGENCY NAME(S) AND ADDRESS(ES) 10. SPONSORING/MONrrORiNGAGENCY REPORT NUMBER
Naval Ocean Systems CenterSan Diego, CA 92152--5000
11. SUPPLEMENTARY NOTES
12a. DISTRtIBUTIONIAVAlLABILITY STATEMENT 12b. DISTRIBUTION COOE
Approved for public release; distribution is unlimited.
13. ABSTRACT (itaxhnur 200 wods)
The Evaporation Duct Communication (EDCOM) project is an effort to provide an alternative ship-to-ship commu-nications channel using the natural environment. A microwave communication link can be used on an over-the-water,over-the-horizon path through the evaporation duct.
This report shows how a microwave communication link, operating at a range separation of more than twice theline-of-sight range, can be constructed. This link can achieve about 80-percent availability at a transmission frequencyof 14.5 GHz and can be constructed using off-the-shelf RF equipment. Operation of this link will provide the fir-st set ofmeasurements of channel capacity that can be critically dependent on the existence of an oceanic evaporation duct. Con-struction of this link presents a unique opportunity to study and evaluate an alternative communications channel thatcan be used to alleviate naval battlegroup communications load.
14. SUBJECT TERMS 15. NUMBER OF PAGES
evaporation duct communication propagation path 27path loss microwave link 10. PRCCDduct height
OF REPORT OF THIS PAGE OF ABSTRACT
IUNCLASSIFIED UNCLASSIFIED UNCLASSIFIED SAME AS REPORT_
NON 7840.O-210-M0 tandard formM

INITIAL DISTRIBUTICN
Code 0012 Patent Counsel (1)Code 0144 R. November (1)Code 54 J. Richter (1)Code 543 H. Hitney (10)Code 805 J. Rockway (1)Code 808 R. Peterson (1)Code 844 B. James (10)Code 921 J. Puleo (1)Code 961 Archive/Stock (6)Code 964 Library (3)
Defense Technical Information CenterAlexandria, VA 22304-6145 (4)
NOSC Liaison OfficeWashington, DC 20363-5100 (1)
Center for Naval Analyses4401 Ford AvenueAlexandria, VA 22302-0268 (1)


![2012ATCE RousseauStructMent 20130228 [Read-Only] · PDF filecommunication guidelines • Relationship building ... systematic transfer of business-critical TACIT knowledge and skills](https://img.pdfslide.us/doc/110x75/5ab710387f8b9a6e1c8e6eef/2012atce-rousseaustructment-20130228-read-only-guidelines-relationship-building.jpg)