Embed Size (px)
Citation preview
Communicating Risk Information to Stakeholders
Much technical information is about assessing and controlling risks.
Public and other stakeholders are part of process of making decisions based on risk information.
What is Risk Communication?
It is no longer one-way messages from experts to non-experts
Communicating Risk
“Risk communication is an interactive process of exchange of information and opinion among individuals, groups, and institutions” National Research Council, 1989. p. 21
As an engineer, your job is not simply to convey information so it is understood. You must anticipate needs of your audiences and solicit information from them.
Why is Risk Communication necessary? “ . . . decision-making responsibility involving risk
issues must be shared with the American people.”
William Ruckelhaus, 1986
“ . . . we must ensure that [citizens have] a fuller understanding of the inevitable tradeoffs . . . in the management of risk.”
Lee M. Thomas, 1986
Risk decisions must include values of stakeholders
Risks cannot be weighed against each other without considering human values.
Which option provides the best protection at the least cost -- in terms of human values, as well as $$$$$$?
Some Typical Stakeholders
Government federal, state, municipal regulators
Scientists/engineers and subject-matter experts Environmental or worker-safety groups Geographical neighbors Community and civic organizations Educational organizations Business and professional associations
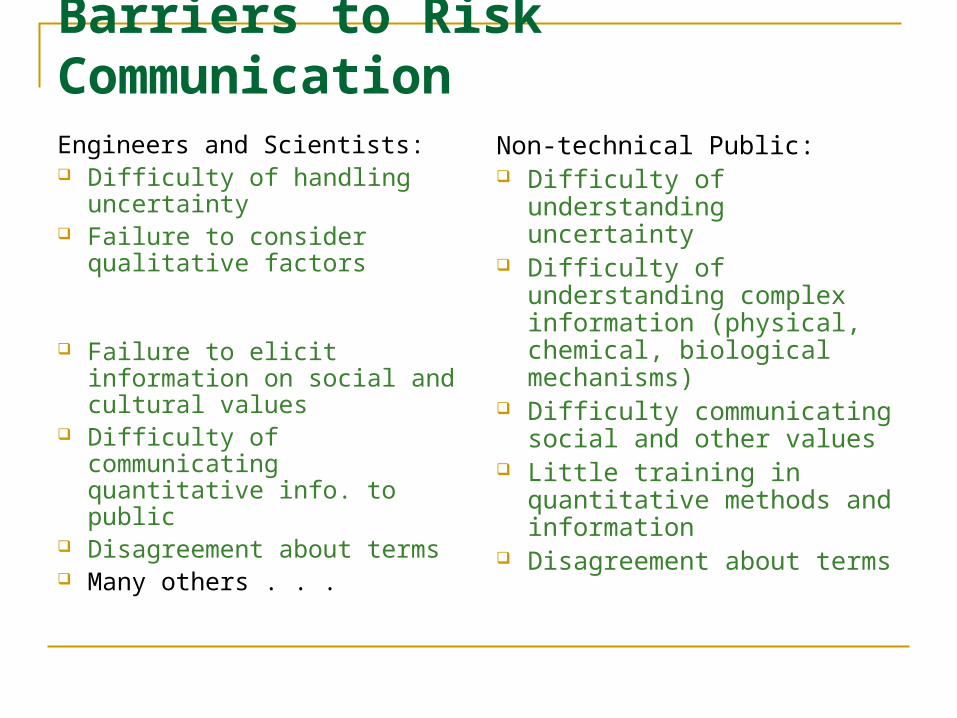
Barriers to Risk CommunicationEngineers and Scientists: Difficulty of handling
uncertainty Failure to consider
qualitative factors
Failure to elicit information on social and cultural values
Difficulty of communicating quantitative info. to public
Disagreement about terms Many others . . .
Non-technical Public: Difficulty of understanding
uncertainty Difficulty of understanding
complex information (physical, chemical, biological mechanisms)
Difficulty communicating social and other values
Little training in quantitative methods and information
Disagreement about terms
Some of the many other barriers . . .
Fragmentation of risk-control decisions: federal, state, local governments
Liability -- legal constraints Difficulty in determining “acceptable risk”• Lack of trust/credibility (lack of empowerment)
“Risk” is inherently subjective (qualitative) The risk estimates of experts are “based on
theoretical models, whose structure is subjective and assumption-laden and whose inputs are dependent on judgment.”
Risk assessments depend on judgments “at every stage of the process, from the initial structuring of a risk problem to deciding which endpoints or consequences to include in the analysis.”
Paul Slovic 1999
Everyone (even scientists) makes errors in judgment.
Inappropriate reliance on limited data Tendency to impose order on random events Tendency to fit ambiguous evidence into
predispositions Overconfidence in the reliability of scientific
analyses Nat’l Research Council, 1989
Public-Perception Categories of Risk Controllable vs. Uncontrollable
driving a car vs. flying in a plane Voluntary vs. Involuntary
smoking cigarettes vs. radon from landfill Macro vs. Micro
population risk vs. individual risk regulator’s perception vs. individual’s
The risks that frighten people aren’t the same ones that kill them.
Dichotomy between expert and public rankings of risk. public has until recently ranked hazardous
waste as #1 threat. experts rank smoking and diet as #1.
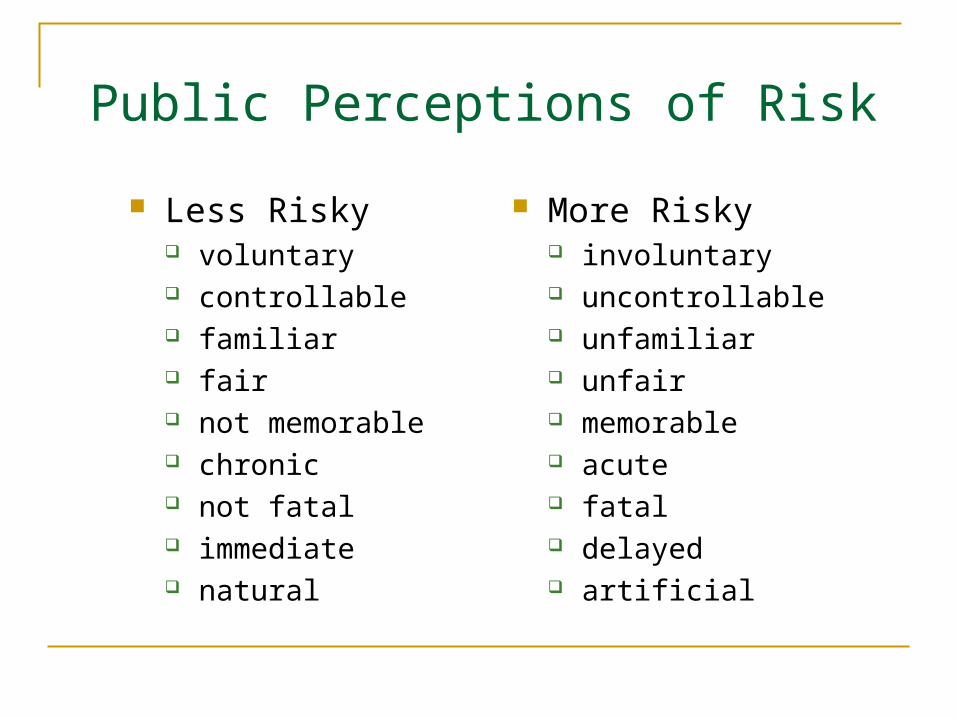
Public Perceptions of Risk
Less Risky voluntary controllable familiar fair not memorable chronic not fatal immediate natural
More Risky involuntary uncontrollable unfamiliar unfair memorable acute fatal delayed artificial
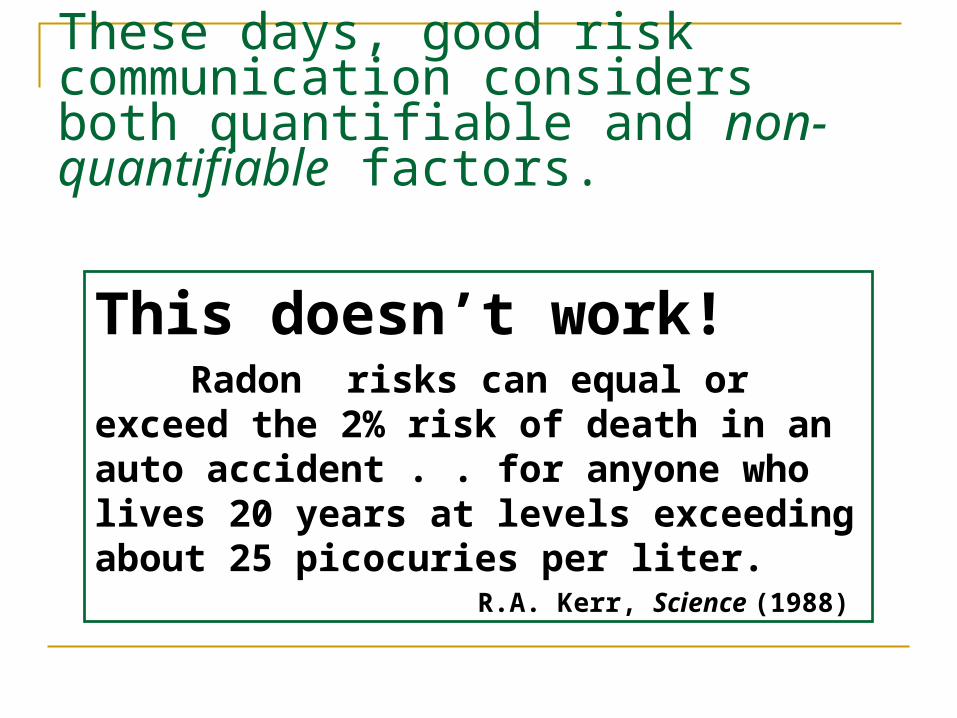
These days, good risk communication considers both quantifiable and non-quantifiable factors.
This doesn’t work!Radon risks can equal or exceed the
2% risk of death in an auto accident . . for anyone who lives 20 years at levels exceeding about 25 picocuries per liter.
R.A. Kerr, Science (1988)
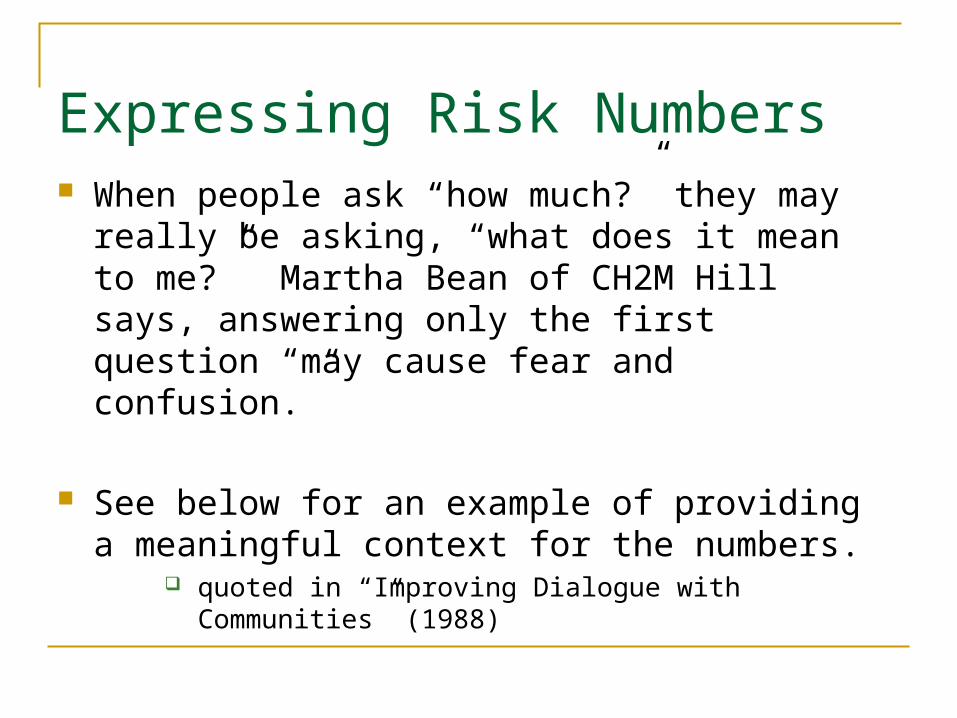
Expressing Risk Numbers When people ask “how much?” they may really be
asking, “what does it mean to me?” Martha Bean of CH2M Hill says, answering only the first question “may cause fear and confusion.”
See below for an example of providing a meaningful
context for the numbers. quoted in “Improving Dialogue with Communities” (1988)
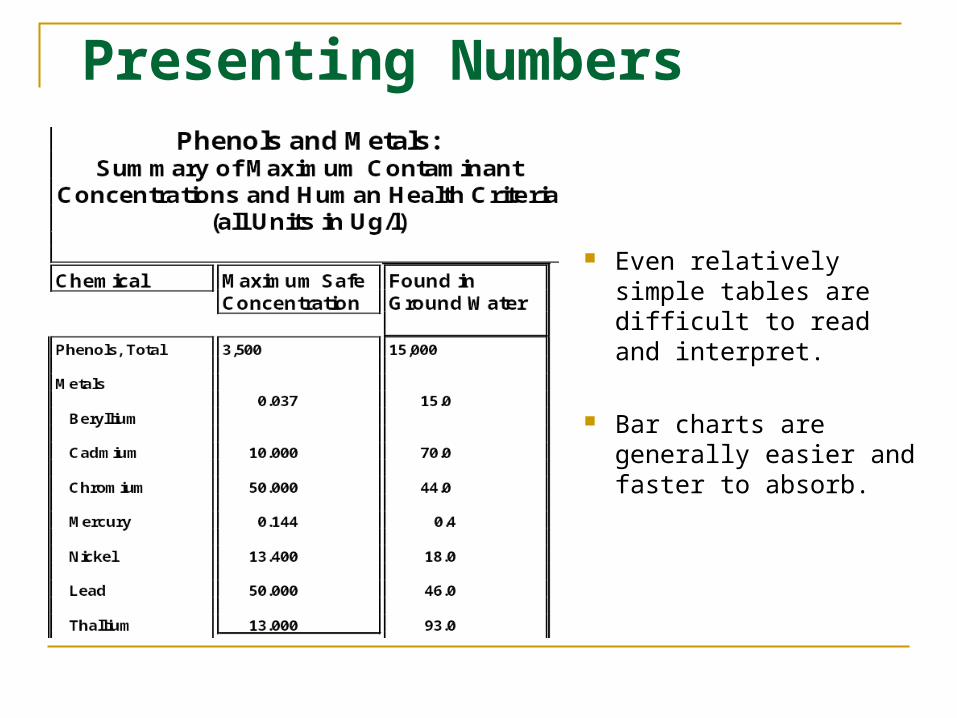
Presenting Numbers
Even relatively simple tables are difficult to read and interpret.
Bar charts are generally easier and faster to absorb.
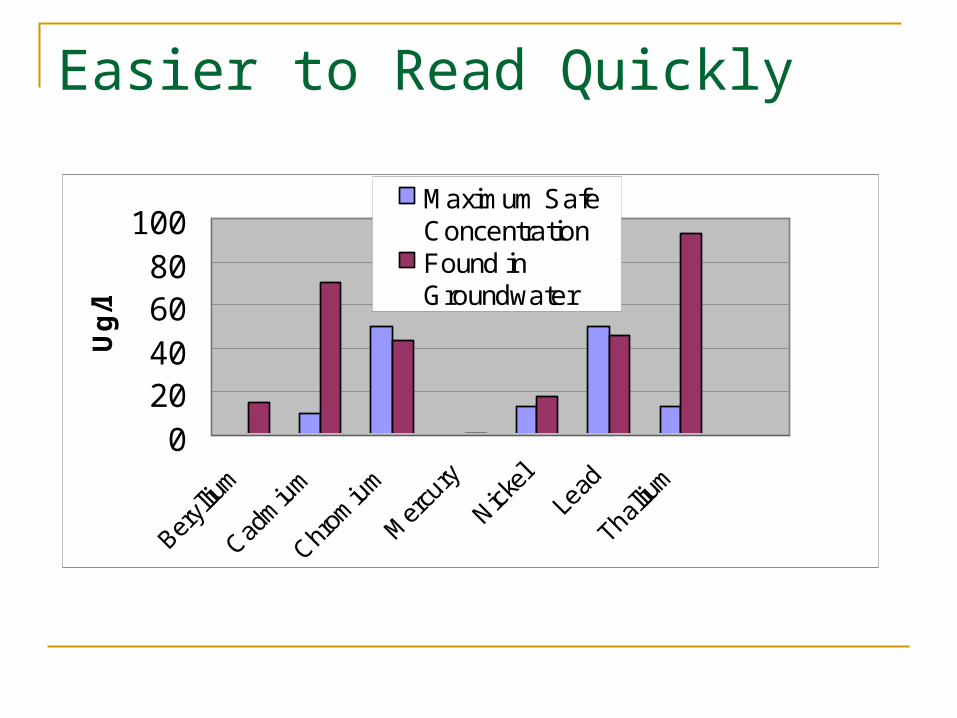
Easier to Read Quickly
020406080
100
Beryll
ium
Cadm
ium
Chrom
ium
Mer
cury
Nickel
Lead
Thalliu
m
Ug
/l
Maximum SafeConcentrationFound inGroundwater
Challenge of Comparing Risks Risk comparisons help people understand
quantitative info. But be careful not to compare apples and
oranges: voluntary vs. involuntary risks different consequences of a hazard quantitative vs. qualitative risks
Compare risks of same hazard at different times or risks of different options for achieving same purpose.
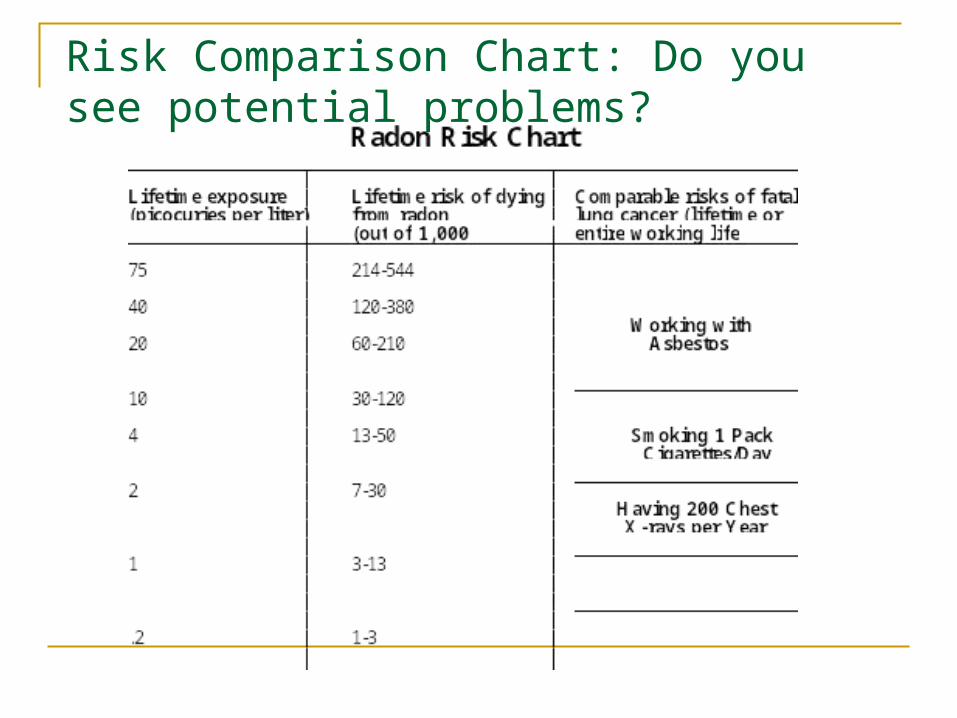
Risk Comparison Chart: Do you see potential problems?
Challenge of Information Design, especially for quantitative information
Public is not used to interpreting scientific data in same graphical forms as scientists typically represent them.
Even simplified graphics can be misinterpreted.
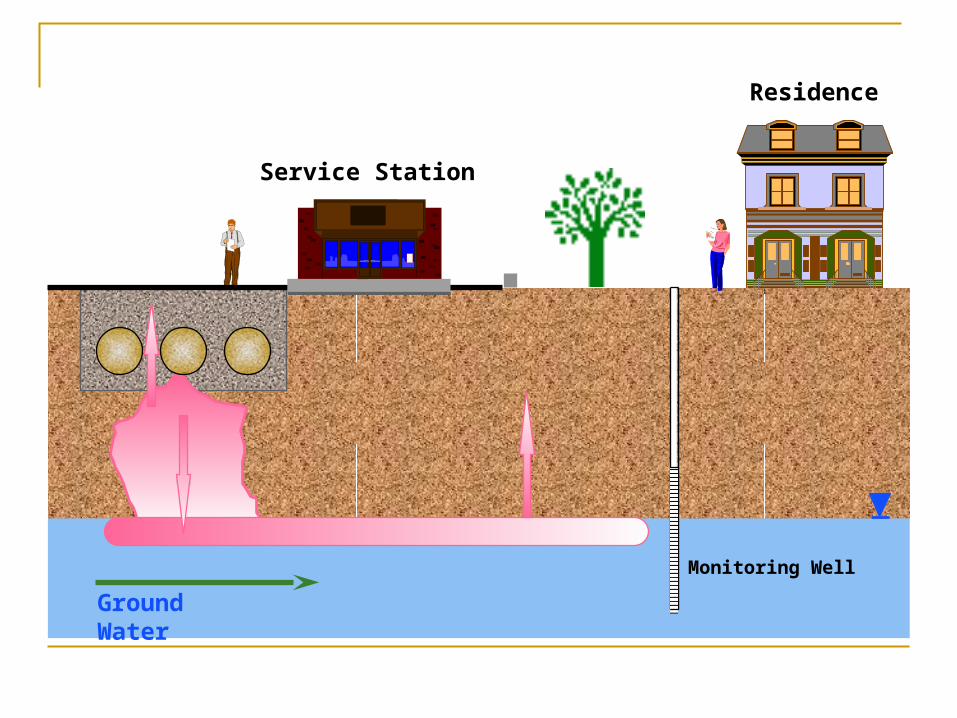
Monitoring Well
Ground Water
Service Station
Residence
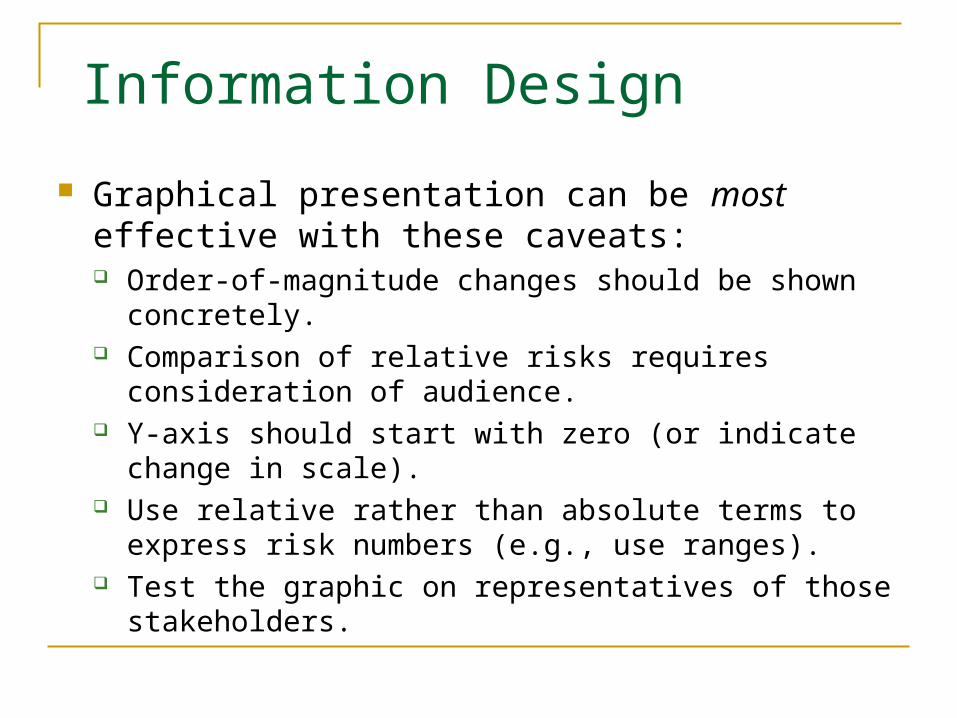
Information Design
Graphical presentation can be most effective with these caveats: Order-of-magnitude changes should be shown concretely. Comparison of relative risks requires consideration of
audience. Y-axis should start with zero (or indicate change in scale). Use relative rather than absolute terms to express risk
numbers (e.g., use ranges). Test the graphic on representatives of those stakeholders.
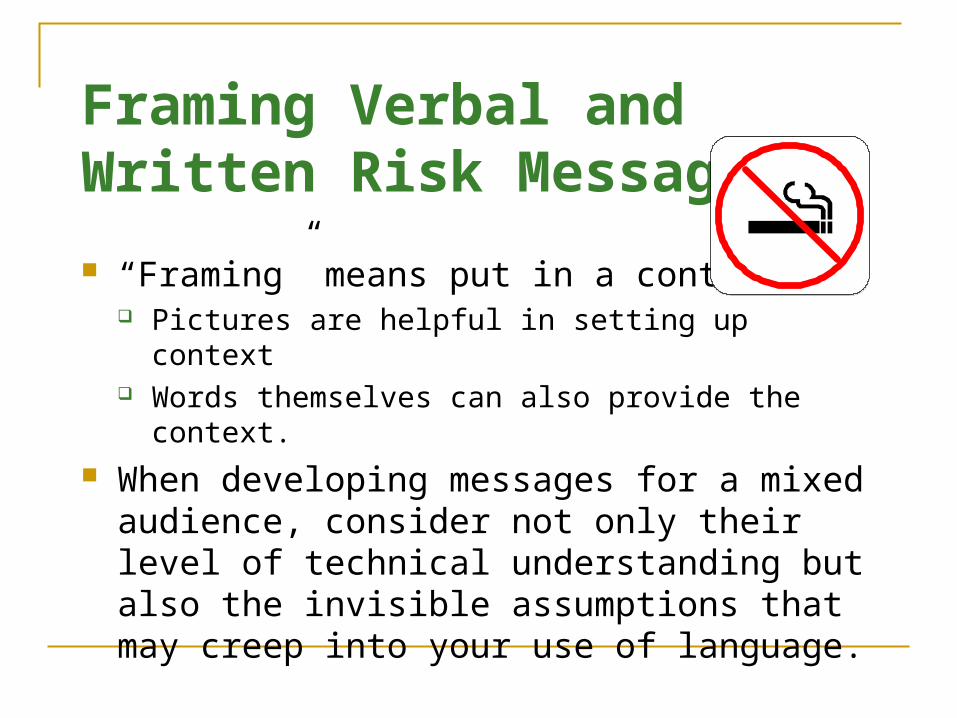
Framing Verbal and Written Risk Messages
“Framing” means put in a context. Pictures are helpful in setting up context Words themselves can also provide the context.
When developing messages for a mixed audience, consider not only their level of technical understanding but also the invisible assumptions that may creep into your use of language.
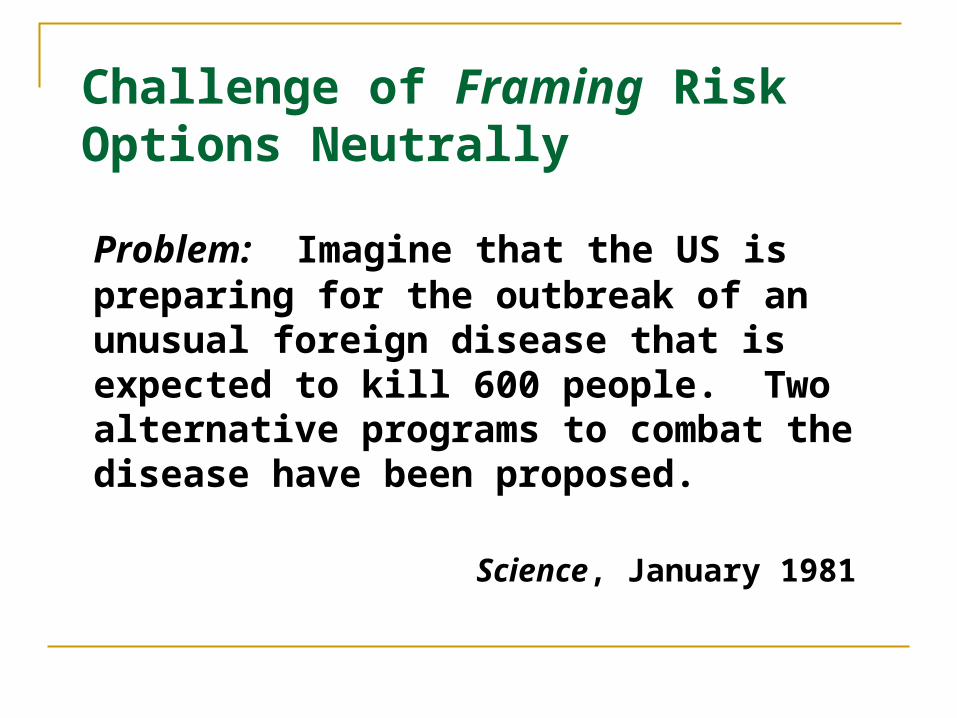
Challenge of Framing Risk Options Neutrally
Problem: Imagine that the US is preparing for the outbreak of an unusual foreign disease that is expected to kill 600 people. Two alternative programs to combat the disease have been proposed.
Science, January 1981
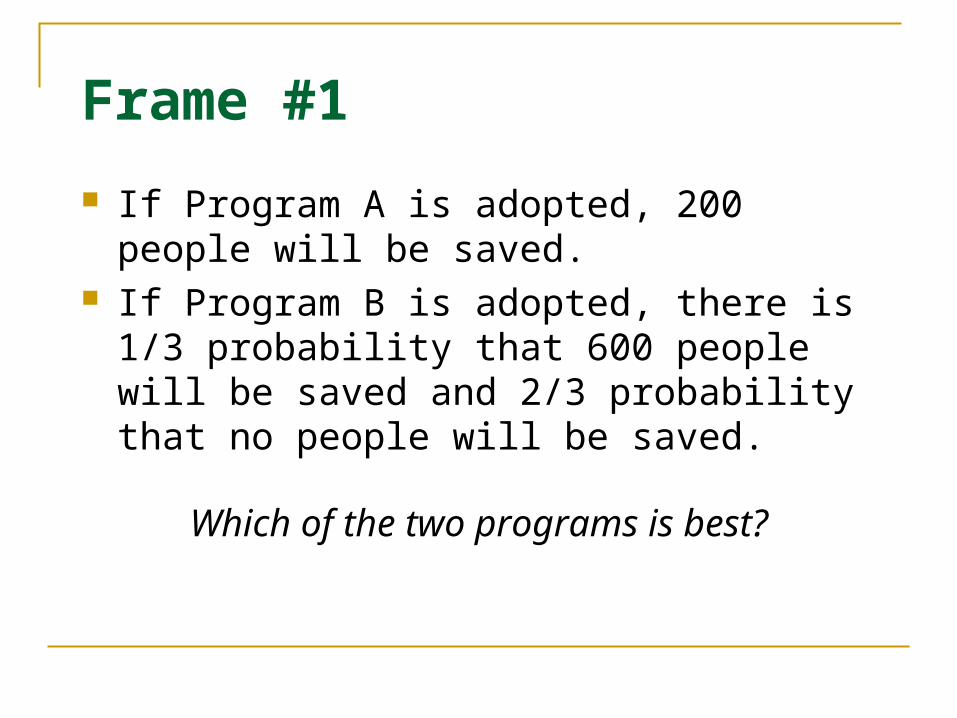
Frame #1
If Program A is adopted, 200 people will be saved.
If Program B is adopted, there is 1/3 probability that 600 people will be saved and 2/3 probability that no people will be saved.
Which of the two programs is best?
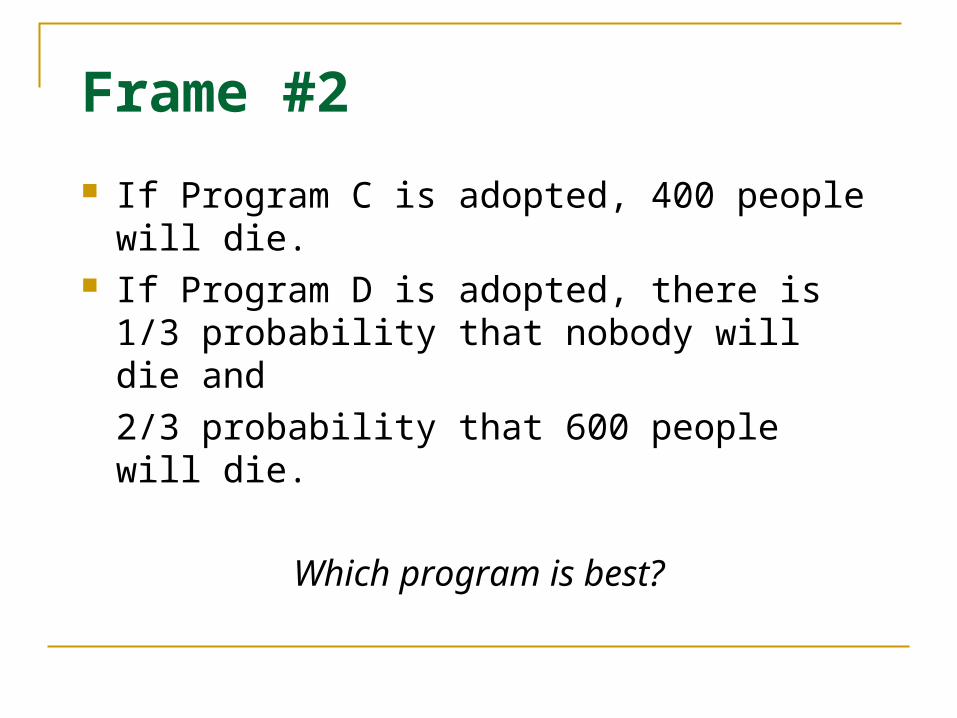
Frame #2
If Program C is adopted, 400 people will die. If Program D is adopted, there is 1/3
probability that nobody will die and
2/3 probability that 600 people will die.
Which program is best?
References
Baruch Fischoff and Paul Slovic cognitive psychologists
Vincent T. Covello risk perception guru
Peter Sandman risk communication promoter
Journals: Risk Analysis; Environmental Science &Technology