Embed Size (px)
Citation preview

Ross Pfeffer, Director Sales and Marketing, Southern Cross
CommsDay Summit, Sydney, April 2013

o Total Design Capacity of .050 Tbps
o Voice, Fax and TV
o Internet Growth from the early 90’s,
o Internet Content centred in the US
o By 1998-2000
o ANZ-US Bottleneck of 0.012 Tbps
o Second Generation of Fibre Cables
Tbps
1992
1993
1994
1995
1996
1997
1998
1999
2000
2001
2002
2003
2004
2005
2006
2007
2008
2009
2010
2011
2012
2013
TASMAN 2 0.001
PACRIM EAST 0.001
PACRIM WEST 0.001
JASURAUS 0.005
SE-ME-WE 3 0.040
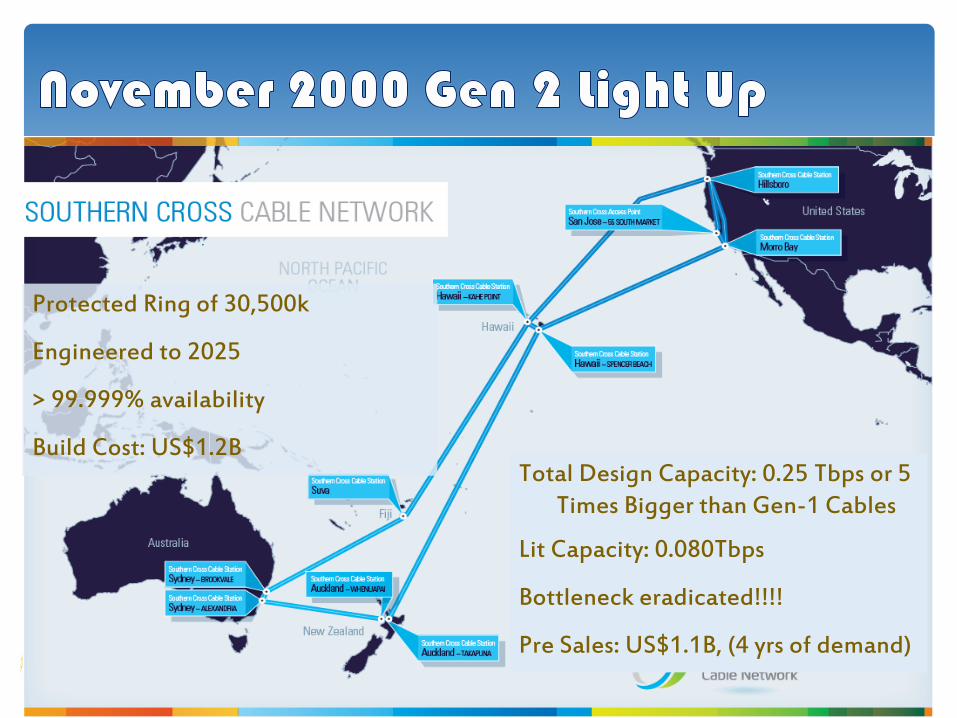
Protected Ring of 30,500k
Engineered to 2025
> 99.999% availability
Build Cost: US$1.2B Total Design Capacity: 0.25 Tbps or 5
Times Bigger than Gen-1 Cables
Lit Capacity: 0.080Tbps
Bottleneck eradicated!!!!
Pre Sales: US$1.1B, (4 yrs of demand)

o Dot coms and cables crash
o 6 new Trans-Atlantic cables between 2000 and 2003
o Each cable bigger than all that preceded it
o Soon 1 Million kilometres of submarine cable
o Overestimated Demand Growth
o Virtuous Circle became Vicious
o Prices collapsed to less than Operational Cost
o Chapter 11 & Bankruptcies
o Financial Restructuring
o What has been the ANZ Experience?

New Cables Announcements Refinances / Failures
2000 SX1 to USA NAVA-1 to Singapore
SX2 to USA SX Banks Walked, Sponsor Guarantees
AJC to Guam
2002
2003 AJC Bank Rescue
2004 NAVA-1 Initiative Fails
2005
2006
2007
2008 Endeavour to Haw
PPC1 to Guam
AAG SEA-Guam-USA
2010 Pacific Fibre to USA Pipe Incl PPC-1 Sold
AXIN Trans Tasman
ASC to Singapore
ASSC-1 to Singapore
Hawaiiki to USA Pacific Fibre Inititative Fails
APX West to Singapore ASSC-1 and AXIN Gone Quiet
APX East to USA
Tasman Global Access
Freedom extension to Perth
2012
2011
2009
2001

o ANZ International Capacity CAGR
50% since 2002
o Now totals about 2.5 Tbps
o Traffic Capacity + Protection Capacity
o 80% Fully Protected
o 70–80% terminates in the US
o Actual Demand is now 10 times the
initial Design Capability of SX
o So how did the industry do it?


o SX upgraded 8 times
o SX capability increased by 35

o CAGR Price Decline > -23%
o Reflecting:
o Cable Competition
o Resale Competition
o Low MC of Capacity Upgrades
o Retail Broadband Competition
o Price is now < 5c per GB o SX Published 10G-2D/R
o 10 Year Repayment
o 45% Utilisation
o excluding volume discounts and O&M

o Demand Sources
o Applications Changes
o Technology Changes for Access and Transport

o The Dial and DSL waves
drove international capacity
demand


o Entitlement is greater than use
o Unlimited / TB Plans
o More can be consumed for no increase
in retail revenue
o The faster retail demand increases the
faster international capacity price must
fall
o Applications are the real key to future
growth.

o Market Capacity grown at 45% since 2008
o ABS Download Volumes grown at 65%
o Reflects growth of Cache
o Cache accounts for > 30% of D/L today
o Likely to exceed 50% by 2015
o Cache will increasingly subdue demand

o Mobile devices are adding to Fixed Volumes via Wi-Fi
o US evidence suggests the 4G Impact will be strong
o provided mobile quotas expand and mobile data prices fall
o Mobile Substitution of Fixed Line may become much more significant
o 4G Likely to Impact Fibre uptake depending on Pricing

o Will substitute ADSL fixed Line
o The FTTH Wave will take a DECADE
o NBN subs may currently consume twice the volume of ADSL2+
o But DSL Subs are oversubscribed to Data Entitlement
o FTTH has not enabled new applications in other markets
o Most Subscribers unlikely to pay more for more data?
o If FTTH lifts demand Cache will strengthen further
18
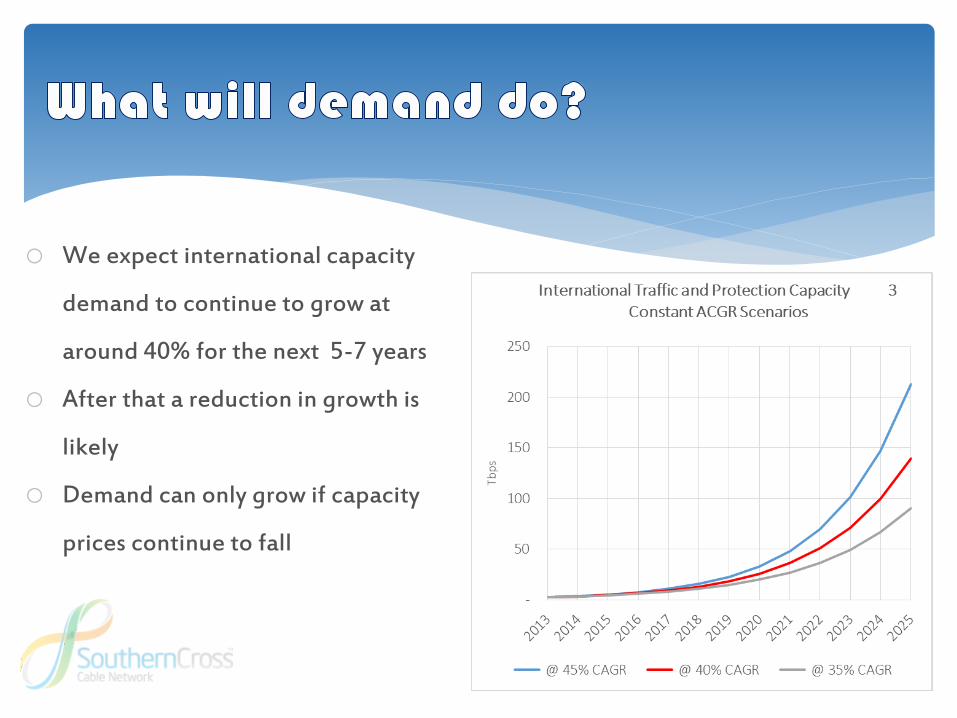
o We expect international capacity
demand to continue to grow at
around 40% for the next 5-7 years
o After that a reduction in growth is
likely
o Demand can only grow if capacity
prices continue to fall

o 5 existing cables from ANZ can all
expand supply at low cost
o Assumes SX1/2 cannot or does not
use 1 Tbps Channels from 2020
o Have not included the construction
of a new SX Cable

o Supply is assuredo International capacity demand likely to remain strong o The impact of Fibre and Mobile remains in doubto Cache Impact will strengthen
o Most Fixed Users have high data entitlements and unlikely to pay moreo so Retail Revenue generation opportunities from more Data have diminished greatly.
o But ISP’s will need to acquire a lot more capacity
o Existing Cables will continue to expand, at low MC and to aggressively compete to meet the evolving needs of ISPs.
o A plethora of new cable proposals will continue to add to price decline pressures

o No imminent need :
o Technical cable performance indicates reliability until at least 2030
o Likely upgrade efficiencies will allow us to easily meet the expected demand
o An early overbuild may have considerable merit i.e Build Cost/Benefit may be more
attractive than Upgrade Economics
o Large installed customer base increasingly looking at LT supply options
o Opportunity to expand route and mesh network options
o Our potential Capacity increases dramatically
o using current100Gbps channels the balanced cable limit of 7 Tbps increases to 24 Tbps!
o The case for an early SX overbuild is under review

o Capacity will continue to be expanded well ahead of demand
o The term of our IRU’s will be extended (again) to 2030
o Construction of more POPS (LA, Sydney No. 2, Auckland)
o Further Price reductions associated with capacity expansions
o Major innovations to de-risk and reward long term customer purchase commitments


![AN v ANZ Banking Group Limited - Home | …...AN v ANZ Banking Group Limited • [2015] AusHRC 93 • 1 Australian Human Rights Commission Level 3, 175 Pitt Street, Sydney NSW 2000](https://img.pdfslide.us/doc/110x75/5f04d5317e708231d40feef9/an-v-anz-banking-group-limited-home-an-v-anz-banking-group-limited-a-2015.jpg)