Embed Size (px)
Citation preview

CommonwealthActuarial Valuation Report
January 1, 2015
PUBLIC EMPLOYEE RETIREMENT ADMINISTRATION COMMISSIONCOMMONWEALTH OF MASSACHUSETTS

COMMONWEALTH ACTUARIAL VALUATION REPORT
January 1, 2015

TABLE OF CONTENTS Section Page 1. Introduction & Certification .............................................................................................................. 1 2. Executive Summary A. Principal Valuation Results ...................................................................................................... 2 B. Comparison with Prior Valuation and Experience Analysis ............................................ 3 C. Funding Progress ....................................................................................................................... 6 3. Summary of Valuation Results ........................................................................................................ 10 4. Development of the Actuarial Gain or Loss ................................................................................ 11 5. Audit Information .............................................................................................................................. 12 6. Plan Assets A. State and Massachusetts Teachers’ ..................................................................................... 13 B. Boston Teachers ...................................................................................................................... 13 C. Impact of 2008 Loss and Asset Corridor .......................................................................... 13 D. Development of Actuarial Value of Assets ....................................................................... 14 7. System Membership A. State Active Members ............................................................................................................ 15 B. State Retirees and Survivors ................................................................................................. 17 C. Massachusetts Teachers’ Active Members ....................................................................... 19 D. Massachusetts Teachers’ Retirees and Survivors ............................................................ 22 E. Boston Teachers’ Active Members ..................................................................................... 24 F. Boston Teachers’ Retirees and Survivors .......................................................................... 26 8. Valuation Cost Methods A. Actuarial Cost Method .......................................................................................................... 28 B. Asset Valuation Method ......................................................................................................... 28 9. Actuarial Assumptions ...................................................................................................................... 29 10. Summary of Plan Provisions .......................................................................................................... 37 11. Glossary of Terms ........................................................................................................................... 44

C O M M O N W E A L T H A C T U A R I A L V A L U A T I O N R E P O R T | J A N U A R Y 1 , 2 0 1 5 1
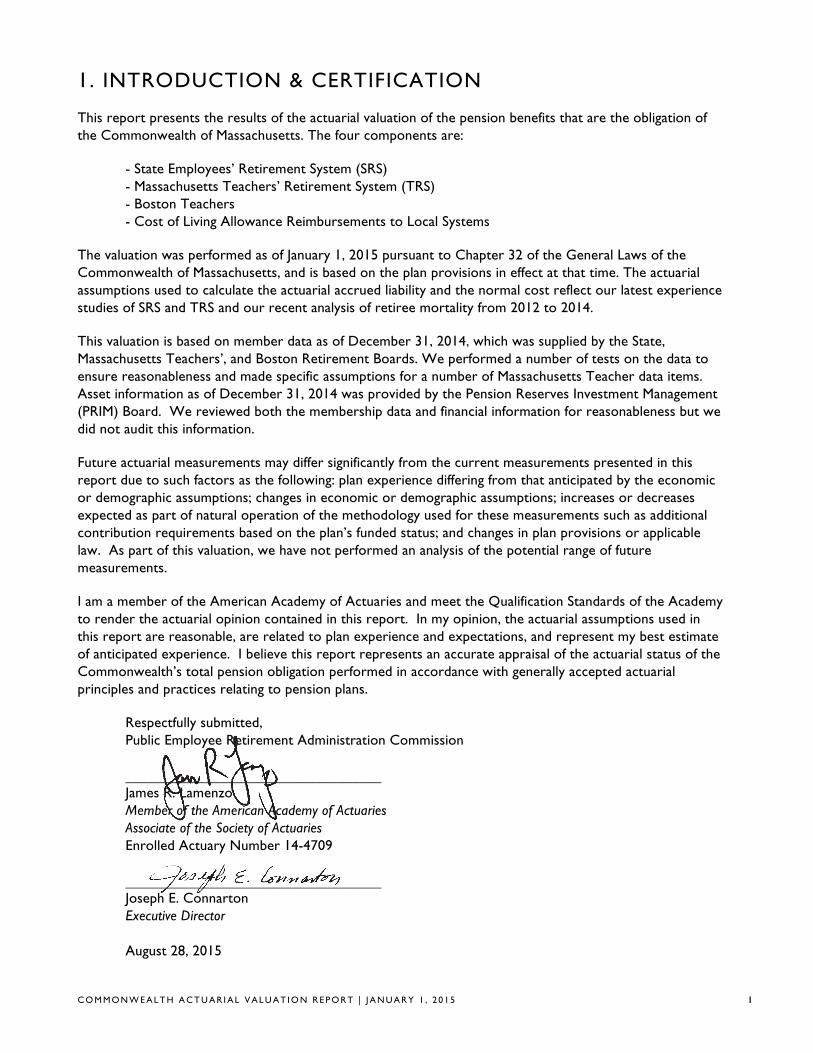
1. INTRODUCTION & CERTIFICATION This report presents the results of the actuarial valuation of the pension benefits that are the obligation of the Commonwealth of Massachusetts. The four components are: - State Employees’ Retirement System (SRS) - Massachusetts Teachers’ Retirement System (TRS) - Boston Teachers - Cost of Living Allowance Reimbursements to Local Systems The valuation was performed as of January 1, 2015 pursuant to Chapter 32 of the General Laws of the Commonwealth of Massachusetts, and is based on the plan provisions in effect at that time. The actuarial assumptions used to calculate the actuarial accrued liability and the normal cost reflect our latest experience studies of SRS and TRS and our recent analysis of retiree mortality from 2012 to 2014. This valuation is based on member data as of December 31, 2014, which was supplied by the State, Massachusetts Teachers’, and Boston Retirement Boards. We performed a number of tests on the data to ensure reasonableness and made specific assumptions for a number of Massachusetts Teacher data items. Asset information as of December 31, 2014 was provided by the Pension Reserves Investment Management (PRIM) Board. We reviewed both the membership data and financial information for reasonableness but we did not audit this information. Future actuarial measurements may differ significantly from the current measurements presented in this report due to such factors as the following: plan experience differing from that anticipated by the economic or demographic assumptions; changes in economic or demographic assumptions; increases or decreases expected as part of natural operation of the methodology used for these measurements such as additional contribution requirements based on the plan’s funded status; and changes in plan provisions or applicable law. As part of this valuation, we have not performed an analysis of the potential range of future measurements. I am a member of the American Academy of Actuaries and meet the Qualification Standards of the Academy to render the actuarial opinion contained in this report. In my opinion, the actuarial assumptions used in this report are reasonable, are related to plan experience and expectations, and represent my best estimate of anticipated experience. I believe this report represents an accurate appraisal of the actuarial status of the Commonwealth’s total pension obligation performed in accordance with generally accepted actuarial principles and practices relating to pension plans.
Respectfully submitted, Public Employee Retirement Administration Commission ___________________________________ James R. Lamenzo Member of the American Academy of Actuaries Associate of the Society of Actuaries Enrolled Actuary Number 14-4709 ___________________________________ Joseph E. Connarton Executive Director August 28, 2015

C O M M O N W E A L T H A C T U A R I A L V A L U A T I O N R E P O R T | J A N U A R Y 1 , 2 0 1 5 2
2. EXECUTIVE SUMMARY PART A | PRINCIPAL VALUATION RESULTS
The provisions of Chapter 32, Section 22C mandate the establishment of a funding schedule for the Commonwealth of Massachusetts pension obligation. The SRS, TRS, liabilities for Boston teachers, and State reimbursements to local systems to reflect COLAs granted from 1982 through 1996 are the components of the Commonwealth schedule. The schedule, as mandated by law, calls for payment of the Normal Cost plus an amortization payment on the Unfunded Actuarial Liability (UAL).
The Commonwealth’s current funding schedule was filed in January, 2014 and was based on the results of the January 1, 2013 Commonwealth Actuarial Valuation. The FY15 appropriation was $1.793 billion. This amount increases 10% in FY16 and FY17. The appropriations for FY16 and FY17 are $1.972 billion and $2.169 billion under this schedule. Beginning in FY18, total appropriations increase 7% each year until FY35 with a final amortization payment in FY36. Based on the results of the January 1, 2015 actuarial valuation, that appropriation increase would be required for two additional years with a final amortization payment in FY38. This extension is primarily due to the adoption of a fully generational mortality assumption, as actuarial gains since January 1, 2013 essentially offset the cost increase for the reduction in the investment return assumption (see page 4 for detail with respect to assumption changes). Due to the adoption of an early retirement incentive (ERI) program for SRS, there was an initial additional budgeted amount for FY16 of $48.7 million (15 year level amortization basis) to estimate the increase in actuarial liability. This estimate was recently revised to $29.1 million to reflect an estimate based on the number of members actually electing the ERI. In prior actuarial valuations, the Annual Required Contribution (ARC) was developed under GASB 27. The ARC was developed using the minimum allowable schedule for local systems under Chapter 32 (UAL amortized on a 4.0% annual increasing basis to FY40). On this basis, the FY16 appropriation is approximately $2.6 billion. Therefore, the FY16 appropriation (excluding the additional amount for ERI) is approximately 76% of the ARC. This percentage will increase each year. After 10 years, we expect the appropriation will exceed the ARC.
The results of the January 1, 2015 actuarial valuation are as follows (in thousands):
Total Normal Cost $1,589,683
Expected Employee Contributions 1,158,258
Net Normal Cost $431,425
Total Actuarial Liability $81,535,003
Assets 48,105,862
Unfunded Actuarial Liability $33,429,141

C O M M O N W E A L T H A C T U A R I A L V A L U A T I O N R E P O R T | J A N U A R Y 1 , 2 0 1 5 3
2. EXECUTIVE SUMMARY (continued)
PART B | COMPARISON WITH PRIOR VALUATION AND EXPERIENCE ANALYSIS
A comparison of the results of the current valuation and the January 1, 2014 valuation is shown below. (Dollars in thousands)
1/1/15 1/1/14 Increase (Decrease)
Increase (Decrease)
Total Normal Cost $1,589,683 $1,428,124 $161,559 11.3%
Expected Employee Contributions
1,158,258 1,100,228 58,030 5.3%
Net Normal Cost $431,425 $327,896 $103,529 31.6%
Actuarial Liability
Actives $34,798,600 $31,958,004 $2,840,596 8.9%
Retirees and Inactives 46,736,403 42,978,990 3,757,413 8.7%
Total $81,535,003 $74,936,994 $6,598,009 8.8%
Assets (Actuarial Value) 48,105,862 45,894,034 2,211,828 4.8%
Unfunded Actuarial Liability $33,429,141 $29,042,960 $4,386,181 15.1%
Funded Ratio 59.0% 61.2% (2.2%)
Gain/(Loss)
The development of the actuarial gain/(loss) is shown in Section 4. During 2014, there was an overall actuarial gain of $211 million. There was a non-investment loss on actuarial liability of approximately $398 million and a gain on assets (on an actuarial value basis) of approximately $610 million. The return on assets was approximately 8.3% on a market value basis compared to 9.4% on an actuarial value basis. Since 1998, PERAC has valued system assets using a smoothing technique which spreads gains and losses over five years and employs a “corridor” so that the actuarial value of assets (AVA) is always within a set percentage of the market value of assets. The current corridor is 10% so that the AVA is never less than 90% nor greater than 110% of the market value of assets. The calculated actuarial value of assets as of January 1, 2015 is 95.7% of the market value. This figure was 94.9% as of January 1, 2014. The UAL increased from $29.0 billion as of January 1, 2014 to $33.4 billion as of January 1, 2015. This increase reflects a change in the investment return assumption from 8.0% to 7.75% and the adoption of a fully generational mortality assumption.
C O M M O N W E A L T H A C T U A R I A L V A L U A T I O N R E P O R T | J A N U A R Y 1 , 2 0 1 5 4
2. EXECUTIVE SUMMARY (continued)
PART B | COMPARISON WITH PRIOR VALUATION AND EXPERIENCE ANALYSIS (continued)
Assumption Changes
We used an 8.25% investment return assumption in our actuarial valuations prior to January 1, 2013. The January 1, 2013 valuation reflected an 8.0% investment return assumption. The January 1, 2015 valuation reflects a 7.75% investment return assumption which we recommended in the fall of 2014. Our recommendation was based on the most recent PRIM study available which was released in early 2014 (see next paragraph) and the general trend of this assumption both in Massachusetts and nationally. The actuarial liability (and correspondingly the UAL) increased by approximately $1.8 billion to reflect this change. In January 2015, an updated study by PRIM’s investment consultant outlined a 30 year expected average annual return of 7.9% (gross of investment expenses which are typically about 50 basis points). This expected return was 30 basis points less than the figure of 8.2% outlined in the 2014 study. The annual PRIM study is one factor we consider in developing a recommendation for the investment return assumption. Based on this result and the upcoming study to be completed in early 2016, we may recommend a further reduction in this assumption in the 2016 valuation. In our 2011 actuarial valuation, we began reflecting future mortality improvement (increasing life expectancy). Each year we have modified this assumption as we have moved closer to a fully generational mortality assumption that includes all expected future mortality improvements. Based on recent analysis of retiree mortality during 2012, 2013, and 2014, we have taken the final step in this valuation and moved to a fully generational assumption. The revised assumption reflects a two-dimensional table based on the calendar year and each member’s age. The 2014 valuation used a static table that projected mortality improvement to 2022 for active members and 2017 for retirees then used these rates for all future years. The actuarial liability (and correspondingly the UAL) increased by approximately $1.7 billion to reflect this change. As noted in the prior paragraphs, the UAL as of January 1, 2015 would have been approximately $3.5 billion lower ($1.8 billion plus $1.7 billion) if there had been no change in assumptions from the prior valuation. On this basis, the January 1, 2015 UAL would be $29.9 billion and the funded ratio 61.6%. The two assumption changes reflect a more conservative funding basis.
Chapter 176 Chapter 176 of the Acts of 2011, An Act Providing for Pension Reform and Benefit Modernization made a number of changes to the Chapter 32 pension law for employees hired after April 1, 2012. There are several changes that will have the most impact on decreasing plan liabilities over the longer term. These include an increase in the normal retirement age by two years (for example, from age 65 to age 67 for Group 1 members), an increase in the age (early retirement) reduction factor for ages below the maximum age (from a 4.0% to a 6.0% annual reduction), and an increase in the period for determining a member’s average annual compensation (from 3 years to 5 years). Since these changes are effective only for members hired after April 1, 2012, this is the third actuarial valuation to reflect these changes.

C O M M O N W E A L T H A C T U A R I A L V A L U A T I O N R E P O R T | J A N U A R Y 1 , 2 0 1 5 5
2. EXECUTIVE SUMMARY (continued)
PART B | COMPARISON WITH PRIOR VALUATION AND EXPERIENCE ANALYSIS (continued)
As of January 1, 2015, there were approximately 32,600 members hired after April 1, 2012. Since these members have less than three years of service and are generally young, there is still relatively little impact on plan costs (on a percentage basis) in this valuation. The employer normal cost is approximately $43 million lower than it would have been if the previous provisions were in place for these members. The actuarial liability is approximately $70 million lower than it would have been if the prior provisions were in place.
Teachers
We have detailed a number of the assumptions we made for missing or questionable data for active members of the TRS in Part C of Section 7.
TRS implemented a new system with the data submission for the January 1, 2014 valuation. As part of the 2014 valuation, we identified several issues that TRS subsequently reviewed prior to the January 1, 2015 data submission. The data submission for the January 1, 2015 valuation has improved.
Boston Teachers
The Boston Retirement System (BRS) also implemented a new system with the data submission for the January 1, 2014 valuation. As part of the 2014 valuation, we identified several issues that BRS subsequently reviewed prior to the January 1, 2015 data submission. The data submission for the January 1, 2015 has improved. However, several data issues remain. The most significant issue is that the Annuity Savings Fund balances were not provided.

C O M M O N W E A L T H A C T U A R I A L V A L U A T I O N R E P O R T | J A N U A R Y 1 , 2 0 1 5 6
2. EXECUTIVE SUMMARY (continued)
PART C | FUNDING PROGRESS The UAL and funded ratio are measures of the plan’s funded status. These measures reflect the plan’s position as of January 1, 2015. We believe these measures alone are not appropriate for assessing the sufficiency of assets to cover the estimated cost of settling the Commonwealth’s benefit obligations or assessing the need for or the amount of future contributions. However, we believe these measures, in conjunction with maintaining the appropriations required under the Commonwealth funding schedule, are appropriate for assessing the amount of future contributions.
The nature of actuarial funding is that assets gradually catch up to the actuarial liability. When pension funding was adopted in 1987, the initial amortization period was established as 40 years. Based on the amortization basis of the schedules adopted, the UAL was expected to increase for a period of time. However, due to actual investment returns significantly exceeding the expected return in the 1990’s, the UAL actually decreased until January 1, 2000.
It is important to note that plan assets have grown faster than plan liabilities. As of January 1, 1990, the actuarial liability was $20.0 billion and assets were $7.8 billion. The difference of $12.2 billion is the UAL. As of January 1, 2015, the actuarial liability is $81.5 billion and the actuarial value of assets is $48.1 billion. The difference of $33.4 billion is the UAL. The actuarial liability has grown 4.1 times over this period ($81.5B / $20.0B). But assets have grown 6.2 times over this same period ($48.1B / $7.8B).
For this reason, we believe the funded ratio represents a better measure of the Commonwealth’s progress. If you draw a straight line from the 1990 funded ratio of 39.0% to the January 1, 2015 amount of 59.0%, the line is moving upward to the right. This demonstrates the funding progress to date. Although the funded ratio reached 85.2% on January 1, 2000, this was the result of average annual returns from 1985-1999 that exceeded 12.5% and attaining such a high level of funding so quickly was not expected. Over the past 15 years (2000-2014), the average annual return on assets on a market value basis is approximately 6.1%. Over a 10-year and 5-year period, the returns have been 7.0% and 10.0% respectively. The 30 year return is 9.8%.
We indicated on page 4 that the actuarial liability as of January 1, 2015 increased $3.5 billion to reflect a reduction in the investment return assumption from 8.0% to 7.75% and a change to a fully generational mortality assumption. There have been a number of other plan and assumption changes in the past 5 years that have increased the Commonwealth actuarial liability. These changes include a reduction in the investment return assumption from 8.25% to 8.0% as of January 1, 2013, annual adjustments to the mortality assumption, the adoption of a $13,000 COLA base, the transfer of active members of sheriff departments in six counties to the State, and the transfer of former members of the Massachusetts Turnpike Authority Retirement System to the State. Including the changes as of January 1, 2015, the actuarial liability is approximately $6.8 billion greater than it would have been using the 2010 basis. Therefore, on a comparable basis with the 2010 plan provisions and assumptions, the UAL on January 1, 2015 would be $26.6 billion and the funded ratio would be 64.4%.

2. EXECUTIVE SUMMARY
PART C | FUNDING PROGRESS UNFUNDED LIABILITY
The chart below shows the Commonwealth’s unfunded actuarial accrued liability (UAL) since 1990. The UAL represents the actuarial accrued liability less the actuarial value of
plan assets. When there is no UAL, a system is said to be “fully funded.” In this exhibit, for years prior to 2000, the figures were estimated to reflect implementation of
updated actuarial software. On a market value basis, the UAL is $31.2 billion.
COMMONWEALTH ACTUARIAL VALUATION REPORT | JANUARY 1, 2015 7
0
$3.0
$6.0
$9.0
$12.0
$15.0
$18.0
$21.0
$24.0
$27.0
$30.0
$33.0
$36.0
06 070504030201009896959390
$12.2
$11.1
$9.8
$8.4$7.9
$4.8
COMMONWEALTH UNFUNDED LIABILITY(in billions of dollars)
$6.4
$7.4
$13.4 $13.3
$12.0
$13.4
$14.5
$22.1
$20.0
$18.6
$23.6
$28.3 $29.0
$33.4
08 09 10 11 12 13 14 15
$12.1

2. EXECUTIVE SUMMARY
PART C | FUNDING PROGRESS FUNDED RATIO
The chart below shows the Commonwealth’s funded ratio progress since 1990. The funded ratio represents the actuarial value of plan assets divided by the actuarial accrued liability. When the funded ratio reaches 100%, a system is said to be “fully funded.” In this exhibit, for years prior to 2000, the figures were estimated to reflect implementation of
updated actuarial software. On a market value basis, the funded ratio is 61.7%.
COMMONWEALTH ACTUARIAL VALUATION REPORT | JANUARY 1, 2015 8
COMMONWEALTH FUNDED RATIO
20%
40%
60%
80%
100%
10 1505009590
39.0%
48.8%
55.8%
64.9%
72.6%
85.2%
82.1%81.1%
68.9%
73.9%
72.3% 71.5%
75.2%78.6%
62.7%
67.5%
65.1%
60.6%
61.2%
59.0%
71.1%
2. EXECUTIVE SUMMARY
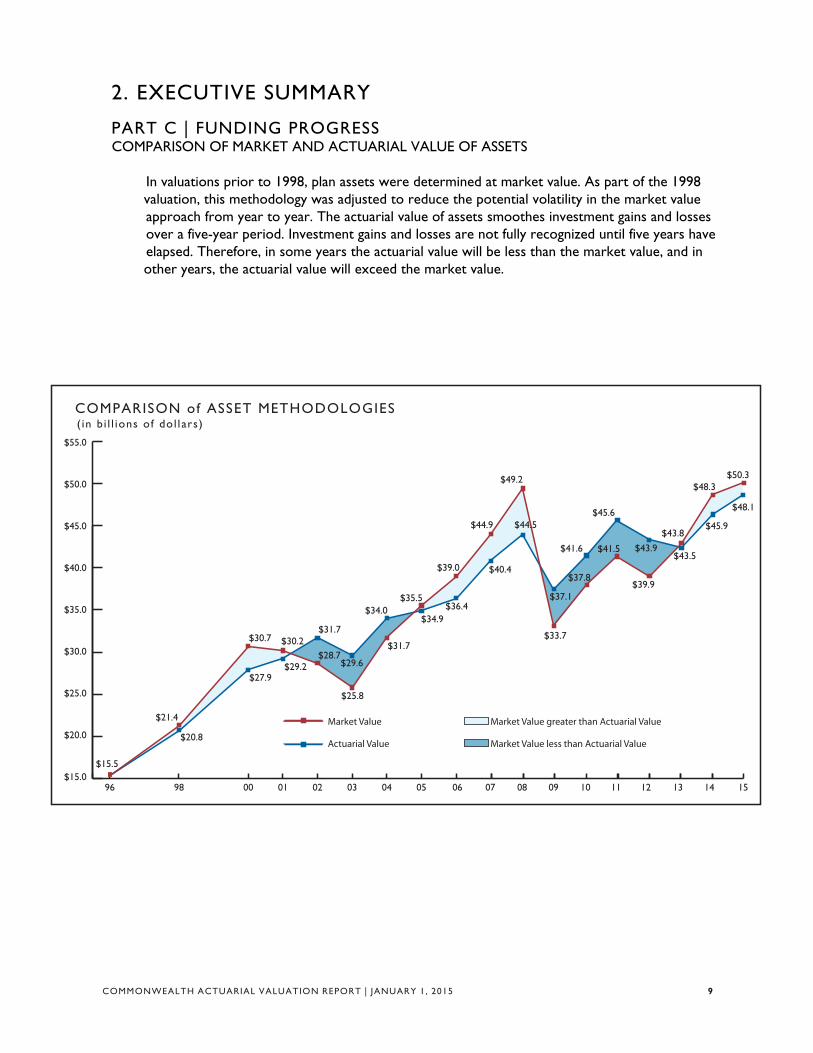
PART C | FUNDING PROGRESS COMPARISON OF MARKET AND ACTUARIAL VALUE OF ASSETS
In valuations prior to 1998, plan assets were determined at market value. As part of the 1998 valuation, this methodology was adjusted to reduce the potential volatility in the market value
approach from year to year. The actuarial value of assets smoothes investment gains and losses over a five-year period. Investment gains and losses are not fully recognized until five years have
elapsed. Therefore, in some years the actuarial value will be less than the market value, and in other years, the actuarial value will exceed the market value.
COMMONWEALTH ACTUARIAL VALUATION REPORT | JANUARY 1, 2015 9
$15.0
$20.0
$25.0
$30.0
$35.0
$40.0
$45.0
06 07 08 09 10 11 12 13 14 150504030201009896
Market Value
Actuarial Value
$15.5
$20.8
$27.9$29.2
$31.7
$21.4
$30.7 $30.2$28.7
$25.8
$29.6
$31.7
$34.0
COMPARISON of ASSET METHODOLOGIES(in b i l l ions of dol lars)
$50.0
$55.0
Market Value greater than Actuarial Value
Market Value less than Actuarial Value
$34.9
$35.5
$39.0
$39.9
$43.8
$48.3$50.3
$43.5
$45.9
$48.1
$36.4
$40.4
$44.5$44.9
$43.9
$49.2
$33.7
$37.1
$37.8
$41.5$41.6
$45.6

C O M M O N W E A L T H A C T U A R I A L V A L U A T I O N R E P O R T | J A N U A R Y 1 , 2 0 1 5 10
3. SUMMARY OF VALUATION RESULTS (Dollars in thousands)
A. Number of Members State Mass. Teachers
Boston Teachers
Local COLA
Total
Active 88,508 90,070 6,145 184,723
Vested Terminated 4,340 0 0 4,340
Retired/ Beneficiaries 57,774 62,312 4,488 124,574
Total 150,622 152,382 10,633 313,637
B. Total Payroll $5,591,911 $6,204,274 $505,977 $12,302,162
C. Normal Cost
Superannuation $518,701 $677,668 55,159 $1,251,528
Death 57,659 27,941 2,015 87,615
Disability 78,921 9,697 727 89,345
Termination 71,856 82,487 6,852 161,195
Total Normal Cost $727,137 $797,793 $64,753 $1,589,683
Expected Employee Contributions 487,046 620,692 50,520 1,158,258
Net Employer Normal Cost $240,091 $177,101 $14,233 $431,425
D. Actuarial Liability
Active
Superannuation $14,784,528 $16,838,378 1,278,323 32,901,229
Death 346,491 209,729 15,607 571,827
Disability 416,485 90,485 7,054 514,024
Termination 347,047 433,099 31,374 811,520
Total Active $15,894,551 $17,571,691 $1,332,358 $34,798,600
Vested Terminated (a) 746,623 625,000 70,000 1,441,623
Non-Vested Terminated 196,766 0 0 196,766
Retirees and Survivors 16,841,210 25,919,078 2,151,226 186,500 45,098,014
Total Actuarial Liability $33,679,150 $44,115,769 $3,553,584 $186,500 $81,535,003
E. Actuarial Value of Assets 22,720,160 23,946,759 1,438,943 0 48,105,862
F. Unfunded Actuarial Liability $10,958,990 $20,169,010 $2,114,641 186,500 33,429,141
G. Funded Ratio: E/D 67.5% 54.3% 40.5% 0.0% 59.0%
(a) Massachusetts Teachers’ and Boston teachers’ amounts are estimated and includes non-vested terminated members.

C O M M O N W E A L T H A C T U A R I A L V A L U A T I O N R E P O R T | J A N U A R Y 1 , 2 0 1 5 11
4. DEVELOPMENT OF THE ACTUARIAL GAIN OR LOSS ( in mi l l ions)
State Mass. Teachers
Boston Teachers
Local COLA
Total
A. Gain/(loss) on Actuarial Liability
1. Actuarial Liability 1/1/14 30,679 40,742 3,315 201 74,937
2. Total Normal Cost 1/1/14 652 718 58 1,428
3. Interest on (1) and (2) at 8.0% 2,506 3,317 270 16 6,109
4. Benefits paid during 2014 [a] 1,760 2,600 220 30 4,610
5. Interest on (4) assuming mid year payment 70 104 9 1 184
6. Expected Actuarial Liability before adjustments: 32,007 42,073 3,414 186 77,680
(1)+(2)+(3)-(4)-(5)
7. Increase due to change in assumptions 1,397 1,890 168 3 3,458
8. Expected Actuarial Liability 1/1/15: (6)+(7) 33,404 43,963 3,582 189 81,138
9. Actuarial Liability 1/1/15 33,679 44,116 3,554 187 81,536
10. Gain/(loss): (8)-(9) (275) (153) 28 2 (398)
B. Gain/(loss) on assets
11. Actuarial Value of Assets (AVA) 1/1/14 21,581 22,940 1,373 45,894
12. Interest on (11) at 8.0% 1,726 1,835 110 3,672
13. Net Receipts [b] 562 717 110 1,389
14. Net Disbursements [b] 1,395 1,813 166 3,374
15. Net Cash Flow: (13)-(14) (833) (1,096) (56) (1,985) (( 16. Interest on (15) [c] (33) (44) (7) (84)
17. Expected AVA 1/1/15: (11)+(12)+(15)+(16) 22,441 23,635 1,420 47,496
18. AVA 1/1/15 22,720 23,947 1,439 48,106
19. Gain/(loss): (18)-(17) 279 312 19 610
C. Total Gain/(loss): (10)+(19) 4 158 47 2 211
Figures may not add due to rounding.
[a] Estimated
[b] Amounts actually received or disbursed by the fund.
[c] Assumes time weighting based on monthly cash flow. Boston Teachers assumed mid-year.

C O M M O N W E A L T H A C T U A R I A L V A L U A T I O N R E P O R T | J A N U A R Y 1 , 2 0 1 5 12
5. AUDIT INFORMATION In prior Commonwealth valuation reports, we included information required under Governmental Accounting Standards Board (GASB) Statement No. 27 (GASB 27). The Commonwealth began implementing GASB 27 in Fiscal Year 1996. GASB 27 has been replaced by GASB 68. In addition, GASB 67 replaces the requirements under GASB 25.
GASB 67 reflects plan financial statement reporting and was first effective for the plan year ending June 30, 2014. GASB 68 reflects employer financial statement reporting and was first effective for the fiscal year ending June 30, 2015.
We have not provided any GASB 67 or GASB 68 exhibits in this valuation report. These exhibits are provided under separate cover.

C O M M O N W E A L T H A C T U A R I A L V A L U A T I O N R E P O R T | J A N U A R Y 1 , 2 0 1 5 13
6. ASSETS PART A | STATE AND MASSACHUSETTS TEACHERS’ (Dol lars in thousands)
State Mass. Teachers Pension Reserves Investment Trust Market Value $23,739,487 $25,046,692 Actuarial Value $22,720,160 $23,946,759 Actuarial Value as a Percentage of Market Value 95.7% 95.6%
The Market Value of Assets shown above for the State consists of the assets as of December 31, 2014 for the State Employees’ Retirement System ($23.551 billion) and the assets remaining in the Massachusetts Turnpike Authority Employees’ Retirement System fund ($188.1 million).
The actuarial value of assets is determined so that 20% of the investment gain and loss in a given year is recognized annually for the next five years. Therefore, these investment gains and losses are fully recognized after five years. In addition to this treatment of gains and losses, we use a “corridor” approach so that the actuarial value of assets can never be too far from the market value of assets. Under our approach for the Commonwealth, the actuarial value cannot be less than 90% nor greater than 110% of the market value.
PART B | BOSTON TEACHERS Based on the enactment of Chapter 112 of the Acts of 2010, the assets of the Boston Teachers are
maintained by PRIM. The transfer of these assets occurred during 2010. We set the actuarial value of assets to 95.7% of the market value based on the results for State and Massachusetts Teachers.
Market Value $1,503,598 Actuarial Value $1,438,943
PART C | IMPACT OF 2008 LOSS AND ASSET CORRIDOR Due to the severity of the 2008 investment loss, and later the 2011 investment loss, the calculated actuarial value of assets had been greater than 110% of the market value each year from January 1, 2009 through January 1, 2012. Therefore, the actuarial value was set at 110% of the market value for those years. As of January 1, 2013, the 2008 loss was completely recognized and the actuarial value of assets was 99.6% of the market value. As of January 1, 2014, the actuarial value of assets was 95.0% of the market value. As of January 1, 2015 the actuarial value of assets was 95.7% of the market value. The corridor does not apply in this valuation.

C O M M O N W E A L T H A C T U A R I A L V A L U A T I O N R E P O R T | J A N U A R Y 1 , 2 0 1 5 14
6. ASSETS (cont inued) PART D | DEVELOPMENT OF ACTUARIAL VALUE OF ASSETS (Dollars in thousands) A. Development of 12/31/14 expected actuarial value of assets (AVA) State Mass. Teachers Total 1. Market Value (MV) 12/31/13 22,721,053 24,183,391 46,904,444 2. Actuarial Value 12/31/13 (as calculated) 21,581,133 22,940,196 44,521,329 3. Net Receipts 2014 562,314 716,803 1,279,117 4. Net Disbursements 2014 1,395,162 1,813,345 3,208,507 5. Net Cash Flow: (3)-(4) (832,848) (1,096,542) (1,929,390) 6. Expected Investment Return on (2): 0.08 x (2) 1,726,491 1,835,216 3,561,706 7. Expected Investment Return on (5): ½x 0.08 x (5) (33,314) (43,862) (77,176) 8. Expected AVA 12/31/14: (2)+(5)+(6)+(7) 22,441,462 23,635,008 46,076,470 B. Previous differences not yet amortized 1. Unrecognized amount of 12/31/13 difference a. .2 x 2010 Gain/(loss) 124,991 137,345 262,335 b. .4 x 2011 Gain/(loss) (699,871) (729,679) (1,429,550) c. .6 x 2012 Gain/(loss) 519,866 559,984 1,079,850 d. .8 x 2013 Gain/(loss) 1,194,934 1,275,546 2,470,481 e. Total 1,139,920 1,243,196 2,383,116 C. Gain/(loss) from 2014 1. Market Value 12/31/14 23,739,487 25,046,692 48,786,179 2. Expected Market Value 12/31/14: A(8)+B(1e) 23,581,382 24,878,204 48,459,586 3. Gain/ (loss) from 2014 investment: (1)-(2) 158,105 168,488 326,593 D. Development of AVA 12/31/14 1. 2014 Gain/(loss) 158,105 168,488 326,593 2. 2013 Gain/(loss) 1,493,668 1,594,433 3,088,101 3. 2012 Gain/(loss) 866,444 933,306 1,799,750 4. 2011 Gain/(loss) (1,749,678) (1,824,198) (3,573,876) 5. 2010 Gain/(loss) 624,953 686,724 1,311,677 6. 20% of 2014 Gain/(loss) 31,621 33,698 65,319 7. 20% of 2013 Gain/(loss) 298,734 318,887 617,620 8. 20% of 2012 Gain/(loss) 173,289 186,661 359,950 9. 20% of 2011 Gain/(loss) (349,936) (364,840) (714,775) 10. 20% of 2010 Gain/(loss) 124,991 137,345 262,335 11. Total 278,698 311,751 590,449 12. Actuarial Value 12/31/14: A(8)+D(11) 22,720,160 23,946,759 46,666,919 13. Percentage of Market Value 95.7% 95.6% 95.7% 14. Actuarial Value: (12) but not less than 90% of C(1) 22,720,160 23,946,759 46,666,919

C O M M O N W E A L T H A C T U A R I A L V A L U A T I O N R E P O R T | J A N U A R Y 1 , 2 0 1 5 15
7. SYSTEM MEMBERSHIP
PART A | STATE ACTIVE MEMBERS
A critical element of an actuarial valuation is accurate and up-to-date membership information. As part of this valuation, PERAC analyzed the member data provided by the State Retirement System. Actives Vested Terminations
Number of Members 88,508 4,340
Average Age 47.3 53.8
Average Service 13.2 15.9
Average Salary $63,180 $54,826
Average Annuity Savings Fund Balance
$60,553
$60,743
Age by Service Distribution of Active Members
Years of Service
Present Age
0 – 4 5 -9 10 - 14 15 - 19 20 – 24 25 - 29 30+ Total
0 - 24 2,180 7 2,187
25 - 29 6,160 1,015 15 7,190
30 - 34 4,704 3,244 710 10 8,668
35 - 39 3,008 2,502 2,049 650 6 8,215
40 - 44 2,519 2,247 1,982 2,345 748 40 9,881
45 - 49 2,353 2,022 1,940 2,149 2,067 1,204 72 11,807
50 - 54 2,180 1,981 1,763 1,871 1,779 2,555 1,245 13,374
55 - 59 1,587 1,632 1,703 1,703 1,568 2,125 2,762 13,080
60 - 64 883 1,127 1,241 1,276 1,086 1,426 2,209 9,248
65+ 318 563 704 690 554 763 1,266 4,858
Total 25,892 16,340 12,107 10,694 7,808 8,113 7,554 88,508

C O M M O N W E A L T H A C T U A R I A L V A L U A T I O N R E P O R T | J A N U A R Y 1 , 2 0 1 5 16
7. SYSTEM MEMBERSHIP (continued)
PART A | STATE ACTIVE MEMBERS (continued)
Salary by Age Distribution of Active Members
Present Age
Number of Members
Total Salary
Average Salary
0 - 24 2,187 $74,988,730 $34,288
25 - 29 7,190 $321,987,111 $44,783
30 - 34 8,668 $460,822,889 $53,164
35 - 39 8,215 $484,242,151 $58,946
40 - 44 9,881 $631,792,032 $63,940
45 - 49 11,807 $781,815,437 $66,216
50 - 54 13,374 $898,584,108 $67,189
55 - 59 13,080 $904,545,282 $69,155
60 - 64 9,248 $671,220,934 $72,580
65+ 4,858 $361,912,559 $74,498
Total 88,508 $5,591,911,233 $63,180

C O M M O N W E A L T H A C T U A R I A L V A L U A T I O N R E P O R T | J A N U A R Y 1 , 2 0 1 5 17
7. SYSTEM MEMBERSHIP (continued)
PART B | STATE RETIREES AND SURVIVORS
Superannuation Ordinary Disability
Accidental Disability
Survivors Total
Number of Members 47,381 642 3,238 6,513 57,774
Average Age 72.1 65.1 63.7 75.3 71.9
Average Annual Benefit $32,406 $19,259 $38,151 $16,766 $30,819
Benefit by Retirement Type
Superannuation Ordinary Disability
Accidental Disability
Survivors Total
Annuity $283,898,107 $1,936,752 $9,186,012 $16,411,332 $311,432,203
Pension $1,251,551,857 $10,427,211 $114,347,357 $92,782,966 $1,469,109,391
Total $1,535,449,964 $12,363,963 $123,533,369 $109,194,298 $1,780,541,594

C O M M O N W E A L T H A C T U A R I A L V A L U A T I O N R E P O R T | J A N U A R Y 1 , 2 0 1 5 18
7. SYSTEM MEMBERSHIP (continued)
PART B | STATE RETIREES & SURVIVORS (continued)
Benefit by Age Distribution
Present Age Number of Members
Total Benefits Average Benefits
Less than 40 126 $3,164,237 $25,113
40 – 44 258 $8,158,379 $31,622
45 – 49 922 $31,893,091 $34,591
50 – 54 1,641 $54,183,306 $33,018
55 – 59 3,808 $116,470,519 $30,586
60 – 64 7,903 $276,105,256 $34,937
65 – 69 12,078 $426,405,957 $35,304
70 – 74 9,985 $329,964,845 $33,046
75 – 79 7,352 $218,490,491 $29,719
80 – 84 6,051 $158,540,642 $26,201
85 – 89 4,606 $103,501,180 $22,471
90+ 3,044 $53,663,691 $17,629
Totals 57,774 $1,780,541,594 $30,819

C O M M O N W E A L T H A C T U A R I A L V A L U A T I O N R E P O R T | J A N U A R Y 1 , 2 0 1 5 19
7. SYSTEM MEMBERSHIP (cont inued)
PART C | MASSACHUSETTS TEACHERS’ ACTIVE MEMBERS
A critical element of an actuarial valuation is accurate and up-to-date membership information. As part of this valuation, PERAC analyzed the member data provided by the TRS. We made several assumptions about missing, questionable, or unavailable data. Until the January 1, 2006 actuarial valuation, we had estimated the total creditable service for each member for the actuarial valuation. The estimate was based on either the employment date (date of hire as a teacher) or the adjusted employment date and was set equal to the greater of the two calculated service amounts. We used this methodology, which we believed was conservative, because we had no way to assess additional costs for members who buy back service near retirement. In 2006, we compared the service estimated for valuation purposes with actual service for over 6,800 members who retired in 2004 and 2005. We found that, in total, our methodology slightly understated service. To estimate this additional cost, we increased the plan liabilities as of January 1, 2006. We have continued using this methodology in each valuation. For members with a date of birth and/or date of hire that seemed questionable, we assumed (based on credited service or date of birth) the member was hired at age 30 (or at a younger age, if the member was under 30). Based on our experience with prior years’ data, buyback issues, and questions to TRS regarding specific members, we made several adjustments. Members whose pay was less than $5,000 were assumed to be inactive. For members with pay between $5,000 and $10,000, we used an estimated pay of $50,000. For members with submitted pay over $150,000, we compared this year’s figure to the pay used in last year’s valuation. We adjusted this year’s figure based on the amount contributed if we believed it was overstated. Determining valuation pay for members with reported pay less than $10,000 is difficult. Although we make the assumptions outlined above, we know there will always be a significant number of members that fall into this category for a variety of reasons including leaves of absence and part time employment. We believe our overall assumption is reasonable but know some members that we have deemed inactive are active members. To reflect this uncertainty, we made an additional increase to the calculated plan liabilities consistent with last year. We increased the normal cost by 2.0% and the active actuarial liability by 1.0% to reflect the service buyback and various data issues.
Pay for all members hired in 2014 was annualized.
Because we could not determine the number of vested terminations, we estimated a combined inactive (terminated vested plus terminated with an ASF balance) liability. This is the same methodology we have used in prior valuations.

C O M M O N W E A L T H A C T U A R I A L V A L U A T I O N R E P O R T | J A N U A R Y 1 , 2 0 1 5 20
7. SYSTEM MEMBERSHIP (cont inued)
PART C | MASSACHUSETTS TEACHERS’ ACTIVE MEMBERS (cont inued) Actives
Number of Members 90,070
Average Age 43.8
Average Service 12.9
Average Salary $68,883
Average Annuity Savings Fund Balance
$66,224
Age by Service Distribution of Active Members
Years of Service
Present Age
0 – 4 5 -9 10 - 14 15 - 19 20 – 24 25 - 29 30+ Total
0 - 24 2,102 2,102
25 - 29 8,227 1,698 2 9,927
30 - 34 4,139 6,799 1,766 6 12,710
35 - 39 1,967 3,191 5,732 1,307 15 12,212
40 - 44 1,497 1,783 3,352 4,871 1,003 31 12,537
45 - 49 1,354 1,798 2,257 2,923 2,494 686 27 11,539
50 - 54 889 1,564 2,132 1,910 1,271 2,101 614 10,481
55 - 59 497 929 1,790 1,977 1,204 1,470 2,276 10,143
60 - 64 209 454 975 1,261 920 903 2,050 6,772
65+ 45 119 203 278 196 196 610 1,647
Total 20,926 18,335 18,209 14,533 7,103 5,387 5,577 90,070

C O M M O N W E A L T H A C T U A R I A L V A L U A T I O N R E P O R T | J A N U A R Y 1 , 2 0 1 5 21
7. SYSTEM MEMBERSHIP (continued)
PART C | MASSACHUSETTS TEACHERS’ ACTIVE MEMBERS (continued)
Salary by Age Distribution of Active Members
Present Age
Number of Members
Total Salary
Average Salary
0 - 24 2,102 $90,310,470 $42,964
25 - 29 9,927 $493,228,592 $49,686
30 - 34 12,710 $760,447,663 $59,831
35 - 39 12,212 $843,014,493 $69,032
40 - 44 12,537 $916,969,103 $73,141
45 - 49 11,539 $849,835,717 $73,649
50 - 54 10,481 $787,701,122 $75,155
55 - 59 10,143 $790,126,422 $77,899
60 - 64 6,772 $537,888,872 $79,428
65+ 1,647 $134,751,935 $81,817
Total 90,070 $6,204,274,389 $68,883
C O M M O N W E A L T H A C T U A R I A L V A L U A T I O N R E P O R T | J A N U A R Y 1 , 2 0 1 5 22
7. SYSTEM MEMBERSHIP (continued)
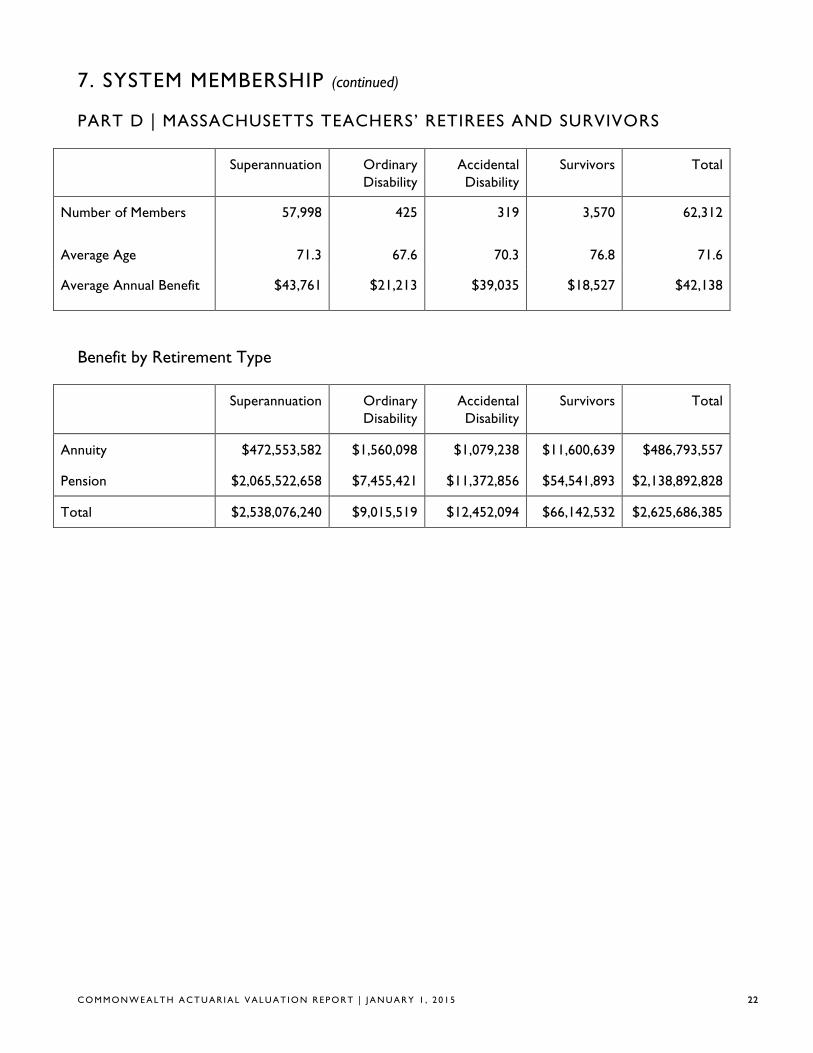
PART D | MASSACHUSETTS TEACHERS’ RETIREES AND SURVIVORS
Superannuation Ordinary Disability
Accidental Disability
Survivors Total
Number of Members 57,998 425 319 3,570 62,312
Average Age 71.3 67.6 70.3 76.8 71.6
Average Annual Benefit $43,761 $21,213 $39,035 $18,527 $42,138
Benefit by Retirement Type
Superannuation Ordinary Disability
Accidental Disability
Survivors Total
Annuity $472,553,582 $1,560,098 $1,079,238 $11,600,639 $486,793,557
Pension $2,065,522,658 $7,455,421 $11,372,856 $54,541,893 $2,138,892,828
Total $2,538,076,240 $9,015,519 $12,452,094 $66,142,532 $2,625,686,385

C O M M O N W E A L T H A C T U A R I A L V A L U A T I O N R E P O R T | J A N U A R Y 1 , 2 0 1 5 23
7. SYSTEM MEMBERSHIP (continued)
PART D | MASSACHUSETTS TEACHERS’ RETIREES & SURVIVORS (continued)
Benefit by Age Distribution
Present Age Number of Members
Total Benefits Average Benefits
Less than 40 27 $375,164 $13,895
40 – 44 38 $372,654 $9,807
45 – 49 75 $1,160,591 $15,475
50 – 54 179 $3,690,768 $20,619
55 – 59 1,850 $77,796,715 $42,052
60 – 64 11,429 $565,720,015 $49,499
65 – 69 18,869 $900,946,339 $47,747
70 – 74 12,045 $520,061,071 $43,177
75 – 79 6,975 $257,402,060 $36,904
80 – 84 5,350 $169,927,721 $31,762
85 – 89 3,262 $85,284,989 $26,145
90+ 2,213 $42,948,300 $19,407
Totals 62,312 $2,625,686,385 $42,138
C O M M O N W E A L T H A C T U A R I A L V A L U A T I O N R E P O R T | J A N U A R Y 1 , 2 0 1 5 24
7. SYSTEM MEMBERSHIP (cont inued)
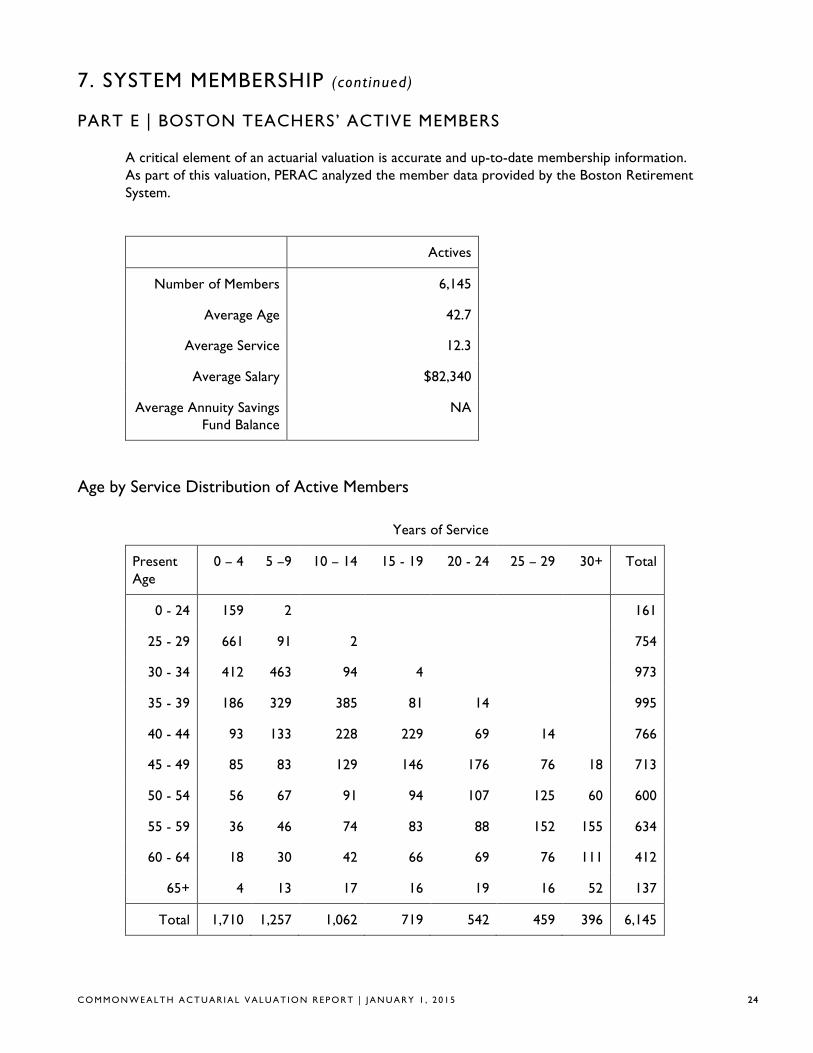
PART E | BOSTON TEACHERS’ ACTIVE MEMBERS
A critical element of an actuarial valuation is accurate and up-to-date membership information. As part of this valuation, PERAC analyzed the member data provided by the Boston Retirement System. Actives
Number of Members 6,145
Average Age 42.7
Average Service 12.3
Average Salary $82,340
Average Annuity Savings Fund Balance
NA
Age by Service Distribution of Active Members
Years of Service
Present Age
0 – 4 5 –9 10 – 14 15 - 19 20 - 24 25 – 29 30+ Total
0 - 24 159 2 161
25 - 29 661 91 2 754
30 - 34 412 463 94 4 973
35 - 39 186 329 385 81 14 995
40 - 44 93 133 228 229 69 14 766
45 - 49 85 83 129 146 176 76 18 713
50 - 54 56 67 91 94 107 125 60 600
55 - 59 36 46 74 83 88 152 155 634
60 - 64 18 30 42 66 69 76 111 412
65+ 4 13 17 16 19 16 52 137
Total 1,710 1,257 1,062 719 542 459 396 6,145

C O M M O N W E A L T H A C T U A R I A L V A L U A T I O N R E P O R T | J A N U A R Y 1 , 2 0 1 5 25
7. SYSTEM MEMBERSHIP (continued)
PART E | BOSTON TEACHERS’ ACTIVE MEMBERS (continued)
Salary by Age Distribution of Active Members
Present Age
Number of Members
Total Salary
Average Salary
0 - 24 161 $8,804,428 $54,686
25 - 29 754 $47,404,744 $62,871
30 - 34 973 $74,056,629 $76,112
35 - 39 995 $83,715,286 $84,136
40 - 44 766 $66,539,742 $86,867
45 - 49 713 $62,923,800 $88,252
50 - 54 600 $53,646,802 $89,411
55 - 59 634 $58,164,175 $91,742
60 - 64 412 $38,698,945 $93,929
65+ 137 $12,022,868 $87,758
Total 6,145 $505,977,420 $82,340

C O M M O N W E A L T H A C T U A R I A L V A L U A T I O N R E P O R T | J A N U A R Y 1 , 2 0 1 5 26
7. SYSTEM MEMBERSHIP (continued)
PART F | BOSTON TEACHERS’ RETIREES AND SURVIVORS
Superannuation Ordinary Disability
Accidental Disability
Survivors Total
Number of Members 4,084 45 70 289 4,488
Average Age 71.6 66.3 71.1 79.0 72.0
Average Annual Benefit $51,430 $23,443 $45,044 $21,349 $49,113
Benefit by Retirement Type
Superannuation Ordinary Disability
Accidental Disability
Survivors Total
Annuity $40,008,960 $211,680 $318,611 $1,090,697 $41,629,948
Pension $170,030,254 $843,243 $2,834,442 $5,079,052 $178,786,991
Total $210,039,214 $1,054,923 $3,153,053 $6,169,749 $220,416,939

C O M M O N W E A L T H A C T U A R I A L V A L U A T I O N R E P O R T | J A N U A R Y 1 , 2 0 1 5 27
7. SYSTEM MEMBERSHIP (continued)
PART F | BOSTON TEACHERS’ RETIREES & SURVIVORS (continued)
Benefit by Age Distribution
Present Age Number of Members
Total Benefits Average Benefits
Less than 40 0 $0 $0
40 - 44 1 $14,301 $14,301
45 - 49 2 $32,828 $16,414
50 - 54 20 $556,686 $27,834
55 - 59 139 $6,875,445 $49,464
60 - 64 751 $43,882,070 $58,432
65 - 69 1,343 $75,343,985 $56,101
70 - 74 909 $45,347,586 $49,887
75 - 79 491 $21,664,558 $44,123
80 - 84 352 $12,766,146 $36,267
85 - 89 293 $9,509,559 $32,456
90+ 187 $4,423,775 $23,657
Totals 4,488 $220,416,939 $49,113

C O M M O N W E A L T H A C T U A R I A L V A L U A T I O N R E P O R T | J A N U A R Y 1 , 2 0 1 5 28
8. VALUATION COST METHODS
PART A | ACTUARIAL COST METHOD
The Actuarial Cost Method which was used to determine pension liabilities in this valuation is known as the Entry Age Normal Cost Method. Under this method, the Normal Cost for each active member on the valuation date is determined as the level percent of salary, which, if paid annually from the date the employee first became a retirement system member, would fully fund by retirement, death, disability or termination, the projected benefits which the member is expected to receive. The Actuarial Liability for each member is determined as the present value as of the valuation date of all projected benefits which the member is expected to receive, minus the present value of future annual Normal Cost payments expected to be made to the fund. Since only active members have a Normal Cost, the Actuarial Liability for inactives, retirees, and survivors is simply equal to the present value of all projected benefits. The Unfunded Actuarial Liability is the Actuarial Liability less current assets.
The Normal Cost for a member will remain a level percent of salary for each year of membership, except for changes in provisions of the plan or the actuarial assumptions employed in projection of benefits and present value determinations. The Normal Cost for the entire system will also be changed by the addition of new members or the retirement, death, disability, or termination of members. The Actuarial Liability for a member will increase each year to reflect the additional accrual of Normal Cost. It will also change if the plan provisions or actuarial assumptions change.
Differences each year between the actual experience of the plan and the experience projected by the actuarial assumptions are reflected by adjustments to the Unfunded Actuarial Liability. An experience difference which increases the Unfunded Actuarial Liability is an Actuarial Loss and one which decreases the Unfunded Actuarial Liability is called an Actuarial Gain.
PART B | ASSET VALUATION METHOD In valuations prior to 1998, plan assets were determined at market value. As part of the 1998 valuation this methodology was adjusted so that investment gains and losses for a given year would not be fully recognized until five years have passed. This calculation recognizes 20% of the gain or loss occurring in the prior year, 40% of those gains or losses occurring two years ago, etc., so that 100% of the gain or loss occurring 5 or more years ago is recognized. This approach reduces the potential volatility in the market value approach from year to year. Under our corridor approach, the actuarial value of assets cannot be less than 90% nor greater than 100% of market value. The actuarial value of assets as of January 1, 2015 is 95.7% of the market value.

C O M M O N W E A L T H A C T U A R I A L V A L U A T I O N R E P O R T | J A N U A R Y 1 , 2 0 1 5 29
9. ACTUARIAL ASSUMPTIONS Investment Return 7.75% per year net of investment expenses (prior assumption 8.0%) The investment return assumption is a long term assumption and is based on capital market expectations by asset class, historical returns, and professional judgment. We considered analysis prepared by PRIM’s investment advisor using a building block approach which included expected returns by asset class, risk analysis, and the determination of a 30 year expected target rate of return.
Interest Rate Credited to the Annuity Savings Fund 3.5% per year
Assumed Rate of Cost of Living Increases (COLA) 3.0% per year (on the first $13,000 of an allowance)
Mortality State: Pre-retirement mortality reflects RP-2000 Employees table projected generationally with Scale BB and a base year of 2009 (gender distinct). (Prior assumption – RP-2000 Employees table projected 22 years with Scale AA.) Teachers: Pre-retirement mortality reflects RP-2014 Employees table projected generationally with Scale BB and a base year of 2014 (gender distinct). (Prior assumption – RP-2000 Employees table adjusted for “white-collar” employment projected 22 years with Scale AA.) State: Post-retirement mortality reflects RP-2000 Healthy Annuitant table projected generationally with Scale BB and a base year of 2009 (gender distinct). (Prior assumption – RP-2000 Healthy Annuitant table projected 17 years with Scale AA.) Teachers: Post-retirement mortality reflects RP-2014 Healthy Annuitant table projected generationally with Scale BB and a base year of 2014 (gender distinct). (Prior assumption – RP-2000 Healthy Annuitant table adjusted for large annuity amounts and projected 17 years with Scale AA.) State: For disabled members, the mortality rate is assumed to be in accordance with the RP-2000 Healthy Annuitant Table projected generationally with Scale BB and a base year of 2015 (gender distinct). (Prior assumption – RP-2000 Healthy Annuitant table projected 7 years with Scale AA set forward 3 years for males.) Teachers: For disabled members, the mortality rate is assumed to be in accordance with the RP-2014 Healthy Annuitant Table projected generationally with Scale BB and a base year of 2014 set forward 4 years. (Prior assumption – RP-2000 Healthy Annuitant table adjusted for large annuity amounts and projected 7 years with Scale AA set forward 3 years for males.) It is assumed that 55% of pre-retirement deaths are job-related for Group 1 and 2 members and 90% are job-related for Group 4 members. For members retired under an Accidental Disability, 40% of deaths are assumed to be from the same cause as the disability.

C O M M O N W E A L T H A C T U A R I A L V A L U A T I O N R E P O R T | J A N U A R Y 1 , 2 0 1 5 30
9. ACTUARIAL ASSUMPTIONS (cont inued)
Salary Increase Based on an analysis of past experience. Annual rates are shown below. Increases for State employees are 3.5% for 2013, 3.75% for 2014 and 4.0% for 2015. Increases after 2015 are based on service as shown below. For Teachers, increases are based on service as shown below.
Service Groups 1& 2 Group 3 Group 4 Service Teachers 0 7.00% 7.00% 9.00% 0 7.50% 1 6.50% 7.00% 8.00% 1 7.10% 2 6.00% 7.00% 7.50% 2 7.00% 3 5.50% 7.00% 7.00% 3 6.90% 4 5.50% 6.75% 6.75% 4 6.80% 5 5.25% 6.25% 6.25% 5 6.70% 6 5.00% 5.25% 5.75% 6 6.60% 7 4.75% 4.75% 5.25% 7 6.50% 8-12 4.75% 4.75% 4.75% 8 6.30% 13-15 4.50% 4.75% 4.75% 9 6.10% 16-19 4.25% 4.75% 4.75% 10 5.90% 20+ 4.00% 4.50% 4.50% 11 5.70% 12 5.20% 13 4.70% 14 4.35% 15-16 4.20% 17-19 4.10% 20+ 4.00%
The salary increase assumption reflects both prior experience (2014 study) and professional judgment. The assumption for 2013 to 2015 was modified to reflect current conditions.

C O M M O N W E A L T H A C T U A R I A L V A L U A T I O N R E P O R T | J A N U A R Y 1 , 2 0 1 5 31
9. ACTUARIAL ASSUMPTIONS (cont inued) Retirement
Group 1
Group 2
Group 3
Group 4
Age Male Female
45 0.000 0.000 0.000 0.020 0.060 46 0.000 0.000 0.000 0.020 0.060 47 0.000 0.000 0.000 0.050 0.060 48 0.000 0.000 0.000 0.050 0.060 49 0.000 0.000 0.000 0.050 0.060 50 0.030 0.030 0.020 0.050 0.060 51 0.030 0.030 0.020 0.060 0.060 52 0.030 0.030 0.020 0.070 0.060 53 0.030 0.030 0.030 0.080 0.075 54 0.030 0.035 0.040 0.090 0.150 55 0.035 0.050 0.075 0.100 0.250 56 0.035 0.050 0.075 0.100 0.150 57 0.040 0.055 0.080 0.110 0.150 58 0.050 0.060 0.100 0.110 0.150 59 0.060 0.065 0.120 0.120 0.150 60 0.090 0.075 0.150 0.140 0.200 61 0.110 0.100 0.150 0.150 0.200 62 0.150 0.150 0.150 0.150 0.200 63 0.150 0.150 0.150 0.150 0.200 64 0.160 0.150 0.200 0.250 0.300 65 0.200 0.200 0.200 0.250 0.500 66 0.200 0.200 0.200 0.250 0.250 67 0.200 0.200 0.200 0.250 0.250 68 0.200 0.200 0.200 0.250 0.250 69 0.200 0.200 0.200 0.250 0.250 70 1.000 1.000 1.000 1.000 1.000

C O M M O N W E A L T H A C T U A R I A L V A L U A T I O N R E P O R T | J A N U A R Y 1 , 2 0 1 5 32
9. ACTUARIAL ASSUMPTIONS (cont inued) Teachers Males
Not in Retirement Plus Retirement Plus Less than 20 20+ Less than 20 20-30 30+
47 0.000 0.000 47 0.00 0.000 0.00 48 0.000 0.000 48 0.00 0.000 0.00 49 0.000 0.000 49 0.00 0.000 0.00 50 0.000 0.020 50 0.00 0.010 0.02 51 0.000 0.020 51 0.00 0.010 0.02 52 0.000 0.020 52 0.00 0.010 0.02 53 0.000 0.020 53 0.00 0.015 0.02 54 0.000 0.030 54 0.00 0.025 0.02 55 0.035 0.030 55 0.05 0.030 0.06 56 0.035 0.035 56 0.05 0.060 0.20 57 0.050 0.040 57 0.05 0.100 0.40 58 0.055 0.050 58 0.05 0.150 0.50 59 0.060 0.060 59 0.10 0.200 0.50 60 0.075 0.150 60 0.10 0.250 0.40 61 0.120 0.250 61 0.20 0.300 0.40 62 0.140 0.300 62 0.20 0.350 0.35 63 0.140 0.300 63 0.25 0.400 0.35 64 0.140 0.300 64 0.25 0.400 0.35 65 0.300 0.300 65 0.25 0.400 0.35 66 0.300 0.250 66 0.30 0.300 0.40 67 0.300 0.250 67 0.30 0.300 0.40 68 0.300 0.250 68 0.30 0.300 0.40 69 0.300 0.250 69 0.30 0.300 0.40
70+ 1.000 1.000 70+ 1.00 1.000 1.00

C O M M O N W E A L T H A C T U A R I A L V A L U A T I O N R E P O R T | J A N U A R Y 1 , 2 0 1 5 33
9. ACTUARIAL ASSUMPTIONS (cont inued) Teachers Females
Not in Retirement Plus Retirement Plus Less than 20 20+ Less than 20 20-30 30+
47 0.000 0.000 47 0.00 0.00 0.000 48 0.000 0.000 48 0.00 0.00 0.000 49 0.000 0.000 49 0.00 0.00 0.000 50 0.000 0.010 50 0.00 0.01 0.015 51 0.000 0.010 51 0.00 0.01 0.015 52 0.000 0.015 52 0.00 0.01 0.015 53 0.000 0.020 53 0.00 0.01 0.015 54 0.000 0.020 54 0.00 0.01 0.020 55 0.035 0.040 55 0.03 0.03 0.050 56 0.035 0.040 56 0.03 0.05 0.150 57 0.035 0.040 57 0.04 0.08 0.350 58 0.050 0.060 58 0.08 0.10 0.350 59 0.065 0.080 59 0.08 0.15 0.350 60 0.085 0.150 60 0.10 0.20 0.350 61 0.100 0.200 61 0.12 0.25 0.350 62 0.120 0.200 62 0.12 0.30 0.350 63 0.120 0.250 63 0.15 0.30 0.350 64 0.200 0.300 64 0.20 0.30 0.350 65 0.300 0.400 65 0.25 0.40 0.350 66 0.300 0.300 66 0.25 0.30 0.350 67 0.300 0.300 67 0.30 0.30 0.300 68 0.300 0.300 68 0.30 0.30 0.300 69 0.300 0.300 69 0.30 0.30 0.300
70+ 1.000 1.000 70+ 1.00 1.00 1.000

C O M M O N W E A L T H A C T U A R I A L V A L U A T I O N R E P O R T | J A N U A R Y 1 , 2 0 1 5 34
9. ACTUARIAL ASSUMPTIONS (continued)
Disability Based on an analysis of past experience. Sample annual rates are shown below. Age Group 1 Group 2 Group 3 Group 4 20 0.00010 0.00052 0.0010 0.0020 30 0.00010 0.00072 0.0016 0.0021 40 0.00068 0.00210 0.0036 0.0071 50 0.00133 0.00420 0.0094 0.0110 60 0.00120 0.00500 0.0430 0.0080 It is also assumed that 75% of disabilities will be job-related for Group 1 and 2 members (other than Teachers), and 95% will be job-related for Group 3 and 4 members, and 35% will be job-related for Teachers. Disability rates are based on our most recent experience analysis (2014) which reviewed age, gender and job group. Final assumptions reflect this analysis as well as professional judgment.
Withdrawal Based on an analysis of past experience. For Groups 1 and 2, rates are both age and service based for service up to 10 years. After 10 years of service, rates are age based. In addition to being age and service based, Teacher rates are also gender based. For Groups 3 and 4, rates are service based. Sample annual rates are shown below. Groups 1 & 2
Age Service 0 5 10+
20 0.270 0.000 0.000 30 0.230 0.100 0.045 40 0.160 0.080 0.030 50 0.180 0.060 0.030
Groups 3 & 4
Service Group 3 Group 4 0 0.007 0.090 5 0.007 0.060 10 0.005 0.035 15 0.005 0.020
20+ 0.005 0.015

C O M M O N W E A L T H A C T U A R I A L V A L U A T I O N R E P O R T | J A N U A R Y 1 , 2 0 1 5 35
9. ACTUARIAL ASSUMPTIONS (continued) Teachers
Age Service 0 5 10+
Male Female Male Female Male Female 20 0.130 0.100 0.055 0.070 0.015 0.050 30 0.150 0.150 0.054 0.088 0.015 0.045 40 0.133 0.105 0.052 0.050 0.017 0.022 50 0.162 0.098 0.070 0.050 0.023 0.020
Members Hired on or After April 2, 2012 Chapter 176 of the Acts of 2011 changed the retirement eligibility for the different job groups. For example, Group 1 eligibility changed from 55 years old with 10 years of service to 60 years old with 10 years of service (Chapter 176 removed the provision that allowed retirement at any age with 20 years of service). Our software system is programmed such that at any given age, a member is assumed to either retire or terminate, but not both. Therefore, we adjusted the retirement and termination rates for members impacted by Chapter 176. For example, for Group 1 members, we removed retirement rates for ages 50-59. Termination rates remain in effect for those years. We will monitor these assumptions going forward. Family Composition It is assumed that 80% of plan participants are married and that the male spouse in 3 years older than the female spouse. Loading and Administrative Expenses State We increased the normal cost by 1% and the actuarial accrued liability of active members by approximately $100 million to account for certain Chapter 32 benefits that cannot be readily valued with our software system. Such benefits include, but are not limited to, benefits provided under Sections 10, 28M, 28N, 65D, and 100. In addition, an amount of $16 million has been included in the normal cost to reflect a portion of administrative and other expenses paid by the fund and net Section 3(8)(c) cash flow. Teachers We increased the total normal cost by 2% and the actuarial accrued liability of active members by 1% to account for buybacks at retirement and various data issues including the status of members with reported pay of less than $10,000. In addition, an amount of $15 million has been included in the normal cost to reflect a portion of administrative and other expenses paid by the fund and net Section 3(8)(c) cash flow.

C O M M O N W E A L T H A C T U A R I A L V A L U A T I O N R E P O R T | J A N U A R Y 1 , 2 0 1 5 36
9. ACTUARIAL ASSUMPTIONS (continued) Boston Teachers We increased the total normal cost by 2% and the actuarial accrued liability of active members by 1%. In addition, an amount of $4 million has been included in the normal cost to reflect a portion of administrative and other expenses paid by the fund.

C O M M O N W E A L T H A C T U A R I A L V A L U A T I O N R E P O R T | J A N U A R Y 1 , 2 0 1 5 37
10. SUMMARY OF PLAN PROVISIONS
ADMINISTRATION There are 105 contributory retirement systems for public employees in Massachusetts. Each system is governed by a retirement board and all boards, although operating independently, are governed by Chapter 32 of the Massachusetts General Laws. This law in general provides uniform benefits, uniform contribution requirements and a uniform accounting and funds structure for all systems.
PARTICIPATION Participation is mandatory for all full-time employees. Eligibility with respect to part-time, provisional, temporary, seasonal or intermittent employment is governed by regulations promulgated by the retirement board, and approved by PERAC. Membership is optional for certain elected officials. There are 4 classes of membership in the retirement system:
Group 1: General employees, including clerical, administrative, technical and all other employees not otherwise classified.
Group 2: Certain specified hazardous duty positions. Group 3: Officers and inspectors of the Department of State Police.
Group 4: Police Officers, firefighters, corrections officers, and other specified hazardous positions.
MEMBER CONTRIBUTIONS Member contributions vary depending on the most recent date of membership:
Date of Membership Contribution Rate Prior to 1975: 5% of regular compensation 1975 - 1983: 7% of regular compensation 1984 to 6/30/96: 8% of regular compensation 7/1/96 to present: 9% of regular compensation 7/1/96 to present: 12% of regular compensation (State Police) 7/1/01 to present: 11% of regular compensation (for teachers hired after 7/1/01 and those
accepting provisions of Chapter 114 of the Acts of 2000) 1979 to present: an additional 2% of regular compensation in excess of $30,000. In addition, members of Group 1 who join the system on or after April 2, 2012 will have their withholding rate reduced to 6% after achieving 30 years of creditable service.

C O M M O N W E A L T H A C T U A R I A L V A L U A T I O N R E P O R T | J A N U A R Y 1 , 2 0 1 5 38
10. SUMMARY OF PLAN PROVISIONS (cont inued)
RATE OF INTEREST Interest on regular deductions made after January 1, 1984 is at a rate established by PERAC in consultation with the Commissioner of Banks. The rate is obtained from the average rates paid on individual savings accounts by a representative sample of at least 10 financial institutions.
RETIREMENT AGE The mandatory retirement age for some Group 2 and Group 4 employees is age 65. Most Group 2 and Group 4 members may remain in service after reaching age 65. Group 2 and Group 4 members who are employed in certain public safety positions are required to retire at age 65. There is no mandatory retirement age for employees in Group 1.
SUPERANNUATION RETIREMENT
A person who became a member before April 2, 2012 is eligible for a superannuation retirement allowance (service retirement) upon meeting the following conditions:
• completion of 20 years of service, or • attainment of age 55 if hired prior to 1978, or if classified in Group 4, or • attainment of age 55 with 10 years of service, if hired after 1978, and if classified in Group 1 or 2
A person who became a member on or after April 2, 2012 is eligible for a superannuation retirement allowance (service retirement) upon meeting the following conditions:
• attainment of age 60 with 10 years of service if classified in Group 1, or • attainment of age 55 with 10 years of service if classified in Group 2, or • attainment of age 55 if hired prior to 1978, or if classified in Group 4.
AMOUNT OF BENEFIT
A member’s annual allowance is determined by multiplying average salary by a benefit rate related to the member’s age and job classification at retirement, and the resulting product by his or her creditable service. The amount determined by the benefit formula cannot exceed 80% of the member’s highest three-year (or five-year salary as discussed below) average salary. For veterans as defined in G.L. c. 32, s. 1, there is an additional benefit of $15 per year for each year of creditable service, up to a maximum of $300.

C O M M O N W E A L T H A C T U A R I A L V A L U A T I O N R E P O R T | J A N U A R Y 1 , 2 0 1 5 39
10. SUMMARY OF PLAN PROVISIONS (cont inued) • Salary is defined as gross regular compensation. For employees who become members after January 1, 2011, regular compensation is limited to 64% of the federal limit found in 26 U.S.C. 401(a)(17). In addition, regular compensation for members who retire after April 2, 2012 will be limited to prohibit “spiking” of a member’s salary to increase the retirement benefit. • For persons who became members prior to April 2, 2012, average salary is the average annual rate of regular compensation received during the three consecutive years that produce the highest average, or, if greater, during the last three years (whether or not consecutive) preceding retirement. • For persons who became members on or after April 2, 2012, average salary is the average annual rate of regular compensation received during the 5 consecutive years that produce the highest average, or, if greater, during the last 5 years (whether or not consecutive) preceding retirement. • The benefit rate varies with the member’s retirement age. For persons who became members prior to April 2, 2012 the highest rate of 2.5% applies to Group 1 employees who retire at or after age 65, Group 2 employees who retire at or after age 60, and Group 4 employees who retire at or after age 55. A .1% reduction is applied for each year of age under the maximum age for the member’s group. For Group 2 employees who terminate from service under age 55, the benefit rate for a Group 1 employee shall be used. • For persons who became members on or after April 2, 2012 and retire with less than 30 years of creditable service, the highest rate of 2.5% applies to Group 1 employees who retire at or after age 67, Group 2 employees who retire at or after age 62, and to Group 4 employees who retire at or after age 57. A .15% reduction is applied for each year of age under the maximum age for the member’s group. • For persons who became members on or after April 2, 2012 and retire with more than 30 years of creditable service, the highest rate of 2.5% applies to Group 1 employees who retire at or after age 67, Group 2 employees who retire at or after age 62, and Group 4 employees who retire at or after age 55. A .125% reduction is applied for each year of age under the maximum age for the member’s group.
• For a teacher who is subject to the provisions of Chapter 114 of the Acts of 2000 and who has completed at least 30 years of creditable service, the benefit rate is multiplied by the creditable service and the resulting percentage is increased by 2% per year for each year of service in excess of 24. The amount determined cannot exceed 80% of the average salary.
The allowance of state police officers is calculated using a slightly different formula. Information regarding this formula can be obtained directly from the State Retirement Board.

C O M M O N W E A L T H A C T U A R I A L V A L U A T I O N R E P O R T | J A N U A R Y 1 , 2 0 1 5 40
10. SUMMARY OF PLAN PROVISIONS (cont inued) DEFERRED VESTED BENEFIT
A participant who has attained the requisite years of creditable service can elect to defer his or her retirement until a later date. Group 4 employees cannot defer beyond age 65. All participants must begin to receive a retirement allowance or withdraw their accumulated deductions no later than April 15 of the calendar year following the year they reach age 70½.
WITHDRAWAL OF CONTRIBUTIONS
Member contributions may be withdrawn upon termination of employment. The interest rate for employees who first become members on or after January 1, 1984 who voluntarily withdraw their contributions with less than 10 years of service will be 3%. Interest payable on all other withdrawals will be set at regular interest.
DISABILITY RETIREMENT The Massachusetts Retirement Plan provides two types of disability retirement benefits:
ORDINARY DISABILITY Eligibility: Non-veterans who become totally and permanently disabled by reason of a non-job related condition with at least ten years of creditable service. Veterans with ten years of creditable service who become totally and permanently disabled by reason of a non-job related condition prior to reaching “maximum age”. “Maximum age” applies only to employees classified in Group 4 who are subject to mandatory retirement. Retirement Allowance: For persons who became members prior to April 2, 2012, the benefit is equal to the accrued superannuation retirement benefit as if the member was age 55. If the member is a veteran, the benefit is 50% of the member’s final rate of salary during the preceding 12 months, plus an annuity based upon accumulated member contributions plus credited interest. If the member is over age 55, he or she will receive not less than the superannuation allowance to which he or she is entitled. For persons in Group 1 who became members on or after April 2, 2012, the benefit is equal to the accrued superannuation retirement benefit as if the member was age 60. If the member is a veteran, the benefit is 50% of the member’s final rate of salary during the preceding 12 months, plus an annuity based upon accumulated member contributions plus credited interest. If the member is over age 60, he or she will receive not less than the superannuation allowance to which he or she would have been entitled had they retired for superannuation. For persons in Group 2 and Group 4 who became members on or after April 2, 2012, the benefit is equal to the accrued superannuation retirement benefit as if the member was age 55. If the member is a veteran, the benefit is 50% of the member’s final rate of salary during the preceding 12 months, plus an annuity based upon accumulated member contributions plus credited interest. If the member is over age 55, he or she will receive not less than the superannuation allowance to which he or she is entitled.

C O M M O N W E A L T H A C T U A R I A L V A L U A T I O N R E P O R T | J A N U A R Y 1 , 2 0 1 5 41
10. SUMMARY OF PLAN PROVISIONS (continued)
ACCIDENTAL DISABILITY Eligibility: Applies to members who become permanently incapacitated from the essential duties of the position as a result of a personal injury sustained or hazard undergone while in the performance of duties. There are no minimum age or service requirements. Retirement Allowance: 72% of salary plus an annuity based on accumulated member contributions, with interest. This amount is not to exceed 100% of pay. However, for those who became members in service after January 1, 1988 or who have not been members in service continually since that date, the amount is limited to 75% of pay. There is an additional pension of $821.52 per year, per child who is under 18 at the time of the member’s retirement, with no age limitation if the child is mentally or physically incapacitated from earning. The additional pension may continue up to age 22 for any child who is a full time student at an accredited educational institution. Veterans, as defined in G.L. c. 32, s. 1, receive an additional benefit of $15 per year for each year of creditable service, up to a maximum of $300.
ACCIDENTAL DEATH Eligibility: Applies to members who die as a result of a work-related injury or if the member was retired for accidental disability and the death was the natural and proximate result of the injury or hazard undergone on account of which such member was retired. Allowance: An immediate payment to a named beneficiary equal to the accumulated deductions at the time of death, plus a pension equal to 72% of current salary and payable to the surviving spouse, dependent children or the dependent parent, plus a supplement of $821.52 per year, per child, payable to the spouse or legal guardian until all dependent children reach age 18 or 22 if a full time student, unless mentally or physically incapacitated. The surviving spouse of a member of a police or fire department or any corrections officer who, under specific and limited circumstances detailed in the statute, suffers an accident and is killed or sustains injuries resulting in his death, may receive a pension equal to the maximum salary for the position held by the member upon his death. In addition, an eligible family member of a firefighter, public prosecutor, police officer or corrections officer killed in the line of duty may receive a one-time payment of $150,000 from the State Retirement Board.

C O M M O N W E A L T H A C T U A R I A L V A L U A T I O N R E P O R T | J A N U A R Y 1 , 2 0 1 5 42
10. SUMMARY OF PLAN PROVISIONS (continued)
DEATH AFTER ACCIDENTAL DISABILITY RETIREMENT Effective November 7, 1996, Accidental Disability retirees were allowed to select Option C at retirement and provide a benefit for an eligible survivor. For Accidental Disability retirees prior to November 7, 1996, who could not select Option C, if the member’s death is from a cause unrelated to the condition for which the member received accidental disability benefits, a surviving spouse will receive an annual allowance of $12,000.
DEATH IN ACTIVE SERVICE Allowance: An immediate allowance equal to that which would have been payable had the member retired and selected Option C on the day before his or her death. For a member who became a member prior to April 2, 2012 whose death occurred prior to the member’s superannuation retirement age, the age 55 benefit rate is used. For a member classified in Group 1 who became a member on or after April 2, 2012 whose death occurred prior to the member’s superannuation retirement age, the age 60 benefit rate is used. If the member died after age 60, the actual age is used. The minimum annual allowance payable to the surviving spouse of a member-in-service who dies with at least two years of creditable service is $9,000, provided that the member and the spouse were married for at least one year and living together on the member’s date of death. The surviving spouse of such a member-in-service receives an additional allowance equal to the sum of $1,440 per year for the first child and $1,080 per year for each additional child until all dependent children reach age 18 or 22 if a full-time student, unless mentally or physically incapacitated.
COST OF LIVING A cost of living adjustment (COLA) is determined based upon the increase in the Consumer Price Index (CPI) used for indexing Social Security benefits, but cannot exceed 3.0% on the first $13,000 of a retiree’s benefit.
C O M M O N W E A L T H A C T U A R I A L V A L U A T I O N R E P O R T | J A N U A R Y 1 , 2 0 1 5 43
10. SUMMARY OF PLAN PROVISIONS (continued)
METHODS OF PAYMENT A member may elect to receive his or her retirement allowance in one of 3 forms of payment. Option A: Total annual allowance, payable in monthly installments, commencing at retirement and terminating at the member’s death. Option B: A reduced annual allowance, payable in monthly installments, commencing at retirement and terminating at the death of the member, provided, however, that if the total amount of the annuity portion received by the member is less than the amount of his or her accumulated deductions, including interest, the difference or balance of his accumulated deductions will be paid in a lump sum to the retiree’s beneficiary or beneficiaries of choice. Option C: A reduced annual allowance, payable in monthly installments, commencing at retirement. At the death of the retired employee, 2/3 of the allowance is payable to the member’s designated beneficiary (who may be the spouse, or former spouse who remains unmarried for a member whose retirement becomes effective on or after February 2, 1992, child, parent, sister, or brother of the employee) for the life of the beneficiary. For members who retired on or after January 12, 1988, if the beneficiary predeceases the retiree, the benefit payable increases (or “pops up”) based on the factor used to determine the Option C benefit at retirement. For members who retired prior to January 12, 1988, if the System has accepted Section 288 of Chapter 194 of the Acts of 1998 and the beneficiary predeceases the retiree, the benefit payable “pops up” in the same fashion. The Option C became available to accidental disability retirees on November 7, 1996.
ALLOCATION OF PENSION COSTS If a member’s total creditable service was partly earned by employment in more than one retirement system, the cost of the "pension portion" is allocated between the different systems pro rata based on the member’s service within each retirement system. If a member received regular compensation concurrently from two or more systems on or after January 1, 2010, and was not vested in both systems as of January 1, 2010, such a pro-ration will not be undertaken. This is because such a person will receive a separate retirement allowance from each system.

C O M M O N W E A L T H A C T U A R I A L V A L U A T I O N R E P O R T | J A N U A R Y 1 , 2 0 1 5 44
11. GLOSSARY OF TERMS
ACTUARIAL ACCRUED LIABILITY That portion of the Actuarial Present Value of pension plan benefits which is not provided by future Normal Costs or employee contributions. It is the portion of the Actuarial Present Value attributable to service rendered as of the Valuation Date.
ACTUARIAL ASSUMPTIONS Assumptions, based upon past experience or standard tables, used to predict the occurrence of future events affecting the amount and duration of pension benefits, such as: mortality, withdrawal, disablement and retirement; changes in compensation; rates of investment earnings and asset appreciation or depreciation; and any other relevant items.
ACTUARIAL COST METHOD (OR FUNDING METHOD) A procedure for allocating the Actuarial Present Value of all past and future pension plan benefits to the Normal Cost and the Actuarial Accrued Liability.
ACTUARIAL GAIN OR LOSS (OR EXPERIENCE GAIN OR LOSS) A measure of the difference between actual experience and that expected based upon the set of Actuarial Assumptions, during the period between two Actuarial Valuation dates. Note: The effect on the Accrued Liability and/or the Normal Cost resulting from changes in the Actuarial Assumptions, the Actuarial Cost Method or pension plan provisions would be described as such, rather than an Actuarial Gain (Loss).
ACTUARIAL PRESENT VALUE The dollar value on the valuation date of all benefits expected to be paid to current members based upon the Actuarial Assumptions and the terms of the Plan.
AMORTIZATION PAYMENT That portion of the pension plan appropriation which represents payments made to pay interest on and reduce the Unfunded Accrued Liability.
C O M M O N W E A L T H A C T U A R I A L V A L U A T I O N R E P O R T | J A N U A R Y 1 , 2 0 1 5 45
11 . GLOSSARY OF TERMS (continued)
ANNUAL STATEMENT The statement submitted to PERAC each year that describes the asset holdings and Fund balances as of December 3l as well as the transactions during the calendar year that affected the financial condition of the retirement system.
ANNUITY RESERVE FUND The fund into which total accumulated deductions, including interest, are transferred at the time a member retires, and from which annuity payments are made.
ANNUITY SAVINGS FUND The fund in which employee contributions plus interest credited are held for active and inactive members.
ASSETS The value of securities held by the plan.
COST OF BENEFITS The estimated payment from the pension system for benefits for the fiscal year.
FUNDING SCHEDULE The schedule, based upon the most recently approved actuarial valuation, which sets forth the amount which would be appropriated to the pension system in accordance with Section 22C of M.G.L. Chapter 32.
GASB Governmental Accounting Standards Board

C O M M O N W E A L T H A C T U A R I A L V A L U A T I O N R E P O R T | J A N U A R Y 1 , 2 0 1 5 46
11. GLOSSARY OF TERMS (continued)
NORMAL COST Total Normal Cost is that portion of the Actuarial Present Value of pension plan benefits, which is to be paid in a single fiscal year. The Employee Normal Cost is the amount of the expected employee contributions for the fiscal year. The Employer Normal Cost is the difference between the Total Normal Cost and the Employee Normal Cost.
PENSION FUND The fund into which appropriation amounts, as determined by PERAC are paid and from which pension benefits are paid.
PENSION RESERVE FUND The fund that shall be credited with all amounts set aside by a system for the purpose of establishing a reserve to meet future pension liabilities. These amounts would include excess interest earnings.
SPECIAL FUND FOR MILITARY SERVICE CREDIT The fund which is credited with an amount paid by the retirement board equal to the amount which would have been contributed by a member during a military leave of absence as if the member had remained in active service of the retirement board. In the event of retirement or a non-job related death, such amount is transferred to the Annuity Reserve Fund. In the event of termination prior to retirement or death, such amount shall be transferred to the Pension Fund.
UNFUNDED ACCRUED LIABILITY The excess of the Actuarial Accrued Liability over the Assets.


PUBLIC EMPLOYEE RETIREMENT ADMINISTRATION COMMISSIONFive Middlesex Avenue | Suite 304 | Somerville, MA 02145Ph: 617.666.4446 | Fax: 617.628.4002TTY: 617.591.8917 | Web: www.mass.gov/perac