Embed Size (px)
Citation preview
Commonwealth Transportation Board Aubrey L. Layne, Jr. 1401 East Broad Street (804) 786-2701
Chairman Richmond, Virginia 23219 Fax: (804) 786-2940
COMMONWEALTH TRANSPORTATION BOARD
WORKSHOP AGENDA
Hyatt Regency Reston
Reston ABC
1800 Presidents Street
Reston, Virginia 20190
September 19, 2017
9:00 a.m.
1. DC2RVA Hanover/Hanover Area Community Advisory Committee Update
Emily Stock, Virginia Department of Rail and Public Transportation
Barbara Nelson, Richmond Regional TPO & CAC Member
2. Smart Scale Update
Nick Donohue, Deputy Secretary of Transportation
3. FY 2017 Budget / Actual Performance
FY 2018 Year-to-Date
August Revenue Update – CTF and Regional Revenue Expectations
John Lawson, Virginia Department of Transportation
4. PPTA Implementation Manual & Guidelines - 2017 Updates
Morteza Farajian, Virginia Department of Transportation
5. I-64 Express Lanes proposed Toll Supported Transit Services
Jennifer DeBruhl, Virginia Department of Rail and Public Transportation
6. Update on Vanpool/VA Implementation
Jennifer DeBruhl, Virginia Department of Rail and Public Transportation
7. Rail Industrial Access Program Application Briefing
Steel Dynamics Roanoke Bar Division
Jeremy Latimer, Virginia Department of Rail and Public Transportation
8. VDOT Roadway Lighting - Energy Performance Contract
Quintin Elliott, Virginia Department of Transportation
Agenda
Meeting of the Commonwealth Transportation Board
Workshop Session
September 19, 2017
Page 2
9. Commissioner’s Items
Charles Kilpatrick, Virginia Department of Transportation
10. Director’s Items
Jennifer Mitchell, Virginia Department of Rail & Public Transportation
11. Secretary’s Items
Aubrey Layne, Secretary of Transportation
# # #
DC2RVA Ashland/Hanover Area Community Advisory Committee Update September 19, 2017
Emily Stock Manager of Rail
Planning
Barbara Nelson Richmond Regional
Transportation Planning
Organization & CAC Member
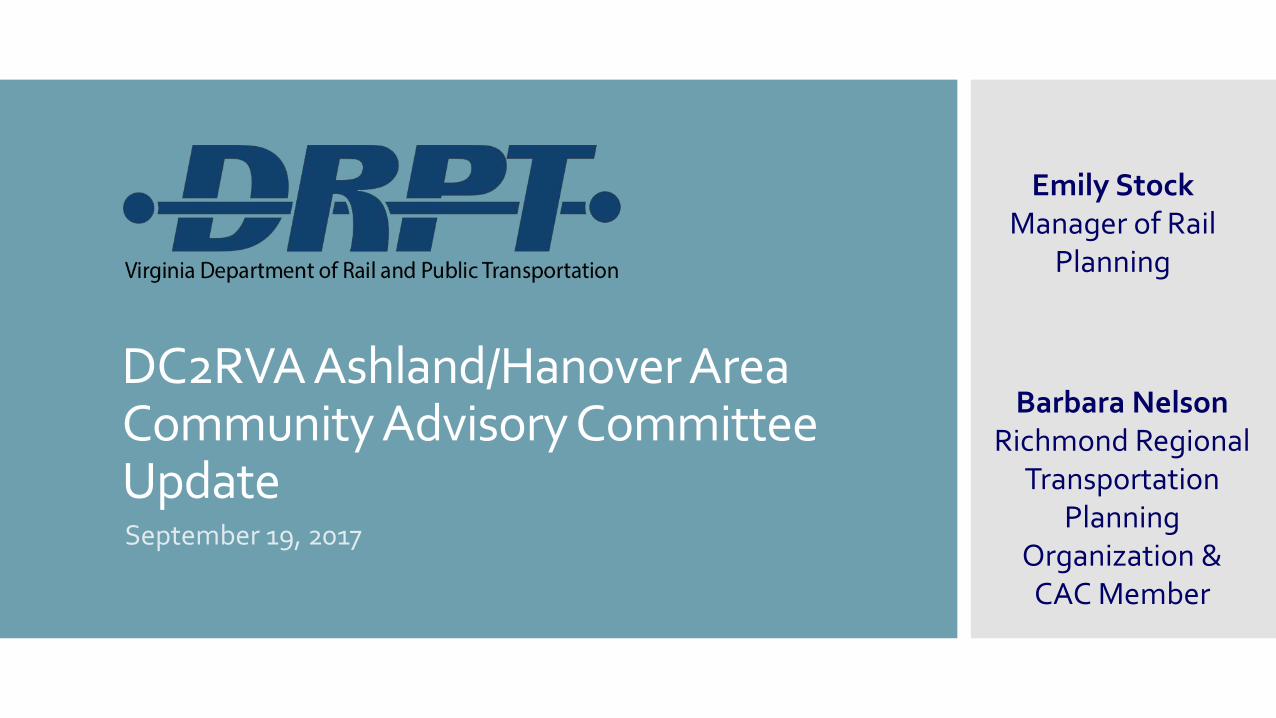
CAC Membership
Town of Ashland CSX Transportation Hanover County Randolph-Macon College Richmond Regional
Transportation Planning Organization
CAC member organizations include:
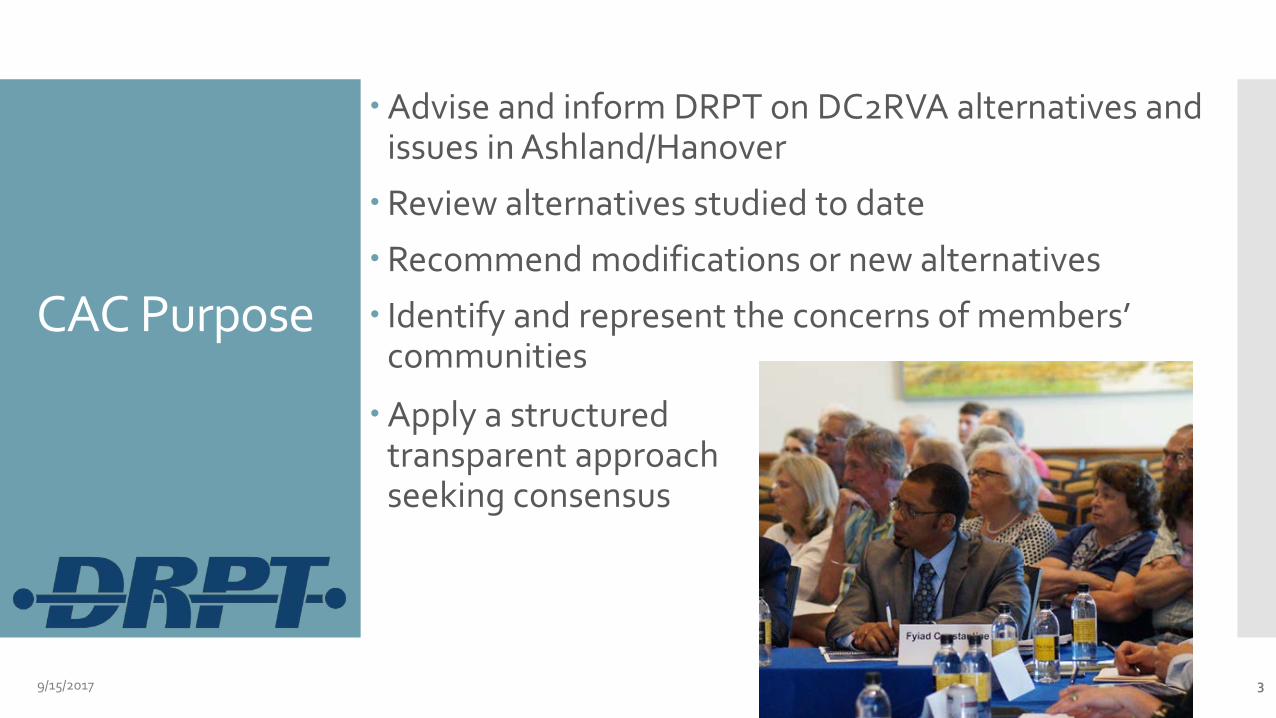
Advise and inform DRPT on DC2RVA alternatives and issues in Ashland/Hanover
Review alternatives studied to date
Recommend modifications or new alternatives
Identify and represent the concerns of members’ communities
CAC Purpose
9/15/2017 3
Apply a structured transparent approach seeking consensus
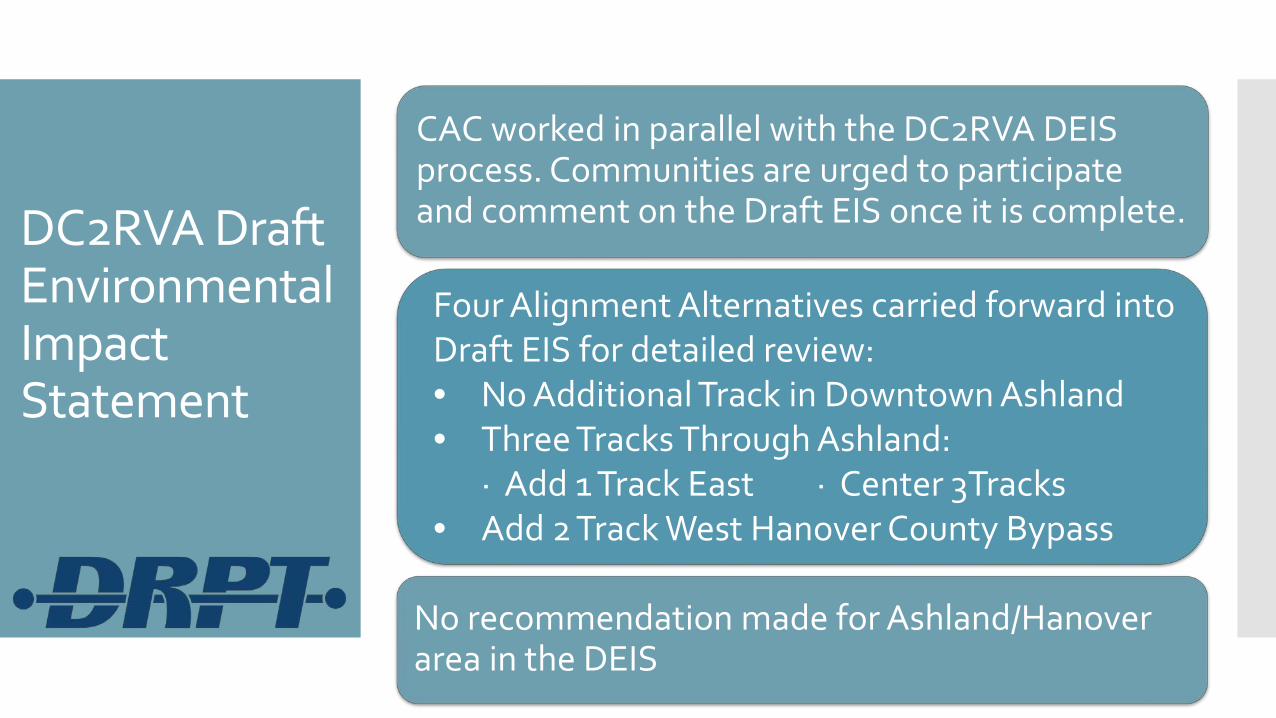
DC2RVA Draft Environmental Impact Statement
No recommendation made for Ashland/Hanover area in the DEIS
Four Alignment Alternatives carried forward into Draft EIS for detailed review: • No Additional Track in Downtown Ashland • Three Tracks Through Ashland: ∙ Add 1 Track East ∙ Center 3Tracks • Add 2 Track West Hanover County Bypass
CAC worked in parallel with the DC2RVA DEIS process. Communities are urged to participate and comment on the Draft EIS once it is complete.
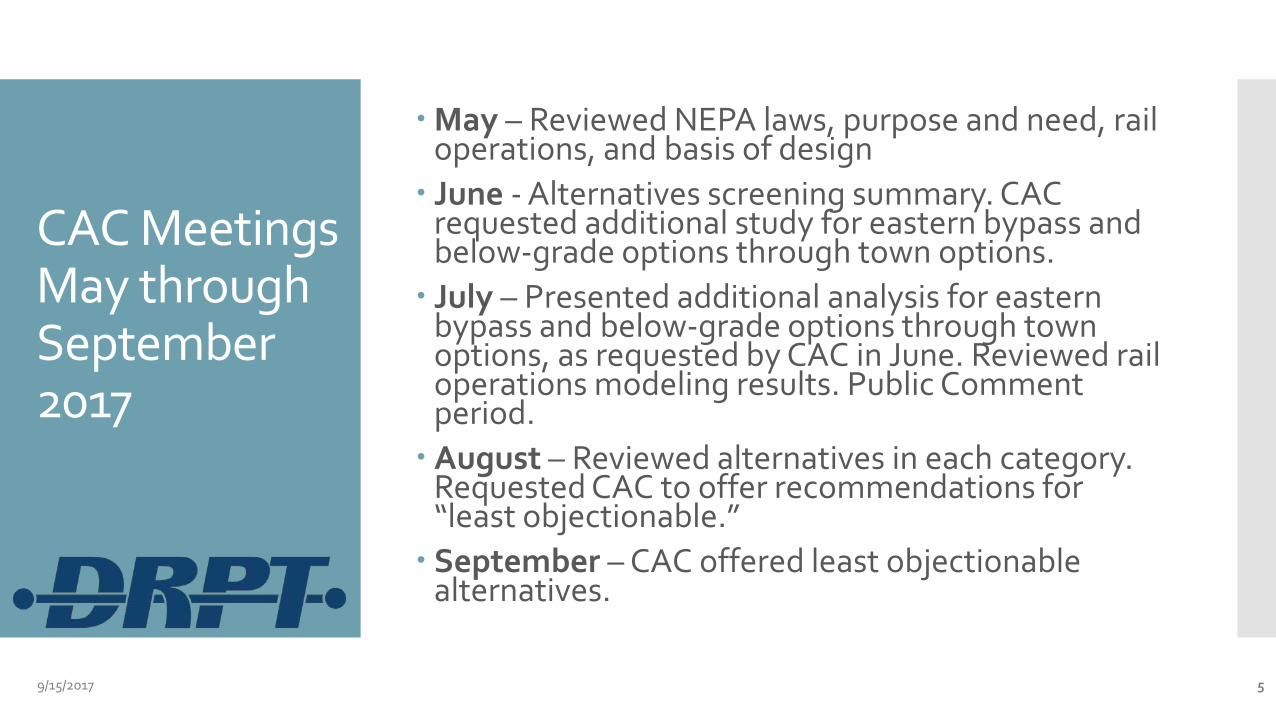
May – Reviewed NEPA laws, purpose and need, rail operations, and basis of design June - Alternatives screening summary. CAC
requested additional study for eastern bypass and below-grade options through town options. July – Presented additional analysis for eastern
bypass and below-grade options through town options, as requested by CAC in June. Reviewed rail operations modeling results. Public Comment period. August – Reviewed alternatives in each category.
Requested CAC to offer recommendations for “least objectionable.” September – CAC offered least objectionable
alternatives.
CAC Meetings May through September 2017
9/15/2017 5
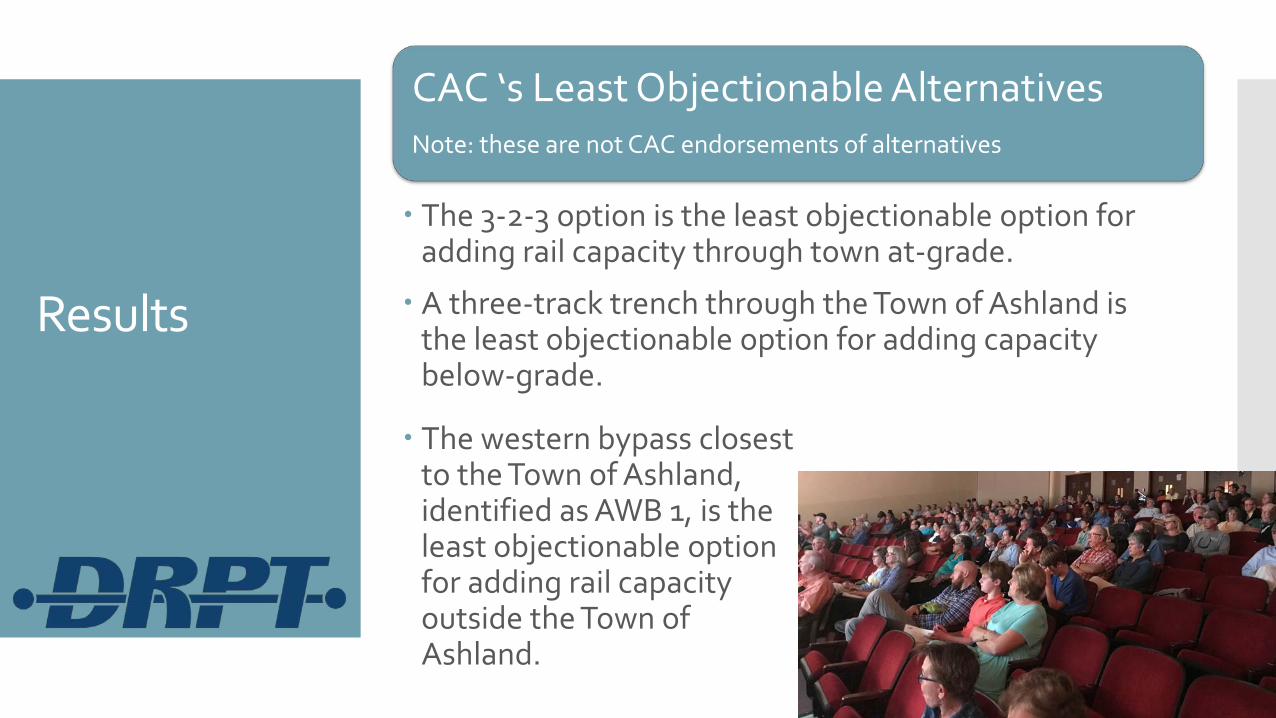
Results
The 3-2-3 option is the least objectionable option for adding rail capacity through town at-grade.
A three-track trench through the Town of Ashland is the least objectionable option for adding capacity below-grade.
CAC ‘s Least Objectionable Alternatives Note: these are not CAC endorsements of alternatives
The western bypass closest to the Town of Ashland, identified as AWB 1, is the least objectionable option for adding rail capacity outside the Town of Ashland.

DC2RVA Ashland/Hanover Area Community Advisory Committee Update September 19, 2017
Emily Stock Manager of Rail
Planning
Barbara Nelson Richmond Regional
Transportation Planning
Organization & CAC Member
1
SMART SCALE Updates
22
Updates
• Recap of proposed Round 3 changes• Follow-up items from June meeting
– Economic Development Measure▪ Cap on Square Footage▪ Distressed Communities
– Congestion Measures▪ Current day demand versus forecasted demand 10 years in future▪ Scaling Throughput
• Summary of Feedback Received
33
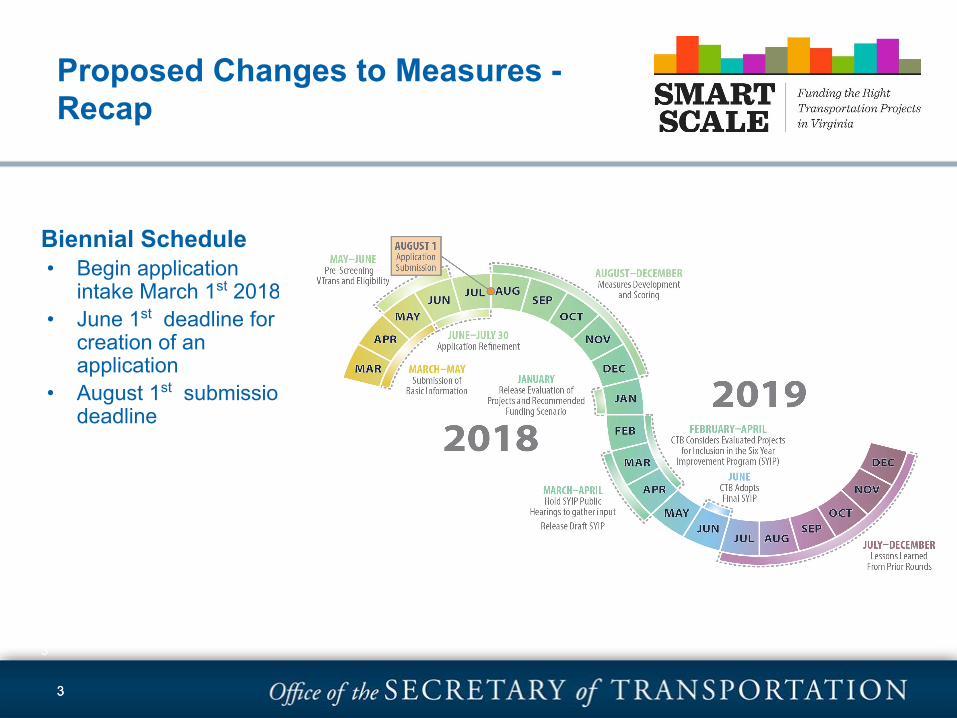
Proposed Changes to Measures - Recap
3
Biennial Schedule• Begin application
intake March 1st 2018• June 1st deadline for
creation of an application
• August 1st submission deadline
44
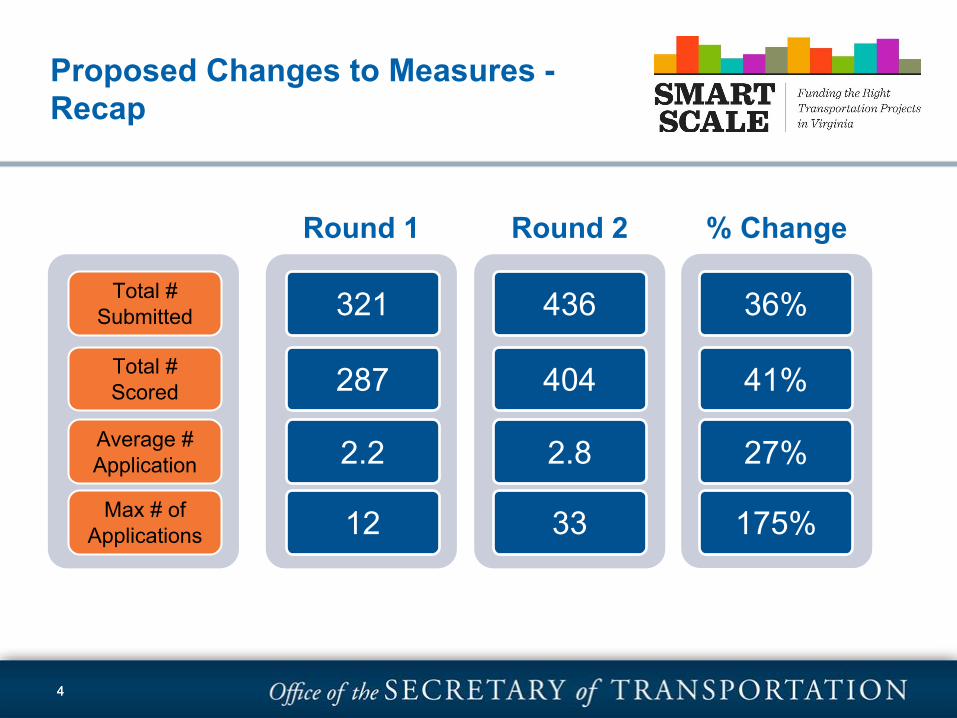
Round 1
287
2.2
12
Round 2
404
2.8
33
Total # Submitted
Total # Scored
Average # Application
Max # of Applications
321 436
% Change
36%
41%
27%
175%
Proposed Changes to Measures - Recap
55
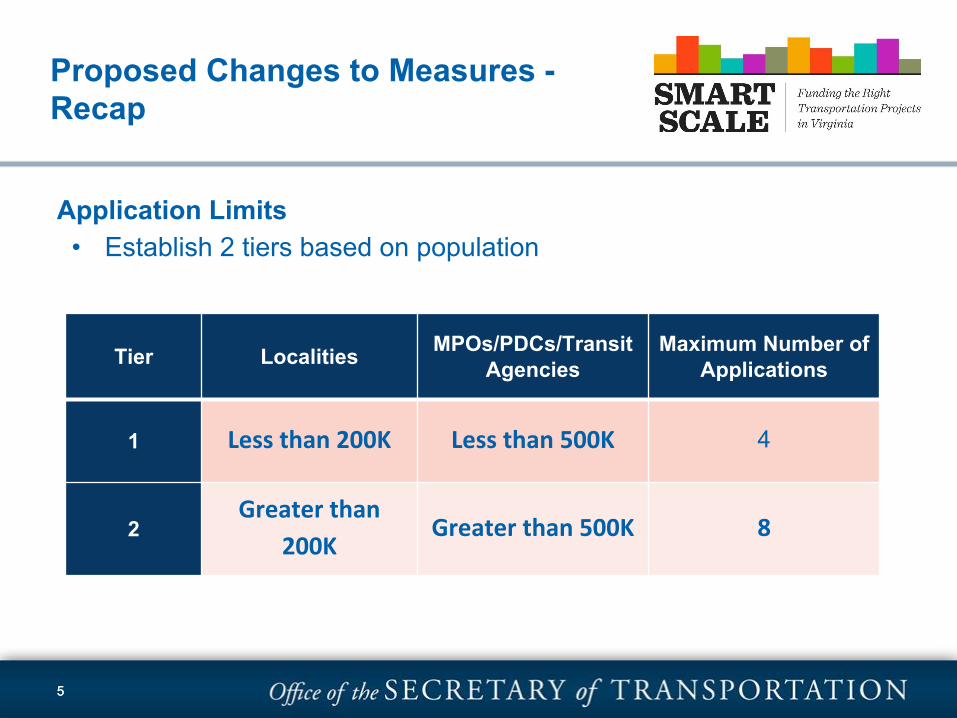
Application Limits• Establish 2 tiers based on population
Tier Localities MPOs/PDCs/Transit Agencies
Maximum Number of Applications
1 Less than 200K Less than 500K 4
2Greater than
200KGreater than 500K 8
Proposed Changes to Measures - Recap
66
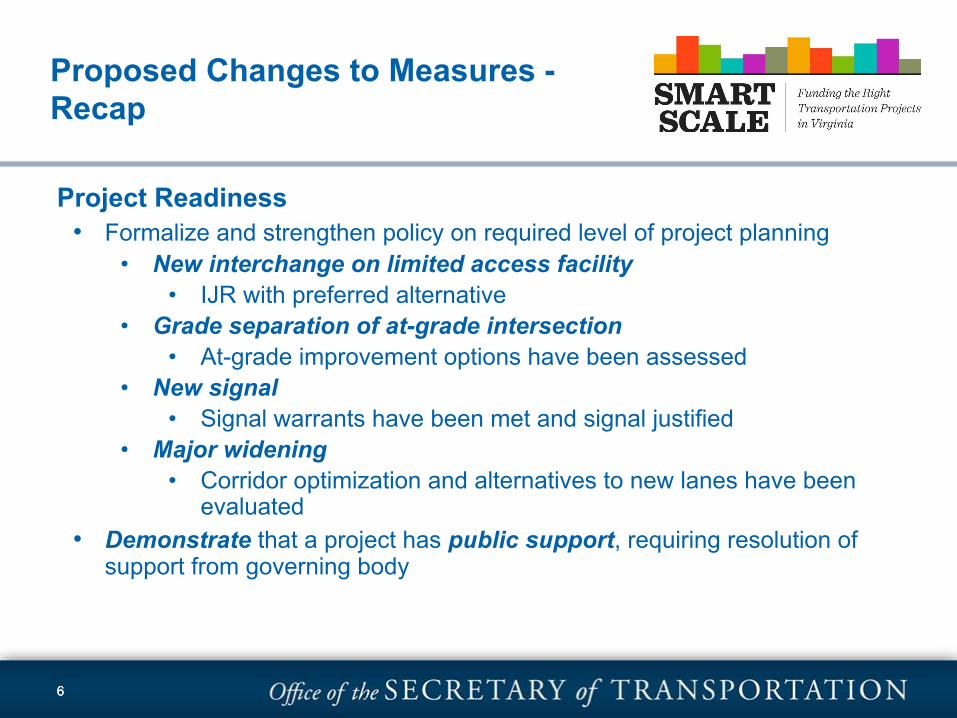
Project Readiness• Formalize and strengthen policy on required level of project planning
• New interchange on limited access facility• IJR with preferred alternative
• Grade separation of at-grade intersection• At-grade improvement options have been assessed
• New signal• Signal warrants have been met and signal justified
• Major widening• Corridor optimization and alternatives to new lanes have been
evaluated• Demonstrate that a project has public support, requiring resolution of
support from governing body
Proposed Changes to Measures - Recap
77
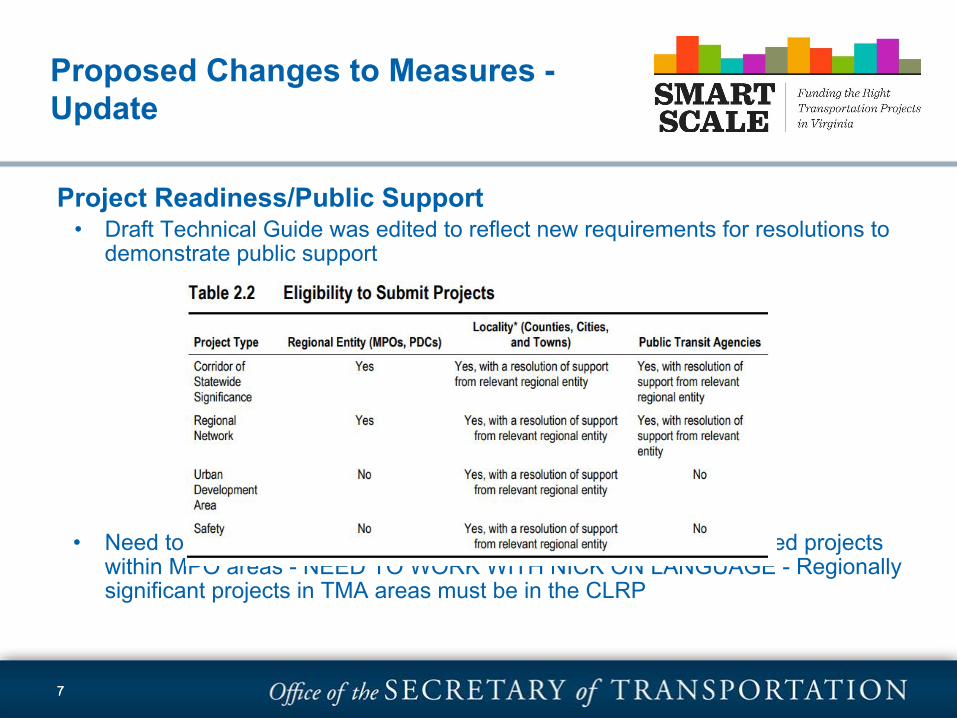
Project Readiness/Public Support• Draft Technical Guide was edited to reflect new requirements for resolutions to
demonstrate public support
• Need to revise draft guide to clarify requirements for locally submitted projects within MPO areas - NEED TO WORK WITH NICK ON LANGUAGE - Regionally significant projects in TMA areas must be in the CLRP
Proposed Changes to Measures - Update
8
Proposed Changes to Measures - Recap
Project Eligibility• Clarify the ineligibility of maintenance and State of Good
Repair (SGR) projects• If project scope is mostly the repair or replacement of existing
assets then it is not eligible for SMART SCALE Examples include:• Signal system replacement (mast arms, signal heads)• Bridge replacement with wider lane widths and/or ped
accommodations
9
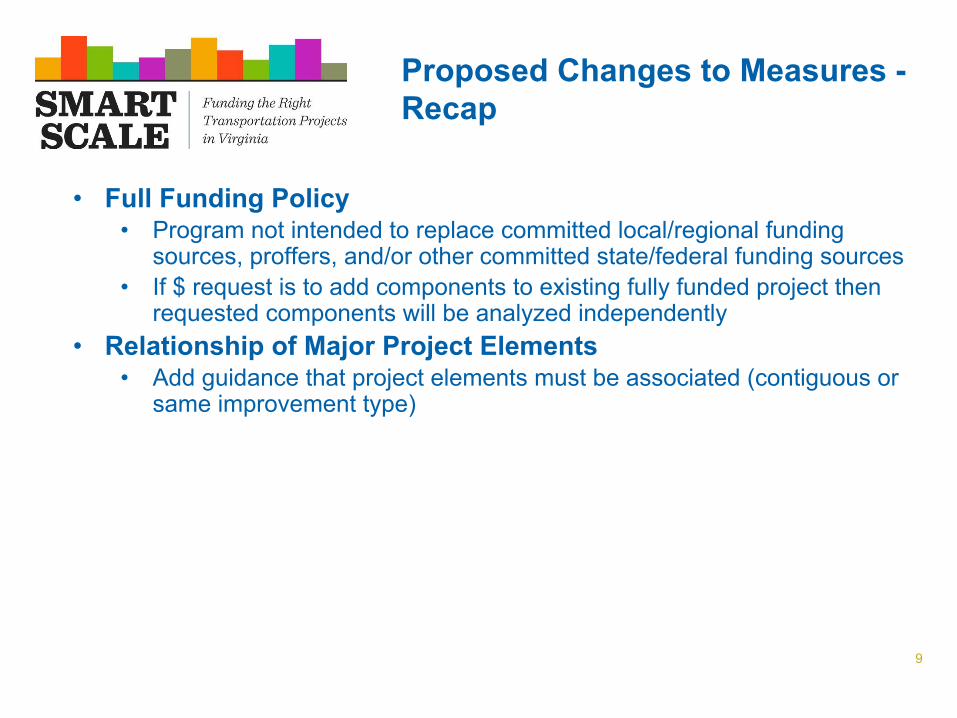
• Full Funding Policy• Program not intended to replace committed local/regional funding
sources, proffers, and/or other committed state/federal funding sources• If $ request is to add components to existing fully funded project then
requested components will be analyzed independently• Relationship of Major Project Elements
• Add guidance that project elements must be associated (contiguous or same improvement type)
Proposed Changes to Measures - Recap
1010
Proposed Changes to Measures - Recap
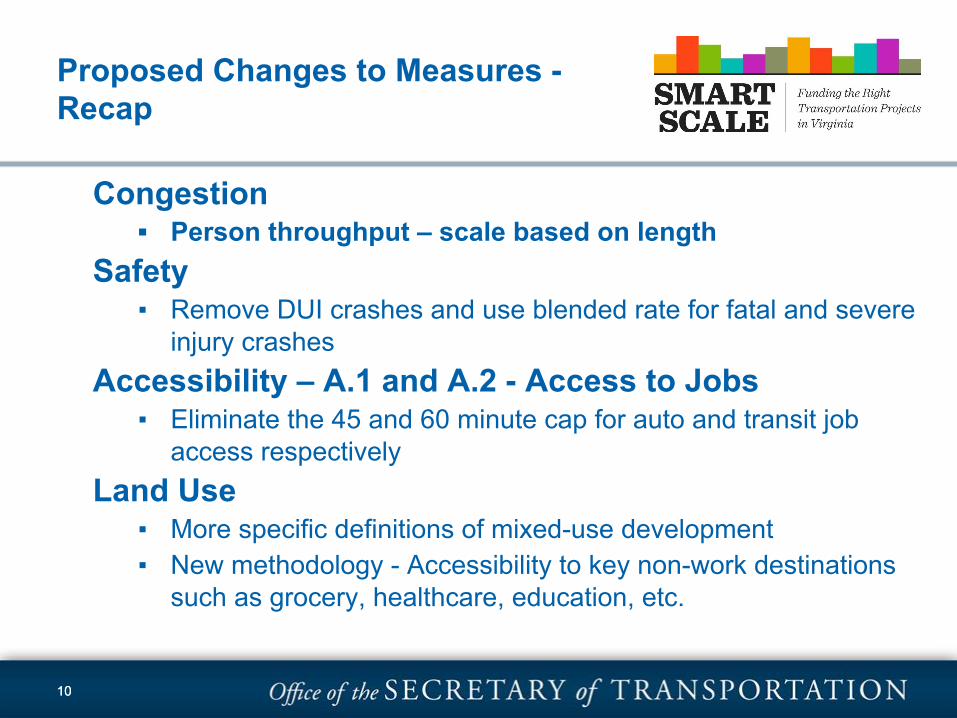
Congestion▪ Person throughput – scale based on length
Safety▪ Remove DUI crashes and use blended rate for fatal and severe
injury crashesAccessibility – A.1 and A.2 - Access to Jobs
▪ Eliminate the 45 and 60 minute cap for auto and transit job access respectively
Land Use▪ More specific definitions of mixed-use development▪ New methodology - Accessibility to key non-work destinations
such as grocery, healthcare, education, etc.
1111
Proposed Changes to Measures - Update
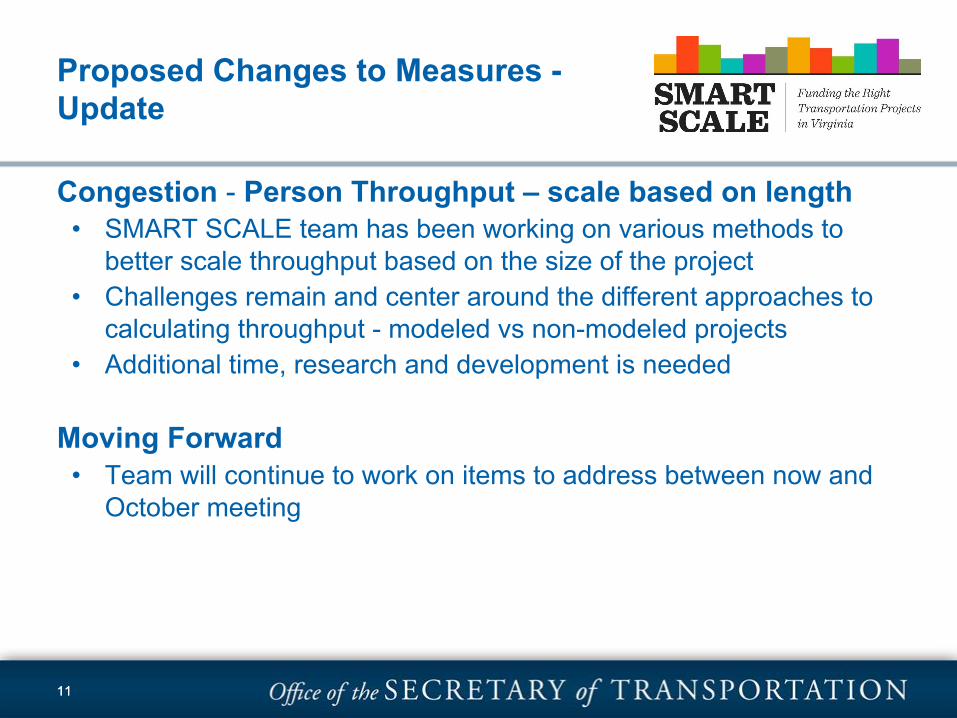
Congestion - Person Throughput – scale based on length• SMART SCALE team has been working on various methods to
better scale throughput based on the size of the project• Challenges remain and center around the different approaches to
calculating throughput - modeled vs non-modeled projects• Additional time, research and development is needed
Moving Forward• Team will continue to work on items to address between now and
October meeting
1212
Proposed Changes to Measures - Update
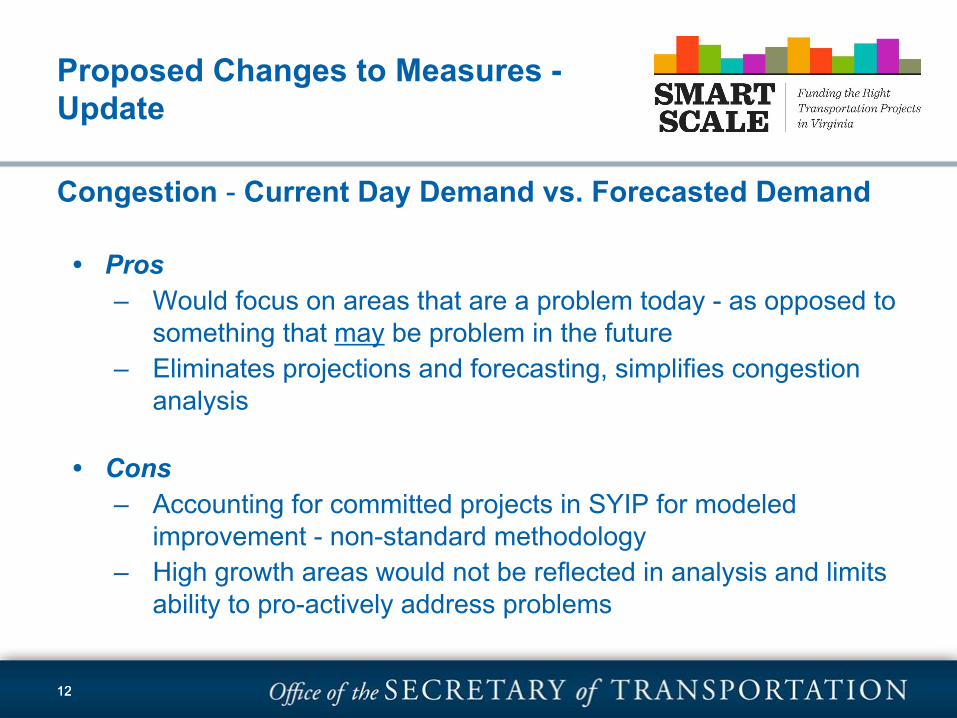
Congestion - Current Day Demand vs. Forecasted Demand
• Pros– Would focus on areas that are a problem today - as opposed to
something that may be problem in the future– Eliminates projections and forecasting, simplifies congestion
analysis
• Cons– Accounting for committed projects in SYIP for modeled
improvement - non-standard methodology– High growth areas would not be reflected in analysis and limits
ability to pro-actively address problems
1313
Proposed Changes to Measures - Recap
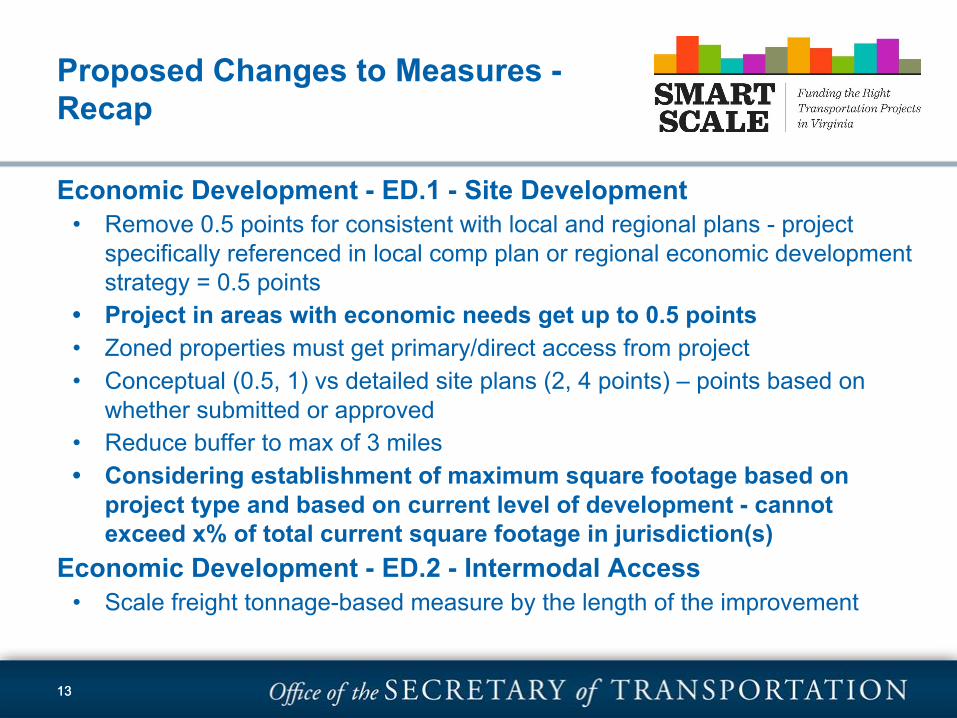
Economic Development - ED.1 - Site Development• Remove 0.5 points for consistent with local and regional plans - project
specifically referenced in local comp plan or regional economic development strategy = 0.5 points
• Project in areas with economic needs get up to 0.5 points• Zoned properties must get primary/direct access from project• Conceptual (0.5, 1) vs detailed site plans (2, 4 points) – points based on
whether submitted or approved• Reduce buffer to max of 3 miles• Considering establishment of maximum square footage based on
project type and based on current level of development - cannot exceed x% of total current square footage in jurisdiction(s)
Economic Development - ED.2 - Intermodal Access• Scale freight tonnage-based measure by the length of the improvement
1414
Proposed Changes to Measures – Update
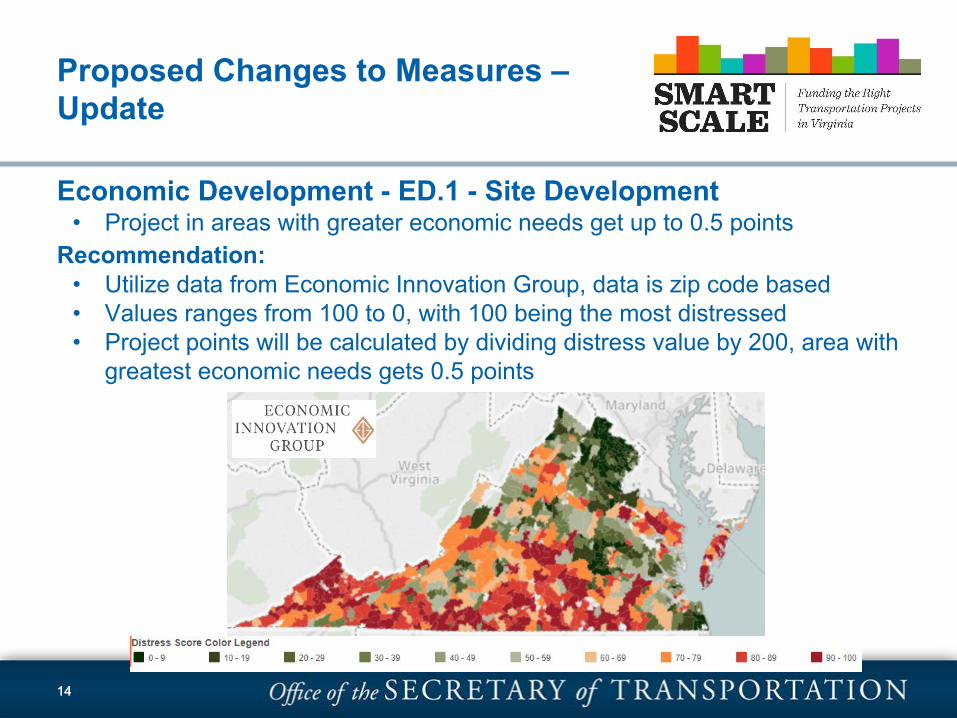
Economic Development - ED.1 - Site Development• Project in areas with greater economic needs get up to 0.5 points
Recommendation:• Utilize data from Economic Innovation Group, data is zip code based• Values ranges from 100 to 0, with 100 being the most distressed• Project points will be calculated by dividing distress value by 200, area with
greatest economic needs gets 0.5 points
1515
Proposed Changes to Measures – Update
Economic Development - ED.1 - Site Development• Considering establishment of maximum square footage based on project
type and based on current level of development - cannot exceed x% of total current square footage in jurisdiction(s)
Update• Requested and received data from several localities• Concern about urban/rural total square footage and cap approach could
disadvantage rural localitiesRecommendation
• Establish statewide limit on amount of square footage, additional documentation required for anything above that amount
– [Developing recommendation based on top X% of applications from previous two rounds]
1616
What we have Heard
Draft Technical Guide made publicly available on August 20, 2017
Application Limits• Concerns raised on whether the two tier approach provides
advantage to most populated areas• Concerns that limit could encourage applicants to submit maximum
Project Readiness• Requested documentation (IJR, signal warrants) could be dated by
the time funding is available
1717
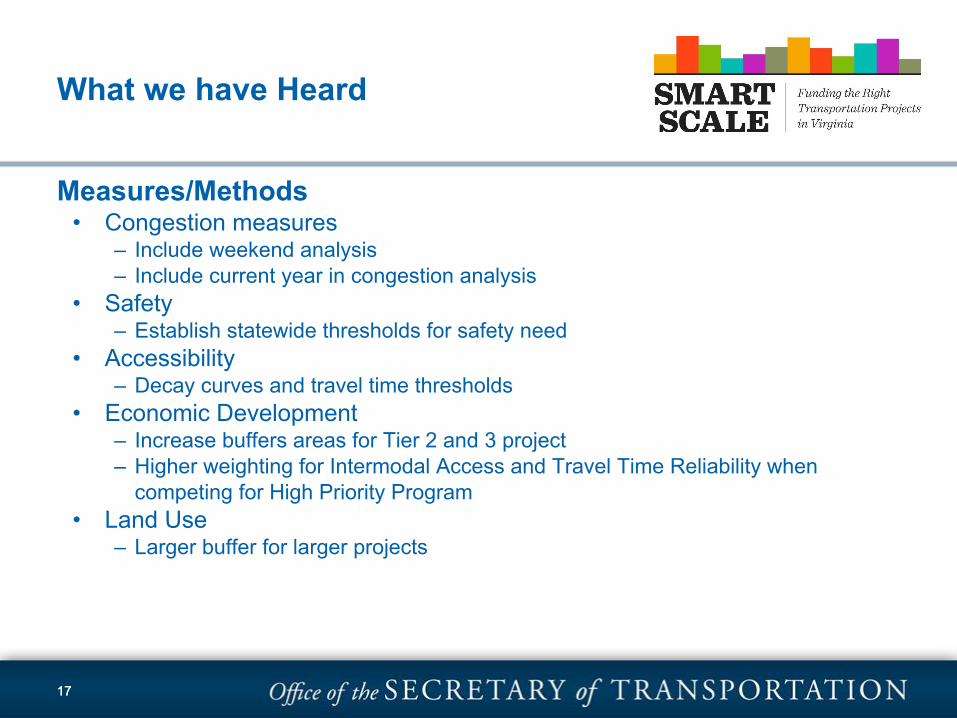
What we have Heard
Measures/Methods• Congestion measures
– Include weekend analysis– Include current year in congestion analysis
• Safety– Establish statewide thresholds for safety need
• Accessibility– Decay curves and travel time thresholds
• Economic Development– Increase buffers areas for Tier 2 and 3 project– Higher weighting for Intermodal Access and Travel Time Reliability when
competing for High Priority Program• Land Use
– Larger buffer for larger projects
1818
Schedule and Next Steps
September – October - Fall Transportation Meetings• Training and Outreach on proposed changes• Receive public comment on proposed changes
October CTB Meeting - Tentative• Adopt Revised CTB Policy and Policy/Technical Guides
FY 2017 Budget / Actual Performance FY 2018 Year-to-Date August Revenue Update – CTF and Regional Revenue Expectations John W. Lawson Chief Financial Officer September 19, 2017
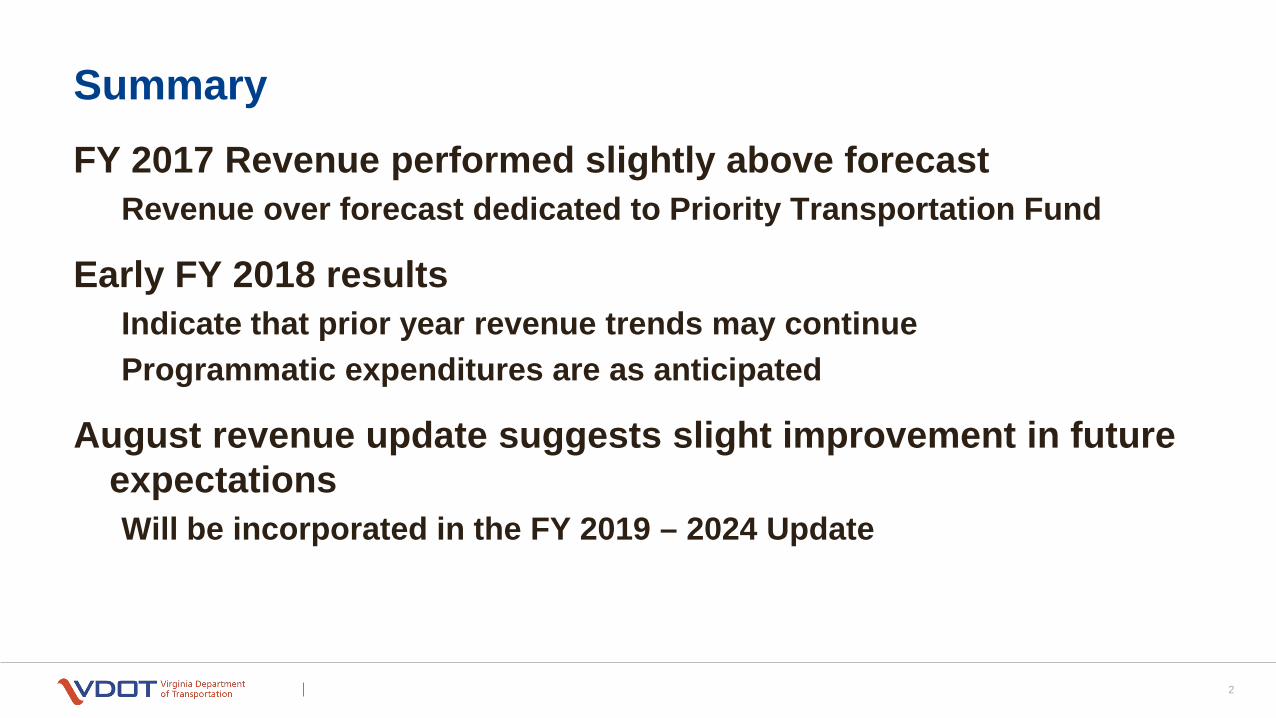
FY 2017 Revenue performed slightly above forecast Revenue over forecast dedicated to Priority Transportation Fund
Early FY 2018 results Indicate that prior year revenue trends may continue Programmatic expenditures are as anticipated
August revenue update suggests slight improvement in future expectations Will be incorporated in the FY 2019 – 2024 Update
2
Summary
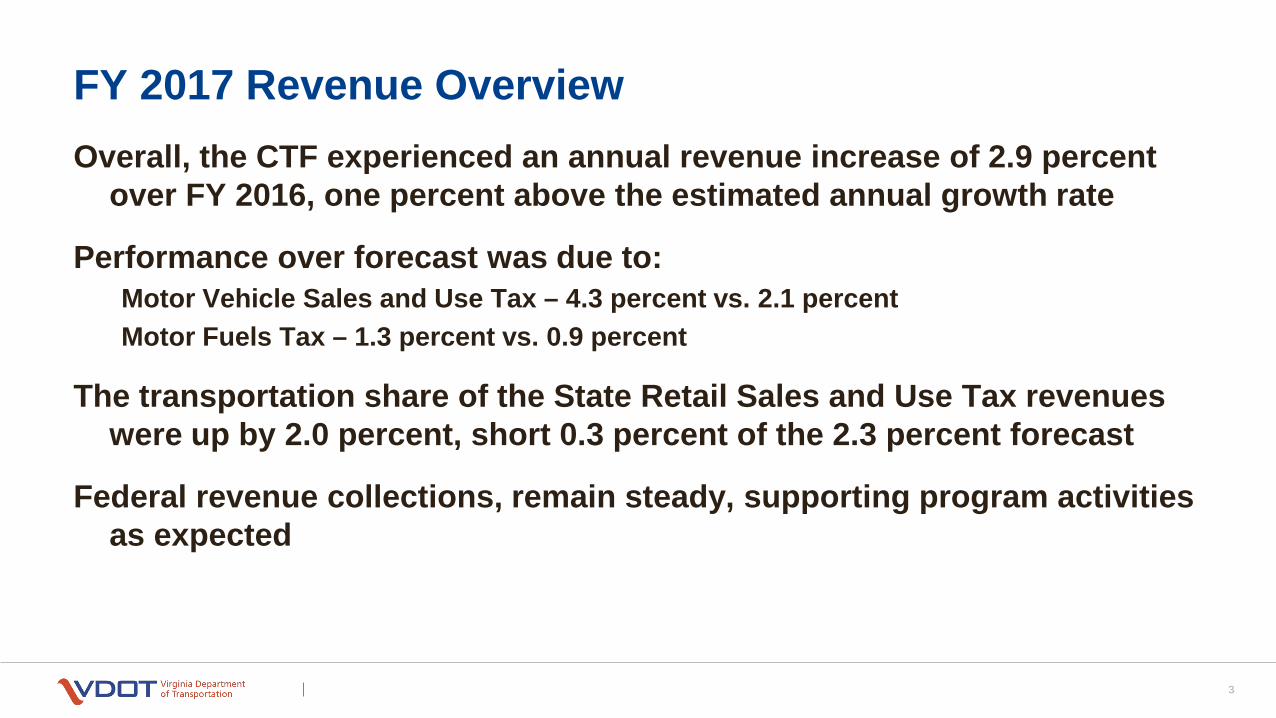
Overall, the CTF experienced an annual revenue increase of 2.9 percent over FY 2016, one percent above the estimated annual growth rate
Performance over forecast was due to: Motor Vehicle Sales and Use Tax – 4.3 percent vs. 2.1 percent Motor Fuels Tax – 1.3 percent vs. 0.9 percent
The transportation share of the State Retail Sales and Use Tax revenues were up by 2.0 percent, short 0.3 percent of the 2.3 percent forecast
Federal revenue collections, remain steady, supporting program activities as expected
3
FY 2017 Revenue Overview
4
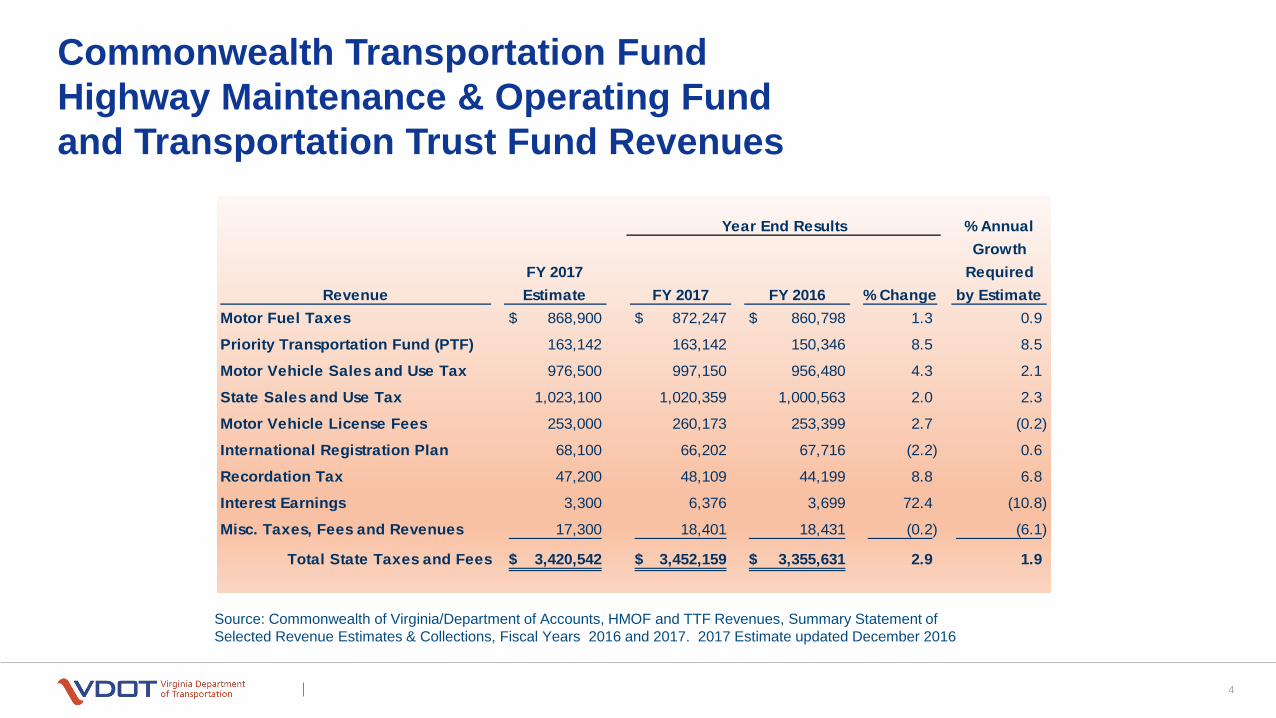
Commonwealth Transportation Fund Highway Maintenance & Operating Fund and Transportation Trust Fund Revenues
Source: Commonwealth of Virginia/Department of Accounts, HMOF and TTF Revenues, Summary Statement of Selected Revenue Estimates & Collections, Fiscal Years 2016 and 2017. 2017 Estimate updated December 2016
RevenueFY 2017Estimate FY 2017 FY 2016 % Change
Motor Fuel Taxes 868,900$ 872,247$ 860,798$ 1.3 0.9
Priority Transportation Fund (PTF) 163,142 163,142 150,346 8.5 8.5
Motor Vehicle Sales and Use Tax 976,500 997,150 956,480 4.3 2.1
State Sales and Use Tax 1,023,100 1,020,359 1,000,563 2.0 2.3
Motor Vehicle License Fees 253,000 260,173 253,399 2.7 (0.2)
International Registration Plan 68,100 66,202 67,716 (2.2) 0.6
Recordation Tax 47,200 48,109 44,199 8.8 6.8
Interest Earnings 3,300 6,376 3,699 72.4 (10.8)
Misc. Taxes, Fees and Revenues 17,300 18,401 18,431 (0.2) (6.1)
Total State Taxes and Fees 3,420,542$ 3,452,159$ 3,355,631$ 2.9 1.9
Year End Results % Annual Growth
Required by Estimate
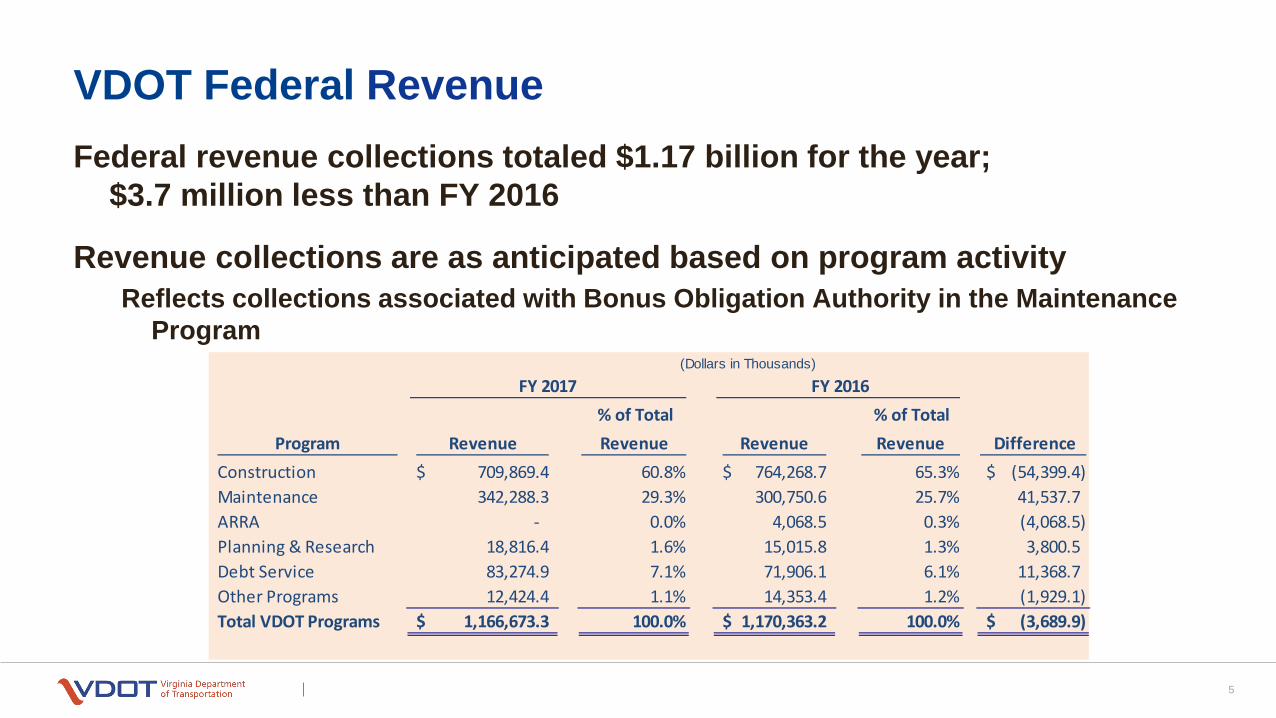
Federal revenue collections totaled $1.17 billion for the year; $3.7 million less than FY 2016
Revenue collections are as anticipated based on program activity Reflects collections associated with Bonus Obligation Authority in the Maintenance
Program
5
VDOT Federal Revenue
Program Revenue % of Total Revenue Revenue
% of Total Revenue Difference
Construction 709,869.4$ 60.8% 764,268.7$ 65.3% (54,399.4)$ Maintenance 342,288.3 29.3% 300,750.6 25.7% 41,537.7 ARRA - 0.0% 4,068.5 0.3% (4,068.5) Planning & Research 18,816.4 1.6% 15,015.8 1.3% 3,800.5 Debt Service 83,274.9 7.1% 71,906.1 6.1% 11,368.7 Other Programs 12,424.4 1.1% 14,353.4 1.2% (1,929.1) Total VDOT Programs 1,166,673.3$ 100.0% 1,170,363.2$ 100.0% (3,689.9)$
(Dollars in Thousands)
FY 2017 FY 2016
$- $150 $300 $450 $600 $750 $900 $1,050 $1,200 $1,350 $1,500 $1,650 $1,800 $1,950
Highway system acquisitionand construction
Highway systemmaintenance
Financial assistance tolocalities
Debt Service
Administrative and supportservices
Planning and research
Toll facility operations andconstruction
Environmental monitoringand compliance
Capital outlay
$1,726
$1,738
$929
$322
$271
$71
$79
$14
$40
$1,937
$1,748
$914
$322
$247
$62
$47
$11
$24
Millions
FY 2017 Expenditures FY 2016 Expenditures
6
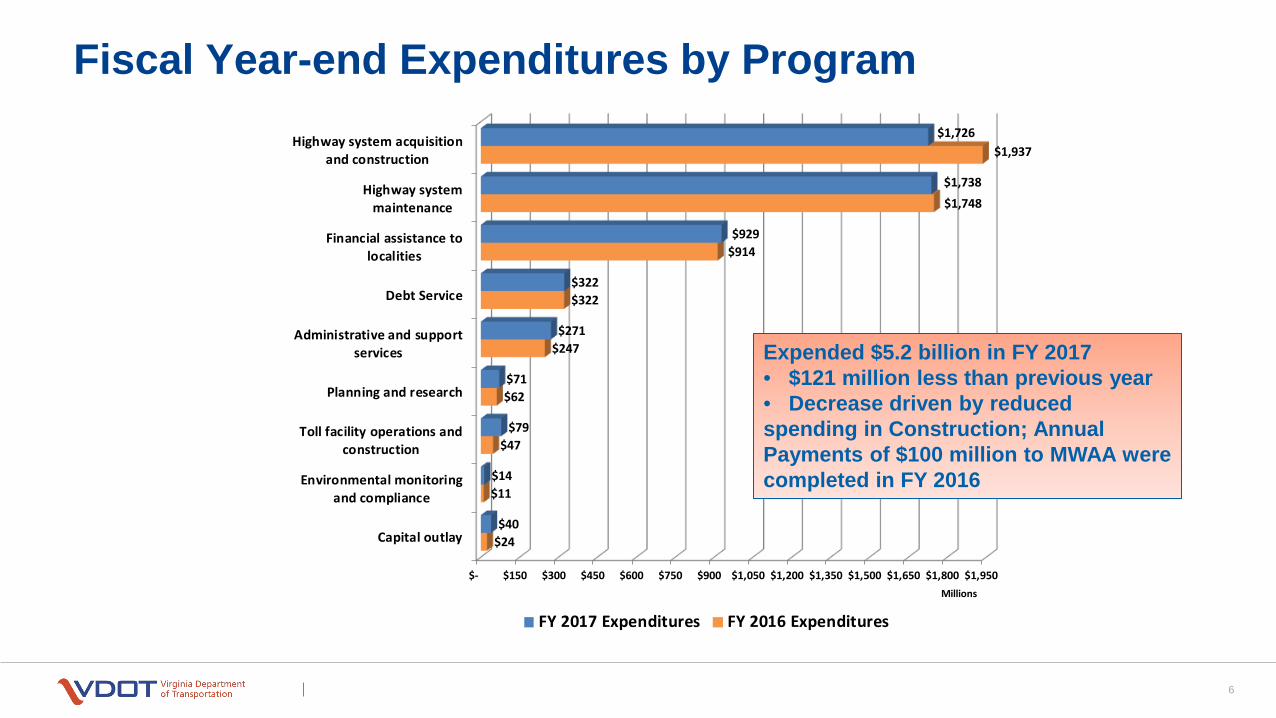
Fiscal Year-end Expenditures by Program
Expended $5.2 billion in FY 2017 • $121 million less than previous year • Decrease driven by reduced spending in Construction; Annual Payments of $100 million to MWAA were completed in FY 2016
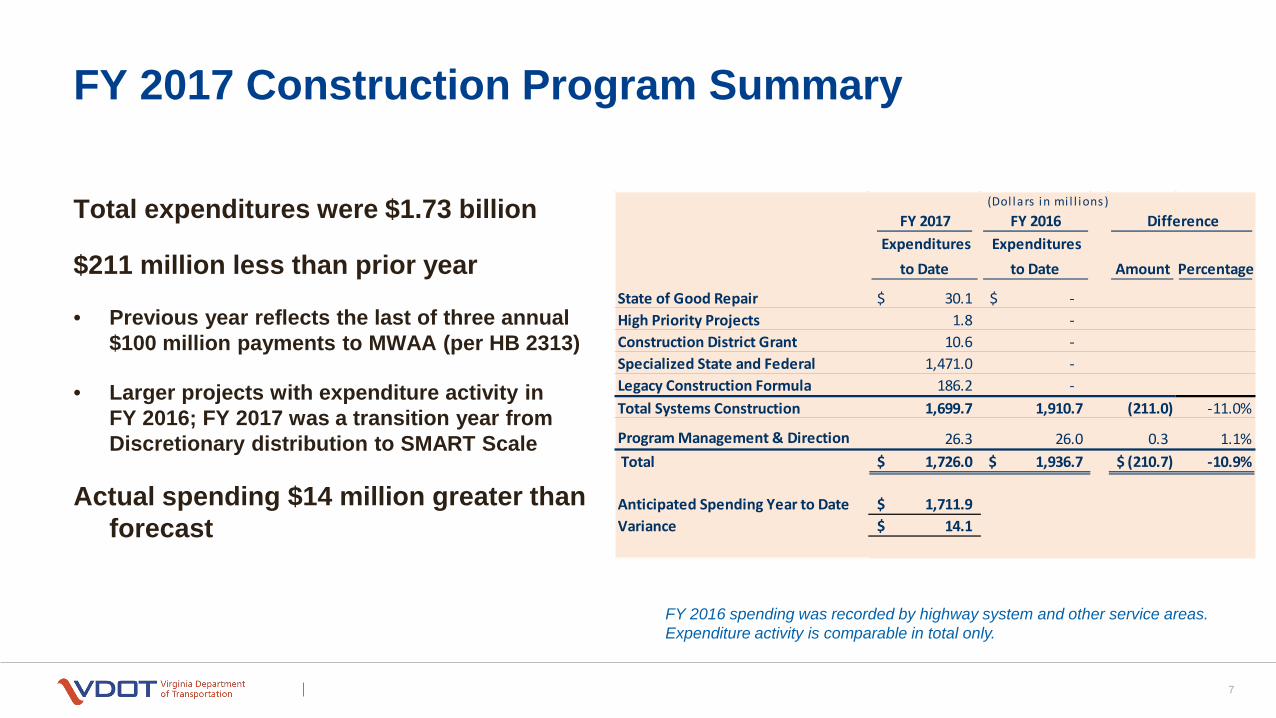
Total expenditures were $1.73 billion
$211 million less than prior year
• Previous year reflects the last of three annual $100 million payments to MWAA (per HB 2313)
• Larger projects with expenditure activity in FY 2016; FY 2017 was a transition year from Discretionary distribution to SMART Scale
Actual spending $14 million greater than forecast
7
FY 2017 Construction Program Summary
(Dol lars in mi l l ions)
Expendituresto Date
Expendituresto Date Amount Percentage
State of Good Repair 30.1$ -$ High Priority Projects 1.8 - Construction District Grant 10.6 - Specialized State and Federal 1,471.0 - Legacy Construction Formula 186.2 - Total Systems Construction 1,699.7 1,910.7 (211.0) -11.0%
Program Management & Direction 26.3 26.0 0.3 1.1% Total 1,726.0$ 1,936.7$ (210.7)$ -10.9%
Anticipated Spending Year to Date 1,711.9$ Variance 14.1$
FY 2017 FY 2016 Difference
FY 2016 spending was recorded by highway system and other service areas. Expenditure activity is comparable in total only.
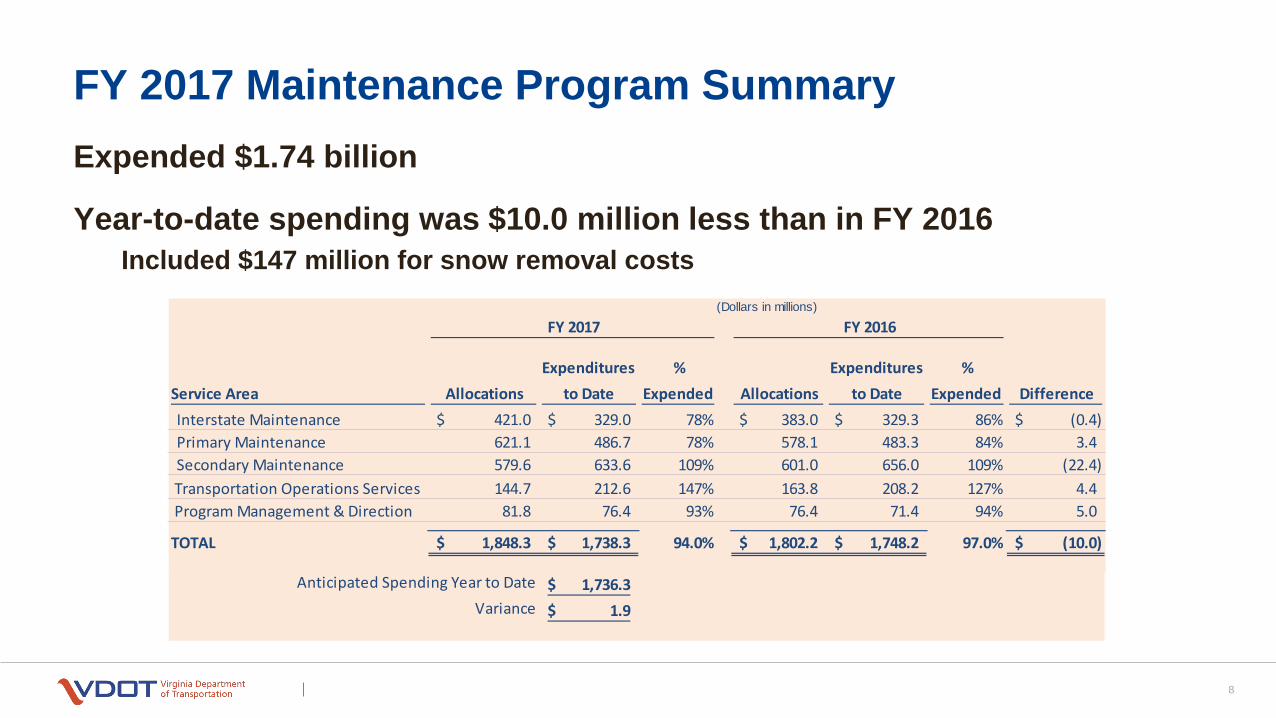
Expended $1.74 billion
Year-to-date spending was $10.0 million less than in FY 2016 Included $147 million for snow removal costs
8
FY 2017 Maintenance Program Summary
Service Area Allocations
Expenditures
to Date %
Expended Allocations
Expenditures
to Date %
Expended Difference Interstate Maintenance 421.0$ 329.0$ 78% 383.0$ 329.3$ 86% (0.4)$ Primary Maintenance 621.1 486.7 78% 578.1 483.3 84% 3.4 Secondary Maintenance 579.6 633.6 109% 601.0 656.0 109% (22.4)
Transportation Operations Services 144.7 212.6 147% 163.8 208.2 127% 4.4 Program Management & Direction 81.8 76.4 93% 76.4 71.4 94% 5.0
TOTAL 1,848.3$ 1,738.3$ 94.0% 1,802.2$ 1,748.2$ 97.0% (10.0)$
1,736.3$ 1.9$
Anticipated Spending Year to Date Variance
FY 2017 FY 2016 (Dollars in millions)
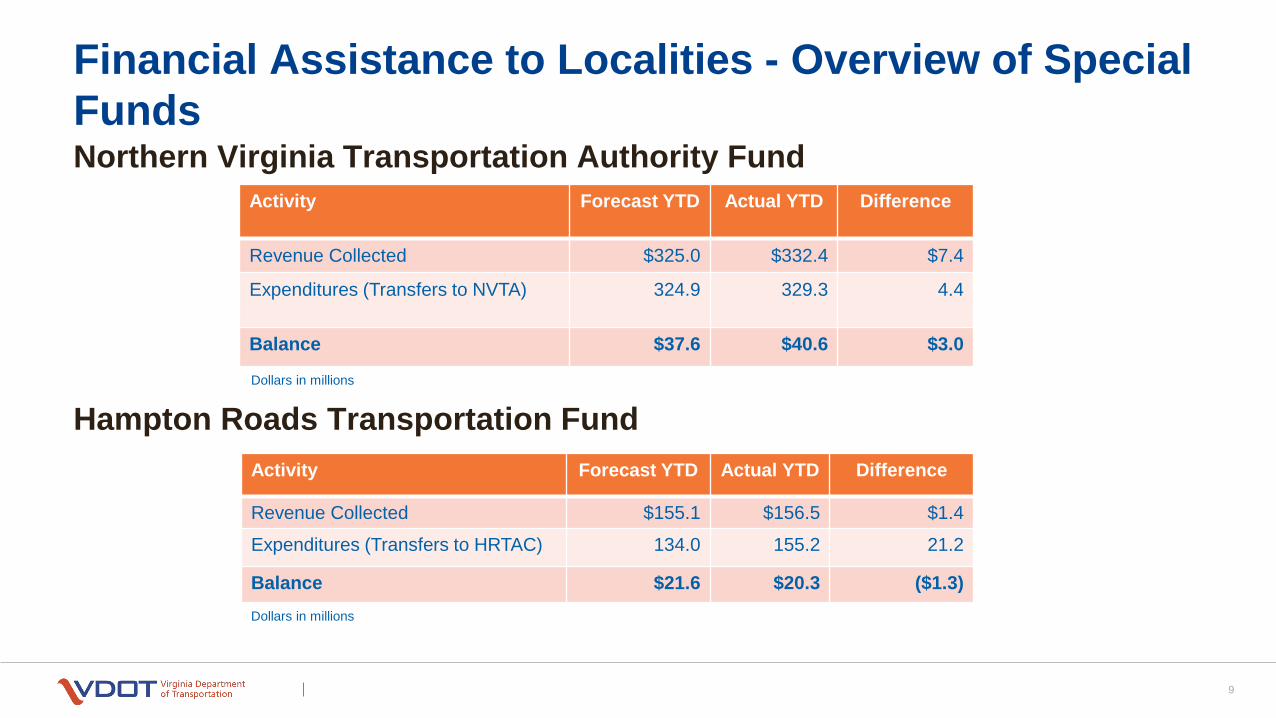
Northern Virginia Transportation Authority Fund
Hampton Roads Transportation Fund
9
Financial Assistance to Localities - Overview of Special Funds
Activity Forecast YTD Actual YTD Difference
Revenue Collected $325.0 $332.4 $7.4
Expenditures (Transfers to NVTA) 324.9 329.3 4.4
Balance $37.6 $40.6 $3.0
Activity Forecast YTD Actual YTD Difference
Revenue Collected $155.1 $156.5 $1.4
Expenditures (Transfers to HRTAC) 134.0 155.2 21.2
Balance $21.6 $20.3 ($1.3)
Dollars in millions
Dollars in millions
10
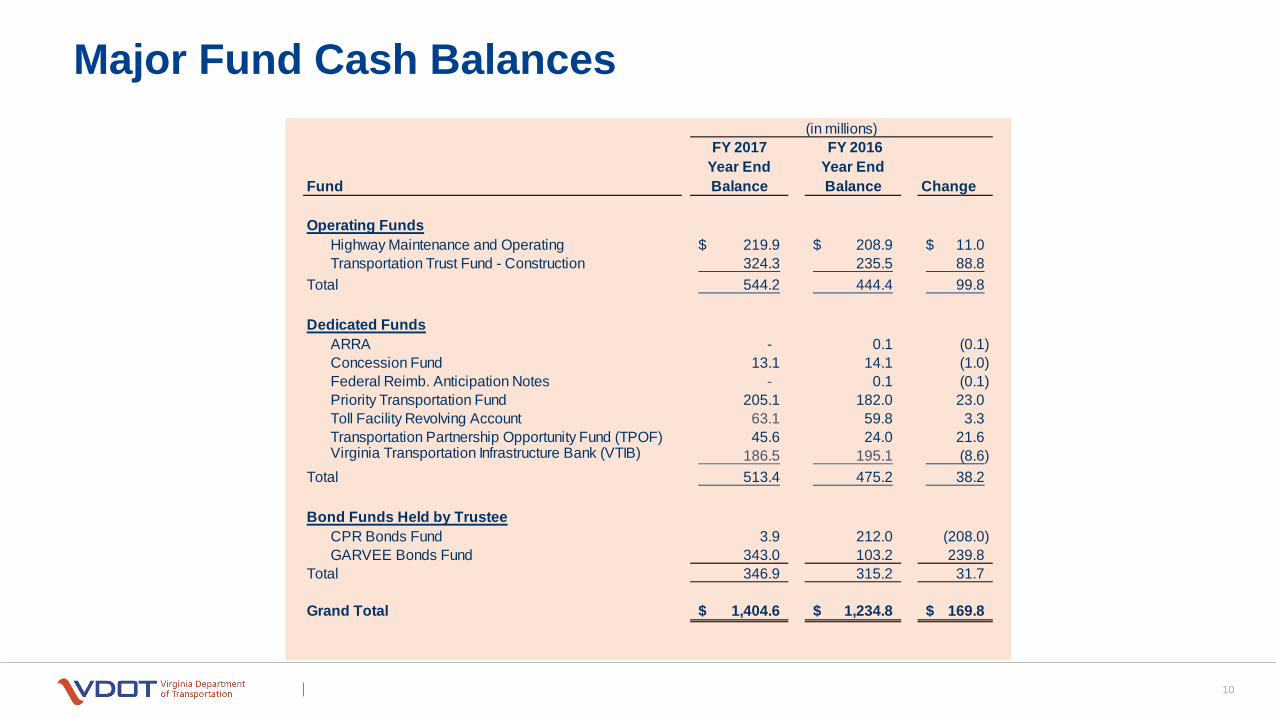
Major Fund Cash Balances
Fund
FY 2017 Year End Balance
FY 2016 Year End Balance Change
Operating FundsHighway Maintenance and Operating 219.9$ 208.9$ 11.0$ Transportation Trust Fund - Construction 324.3 235.5 88.8
Total 544.2 444.4 99.8
Dedicated FundsARRA - 0.1 (0.1) Concession Fund 13.1 14.1 (1.0) Federal Reimb. Anticipation Notes - 0.1 (0.1) Priority Transportation Fund 205.1 182.0 23.0 Toll Facility Revolving Account 63.1 59.8 3.3 Transportation Partnership Opportunity Fund (TPOF) 45.6 24.0 21.6 Virginia Transportation Infrastructure Bank (VTIB) 186.5 195.1 (8.6)
Total 513.4 475.2 38.2
Bond Funds Held by TrusteeCPR Bonds Fund 3.9 212.0 (208.0) GARVEE Bonds Fund 343.0 103.2 239.8
Total 346.9 315.2 31.7
Grand Total 1,404.6$ 1,234.8$ 169.8$
(in millions)
FY 2018 PERFORMANCE TO DATE
11
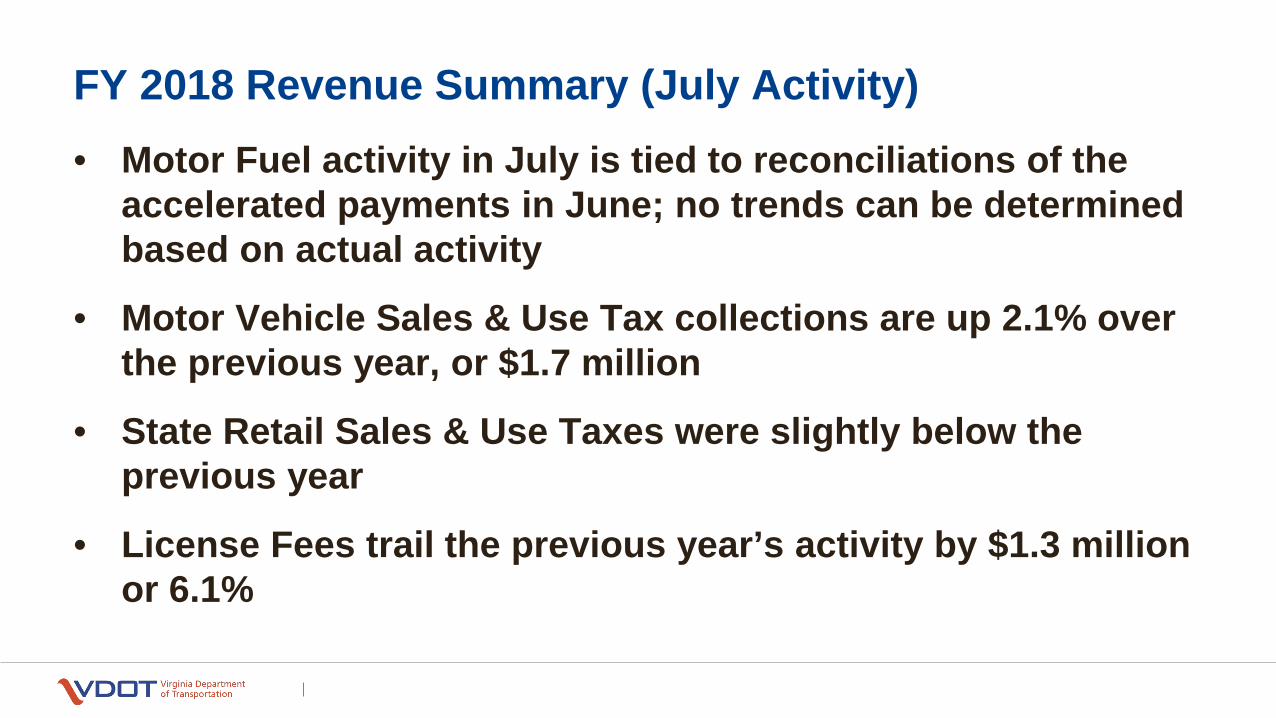
• Motor Fuel activity in July is tied to reconciliations of the accelerated payments in June; no trends can be determined based on actual activity
• Motor Vehicle Sales & Use Tax collections are up 2.1% over the previous year, or $1.7 million
• State Retail Sales & Use Taxes were slightly below the previous year
• License Fees trail the previous year’s activity by $1.3 million or 6.1%
FY 2018 Revenue Summary (July Activity)
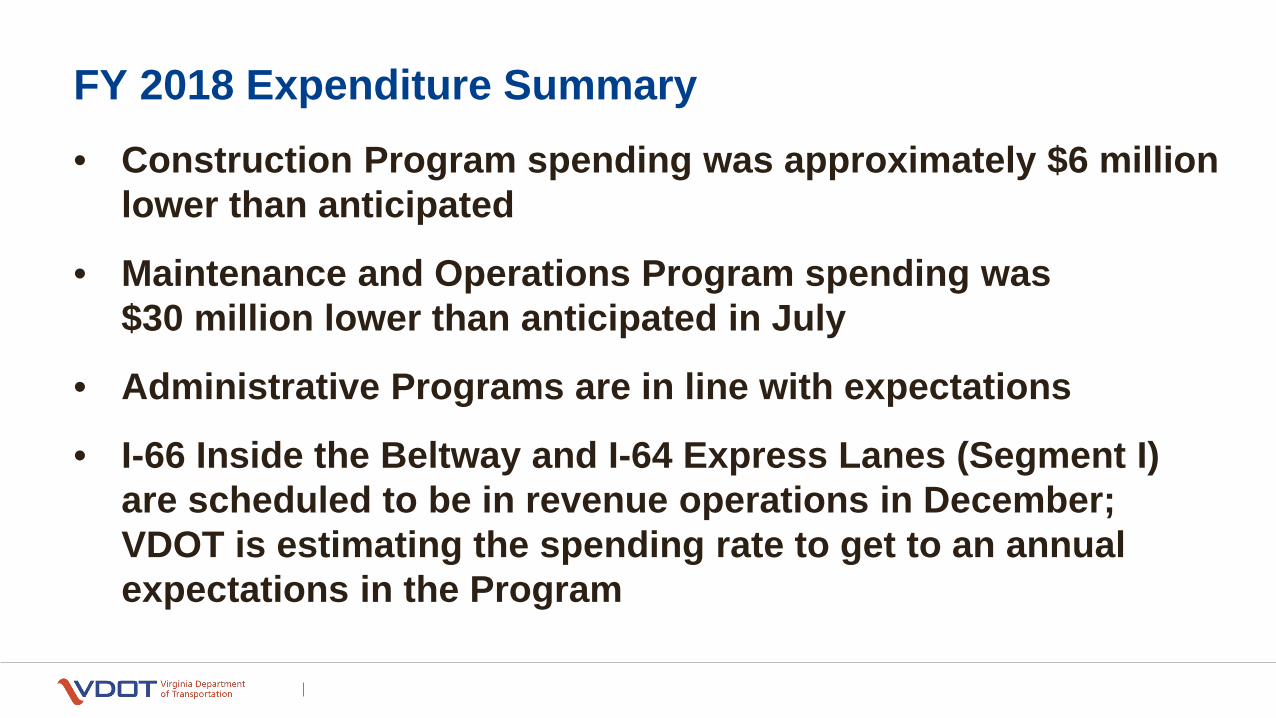
• Construction Program spending was approximately $6 million lower than anticipated
• Maintenance and Operations Program spending was $30 million lower than anticipated in July
• Administrative Programs are in line with expectations
• I-66 Inside the Beltway and I-64 Express Lanes (Segment I) are scheduled to be in revenue operations in December; VDOT is estimating the spending rate to get to an annual expectations in the Program
FY 2018 Expenditure Summary
AUGUST REVENUE UPDATE
14
Update on the Commonwealth’s revenue collections and future expectations released on August 21, 2017 Focused on General Fund revenue sources Included updates to major transportation sources Full annual update of the transportation revenue forecast will be
provided in December as part of the Governor’s Budget Bill for the 2018 General Assembly Session
Update indicates continued improvement in motor vehicle sales and use tax over official forecast
15
August Revenue Updates
Morteza Farajian, Ph.D. Director of P3 Office September 19, 2017
PPTA Implementation Manual & Guidelines
2017 Updates
PURPOSE OF REVISIONS
2
• PPTA Requires Guidelines (Va. Code §33.2-1819) • Guidelines are Out-of-Date (Last Update in 2014)
• 2017 Version Will Incorporate Legislative Changes
from 2015 and 2017
• 2017 Version Will Apply Only to VDOT and DRPT
Key 2015 PPTA Legislative Changes
• Sets Requirements for Finding of Public Interest by CEO (Va. Code §33.2-1803.1)
• Statement of Benefits • Statement of Risks, Liabilities, and Responsibilities Assumed by Private
Partner • Determination of High, Medium, or Low Project Delivery Risk • Rationale for Using Competitive Negotiations (When Used)
• CEO Must Certify the Finding of Public Interest to Governor and General
Assembly before entering into a Comprehensive Agreement (Va. Code §33.2-1803(D))
• Opportunity for Public Comment on Draft Comprehensive Agreement before Request for Proposals (Va. Code §33.2-1820(B)(2))
3
Key 2017 PPTA Legislative Changes
4
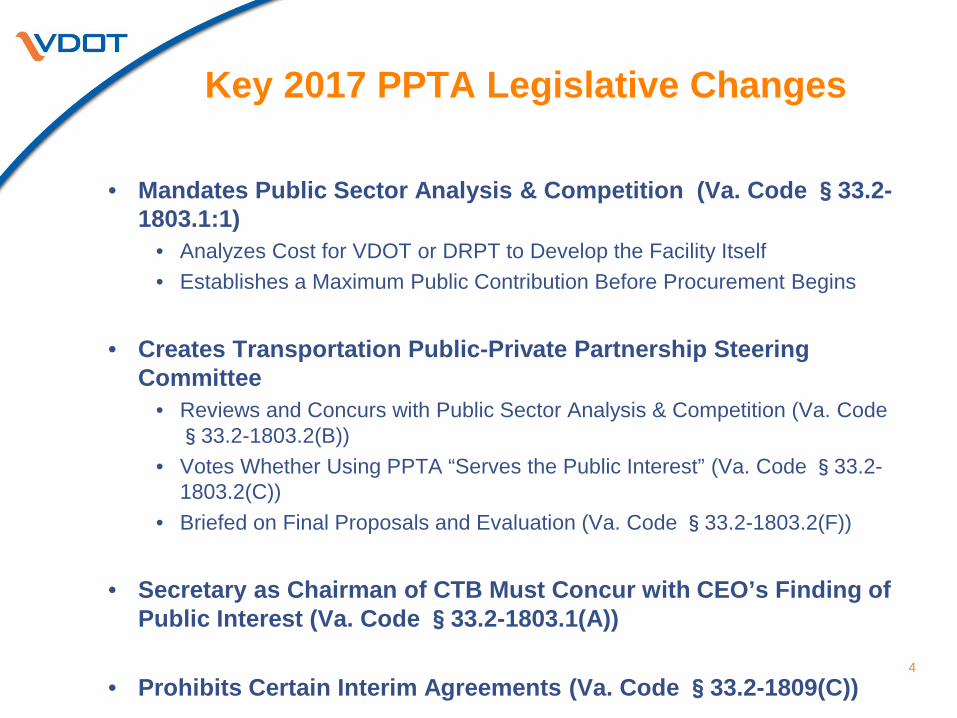
• Mandates Public Sector Analysis & Competition (Va. Code §33.2-1803.1:1)
• Analyzes Cost for VDOT or DRPT to Develop the Facility Itself • Establishes a Maximum Public Contribution Before Procurement Begins
• Creates Transportation Public-Private Partnership Steering Committee
• Reviews and Concurs with Public Sector Analysis & Competition (Va. Code §33.2-1803.2(B))
• Votes Whether Using PPTA “Serves the Public Interest” (Va. Code §33.2-1803.2(C))
• Briefed on Final Proposals and Evaluation (Va. Code §33.2-1803.2(F))
• Secretary as Chairman of CTB Must Concur with CEO’s Finding of Public Interest (Va. Code §33.2-1803.1(A))
• Prohibits Certain Interim Agreements (Va. Code §33.2-1809(C))
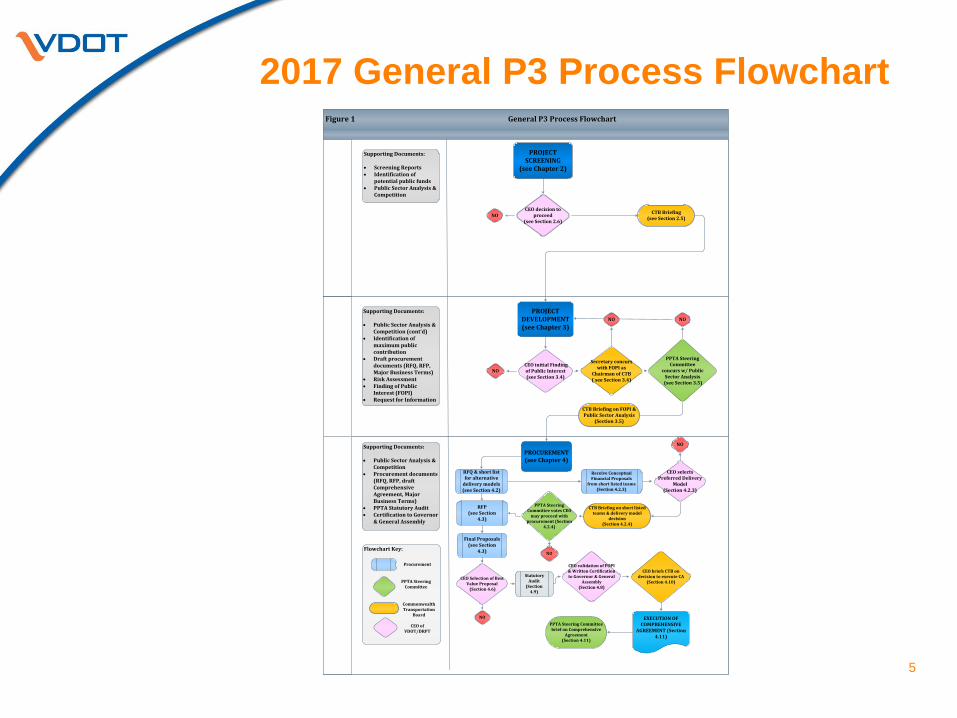
2017 General P3 Process Flowchart
5
Figure 1 General P3 Process Flowchart
PROJECT SCREENING
(see Chapter 2)
CEO decision to proceed
(see Section 2.6)
PROJECT DEVELOPMENT(see Chapter 3)
CTB Briefing (see Section 2.5)NO
CEO initial Finding of Public Interest (see Section 3.4)
PPTA Steering Committee
concurs w/ Public Sector Analysis
(see Section 3.5)
PROCUREMENT (see Chapter 4)
CEO Selection of Best Value Proposal
(Section 4.6)
Statutory Audit
(Section 4.9)
CEO validation of FOPI & Written Certification to Governor & General
Assembly (Section 4.8)
EXECUTION OF COMPREHENSIVE
AGREEMENT (Section 4.11)
CEO briefs CTB on decision to execute CA
(Section 4.10)
Secretary concurs with FOPI as
Chairman of CTB ( see Section 3.4)
NO
NO
Supporting Documents:
• Screening Reports• Identification of
potential public funds• Public Sector Analysis &
Competition
Supporting Documents:
• Public Sector Analysis & Competition (cont’d)
• Identification of maximum public contribution
• Draft procurement documents (RFQ, RFP, Major Business Terms)
• Risk Assessment• Finding of Public
Interest (FOPI)• Request for Information
Supporting Documents:
• Public Sector Analysis & Competition
• Procurement documents (RFQ, RFP, draft Comprehensive Agreement, Major Business Terms)
• PPTA Statutory Audit• Certification to Governor
& General Assembly
RFQ & short list for alternative
delivery models(see Section 4.2)
Receive Conceptual Financial Proposals
from short listed teams (Section 4.2.3)
CEO selects Preferred Delivery
Model (Section 4.2.3)
PPTA Steering Committee votes CEO
may proceed with procurement (Section
4.2.4)
Final Proposals (see Section
4.3)
NO
NO
NO
CTB Briefing on short listed teams & delivery model
decision (Section 4.2.4)
RFP(see Section
4.3)
PPTA Steering Committee brief on Comprehensive
Agreement(Section 4.11)
NO
CTB Briefing on FOPI & Public Sector Analysis
(Section 3.5)
Flowchart Key:
Procurement
PPTA Steering Committee
Commonwealth Transportation
Board
CEO of VDOT/DRPT
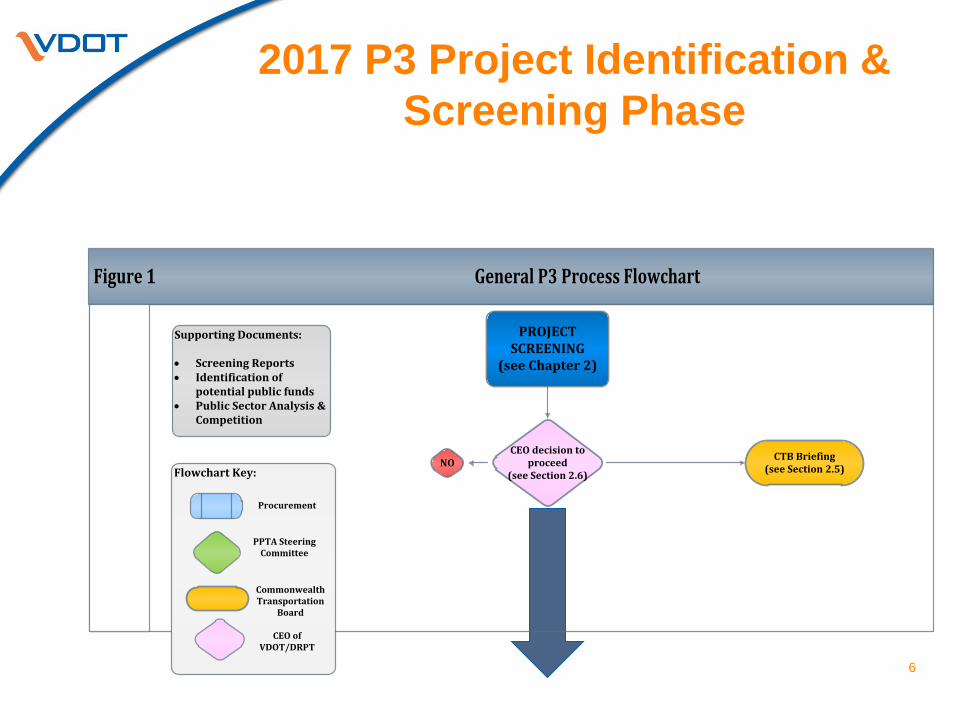
2017 P3 Project Identification & Screening Phase
6
Figure 1 General P3 Process Flowchart
PROJECT SCREENING
(see Chapter 2)
CEO decision to proceed
(see Section 2.6)
CTB Briefing (see Section 2.5)NO
Supporting Documents:
• Screening Reports• Identification of
potential public funds• Public Sector Analysis &
Competition
Flowchart Key:
Procurement
PPTA Steering Committee
Commonwealth Transportation
Board
CEO of VDOT/DRPT
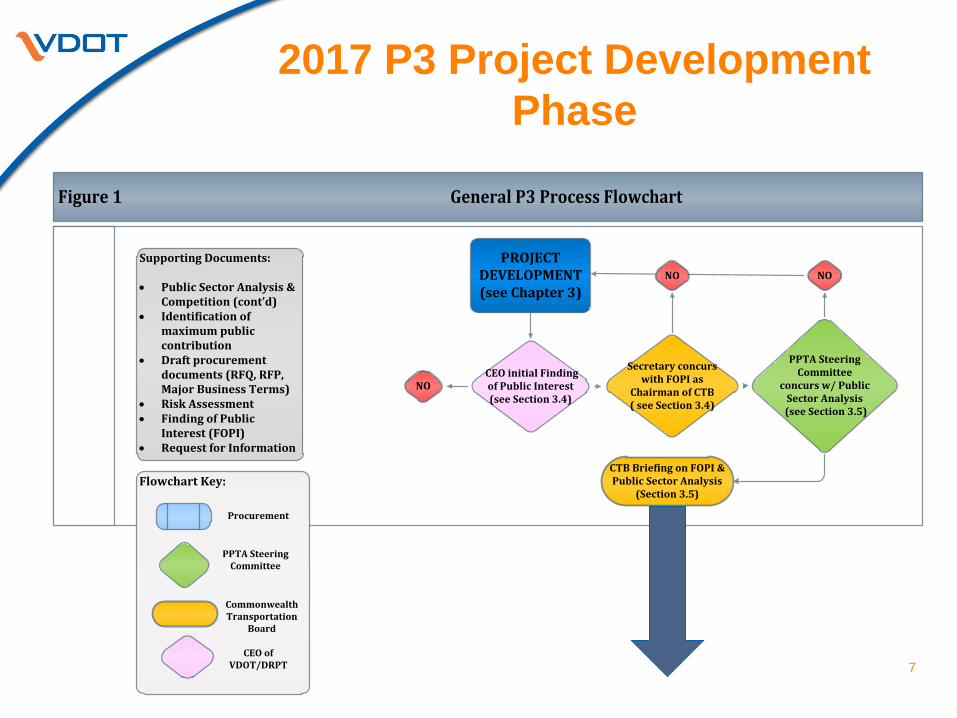
2017 P3 Project Development Phase
7
Figure 1 General P3 Process Flowchart
PROJECT DEVELOPMENT(see Chapter 3)
CEO initial Finding of Public Interest (see Section 3.4)
PPTA Steering Committee
concurs w/ Public Sector Analysis
(see Section 3.5)
Secretary concurs with FOPI as
Chairman of CTB ( see Section 3.4)
NO
Supporting Documents:
• Public Sector Analysis & Competition (cont’d)
• Identification of maximum public contribution
• Draft procurement documents (RFQ, RFP, Major Business Terms)
• Risk Assessment• Finding of Public
Interest (FOPI)• Request for Information
NONO
CTB Briefing on FOPI & Public Sector Analysis
(Section 3.5)Flowchart Key:
Procurement
PPTA Steering Committee
Commonwealth Transportation
Board
CEO of VDOT/DRPT
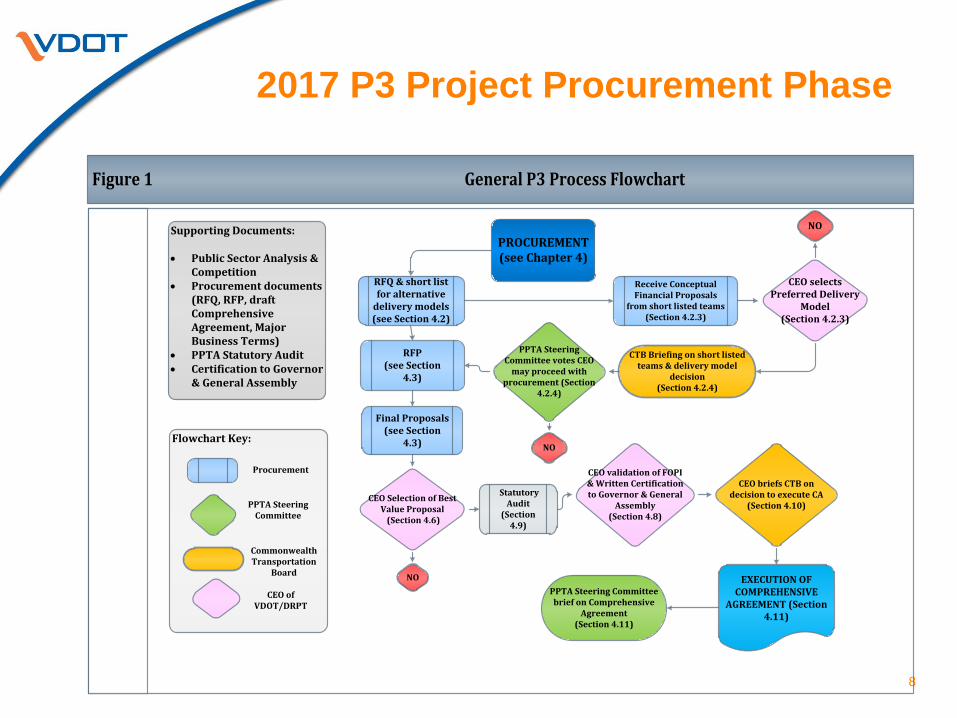
2017 P3 Project Procurement Phase
8
Figure 1 General P3 Process Flowchart
PROCUREMENT (see Chapter 4)
CEO Selection of Best Value Proposal
(Section 4.6)
Statutory Audit
(Section 4.9)
CEO validation of FOPI & Written Certification to Governor & General
Assembly (Section 4.8)
EXECUTION OF COMPREHENSIVE
AGREEMENT (Section 4.11)
CEO briefs CTB on decision to execute CA
(Section 4.10)
NO
Supporting Documents:
• Public Sector Analysis & Competition
• Procurement documents (RFQ, RFP, draft Comprehensive Agreement, Major Business Terms)
• PPTA Statutory Audit• Certification to Governor
& General Assembly
RFQ & short list for alternative
delivery models(see Section 4.2)
Receive Conceptual Financial Proposals
from short listed teams (Section 4.2.3)
CEO selects Preferred Delivery
Model (Section 4.2.3)
PPTA Steering Committee votes CEO
may proceed with procurement (Section
4.2.4)
Final Proposals (see Section
4.3)
NO
NO
CTB Briefing on short listed teams & delivery model
decision (Section 4.2.4)
RFP(see Section
4.3)
PPTA Steering Committee brief on Comprehensive
Agreement(Section 4.11)
Flowchart Key:
Procurement
PPTA Steering Committee
Commonwealth Transportation
Board
CEO of VDOT/DRPT
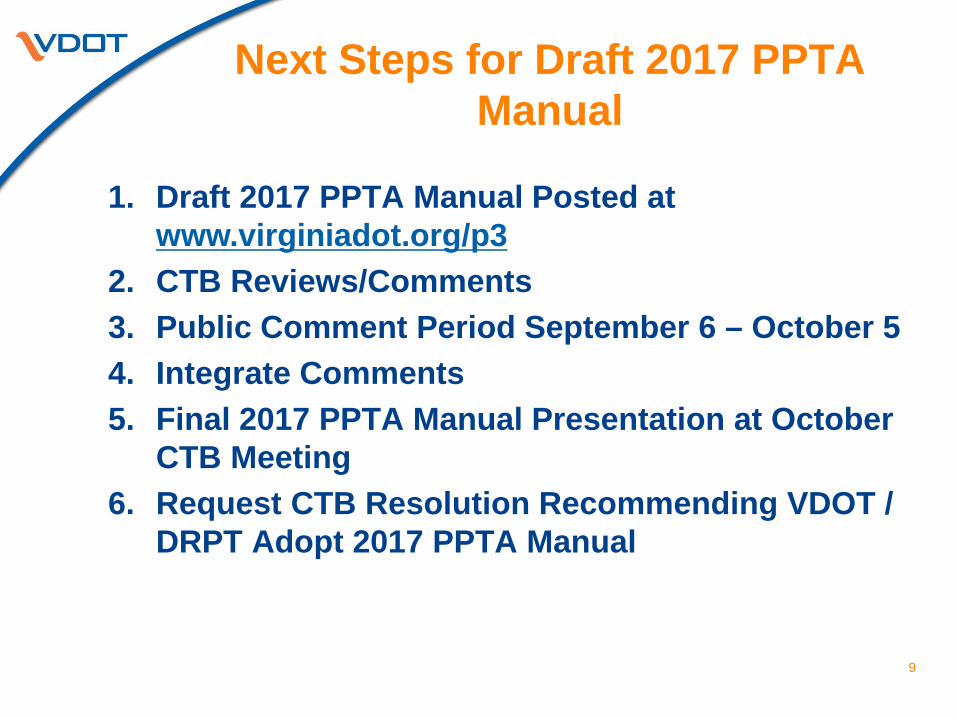
Next Steps for Draft 2017 PPTA Manual
9
1. Draft 2017 PPTA Manual Posted at www.virginiadot.org/p3
2. CTB Reviews/Comments 3. Public Comment Period September 6 – October 5 4. Integrate Comments 5. Final 2017 PPTA Manual Presentation at October
CTB Meeting 6. Request CTB Resolution Recommending VDOT /
DRPT Adopt 2017 PPTA Manual
Morteza Farajian, Ph.D. Director of P3 Office September 20, 2017
PPTA Implementation Manual & Guidelines
2017 Updates
I-64 Express Lanes – Proposed Toll Supported Transit Services
September 19, 2017
Jennifer DeBruhl Chief of Public Transportation
Status of Prior Investments in Transit
Toll Revenue Funded Elizabeth River Service (Source: HRT) 3 bus routes and ferry are partially funded through toll revenues Toll revenues support up to 40% of operating expenses for these services
(depending on route) 1.2 million total boardings on toll revenue supported service in FY16
FY18 boardings expected to increase due to the redevelopment of the Waterside District in Norfolk
2
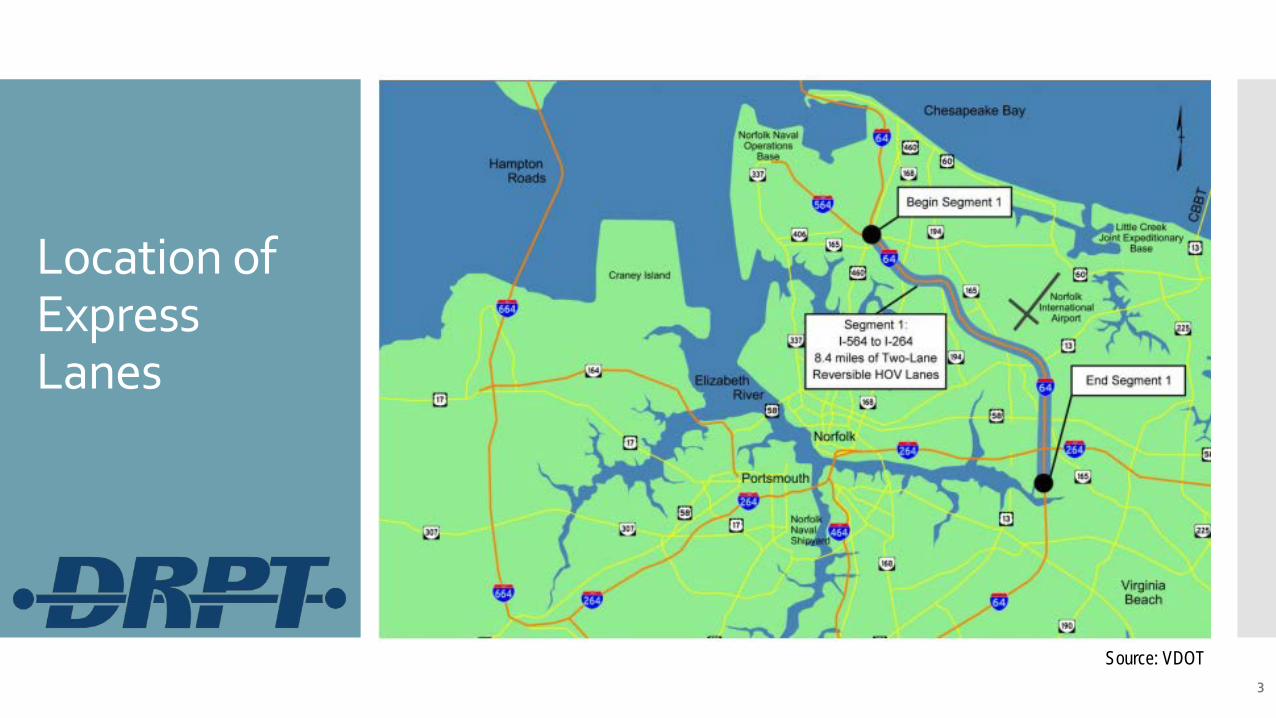
Location of Express Lanes
3
Source: VDOT
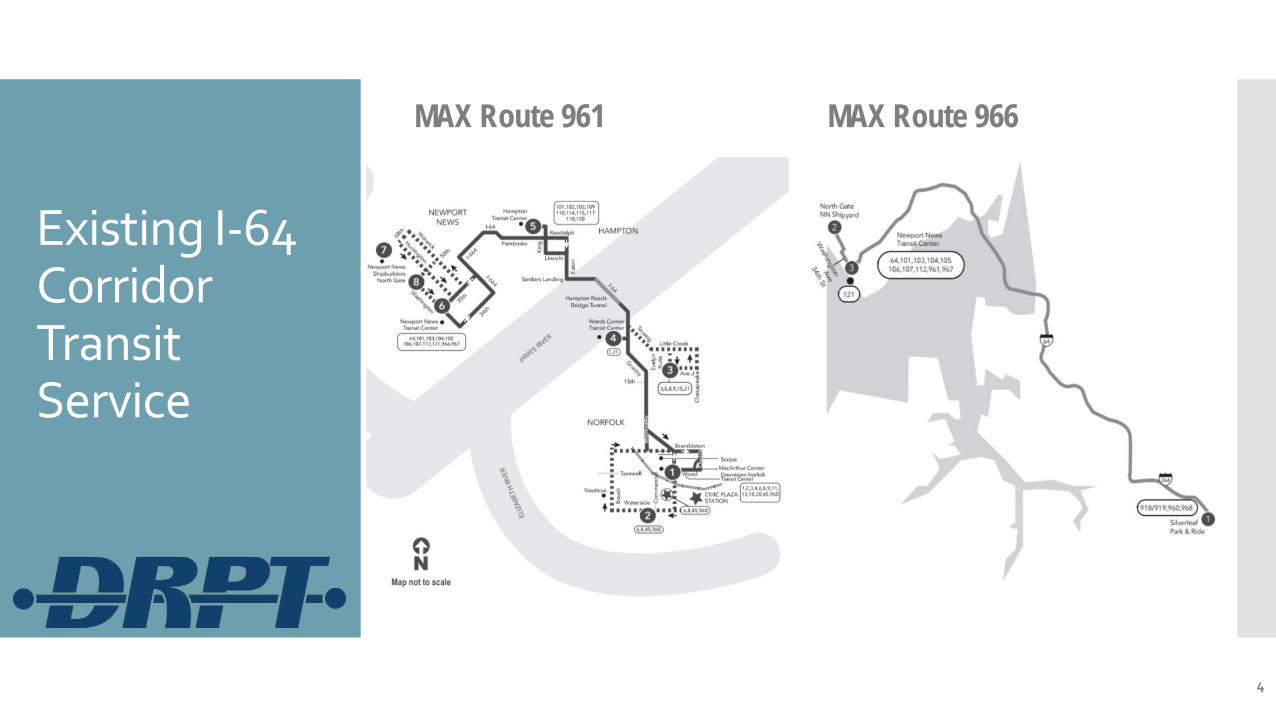
Existing I-64 Corridor Transit Service
4
MAX Route 961 MAX Route 966
Availability of toll revenues would increase transit service in the corridor Increase peak hour frequency on MAX Route 961
by reducing peak hour headways from 60 to 30 minutes – 4 additional trips daily Add an additional peak period trip to MAX Route
966 which currently is only one trip per direction per peak period – 4 additional trips daily
Toll-supported service would be operated only during the HOT hours
Proposed Improvements to Transit in the I-64 Corridor
5
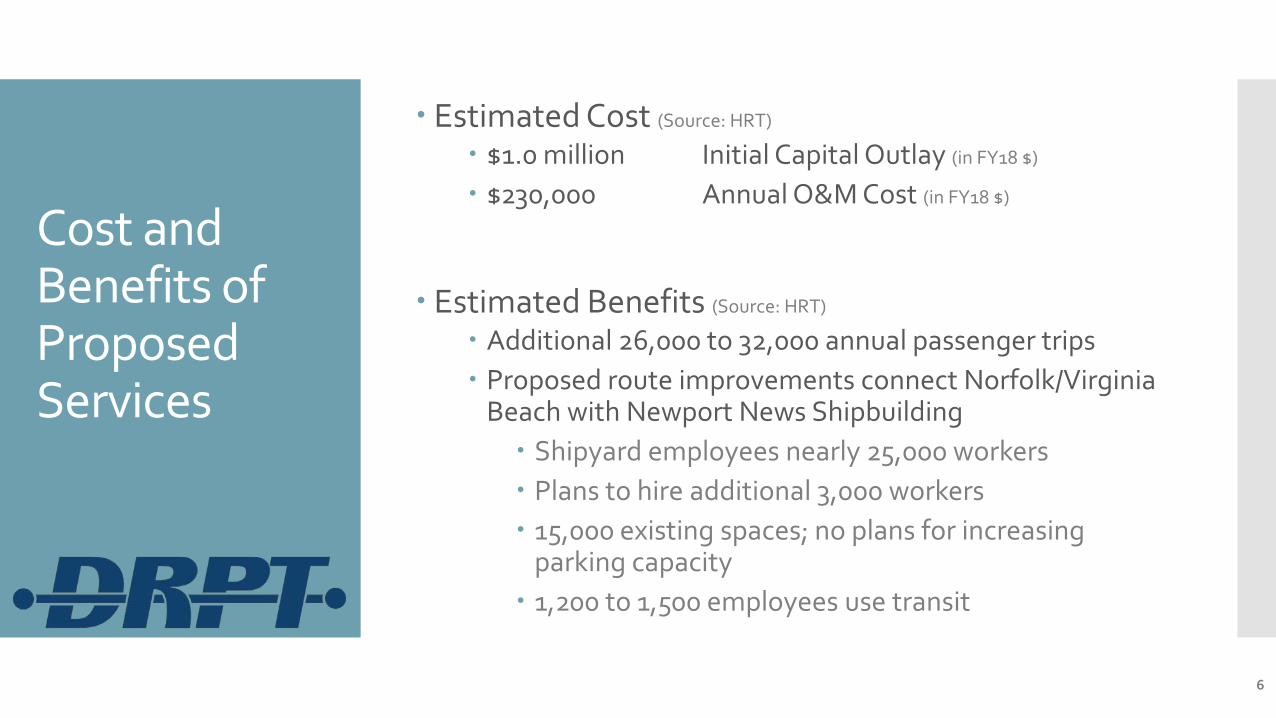
Cost and Benefits of Proposed Services
Estimated Cost (Source: HRT)
$1.0 million Initial Capital Outlay (in FY18 $)
$230,000 Annual O&M Cost (in FY18 $)
Estimated Benefits (Source: HRT)
Additional 26,000 to 32,000 annual passenger trips Proposed route improvements connect Norfolk/Virginia
Beach with Newport News Shipbuilding Shipyard employees nearly 25,000 workers Plans to hire additional 3,000 workers 15,000 existing spaces; no plans for increasing
parking capacity 1,200 to 1,500 employees use transit
6
I-64 Express Lanes – Proposed Toll Supported Transit Services
September 19, 2017

Update on Vanpool!VA Implementation
September 19, 2017
Jennifer DeBruhl Chief of Public Transportation
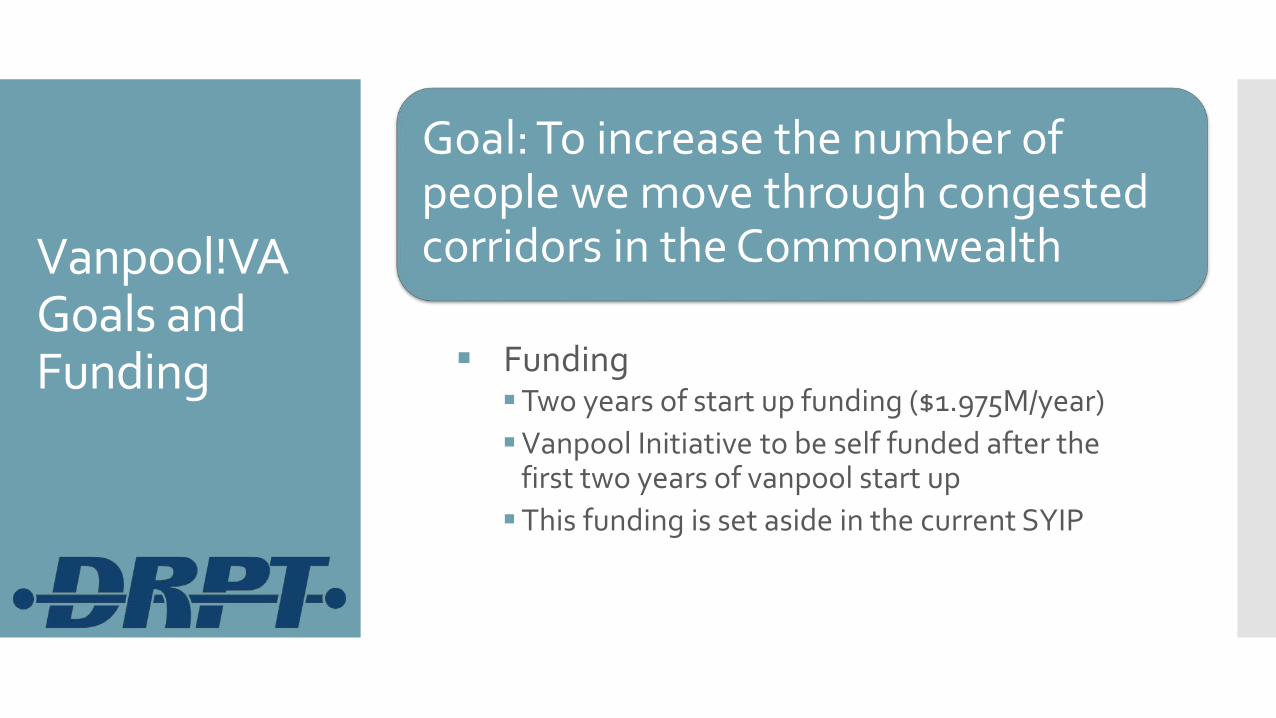
Vanpool!VA Goals and Funding Funding
Two years of start up funding ($1.975M/year) Vanpool Initiative to be self funded after the
first two years of vanpool start up This funding is set aside in the current SYIP
Goal: To increase the number of people we move through congested corridors in the Commonwealth
Vanpool!VA Components
Expand/Increase vanpool subsidy
Statewide vanpool brand
Improved ride matching
Request for $1.4M to support expansion of their Vanpool Alliance program (2 year pilot) Increase stipend for new vanpools from $200 to
$400/month Must have 75% new riders to qualify
PRTC will report vanpool data to FTA, which will increase 5307 allocation after 2 years Future 5307 funds will be used to maintain program Goal is to increase person throughput in congested
corridors and take advantage of express lanes
Vanpool Alliance (PRTC) Request
9/15/2017 4
Conversion of existing transportation demand management grant with Hampton Roads Transit
Development of agreement with Roanoke Valley – Alleghany Regional Commission to support development of statewide ridematching tools
Other Vanpool!VA Activities Underway
9/15/2017 5
Continued outreach and coordination to implement program – regional commuter assistance agencies and vanpool operators
Development of statewide branding and marketing tools to support implementation
Development/implementation of tools to streamline data reporting/data quality to ensure return on investment
Next Steps
9/15/2017 6
Update on Vanpool!VA Implementation
September 19, 2017
Jennifer DeBruhl Chief of Public Transportation
Rail Industrial Access Program Application Briefing
Steel Dynamics Roanoke Bar Division Roanoke, Virginia
Jeremy Latimer Rail Transportation Programs Administrator
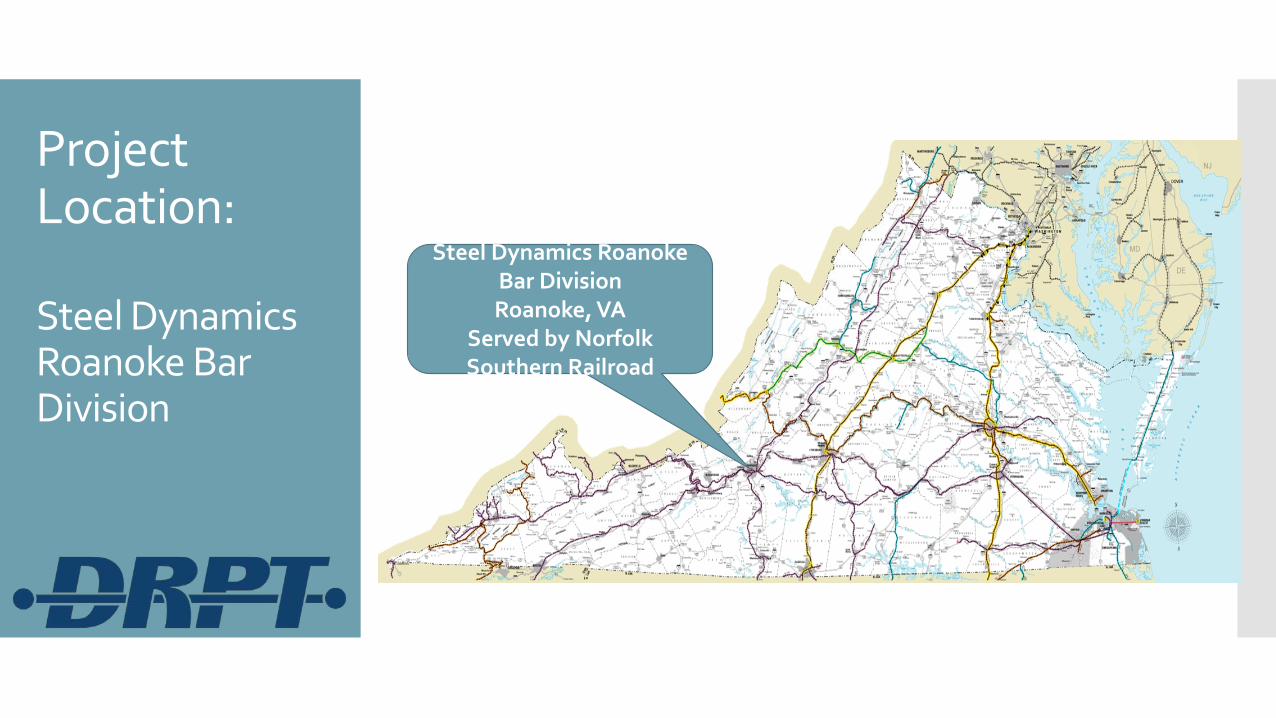
Project Location: Steel Dynamics Roanoke Bar Division
2
Steel Dynamics Roanoke Bar Division Roanoke, VA
Served by Norfolk Southern Railroad
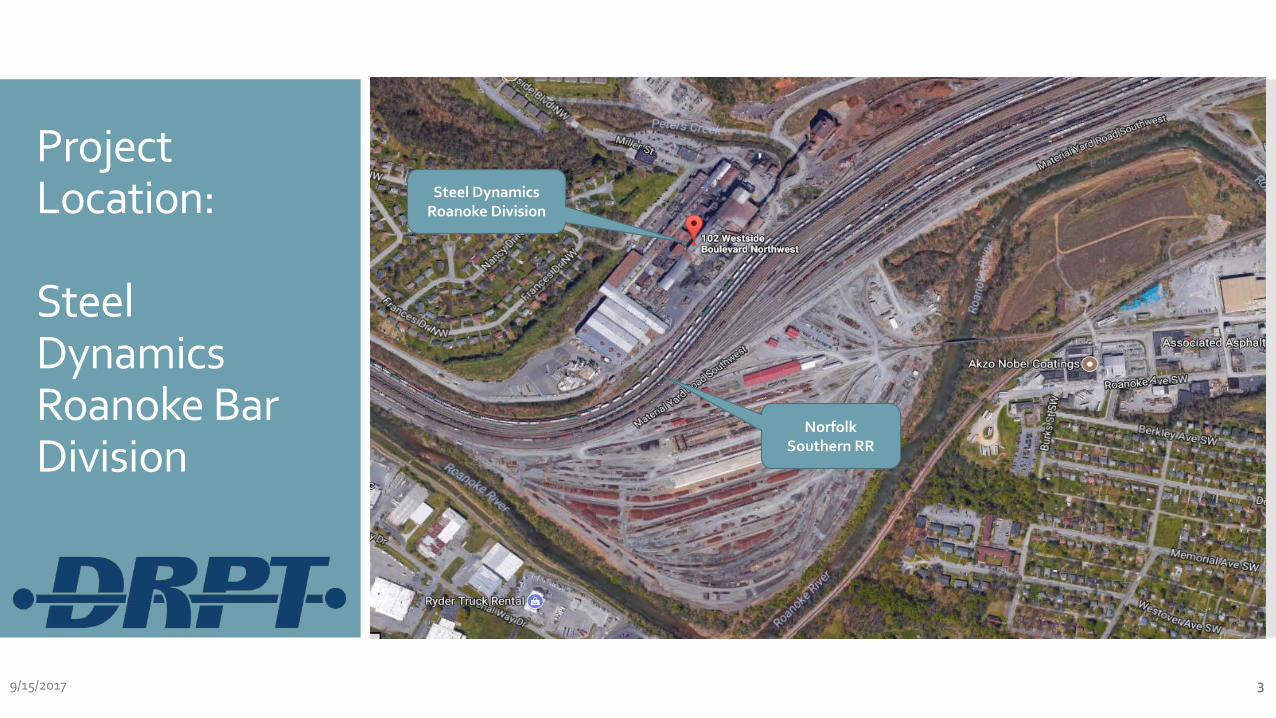
Project Location: Steel Dynamics Roanoke Bar Division
3 9/15/2017
Steel Dynamics Roanoke Division
Norfolk Southern RR
Project Summary
4 9/15/2017
• Steel Dynamics Roanoke Bar Division is headquartered in Roanoke, Virginia and part of Steel Dynamics, Inc. – one of the largest domestic steel producers and recyclers in the United States.
• Steel Dynamics is planning a $28M expansion of an existing melt facility to serve a growing rebar market.
• This expansion requires additional rail capacity to ship rebar to industries and service centers located across the United States, Canada and Mexico; and to ports in Alabama and North Carolina for shipments to South America.
• Rail traffic is expected to increase 1,988 railcars within the first year of operation which is a 40% increase.
Project Summary
5 9/15/2017
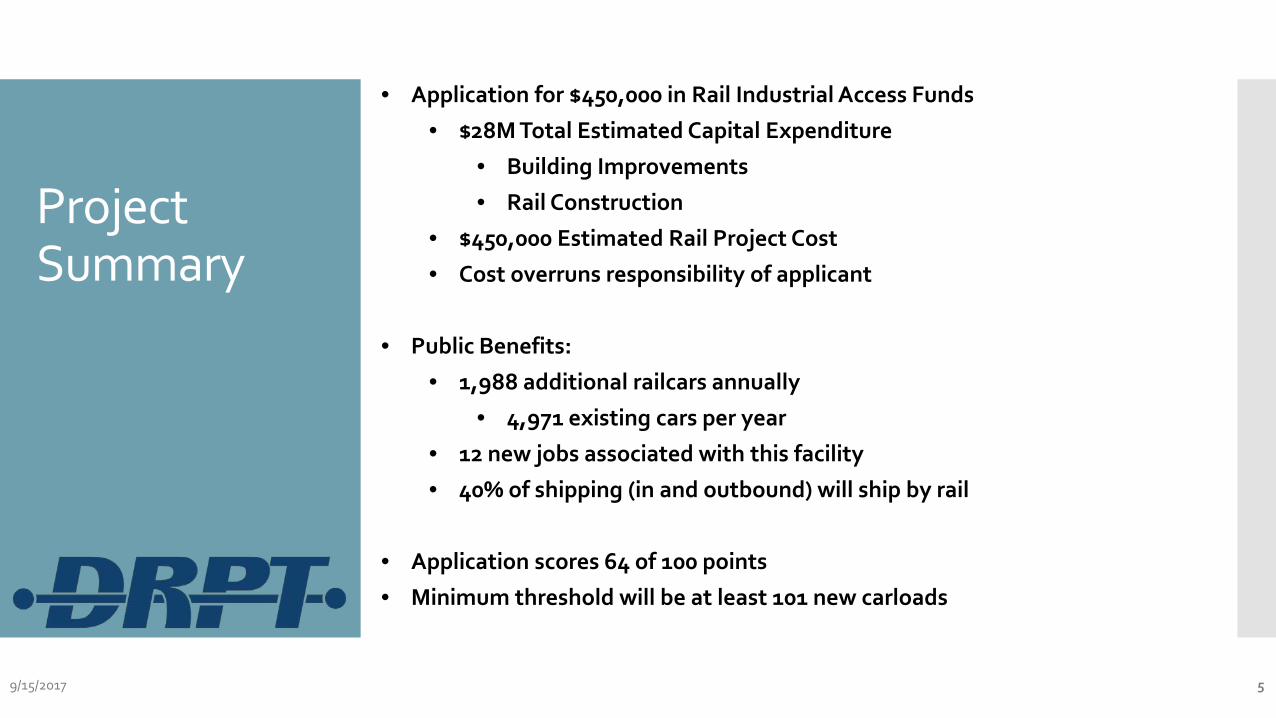
• Application for $450,000 in Rail Industrial Access Funds
• $28M Total Estimated Capital Expenditure
• Building Improvements
• Rail Construction
• $450,000 Estimated Rail Project Cost
• Cost overruns responsibility of applicant
• Public Benefits:
• 1,988 additional railcars annually
• 4,971 existing cars per year
• 12 new jobs associated with this facility
• 40% of shipping (in and outbound) will ship by rail
• Application scores 64 of 100 points
• Minimum threshold will be at least 101 new carloads
Questions?
Date 6
Jeremy Latimer
www.drpt.virginia.gov 804-786-4440
CTB Workshop | September 2017 Quintin D. Elliott | Chief Deputy Commissioner
VDOT Roadway Lighting
Energy Performance Contract
Background
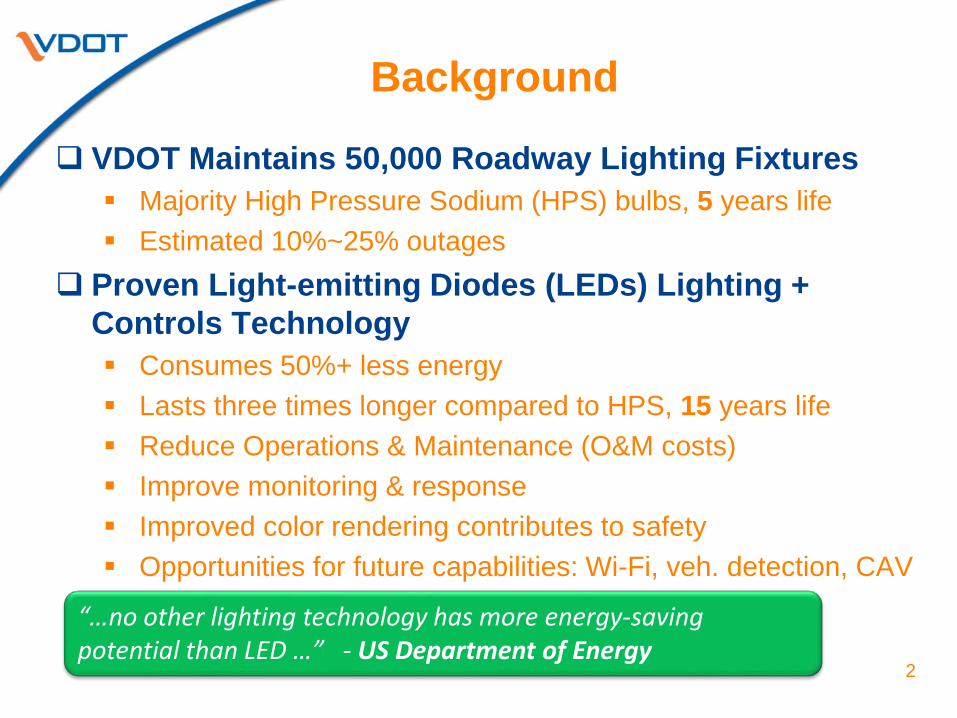
VDOT Maintains 50,000 Roadway Lighting Fixtures Majority High Pressure Sodium (HPS) bulbs, 5 years life Estimated 10%~25% outages
Proven Light-emitting Diodes (LEDs) Lighting + Controls Technology Consumes 50%+ less energy Lasts three times longer compared to HPS, 15 years life Reduce Operations & Maintenance (O&M costs) Improve monitoring & response Improved color rendering contributes to safety Opportunities for future capabilities: Wi-Fi, veh. detection, CAV
2
“…no other lighting technology has more energy-saving potential than LED …” - US Department of Energy
LED Policy Guidance
3
Governor and General Assembly LED Mandates Executive Order 31 (issued October 2014)
2017 Appropriation Act, Chapter 836 Item 80(H)
LED luminaires on all future exterior lighting projects Highway roadway lighting Parking lots (District/Residency/Area HQs, Park & Rides,
Rest Areas, DMV Weigh Stations) Guide sign lighting Underbridges and tunnels
Replace existing lights through attrition & stand-alone projects
Evaluate Energy Performance Contract in Fredericksburg, Richmond & Hampton Roads Districts
4
VDOT LED Strategic Migration Program
Energy Performance Contract (EPC): Energy-savings improvements financed with an available
line of credit secured by future energy savings Energy Service Contractor (ESCO): Pre-approved design-build general contractor; combines
a diagnostic front end & a guaranteed-savings back end ESCO Services: Develop package of feasible energy cost-reduction
measures Annually track & report future energy consumption to
DMME Provide guaranty; ESCO compensates agency if energy
savings fall short
How EPC/ESCO Works
5
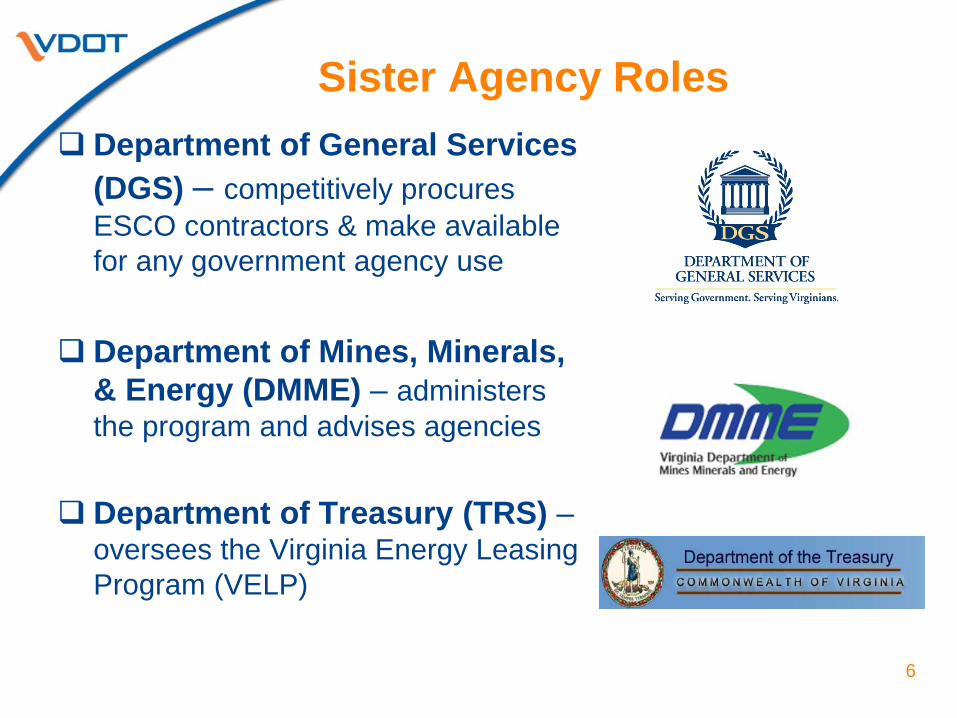
Department of General Services (DGS) – competitively procures ESCO contractors & make available for any government agency use
Department of Mines, Minerals, & Energy (DMME) – administers the program and advises agencies
Department of Treasury (TRS) –
oversees the Virginia Energy Leasing Program (VELP) 6
Sister Agency Roles
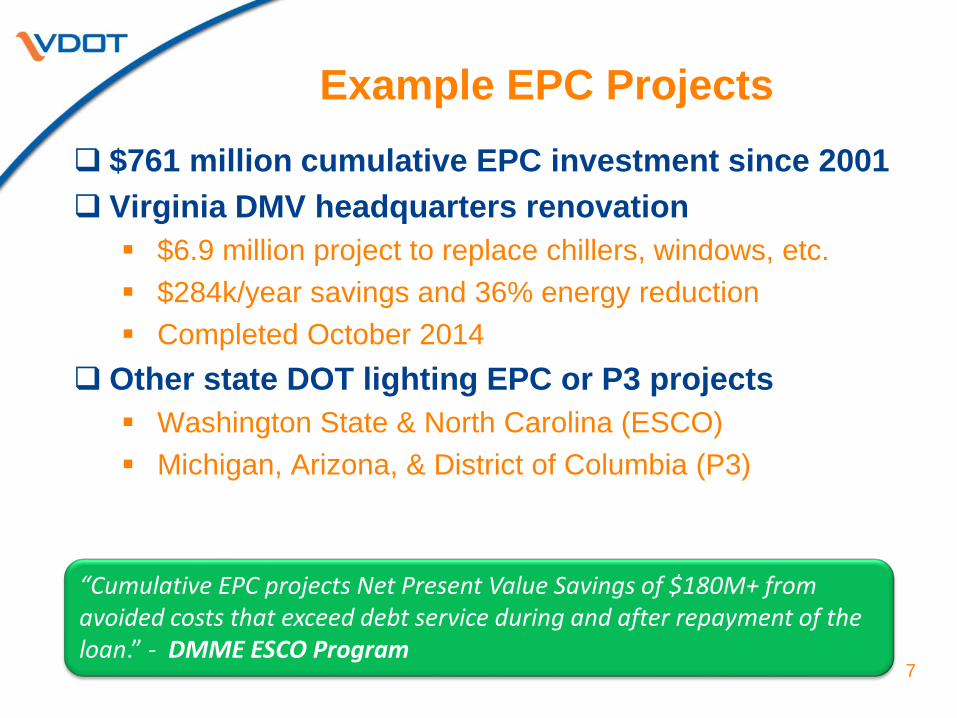
$761 million cumulative EPC investment since 2001 Virginia DMV headquarters renovation $6.9 million project to replace chillers, windows, etc. $284k/year savings and 36% energy reduction Completed October 2014
Other state DOT lighting EPC or P3 projects Washington State & North Carolina (ESCO) Michigan, Arizona, & District of Columbia (P3)
7
Example EPC Projects
“Cumulative EPC projects Net Present Value Savings of $180M+ from avoided costs that exceed debt service during and after repayment of the loan.” - DMME ESCO Program
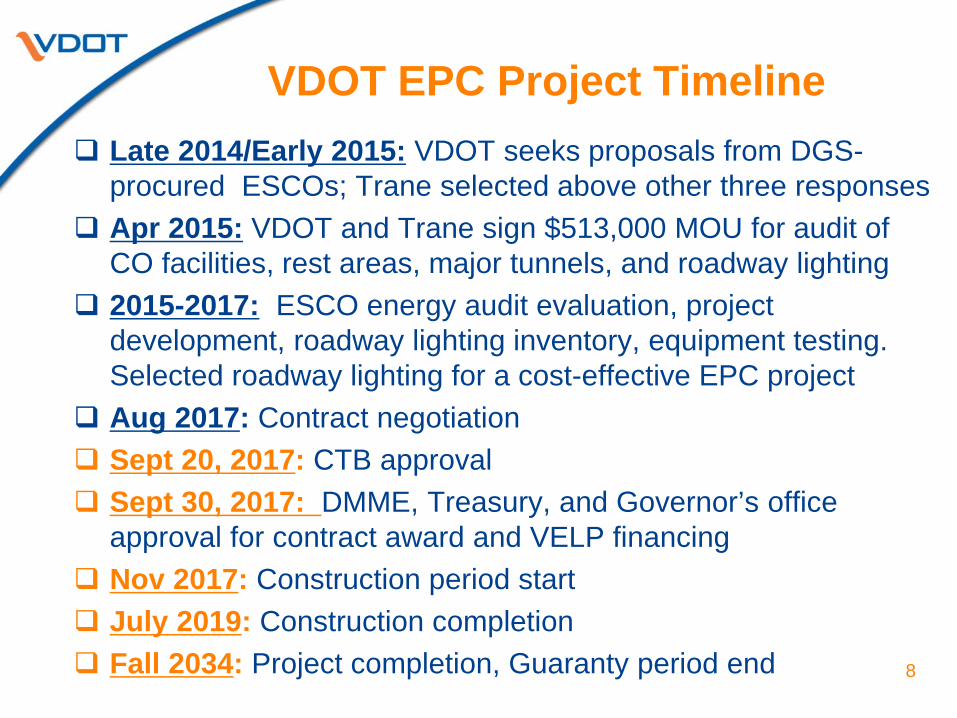
Late 2014/Early 2015: VDOT seeks proposals from DGS-procured ESCOs; Trane selected above other three responses
Apr 2015: VDOT and Trane sign $513,000 MOU for audit of CO facilities, rest areas, major tunnels, and roadway lighting
2015-2017: ESCO energy audit evaluation, project development, roadway lighting inventory, equipment testing. Selected roadway lighting for a cost-effective EPC project
Aug 2017: Contract negotiation Sept 20, 2017: CTB approval Sept 30, 2017: DMME, Treasury, and Governor’s office
approval for contract award and VELP financing Nov 2017: Construction period start July 2019: Construction completion Fall 2034: Project completion, Guaranty period end
8
VDOT EPC Project Timeline
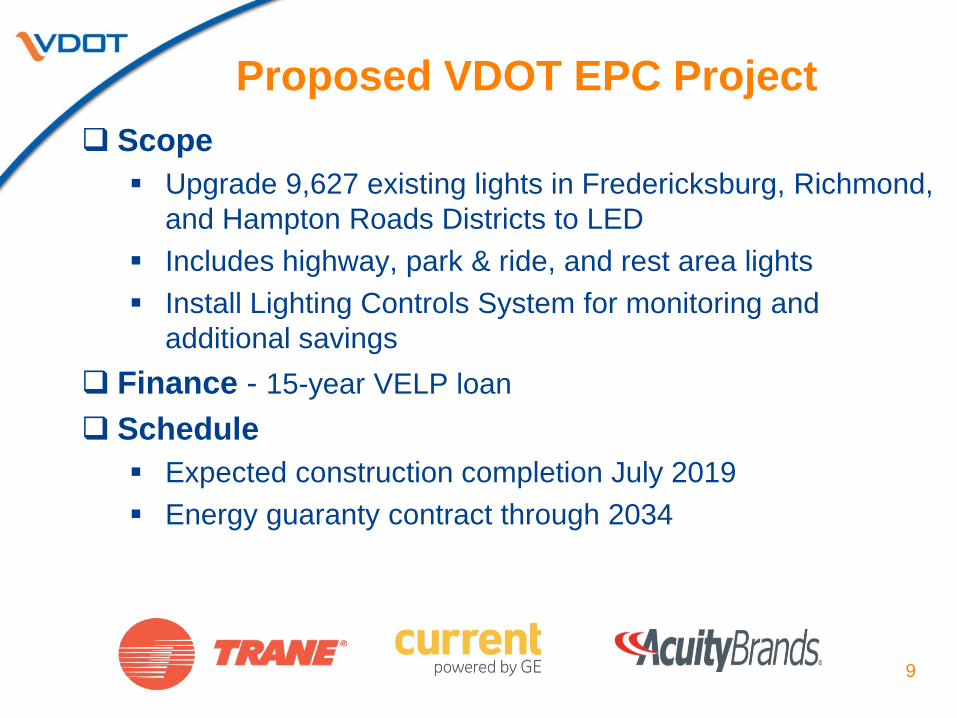
Scope Upgrade 9,627 existing lights in Fredericksburg, Richmond,
and Hampton Roads Districts to LED Includes highway, park & ride, and rest area lights Install Lighting Controls System for monitoring and
additional savings Finance - 15-year VELP loan Schedule Expected construction completion July 2019 Energy guaranty contract through 2034
9
Proposed VDOT EPC Project
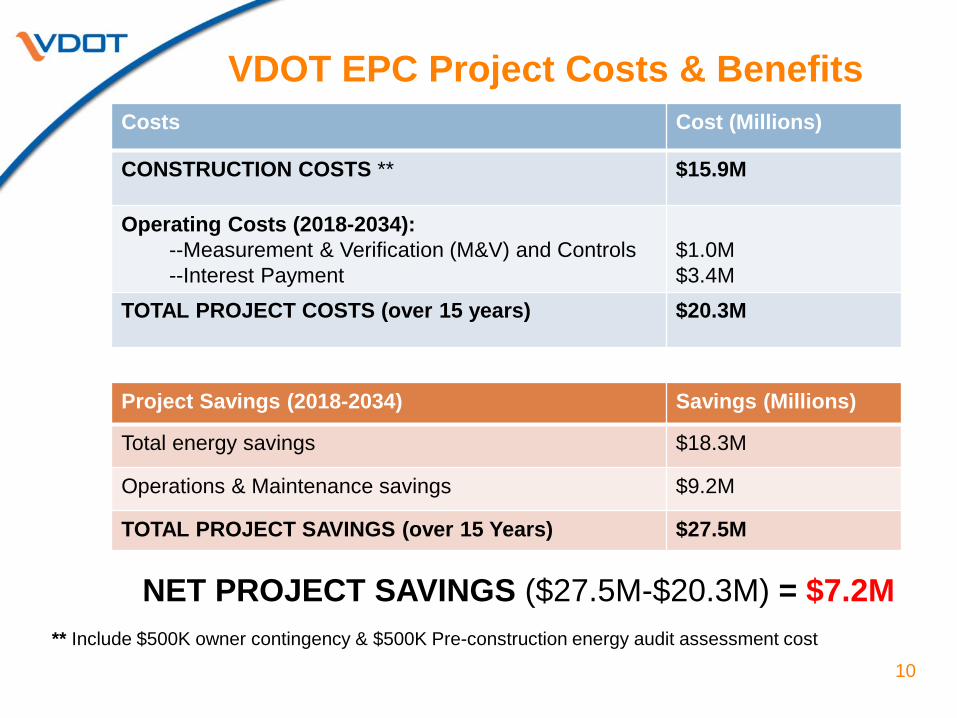
VDOT EPC Project Costs & Benefits Costs Cost (Millions)
CONSTRUCTION COSTS ** $15.9M
Operating Costs (2018-2034): --Measurement & Verification (M&V) and Controls --Interest Payment
$1.0M $3.4M
TOTAL PROJECT COSTS (over 15 years) $20.3M
** Include $500K owner contingency & $500K Pre-construction energy audit assessment cost
Project Savings (2018-2034) Savings (Millions)
Total energy savings $18.3M
Operations & Maintenance savings $9.2M
TOTAL PROJECT SAVINGS (over 15 Years) $27.5M
NET PROJECT SAVINGS ($27.5M-$20.3M) = $7.2M
10