Embed Size (px)
Citation preview

E. Christopher Abruzzo Tom Corbett
Acting Secretary Governor
Commonwealth of Pennsylvania
PROPOSED
VOLUME II: Technical Support Document
State Implementation Plan Revision: NOX Motor Vehicle Emission Budget Revisions Based on the MOVES2010a Model; and General Conformity
Budget for Bell Bend Nuclear Power Plant
Scranton/Wilkes-Barre Eight-Hour Ozone Maintenance Area
October 2013
Bureau of Air Quality Pennsylvania Department of Environmental Protection
P.O. Box 8468 Harrisburg, PA 17105-8468
717-787-9495

[This page intentionally left blank.]

i
Contents Introduction 1
Point Source Category Emissions 1 2009 Point Source Category Emissions .................................................................................... 2 2018 Point Source Category Emissions .................................................................................... 8
Area Source Category Emissions 14 2009 Area Source Category Emissions................................................................................... 15 2018 Area Source Category Emissions................................................................................... 16
Marcellus Shale Emissions 21 Drilling Activity ...................................................................................................................... 21 Compressor Station Engine Activity ...................................................................................... 23
Nonroad Source Category Emissions 26 Bell Bend Nuclear Power Plant Emissions Budget for General Conformity ......................... 27
Highway Source Category Emissions 28

ii
Tables Table 1: Point Source Emissions for 2009 - SIP Estimated versus Actual 2 Table 2: Actual 2009 Annual NOX and VOC Point Source Inventory for the Scranton/Wilkes-
Barre Ozone Maintenance Area by Facility Source 3 Table 3: Scranton/Wilkes-Barre Ozone Maintenance Plan Emission Estimates of Point Sources
for 2018 9 Table 4: Revised Scranton/Wilkes-Barre Ozone Maintenance Plan Emissions Estimates of
Point Sources for 2018 (Derived from MARAMA 2007 Baseline and 2020 Projected Inventories) 10
Table 5: MARAMA 2007 Annual Baseline and 2018 Projected NOX Point Source Inventories
for the Scranton/Wilkes-Barre Ozone Maintenance Area by Facility Source 10 Table 6: Revised Socioeconomic Data for the Scranton/Wilkes-Barre Ozone Maintenance
Area Relative to Projected Growth in the Scranton/Wilkes-Barre Area Maintenance Plan (2002-2009) 15
Table 7: Revised Socioeconomic Data for the Scranton/Wilkes-Barre Ozone Maintenance
Area Relative to the Projected Growth in the Scranton/Wilkes-Barre Area Maintenance Plan (2009-2018) 17
Table 7a: Lackawanna County Portion of the Scranton/Wilkes-Barre Ozone
Maintenance Area 17 Table 7b: Luzerne County Portion of the Scranton/Wilkes-Barre Ozone Maintenance
Area 18 Table 7c: Monroe County Portion of the Scranton/Wilkes-Barre Ozone Maintenance
Area 19 Table 7d: Wyoming County Portion of the Scranton/Wilkes-Barre Ozone
Maintenance Area 20 Table 8: 2011 Reported Emissions Due to Marcellus Shale Drilling Activity in the
Scranton/Wilkes-Barre Area 22 Table 9: 2018 Emissions for Drilling Activity in the Scranton/Wilkes-Barre Area 22

iii
Table 10: 2012 NOX Emissions of Permitted Compressor Engines Used for Marcellus Shale Natural Gas in the Scranton/Wilkes-Barre Area 23
Table 11: Projected 2018 NOX Emissions from Compressor Engines Used for Marcellus Shale
Natural Gas in the Scranton/Wilkes-Barre Area 24 Table 12: 2013 Daily Emissions and 2018 Daily Projected Emissions from Marcellus Shale
Compressor Engine Activity in the Scranton/Wilkes-Barre Area 25 Table 13: NOX Emissions Related to Marcellus Shale Activity in the Scranton/Wilkes-Barre
Area 26 Table 14: Revised Motor Vehicle Emissions Using MOVES2010a Compared to Mobile 6.2 (Tons/Day) 29

iv
[This page intentionally left blank.]

- 1 -
Introduction This Technical Support Document provides detailed information on the categories of point, area, nonroad, and highway sources of oxides of nitrogen (NOX) estimates and assumptions. Data shown in this document were used in the EPA-approved State Implementation Plan Revision: Maintenance Plan and Base Year Inventory – Scranton/Wilkes-Barre Eight-Hour Ozone Nonattainment Area, which is hereafter referred to as the Scranton/Wilkes-Barre Ozone Maintenance Plan. That data, along with other data and assumptions outlined in this Technical Support Document, are also used in the proposed State Implementation Plan (SIP) revision to the Scranton/Wilkes-Barre Ozone Maintenance Plan accompanying this document, entitled, “State Implementation Plan Revision: NOX and VOC Motor Vehicle Emission Budget Revisions Based on the MOVES2010a Model; and General Conformity Budget for Bell Bend Nuclear Power Plant – Scranton/Wilkes-Barre Eight-Hour Ozone Maintenance Area for the 1997 Ozone National Ambient Air Quality Standards”, which is hereafter referred to as the Scranton/Wilkes-Barre Ozone Maintenance Plan revision. The Scranton/Wilkes-Barre Ozone Maintenance Plan revision demonstrates that replacing highway emissions estimates using the MOVES Model instead of the Mobile6 Model to generate emissions estimates will not cause emissions from all sources in the maintenance year to exceed all emissions in the attainment year. This Technical Support Document will describe how emission estimates and emission growth rates that were used in both the Scranton/Wilkes-Barre Ozone Maintenance Plan and the Scranton/Wilkes-Barre Ozone Maintenance Plan revision were developed for all source categories (point, area, nonroad, and highway).
Point Source Category Emissions Point source emissions include emissions from large commercial, institutional, and industrial facilities, such as chemical manufacturing facilities, large waste disposal sites, and large heating and electric generating units (EGUs). Emission projections used in the Scranton/Wilkes-Barre Ozone Maintenance Plan were prepared for the point source sector for 11 states, including Pennsylvania, and the District of Columbia, for the Mid-Atlantic Regional Air Management Association (MARAMA) by MACTEC Federal Programs, Inc. Future year projections were developed by MACTEC so that states could use the projections as inventories in their SIPs. Estimates were prepared for years 2009 and 2018, and took into consideration both growth in economic activity and additional controls. For the purpose of projecting emissions into the future for all of the states’ ozone maintenance plans, the point source inventory of emissions is divided into two subsectors – the EGU sector and the non-EGU sector. Different projection methods were used for those two sectors. The Scranton/Wilkes-Barre Area has a few EGU emission sources. For the EGU sector, the Mid-Atlantic/Northeast Visibility Union (MANE-VU) effort used the Integrating Planning Model (IPM) to project future electric generation, as well as to calculate the impact of control programs on future emission levels. The Scranton/Wilkes-Barre Area also contains many non-EGU point sources. For the non-EGU sector, growth factors were developed by using The United States Environmental Protection Agency’s (EPA) Economic Growth Analysis System (EGAS) Version 5.0. U.S. Department of Energy fuel consumption forecasts were used to replace default values for combustion sources in EGAS 5.0. Also, state-supplied population, employment, and other

- 2 -
emission projection data were used if either EGAS 5.0 values did not exist or if the state-supplied data was deemed better than values given by EGAS 5.0. 2009 Point Source Category Emissions Table 1 gives totals of NOX emissions for both 2009 projected emissions in the Scranton/Wilkes-Barre Ozone Maintenance Plan and the actual 2009 Scranton/Wilkes-Barre Area emissions reported to the Department after the Scranton/Wilkes-Barre Ozone Maintenance Plan was developed.1 Table 1 demonstrates that point source emissions in the Scranton/Wilkes-Barre Ozone Maintenance Plan for 2009 were overestimated for NOX. Table 2 lists the actual 2009 NOX emissions from the individual facilities in the Scranton/Wilkes-Barre Area. The annual emissions were divided by 365 days in a year to obtain daily emissions. The reason why actual NOX emissions are as close to the emissions in the Scranton/Wilkes-Barre Area Maintenance Plan is because emission reduction credits generated by several facilities in the Scranton/Wilkes-Barre Area were not included in the maintenance plan. Emission reduction credits were included as line items in the emissions inventory (see Tables 2 and 5) for these emissions.
Table 1: Point Source Emissions for 2009 - SIP Estimated versus Actual
Emissions for 2009 NOX (tons/day)
Emissions Estimated in Maintenance Plan
9.4
Actual Emissions (actual reported annual emissions in Table 2 divided by 365 days)
7.7
1 Air Information Management System Submittal, Pennsylvania Department of Environmental Protection, 2009

- 3 -
Table 2: Actual 2009 Annual NOX and VOC Point Source Inventory for the Scranton/Wilkes-Barre Ozone Maintenance Area by Facility Source
EPA AFS Number
Facility Name NOX (tons per
year)
420690010 SCRANTON ARMY AMMUNITION PLANT
0.0
420690010 GENERAL DYN OTS INC/SCRANTON
12.6
420690022 PEI POWER CORP/ARCHBALD
22.1
420690023 MACTAC INC/SCRANTON FAC
3.1
420690029 GENTEX CORP/SIMPSON PROT CLOTHING
4.0
420690032 CASCADES TISSUE GRP PA INC/RANSOM PLT
24.1
420690041 COMMUNITY MEDICAL CTR/SCRANTON FACILITY
4.2
420690092 MOSES TAYLOR HOSP/SCRANTON
3.0
420690096 SANDVIK MATERIALS TECHNOLOGY/ SCOTT TWP
45.9
420690101 PANEL PRINTS INC/OLD FORGE
0.5
420690125 QUADRANT EPP LAUREL LINE MFG/SCRANTON
2.1
420690201 ENV & RECYCLING SVC AMITY LDFL/TAYLOR
2.0
420690205 PA DPW/CLARKS SUMMIT STATE HOSP
12.2

- 4 -
EPA AFS Number
Facility Name NOX (tons per
year)
420690214 HAINES & KIBBLEHOUSE/DUNMORE MATERIALS
2.0
420690215 METKOTE LAMINATED PROD/TAYLOR PLT
0.0
420690217 GENTEX OPTICS INC/SIMPSON NIGHTVISION
0.0
420690533 ALLIANCE SANI LANDFILL INC/TAYLOR LDFL
42.8
420690676 EUREKA STONE QUARRY/DALEVILLE
1.6
420690678 CINRAM MFG LLC/OLYPHANT ----
Emission Reduction Credits
CINRAM MFG LLC
----
420690686 METSO PAPER USA INC/CLARKS SUMMIT SVC CTR ----
420690722 KEYSTONE SANI LDFL INC/DUNMORE
6.5
420690765 REG HOSP OF SCRANTON/SCRANTON
4.7
420692039 SHAW ENV & INFRASTRUCTURE INC/THROOP
30.7
420692115 QUADRANT EPP KEYSER VLY MFG/ SCRANTON
2.1
420790001 ALLEGHENY ENERGY SUPPLY CO/HUNLOCK 4
3.4
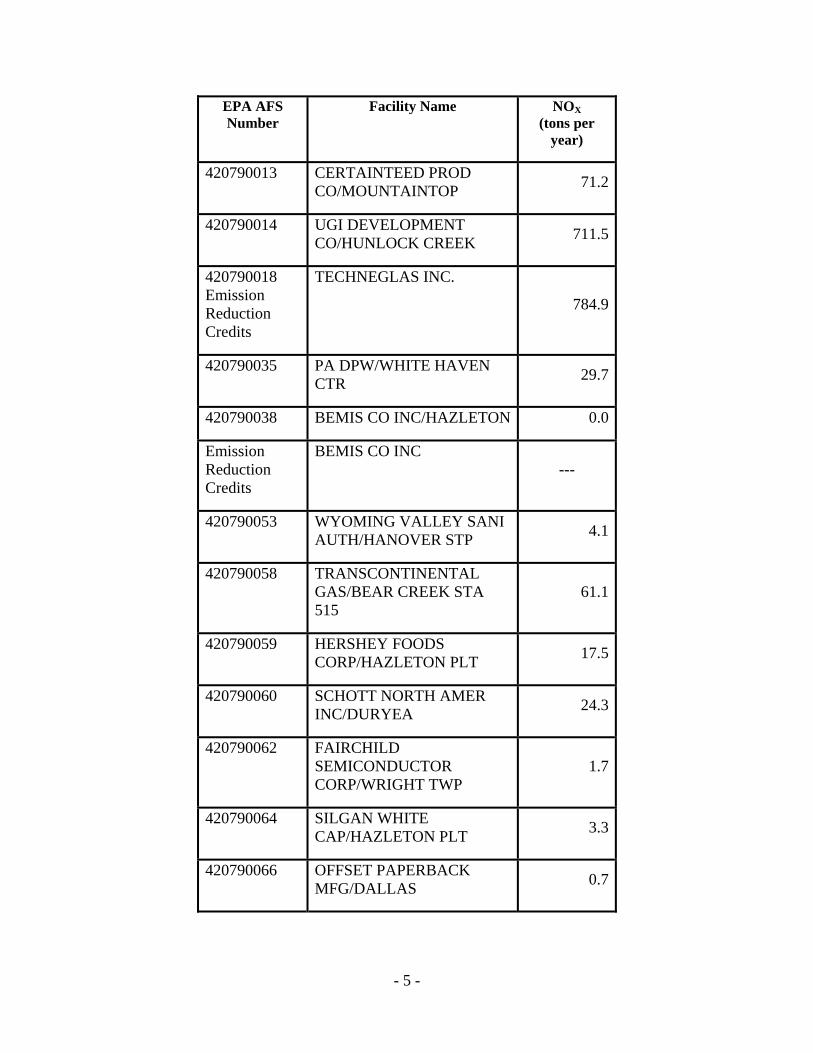
- 5 -
EPA AFS Number
Facility Name NOX (tons per
year)
420790013 CERTAINTEED PROD CO/MOUNTAINTOP
71.2
420790014 UGI DEVELOPMENT CO/HUNLOCK CREEK
711.5
420790018 Emission Reduction Credits
TECHNEGLAS INC.
784.9
420790035 PA DPW/WHITE HAVEN CTR
29.7
420790038 BEMIS CO INC/HAZLETON 0.0
Emission Reduction Credits
BEMIS CO INC ---
420790053 WYOMING VALLEY SANI AUTH/HANOVER STP
4.1
420790058 TRANSCONTINENTAL GAS/BEAR CREEK STA 515
61.1
420790059 HERSHEY FOODS CORP/HAZLETON PLT
17.5
420790060 SCHOTT NORTH AMER INC/DURYEA
24.3
420790062 FAIRCHILD SEMICONDUCTOR CORP/WRIGHT TWP
1.7
420790064 SILGAN WHITE CAP/HAZLETON PLT
3.3
420790066 OFFSET PAPERBACK MFG/DALLAS
0.7

- 6 -
EPA AFS Number
Facility Name NOX (tons per
year)
420790067 OROGRAIN BAKERIES MFG INC/VALMONT
4.0
420790068 BERWICK OFFRAY LLC/BERWICK
1.0
420790069 KAPPA GRAPHICS/HUGHESTOWN
0.4
420790076 BARLETTA MATERIALS & CONST/NESCOPECK
8.4
420790079 GULF OIL LTD PARTNER/DUPONT TERM ---
420790113 PENNSY SUPPLY INC/DORRANCE ASPHALT PLT
4.0
420790122 SEALY MATTRESS MOUNTAINTOP/WRIGHT TWP
1.4
420790132 DUPONT TERM CORP/ DUPONT TERMINALS
0.1
420790202 HAZLETON GEN LLC/HAZLE TWP
1.2
420790267 PIKES CREEK ASPHALT / LEHMAN
5.0
420790317 HAZLETON MATERIALS ASPHALT PLT/FOSTER TWP
7.2
420790407 CASCADES TISSUE GROUP PA INC/PITTSTON ---
420790597 PPL MARTINS CREEK LLC/HARWOOD CTS
0.7

- 7 -
EPA AFS Number
Facility Name NOX (tons per
year)
420790616 SUNOCO PARTNERS MKT & TERM LP/KINGSTON TERM
2.1
420790798 PPL MARTINS CREEK LLC/JENKINS CTG
0.5
420790799 PPL SUSQUEHANNA LLC/SUSQUEHANNA SES
22.1
420790800 DUPONT EAST TERM/PITTSTON
0.1
420791255 WILKES BARRE HOSP CO LLC/WILKES BARRE
4.7
420792033 AMER ASPHALT PAVING /CHASE PLT
3.8
420792061 WILKES BARRE MATERIALS/PLAINS PLT
7.6
420792063 SVC MFG INC/ A DIV OF PEPSI CO, INC
3.3
420890008 US DEPT DEFENSE/TOBYHANNA ARMY DEPOT
17.9
420890013 HAINES & KIBBLEHOUSE/LOCUST RIDGE
7.3
420890018 ROCK TENN CO/DELAWARE WATER GAP
6.9
420890539 SANOFI PASTEUR/SWIFTWATER
59.0
420890795 GENON REMA LLC/SHAWNEE
1.5
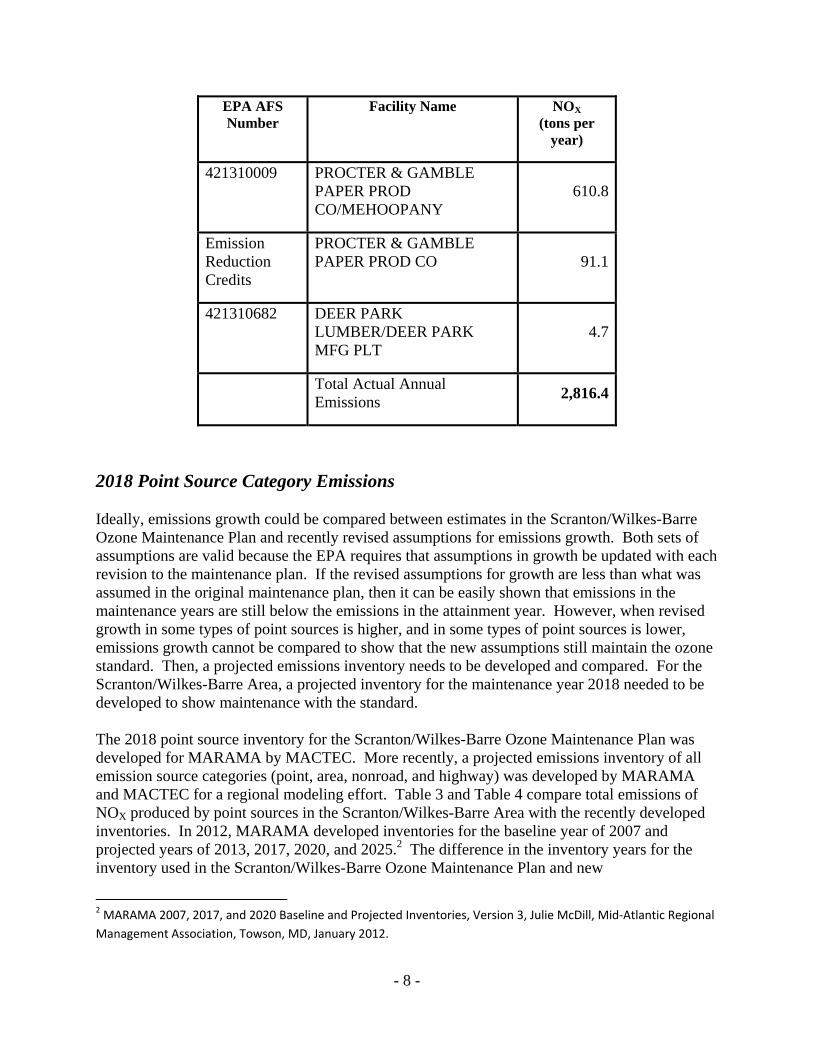
- 8 -
EPA AFS Number
Facility Name NOX (tons per
year)
421310009 PROCTER & GAMBLE PAPER PROD CO/MEHOOPANY
610.8
Emission Reduction Credits
PROCTER & GAMBLE PAPER PROD CO 91.1
421310682 DEER PARK LUMBER/DEER PARK MFG PLT
4.7
Total Actual Annual Emissions
2,816.4
2018 Point Source Category Emissions Ideally, emissions growth could be compared between estimates in the Scranton/Wilkes-Barre Ozone Maintenance Plan and recently revised assumptions for emissions growth. Both sets of assumptions are valid because the EPA requires that assumptions in growth be updated with each revision to the maintenance plan. If the revised assumptions for growth are less than what was assumed in the original maintenance plan, then it can be easily shown that emissions in the maintenance years are still below the emissions in the attainment year. However, when revised growth in some types of point sources is higher, and in some types of point sources is lower, emissions growth cannot be compared to show that the new assumptions still maintain the ozone standard. Then, a projected emissions inventory needs to be developed and compared. For the Scranton/Wilkes-Barre Area, a projected inventory for the maintenance year 2018 needed to be developed to show maintenance with the standard. The 2018 point source inventory for the Scranton/Wilkes-Barre Ozone Maintenance Plan was developed for MARAMA by MACTEC. More recently, a projected emissions inventory of all emission source categories (point, area, nonroad, and highway) was developed by MARAMA and MACTEC for a regional modeling effort. Table 3 and Table 4 compare total emissions of NOX produced by point sources in the Scranton/Wilkes-Barre Area with the recently developed inventories. In 2012, MARAMA developed inventories for the baseline year of 2007 and projected years of 2013, 2017, 2020, and 2025.2 The difference in the inventory years for the inventory used in the Scranton/Wilkes-Barre Ozone Maintenance Plan and new
2 MARAMA 2007, 2017, and 2020 Baseline and Projected Inventories, Version 3, Julie McDill, Mid‐Atlantic Regional
Management Association, Towson, MD, January 2012.

- 9 -
MARAMA/MACTEC inventory development efforts did not allow for easy comparison of growth factors used for projecting emissions. Projected emissions in 2018 were estimated for the maintenance plan revisions using straight-line interpolation between the 2007 MARAMA baseline inventory and the 2020 MARAMA projected year inventory using the following equation: 2018 Emissions = 2007 Emissions + ((2020 Emissions – 2007 emissions) *(2018-2007) ÷ (2020 - 2007)) + Available Emission Reduction Credits Emission projections of non-EGU point sources in the Scranton/Wilkes-Barre Ozone Maintenance Plan were overestimated for the year 2018 when compared to newer emissions data derived by MARAMA (See Tables 3 and 4). The closeness of NOX emissions was due to the fact that emissions reduction credits (ERCs) were not included in the Scranton/Wilkes-Barre Maintenance Plan and they are included in this SIP revision.
Table 3: Scranton/Wilkes-Barre Ozone Maintenance Plan Emission Estimates of Point Sources for 2018
Year NOX
Emissions (tons/year)
NOX Emissions (tons/day)
2018 3956.7 10.5

- 10 -
Table 4: Revised Scranton/Wilkes-Barre Ozone Maintenance Plan Emissions Estimates of Point Sources for 2018
(Derived from MARAMA 2007 Baseline and 2020 Projected Inventories)
Year NOX Emissions (tons/year)
NOX Emissions (tons/day)
2007 (Baseline) 1930.8 5.3
2020 (Projected) 1572.1 4.3
2018 (Interpolated) + Emission Reduction Credits)
2124.4 5.8
Table 5 shows actual 2007 and projected 2020 facility emissions of NOX for non-EGU point source in the Scranton/Wilkes-Barre area.
Table 5: MARAMA 2007 Annual Baseline and 2018 Projected NOX Point Source Inventories for the Scranton/Wilkes-Barre Ozone Maintenance Area by Facility Source
EPA AFS Number Facility Name 2007
Baseline NOX
Emissions
2020 Projected
NOX Emissions
420690010 SCRANTON ARMY AMMUNITION PLANT
15.0 17.1
420690022 PEI POWER CORP/ARCHBALD 13.6 13.6
420690023 MACTAC INC/SCRANTON FAC
3.8 3.9
420690029 GENTEX CORP/SIMPSON PROT CLOTHING
4.3 6.2
420690032 CASCADES TISSUE GRP PA INC/RANSOM PLT
32.6 37.0

- 11 -
EPA AFS Number Facility Name 2007 Baseline
NOX Emissions
2020 Projected
NOX Emissions
420690041 COMMUNITY MEDICAL CTR/SCRANTON FACILITY
0.5 0.5
420690096 SANDVIK MATERIALS TECHNOLOGY/ SCOTT TWP
46.7 49.0
420690101 PANEL PRINTS INC/OLD FORGE
0.4 0.4
420690125 QUADRANT EPP LAUREL LINE MFG/SCRANTON
2.5 2.8
420690201 ENV & RECYCLING SVC AMITY LDFL/TAYLOR
1.7 1.8
420690205 PA DPW/CLARKS SUMMIT STATE HOSP
12.5 12.8
420690533 ALLIANCE SANI LANDFILL INC/TAYLOR LDFL
63.7 67.4
420690676 EUREKA STONE QUARRY/DALEVILLE
1.6 2.0
420690686 METSO PAPER USA INC/CLARKS SUMMIT SVC CTR
0.5 0.7
420690722 KEYSTONE SANI LDFL INC/DUNMORE
5.8 6.2
420690765 REG HOSP OF SCRANTON/SCRANTON
4.7 5.2
420692039 SHAW ENV & INFRASTRUCTURE INC/THROOP
36.6 32.0
420790001 ALLEGHENY ENERGY SUPPLY CO/HUNLOCK 4 (NEW OWNERS ARE FIRST ENERGY)
14.6 20.7
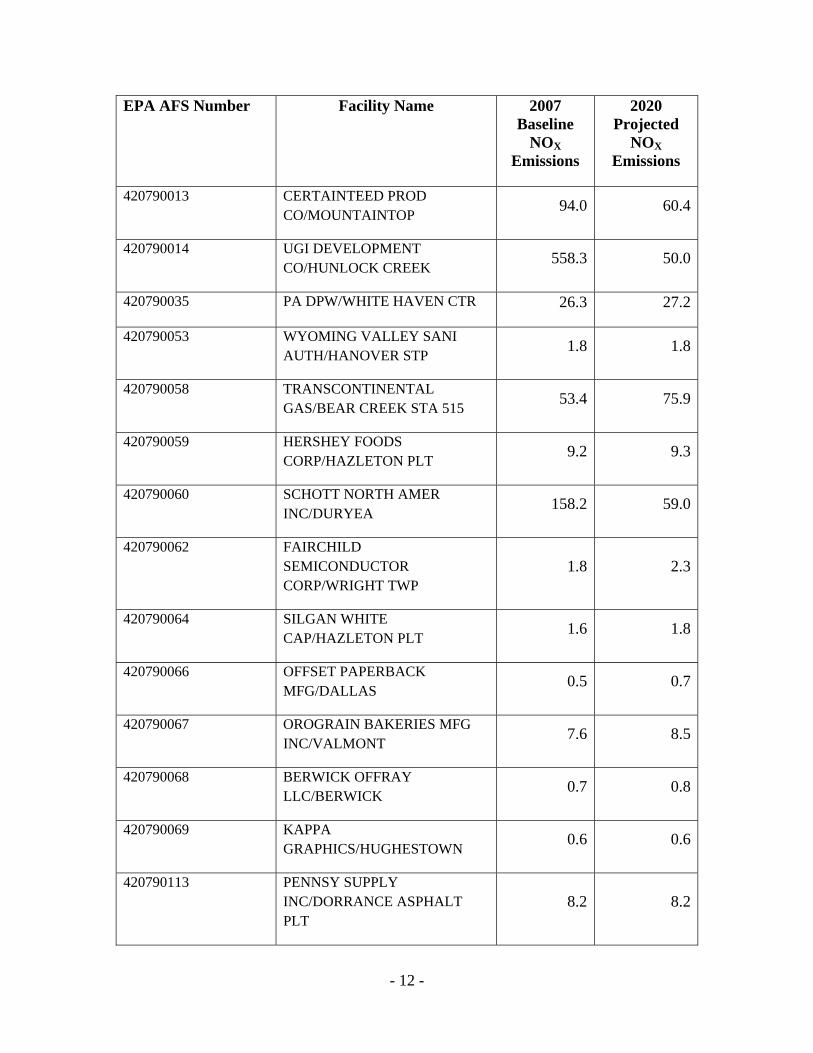
- 12 -
EPA AFS Number Facility Name 2007 Baseline
NOX Emissions
2020 Projected
NOX Emissions
420790013 CERTAINTEED PROD CO/MOUNTAINTOP
94.0 60.4
420790014 UGI DEVELOPMENT CO/HUNLOCK CREEK
558.3 50.0
420790035 PA DPW/WHITE HAVEN CTR 26.3 27.2
420790053 WYOMING VALLEY SANI AUTH/HANOVER STP
1.8 1.8
420790058 TRANSCONTINENTAL GAS/BEAR CREEK STA 515
53.4 75.9
420790059 HERSHEY FOODS CORP/HAZLETON PLT
9.2 9.3
420790060 SCHOTT NORTH AMER INC/DURYEA
158.2 59.0
420790062 FAIRCHILD SEMICONDUCTOR CORP/WRIGHT TWP
1.8 2.3
420790064 SILGAN WHITE CAP/HAZLETON PLT
1.6 1.8
420790066 OFFSET PAPERBACK MFG/DALLAS
0.5 0.7
420790067 OROGRAIN BAKERIES MFG INC/VALMONT
7.6 8.5
420790068 BERWICK OFFRAY LLC/BERWICK
0.7 0.8
420790069 KAPPA GRAPHICS/HUGHESTOWN
0.6 0.6
420790113 PENNSY SUPPLY INC/DORRANCE ASPHALT PLT
8.2 8.2

- 13 -
EPA AFS Number Facility Name 2007 Baseline
NOX Emissions
2020 Projected
NOX Emissions
420790202 HAZLETON GEN LLC/HAZLE TWP
8.4 11.5
420790597 PPL MARTINS CREEK LLC/HARWOOD CTS
4.3 5.4
420790616 SUNOCO PARTNERS MKT & TERM LP/KINGSTON TERM
1.7 1.9
420790798 PPL MARTINS CREEK LLC/JENKINS CTG
1.0 1.2
420790799 PPL SUSQUEHANNA LLC/SUSQUEHANNA SES
22.1 27.5
420791255 WILKES BARRE HOSP CO LLC/WILKES BARRE
3.6 5.0
420792061 WILKES BARRE MATERIALS/PLAINS PLT
9.9 9.9
420890008 US DEPT DEFENSE/TOBYHANNA ARMY DEPOT
18.7 20.3
420890539 SANOFI PASTEUR/SWIFTWATER
32.6 32.6
421310009 PROCTER & GAMBLE PAPER PROD CO/MEHOOPANY
639.7 864.9
421310682 DEER PARK LUMBER/DEER PARK MFG PLT
5.5 6.1
Subtotal of NOx Emissions 1930.8 1572.1
420790014
EMISSION REDUCTION CREDITS (PLANNED)
UGI DEVELOPMENT CO/HUNLOCK CREEK
0.0 406.0
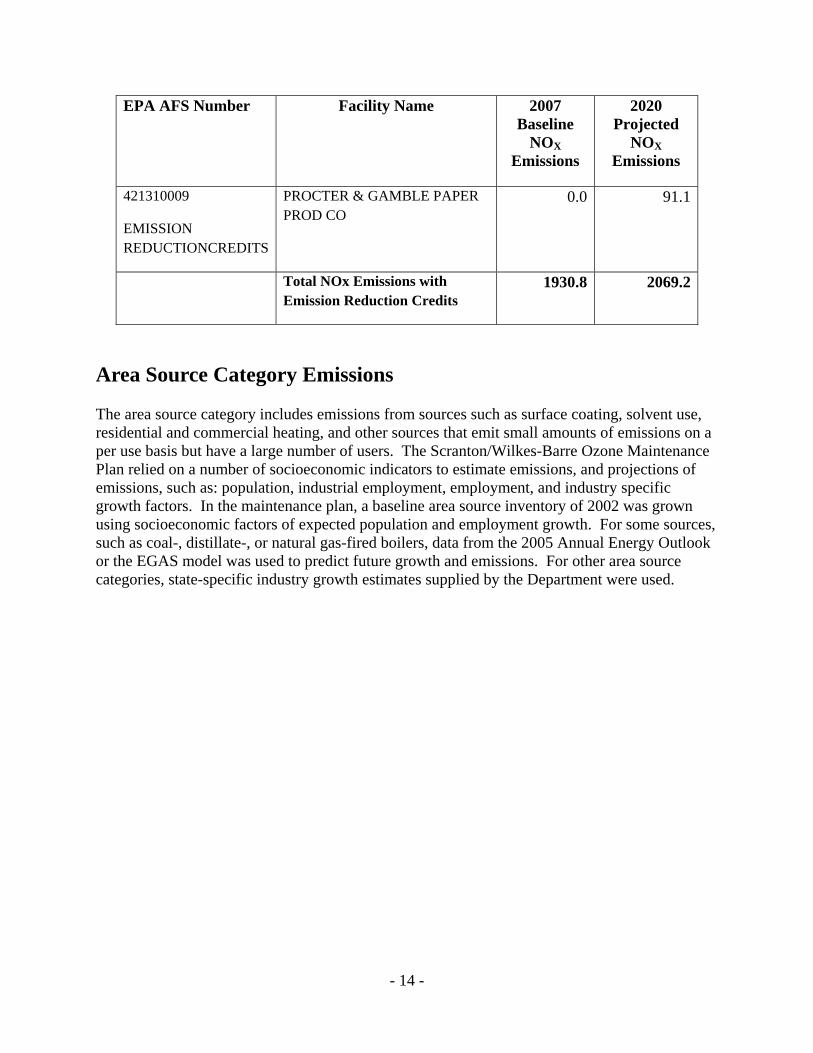
- 14 -
EPA AFS Number Facility Name 2007 Baseline
NOX Emissions
2020 Projected
NOX Emissions
421310009
EMISSION REDUCTIONCREDITS
PROCTER & GAMBLE PAPER PROD CO
0.0 91.1
Total NOx Emissions with Emission Reduction Credits
1930.8 2069.2
Area Source Category Emissions The area source category includes emissions from sources such as surface coating, solvent use, residential and commercial heating, and other sources that emit small amounts of emissions on a per use basis but have a large number of users. The Scranton/Wilkes-Barre Ozone Maintenance Plan relied on a number of socioeconomic indicators to estimate emissions, and projections of emissions, such as: population, industrial employment, employment, and industry specific growth factors. In the maintenance plan, a baseline area source inventory of 2002 was grown using socioeconomic factors of expected population and employment growth. For some sources, such as coal-, distillate-, or natural gas-fired boilers, data from the 2005 Annual Energy Outlook or the EGAS model was used to predict future growth and emissions. For other area source categories, state-specific industry growth estimates supplied by the Department were used.
- 15 -
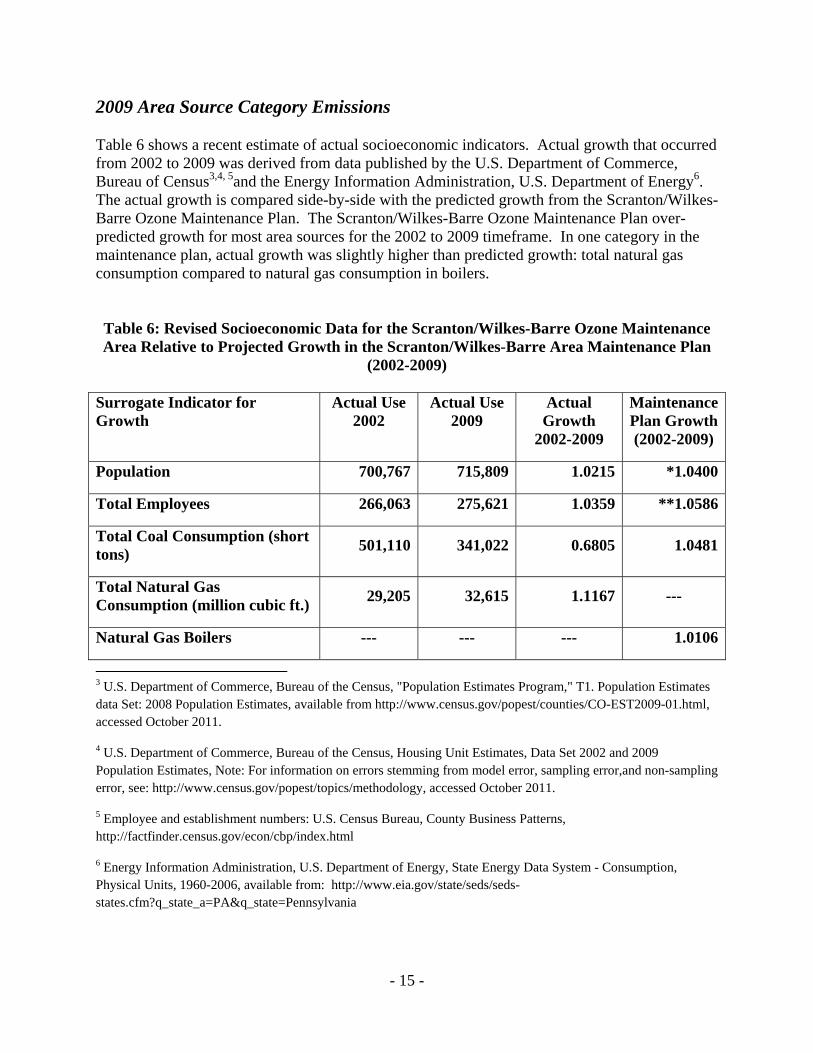
2009 Area Source Category Emissions Table 6 shows a recent estimate of actual socioeconomic indicators. Actual growth that occurred from 2002 to 2009 was derived from data published by the U.S. Department of Commerce, Bureau of Census3,4, 5and the Energy Information Administration, U.S. Department of Energy6. The actual growth is compared side-by-side with the predicted growth from the Scranton/Wilkes-Barre Ozone Maintenance Plan. The Scranton/Wilkes-Barre Ozone Maintenance Plan over-predicted growth for most area sources for the 2002 to 2009 timeframe. In one category in the maintenance plan, actual growth was slightly higher than predicted growth: total natural gas consumption compared to natural gas consumption in boilers. Table 6: Revised Socioeconomic Data for the Scranton/Wilkes-Barre Ozone Maintenance Area Relative to Projected Growth in the Scranton/Wilkes-Barre Area Maintenance Plan
(2002-2009) Surrogate Indicator for Growth
Actual Use 2002
Actual Use 2009
Actual Growth
2002-2009
Maintenance Plan Growth (2002-2009)
Population 700,767 715,809 1.0215 *1.0400
Total Employees 266,063 275,621 1.0359 **1.0586
Total Coal Consumption (short tons)
501,110 341,022 0.6805 1.0481
Total Natural Gas Consumption (million cubic ft.)
29,205 32,615 1.1167 ---
Natural Gas Boilers --- --- --- 1.0106
3 U.S. Department of Commerce, Bureau of the Census, "Population Estimates Program," T1. Population Estimates data Set: 2008 Population Estimates, available from http://www.census.gov/popest/counties/CO-EST2009-01.html, accessed October 2011.
4 U.S. Department of Commerce, Bureau of the Census, Housing Unit Estimates, Data Set 2002 and 2009 Population Estimates, Note: For information on errors stemming from model error, sampling error,and non-sampling error, see: http://www.census.gov/popest/topics/methodology, accessed October 2011.
5 Employee and establishment numbers: U.S. Census Bureau, County Business Patterns, http://factfinder.census.gov/econ/cbp/index.html
6 Energy Information Administration, U.S. Department of Energy, State Energy Data System - Consumption, Physical Units, 1960-2006, available from: http://www.eia.gov/state/seds/seds-states.cfm?q_state_a=PA&q_state=Pennsylvania
- 16 -
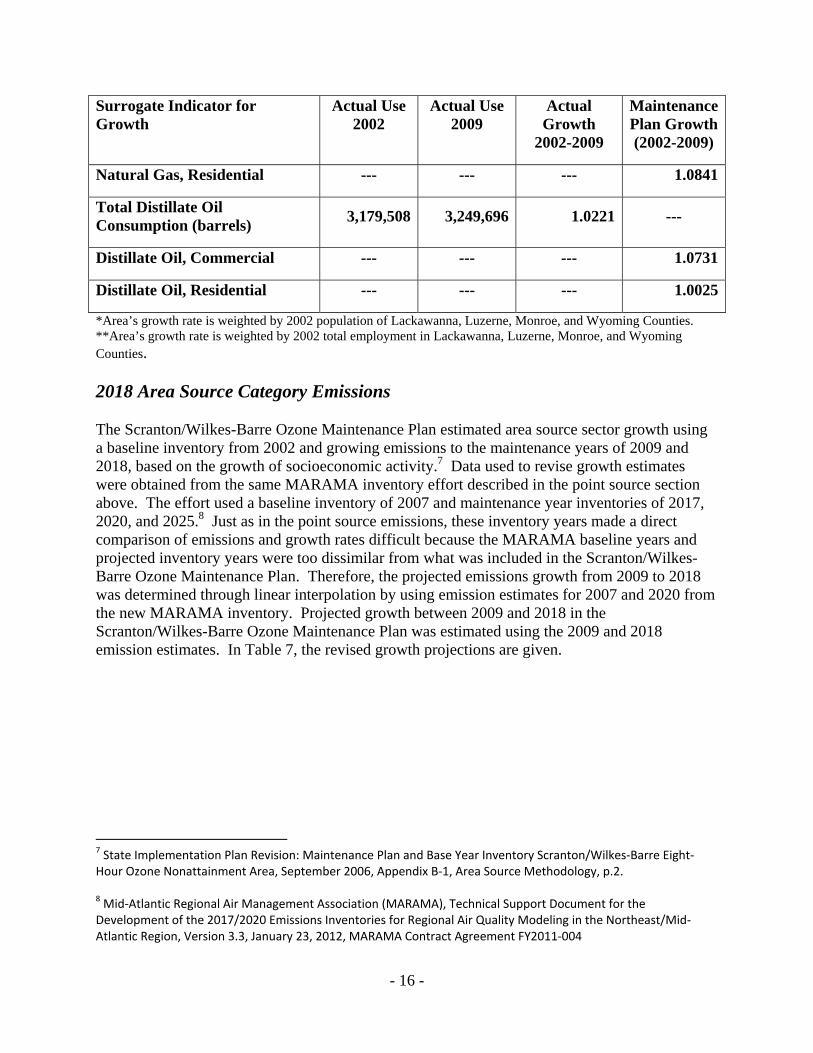
Surrogate Indicator for Growth
Actual Use 2002
Actual Use 2009
Actual Growth
2002-2009
Maintenance Plan Growth (2002-2009)
Natural Gas, Residential --- --- --- 1.0841
Total Distillate Oil Consumption (barrels)
3,179,508 3,249,696 1.0221 ---
Distillate Oil, Commercial --- --- --- 1.0731
Distillate Oil, Residential --- --- --- 1.0025
*Area’s growth rate is weighted by 2002 population of Lackawanna, Luzerne, Monroe, and Wyoming Counties. **Area’s growth rate is weighted by 2002 total employment in Lackawanna, Luzerne, Monroe, and Wyoming Counties. 2018 Area Source Category Emissions The Scranton/Wilkes-Barre Ozone Maintenance Plan estimated area source sector growth using a baseline inventory from 2002 and growing emissions to the maintenance years of 2009 and 2018, based on the growth of socioeconomic activity.7 Data used to revise growth estimates were obtained from the same MARAMA inventory effort described in the point source section above. The effort used a baseline inventory of 2007 and maintenance year inventories of 2017, 2020, and 2025.8 Just as in the point source emissions, these inventory years made a direct comparison of emissions and growth rates difficult because the MARAMA baseline years and projected inventory years were too dissimilar from what was included in the Scranton/Wilkes-Barre Ozone Maintenance Plan. Therefore, the projected emissions growth from 2009 to 2018 was determined through linear interpolation by using emission estimates for 2007 and 2020 from the new MARAMA inventory. Projected growth between 2009 and 2018 in the Scranton/Wilkes-Barre Ozone Maintenance Plan was estimated using the 2009 and 2018 emission estimates. In Table 7, the revised growth projections are given.
7 State Implementation Plan Revision: Maintenance Plan and Base Year Inventory Scranton/Wilkes‐Barre Eight‐Hour Ozone Nonattainment Area, September 2006, Appendix B‐1, Area Source Methodology, p.2. 8 Mid‐Atlantic Regional Air Management Association (MARAMA), Technical Support Document for the Development of the 2017/2020 Emissions Inventories for Regional Air Quality Modeling in the Northeast/Mid‐Atlantic Region, Version 3.3, January 23, 2012, MARAMA Contract Agreement FY2011‐004

- 17 -
The growth rate predicted in the maintenance plan from 2009 to 2018 is derived by the following formula: Growth Factor (2009-2018) = ((Growth Factor (2002-2018) – Growth Factor (2002-2009)) ÷ Growth Factor (2002-2009)) + 1 A straight line interpolation between the 2007 MARAMA baseline emissions and the 2020 MARAMA projected emissions was used to calculate emissions for the years 2009 and 2018. From these interpolated emissions (see equations 1 and 2 below), the projected growth between 2009 and 2018 was calculated (see equation 3 below). Fossil fuel combustion surrogates in Table 7 represent most emissions of NOX, while ‘population’ and ‘employees’ represent the best surrogates for many source categories that produce VOC emissions. The surrogates for growth shown in Table 7 are used to predict revised growth for a large majority of emissions from area source categories in the Scranton/Wilkes-Barre Ozone Maintenance Plan revision.
(1) 2009 Emissions = 2007 Emissions + (2020 Emissions – 2007 Emissions) * ((2009 – 2007) ÷ (2020-2007))
(2) 2018 Emissions = 2007 Emissions + (2020 Emissions – 2007 Emissions) *
((2018 – 2007) ÷ (2020-2007))
(3) Emissions Growth (2009-2018) = ((2018 Emission – 2009 Emissions) ÷ 2009 Emissions) + 1
Tables 7a, b, c, d: Revised Socioeconomic Data for the Scranton/Wilkes-Barre Ozone Maintenance Area Relative to the Projected Growth in the Scranton/Wilkes-Barre Area
Maintenance Plan (2009-2018)
Table 7a: Lackawanna County Portion of the Scranton/Wilkes-Barre Ozone Maintenance Area
Indicator for Growth Revised Growth
In MARAMA Inventory
(2009-2018)
Maintenance Plan Growth (2009-2018)
Population 0.9735 0.9911
Employees 1.0290* 1.0293
Anthracite Coal, Industrial 0.9136 0.9983
Anthracite Coal, Commercial 1.0230 0.9865
All Combustor Types, Distillate Oil, Residential
0.8226 0.9598

- 18 -
Indicator for Growth Revised Growth In MARAMA
Inventory (2009-2018)
Maintenance Plan Growth (2009-2018)
Boilers and Internal Combustion Engines, Natural Gas, Commercial
1.0687 1.0521
Combustor Types, Natural Gas, Residential
1.0188 1.0181
*The MARAMA inventory estimated growth in employment based on statewide North American Industry Classification System codes. NAICS codes proved too cumbersome to establish employment growth on the county level. Employment growth in Table 7a was derived from U.S Census Bureau industrial employment data and was not developed by MARAMA.
Table 7b: Luzerne County Portion of the Scranton/Wilkes-Barre Ozone Maintenance Area
Indicator for Growth Revised Growth In MARAMA
Inventory (2009-2018)
Maintenance Plan Growth (2009-2018)
Population 0.9696 0.9981
Employees 1.0060* 1.0293
Anthracite Coal, Industrial 0.9136 0.9983
Anthracite Coal, Commercial 1.0230 0.9865
All Combustor Types, Distillate Oil, Residential
0.8226 0.9598
Boilers and Internal Combustion Engines, Natural Gas, Commercial
1.0687 1.0521
Combustor Types, Natural Gas, Residential
1.0188 1.0181
*The MARAMA inventory estimated growth in employment based on statewide North American Industry Classification System codes. NAICS codes proved too cumbersome to establish employment growth on the county level. Employment growth in Table 7b was derived from U.S Census Bureau industrial employment data and was not developed by MARAMA.

- 19 -
Table 7c: Monroe County Portion of the Scranton/Wilkes-Barre Ozone Maintenance Area
Indicator for Growth Revised Growth In MARAMA
Inventory (2009-2018)
Maintenance Plan Growth (2009-2018)
Population 1.1841 1.1934
Employees 1.0613* 1.2077
Anthracite Coal, Industrial 0.9136 0.9983
Anthracite Coal, Commercial 1.0230 0.9865
All Combustor Types, Distillate Oil, Residential
0.8226 0.9598
Boilers and Internal Combustion Engines, Natural Gas, Commercial
1.0687 1.0521
Combustor Types, Natural Gas, Residential
1.0188 1.0181
*The MARAMA inventory estimated growth in employment based on statewide North American Industry Classification System codes. NAICS codes proved too cumbersome to establish employment growth on the county level. Employment growth in Table 7c was derived from U.S Census Bureau industrial employment data and was not developed by MARAMA.

- 20 -
Table 7d: Wyoming County Portion of the Scranton/Wilkes-Barre Ozone Maintenance Area
Indicator for Growth Revised Growth
In MARAMA Inventory
(2009-2018)
Maintenance Plan Growth (2009-2018)
Population 1.0124 1.1243
Employees 0.8969* 1.0293
Anthracite Coal, Industrial 0.9799 0.9983
Anthracite Coal, Commercial 1.0230 0.9865
All Combustor Types, Distillate Oil, Residential
0.8226 0.9598
Boilers and Internal Combustion Engines, Natural Gas, Commercial
1.0687 1.0521
Combustor Types, Natural Gas, Residential
1.0188 1.0181
*The MARAMA inventory estimated growth in employment based on statewide North American Industry Classification System codes. NAICS codes proved too cumbersome to establish employment growth on the county level. Employment growth in Table 7d was derived from U.S Census Bureau industrial employment data and was not developed by MARAMA.
Tables 7a, 7b, 7c, and 7d show that assumptions in growth in the Scranton/Wilkes-Barre Ozone Maintenance Plan are greater than new assumptions developed by the MARAMA inventory effort. It is safe to assume that, due to the severe economic downturn experienced from 2007 to 2009, employee growth does not approach what was predicted in the Scranton/Wilkes-Barre Ozone Maintenance Plan in 2009 out to 2018. Most types of VOC emission sources and a few NOX emission sources relied on population and employment data to grow emissions. Population and employment show clearly that current projections are below what was projected in the Scranton/Wilkes-Barre Ozone Maintenance Plan. Emissions of NOX from area sources are dominated by fossil fuel combustion. While one category, commercial anthracite coal consumption, shows greater projected growth than what is in the Scranton/Wilkes-Barre Maintenance Plan, it is a small source of emissions when compared to industrial coal consumption, which shows a lower projected growth than what is in the maintenance plan. As occurred from 2002 to 2009, updated projections of natural gas usage was greater than in the maintenance plan. The reduction in projections of industrial coal and residential heating oil will more than offset increases in projection of natural gas use. With the over prediction of growth indicators in the Scranton/Wilkes-Barre Ozone Maintenance Plan, it follows that actual
- 21 -
emissions of NOX will be less than what was needed in the maintenance plan to demonstrate maintenance of the 8-hour ozone standard.
Marcellus Shale Emissions Since the Scranton/Wilkes-Barre Ozone Maintenance Plan was approved, Lackawanna and Wyoming Counties in the Scranton/Wilkes-Barre Area have experienced some Marcellus Shale activity. Marcellus Shale activity did not exist in 2004 and was minimal in 2009 in the Scranton/Wilkes-Barre Area. Emissions of NOX increased due to Marcellus Shale activity since the 2004 attainment year. The emissions are considered to be part of the area source sector. These area source emissions are produced by activities at the drill pad and compressor engines that pump natural gas through the gathering pipelines all the way to its final destination. Table 8 gives emissions related to Marcellus Shale drilling activity for the year 2011. Drilling Activity In 2011, the total Marcellus Shale well count in Wyoming and Lackawanna Counties was 99.9 These wells were drilled mostly over a three to four year period. According to the Marcellus Shale Coalition, drilling activity has been forecasted to remain constant into the foreseeable future across Pennsylvania.10 Projecting this activity into the future means that about 300 wells would exist by 2018, which would mean projected growth in wells of 200 percent.
9 Pennsylvania Department of Environmental Protection data submitted to the Department by gas producers, 2011 inventory.
10 Information was gathered during a phone conversation between DEP staff from the Bureau of Air Quality and Marcellus Shale Coalition representatives, 2012.

- 22 -
Table 8: 2011 Reported Emissions Due to Marcellus Shale Drilling Activity in the Scranton/Wilkes-Barre Area
County SCC SCC
Description Pollutant 2011
(tons/year) 2018
(tons/year)
Wyoming 2310021500 On-Shore Gas Production / Gas Well Completion - Flaring
NOX 136.8 136.8
Wyoming 2310000220 Oil & Gas Expl & Prod / All Processes / Drill Rigs
NOX 491.6 491.6
Wyoming 2310021100 On-Shore Gas Production / Gas Well Heaters
NOX 4.7 4.7
Lackawanna 2310000220 Oil & Gas Expl & Prod / All Processes / Drill Rigs
NOX 3.7 3.7
Table 9: 2018 Emissions for Drilling Activity in the Scranton/Wilkes-Barre Area
County NOX (tons/year)
Lackawanna 3.7
Wyoming 633.1
Total Drilling Emissions 636.8

- 23 -
Compressor Station Engine Activity Compressor station engine activity will gradually increase as more wells are drilled and the pressure of existing wells diminishes. As pressures at the wellhead decrease, compressor station engine activity will increase in order to pump natural gas through the pipeline. In 2011, natural gas drillers or companies reported no emissions produced by compressor station engines in the Scranton/Wilkes-Barre Area. Compressor engines were probably not needed in 2011 because the pressures at the well were sufficient to transport Marcellus Shale natural gas to its final destination. In 2012, there were 27 permitted compressor engines in the Scranton/Wilkes-Barre area. Assuming that permitted compressor engines come on line as they are needed and that the number of wells being pumped in Northeast Pennsylvania between 2011 and 2018 will increase by 200 percent, which is the same as the increase in the number of wells drilled, compressor engine activity will also increase by 200 percent. In early 2013, the Department issued General Permit BAQ-GPA/GP-5, Natural Gas Compression and/or Processing Facilities (GP5), which among other requirements, lowers the emissions rate for natural gas compressor engines used in pumping natural gas. Table 10 displays information received by the Department to determine the emissions that are coming from compressor engines in the Scranton/Wilkes-Barre Area. Although compressor engine activity is estimated to increase by 200 percent from 2011 to 2018, emissions will not increase by 200 percent since GP-5 established more stringent limitations on emission rates for compressors.
Table 10: 2012 NOX Emissions of Permitted Compressor Engines Used for Marcellus Shale Natural Gas in the Scranton/Wilkes-Barre Area
County Engine
HorsepowerNumber of
Engines Load
Factor* NOX
Emission (grams/bhp-
hr)
Emissions (tons/year)
Wyoming 1340 3 0.85 2.0 65.9
Wyoming 1380 4 0.85 2.0 90.5
Wyoming 1380 10 0.85 0.5 56.6
Wyoming 2370 8 0.85 0.5 77.7
Wyoming 7401 2 0.85 0.5 60.7
Total Emissions 351.5
*Load factor was taken from the NONROAD2008 Model for natural gas compressor engines.

- 24 -
Table 11: Projected 2018 NOX Emissions from Compressor Engines Used for Marcellus Shale Natural Gas in the Scranton/Wilkes-Barre Area
County Engine
HorsepowerNumber of
Engines Load
Factor* NOX
Emission Factor
(grams/bhp-hr)
Emissions (tons/year)
Wyoming 1340 3 0.85 2.0 65.9
Wyoming 1340 6 0.85 0.25 24.7
Wyoming 1380 4 0.85 2.0 90.5
Wyoming 1380 8 0.85 0.25 34.0
Wyoming 1380 10 0.85 0.5 56.6
Wyoming 1380 20 0.85 0.25 56.6
Wyoming 2370 24 0.85 0.50 233.2
Wyoming 7401 6 0.85 0.50 182.1
Total Emissions 743.6

- 25 -
Table 12: 2013 Daily Emissions and 2018 Daily Projected Emissions from Marcellus Shale Compressor Engine Activity in the Scranton/Wilkes-Barre Area
County 2011 NOX 2018 NOX
Wyoming 1.0 2.0

- 26 -
Table 13: NOX Emissions Related to Marcellus Shale Activity in the Scranton/Wilkes-Barre Area
County SCC* SCC Description 2009 2018
NOX NOX
42069 2310000220 Oil & Gas
Exploration/All Processes/Drill Rigs
0.0 3.7
42131 2310000220 Oil & Gas
Exploration/All Processes/Drill Rigs
0.0 491.6
42131 2310020600
Oil & Gas Exploration
Production/Natural Gas Compressor
Engines
0.0 743.6
42131 2310021010 On-Shore Gas
Production/Storage Tanks: Condensate
0.0 0.0
42131 2310021100 On-Shore Gas
Production/Gas Well Heaters
0.0 4.7
42131 2310021310 On-Shore Gas
Production/Gas Well Pneumatic Pumps
0.0 0.0
42131 2310021500 On-Shore Gas
Production/Gas Well Completion
0.0 136.8
42131 2310021509 On-Shore Gas Production/Fugitives
0.0 0.0
Annual Area Total
0.0 1380.4
Daily Area Total
0.0 3.8
Nonroad Source Category Emissions

- 27 -
Emissions from the nonroad category are produced by many different types of vehicles and equipment. The EPA’s NONROAD Model estimates emissions for over 200 types of equipment, engines and vehicles. Nonroad engines and vehicles can be used for such applications as construction, lawn and garden care, farming, and commercial and industrial applications. Emissions from three types of activities namely aircraft, locomotives, and commercial marine vessels are not estimated in the NONROAD Model but are still included in the nonroad category. The aircraft, rail, and commercial marine emissions are estimated outside of the NONROAD Model. In the approved Scranton/Wilkes-Barre Ozone Maintenance Plan, the NONROAD2005 model was used to estimate nonroad emissions. The model went through one major revision since then. NONRAOD2008a is the latest version of this model. This new version of the model incorporated two reduction strategies that affect engines and vehicles in the nonroad sector:
Diesel recreational marine standards in the 2008 final rule on locomotive and marine engines (73 FR 25098); and
The October 2008 small spark ignition and spark ignition and recreational marine rule
(73 FR 59034). For the Scranton/Wilkes-Barre Ozone Maintenance Plan, the Department modified files in the NONROAD Model, when state specific data was available for emission categories such as residential lawn and garden. Emissions from nonroad sources have decreased since the submittal of the Scranton/Wilkes-Barre Ozone Maintenance Plan in 2007, as a result of the two additional controls mentioned above and normal fleet turnover that occurs when older engines are replaced with cleaner engines. The fleet turnover that occurs as older, more polluting nonroad equipment and vehicles are replaced by newer equipment and vehicles that meet more stringent emission standards has continued to lower emissions in the nonroad sector since the late 1990s and will continue to do so for the next 10 years. Emission reductions occurred across all segments of the nonroad category, including construction equipment, farming equipment, locomotives, and lawn and garden equipment. Modeling runs were not completed for the nonroad emission source categories. The Department will treat nonroad emissions in the Scranton/Wilkes-Barre Area as non-changing from their 2004 levels for the purpose of this SIP revision, even though full scale modeling runs using the NONROAD2008a would show nonroad emissions in a decline.
Bell Bend Nuclear Power Plant Emissions Budget for General Conformity
An emission budget for NOX that will be produced by the construction of the Bell Bend Nuclear Power Plant is included in this SIP revision in order that the construction of the plant can meet the applicable requirements of General Conformity. The emissions were estimated in the Bell Bend Nuclear Power Plant Revised General Conformity Analysis Report, Revision 2.11 The Bell
11 PPL Nuclear Development, Allentown Pa., Gary Petrewski, February 3, 2012.

- 28 -
Bend Nuclear Power Plant project is scheduled to take seven years to complete. The largest amount of NOX emissions will be produced during year 2 of project construction. Emissions of NOX will total 167.7 tons during the second year of construction. The annual emissions, if uniformly distributed over the calendar year, equate to 0.46 tons of NOX per day. Assuming that slightly more construction activity will occur during the non-winter months, the daily emissions of NOX would be slightly more than 0.46 tons. The General Conformity budget for NOX emissions for this project will be 1.0 tons/summer day for the maintenance years 2009 and 2018 which corresponds to a 201.0 tons of NOX cap per calendar year of emissions. The cap includes emissions of on-site nonroad diesel equipment and vehicles, small combustion engines, work force commuting that occurs within the maintenance area, delivery vehicles that operate within the maintenance area, on-site highway vehicles, and safety-related activities. Therefore, the actual emissions of the project should never exceed the emission budget in this SIP revision.
Highway Source Category Emissions Highway emissions were estimated by Michael Baker, Jr., Inc., who is a consultant to the Pennsylvania Department of Transportation. The methodology for estimating emissions of highway vehicles is greatly different than what was used in the Scranton/Wilkes-Barre Ozone Maintenance Plan because an entirely new highway emissions model is being used. Highway emissions are being estimated using the MOVES Model instead of the Mobile6 Model. With this change, a new set of inputs was used. The method for how traffic growth or vehicle miles travelled was forecasted remains the same as what was used in the Scranton/Wilkes-Barre Ozone Maintenance Plan. Both the revised maintenance plan and the original maintenance plan used the Statistical Evaluation of Projected Traffic Growth. A revised Appendix C, Maintenance Plan Update for the Scranton/Wilkes-Barre Eight-Hour Ozone Maintenance Area: Motor Vehicle Emission Budget Revisions Using MOVES2010a, is attached. The Appendix C-1, Mobile Source Highway Emissions Inventory – An Explanation of Methodology is also attached. The MOVES Model estimates that highway vehicle emissions increase for NOX for the 2009 and 2018 attainment years when compared to the highway vehicle emission estimates included in the Scranton/Wilkes-Barre Ozone Maintenance Plan for those same years (See Table 14). For the most part, emission estimates of VOC in 2009 and 2018 do not increase when using MOVES instead of Mobile6. MOVES also increases the emission estimates of the 2004 attainment year. Since the emissions increase in both the attainment and maintenance years, MOVES modeled emissions, like Mobile6 modeled emissions, of highway vehicles still show a large decrease in emissions between 2004 and 2009 and between 2004 and 2018.

- 29 -
Table 14: Revised Motor Vehicle Emissions Using MOVES2010a Compared to Mobile 6.2 (Tons/Day)
Pollutant Sub Area Original MOBILE6.2 Emissions Revised MOVES2010a Emissions
2004 2009 2018 2004 2009 2018 VOC Lackawanna County 8.93 6.51 3.94 7.12 5.91 3.37
Luzerne County 13.84 10.12 5.90 11.19 9.28 5.16Scranton MPO Subtotal 22.8 16.6 9.8 18.3 15.2 8.5 Monroe County
7.42 5.73 3.99 6.28 5.43 3.05NEPA MPO Subtotal
7.4 5.7 4.0 6.3 5.4 3.1 Wyoming County 1.4 0.97 0.51 1.18 0.95 0.67Northern Tier MPO Subtotal 1.4 1.0 0.5 1.2 1.0 0.7 Total 31.7 23.3 14.3 25.8 21.6 12.3
NOX Lackawanna County 18.85 13.23 6.01 21.69 16.44 8.40Luzerne County 29.10 20.60 9.34 33.19 24.83 12.13Scranton MPO Subtotal 48.0 33.8 15.4 54.9 41.3 20.5 Monroe County 15.88 11.6 5.66 18.85 13.61 6.55NEPA MPO Subtotal 15.9 11.6 5.7 18.9 13.6 6.6 Wyoming County 2.25 1.5 0.64 3.29 2.39 1.46Northern Tier MPO Subtotal 2.2 1.5 0.6 3.3 2.4 1.5 Total 66.1 46.9 21.7 77.1 57.3 28.6